Cities with the Highest Percentage of Population Employed in Mining, Quarrying, & Extraction in West Virginia
RELATED REPORTS & OPTIONS
Mining, Quarrying, & Extraction
West Virginia
Compare Cities
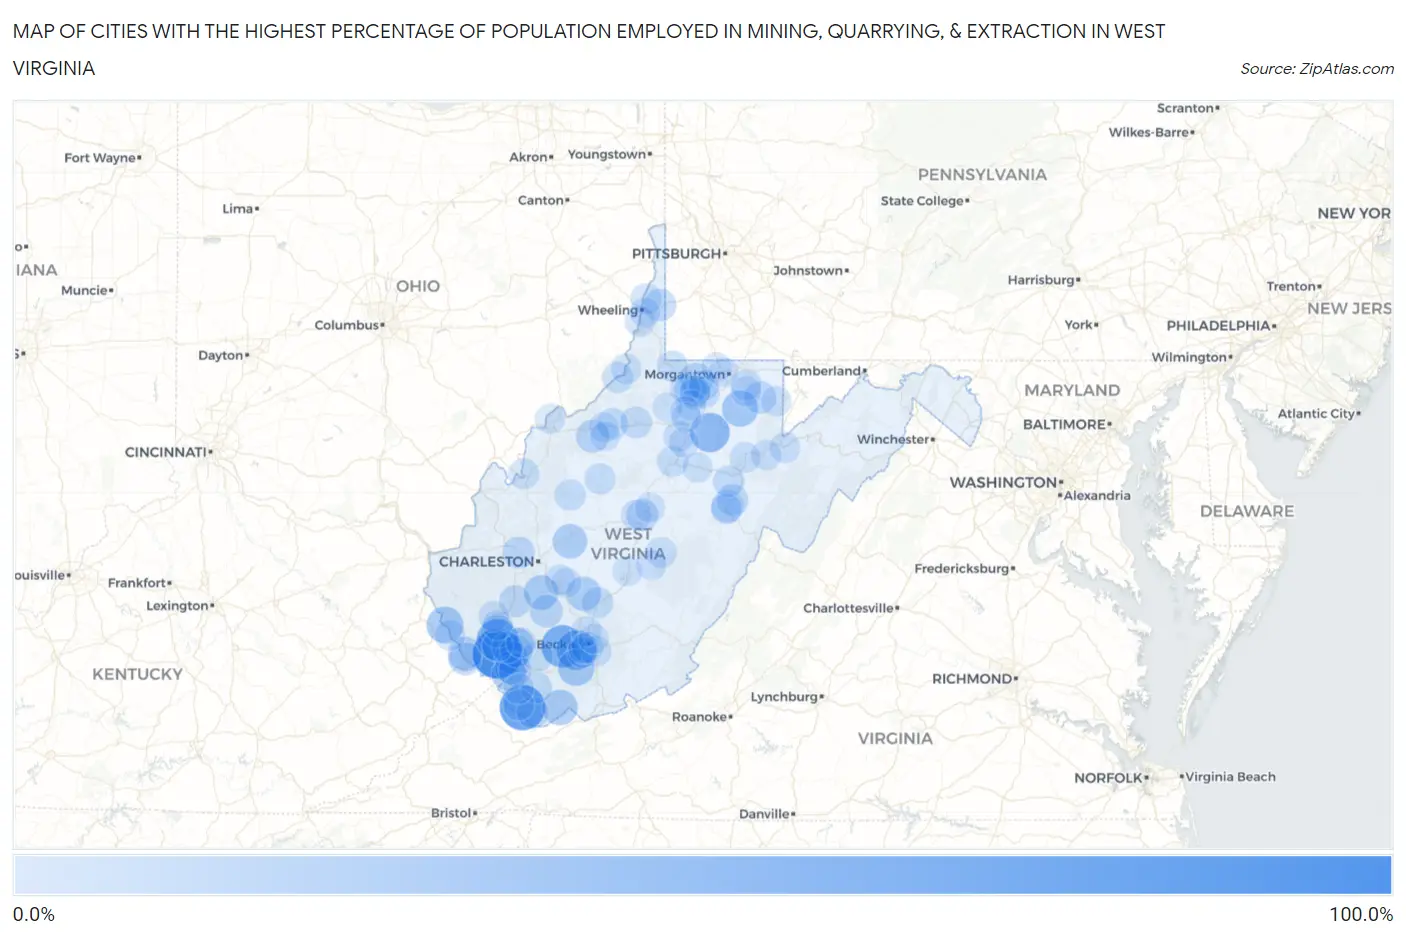
Map of Cities with the Highest Percentage of Population Employed in Mining, Quarrying, & Extraction in West Virginia
0.0%
100.0%
Cities with the Highest Percentage of Population Employed in Mining, Quarrying, & Extraction in West Virginia
| City | % Employed | vs State | vs National | |
| 1. | Sarah Ann | 84.1% | 2.6%(+81.6)#1 | 0.44%(+83.7)#13 |
| 2. | Raysal | 66.7% | 2.6%(+64.1)#2 | 0.44%(+66.2)#18 |
| 3. | Bolt | 53.7% | 2.6%(+51.1)#3 | 0.44%(+53.2)#32 |
| 4. | Rossmore | 51.7% | 2.6%(+49.1)#4 | 0.44%(+51.3)#37 |
| 5. | Lester | 42.9% | 2.6%(+40.3)#5 | 0.44%(+42.4)#57 |
| 6. | Colcord | 41.9% | 2.6%(+39.4)#6 | 0.44%(+41.5)#61 |
| 7. | Galloway | 41.2% | 2.6%(+38.6)#7 | 0.44%(+40.7)#65 |
| 8. | Crum | 30.4% | 2.6%(+27.9)#8 | 0.44%(+30.0)#111 |
| 9. | Rhodell | 29.8% | 2.6%(+27.2)#9 | 0.44%(+29.4)#118 |
| 10. | Newburg | 28.1% | 2.6%(+25.5)#10 | 0.44%(+27.6)#135 |
| 11. | Anawalt | 25.0% | 2.6%(+22.4)#11 | 0.44%(+24.6)#166 |
| 12. | Accoville | 22.6% | 2.6%(+20.1)#12 | 0.44%(+22.2)#192 |
| 13. | Comfort | 22.5% | 2.6%(+19.9)#13 | 0.44%(+22.1)#198 |
| 14. | Clendenin | 21.6% | 2.6%(+19.0)#14 | 0.44%(+21.2)#214 |
| 15. | Charlton Heights | 21.6% | 2.6%(+19.0)#15 | 0.44%(+21.2)#215 |
| 16. | Gilbert Creek | 21.5% | 2.6%(+18.9)#16 | 0.44%(+21.0)#218 |
| 17. | Chattaroy | 20.2% | 2.6%(+17.6)#17 | 0.44%(+19.7)#243 |
| 18. | Fairview | 19.7% | 2.6%(+17.2)#18 | 0.44%(+19.3)#254 |
| 19. | Bruno | 16.7% | 2.6%(+14.1)#19 | 0.44%(+16.2)#346 |
| 20. | Rock Cave | 16.3% | 2.6%(+13.8)#20 | 0.44%(+15.9)#357 |
| 21. | Gilbert | 16.3% | 2.6%(+13.7)#21 | 0.44%(+15.8)#359 |
| 22. | Cairo | 16.0% | 2.6%(+13.4)#22 | 0.44%(+15.6)#376 |
| 23. | Dorothy | 15.6% | 2.6%(+13.0)#23 | 0.44%(+15.1)#386 |
| 24. | West Logan | 15.2% | 2.6%(+12.6)#24 | 0.44%(+14.8)#395 |
| 25. | Justice | 15.0% | 2.6%(+12.4)#25 | 0.44%(+14.6)#406 |
| 26. | Sylvester | 15.0% | 2.6%(+12.4)#26 | 0.44%(+14.6)#408 |
| 27. | Williamson | 14.6% | 2.6%(+12.1)#27 | 0.44%(+14.2)#434 |
| 28. | Mill Creek | 13.7% | 2.6%(+11.1)#28 | 0.44%(+13.2)#482 |
| 29. | Nitro | 13.4% | 2.6%(+10.8)#29 | 0.44%(+13.0)#501 |
| 30. | Kingwood | 13.4% | 2.6%(+10.8)#30 | 0.44%(+12.9)#506 |
| 31. | Valley Grove | 13.1% | 2.6%(+10.5)#31 | 0.44%(+12.7)#522 |
| 32. | Danville | 12.6% | 2.6%(+10.1)#32 | 0.44%(+12.2)#558 |
| 33. | Mallory | 12.6% | 2.6%(+9.99)#33 | 0.44%(+12.1)#560 |
| 34. | Sutton | 11.9% | 2.6%(+9.34)#34 | 0.44%(+11.5)#599 |
| 35. | Rachel | 11.4% | 2.6%(+8.81)#35 | 0.44%(+11.0)#642 |
| 36. | Valley Bend | 11.3% | 2.6%(+8.71)#36 | 0.44%(+10.9)#652 |
| 37. | War | 11.2% | 2.6%(+8.64)#37 | 0.44%(+10.8)#658 |
| 38. | Barrackville | 10.8% | 2.6%(+8.26)#38 | 0.44%(+10.4)#698 |
| 39. | West Union | 10.6% | 2.6%(+8.06)#39 | 0.44%(+10.2)#705 |
| 40. | Womelsdorf Coalton | 9.8% | 2.6%(+7.25)#40 | 0.44%(+9.40)#775 |
| 41. | Davy | 9.5% | 2.6%(+6.94)#41 | 0.44%(+9.08)#798 |
| 42. | Macarthur | 9.5% | 2.6%(+6.92)#42 | 0.44%(+9.07)#805 |
| 43. | Pennsboro | 9.3% | 2.6%(+6.77)#43 | 0.44%(+8.91)#817 |
| 44. | Fayetteville | 9.0% | 2.6%(+6.37)#44 | 0.44%(+8.51)#868 |
| 45. | Spencer | 8.7% | 2.6%(+6.08)#45 | 0.44%(+8.23)#911 |
| 46. | Man | 8.7% | 2.6%(+6.08)#46 | 0.44%(+8.22)#915 |
| 47. | Weston | 8.6% | 2.6%(+5.99)#47 | 0.44%(+8.14)#926 |
| 48. | Paden City | 8.4% | 2.6%(+5.85)#48 | 0.44%(+7.99)#940 |
| 49. | Idamay | 8.3% | 2.6%(+5.75)#49 | 0.44%(+7.89)#948 |
| 50. | Clearview | 8.3% | 2.6%(+5.75)#50 | 0.44%(+7.89)#949 |
| 51. | Grantsville | 8.3% | 2.6%(+5.75)#51 | 0.44%(+7.89)#950 |
| 52. | Bradshaw | 8.2% | 2.6%(+5.64)#52 | 0.44%(+7.78)#964 |
| 53. | Hundred | 7.8% | 2.6%(+5.17)#53 | 0.44%(+7.31)#1,039 |
| 54. | West Milford | 7.2% | 2.6%(+4.64)#54 | 0.44%(+6.78)#1,108 |
| 55. | Cedar Grove | 7.2% | 2.6%(+4.63)#55 | 0.44%(+6.78)#1,109 |
| 56. | Cowen | 7.2% | 2.6%(+4.62)#56 | 0.44%(+6.77)#1,112 |
| 57. | Davis | 7.1% | 2.6%(+4.48)#57 | 0.44%(+6.63)#1,143 |
| 58. | Oceana | 7.0% | 2.6%(+4.40)#58 | 0.44%(+6.54)#1,157 |
| 59. | Daniels | 6.9% | 2.6%(+4.35)#59 | 0.44%(+6.49)#1,167 |
| 60. | Ravenswood | 6.9% | 2.6%(+4.29)#60 | 0.44%(+6.43)#1,182 |
| 61. | Chauncey | 6.8% | 2.6%(+4.21)#61 | 0.44%(+6.35)#1,192 |
| 62. | Montrose | 6.8% | 2.6%(+4.20)#62 | 0.44%(+6.34)#1,194 |
| 63. | Mcmechen | 6.8% | 2.6%(+4.19)#63 | 0.44%(+6.33)#1,196 |
| 64. | Farmington | 6.8% | 2.6%(+4.18)#64 | 0.44%(+6.32)#1,198 |
| 65. | Huttonsville | 6.6% | 2.6%(+4.01)#65 | 0.44%(+6.15)#1,234 |
| 66. | New Martinsville | 6.5% | 2.6%(+3.91)#66 | 0.44%(+6.06)#1,249 |
| 67. | Masontown | 6.4% | 2.6%(+3.85)#67 | 0.44%(+5.99)#1,264 |
| 68. | Kermit | 6.3% | 2.6%(+3.77)#68 | 0.44%(+5.91)#1,280 |
| 69. | Sophia | 6.2% | 2.6%(+3.67)#69 | 0.44%(+5.81)#1,293 |
| 70. | East View | 6.2% | 2.6%(+3.63)#70 | 0.44%(+5.78)#1,306 |
| 71. | Chapmanville | 6.2% | 2.6%(+3.59)#71 | 0.44%(+5.73)#1,326 |
| 72. | Gassaway | 5.9% | 2.6%(+3.36)#72 | 0.44%(+5.50)#1,368 |
| 73. | Grant Town | 5.9% | 2.6%(+3.30)#73 | 0.44%(+5.44)#1,375 |
| 74. | Craigsville | 5.8% | 2.6%(+3.26)#74 | 0.44%(+5.40)#1,383 |
| 75. | Iaeger | 5.7% | 2.6%(+3.13)#75 | 0.44%(+5.27)#1,409 |
| 76. | Hendricks | 5.7% | 2.6%(+3.10)#76 | 0.44%(+5.24)#1,418 |
| 77. | Reedsville | 5.7% | 2.6%(+3.08)#77 | 0.44%(+5.22)#1,424 |
| 78. | Hinkleville | 5.5% | 2.6%(+2.94)#78 | 0.44%(+5.08)#1,461 |
| 79. | Mannington | 5.4% | 2.6%(+2.81)#79 | 0.44%(+4.96)#1,502 |
| 80. | Mitchell Heights | 5.2% | 2.6%(+2.65)#80 | 0.44%(+4.80)#1,535 |
| 81. | Lost Creek | 5.2% | 2.6%(+2.65)#81 | 0.44%(+4.80)#1,536 |
| 82. | Terra Alta | 5.1% | 2.6%(+2.54)#82 | 0.44%(+4.68)#1,574 |
| 83. | Bradley | 5.1% | 2.6%(+2.52)#83 | 0.44%(+4.66)#1,581 |
| 84. | Buckhannon | 4.8% | 2.6%(+2.24)#84 | 0.44%(+4.39)#1,651 |
| 85. | Bethlehem | 4.8% | 2.6%(+2.20)#85 | 0.44%(+4.34)#1,666 |
| 86. | Flatwoods | 4.7% | 2.6%(+2.08)#86 | 0.44%(+4.23)#1,706 |
| 87. | Ellenboro | 4.5% | 2.6%(+1.96)#87 | 0.44%(+4.11)#1,746 |
| 88. | Pratt | 4.5% | 2.6%(+1.93)#88 | 0.44%(+4.08)#1,760 |
| 89. | Cassville | 4.5% | 2.6%(+1.87)#89 | 0.44%(+4.02)#1,778 |
| 90. | Robinette | 4.4% | 2.6%(+1.81)#90 | 0.44%(+3.96)#1,796 |
| 91. | Enterprise | 4.4% | 2.6%(+1.79)#91 | 0.44%(+3.93)#1,806 |
| 92. | Wallace | 4.3% | 2.6%(+1.67)#92 | 0.44%(+3.82)#1,840 |
| 93. | Crab Orchard | 4.2% | 2.6%(+1.62)#93 | 0.44%(+3.76)#1,862 |
| 94. | Vienna | 4.2% | 2.6%(+1.60)#94 | 0.44%(+3.74)#1,872 |
| 95. | Harrisville | 4.1% | 2.6%(+1.54)#95 | 0.44%(+3.68)#1,895 |
| 96. | Lumberport | 4.0% | 2.6%(+1.46)#96 | 0.44%(+3.60)#1,923 |
| 97. | Stanaford | 4.0% | 2.6%(+1.46)#97 | 0.44%(+3.60)#1,924 |
| 98. | Westover | 4.0% | 2.6%(+1.45)#98 | 0.44%(+3.60)#1,925 |
| 99. | Summersville | 4.0% | 2.6%(+1.45)#99 | 0.44%(+3.60)#1,926 |
| 100. | Hepzibah | 4.0% | 2.6%(+1.42)#100 | 0.44%(+3.56)#1,941 |
Common Questions
What are the Top 10 Cities with the Highest Percentage of Population Employed in Mining, Quarrying, & Extraction in West Virginia?
Top 10 Cities with the Highest Percentage of Population Employed in Mining, Quarrying, & Extraction in West Virginia are:
What city has the Highest Percentage of Population Employed in Mining, Quarrying, & Extraction in West Virginia?
Sarah Ann has the Highest Percentage of Population Employed in Mining, Quarrying, & Extraction in West Virginia with 84.1%.
What is the Percentage of Population Employed in Mining, Quarrying, & Extraction in the State of West Virginia?
Percentage of Population Employed in Mining, Quarrying, & Extraction in West Virginia is 2.6%.
What is the Percentage of Population Employed in Mining, Quarrying, & Extraction in the United States?
Percentage of Population Employed in Mining, Quarrying, & Extraction in the United States is 0.44%.