Cities with the Highest Percentage of Population Employed in Mining, Quarrying, & Extraction in North Dakota
RELATED REPORTS & OPTIONS
Mining, Quarrying, & Extraction
North Dakota
Compare Cities
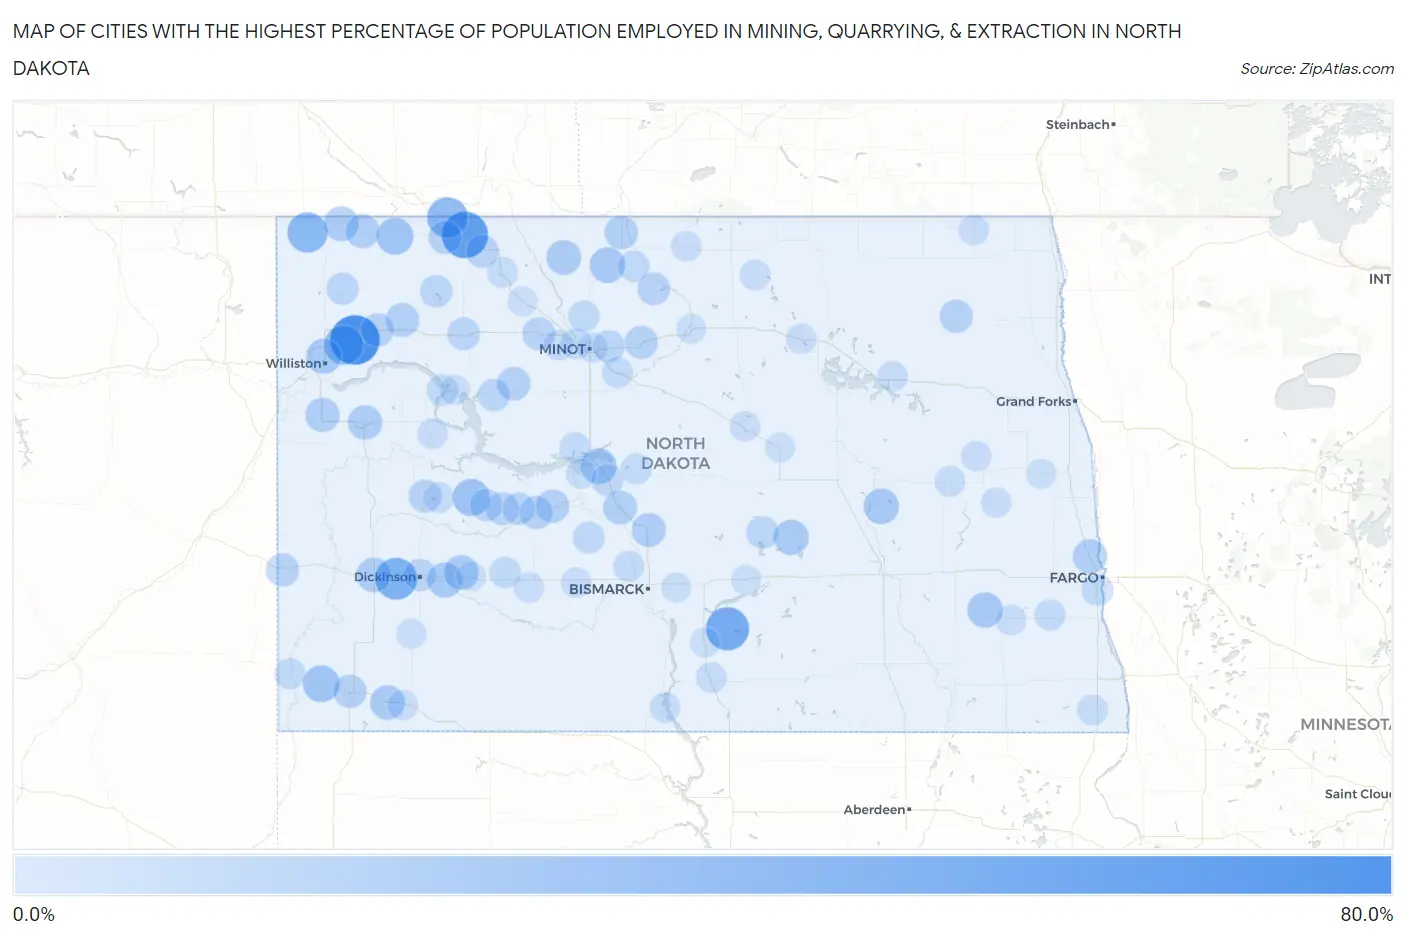
Map of Cities with the Highest Percentage of Population Employed in Mining, Quarrying, & Extraction in North Dakota
0.0%
80.0%
Cities with the Highest Percentage of Population Employed in Mining, Quarrying, & Extraction in North Dakota
| City | % Employed | vs State | vs National | |
| 1. | Epping | 63.2% | 3.0%(+60.2)#1 | 0.44%(+62.7)#23 |
| 2. | Flaxton | 52.9% | 3.0%(+50.0)#2 | 0.44%(+52.5)#33 |
| 3. | Braddock | 42.9% | 3.0%(+39.9)#3 | 0.44%(+42.4)#59 |
| 4. | South Heart | 38.5% | 3.0%(+35.5)#4 | 0.44%(+38.0)#75 |
| 5. | Portal | 34.8% | 3.0%(+31.9)#5 | 0.44%(+34.4)#88 |
| 6. | Fortuna | 33.3% | 3.0%(+30.4)#6 | 0.44%(+32.9)#97 |
| 7. | Springbrook | 30.0% | 3.0%(+27.0)#7 | 0.44%(+29.6)#117 |
| 8. | Halliday | 23.6% | 3.0%(+20.6)#8 | 0.44%(+23.2)#180 |
| 9. | Noonan | 22.6% | 3.0%(+19.6)#9 | 0.44%(+22.1)#195 |
| 10. | Rhame | 22.5% | 3.0%(+19.6)#10 | 0.44%(+22.1)#197 |
| 11. | Coleharbor | 19.2% | 3.0%(+16.3)#11 | 0.44%(+18.8)#266 |
| 12. | Maxbass | 18.9% | 3.0%(+15.9)#12 | 0.44%(+18.4)#275 |
| 13. | Kensal | 18.7% | 3.0%(+15.7)#13 | 0.44%(+18.3)#280 |
| 14. | Nome | 18.5% | 3.0%(+15.6)#14 | 0.44%(+18.1)#286 |
| 15. | Williston | 17.9% | 3.0%(+14.9)#15 | 0.44%(+17.5)#300 |
| 16. | Gladstone | 17.8% | 3.0%(+14.8)#16 | 0.44%(+17.4)#303 |
| 17. | Pettibone | 17.4% | 3.0%(+14.4)#17 | 0.44%(+17.0)#314 |
| 18. | Ambrose | 16.7% | 3.0%(+13.7)#18 | 0.44%(+16.2)#348 |
| 19. | Gascoyne | 16.7% | 3.0%(+13.7)#19 | 0.44%(+16.2)#350 |
| 20. | Mohall | 16.6% | 3.0%(+13.6)#20 | 0.44%(+16.2)#353 |
| 21. | Taylor | 16.5% | 3.0%(+13.5)#21 | 0.44%(+16.0)#354 |
| 22. | Belfield | 16.1% | 3.0%(+13.2)#22 | 0.44%(+15.7)#366 |
| 23. | Watford City | 15.7% | 3.0%(+12.8)#23 | 0.44%(+15.3)#380 |
| 24. | Alexander | 14.9% | 3.0%(+11.9)#24 | 0.44%(+14.5)#414 |
| 25. | Brooktree Park | 14.8% | 3.0%(+11.9)#25 | 0.44%(+14.4)#422 |
| 26. | Wilton | 14.4% | 3.0%(+11.4)#26 | 0.44%(+13.9)#451 |
| 27. | Crosby | 14.3% | 3.0%(+11.4)#27 | 0.44%(+13.9)#453 |
| 28. | Tioga | 14.1% | 3.0%(+11.1)#28 | 0.44%(+13.6)#465 |
| 29. | Washburn | 14.1% | 3.0%(+11.1)#29 | 0.44%(+13.6)#466 |
| 30. | Westhope | 13.2% | 3.0%(+10.2)#30 | 0.44%(+12.7)#517 |
| 31. | Plaza | 12.6% | 3.0%(+9.67)#31 | 0.44%(+12.2)#559 |
| 32. | Bowman | 12.4% | 3.0%(+9.48)#32 | 0.44%(+12.0)#570 |
| 33. | Hazen | 12.3% | 3.0%(+9.29)#33 | 0.44%(+11.8)#581 |
| 34. | Adams | 11.9% | 3.0%(+8.94)#34 | 0.44%(+11.5)#601 |
| 35. | Granville | 11.8% | 3.0%(+8.84)#35 | 0.44%(+11.4)#609 |
| 36. | Beulah | 11.7% | 3.0%(+8.76)#36 | 0.44%(+11.3)#616 |
| 37. | Beach | 11.7% | 3.0%(+8.75)#37 | 0.44%(+11.3)#619 |
| 38. | Lignite | 11.7% | 3.0%(+8.73)#38 | 0.44%(+11.2)#620 |
| 39. | Ray | 11.5% | 3.0%(+8.53)#39 | 0.44%(+11.0)#634 |
| 40. | Berthold | 11.1% | 3.0%(+8.09)#40 | 0.44%(+10.6)#676 |
| 41. | Golden Valley | 11.0% | 3.0%(+8.04)#41 | 0.44%(+10.6)#684 |
| 42. | Killdeer | 11.0% | 3.0%(+8.03)#42 | 0.44%(+10.5)#685 |
| 43. | Bowbells | 10.7% | 3.0%(+7.73)#43 | 0.44%(+10.3)#702 |
| 44. | Upham | 10.6% | 3.0%(+7.64)#44 | 0.44%(+10.2)#706 |
| 45. | Zap | 9.8% | 3.0%(+6.87)#45 | 0.44%(+9.40)#776 |
| 46. | Stanley | 9.8% | 3.0%(+6.84)#46 | 0.44%(+9.36)#778 |
| 47. | Dickinson | 9.6% | 3.0%(+6.66)#47 | 0.44%(+9.19)#790 |
| 48. | Powers Lake | 9.6% | 3.0%(+6.60)#48 | 0.44%(+9.12)#794 |
| 49. | Robinson | 9.5% | 3.0%(+6.56)#49 | 0.44%(+9.08)#802 |
| 50. | Dodge | 9.4% | 3.0%(+6.41)#50 | 0.44%(+8.93)#815 |
| 51. | Parshall | 9.3% | 3.0%(+6.38)#51 | 0.44%(+8.90)#820 |
| 52. | Alamo | 8.8% | 3.0%(+5.86)#52 | 0.44%(+8.38)#887 |
| 53. | Trenton | 8.7% | 3.0%(+5.76)#53 | 0.44%(+8.28)#897 |
| 54. | Surrey | 8.5% | 3.0%(+5.54)#54 | 0.44%(+8.06)#935 |
| 55. | Underwood | 8.0% | 3.0%(+5.01)#55 | 0.44%(+7.54)#1,002 |
| 56. | Center | 7.8% | 3.0%(+4.87)#56 | 0.44%(+7.39)#1,024 |
| 57. | Hebron | 6.9% | 3.0%(+3.93)#57 | 0.44%(+6.46)#1,175 |
| 58. | Frontier | 6.9% | 3.0%(+3.90)#58 | 0.44%(+6.42)#1,183 |
| 59. | Four Bears Village | 6.7% | 3.0%(+3.70)#59 | 0.44%(+6.23)#1,217 |
| 60. | Newburg | 6.5% | 3.0%(+3.49)#60 | 0.44%(+6.01)#1,262 |
| 61. | Minot Afb | 6.3% | 3.0%(+3.32)#61 | 0.44%(+5.84)#1,290 |
| 62. | Sawyer | 6.0% | 3.0%(+3.04)#62 | 0.44%(+5.56)#1,357 |
| 63. | Harmon | 5.4% | 3.0%(+2.44)#63 | 0.44%(+4.97)#1,496 |
| 64. | Marmarth | 5.4% | 3.0%(+2.44)#64 | 0.44%(+4.97)#1,498 |
| 65. | Turtle Lake | 5.3% | 3.0%(+2.30)#65 | 0.44%(+4.82)#1,526 |
| 66. | Leonard | 5.2% | 3.0%(+2.22)#66 | 0.44%(+4.74)#1,555 |
| 67. | Garrison | 5.2% | 3.0%(+2.21)#67 | 0.44%(+4.73)#1,558 |
| 68. | Burlington | 5.1% | 3.0%(+2.18)#68 | 0.44%(+4.70)#1,568 |
| 69. | Hankinson | 4.8% | 3.0%(+1.85)#69 | 0.44%(+4.37)#1,660 |
| 70. | Linton | 4.7% | 3.0%(+1.72)#70 | 0.44%(+4.24)#1,704 |
| 71. | Kenmare | 4.5% | 3.0%(+1.57)#71 | 0.44%(+4.10)#1,753 |
| 72. | Rolette | 4.5% | 3.0%(+1.56)#72 | 0.44%(+4.08)#1,759 |
| 73. | Fort Yates | 4.4% | 3.0%(+1.48)#73 | 0.44%(+4.00)#1,786 |
| 74. | Des Lacs | 4.3% | 3.0%(+1.38)#74 | 0.44%(+3.91)#1,818 |
| 75. | Dunn Center | 4.3% | 3.0%(+1.32)#75 | 0.44%(+3.85)#1,830 |
| 76. | Cooperstown | 4.3% | 3.0%(+1.31)#76 | 0.44%(+3.83)#1,833 |
| 77. | Harvey | 3.9% | 3.0%(+0.940)#77 | 0.44%(+3.46)#1,986 |
| 78. | Leeds | 3.9% | 3.0%(+0.900)#78 | 0.44%(+3.42)#2,008 |
| 79. | Reeder | 3.8% | 3.0%(+0.883)#79 | 0.44%(+3.41)#2,018 |
| 80. | Sharon | 3.8% | 3.0%(+0.883)#80 | 0.44%(+3.41)#2,021 |
| 81. | Glen Ullin | 3.8% | 3.0%(+0.854)#81 | 0.44%(+3.38)#2,032 |
| 82. | Enderlin | 3.7% | 3.0%(+0.773)#82 | 0.44%(+3.30)#2,065 |
| 83. | New Salem | 3.7% | 3.0%(+0.773)#83 | 0.44%(+3.30)#2,066 |
| 84. | Crary | 3.6% | 3.0%(+0.673)#84 | 0.44%(+3.20)#2,102 |
| 85. | Hope | 3.6% | 3.0%(+0.634)#85 | 0.44%(+3.16)#2,123 |
| 86. | Mandaree | 3.5% | 3.0%(+0.567)#86 | 0.44%(+3.09)#2,170 |
| 87. | Minot | 3.5% | 3.0%(+0.555)#87 | 0.44%(+3.08)#2,176 |
| 88. | Bottineau | 3.5% | 3.0%(+0.553)#88 | 0.44%(+3.08)#2,180 |
| 89. | Walhalla | 3.4% | 3.0%(+0.437)#89 | 0.44%(+2.96)#2,252 |
| 90. | Riverdale | 3.1% | 3.0%(+0.162)#90 | 0.44%(+2.68)#2,416 |
| 91. | Menoken | 2.9% | 3.0%(-0.022)#91 | 0.44%(+2.50)#2,522 |
| 92. | Steele | 2.8% | 3.0%(-0.113)#92 | 0.44%(+2.41)#2,586 |
| 93. | Hazelton | 2.8% | 3.0%(-0.185)#93 | 0.44%(+2.34)#2,632 |
| 94. | Fessenden | 2.7% | 3.0%(-0.236)#94 | 0.44%(+2.29)#2,669 |
| 95. | New England | 2.7% | 3.0%(-0.303)#95 | 0.44%(+2.22)#2,726 |
| 96. | Donnybrook | 2.6% | 3.0%(-0.331)#96 | 0.44%(+2.19)#2,759 |
| 97. | New Town | 2.6% | 3.0%(-0.351)#97 | 0.44%(+2.17)#2,771 |
| 98. | Richardton | 2.6% | 3.0%(-0.356)#98 | 0.44%(+2.17)#2,775 |
| 99. | Mayville | 2.5% | 3.0%(-0.422)#99 | 0.44%(+2.10)#2,826 |
| 100. | Towner | 2.5% | 3.0%(-0.463)#100 | 0.44%(+2.06)#2,856 |
Common Questions
What are the Top 10 Cities with the Highest Percentage of Population Employed in Mining, Quarrying, & Extraction in North Dakota?
Top 10 Cities with the Highest Percentage of Population Employed in Mining, Quarrying, & Extraction in North Dakota are:
#1
63.2%
#2
52.9%
#3
42.9%
#4
38.5%
#5
34.8%
#6
33.3%
#7
30.0%
#8
23.6%
#9
22.6%
#10
22.5%
What city has the Highest Percentage of Population Employed in Mining, Quarrying, & Extraction in North Dakota?
Epping has the Highest Percentage of Population Employed in Mining, Quarrying, & Extraction in North Dakota with 63.2%.
What is the Percentage of Population Employed in Mining, Quarrying, & Extraction in the State of North Dakota?
Percentage of Population Employed in Mining, Quarrying, & Extraction in North Dakota is 3.0%.
What is the Percentage of Population Employed in Mining, Quarrying, & Extraction in the United States?
Percentage of Population Employed in Mining, Quarrying, & Extraction in the United States is 0.44%.