Cities with the Highest Percentage of Population Employed in Mining, Quarrying, & Extraction in Tennessee
RELATED REPORTS & OPTIONS
Mining, Quarrying, & Extraction
Tennessee
Compare Cities
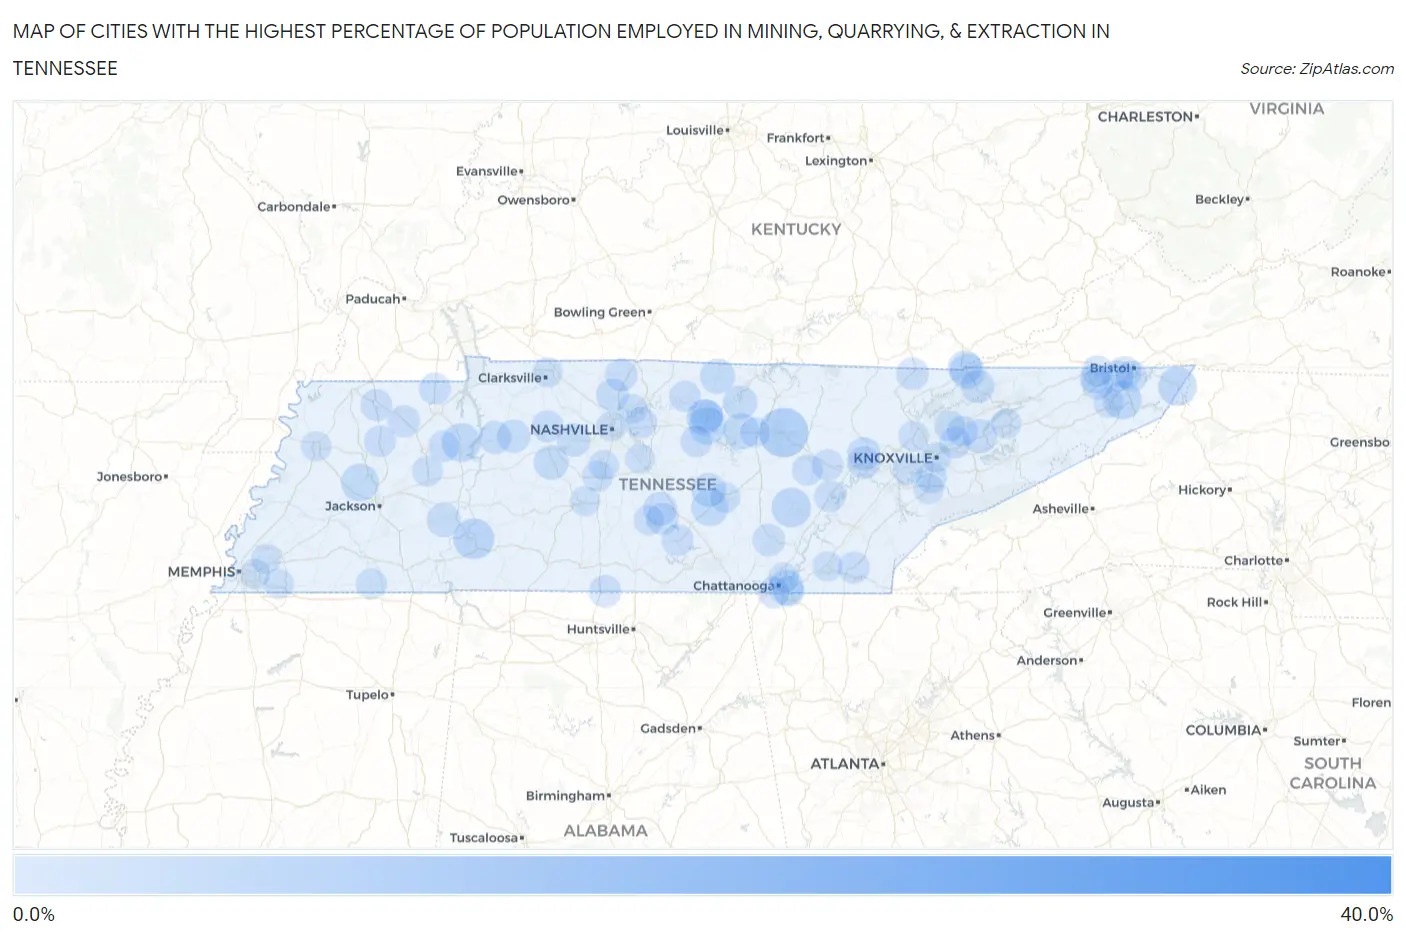
Map of Cities with the Highest Percentage of Population Employed in Mining, Quarrying, & Extraction in Tennessee
0.0%
40.0%
Cities with the Highest Percentage of Population Employed in Mining, Quarrying, & Extraction in Tennessee
| City | % Employed | vs State | vs National | |
| 1. | Holladay | 38.7% | 0.14%(+38.6)#1 | 0.44%(+38.3)#72 |
| 2. | Mayland | 23.0% | 0.14%(+22.9)#2 | 0.44%(+22.6)#188 |
| 3. | Monterey | 6.8% | 0.14%(+6.70)#3 | 0.44%(+6.41)#1,187 |
| 4. | Finley | 4.7% | 0.14%(+4.53)#4 | 0.44%(+4.23)#1,705 |
| 5. | Clifton | 3.8% | 0.14%(+3.69)#5 | 0.44%(+3.40)#2,026 |
| 6. | Pikeville | 3.3% | 0.14%(+3.19)#6 | 0.44%(+2.89)#2,289 |
| 7. | Strawberry Plains | 3.1% | 0.14%(+2.99)#7 | 0.44%(+2.69)#2,409 |
| 8. | Camden | 3.1% | 0.14%(+2.95)#8 | 0.44%(+2.66)#2,432 |
| 9. | Mountain City | 3.0% | 0.14%(+2.89)#9 | 0.44%(+2.59)#2,471 |
| 10. | Watauga | 3.0% | 0.14%(+2.84)#10 | 0.44%(+2.54)#2,503 |
| 11. | Gadsden | 2.8% | 0.14%(+2.62)#11 | 0.44%(+2.32)#2,641 |
| 12. | Gordonsville | 2.5% | 0.14%(+2.35)#12 | 0.44%(+2.05)#2,865 |
| 13. | Morrison | 2.5% | 0.14%(+2.33)#13 | 0.44%(+2.03)#2,878 |
| 14. | South Carthage | 2.4% | 0.14%(+2.25)#14 | 0.44%(+1.96)#2,936 |
| 15. | Baxter | 2.2% | 0.14%(+2.05)#15 | 0.44%(+1.75)#3,098 |
| 16. | Harrogate | 1.9% | 0.14%(+1.77)#16 | 0.44%(+1.47)#3,348 |
| 17. | Ridgeside | 1.9% | 0.14%(+1.74)#17 | 0.44%(+1.44)#3,380 |
| 18. | Red Boiling Springs | 1.8% | 0.14%(+1.67)#18 | 0.44%(+1.37)#3,456 |
| 19. | Bon Aqua Junction | 1.7% | 0.14%(+1.54)#19 | 0.44%(+1.24)#3,580 |
| 20. | New Market | 1.5% | 0.14%(+1.36)#20 | 0.44%(+1.06)#3,826 |
| 21. | Centertown | 1.5% | 0.14%(+1.35)#21 | 0.44%(+1.05)#3,837 |
| 22. | Gainesboro | 1.5% | 0.14%(+1.33)#22 | 0.44%(+1.03)#3,857 |
| 23. | Cumberland Gap | 1.4% | 0.14%(+1.29)#23 | 0.44%(+0.988)#3,912 |
| 24. | Scotts Hill | 1.3% | 0.14%(+1.20)#24 | 0.44%(+0.900)#4,029 |
| 25. | Bell Buckle | 1.3% | 0.14%(+1.16)#25 | 0.44%(+0.865)#4,079 |
| 26. | Tazewell | 1.3% | 0.14%(+1.11)#26 | 0.44%(+0.810)#4,158 |
| 27. | Kingston Springs | 1.2% | 0.14%(+1.09)#27 | 0.44%(+0.790)#4,191 |
| 28. | Mcewen | 1.2% | 0.14%(+1.02)#28 | 0.44%(+0.717)#4,308 |
| 29. | Oakdale | 1.1% | 0.14%(+0.994)#29 | 0.44%(+0.696)#4,340 |
| 30. | Harriman | 1.1% | 0.14%(+0.956)#30 | 0.44%(+0.657)#4,411 |
| 31. | Waverly | 1.0% | 0.14%(+0.880)#31 | 0.44%(+0.582)#4,525 |
| 32. | Ridgetop | 0.99% | 0.14%(+0.844)#32 | 0.44%(+0.546)#4,592 |
| 33. | Dunlap | 0.98% | 0.14%(+0.840)#33 | 0.44%(+0.541)#4,600 |
| 34. | Carthage | 0.96% | 0.14%(+0.823)#34 | 0.44%(+0.524)#4,634 |
| 35. | Jellico | 0.95% | 0.14%(+0.807)#35 | 0.44%(+0.508)#4,667 |
| 36. | Cross Plains | 0.92% | 0.14%(+0.779)#36 | 0.44%(+0.481)#4,706 |
| 37. | Walnut Hill | 0.82% | 0.14%(+0.676)#37 | 0.44%(+0.378)#4,898 |
| 38. | Wartrace | 0.81% | 0.14%(+0.665)#38 | 0.44%(+0.366)#4,928 |
| 39. | Gleason | 0.79% | 0.14%(+0.650)#39 | 0.44%(+0.352)#4,949 |
| 40. | Ardmore | 0.75% | 0.14%(+0.606)#40 | 0.44%(+0.307)#5,053 |
| 41. | Benton | 0.74% | 0.14%(+0.600)#41 | 0.44%(+0.302)#5,066 |
| 42. | Martin | 0.71% | 0.14%(+0.565)#42 | 0.44%(+0.266)#5,183 |
| 43. | Blountville | 0.70% | 0.14%(+0.558)#43 | 0.44%(+0.260)#5,202 |
| 44. | Puryear | 0.66% | 0.14%(+0.518)#44 | 0.44%(+0.220)#5,298 |
| 45. | Bradford | 0.66% | 0.14%(+0.515)#45 | 0.44%(+0.216)#5,306 |
| 46. | Mascot | 0.61% | 0.14%(+0.473)#46 | 0.44%(+0.175)#5,437 |
| 47. | Tullahoma | 0.60% | 0.14%(+0.463)#47 | 0.44%(+0.164)#5,467 |
| 48. | Charlotte | 0.59% | 0.14%(+0.451)#48 | 0.44%(+0.152)#5,510 |
| 49. | Alexandria | 0.59% | 0.14%(+0.444)#49 | 0.44%(+0.146)#5,524 |
| 50. | Lookout Mountain | 0.57% | 0.14%(+0.430)#50 | 0.44%(+0.131)#5,568 |
| 51. | Colonial Heights | 0.56% | 0.14%(+0.423)#51 | 0.44%(+0.124)#5,590 |
| 52. | Crab Orchard | 0.55% | 0.14%(+0.411)#52 | 0.44%(+0.112)#5,622 |
| 53. | Mount Juliet | 0.54% | 0.14%(+0.398)#53 | 0.44%(+0.100)#5,661 |
| 54. | Spring City | 0.51% | 0.14%(+0.363)#54 | 0.44%(+0.065)#5,754 |
| 55. | Bloomingdale | 0.47% | 0.14%(+0.324)#55 | 0.44%(+0.025)#5,881 |
| 56. | Bruceton | 0.46% | 0.14%(+0.314)#56 | 0.44%(+0.015)#5,915 |
| 57. | Hartsville Trousdale County | 0.41% | 0.14%(+0.268)#57 | 0.44%(-0.030)#6,086 |
| 58. | Bristol | 0.40% | 0.14%(+0.254)#58 | 0.44%(-0.044)#6,139 |
| 59. | Alcoa | 0.39% | 0.14%(+0.243)#59 | 0.44%(-0.055)#6,182 |
| 60. | Blaine | 0.37% | 0.14%(+0.225)#60 | 0.44%(-0.074)#6,253 |
| 61. | Lake Tansi | 0.35% | 0.14%(+0.209)#61 | 0.44%(-0.089)#6,310 |
| 62. | Plainview | 0.35% | 0.14%(+0.207)#62 | 0.44%(-0.091)#6,314 |
| 63. | Clinton | 0.32% | 0.14%(+0.183)#63 | 0.44%(-0.115)#6,402 |
| 64. | Middleton | 0.32% | 0.14%(+0.177)#64 | 0.44%(-0.122)#6,425 |
| 65. | Farragut | 0.26% | 0.14%(+0.122)#65 | 0.44%(-0.177)#6,620 |
| 66. | Thompson S Station | 0.26% | 0.14%(+0.119)#66 | 0.44%(-0.180)#6,634 |
| 67. | Clarksburg | 0.24% | 0.14%(+0.096)#67 | 0.44%(-0.202)#6,703 |
| 68. | Maryville | 0.23% | 0.14%(+0.091)#68 | 0.44%(-0.208)#6,722 |
| 69. | Mcminnville | 0.22% | 0.14%(+0.082)#69 | 0.44%(-0.217)#6,754 |
| 70. | Johnson City | 0.22% | 0.14%(+0.080)#70 | 0.44%(-0.219)#6,759 |
| 71. | East Ridge | 0.19% | 0.14%(+0.051)#71 | 0.44%(-0.248)#6,898 |
| 72. | Shelbyville | 0.15% | 0.14%(+0.009)#72 | 0.44%(-0.289)#7,062 |
| 73. | Dyersburg | 0.14% | 0.14%(-0.003)#73 | 0.44%(-0.301)#7,122 |
| 74. | Chattanooga | 0.12% | 0.14%(-0.025)#74 | 0.44%(-0.324)#7,252 |
| 75. | Knoxville | 0.11% | 0.14%(-0.036)#75 | 0.44%(-0.334)#7,311 |
| 76. | Franklin | 0.10% | 0.14%(-0.041)#76 | 0.44%(-0.340)#7,333 |
| 77. | Kingsport | 0.099% | 0.14%(-0.043)#77 | 0.44%(-0.342)#7,347 |
| 78. | Clarksville | 0.086% | 0.14%(-0.056)#78 | 0.44%(-0.354)#7,417 |
| 79. | Collierville | 0.078% | 0.14%(-0.064)#79 | 0.44%(-0.362)#7,470 |
| 80. | Hendersonville | 0.071% | 0.14%(-0.071)#80 | 0.44%(-0.370)#7,526 |
| 81. | Cookeville | 0.067% | 0.14%(-0.075)#81 | 0.44%(-0.373)#7,551 |
| 82. | Morristown | 0.067% | 0.14%(-0.075)#82 | 0.44%(-0.374)#7,555 |
| 83. | Columbia | 0.034% | 0.14%(-0.108)#83 | 0.44%(-0.406)#7,771 |
| 84. | Cleveland | 0.031% | 0.14%(-0.111)#84 | 0.44%(-0.409)#7,793 |
| 85. | Bartlett | 0.026% | 0.14%(-0.116)#85 | 0.44%(-0.415)#7,836 |
| 86. | Smyrna | 0.024% | 0.14%(-0.118)#86 | 0.44%(-0.416)#7,848 |
| 87. | Memphis | 0.018% | 0.14%(-0.124)#87 | 0.44%(-0.422)#7,884 |
| 88. | Nashville | 0.018% | 0.14%(-0.124)#88 | 0.44%(-0.423)#7,885 |
Common Questions
What are the Top 10 Cities with the Highest Percentage of Population Employed in Mining, Quarrying, & Extraction in Tennessee?
Top 10 Cities with the Highest Percentage of Population Employed in Mining, Quarrying, & Extraction in Tennessee are:
#1
6.8%
#2
3.8%
#3
3.3%
#4
3.1%
#5
3.0%
#6
3.0%
#7
2.8%
#8
2.5%
#9
2.5%
#10
2.4%
What city has the Highest Percentage of Population Employed in Mining, Quarrying, & Extraction in Tennessee?
Monterey has the Highest Percentage of Population Employed in Mining, Quarrying, & Extraction in Tennessee with 6.8%.
What is the Percentage of Population Employed in Mining, Quarrying, & Extraction in the State of Tennessee?
Percentage of Population Employed in Mining, Quarrying, & Extraction in Tennessee is 0.14%.
What is the Percentage of Population Employed in Mining, Quarrying, & Extraction in the United States?
Percentage of Population Employed in Mining, Quarrying, & Extraction in the United States is 0.44%.