Cities with the Highest Percentage of Population Employed in Mining, Quarrying, & Extraction in Iowa
RELATED REPORTS & OPTIONS
Mining, Quarrying, & Extraction
Iowa
Compare Cities
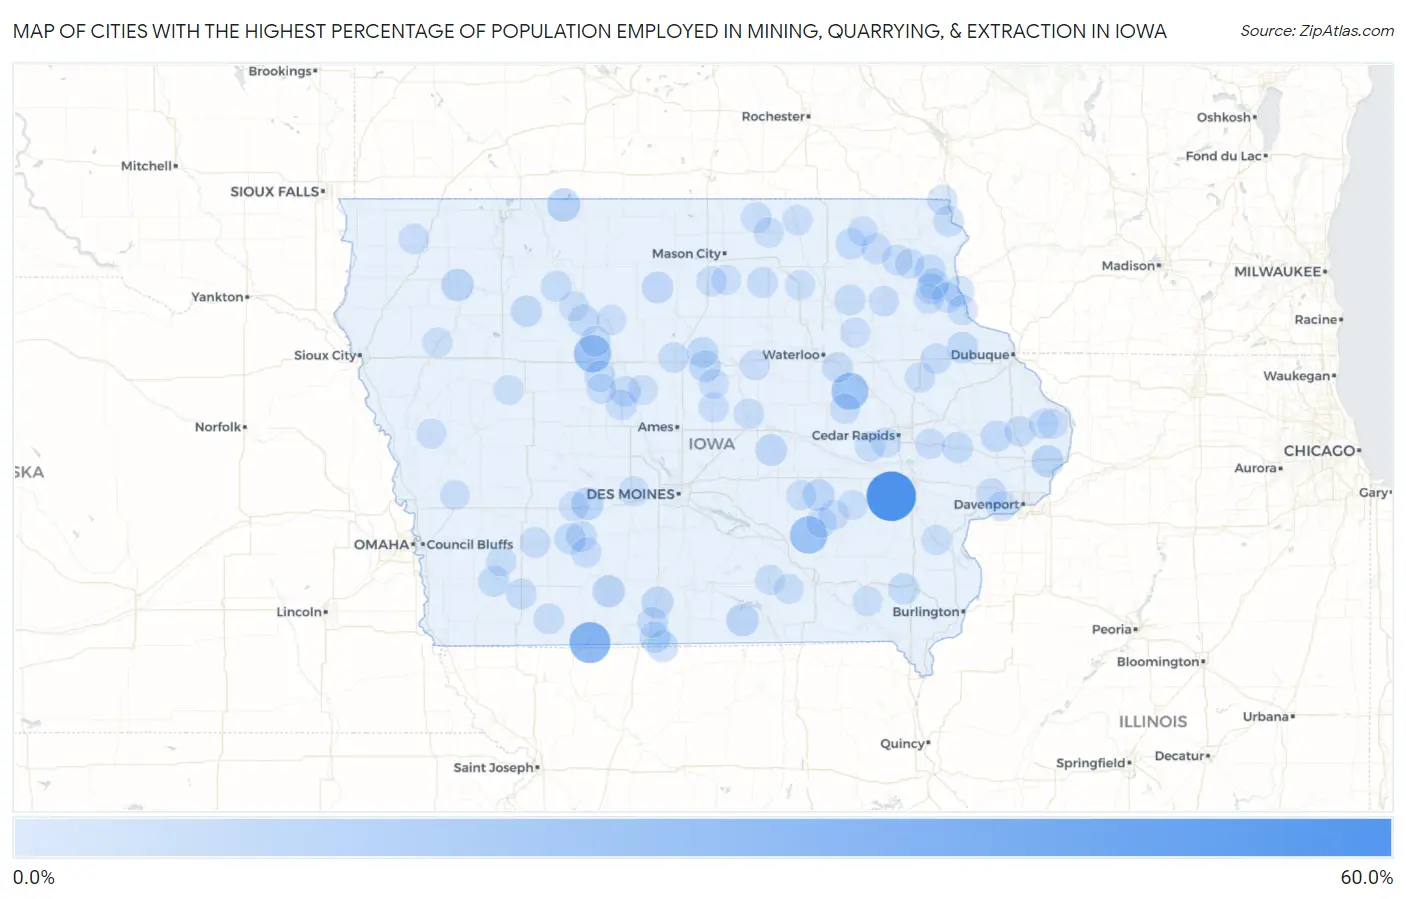
Map of Cities with the Highest Percentage of Population Employed in Mining, Quarrying, & Extraction in Iowa
0.0%
60.0%
Cities with the Highest Percentage of Population Employed in Mining, Quarrying, & Extraction in Iowa
| City | % Employed | vs State | vs National | |
| 1. | Frytown | 51.4% | 0.17%(+51.3)#1 | 0.44%(+51.0)#40 |
| 2. | Redding | 28.6% | 0.17%(+28.4)#2 | 0.44%(+28.1)#130 |
| 3. | Rose Hill | 19.5% | 0.17%(+19.3)#3 | 0.44%(+19.1)#258 |
| 4. | Barnum | 18.7% | 0.17%(+18.5)#4 | 0.44%(+18.2)#282 |
| 5. | Mount Auburn | 18.1% | 0.17%(+17.9)#5 | 0.44%(+17.6)#297 |
| 6. | Dolliver | 8.9% | 0.17%(+8.72)#6 | 0.44%(+8.45)#878 |
| 7. | Plano | 7.1% | 0.17%(+6.97)#7 | 0.44%(+6.70)#1,130 |
| 8. | Calumet | 6.9% | 0.17%(+6.73)#8 | 0.44%(+6.46)#1,176 |
| 9. | Menlo | 6.7% | 0.17%(+6.50)#9 | 0.44%(+6.23)#1,215 |
| 10. | Arispe | 6.5% | 0.17%(+6.28)#10 | 0.44%(+6.01)#1,261 |
| 11. | Low Moor | 5.6% | 0.17%(+5.47)#11 | 0.44%(+5.20)#1,431 |
| 12. | Deep River | 5.6% | 0.17%(+5.38)#12 | 0.44%(+5.12)#1,455 |
| 13. | Van Wert | 5.1% | 0.17%(+4.91)#13 | 0.44%(+4.64)#1,586 |
| 14. | Gilman | 5.0% | 0.17%(+4.80)#14 | 0.44%(+4.53)#1,614 |
| 15. | Buckeye | 4.9% | 0.17%(+4.71)#15 | 0.44%(+4.44)#1,640 |
| 16. | Kanawha | 4.8% | 0.17%(+4.65)#16 | 0.44%(+4.38)#1,654 |
| 17. | Albert City | 4.2% | 0.17%(+4.07)#17 | 0.44%(+3.80)#1,845 |
| 18. | New Vienna | 4.2% | 0.17%(+4.06)#18 | 0.44%(+3.79)#1,852 |
| 19. | Pleasanton | 4.2% | 0.17%(+4.00)#19 | 0.44%(+3.73)#1,878 |
| 20. | Davis City | 4.0% | 0.17%(+3.79)#20 | 0.44%(+3.52)#1,964 |
| 21. | Westwood | 3.8% | 0.17%(+3.67)#21 | 0.44%(+3.41)#2,019 |
| 22. | Lost Nation | 3.7% | 0.17%(+3.53)#22 | 0.44%(+3.26)#2,077 |
| 23. | Alden | 3.7% | 0.17%(+3.51)#23 | 0.44%(+3.25)#2,086 |
| 24. | Fontanelle | 3.6% | 0.17%(+3.46)#24 | 0.44%(+3.20)#2,100 |
| 25. | Stanwood | 3.6% | 0.17%(+3.43)#25 | 0.44%(+3.16)#2,120 |
| 26. | Gilmore City | 3.6% | 0.17%(+3.39)#26 | 0.44%(+3.12)#2,150 |
| 27. | Red Oak | 3.6% | 0.17%(+3.38)#27 | 0.44%(+3.12)#2,153 |
| 28. | Monona | 3.6% | 0.17%(+3.38)#28 | 0.44%(+3.11)#2,154 |
| 29. | Callender | 3.5% | 0.17%(+3.30)#29 | 0.44%(+3.03)#2,209 |
| 30. | Protivin | 3.4% | 0.17%(+3.20)#30 | 0.44%(+2.93)#2,267 |
| 31. | St Olaf | 3.2% | 0.17%(+3.00)#31 | 0.44%(+2.73)#2,386 |
| 32. | Clayton | 3.1% | 0.17%(+2.95)#32 | 0.44%(+2.68)#2,419 |
| 33. | Farmersburg | 2.9% | 0.17%(+2.76)#33 | 0.44%(+2.49)#2,528 |
| 34. | Clare | 2.9% | 0.17%(+2.73)#34 | 0.44%(+2.46)#2,553 |
| 35. | Mallard | 2.9% | 0.17%(+2.69)#35 | 0.44%(+2.42)#2,577 |
| 36. | Decatur City | 2.8% | 0.17%(+2.65)#36 | 0.44%(+2.38)#2,601 |
| 37. | Villisca | 2.8% | 0.17%(+2.64)#37 | 0.44%(+2.37)#2,608 |
| 38. | Sumner | 2.8% | 0.17%(+2.60)#38 | 0.44%(+2.33)#2,635 |
| 39. | Greenfield | 2.7% | 0.17%(+2.57)#39 | 0.44%(+2.30)#2,658 |
| 40. | Castalia | 2.7% | 0.17%(+2.57)#40 | 0.44%(+2.30)#2,664 |
| 41. | Gilbertville | 2.6% | 0.17%(+2.45)#41 | 0.44%(+2.18)#2,765 |
| 42. | Lansing | 2.6% | 0.17%(+2.43)#42 | 0.44%(+2.16)#2,787 |
| 43. | Cumberland | 2.6% | 0.17%(+2.41)#43 | 0.44%(+2.15)#2,796 |
| 44. | Dayton | 2.6% | 0.17%(+2.41)#44 | 0.44%(+2.14)#2,800 |
| 45. | Marble Rock | 2.5% | 0.17%(+2.36)#45 | 0.44%(+2.09)#2,831 |
| 46. | Delaware | 2.5% | 0.17%(+2.36)#46 | 0.44%(+2.09)#2,834 |
| 47. | Delmar | 2.4% | 0.17%(+2.21)#47 | 0.44%(+1.94)#2,950 |
| 48. | Blairsburg | 2.4% | 0.17%(+2.21)#48 | 0.44%(+1.94)#2,952 |
| 49. | Stockton | 2.4% | 0.17%(+2.21)#49 | 0.44%(+1.94)#2,953 |
| 50. | What Cheer | 2.3% | 0.17%(+2.09)#50 | 0.44%(+1.82)#3,035 |
| 51. | Boxholm | 2.2% | 0.17%(+2.05)#51 | 0.44%(+1.78)#3,076 |
| 52. | Matlock | 2.2% | 0.17%(+2.03)#52 | 0.44%(+1.76)#3,091 |
| 53. | Kent Estates | 2.2% | 0.17%(+2.03)#53 | 0.44%(+1.76)#3,092 |
| 54. | Calmar | 2.2% | 0.17%(+1.98)#54 | 0.44%(+1.71)#3,125 |
| 55. | Gravity | 2.2% | 0.17%(+1.98)#55 | 0.44%(+1.71)#3,130 |
| 56. | Garrison | 2.0% | 0.17%(+1.84)#56 | 0.44%(+1.57)#3,251 |
| 57. | St Ansgar | 2.0% | 0.17%(+1.79)#57 | 0.44%(+1.52)#3,299 |
| 58. | Orient | 1.9% | 0.17%(+1.75)#58 | 0.44%(+1.48)#3,333 |
| 59. | Garnavillo | 1.9% | 0.17%(+1.74)#59 | 0.44%(+1.47)#3,354 |
| 60. | Swaledale | 1.9% | 0.17%(+1.72)#60 | 0.44%(+1.45)#3,377 |
| 61. | Norway | 1.8% | 0.17%(+1.65)#61 | 0.44%(+1.38)#3,435 |
| 62. | Ryan | 1.7% | 0.17%(+1.56)#62 | 0.44%(+1.29)#3,531 |
| 63. | Montezuma | 1.7% | 0.17%(+1.55)#63 | 0.44%(+1.28)#3,539 |
| 64. | Keswick | 1.7% | 0.17%(+1.55)#64 | 0.44%(+1.28)#3,542 |
| 65. | Blue Grass | 1.7% | 0.17%(+1.50)#65 | 0.44%(+1.23)#3,594 |
| 66. | Albion | 1.7% | 0.17%(+1.49)#66 | 0.44%(+1.22)#3,619 |
| 67. | Guttenberg | 1.6% | 0.17%(+1.46)#67 | 0.44%(+1.19)#3,654 |
| 68. | Fayette | 1.6% | 0.17%(+1.40)#68 | 0.44%(+1.13)#3,732 |
| 69. | Wellsburg | 1.6% | 0.17%(+1.39)#69 | 0.44%(+1.12)#3,751 |
| 70. | Zearing | 1.6% | 0.17%(+1.39)#70 | 0.44%(+1.12)#3,752 |
| 71. | Miles | 1.5% | 0.17%(+1.36)#71 | 0.44%(+1.09)#3,789 |
| 72. | Lisbon | 1.5% | 0.17%(+1.34)#72 | 0.44%(+1.07)#3,808 |
| 73. | Elliott | 1.5% | 0.17%(+1.33)#73 | 0.44%(+1.06)#3,822 |
| 74. | New Albin | 1.4% | 0.17%(+1.28)#74 | 0.44%(+1.01)#3,888 |
| 75. | Birmingham | 1.4% | 0.17%(+1.25)#75 | 0.44%(+0.983)#3,923 |
| 76. | Preston | 1.4% | 0.17%(+1.23)#76 | 0.44%(+0.965)#3,943 |
| 77. | Fredonia | 1.4% | 0.17%(+1.23)#77 | 0.44%(+0.958)#3,950 |
| 78. | Dakota City | 1.4% | 0.17%(+1.19)#78 | 0.44%(+0.919)#4,009 |
| 79. | Persia | 1.3% | 0.17%(+1.17)#79 | 0.44%(+0.902)#4,027 |
| 80. | Rolfe | 1.3% | 0.17%(+1.17)#80 | 0.44%(+0.899)#4,032 |
| 81. | Osage | 1.3% | 0.17%(+1.17)#81 | 0.44%(+0.896)#4,033 |
| 82. | Fairfax | 1.3% | 0.17%(+1.16)#82 | 0.44%(+0.893)#4,035 |
| 83. | Nashua | 1.3% | 0.17%(+1.14)#83 | 0.44%(+0.872)#4,067 |
| 84. | Elkader | 1.3% | 0.17%(+1.12)#84 | 0.44%(+0.854)#4,096 |
| 85. | Ridgeway | 1.3% | 0.17%(+1.09)#85 | 0.44%(+0.826)#4,130 |
| 86. | Washta | 1.3% | 0.17%(+1.09)#86 | 0.44%(+0.826)#4,131 |
| 87. | Albia | 1.3% | 0.17%(+1.08)#87 | 0.44%(+0.811)#4,156 |
| 88. | Riceville | 1.2% | 0.17%(+1.06)#88 | 0.44%(+0.788)#4,195 |
| 89. | Stratford | 1.2% | 0.17%(+1.03)#89 | 0.44%(+0.761)#4,249 |
| 90. | Hubbard | 1.2% | 0.17%(+1.01)#90 | 0.44%(+0.745)#4,280 |
| 91. | Rockwell | 1.2% | 0.17%(+0.991)#91 | 0.44%(+0.722)#4,299 |
| 92. | Casey | 1.2% | 0.17%(+0.985)#92 | 0.44%(+0.716)#4,312 |
| 93. | Soldier | 1.1% | 0.17%(+0.965)#93 | 0.44%(+0.696)#4,341 |
| 94. | Postville | 1.1% | 0.17%(+0.963)#94 | 0.44%(+0.694)#4,342 |
| 95. | Adel | 1.1% | 0.17%(+0.958)#95 | 0.44%(+0.689)#4,351 |
| 96. | Blakesburg | 1.1% | 0.17%(+0.952)#96 | 0.44%(+0.683)#4,365 |
| 97. | Fairbank | 1.1% | 0.17%(+0.883)#97 | 0.44%(+0.614)#4,467 |
| 98. | North English | 1.0% | 0.17%(+0.862)#98 | 0.44%(+0.593)#4,502 |
| 99. | Wall Lake | 1.0% | 0.17%(+0.849)#99 | 0.44%(+0.580)#4,531 |
| 100. | Gowrie | 1.0% | 0.17%(+0.841)#100 | 0.44%(+0.572)#4,540 |
Common Questions
What are the Top 10 Cities with the Highest Percentage of Population Employed in Mining, Quarrying, & Extraction in Iowa?
Top 10 Cities with the Highest Percentage of Population Employed in Mining, Quarrying, & Extraction in Iowa are:
What city has the Highest Percentage of Population Employed in Mining, Quarrying, & Extraction in Iowa?
Frytown has the Highest Percentage of Population Employed in Mining, Quarrying, & Extraction in Iowa with 51.4%.
What is the Percentage of Population Employed in Mining, Quarrying, & Extraction in the State of Iowa?
Percentage of Population Employed in Mining, Quarrying, & Extraction in Iowa is 0.17%.
What is the Percentage of Population Employed in Mining, Quarrying, & Extraction in the United States?
Percentage of Population Employed in Mining, Quarrying, & Extraction in the United States is 0.44%.