Cities with the Highest Percentage of Population Employed in Mining, Quarrying, & Extraction in Missouri
RELATED REPORTS & OPTIONS
Mining, Quarrying, & Extraction
Missouri
Compare Cities
Map of Cities with the Highest Percentage of Population Employed in Mining, Quarrying, & Extraction in Missouri
0.0%
100.0%
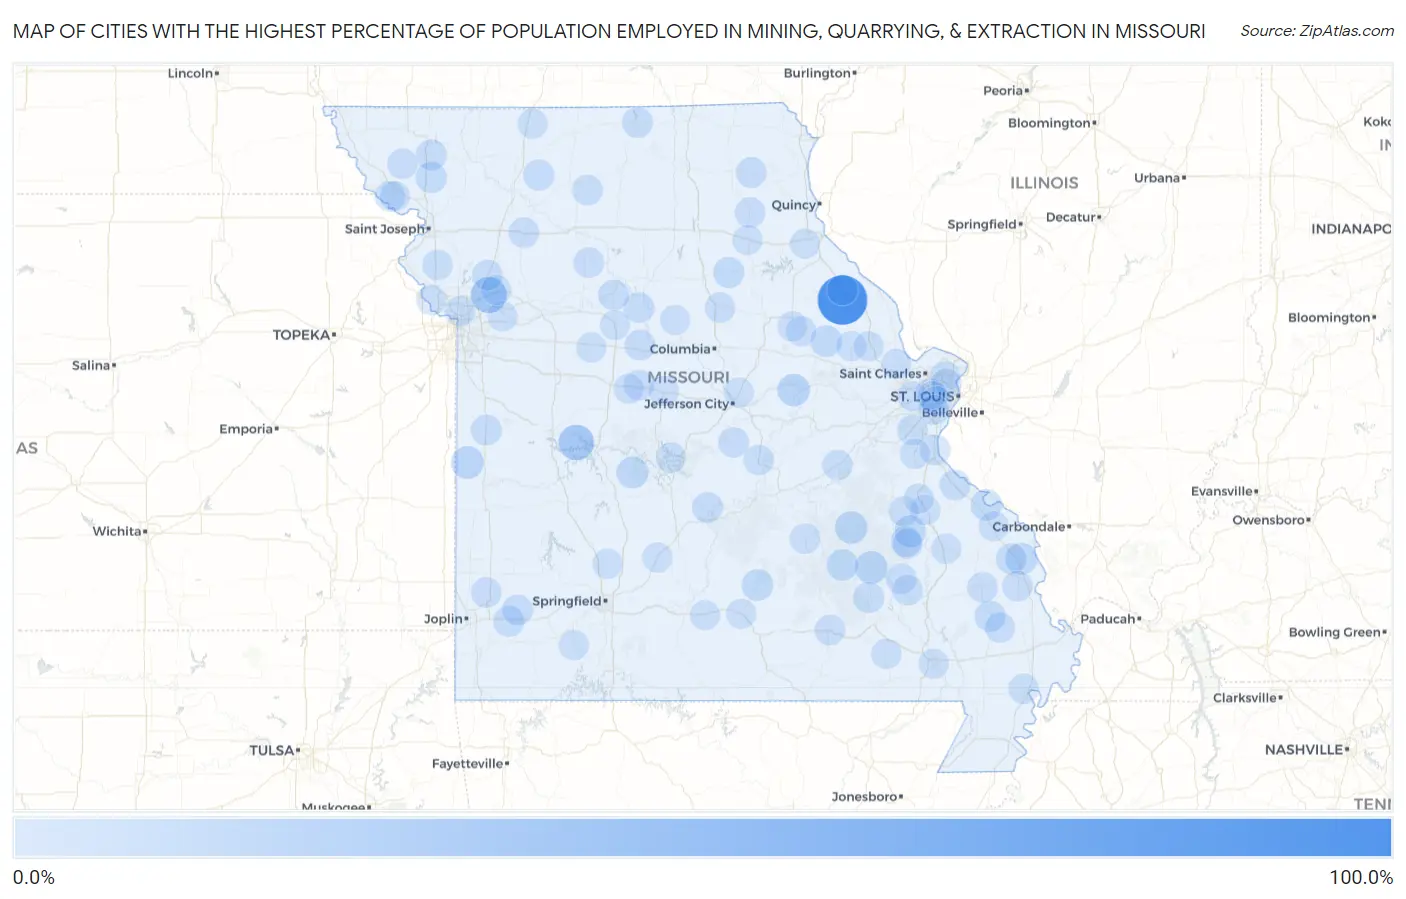
Cities with the Highest Percentage of Population Employed in Mining, Quarrying, & Extraction in Missouri
| City | % Employed | vs State | vs National | |
| 1. | St Clement | 100.0% | 0.18%(+99.8)#1 | 0.44%(+99.6)#1 |
| 2. | Mosby | 29.6% | 0.18%(+29.5)#2 | 0.44%(+29.2)#121 |
| 3. | Tightwad | 26.9% | 0.18%(+26.7)#3 | 0.44%(+26.5)#146 |
| 4. | Centerville | 12.9% | 0.18%(+12.8)#4 | 0.44%(+12.5)#536 |
| 5. | Viburnum | 12.4% | 0.18%(+12.2)#5 | 0.44%(+12.0)#574 |
| 6. | Foster | 12.2% | 0.18%(+12.0)#6 | 0.44%(+11.8)#583 |
| 7. | Morrison | 11.8% | 0.18%(+11.6)#7 | 0.44%(+11.3)#613 |
| 8. | Climax Springs | 9.7% | 0.18%(+9.53)#8 | 0.44%(+9.27)#783 |
| 9. | Pocahontas | 8.7% | 0.18%(+8.52)#9 | 0.44%(+8.26)#907 |
| 10. | Iron Mountain Lake | 8.1% | 0.18%(+7.97)#10 | 0.44%(+7.70)#978 |
| 11. | Houston | 7.5% | 0.18%(+7.32)#11 | 0.44%(+7.06)#1,077 |
| 12. | Bellflower | 7.3% | 0.18%(+7.14)#12 | 0.44%(+6.88)#1,098 |
| 13. | Bunker | 6.6% | 0.18%(+6.43)#13 | 0.44%(+6.17)#1,228 |
| 14. | St Mary | 6.3% | 0.18%(+6.14)#14 | 0.44%(+5.88)#1,285 |
| 15. | Madison | 5.1% | 0.18%(+4.96)#15 | 0.44%(+4.70)#1,569 |
| 16. | Bolckow | 5.1% | 0.18%(+4.95)#16 | 0.44%(+4.69)#1,573 |
| 17. | Advance | 4.9% | 0.18%(+4.68)#17 | 0.44%(+4.42)#1,641 |
| 18. | Gilman City | 4.7% | 0.18%(+4.56)#18 | 0.44%(+4.29)#1,684 |
| 19. | Ellington | 4.5% | 0.18%(+4.34)#19 | 0.44%(+4.07)#1,761 |
| 20. | Arkoe | 4.4% | 0.18%(+4.27)#20 | 0.44%(+4.00)#1,788 |
| 21. | Oak Ridge | 4.0% | 0.18%(+3.82)#21 | 0.44%(+3.56)#1,943 |
| 22. | Sarcoxie | 3.9% | 0.18%(+3.68)#22 | 0.44%(+3.42)#2,009 |
| 23. | Gilliam | 3.8% | 0.18%(+3.62)#23 | 0.44%(+3.36)#2,039 |
| 24. | Blackwater | 3.7% | 0.18%(+3.56)#24 | 0.44%(+3.30)#2,062 |
| 25. | Adrian | 3.7% | 0.18%(+3.55)#25 | 0.44%(+3.28)#2,068 |
| 26. | Unionville | 3.7% | 0.18%(+3.53)#26 | 0.44%(+3.26)#2,074 |
| 27. | La Russell | 3.6% | 0.18%(+3.39)#27 | 0.44%(+3.13)#2,142 |
| 28. | Knox City | 3.4% | 0.18%(+3.27)#28 | 0.44%(+3.01)#2,223 |
| 29. | Pilot Knob | 3.4% | 0.18%(+3.18)#29 | 0.44%(+2.92)#2,270 |
| 30. | Richland | 3.3% | 0.18%(+3.11)#30 | 0.44%(+2.85)#2,310 |
| 31. | Holt | 3.3% | 0.18%(+3.10)#31 | 0.44%(+2.84)#2,327 |
| 32. | Bloomsdale | 3.2% | 0.18%(+3.07)#32 | 0.44%(+2.81)#2,343 |
| 33. | Miami | 3.2% | 0.18%(+3.05)#33 | 0.44%(+2.79)#2,351 |
| 34. | Shakertowne | 3.2% | 0.18%(+3.03)#34 | 0.44%(+2.77)#2,362 |
| 35. | Herculaneum | 3.0% | 0.18%(+2.84)#35 | 0.44%(+2.58)#2,480 |
| 36. | Hamilton | 3.0% | 0.18%(+2.78)#36 | 0.44%(+2.52)#2,510 |
| 37. | Bethel | 2.9% | 0.18%(+2.72)#37 | 0.44%(+2.46)#2,554 |
| 38. | Westwood | 2.8% | 0.18%(+2.58)#38 | 0.44%(+2.32)#2,642 |
| 39. | Raintree Plantation | 2.7% | 0.18%(+2.49)#39 | 0.44%(+2.22)#2,718 |
| 40. | Otterville | 2.6% | 0.18%(+2.47)#40 | 0.44%(+2.21)#2,737 |
| 41. | Annapolis | 2.6% | 0.18%(+2.45)#41 | 0.44%(+2.19)#2,753 |
| 42. | Marble Hill | 2.6% | 0.18%(+2.42)#42 | 0.44%(+2.16)#2,782 |
| 43. | Tina | 2.6% | 0.18%(+2.42)#43 | 0.44%(+2.16)#2,789 |
| 44. | Scotsdale | 2.5% | 0.18%(+2.32)#44 | 0.44%(+2.06)#2,861 |
| 45. | Laredo | 2.5% | 0.18%(+2.32)#45 | 0.44%(+2.06)#2,862 |
| 46. | Forest City | 2.5% | 0.18%(+2.29)#46 | 0.44%(+2.03)#2,882 |
| 47. | Maitland | 2.5% | 0.18%(+2.28)#47 | 0.44%(+2.02)#2,890 |
| 48. | Bowling Green | 2.5% | 0.18%(+2.28)#48 | 0.44%(+2.02)#2,891 |
| 49. | Winona | 2.4% | 0.18%(+2.24)#49 | 0.44%(+1.97)#2,919 |
| 50. | Des Arc | 2.4% | 0.18%(+2.23)#50 | 0.44%(+1.97)#2,928 |
| 51. | Gordonville | 2.3% | 0.18%(+2.15)#51 | 0.44%(+1.89)#2,985 |
| 52. | Carytown | 2.2% | 0.18%(+2.06)#52 | 0.44%(+1.80)#3,056 |
| 53. | Oakview | 2.2% | 0.18%(+2.02)#53 | 0.44%(+1.76)#3,086 |
| 54. | Salem | 2.2% | 0.18%(+2.02)#54 | 0.44%(+1.76)#3,088 |
| 55. | Meta | 2.0% | 0.18%(+1.82)#55 | 0.44%(+1.56)#3,265 |
| 56. | Bourbon | 1.9% | 0.18%(+1.72)#56 | 0.44%(+1.46)#3,362 |
| 57. | Bell City | 1.7% | 0.18%(+1.51)#57 | 0.44%(+1.25)#3,572 |
| 58. | Dearborn | 1.6% | 0.18%(+1.44)#58 | 0.44%(+1.18)#3,668 |
| 59. | Sturgeon | 1.6% | 0.18%(+1.39)#59 | 0.44%(+1.13)#3,737 |
| 60. | Lilbourn | 1.5% | 0.18%(+1.31)#60 | 0.44%(+1.05)#3,839 |
| 61. | Vienna | 1.5% | 0.18%(+1.28)#61 | 0.44%(+1.02)#3,871 |
| 62. | Wellsville | 1.4% | 0.18%(+1.27)#62 | 0.44%(+1.01)#3,894 |
| 63. | Ironton | 1.4% | 0.18%(+1.21)#63 | 0.44%(+0.949)#3,959 |
| 64. | Tipton | 1.4% | 0.18%(+1.19)#64 | 0.44%(+0.930)#3,986 |
| 65. | Grandin | 1.3% | 0.18%(+1.15)#65 | 0.44%(+0.893)#4,039 |
| 66. | Oregon | 1.3% | 0.18%(+1.13)#66 | 0.44%(+0.864)#4,081 |
| 67. | Conway | 1.2% | 0.18%(+0.998)#67 | 0.44%(+0.736)#4,288 |
| 68. | Calverton Park | 1.2% | 0.18%(+0.991)#68 | 0.44%(+0.729)#4,295 |
| 69. | Hawk Point | 1.2% | 0.18%(+0.984)#69 | 0.44%(+0.722)#4,300 |
| 70. | Sibley | 1.2% | 0.18%(+0.978)#70 | 0.44%(+0.716)#4,313 |
| 71. | Leadington | 1.1% | 0.18%(+0.955)#71 | 0.44%(+0.693)#4,346 |
| 72. | Poplar Bluff | 1.1% | 0.18%(+0.943)#72 | 0.44%(+0.681)#4,369 |
| 73. | Irondale | 1.1% | 0.18%(+0.939)#73 | 0.44%(+0.677)#4,377 |
| 74. | Pasadena Hills | 1.1% | 0.18%(+0.919)#74 | 0.44%(+0.657)#4,412 |
| 75. | Fredericktown | 1.0% | 0.18%(+0.845)#75 | 0.44%(+0.583)#4,520 |
| 76. | Fayette | 1.0% | 0.18%(+0.842)#76 | 0.44%(+0.580)#4,527 |
| 77. | Hillsboro | 0.99% | 0.18%(+0.812)#77 | 0.44%(+0.550)#4,584 |
| 78. | St Paul | 0.94% | 0.18%(+0.761)#78 | 0.44%(+0.500)#4,678 |
| 79. | Pleasant Hope | 0.88% | 0.18%(+0.707)#79 | 0.44%(+0.445)#4,770 |
| 80. | Marshall | 0.85% | 0.18%(+0.676)#80 | 0.44%(+0.414)#4,823 |
| 81. | Troy | 0.82% | 0.18%(+0.637)#81 | 0.44%(+0.375)#4,903 |
| 82. | Blythedale | 0.81% | 0.18%(+0.628)#82 | 0.44%(+0.366)#4,930 |
| 83. | Rensselaer | 0.80% | 0.18%(+0.622)#83 | 0.44%(+0.360)#4,940 |
| 84. | Martinsburg | 0.79% | 0.18%(+0.609)#84 | 0.44%(+0.347)#4,955 |
| 85. | Village Of Four Seasons | 0.78% | 0.18%(+0.601)#85 | 0.44%(+0.339)#4,978 |
| 86. | Cabool | 0.77% | 0.18%(+0.594)#86 | 0.44%(+0.332)#4,992 |
| 87. | Crane | 0.75% | 0.18%(+0.572)#87 | 0.44%(+0.310)#5,044 |
| 88. | Smithton | 0.75% | 0.18%(+0.571)#88 | 0.44%(+0.309)#5,049 |
| 89. | Perryville | 0.75% | 0.18%(+0.569)#89 | 0.44%(+0.308)#5,052 |
| 90. | Farley | 0.74% | 0.18%(+0.557)#90 | 0.44%(+0.295)#5,091 |
| 91. | Bonne Terre | 0.73% | 0.18%(+0.554)#91 | 0.44%(+0.292)#5,100 |
| 92. | Sweet Springs | 0.72% | 0.18%(+0.546)#92 | 0.44%(+0.284)#5,124 |
| 93. | Clarkson Valley | 0.71% | 0.18%(+0.529)#93 | 0.44%(+0.267)#5,180 |
| 94. | Shelbina | 0.71% | 0.18%(+0.528)#94 | 0.44%(+0.266)#5,184 |
| 95. | Norwood | 0.67% | 0.18%(+0.495)#95 | 0.44%(+0.233)#5,271 |
| 96. | Frontenac | 0.66% | 0.18%(+0.478)#96 | 0.44%(+0.216)#5,309 |
| 97. | Glendale | 0.65% | 0.18%(+0.474)#97 | 0.44%(+0.213)#5,315 |
| 98. | Excelsior Springs | 0.65% | 0.18%(+0.468)#98 | 0.44%(+0.207)#5,338 |
| 99. | Sunset Hills | 0.64% | 0.18%(+0.457)#99 | 0.44%(+0.195)#5,373 |
| 100. | Holts Summit | 0.63% | 0.18%(+0.449)#100 | 0.44%(+0.188)#5,397 |
Common Questions
What are the Top 10 Cities with the Highest Percentage of Population Employed in Mining, Quarrying, & Extraction in Missouri?
Top 10 Cities with the Highest Percentage of Population Employed in Mining, Quarrying, & Extraction in Missouri are:
#1
100.0%
#2
29.6%
#3
26.9%
#4
12.9%
#5
12.4%
#6
12.2%
#7
11.8%
#8
9.7%
#9
8.7%
#10
8.1%
What city has the Highest Percentage of Population Employed in Mining, Quarrying, & Extraction in Missouri?
St Clement has the Highest Percentage of Population Employed in Mining, Quarrying, & Extraction in Missouri with 100.0%.
What is the Percentage of Population Employed in Mining, Quarrying, & Extraction in the State of Missouri?
Percentage of Population Employed in Mining, Quarrying, & Extraction in Missouri is 0.18%.
What is the Percentage of Population Employed in Mining, Quarrying, & Extraction in the United States?
Percentage of Population Employed in Mining, Quarrying, & Extraction in the United States is 0.44%.