Zip Codes with the Highest Percentage of Population with a Degree in Social Sciences in Indiana
RELATED REPORTS & OPTIONS
Social Sciences
Indiana
Compare Zip Codes
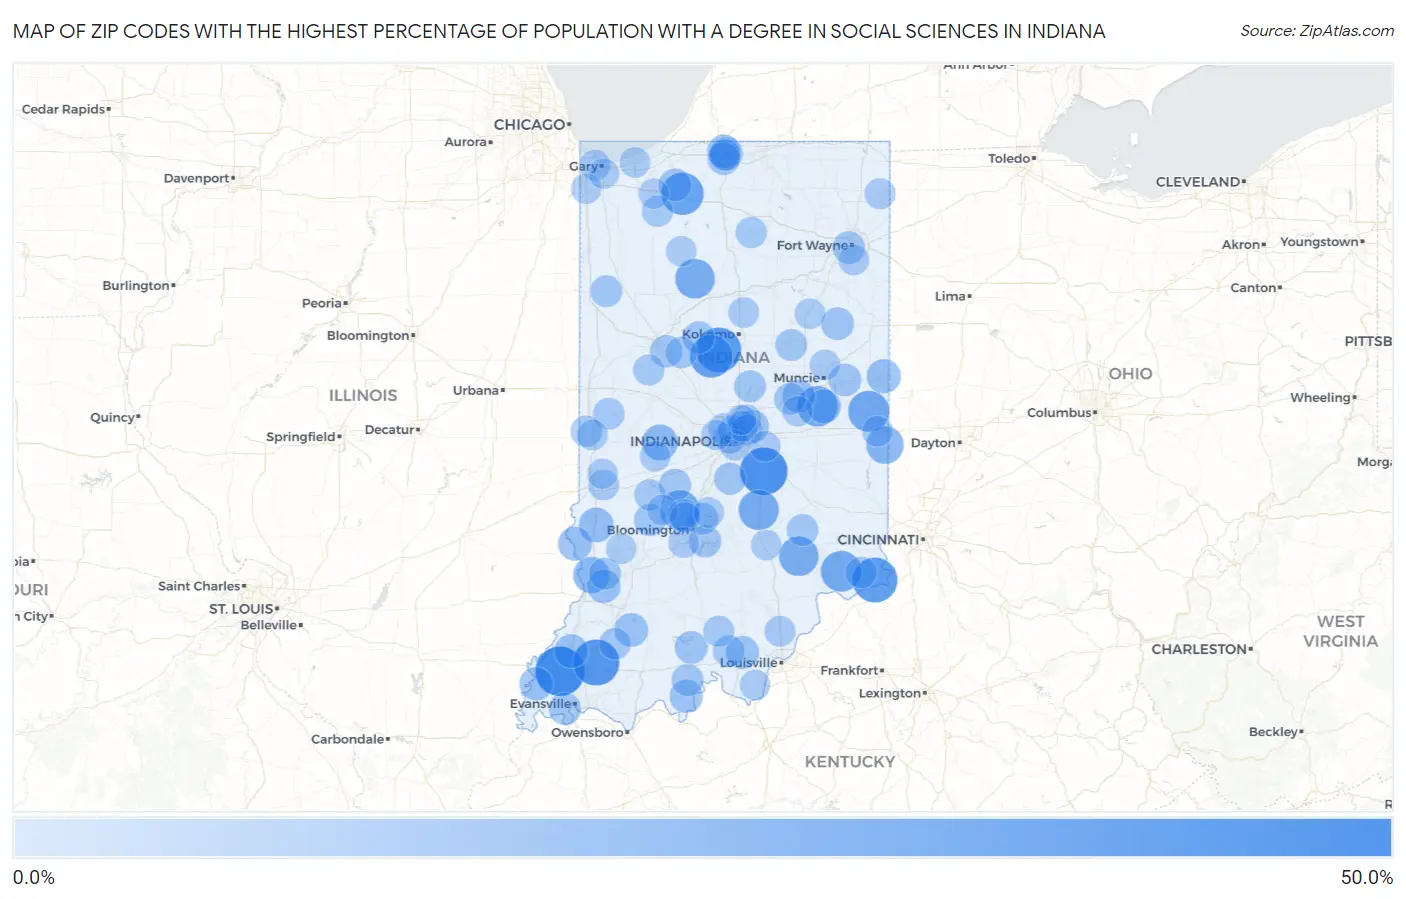
Map of Zip Codes with the Highest Percentage of Population with a Degree in Social Sciences in Indiana
0.0%
50.0%
Zip Codes with the Highest Percentage of Population with a Degree in Social Sciences in Indiana
| Zip Code | % Graduates | vs State | vs National | |
| 1. | 47612 | 46.9% | 5.4%(+41.5)#1 | 8.1%(+38.9)#185 |
| 2. | 46110 | 42.9% | 5.4%(+37.4)#2 | 8.1%(+34.8)#214 |
| 3. | 47654 | 40.0% | 5.4%(+34.6)#3 | 8.1%(+31.9)#251 |
| 4. | 47020 | 37.3% | 5.4%(+31.9)#4 | 8.1%(+29.2)#272 |
| 5. | 46039 | 37.2% | 5.4%(+31.8)#5 | 8.1%(+29.1)#274 |
| 6. | 46057 | 33.0% | 5.4%(+27.6)#6 | 8.1%(+25.0)#366 |
| 7. | 46532 | 32.0% | 5.4%(+26.6)#7 | 8.1%(+24.0)#382 |
| 8. | 47393 | 29.5% | 5.4%(+24.0)#8 | 8.1%(+21.4)#444 |
| 9. | 47224 | 28.8% | 5.4%(+23.3)#9 | 8.1%(+20.7)#466 |
| 10. | 47388 | 28.2% | 5.4%(+22.8)#10 | 8.1%(+20.1)#487 |
| 11. | 47280 | 27.6% | 5.4%(+22.2)#11 | 8.1%(+19.5)#506 |
| 12. | 47464 | 26.4% | 5.4%(+21.0)#12 | 8.1%(+18.3)#569 |
| 13. | 46978 | 26.4% | 5.4%(+21.0)#13 | 8.1%(+18.3)#570 |
| 14. | 47282 | 26.3% | 5.4%(+20.9)#14 | 8.1%(+18.2)#576 |
| 15. | 47324 | 22.2% | 5.4%(+16.8)#15 | 8.1%(+14.2)#801 |
| 16. | 47561 | 19.8% | 5.4%(+14.3)#16 | 8.1%(+11.7)#993 |
| 17. | 46105 | 19.0% | 5.4%(+13.6)#17 | 8.1%(+11.0)#1,078 |
| 18. | 47879 | 16.8% | 5.4%(+11.3)#18 | 8.1%(+8.71)#1,444 |
| 19. | 47361 | 15.5% | 5.4%(+10.1)#19 | 8.1%(+7.45)#1,797 |
| 20. | 47390 | 15.5% | 5.4%(+10.0)#20 | 8.1%(+7.41)#1,805 |
| 21. | 47861 | 14.9% | 5.4%(+9.48)#21 | 8.1%(+6.85)#1,984 |
| 22. | 47564 | 14.9% | 5.4%(+9.45)#22 | 8.1%(+6.82)#1,995 |
| 23. | 47670 | 14.6% | 5.4%(+9.12)#23 | 8.1%(+6.50)#2,116 |
| 24. | 47512 | 14.2% | 5.4%(+8.73)#24 | 8.1%(+6.11)#2,275 |
| 25. | 47631 | 14.0% | 5.4%(+8.59)#25 | 8.1%(+5.97)#2,335 |
| 26. | 46617 | 13.8% | 5.4%(+8.38)#26 | 8.1%(+5.76)#2,412 |
| 27. | 46616 | 13.8% | 5.4%(+8.37)#27 | 8.1%(+5.75)#2,418 |
| 28. | 47161 | 13.5% | 5.4%(+8.06)#28 | 8.1%(+5.44)#2,596 |
| 29. | 47520 | 13.4% | 5.4%(+7.99)#29 | 8.1%(+5.37)#2,618 |
| 30. | 46017 | 13.1% | 5.4%(+7.62)#30 | 8.1%(+5.00)#2,796 |
| 31. | 47175 | 12.9% | 5.4%(+7.46)#31 | 8.1%(+4.83)#2,881 |
| 32. | 46216 | 12.8% | 5.4%(+7.31)#32 | 8.1%(+4.69)#2,970 |
| 33. | 47359 | 12.7% | 5.4%(+7.27)#33 | 8.1%(+4.65)#2,993 |
| 34. | 47368 | 12.5% | 5.4%(+7.05)#34 | 8.1%(+4.43)#3,121 |
| 35. | 46346 | 12.5% | 5.4%(+7.05)#35 | 8.1%(+4.43)#3,125 |
| 36. | 46613 | 12.1% | 5.4%(+6.70)#36 | 8.1%(+4.07)#3,393 |
| 37. | 47941 | 12.0% | 5.4%(+6.55)#37 | 8.1%(+3.93)#3,504 |
| 38. | 47401 | 12.0% | 5.4%(+6.51)#38 | 8.1%(+3.88)#3,531 |
| 39. | 47456 | 11.8% | 5.4%(+6.37)#39 | 8.1%(+3.75)#3,646 |
| 40. | 46802 | 11.8% | 5.4%(+6.33)#40 | 8.1%(+3.71)#3,676 |
| 41. | 47712 | 11.8% | 5.4%(+6.31)#41 | 8.1%(+3.69)#3,696 |
| 42. | 46920 | 11.6% | 5.4%(+6.16)#42 | 8.1%(+3.54)#3,820 |
| 43. | 46106 | 11.4% | 5.4%(+5.95)#43 | 8.1%(+3.33)#4,000 |
| 44. | 47551 | 11.3% | 5.4%(+5.89)#44 | 8.1%(+3.27)#4,046 |
| 45. | 47431 | 11.2% | 5.4%(+5.75)#45 | 8.1%(+3.13)#4,171 |
| 46. | 46034 | 11.0% | 5.4%(+5.57)#46 | 8.1%(+2.95)#4,358 |
| 47. | 46928 | 10.9% | 5.4%(+5.44)#47 | 8.1%(+2.82)#4,476 |
| 48. | 47283 | 10.9% | 5.4%(+5.44)#48 | 8.1%(+2.81)#4,483 |
| 49. | 47535 | 10.9% | 5.4%(+5.42)#49 | 8.1%(+2.80)#4,507 |
| 50. | 46013 | 10.9% | 5.4%(+5.42)#50 | 8.1%(+2.80)#4,513 |
| 51. | 47948 | 10.8% | 5.4%(+5.39)#51 | 8.1%(+2.76)#4,552 |
| 52. | 47408 | 10.8% | 5.4%(+5.34)#52 | 8.1%(+2.72)#4,598 |
| 53. | 46222 | 10.7% | 5.4%(+5.30)#53 | 8.1%(+2.68)#4,639 |
| 54. | 47429 | 10.7% | 5.4%(+5.30)#54 | 8.1%(+2.68)#4,640 |
| 55. | 47598 | 10.6% | 5.4%(+5.15)#55 | 8.1%(+2.53)#4,808 |
| 56. | 46058 | 10.5% | 5.4%(+5.02)#56 | 8.1%(+2.40)#4,967 |
| 57. | 47952 | 10.5% | 5.4%(+5.02)#57 | 8.1%(+2.39)#4,979 |
| 58. | 46601 | 10.4% | 5.4%(+4.91)#58 | 8.1%(+2.29)#5,107 |
| 59. | 47115 | 10.4% | 5.4%(+4.91)#59 | 8.1%(+2.29)#5,114 |
| 60. | 47011 | 10.2% | 5.4%(+4.74)#60 | 8.1%(+2.11)#5,325 |
| 61. | 47868 | 10.1% | 5.4%(+4.68)#61 | 8.1%(+2.06)#5,391 |
| 62. | 47847 | 9.8% | 5.4%(+4.39)#62 | 8.1%(+1.76)#5,770 |
| 63. | 47981 | 9.7% | 5.4%(+4.29)#63 | 8.1%(+1.67)#5,883 |
| 64. | 46348 | 9.7% | 5.4%(+4.27)#64 | 8.1%(+1.65)#5,911 |
| 65. | 46539 | 9.4% | 5.4%(+3.99)#65 | 8.1%(+1.37)#6,288 |
| 66. | 46208 | 9.4% | 5.4%(+3.94)#66 | 8.1%(+1.32)#6,373 |
| 67. | 47125 | 9.3% | 5.4%(+3.87)#67 | 8.1%(+1.25)#6,469 |
| 68. | 46721 | 9.1% | 5.4%(+3.64)#68 | 8.1%(+1.02)#6,785 |
| 69. | 46250 | 9.0% | 5.4%(+3.51)#69 | 8.1%(+0.884)#7,030 |
| 70. | 46254 | 8.9% | 5.4%(+3.49)#70 | 8.1%(+0.867)#7,058 |
| 71. | 47854 | 8.9% | 5.4%(+3.47)#71 | 8.1%(+0.849)#7,084 |
| 72. | 47143 | 8.9% | 5.4%(+3.44)#72 | 8.1%(+0.818)#7,136 |
| 73. | 46226 | 8.9% | 5.4%(+3.43)#73 | 8.1%(+0.803)#7,158 |
| 74. | 46163 | 8.8% | 5.4%(+3.33)#74 | 8.1%(+0.709)#7,305 |
| 75. | 46225 | 8.8% | 5.4%(+3.31)#75 | 8.1%(+0.691)#7,329 |
| 76. | 46220 | 8.7% | 5.4%(+3.29)#76 | 8.1%(+0.668)#7,363 |
| 77. | 47403 | 8.7% | 5.4%(+3.28)#77 | 8.1%(+0.654)#7,383 |
| 78. | 46406 | 8.7% | 5.4%(+3.22)#78 | 8.1%(+0.594)#7,493 |
| 79. | 47303 | 8.7% | 5.4%(+3.20)#79 | 8.1%(+0.582)#7,511 |
| 80. | 47460 | 8.6% | 5.4%(+3.17)#80 | 8.1%(+0.546)#7,577 |
| 81. | 46135 | 8.6% | 5.4%(+3.14)#81 | 8.1%(+0.519)#7,632 |
| 82. | 46819 | 8.6% | 5.4%(+3.14)#82 | 8.1%(+0.519)#7,635 |
| 83. | 47374 | 8.6% | 5.4%(+3.13)#83 | 8.1%(+0.511)#7,652 |
| 84. | 47803 | 8.6% | 5.4%(+3.12)#84 | 8.1%(+0.500)#7,666 |
| 85. | 46914 | 8.5% | 5.4%(+3.03)#85 | 8.1%(+0.412)#7,836 |
| 86. | 47404 | 8.5% | 5.4%(+3.01)#86 | 8.1%(+0.388)#7,889 |
| 87. | 47468 | 8.5% | 5.4%(+3.01)#87 | 8.1%(+0.386)#7,892 |
| 88. | 46991 | 8.4% | 5.4%(+2.93)#88 | 8.1%(+0.309)#8,033 |
| 89. | 46304 | 8.4% | 5.4%(+2.93)#89 | 8.1%(+0.309)#8,034 |
| 90. | 47247 | 8.3% | 5.4%(+2.89)#90 | 8.1%(+0.262)#8,132 |
| 91. | 47441 | 8.3% | 5.4%(+2.82)#91 | 8.1%(+0.201)#8,221 |
| 92. | 46390 | 8.3% | 5.4%(+2.81)#92 | 8.1%(+0.190)#8,249 |
| 93. | 47117 | 8.2% | 5.4%(+2.79)#93 | 8.1%(+0.166)#8,295 |
| 94. | 46996 | 8.2% | 5.4%(+2.73)#94 | 8.1%(+0.103)#8,408 |
| 95. | 46056 | 8.1% | 5.4%(+2.67)#95 | 8.1%(+0.044)#8,518 |
| 96. | 46373 | 8.1% | 5.4%(+2.63)#96 | 8.1%(+0.004)#8,594 |
| 97. | 46409 | 8.1% | 5.4%(+2.61)#97 | 8.1%(-0.017)#8,635 |
| 98. | 46240 | 8.0% | 5.4%(+2.57)#98 | 8.1%(-0.049)#8,700 |
| 99. | 46234 | 8.0% | 5.4%(+2.57)#99 | 8.1%(-0.055)#8,713 |
| 100. | 47805 | 8.0% | 5.4%(+2.57)#100 | 8.1%(-0.057)#8,718 |
Common Questions
What are the Top 10 Zip Codes with the Highest Percentage of Population with a Degree in Social Sciences in Indiana?
Top 10 Zip Codes with the Highest Percentage of Population with a Degree in Social Sciences in Indiana are:
What zip code has the Highest Percentage of Population with a Degree in Social Sciences in Indiana?
47612 has the Highest Percentage of Population with a Degree in Social Sciences in Indiana with 46.9%.
What is the Percentage of Population with a Degree in Social Sciences in the State of Indiana?
Percentage of Population with a Degree in Social Sciences in Indiana is 5.4%.
What is the Percentage of Population with a Degree in Social Sciences in the United States?
Percentage of Population with a Degree in Social Sciences in the United States is 8.1%.