Van Bibber Lake, IN Map & Demographics
Van Bibber Lake Map
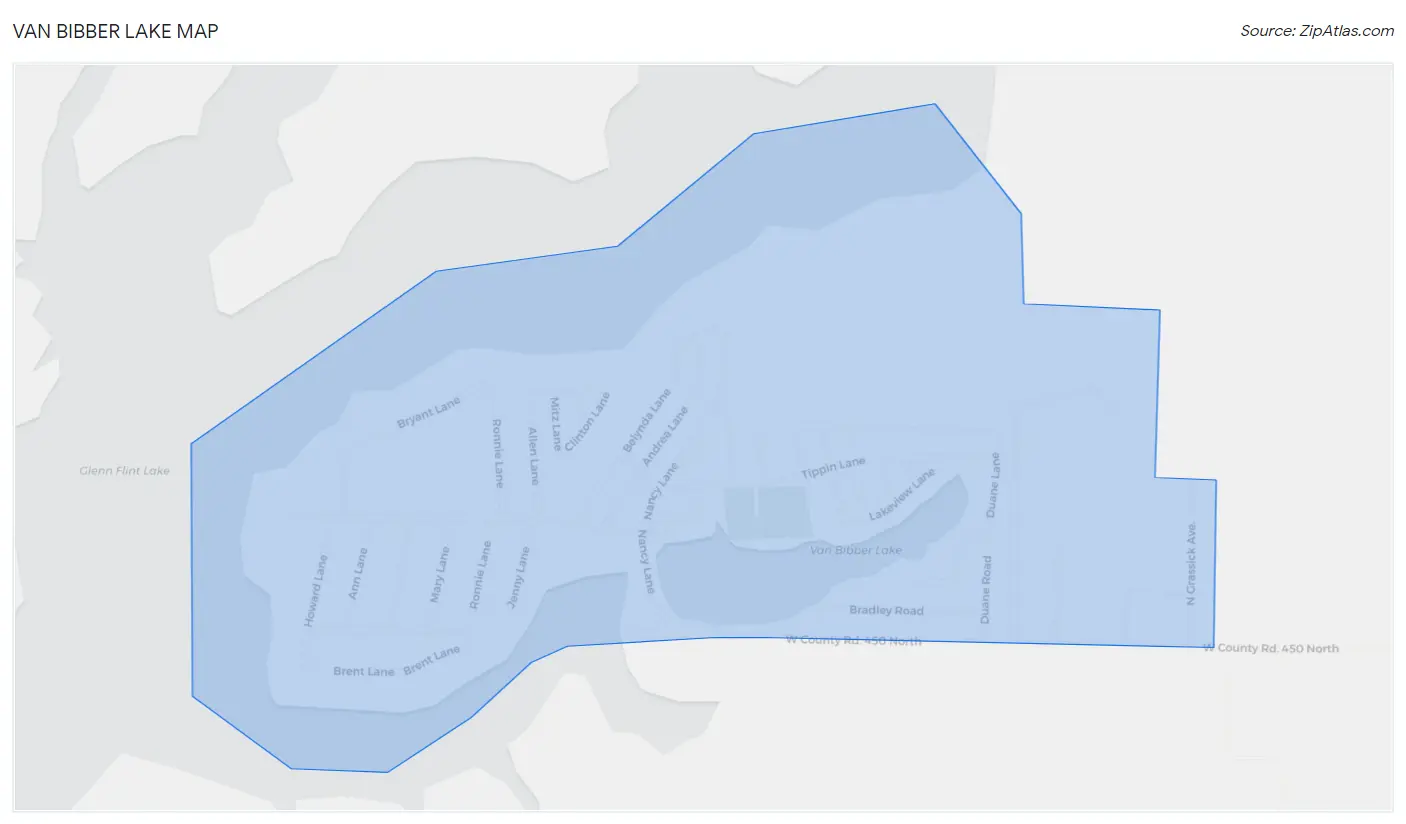
Van Bibber Lake Overview
$21,144
PER CAPITA INCOME
$32,255
AVG FAMILY INCOME
$33,056
AVG HOUSEHOLD INCOME
36.8%
WAGE / INCOME GAP [ % ]
63.2¢/ $1
WAGE / INCOME GAP [ $ ]
0.40
INEQUALITY / GINI INDEX
429
TOTAL POPULATION
276
MALE POPULATION
153
FEMALE POPULATION
180.39
MALES / 100 FEMALES
55.43
FEMALES / 100 MALES
34.8
MEDIAN AGE
2.2
AVG FAMILY SIZE
2.1
AVG HOUSEHOLD SIZE
194
LABOR FORCE [ PEOPLE ]
53.7%
PERCENT IN LABOR FORCE
Income in Van Bibber Lake
Income Overview in Van Bibber Lake
Per Capita Income in Van Bibber Lake is $21,144, while median incomes of families and households are $32,255 and $33,056 respectively.
| Characteristic | Number | Measure |
| Per Capita Income | 429 | $21,144 |
| Median Family Income | 129 | $32,255 |
| Mean Family Income | 129 | $54,030 |
| Median Household Income | 208 | $33,056 |
| Mean Household Income | 208 | $45,325 |
| Income Deficit | 129 | $0 |
| Wage / Income Gap (%) | 429 | 36.76% |
| Wage / Income Gap ($) | 429 | 63.24¢ per $1 |
| Gini / Inequality Index | 429 | 0.40 |
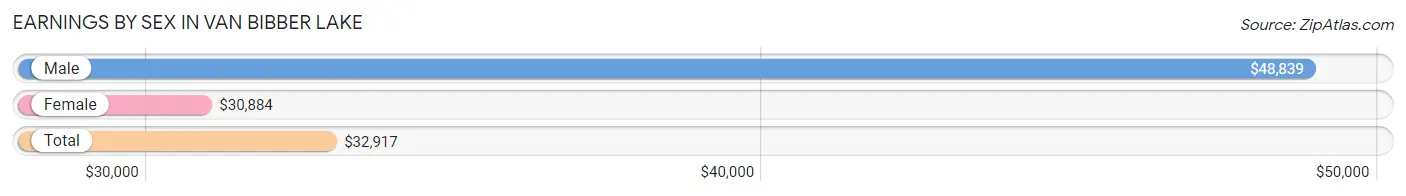
Earnings by Sex in Van Bibber Lake
Average Earnings in Van Bibber Lake are $32,917, $48,839 for men and $30,884 for women, a difference of 36.8%.
| Sex | Number | Average Earnings |
| Male | 87 (44.9%) | $48,839 |
| Female | 107 (55.1%) | $30,884 |
| Total | 194 (100.0%) | $32,917 |
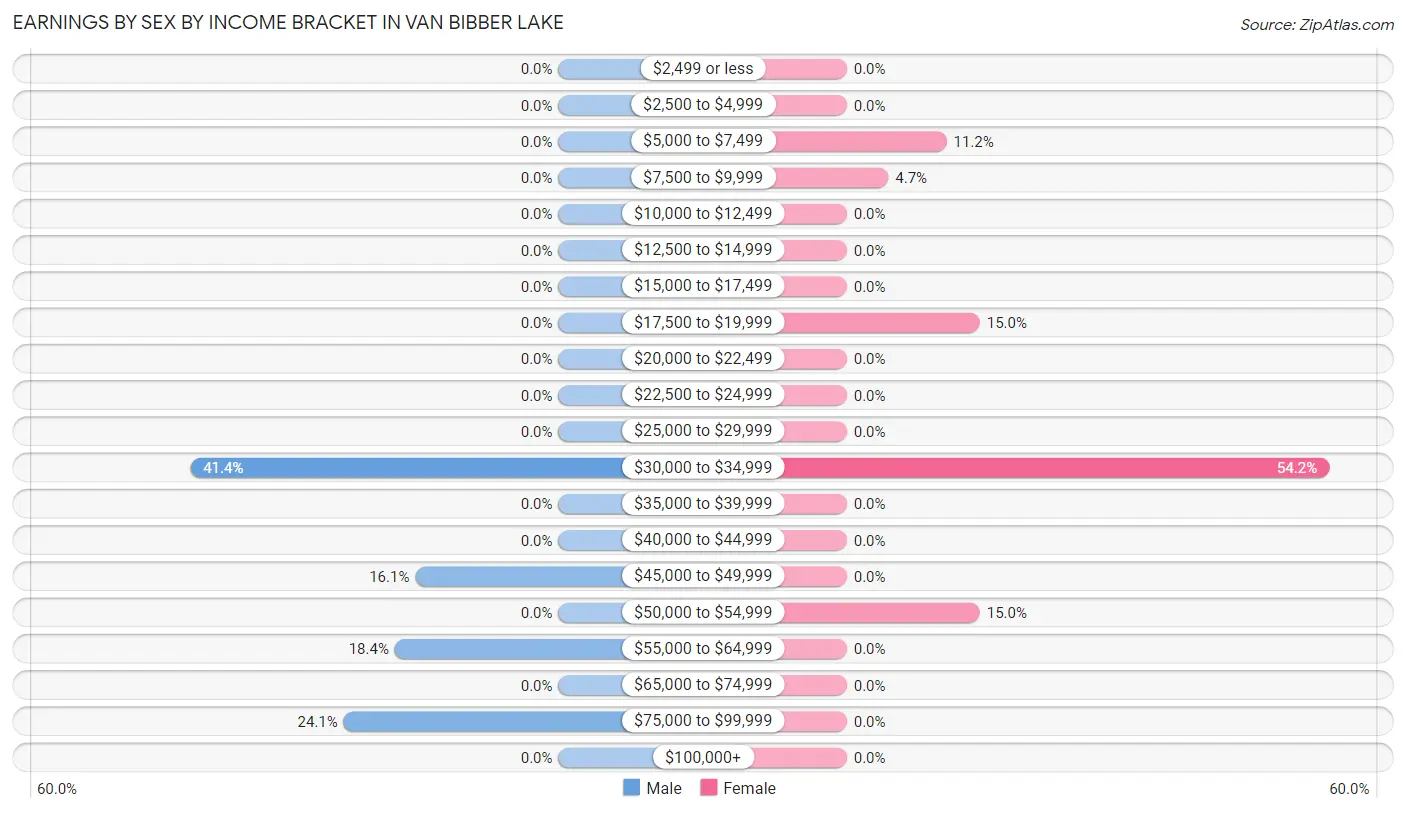
Earnings by Sex by Income Bracket in Van Bibber Lake
The most common earnings brackets in Van Bibber Lake are $30,000 to $34,999 for men (36 | 41.4%) and $30,000 to $34,999 for women (58 | 54.2%).
| Income | Male | Female |
| $2,499 or less | 0 (0.0%) | 0 (0.0%) |
| $2,500 to $4,999 | 0 (0.0%) | 0 (0.0%) |
| $5,000 to $7,499 | 0 (0.0%) | 12 (11.2%) |
| $7,500 to $9,999 | 0 (0.0%) | 5 (4.7%) |
| $10,000 to $12,499 | 0 (0.0%) | 0 (0.0%) |
| $12,500 to $14,999 | 0 (0.0%) | 0 (0.0%) |
| $15,000 to $17,499 | 0 (0.0%) | 0 (0.0%) |
| $17,500 to $19,999 | 0 (0.0%) | 16 (14.9%) |
| $20,000 to $22,499 | 0 (0.0%) | 0 (0.0%) |
| $22,500 to $24,999 | 0 (0.0%) | 0 (0.0%) |
| $25,000 to $29,999 | 0 (0.0%) | 0 (0.0%) |
| $30,000 to $34,999 | 36 (41.4%) | 58 (54.2%) |
| $35,000 to $39,999 | 0 (0.0%) | 0 (0.0%) |
| $40,000 to $44,999 | 0 (0.0%) | 0 (0.0%) |
| $45,000 to $49,999 | 14 (16.1%) | 0 (0.0%) |
| $50,000 to $54,999 | 0 (0.0%) | 16 (14.9%) |
| $55,000 to $64,999 | 16 (18.4%) | 0 (0.0%) |
| $65,000 to $74,999 | 0 (0.0%) | 0 (0.0%) |
| $75,000 to $99,999 | 21 (24.1%) | 0 (0.0%) |
| $100,000+ | 0 (0.0%) | 0 (0.0%) |
| Total | 87 (100.0%) | 107 (100.0%) |
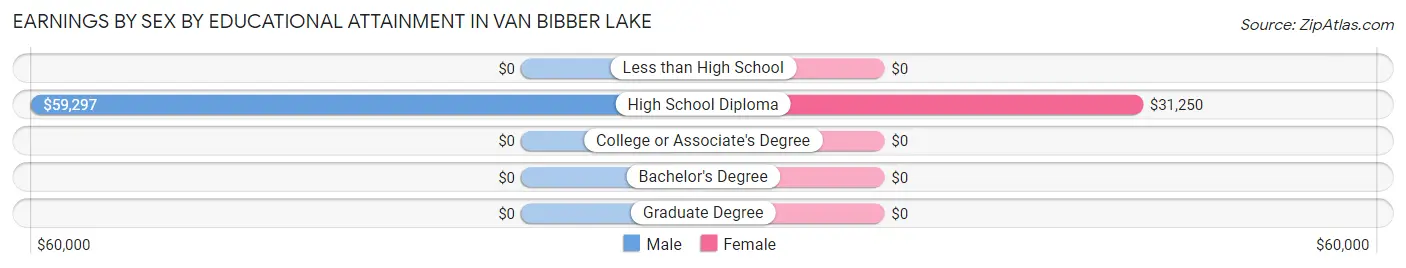
Earnings by Sex by Educational Attainment in Van Bibber Lake
Average earnings in Van Bibber Lake are $48,839 for men and $30,884 for women, a difference of 36.8%. Men with an educational attainment of high school diploma enjoy the highest average annual earnings of $59,297, while those with high school diploma education earn the least with $59,297. Women with an educational attainment of high school diploma earn the most with the average annual earnings of $31,250, while those with high school diploma education have the smallest earnings of $31,250.
| Educational Attainment | Male Income | Female Income |
| Less than High School | - | - |
| High School Diploma | $59,297 | $31,250 |
| College or Associate's Degree | - | - |
| Bachelor's Degree | - | - |
| Graduate Degree | - | - |
| Total | $48,839 | $30,884 |
Family Income in Van Bibber Lake
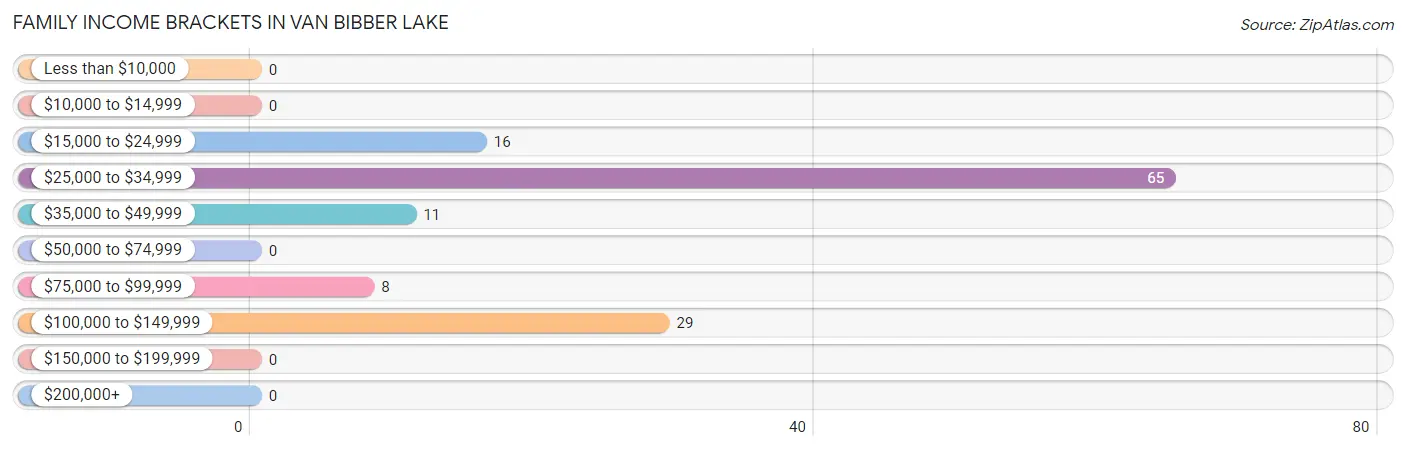
Family Income Brackets in Van Bibber Lake
According to the Van Bibber Lake family income data, there are 65 families falling into the $25,000 to $34,999 income range, which is the most common income bracket and makes up 50.4% of all families.
| Income Bracket | # Families | % Families |
| Less than $10,000 | 0 | 0.0% |
| $10,000 to $14,999 | 0 | 0.0% |
| $15,000 to $24,999 | 16 | 12.4% |
| $25,000 to $34,999 | 65 | 50.4% |
| $35,000 to $49,999 | 11 | 8.5% |
| $50,000 to $74,999 | 0 | 0.0% |
| $75,000 to $99,999 | 8 | 6.2% |
| $100,000 to $149,999 | 29 | 22.5% |
| $150,000 to $199,999 | 0 | 0.0% |
| $200,000+ | 0 | 0.0% |
Family Income by Famaliy Size in Van Bibber Lake
| Income Bracket | # Families | Median Income |
| 2-Person Families | 83 (64.3%) | $0 |
| 3-Person Families | 0 (0.0%) | $0 |
| 4-Person Families | 46 (35.7%) | $0 |
| 5-Person Families | 0 (0.0%) | $0 |
| 6-Person Families | 0 (0.0%) | $0 |
| 7+ Person Families | 0 (0.0%) | $0 |
| Total | 129 (100.0%) | $32,255 |
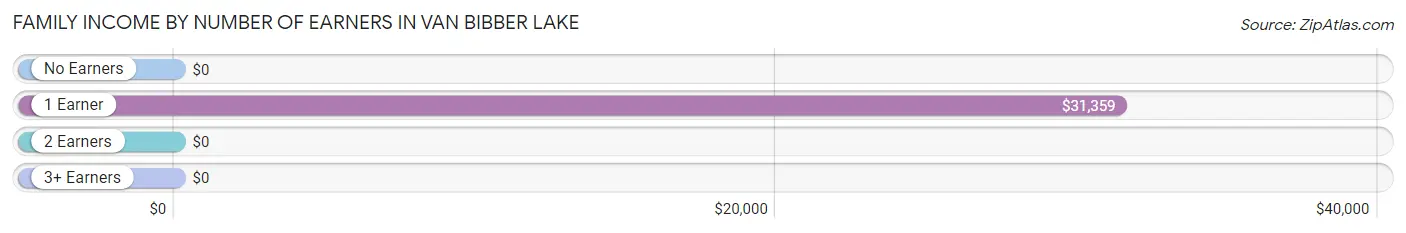
Family Income by Number of Earners in Van Bibber Lake
| Number of Earners | # Families | Median Income |
| No Earners | 18 (14.0%) | $0 |
| 1 Earner | 82 (63.6%) | $31,359 |
| 2 Earners | 29 (22.5%) | $0 |
| 3+ Earners | 0 (0.0%) | $0 |
| Total | 129 (100.0%) | $32,255 |
Household Income in Van Bibber Lake
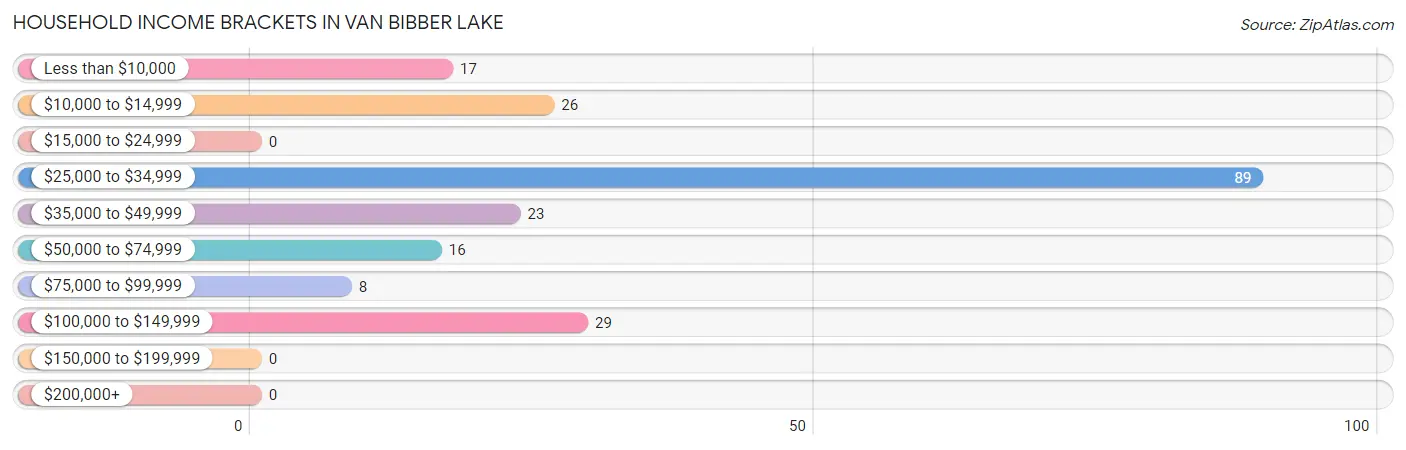
Household Income Brackets in Van Bibber Lake
With 89 households falling in the category, the $25,000 to $34,999 income range is the most frequent in Van Bibber Lake, accounting for 42.8% of all households.
| Income Bracket | # Households | % Households |
| Less than $10,000 | 17 | 8.2% |
| $10,000 to $14,999 | 26 | 12.5% |
| $15,000 to $24,999 | 0 | 0.0% |
| $25,000 to $34,999 | 89 | 42.8% |
| $35,000 to $49,999 | 23 | 11.1% |
| $50,000 to $74,999 | 16 | 7.7% |
| $75,000 to $99,999 | 8 | 3.8% |
| $100,000 to $149,999 | 29 | 13.9% |
| $150,000 to $199,999 | 0 | 0.0% |
| $200,000+ | 0 | 0.0% |
Household Income by Householder Age in Van Bibber Lake
The median household income in Van Bibber Lake is $33,056, with the highest median household income of $32,391 found in the 25 to 44 years age bracket for the primary householder. A total of 108 households (51.9%) fall into this category.
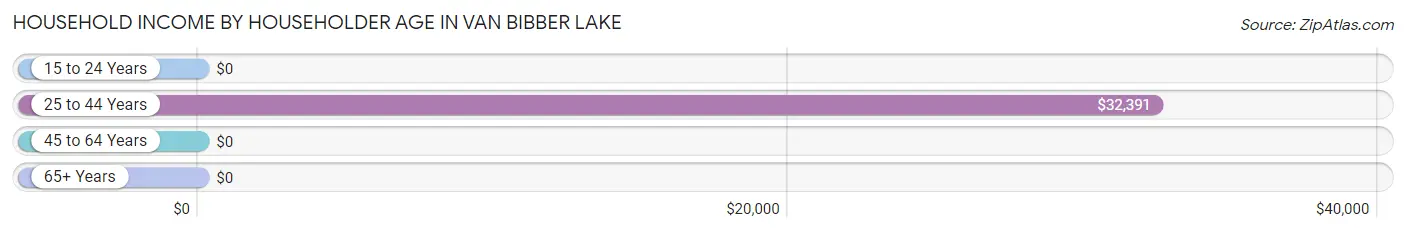
| Income Bracket | # Households | Median Income |
| 15 to 24 Years | 0 (0.0%) | $0 |
| 25 to 44 Years | 108 (51.9%) | $32,391 |
| 45 to 64 Years | 62 (29.8%) | $0 |
| 65+ Years | 38 (18.3%) | $0 |
| Total | 208 (100.0%) | $33,056 |
Poverty in Van Bibber Lake
Income Below Poverty by Sex and Age in Van Bibber Lake
With 39.5% poverty level for males and 13.7% for females among the residents of Van Bibber Lake, 15 year old males and 35 to 44 year old females are the most vulnerable to poverty, with 14 males (100.0%) and 16 females (100.0%) in their respective age groups living below the poverty level.
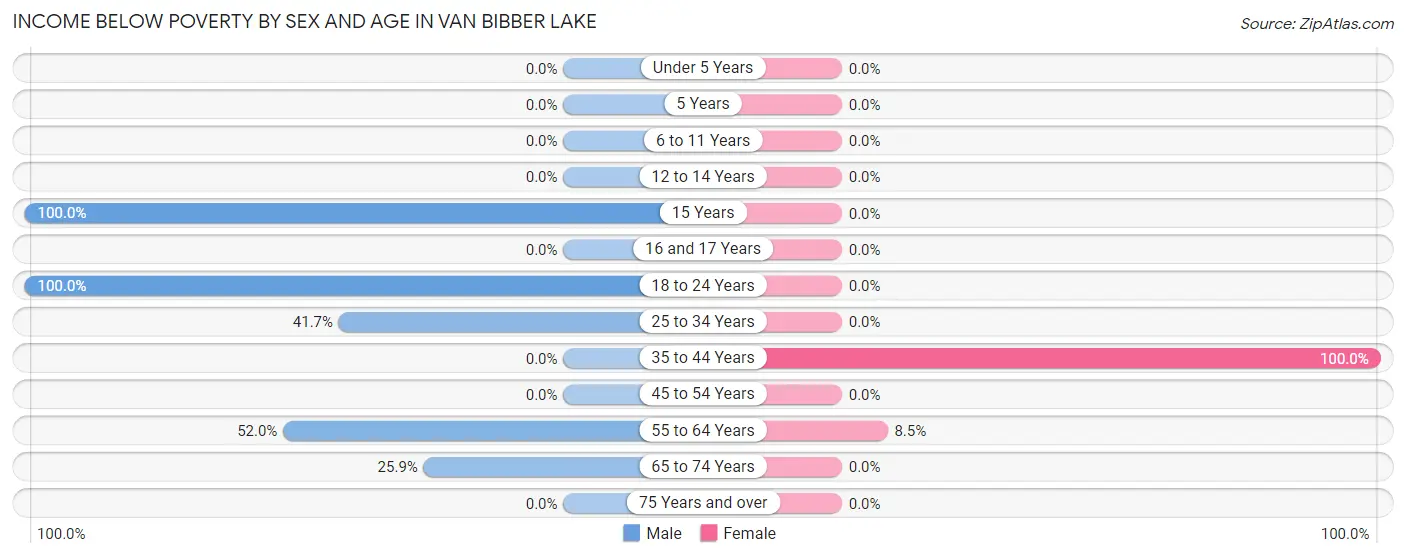
| Age Bracket | Male | Female |
| Under 5 Years | 0 (0.0%) | 0 (0.0%) |
| 5 Years | 0 (0.0%) | 0 (0.0%) |
| 6 to 11 Years | 0 (0.0%) | 0 (0.0%) |
| 12 to 14 Years | 0 (0.0%) | 0 (0.0%) |
| 15 Years | 14 (100.0%) | 0 (0.0%) |
| 16 and 17 Years | 0 (0.0%) | 0 (0.0%) |
| 18 to 24 Years | 52 (100.0%) | 0 (0.0%) |
| 25 to 34 Years | 10 (41.7%) | 0 (0.0%) |
| 35 to 44 Years | 0 (0.0%) | 16 (100.0%) |
| 45 to 54 Years | 0 (0.0%) | 0 (0.0%) |
| 55 to 64 Years | 26 (52.0%) | 5 (8.5%) |
| 65 to 74 Years | 7 (25.9%) | 0 (0.0%) |
| 75 Years and over | 0 (0.0%) | 0 (0.0%) |
| Total | 109 (39.5%) | 21 (13.7%) |
Income Above Poverty by Sex and Age in Van Bibber Lake
According to the poverty statistics in Van Bibber Lake, males aged under 5 years and females aged 16 and 17 years are the age groups that are most secure financially, with 100.0% of males and 100.0% of females in these age groups living above the poverty line.
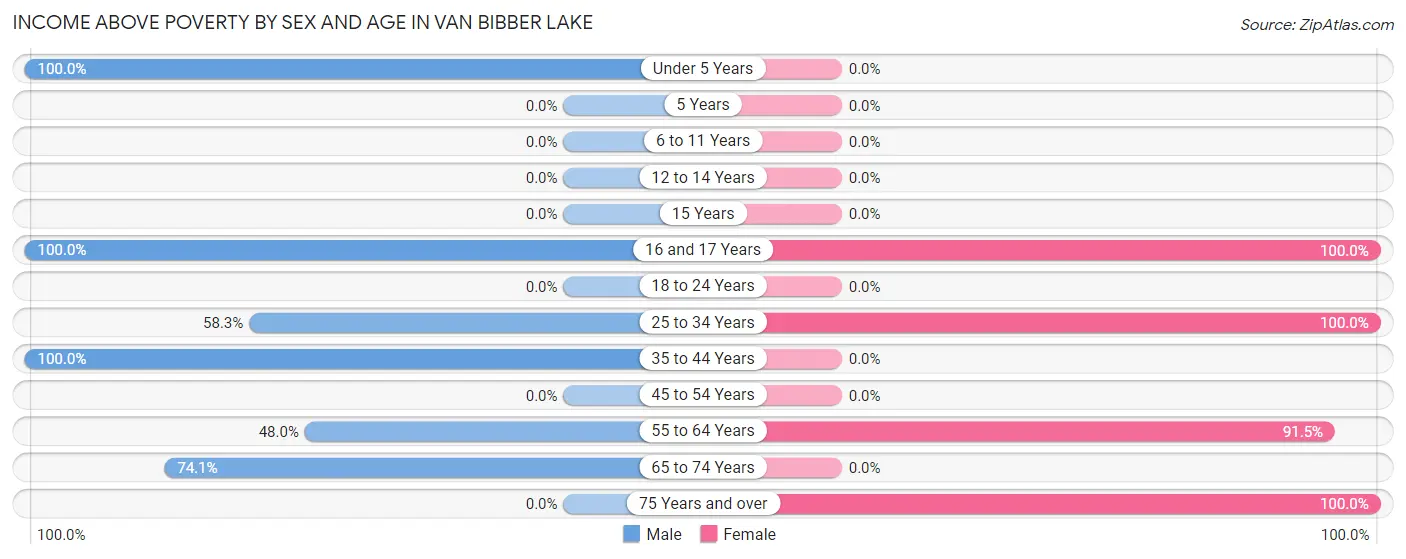
| Age Bracket | Male | Female |
| Under 5 Years | 54 (100.0%) | 0 (0.0%) |
| 5 Years | 0 (0.0%) | 0 (0.0%) |
| 6 to 11 Years | 0 (0.0%) | 0 (0.0%) |
| 12 to 14 Years | 0 (0.0%) | 0 (0.0%) |
| 15 Years | 0 (0.0%) | 0 (0.0%) |
| 16 and 17 Years | 19 (100.0%) | 15 (100.0%) |
| 18 to 24 Years | 0 (0.0%) | 0 (0.0%) |
| 25 to 34 Years | 14 (58.3%) | 46 (100.0%) |
| 35 to 44 Years | 36 (100.0%) | 0 (0.0%) |
| 45 to 54 Years | 0 (0.0%) | 0 (0.0%) |
| 55 to 64 Years | 24 (48.0%) | 54 (91.5%) |
| 65 to 74 Years | 20 (74.1%) | 0 (0.0%) |
| 75 Years and over | 0 (0.0%) | 17 (100.0%) |
| Total | 167 (60.5%) | 132 (86.3%) |
Income Below Poverty Among Married-Couple Families in Van Bibber Lake
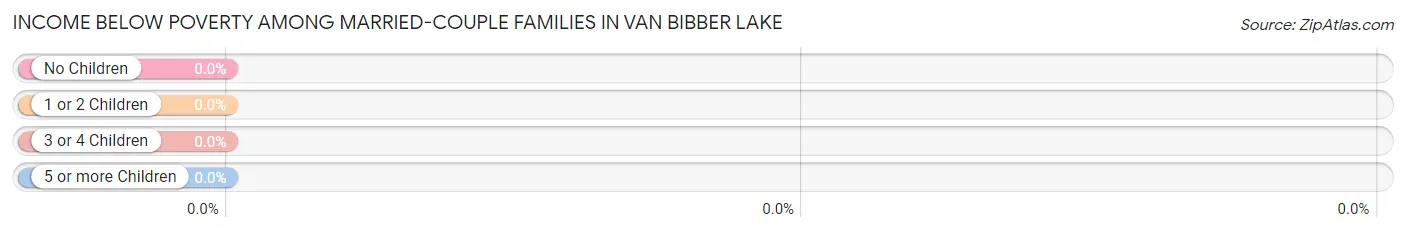
| Children | Above Poverty | Below Poverty |
| No Children | 44 (100.0%) | 0 (0.0%) |
| 1 or 2 Children | 0 (0.0%) | 0 (0.0%) |
| 3 or 4 Children | 0 (0.0%) | 0 (0.0%) |
| 5 or more Children | 0 (0.0%) | 0 (0.0%) |
| Total | 44 (100.0%) | 0 (0.0%) |
Income Below Poverty Among Single-Parent Households in Van Bibber Lake
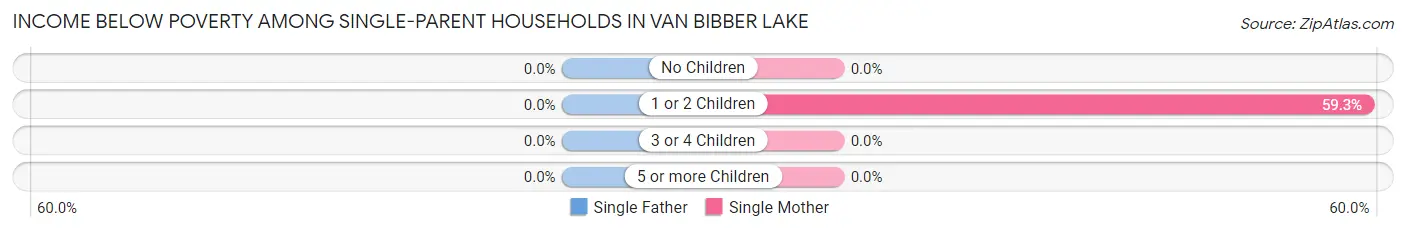
| Children | Single Father | Single Mother |
| No Children | 0 (0.0%) | 0 (0.0%) |
| 1 or 2 Children | 0 (0.0%) | 16 (59.3%) |
| 3 or 4 Children | 0 (0.0%) | 0 (0.0%) |
| 5 or more Children | 0 (0.0%) | 0 (0.0%) |
| Total | 0 (0.0%) | 16 (18.8%) |
Income Below Poverty Among Married-Couple vs Single-Parent Households in Van Bibber Lake
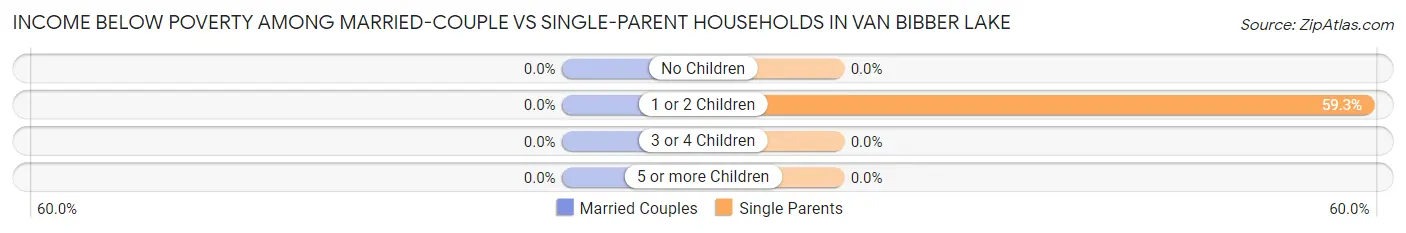
| Children | Married-Couple Families | Single-Parent Households |
| No Children | 0 (0.0%) | 0 (0.0%) |
| 1 or 2 Children | 0 (0.0%) | 16 (59.3%) |
| 3 or 4 Children | 0 (0.0%) | 0 (0.0%) |
| 5 or more Children | 0 (0.0%) | 0 (0.0%) |
| Total | 0 (0.0%) | 16 (18.8%) |
Race in Van Bibber Lake
The most populous races in Van Bibber Lake are , and White / Caucasian (429 | 100.0%).
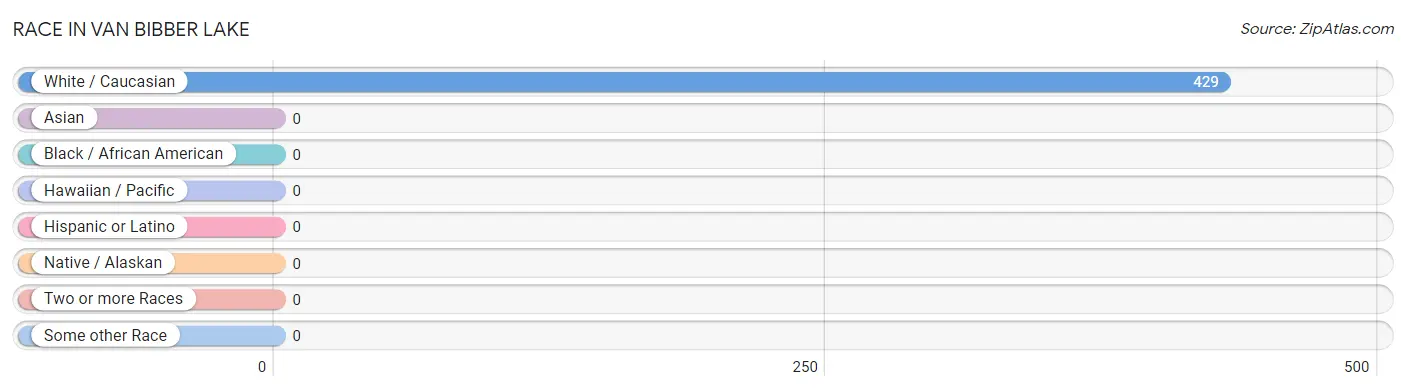
| Race | # Population | % Population |
| Asian | 0 | 0.0% |
| Black / African American | 0 | 0.0% |
| Hawaiian / Pacific | 0 | 0.0% |
| Hispanic or Latino | 0 | 0.0% |
| Native / Alaskan | 0 | 0.0% |
| White / Caucasian | 429 | 100.0% |
| Two or more Races | 0 | 0.0% |
| Some other Race | 0 | 0.0% |
| Total | 429 | 100.0% |
Ancestry in Van Bibber Lake
The most populous ancestries reported in Van Bibber Lake are English (67 | 15.6%), German (32 | 7.5%), Canadian (18 | 4.2%), American (17 | 4.0%), and Dutch (7 | 1.6%), together accounting for 32.9% of all Van Bibber Lake residents.
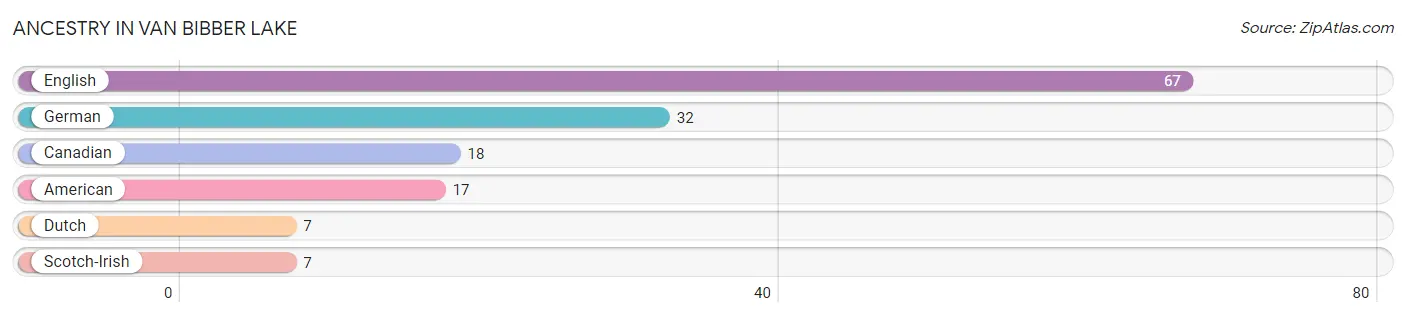
| Ancestry | # Population | % Population |
| American | 17 | 4.0% |
| Canadian | 18 | 4.2% |
| Dutch | 7 | 1.6% |
| English | 67 | 15.6% |
| German | 32 | 7.5% |
| Scotch-Irish | 7 | 1.6% | View All 6 Rows |
Immigrants in Van Bibber Lake
The most numerous immigrant groups reported in Van Bibber Lake came from , and Canada (6 | 1.4%), together accounting for 1.4% of all Van Bibber Lake residents.

| Immigration Origin | # Population | % Population |
| Canada | 6 | 1.4% | View All 1 Rows |
Sex and Age in Van Bibber Lake
Sex and Age in Van Bibber Lake
The most populous age groups in Van Bibber Lake are Under 5 Years (54 | 19.6%) for men and 30 to 34 Years (46 | 30.1%) for women.
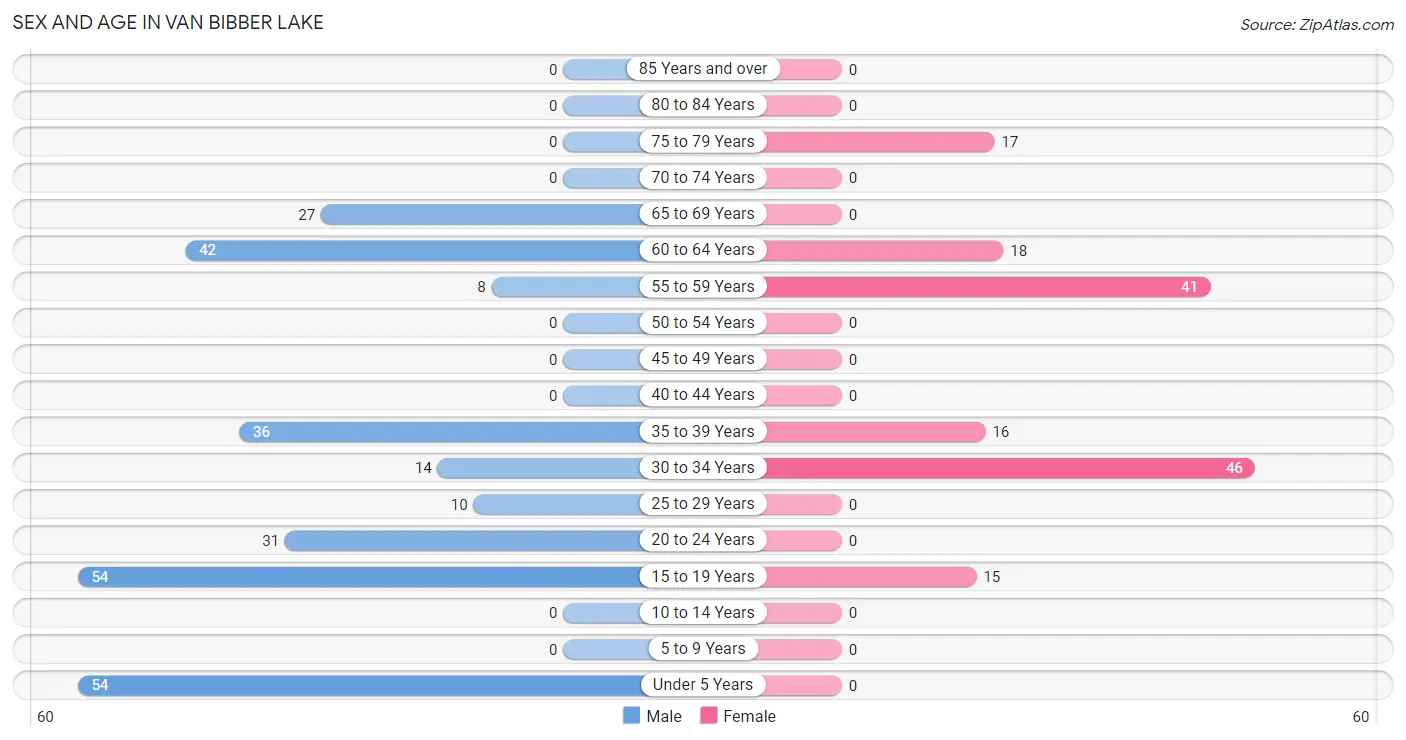
| Age Bracket | Male | Female |
| Under 5 Years | 54 (19.6%) | 0 (0.0%) |
| 5 to 9 Years | 0 (0.0%) | 0 (0.0%) |
| 10 to 14 Years | 0 (0.0%) | 0 (0.0%) |
| 15 to 19 Years | 54 (19.6%) | 15 (9.8%) |
| 20 to 24 Years | 31 (11.2%) | 0 (0.0%) |
| 25 to 29 Years | 10 (3.6%) | 0 (0.0%) |
| 30 to 34 Years | 14 (5.1%) | 46 (30.1%) |
| 35 to 39 Years | 36 (13.0%) | 16 (10.5%) |
| 40 to 44 Years | 0 (0.0%) | 0 (0.0%) |
| 45 to 49 Years | 0 (0.0%) | 0 (0.0%) |
| 50 to 54 Years | 0 (0.0%) | 0 (0.0%) |
| 55 to 59 Years | 8 (2.9%) | 41 (26.8%) |
| 60 to 64 Years | 42 (15.2%) | 18 (11.8%) |
| 65 to 69 Years | 27 (9.8%) | 0 (0.0%) |
| 70 to 74 Years | 0 (0.0%) | 0 (0.0%) |
| 75 to 79 Years | 0 (0.0%) | 17 (11.1%) |
| 80 to 84 Years | 0 (0.0%) | 0 (0.0%) |
| 85 Years and over | 0 (0.0%) | 0 (0.0%) |
| Total | 276 (100.0%) | 153 (100.0%) |
Families and Households in Van Bibber Lake
Median Family Size in Van Bibber Lake
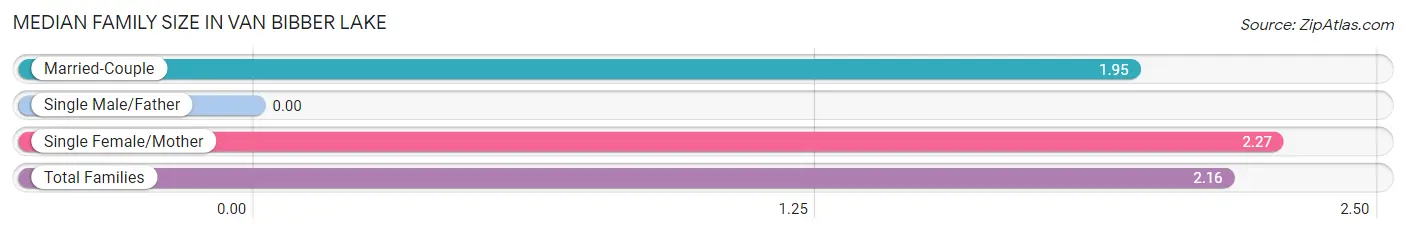
| Family Type | # Families | Family Size |
| Married-Couple | 44 (34.1%) | 1.95 |
| Single Male/Father | 0 (0.0%) | - |
| Single Female/Mother | 85 (65.9%) | 2.27 |
| Total Families | 129 (100.0%) | 2.16 |
Median Household Size in Van Bibber Lake
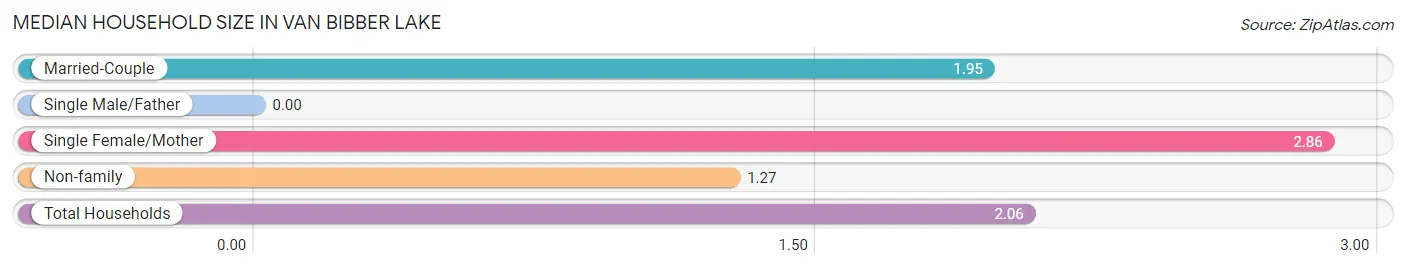
| Household Type | # Households | Household Size |
| Married-Couple | 44 (21.1%) | 1.95 |
| Single Male/Father | 0 (0.0%) | - |
| Single Female/Mother | 85 (40.9%) | 2.86 |
| Non-family | 79 (38.0%) | 1.27 |
| Total Households | 208 (100.0%) | 2.06 |
Household Size by Marriage Status in Van Bibber Lake
Out of a total of 208 households in Van Bibber Lake, 129 (62.0%) are family households, while 79 (38.0%) are nonfamily households. The most numerous type of family households are 2-person households, comprising 55, and the most common type of nonfamily households are 1-person households, comprising 69.
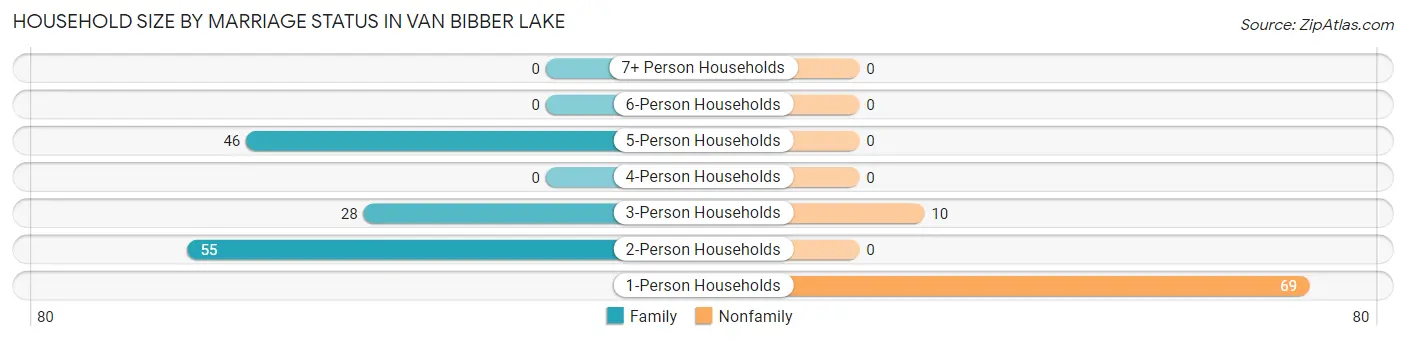
| Household Size | Family Households | Nonfamily Households |
| 1-Person Households | - | 69 (33.2%) |
| 2-Person Households | 55 (26.4%) | 0 (0.0%) |
| 3-Person Households | 28 (13.5%) | 10 (4.8%) |
| 4-Person Households | 0 (0.0%) | 0 (0.0%) |
| 5-Person Households | 46 (22.1%) | 0 (0.0%) |
| 6-Person Households | 0 (0.0%) | 0 (0.0%) |
| 7+ Person Households | 0 (0.0%) | 0 (0.0%) |
| Total | 129 (62.0%) | 79 (38.0%) |
Female Fertility in Van Bibber Lake
Fertility by Age in Van Bibber Lake
| Age Bracket | Women with Births | Births / 1,000 Women |
| 15 to 19 years | 0 (0.0%) | 0.0 |
| 20 to 34 years | 0 (0.0%) | 0.0 |
| 35 to 50 years | 0 (0.0%) | 0.0 |
| Total | 0 (0.0%) | 0.0 |
Fertility by Age by Marriage Status in Van Bibber Lake
| Age Bracket | Married | Unmarried |
| 15 to 19 years | 0 (0.0%) | 0 (0.0%) |
| 20 to 34 years | 0 (0.0%) | 0 (0.0%) |
| 35 to 50 years | 0 (0.0%) | 0 (0.0%) |
| Total | 0 (0.0%) | 0 (0.0%) |
Fertility by Education in Van Bibber Lake
| Educational Attainment | Women with Births | Births / 1,000 Women |
| Less than High School | 0 (0.0%) | 0.0 |
| High School Diploma | 0 (0.0%) | 0.0 |
| College or Associate's Degree | 0 (0.0%) | 0.0 |
| Bachelor's Degree | 0 (0.0%) | 0.0 |
| Graduate Degree | 0 (0.0%) | 0.0 |
| Total | 0 (0.0%) | 0.0 |
Fertility by Education by Marriage Status in Van Bibber Lake
| Educational Attainment | Married | Unmarried |
| Less than High School | 0 (0.0%) | 0 (0.0%) |
| High School Diploma | 0 (0.0%) | 0 (0.0%) |
| College or Associate's Degree | 0 (0.0%) | 0 (0.0%) |
| Bachelor's Degree | 0 (0.0%) | 0 (0.0%) |
| Graduate Degree | 0 (0.0%) | 0 (0.0%) |
| Total | 0 (0.0%) | 0 (0.0%) |
Employment Characteristics in Van Bibber Lake
Employment by Class of Employer in Van Bibber Lake
Among the 158 employed individuals in Van Bibber Lake, private company employees (114 | 72.2%), local government employees (28 | 17.7%), and self-employed (not incorporated) (16 | 10.1%) make up the most common classes of employment.
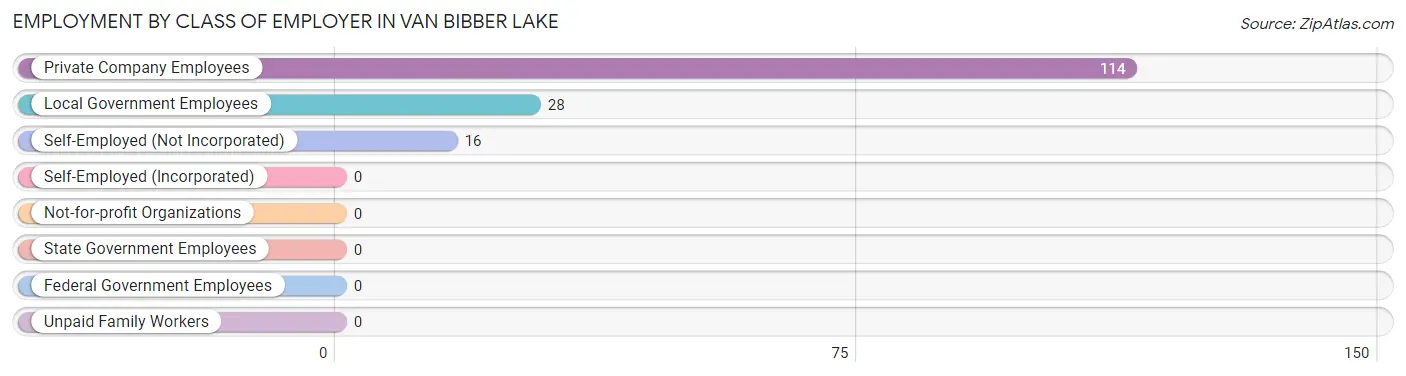
| Employer Class | # Employees | % Employees |
| Private Company Employees | 114 | 72.2% |
| Self-Employed (Incorporated) | 0 | 0.0% |
| Self-Employed (Not Incorporated) | 16 | 10.1% |
| Not-for-profit Organizations | 0 | 0.0% |
| Local Government Employees | 28 | 17.7% |
| State Government Employees | 0 | 0.0% |
| Federal Government Employees | 0 | 0.0% |
| Unpaid Family Workers | 0 | 0.0% |
| Total | 158 | 100.0% |
Employment Status by Age in Van Bibber Lake
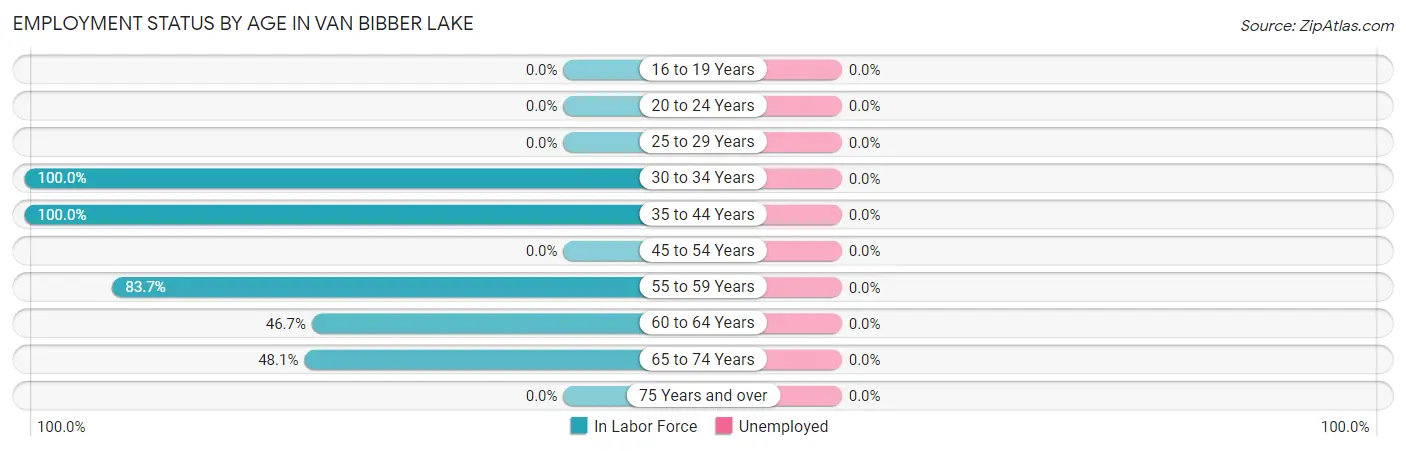
| Age Bracket | In Labor Force | Unemployed |
| 16 to 19 Years | 0 (0.0%) | 0 (0.0%) |
| 20 to 24 Years | 0 (0.0%) | 0 (0.0%) |
| 25 to 29 Years | 0 (0.0%) | 0 (0.0%) |
| 30 to 34 Years | 60 (100.0%) | 0 (0.0%) |
| 35 to 44 Years | 52 (100.0%) | 0 (0.0%) |
| 45 to 54 Years | 0 (0.0%) | 0 (0.0%) |
| 55 to 59 Years | 41 (83.7%) | 0 (0.0%) |
| 60 to 64 Years | 28 (46.7%) | 0 (0.0%) |
| 65 to 74 Years | 13 (48.1%) | 0 (0.0%) |
| 75 Years and over | 0 (0.0%) | 0 (0.0%) |
| Total | 194 (53.7%) | 0 (0.0%) |
Employment Status by Educational Attainment in Van Bibber Lake
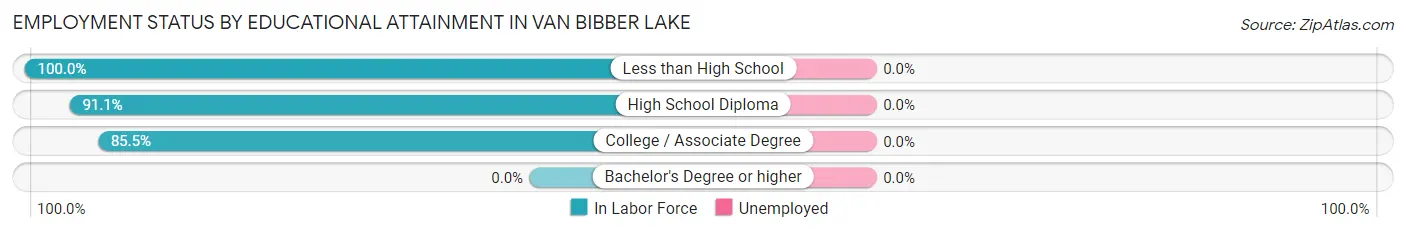
| Educational Attainment | In Labor Force | Unemployed |
| Less than High School | 5 (100.0%) | 0 (0.0%) |
| High School Diploma | 82 (91.1%) | 0 (0.0%) |
| College / Associate Degree | 94 (85.5%) | 0 (0.0%) |
| Bachelor's Degree or higher | 0 (0.0%) | 0 (0.0%) |
| Total | 181 (78.4%) | 0 (0.0%) |
Employment Occupations by Sex in Van Bibber Lake
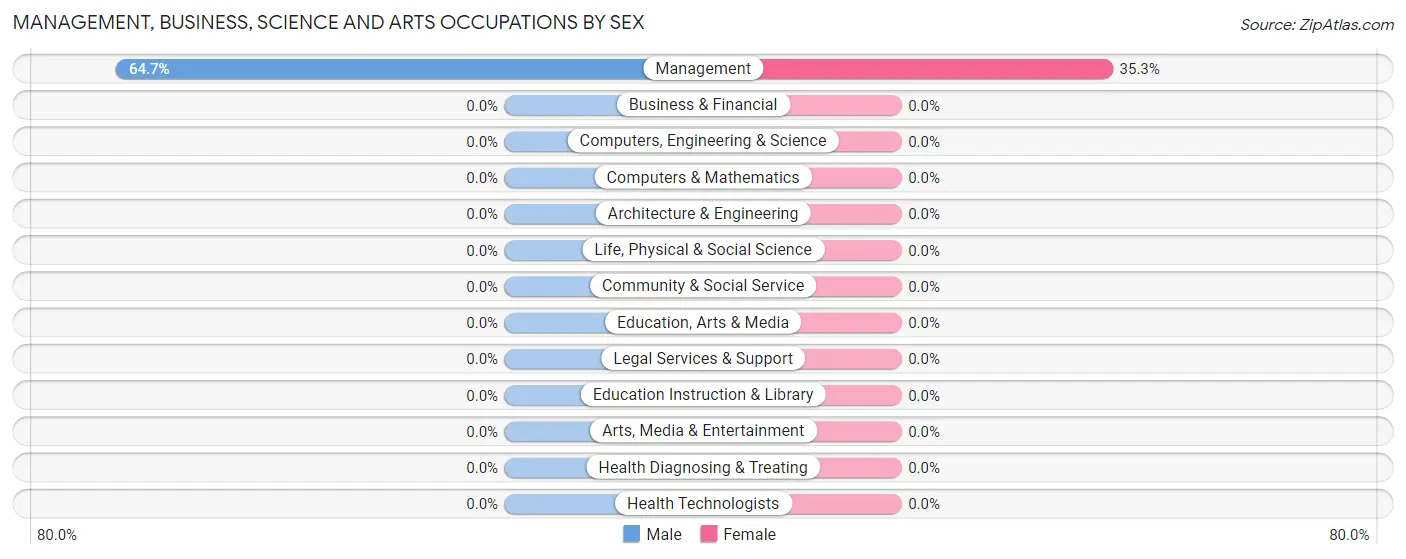
Management, Business, Science and Arts Occupations
The most common Management, Business, Science and Arts occupations in Van Bibber Lake are , and Management (34 | 17.5%).
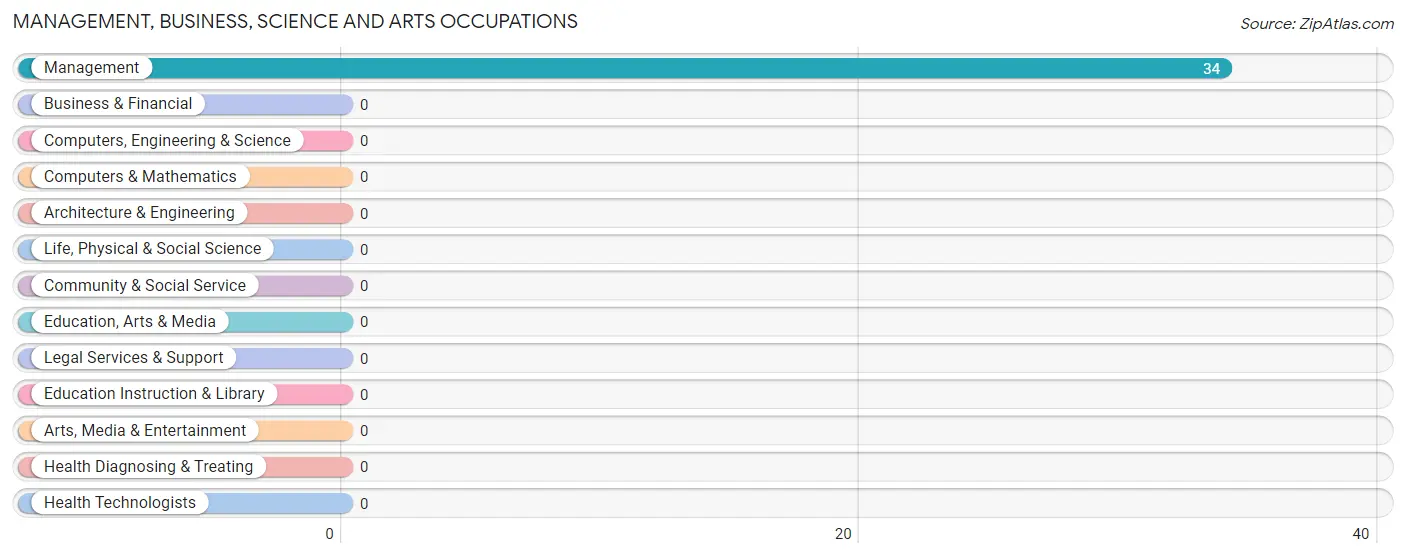
Management, Business, Science and Arts Occupations by Sex
| Occupation | Male | Female |
| Management | 22 (64.7%) | 12 (35.3%) |
| Business & Financial | 0 (0.0%) | 0 (0.0%) |
| Computers, Engineering & Science | 0 (0.0%) | 0 (0.0%) |
| Computers & Mathematics | 0 (0.0%) | 0 (0.0%) |
| Architecture & Engineering | 0 (0.0%) | 0 (0.0%) |
| Life, Physical & Social Science | 0 (0.0%) | 0 (0.0%) |
| Community & Social Service | 0 (0.0%) | 0 (0.0%) |
| Education, Arts & Media | 0 (0.0%) | 0 (0.0%) |
| Legal Services & Support | 0 (0.0%) | 0 (0.0%) |
| Education Instruction & Library | 0 (0.0%) | 0 (0.0%) |
| Arts, Media & Entertainment | 0 (0.0%) | 0 (0.0%) |
| Health Diagnosing & Treating | 0 (0.0%) | 0 (0.0%) |
| Health Technologists | 0 (0.0%) | 0 (0.0%) |
| Total (Category) | 22 (64.7%) | 12 (35.3%) |
| Total (Overall) | 87 (44.9%) | 107 (55.1%) |
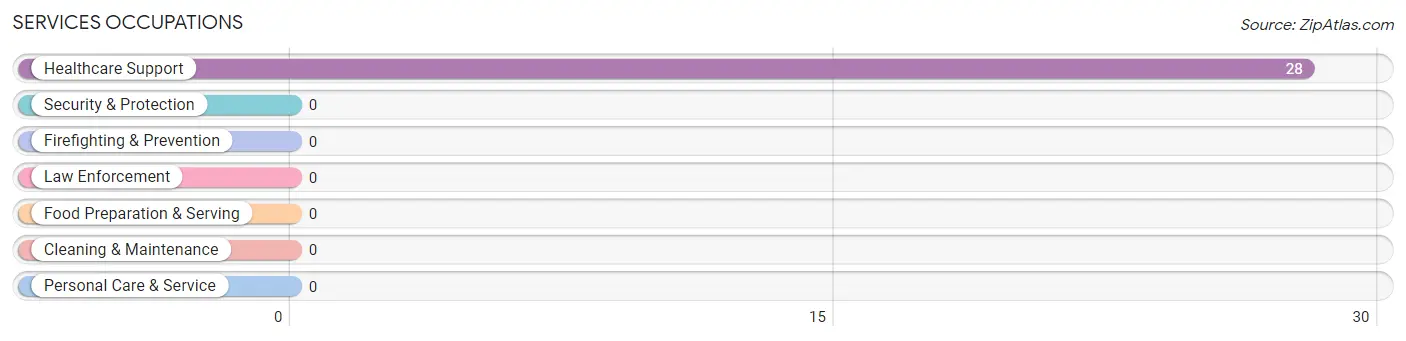
Services Occupations
The most common Services occupations in Van Bibber Lake are , and Healthcare Support (28 | 14.4%).
Services Occupations by Sex
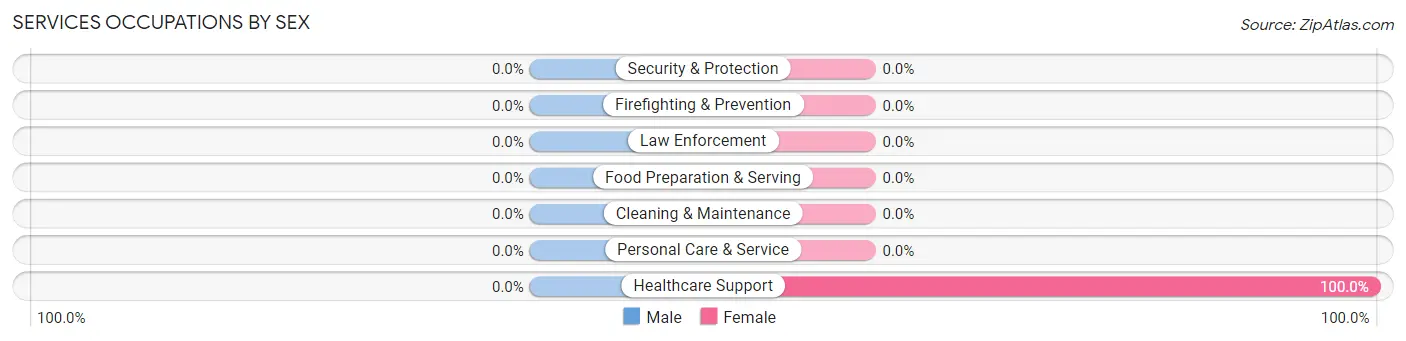
| Occupation | Male | Female |
| Healthcare Support | 0 (0.0%) | 28 (100.0%) |
| Security & Protection | 0 (0.0%) | 0 (0.0%) |
| Firefighting & Prevention | 0 (0.0%) | 0 (0.0%) |
| Law Enforcement | 0 (0.0%) | 0 (0.0%) |
| Food Preparation & Serving | 0 (0.0%) | 0 (0.0%) |
| Cleaning & Maintenance | 0 (0.0%) | 0 (0.0%) |
| Personal Care & Service | 0 (0.0%) | 0 (0.0%) |
| Total (Category) | 0 (0.0%) | 28 (100.0%) |
| Total (Overall) | 87 (44.9%) | 107 (55.1%) |
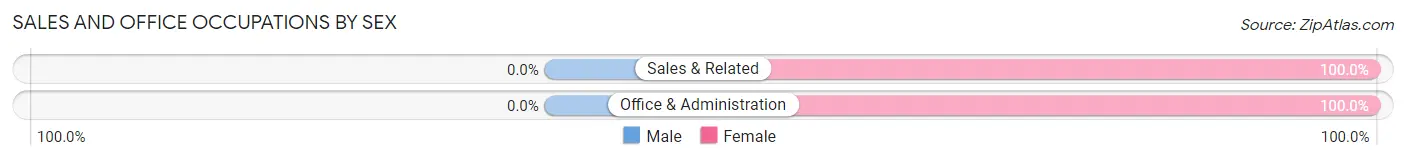
Sales and Office Occupations
The most common Sales and Office occupations in Van Bibber Lake are Office & Administration (16 | 8.3%), and Sales & Related (5 | 2.6%).

Sales and Office Occupations by Sex
| Occupation | Male | Female |
| Sales & Related | 0 (0.0%) | 5 (100.0%) |
| Office & Administration | 0 (0.0%) | 16 (100.0%) |
| Total (Category) | 0 (0.0%) | 21 (100.0%) |
| Total (Overall) | 87 (44.9%) | 107 (55.1%) |
Natural Resources, Construction and Maintenance Occupations
The most common Natural Resources, Construction and Maintenance occupations in Van Bibber Lake are , and Construction & Extraction (16 | 8.3%).
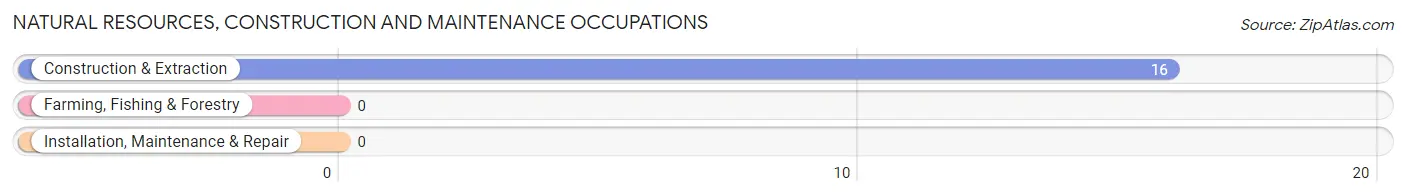
Natural Resources, Construction and Maintenance Occupations by Sex
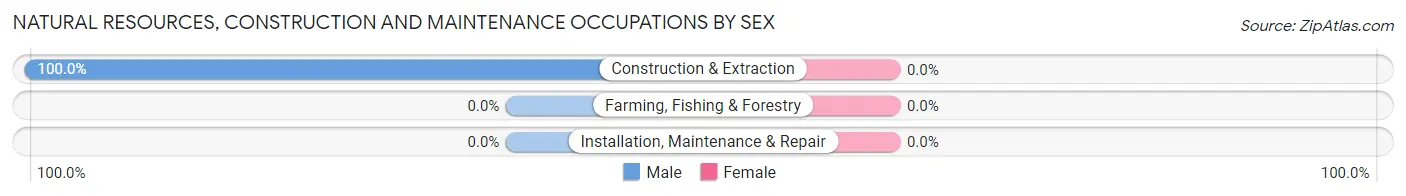
| Occupation | Male | Female |
| Farming, Fishing & Forestry | 0 (0.0%) | 0 (0.0%) |
| Construction & Extraction | 16 (100.0%) | 0 (0.0%) |
| Installation, Maintenance & Repair | 0 (0.0%) | 0 (0.0%) |
| Total (Category) | 16 (100.0%) | 0 (0.0%) |
| Total (Overall) | 87 (44.9%) | 107 (55.1%) |
Production, Transportation and Moving Occupations
The most common Production, Transportation and Moving occupations in Van Bibber Lake are Production (59 | 30.4%), and Material Moving (36 | 18.6%).
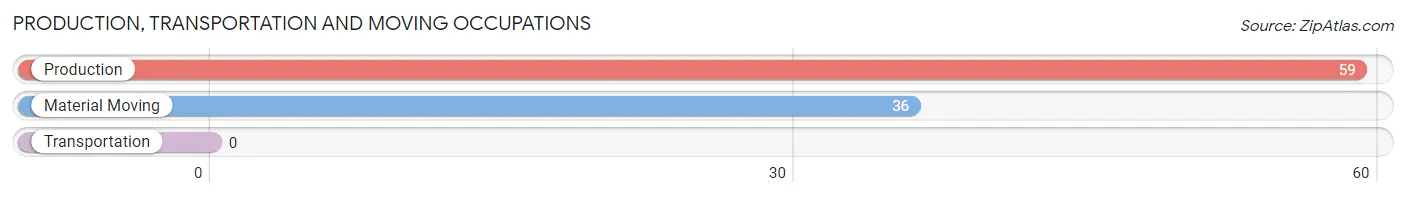
Production, Transportation and Moving Occupations by Sex
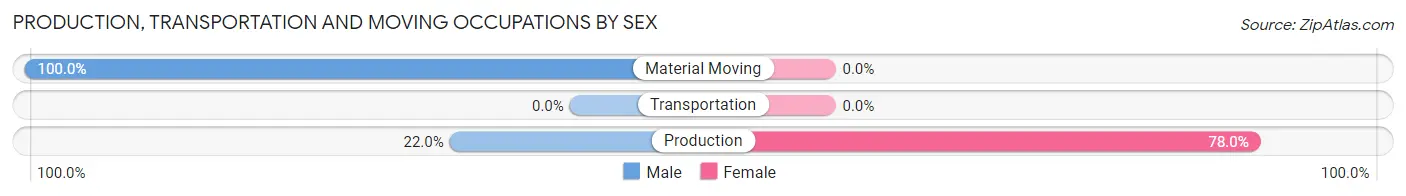
| Occupation | Male | Female |
| Production | 13 (22.0%) | 46 (78.0%) |
| Transportation | 0 (0.0%) | 0 (0.0%) |
| Material Moving | 36 (100.0%) | 0 (0.0%) |
| Total (Category) | 49 (51.6%) | 46 (48.4%) |
| Total (Overall) | 87 (44.9%) | 107 (55.1%) |
Employment Industries by Sex in Van Bibber Lake
Employment Industries in Van Bibber Lake
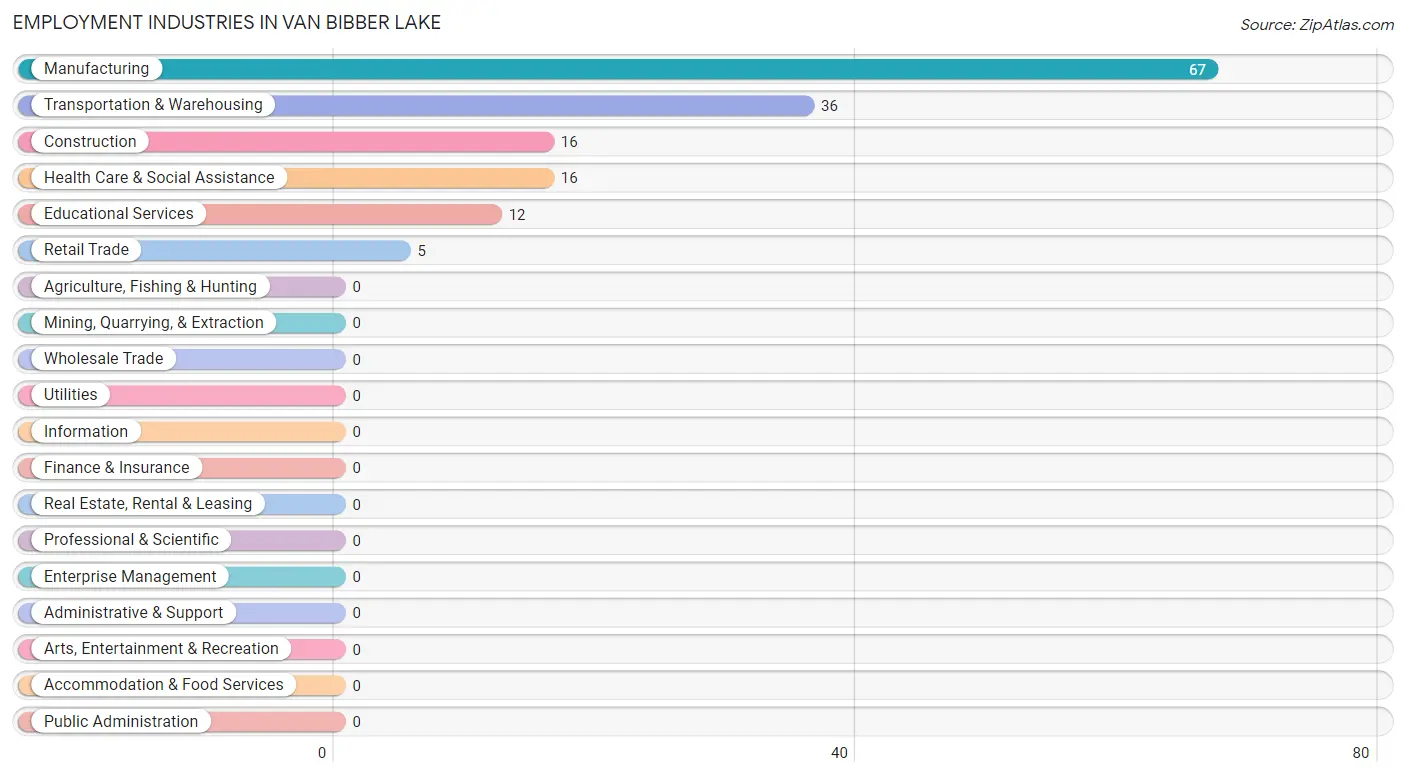
The major employment industries in Van Bibber Lake include Manufacturing (67 | 34.5%), Transportation & Warehousing (36 | 18.6%), Construction (16 | 8.3%), Health Care & Social Assistance (16 | 8.3%), and Educational Services (12 | 6.2%).
Employment Industries by Sex in Van Bibber Lake
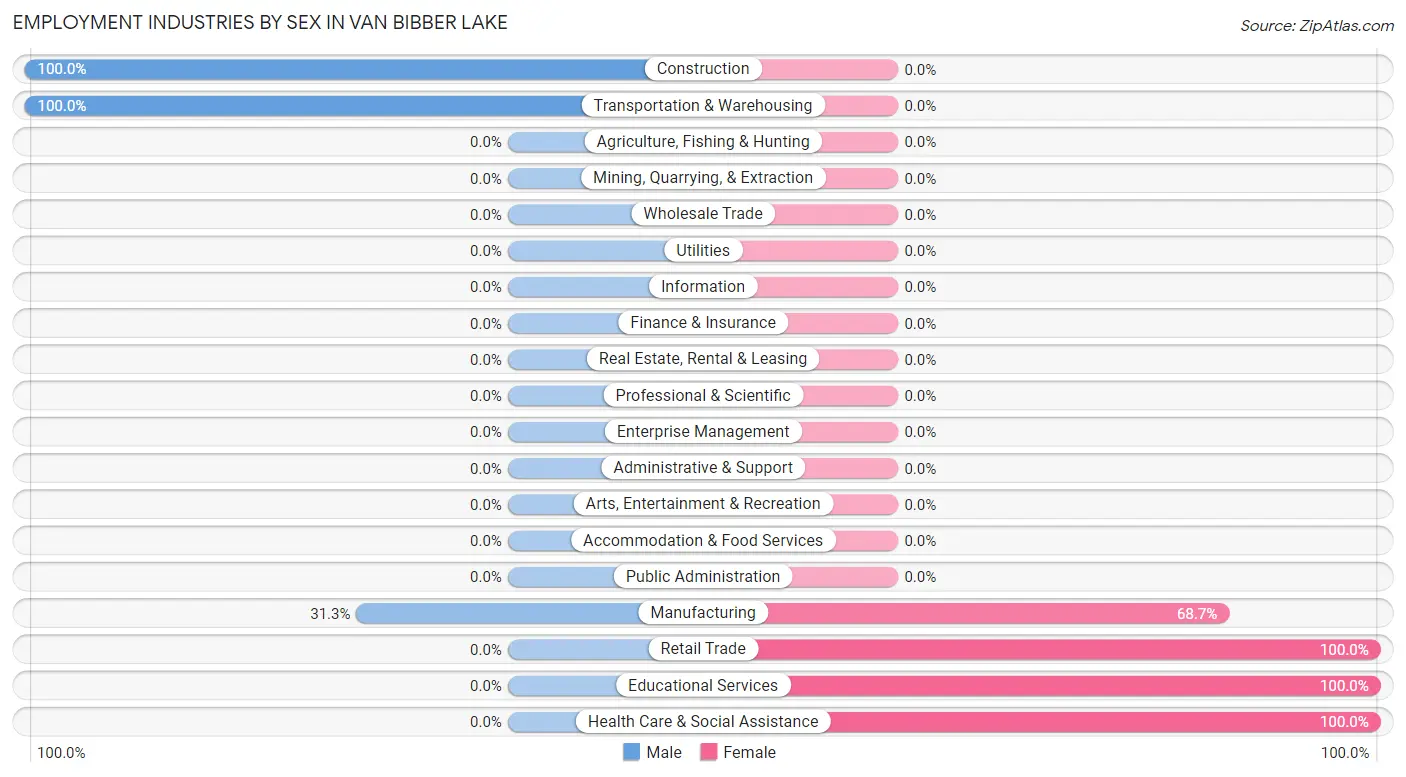
The Van Bibber Lake industries that see more men than women are Construction (100.0%), Transportation & Warehousing (100.0%), and Manufacturing (31.3%), whereas the industries that tend to have a higher number of women are Retail Trade (100.0%), Educational Services (100.0%), and Health Care & Social Assistance (100.0%).
| Industry | Male | Female |
| Agriculture, Fishing & Hunting | 0 (0.0%) | 0 (0.0%) |
| Mining, Quarrying, & Extraction | 0 (0.0%) | 0 (0.0%) |
| Construction | 16 (100.0%) | 0 (0.0%) |
| Manufacturing | 21 (31.3%) | 46 (68.7%) |
| Wholesale Trade | 0 (0.0%) | 0 (0.0%) |
| Retail Trade | 0 (0.0%) | 5 (100.0%) |
| Transportation & Warehousing | 36 (100.0%) | 0 (0.0%) |
| Utilities | 0 (0.0%) | 0 (0.0%) |
| Information | 0 (0.0%) | 0 (0.0%) |
| Finance & Insurance | 0 (0.0%) | 0 (0.0%) |
| Real Estate, Rental & Leasing | 0 (0.0%) | 0 (0.0%) |
| Professional & Scientific | 0 (0.0%) | 0 (0.0%) |
| Enterprise Management | 0 (0.0%) | 0 (0.0%) |
| Administrative & Support | 0 (0.0%) | 0 (0.0%) |
| Educational Services | 0 (0.0%) | 12 (100.0%) |
| Health Care & Social Assistance | 0 (0.0%) | 16 (100.0%) |
| Arts, Entertainment & Recreation | 0 (0.0%) | 0 (0.0%) |
| Accommodation & Food Services | 0 (0.0%) | 0 (0.0%) |
| Public Administration | 0 (0.0%) | 0 (0.0%) |
| Total | 87 (44.9%) | 107 (55.1%) |
Education in Van Bibber Lake
School Enrollment in Van Bibber Lake
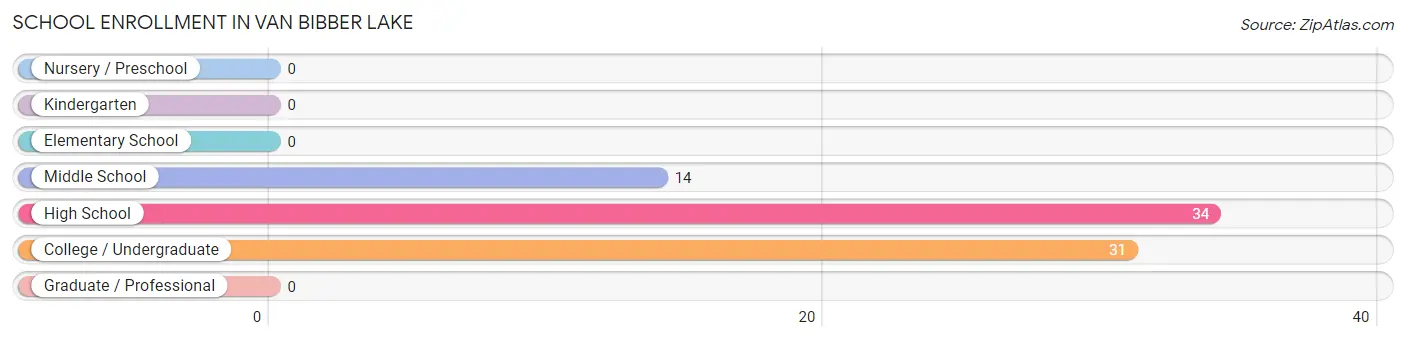
The most common levels of schooling among the 79 students in Van Bibber Lake are high school (34 | 43.0%), college / undergraduate (31 | 39.2%), and middle school (14 | 17.7%).
| School Level | # Students | % Students |
| Nursery / Preschool | 0 | 0.0% |
| Kindergarten | 0 | 0.0% |
| Elementary School | 0 | 0.0% |
| Middle School | 14 | 17.7% |
| High School | 34 | 43.0% |
| College / Undergraduate | 31 | 39.2% |
| Graduate / Professional | 0 | 0.0% |
| Total | 79 | 100.0% |
School Enrollment by Age by Funding Source in Van Bibber Lake
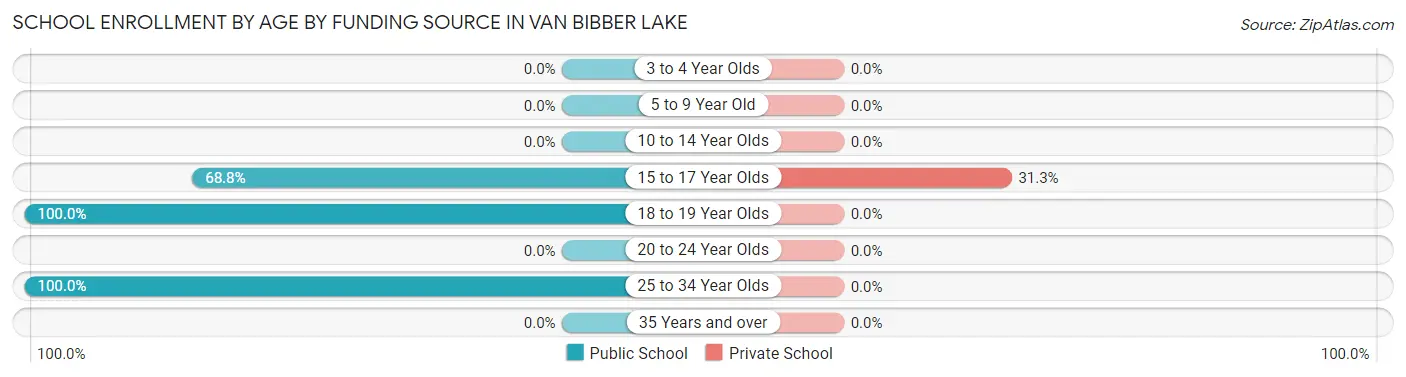
Out of a total of 79 students who are enrolled in schools in Van Bibber Lake, 15 (19.0%) attend a private institution, while the remaining 64 (81.0%) are enrolled in public schools. The age group of 15 to 17 year olds has the highest likelihood of being enrolled in private schools, with 15 (31.2% in the age bracket) enrolled. Conversely, the age group of 18 to 19 year olds has the lowest likelihood of being enrolled in a private school, with 21 (100.0% in the age bracket) attending a public institution.
| Age Bracket | Public School | Private School |
| 3 to 4 Year Olds | 0 (0.0%) | 0 (0.0%) |
| 5 to 9 Year Old | 0 (0.0%) | 0 (0.0%) |
| 10 to 14 Year Olds | 0 (0.0%) | 0 (0.0%) |
| 15 to 17 Year Olds | 33 (68.8%) | 15 (31.2%) |
| 18 to 19 Year Olds | 21 (100.0%) | 0 (0.0%) |
| 20 to 24 Year Olds | 0 (0.0%) | 0 (0.0%) |
| 25 to 34 Year Olds | 10 (100.0%) | 0 (0.0%) |
| 35 Years and over | 0 (0.0%) | 0 (0.0%) |
| Total | 64 (81.0%) | 15 (19.0%) |
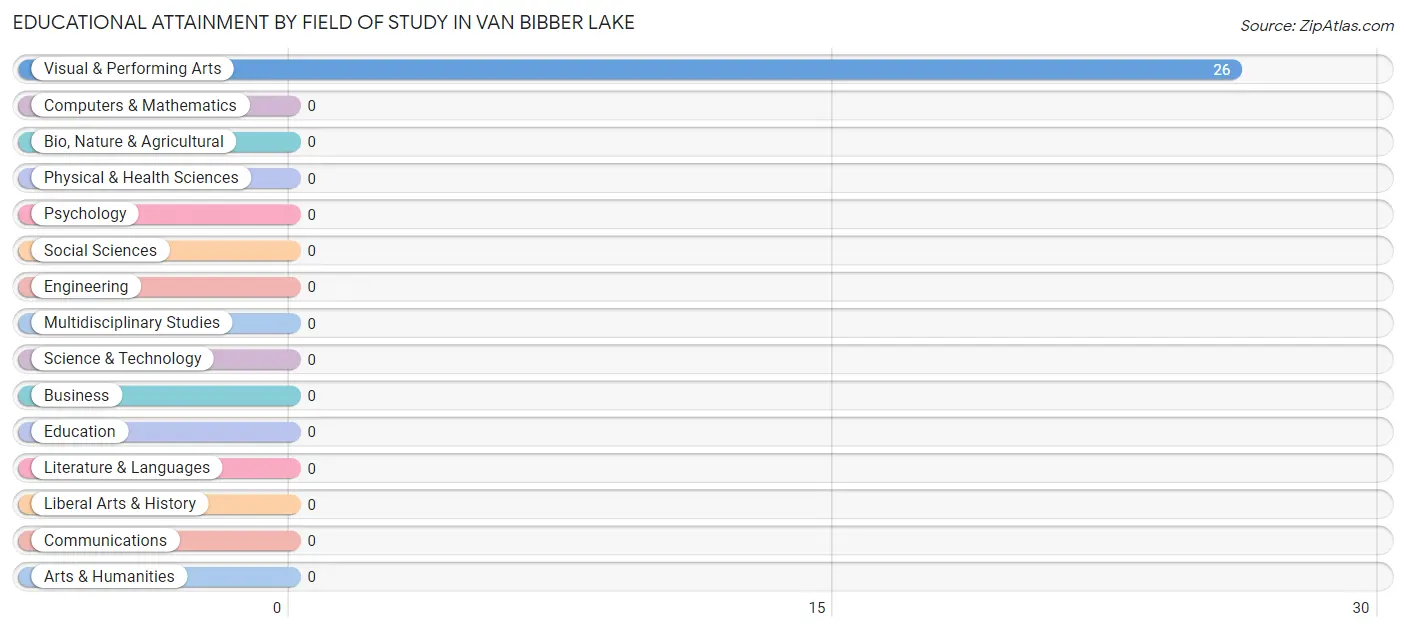
Educational Attainment by Field of Study in Van Bibber Lake
, and visual & performing arts (26 | 100.0%) are the most common fields of study among 26 individuals in Van Bibber Lake who have obtained a bachelor's degree or higher.
| Field of Study | # Graduates | % Graduates |
| Computers & Mathematics | 0 | 0.0% |
| Bio, Nature & Agricultural | 0 | 0.0% |
| Physical & Health Sciences | 0 | 0.0% |
| Psychology | 0 | 0.0% |
| Social Sciences | 0 | 0.0% |
| Engineering | 0 | 0.0% |
| Multidisciplinary Studies | 0 | 0.0% |
| Science & Technology | 0 | 0.0% |
| Business | 0 | 0.0% |
| Education | 0 | 0.0% |
| Literature & Languages | 0 | 0.0% |
| Liberal Arts & History | 0 | 0.0% |
| Visual & Performing Arts | 26 | 100.0% |
| Communications | 0 | 0.0% |
| Arts & Humanities | 0 | 0.0% |
| Total | 26 | 100.0% |
Transportation & Commute in Van Bibber Lake
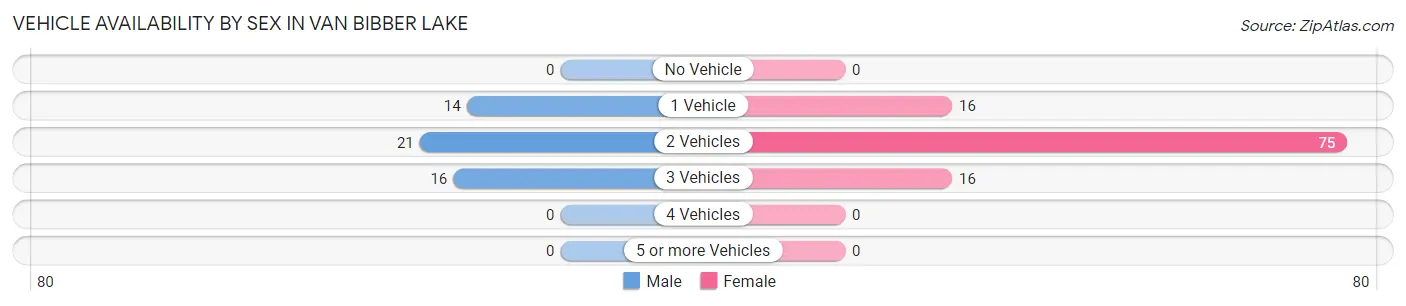
Vehicle Availability by Sex in Van Bibber Lake
The most prevalent vehicle ownership categories in Van Bibber Lake are males with 2 vehicles (21, accounting for 41.2%) and females with 2 vehicles (75, making up 19.6%).
| Vehicles Available | Male | Female |
| No Vehicle | 0 (0.0%) | 0 (0.0%) |
| 1 Vehicle | 14 (27.5%) | 16 (14.9%) |
| 2 Vehicles | 21 (41.2%) | 75 (70.1%) |
| 3 Vehicles | 16 (31.4%) | 16 (14.9%) |
| 4 Vehicles | 0 (0.0%) | 0 (0.0%) |
| 5 or more Vehicles | 0 (0.0%) | 0 (0.0%) |
| Total | 51 (100.0%) | 107 (100.0%) |
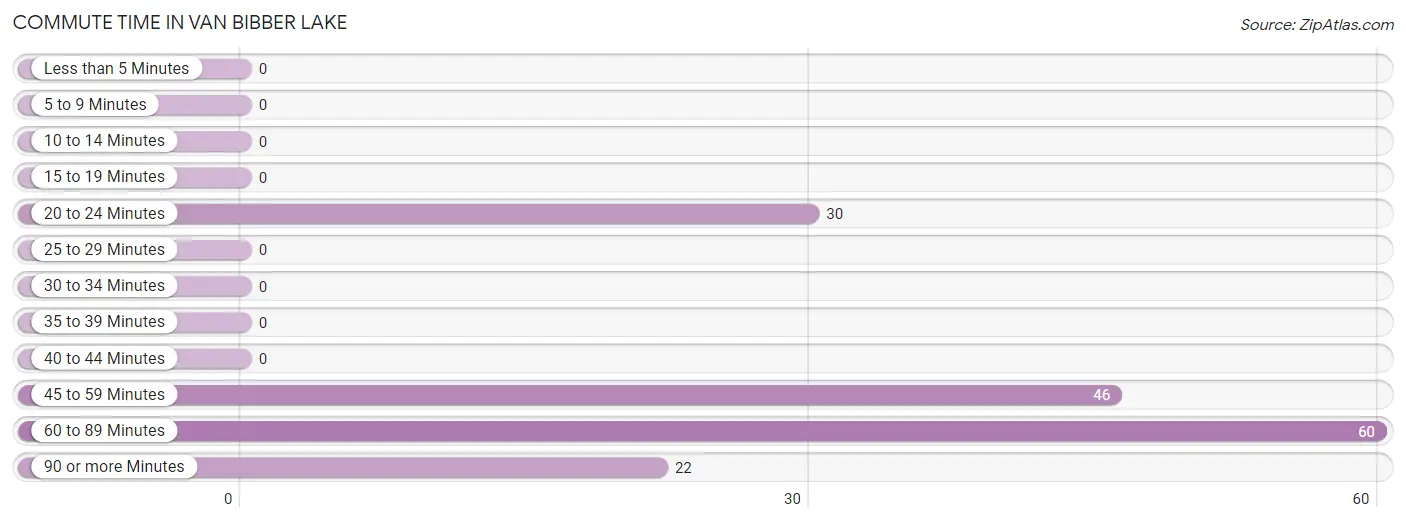
Commute Time in Van Bibber Lake
The most frequently occuring commute durations in Van Bibber Lake are 60 to 89 minutes (60 commuters, 38.0%), 45 to 59 minutes (46 commuters, 29.1%), and 20 to 24 minutes (30 commuters, 19.0%).
| Commute Time | # Commuters | % Commuters |
| Less than 5 Minutes | 0 | 0.0% |
| 5 to 9 Minutes | 0 | 0.0% |
| 10 to 14 Minutes | 0 | 0.0% |
| 15 to 19 Minutes | 0 | 0.0% |
| 20 to 24 Minutes | 30 | 19.0% |
| 25 to 29 Minutes | 0 | 0.0% |
| 30 to 34 Minutes | 0 | 0.0% |
| 35 to 39 Minutes | 0 | 0.0% |
| 40 to 44 Minutes | 0 | 0.0% |
| 45 to 59 Minutes | 46 | 29.1% |
| 60 to 89 Minutes | 60 | 38.0% |
| 90 or more Minutes | 22 | 13.9% |
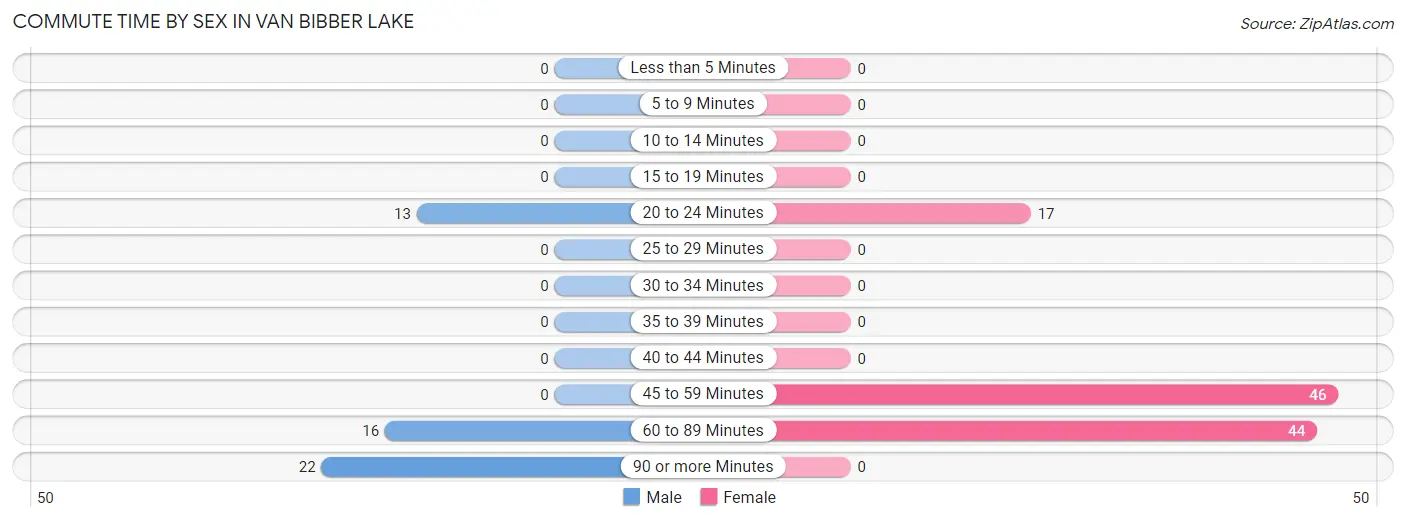
Commute Time by Sex in Van Bibber Lake
The most common commute times in Van Bibber Lake are 90 or more minutes (22 commuters, 43.1%) for males and 45 to 59 minutes (46 commuters, 43.0%) for females.
| Commute Time | Male | Female |
| Less than 5 Minutes | 0 (0.0%) | 0 (0.0%) |
| 5 to 9 Minutes | 0 (0.0%) | 0 (0.0%) |
| 10 to 14 Minutes | 0 (0.0%) | 0 (0.0%) |
| 15 to 19 Minutes | 0 (0.0%) | 0 (0.0%) |
| 20 to 24 Minutes | 13 (25.5%) | 17 (15.9%) |
| 25 to 29 Minutes | 0 (0.0%) | 0 (0.0%) |
| 30 to 34 Minutes | 0 (0.0%) | 0 (0.0%) |
| 35 to 39 Minutes | 0 (0.0%) | 0 (0.0%) |
| 40 to 44 Minutes | 0 (0.0%) | 0 (0.0%) |
| 45 to 59 Minutes | 0 (0.0%) | 46 (43.0%) |
| 60 to 89 Minutes | 16 (31.4%) | 44 (41.1%) |
| 90 or more Minutes | 22 (43.1%) | 0 (0.0%) |
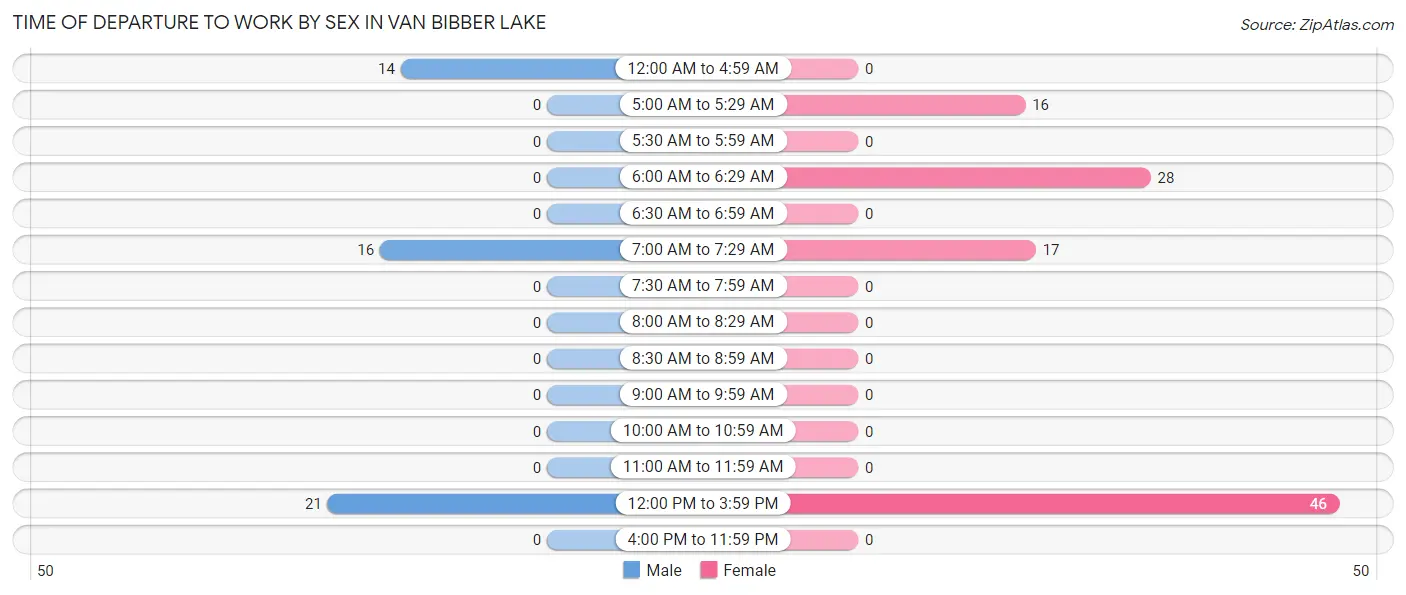
Time of Departure to Work by Sex in Van Bibber Lake
The most frequent times of departure to work in Van Bibber Lake are 12:00 PM to 3:59 PM (21, 41.2%) for males and 12:00 PM to 3:59 PM (46, 43.0%) for females.
| Time of Departure | Male | Female |
| 12:00 AM to 4:59 AM | 14 (27.5%) | 0 (0.0%) |
| 5:00 AM to 5:29 AM | 0 (0.0%) | 16 (14.9%) |
| 5:30 AM to 5:59 AM | 0 (0.0%) | 0 (0.0%) |
| 6:00 AM to 6:29 AM | 0 (0.0%) | 28 (26.2%) |
| 6:30 AM to 6:59 AM | 0 (0.0%) | 0 (0.0%) |
| 7:00 AM to 7:29 AM | 16 (31.4%) | 17 (15.9%) |
| 7:30 AM to 7:59 AM | 0 (0.0%) | 0 (0.0%) |
| 8:00 AM to 8:29 AM | 0 (0.0%) | 0 (0.0%) |
| 8:30 AM to 8:59 AM | 0 (0.0%) | 0 (0.0%) |
| 9:00 AM to 9:59 AM | 0 (0.0%) | 0 (0.0%) |
| 10:00 AM to 10:59 AM | 0 (0.0%) | 0 (0.0%) |
| 11:00 AM to 11:59 AM | 0 (0.0%) | 0 (0.0%) |
| 12:00 PM to 3:59 PM | 21 (41.2%) | 46 (43.0%) |
| 4:00 PM to 11:59 PM | 0 (0.0%) | 0 (0.0%) |
| Total | 51 (100.0%) | 107 (100.0%) |
Housing Occupancy in Van Bibber Lake
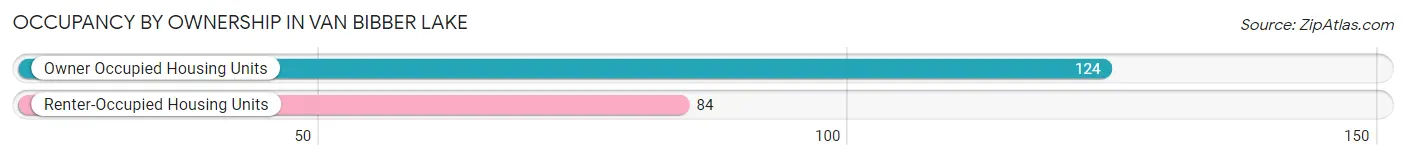
Occupancy by Ownership in Van Bibber Lake
Of the total 208 dwellings in Van Bibber Lake, owner-occupied units account for 124 (59.6%), while renter-occupied units make up 84 (40.4%).
| Occupancy | # Housing Units | % Housing Units |
| Owner Occupied Housing Units | 124 | 59.6% |
| Renter-Occupied Housing Units | 84 | 40.4% |
| Total Occupied Housing Units | 208 | 100.0% |
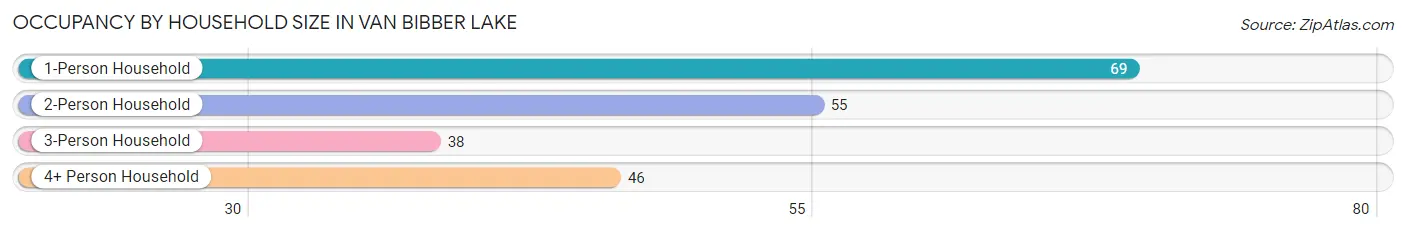
Occupancy by Household Size in Van Bibber Lake
| Household Size | # Housing Units | % Housing Units |
| 1-Person Household | 69 | 33.2% |
| 2-Person Household | 55 | 26.4% |
| 3-Person Household | 38 | 18.3% |
| 4+ Person Household | 46 | 22.1% |
| Total Housing Units | 208 | 100.0% |
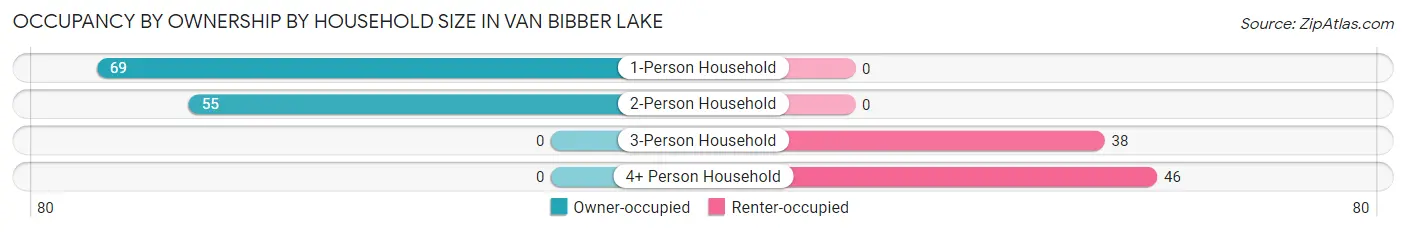
Occupancy by Ownership by Household Size in Van Bibber Lake
| Household Size | Owner-occupied | Renter-occupied |
| 1-Person Household | 69 (100.0%) | 0 (0.0%) |
| 2-Person Household | 55 (100.0%) | 0 (0.0%) |
| 3-Person Household | 0 (0.0%) | 38 (100.0%) |
| 4+ Person Household | 0 (0.0%) | 46 (100.0%) |
| Total Housing Units | 124 (59.6%) | 84 (40.4%) |
Occupancy by Educational Attainment in Van Bibber Lake
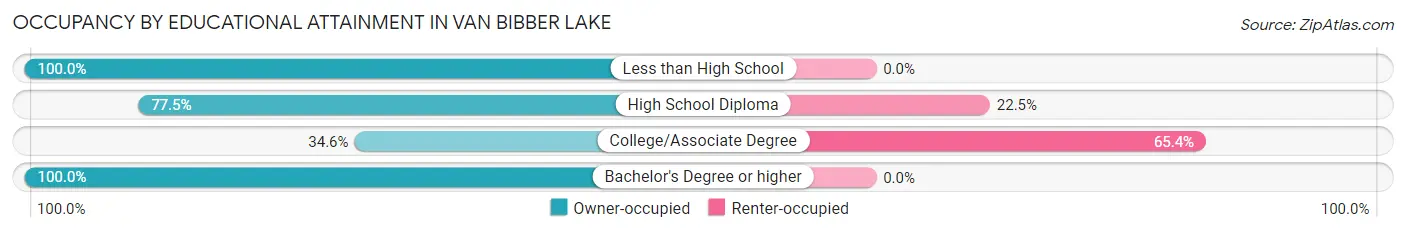
| Household Size | Owner-occupied | Renter-occupied |
| Less than High School | 7 (100.0%) | 0 (0.0%) |
| High School Diploma | 55 (77.5%) | 16 (22.5%) |
| College/Associate Degree | 36 (34.6%) | 68 (65.4%) |
| Bachelor's Degree or higher | 26 (100.0%) | 0 (0.0%) |
Occupancy by Age of Householder in Van Bibber Lake
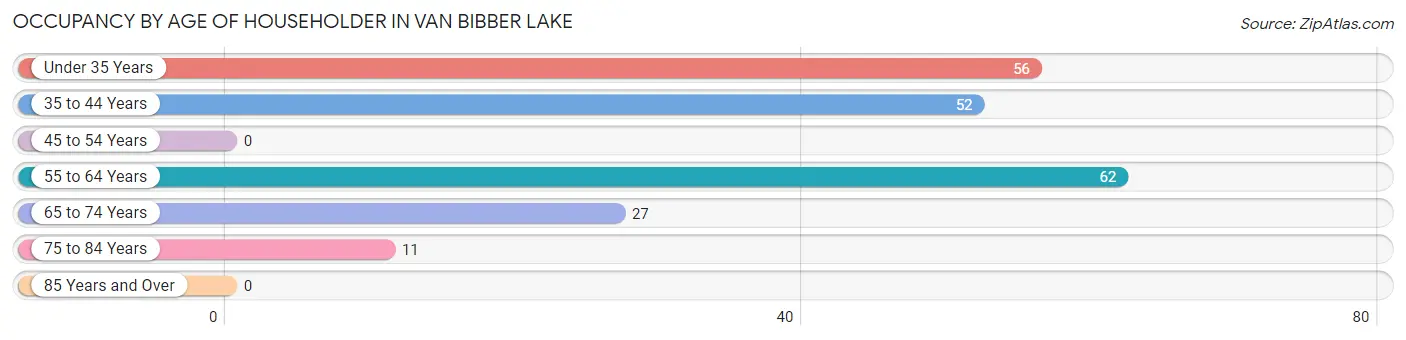
| Age Bracket | # Households | % Households |
| Under 35 Years | 56 | 26.9% |
| 35 to 44 Years | 52 | 25.0% |
| 45 to 54 Years | 0 | 0.0% |
| 55 to 64 Years | 62 | 29.8% |
| 65 to 74 Years | 27 | 13.0% |
| 75 to 84 Years | 11 | 5.3% |
| 85 Years and Over | 0 | 0.0% |
| Total | 208 | 100.0% |
Housing Finances in Van Bibber Lake
Median Income by Occupancy in Van Bibber Lake
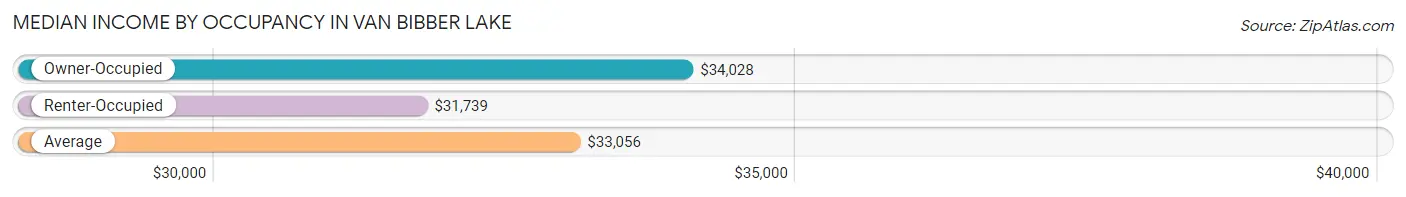
| Occupancy Type | # Households | Median Income |
| Owner-Occupied | 124 (59.6%) | $34,028 |
| Renter-Occupied | 84 (40.4%) | $31,739 |
| Average | 208 (100.0%) | $33,056 |
Occupancy by Householder Income Bracket in Van Bibber Lake
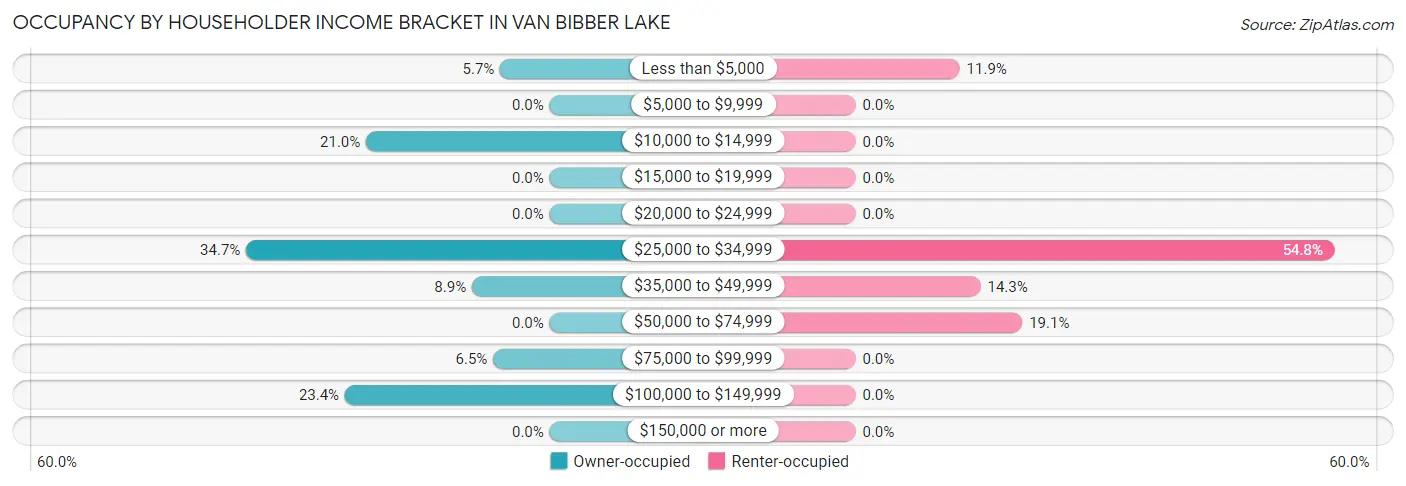
| Income Bracket | Owner-occupied | Renter-occupied |
| Less than $5,000 | 7 (5.7%) | 10 (11.9%) |
| $5,000 to $9,999 | 0 (0.0%) | 0 (0.0%) |
| $10,000 to $14,999 | 26 (21.0%) | 0 (0.0%) |
| $15,000 to $19,999 | 0 (0.0%) | 0 (0.0%) |
| $20,000 to $24,999 | 0 (0.0%) | 0 (0.0%) |
| $25,000 to $34,999 | 43 (34.7%) | 46 (54.8%) |
| $35,000 to $49,999 | 11 (8.9%) | 12 (14.3%) |
| $50,000 to $74,999 | 0 (0.0%) | 16 (19.1%) |
| $75,000 to $99,999 | 8 (6.5%) | 0 (0.0%) |
| $100,000 to $149,999 | 29 (23.4%) | 0 (0.0%) |
| $150,000 or more | 0 (0.0%) | 0 (0.0%) |
| Total | 124 (100.0%) | 84 (100.0%) |
Monthly Housing Cost Tiers in Van Bibber Lake
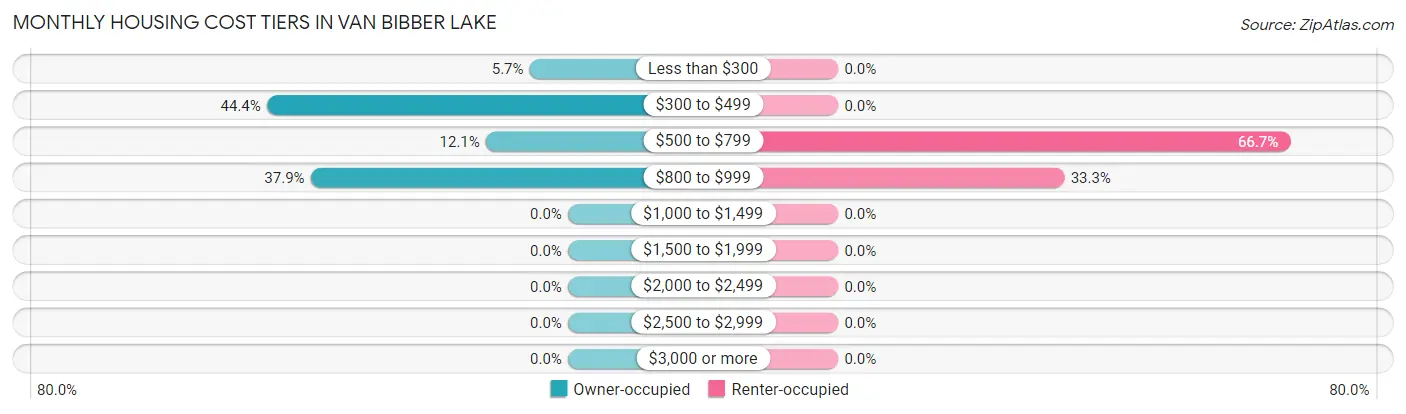
| Monthly Cost | Owner-occupied | Renter-occupied |
| Less than $300 | 7 (5.7%) | 0 (0.0%) |
| $300 to $499 | 55 (44.4%) | 0 (0.0%) |
| $500 to $799 | 15 (12.1%) | 56 (66.7%) |
| $800 to $999 | 47 (37.9%) | 28 (33.3%) |
| $1,000 to $1,499 | 0 (0.0%) | 0 (0.0%) |
| $1,500 to $1,999 | 0 (0.0%) | 0 (0.0%) |
| $2,000 to $2,499 | 0 (0.0%) | 0 (0.0%) |
| $2,500 to $2,999 | 0 (0.0%) | 0 (0.0%) |
| $3,000 or more | 0 (0.0%) | 0 (0.0%) |
| Total | 124 (100.0%) | 84 (100.0%) |
Physical Housing Characteristics in Van Bibber Lake
Housing Structures in Van Bibber Lake
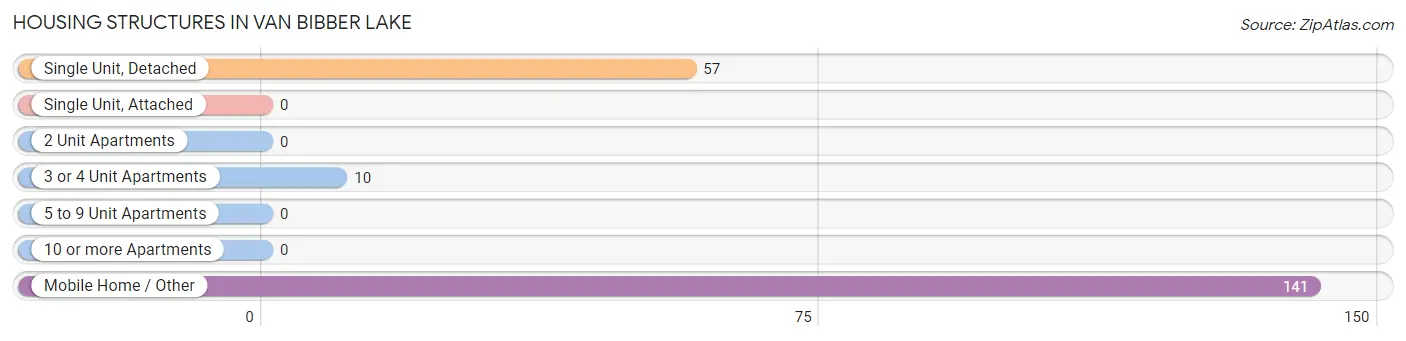
| Structure Type | # Housing Units | % Housing Units |
| Single Unit, Detached | 57 | 27.4% |
| Single Unit, Attached | 0 | 0.0% |
| 2 Unit Apartments | 0 | 0.0% |
| 3 or 4 Unit Apartments | 10 | 4.8% |
| 5 to 9 Unit Apartments | 0 | 0.0% |
| 10 or more Apartments | 0 | 0.0% |
| Mobile Home / Other | 141 | 67.8% |
| Total | 208 | 100.0% |
Housing Structures by Occupancy in Van Bibber Lake
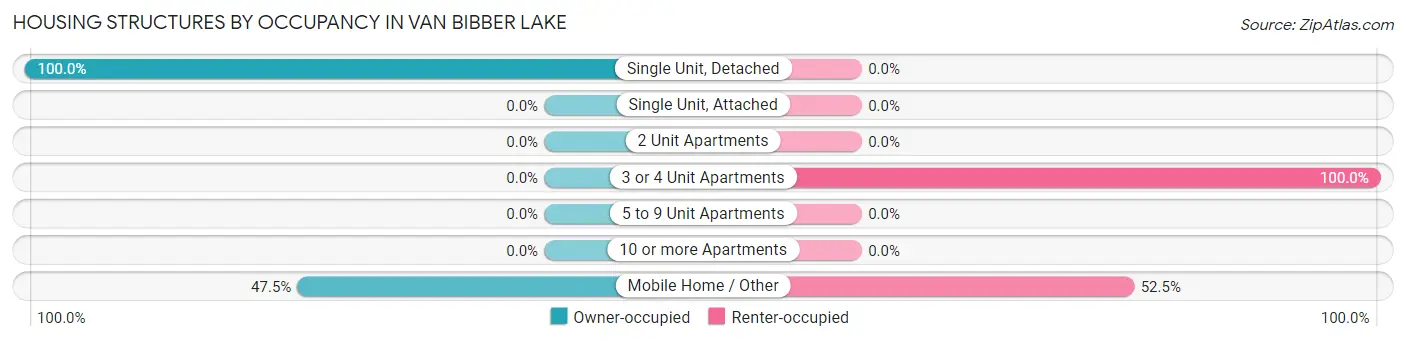
| Structure Type | Owner-occupied | Renter-occupied |
| Single Unit, Detached | 57 (100.0%) | 0 (0.0%) |
| Single Unit, Attached | 0 (0.0%) | 0 (0.0%) |
| 2 Unit Apartments | 0 (0.0%) | 0 (0.0%) |
| 3 or 4 Unit Apartments | 0 (0.0%) | 10 (100.0%) |
| 5 to 9 Unit Apartments | 0 (0.0%) | 0 (0.0%) |
| 10 or more Apartments | 0 (0.0%) | 0 (0.0%) |
| Mobile Home / Other | 67 (47.5%) | 74 (52.5%) |
| Total | 124 (59.6%) | 84 (40.4%) |
Housing Structures by Number of Rooms in Van Bibber Lake
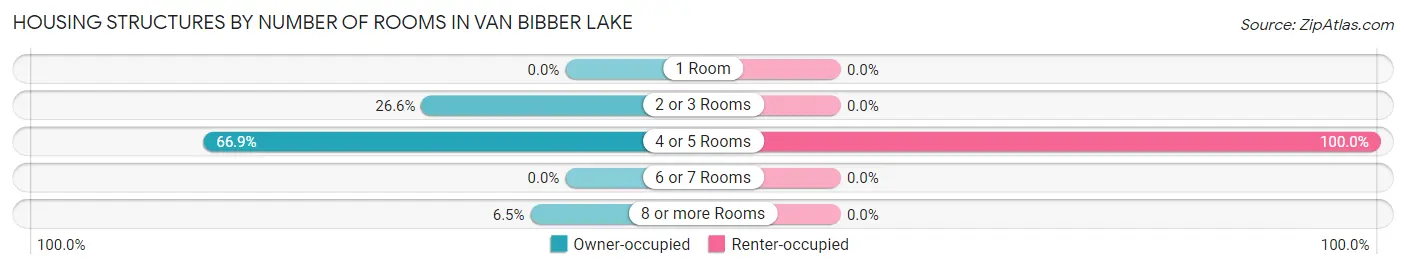
| Number of Rooms | Owner-occupied | Renter-occupied |
| 1 Room | 0 (0.0%) | 0 (0.0%) |
| 2 or 3 Rooms | 33 (26.6%) | 0 (0.0%) |
| 4 or 5 Rooms | 83 (66.9%) | 84 (100.0%) |
| 6 or 7 Rooms | 0 (0.0%) | 0 (0.0%) |
| 8 or more Rooms | 8 (6.5%) | 0 (0.0%) |
| Total | 124 (100.0%) | 84 (100.0%) |
Housing Structure by Heating Type in Van Bibber Lake
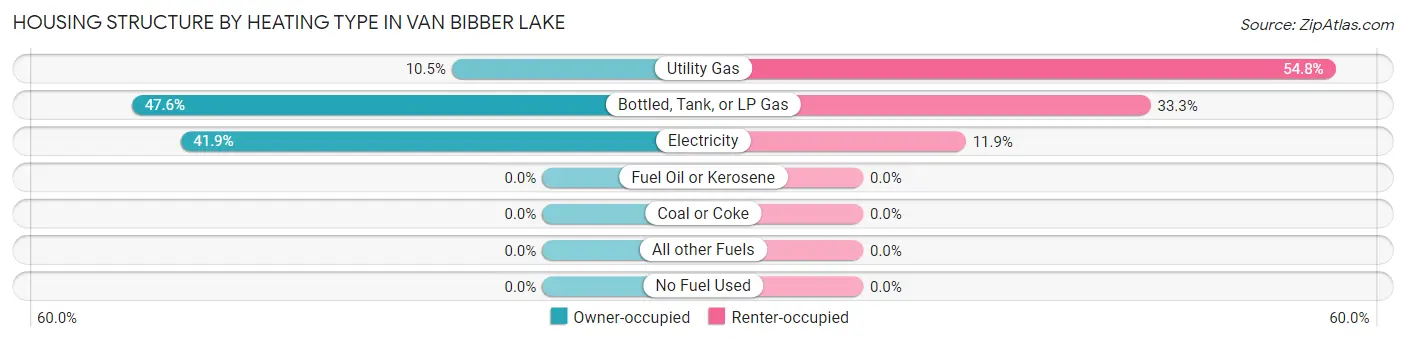
| Heating Type | Owner-occupied | Renter-occupied |
| Utility Gas | 13 (10.5%) | 46 (54.8%) |
| Bottled, Tank, or LP Gas | 59 (47.6%) | 28 (33.3%) |
| Electricity | 52 (41.9%) | 10 (11.9%) |
| Fuel Oil or Kerosene | 0 (0.0%) | 0 (0.0%) |
| Coal or Coke | 0 (0.0%) | 0 (0.0%) |
| All other Fuels | 0 (0.0%) | 0 (0.0%) |
| No Fuel Used | 0 (0.0%) | 0 (0.0%) |
| Total | 124 (100.0%) | 84 (100.0%) |
Household Vehicle Usage in Van Bibber Lake
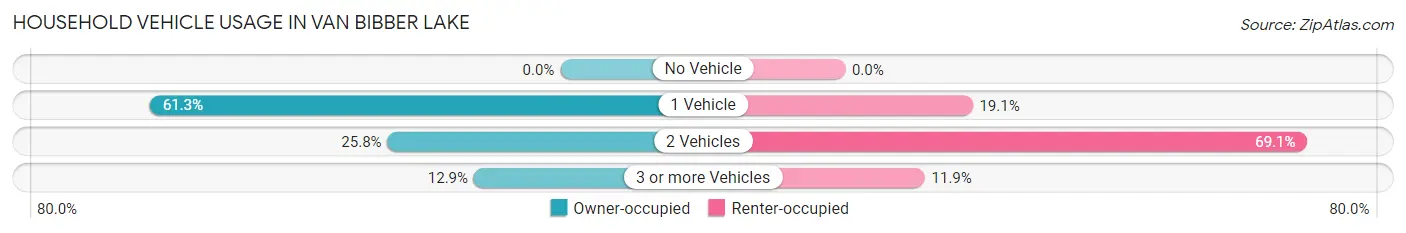
| Vehicles per Household | Owner-occupied | Renter-occupied |
| No Vehicle | 0 (0.0%) | 0 (0.0%) |
| 1 Vehicle | 76 (61.3%) | 16 (19.1%) |
| 2 Vehicles | 32 (25.8%) | 58 (69.1%) |
| 3 or more Vehicles | 16 (12.9%) | 10 (11.9%) |
| Total | 124 (100.0%) | 84 (100.0%) |
Real Estate & Mortgages in Van Bibber Lake
Real Estate and Mortgage Overview in Van Bibber Lake
| Characteristic | Without Mortgage | With Mortgage |
| Housing Units | 69 | 55 |
| Median Property Value | - | - |
| Median Household Income | - | - |
| Monthly Housing Costs | $405 | $0 |
| Real Estate Taxes | - | - |
Property Value by Mortgage Status in Van Bibber Lake
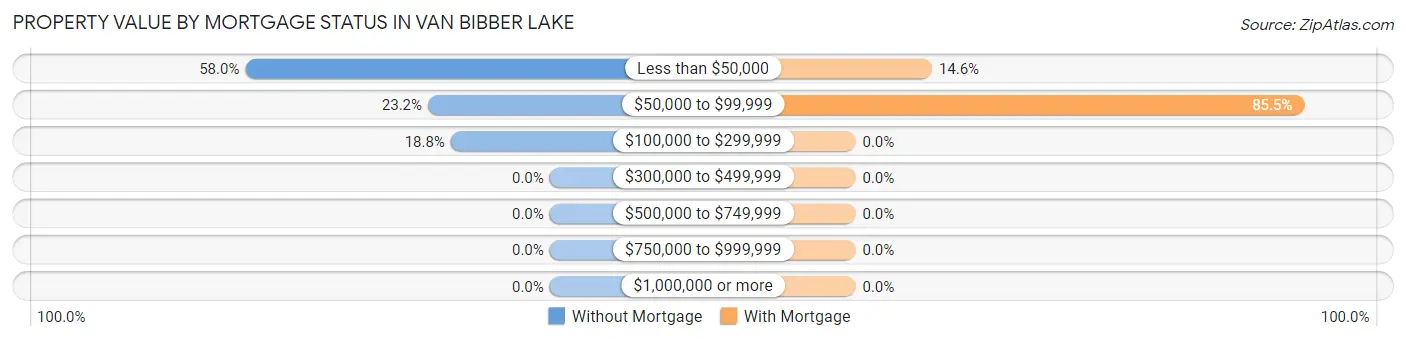
| Property Value | Without Mortgage | With Mortgage |
| Less than $50,000 | 40 (58.0%) | 8 (14.5%) |
| $50,000 to $99,999 | 16 (23.2%) | 47 (85.5%) |
| $100,000 to $299,999 | 13 (18.8%) | 0 (0.0%) |
| $300,000 to $499,999 | 0 (0.0%) | 0 (0.0%) |
| $500,000 to $749,999 | 0 (0.0%) | 0 (0.0%) |
| $750,000 to $999,999 | 0 (0.0%) | 0 (0.0%) |
| $1,000,000 or more | 0 (0.0%) | 0 (0.0%) |
| Total | 69 (100.0%) | 55 (100.0%) |
Household Income by Mortgage Status in Van Bibber Lake
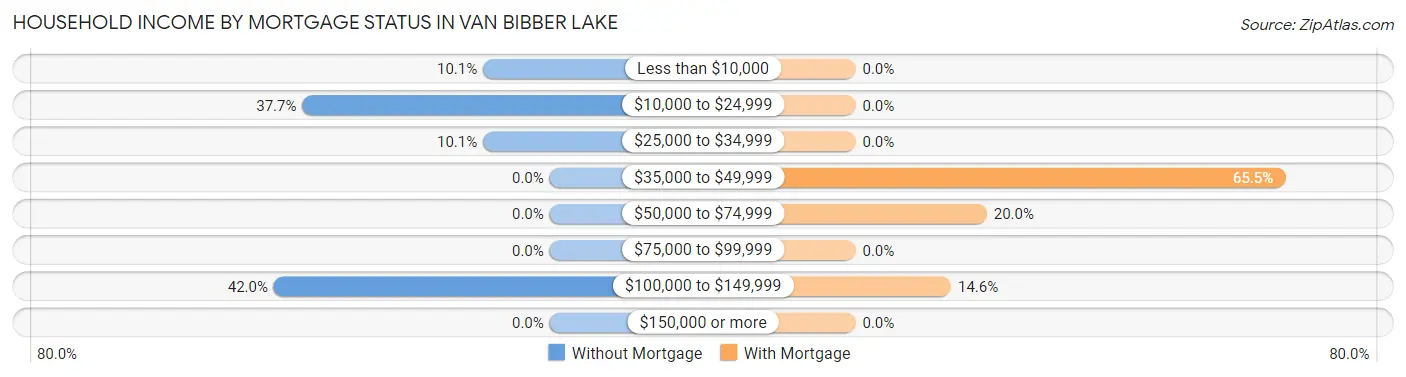
| Household Income | Without Mortgage | With Mortgage |
| Less than $10,000 | 7 (10.1%) | 0 (0.0%) |
| $10,000 to $24,999 | 26 (37.7%) | 0 (0.0%) |
| $25,000 to $34,999 | 7 (10.1%) | 0 (0.0%) |
| $35,000 to $49,999 | 0 (0.0%) | 36 (65.4%) |
| $50,000 to $74,999 | 0 (0.0%) | 11 (20.0%) |
| $75,000 to $99,999 | 0 (0.0%) | 0 (0.0%) |
| $100,000 to $149,999 | 29 (42.0%) | 8 (14.5%) |
| $150,000 or more | 0 (0.0%) | 0 (0.0%) |
| Total | 69 (100.0%) | 55 (100.0%) |
Property Value to Household Income Ratio in Van Bibber Lake
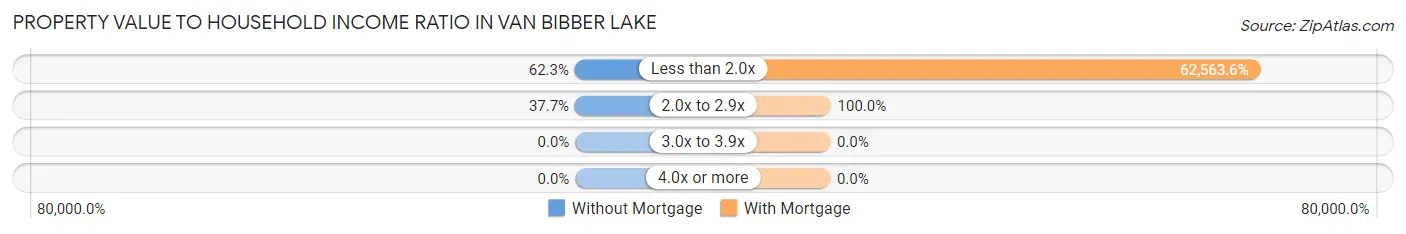
| Value-to-Income Ratio | Without Mortgage | With Mortgage |
| Less than 2.0x | 43 (62.3%) | 34,410 (62,563.6%) |
| 2.0x to 2.9x | 26 (37.7%) | 55 (100.0%) |
| 3.0x to 3.9x | 0 (0.0%) | 0 (0.0%) |
| 4.0x or more | 0 (0.0%) | 0 (0.0%) |
| Total | 69 (100.0%) | 55 (100.0%) |
Real Estate Taxes by Mortgage Status in Van Bibber Lake
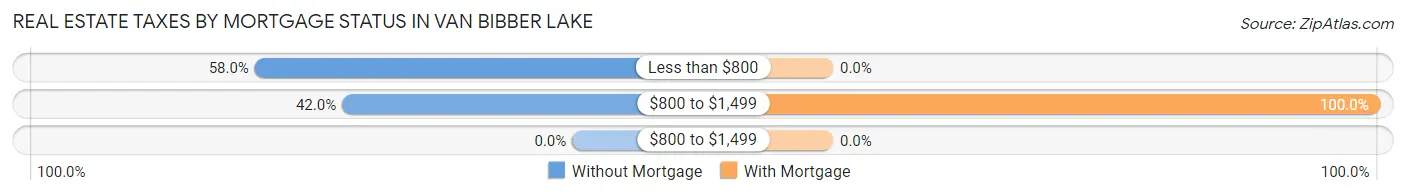
| Property Taxes | Without Mortgage | With Mortgage |
| Less than $800 | 40 (58.0%) | 0 (0.0%) |
| $800 to $1,499 | 29 (42.0%) | 55 (100.0%) |
| $800 to $1,499 | 0 (0.0%) | 0 (0.0%) |
| Total | 69 (100.0%) | 55 (100.0%) |
Health & Disability in Van Bibber Lake
Health Insurance Coverage by Age in Van Bibber Lake
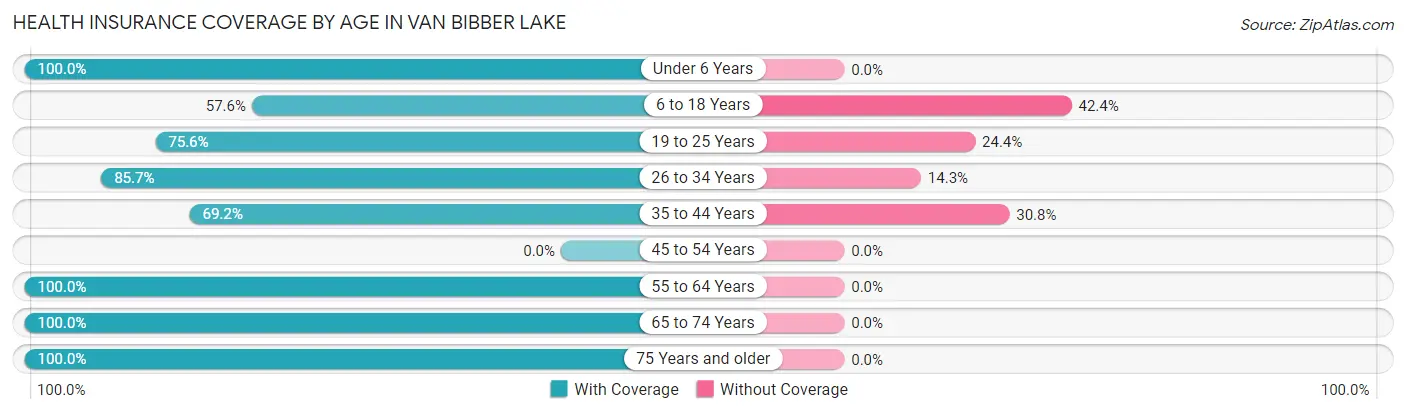
| Age Bracket | With Coverage | Without Coverage |
| Under 6 Years | 54 (100.0%) | 0 (0.0%) |
| 6 to 18 Years | 34 (57.6%) | 25 (42.4%) |
| 19 to 25 Years | 31 (75.6%) | 10 (24.4%) |
| 26 to 34 Years | 60 (85.7%) | 10 (14.3%) |
| 35 to 44 Years | 36 (69.2%) | 16 (30.8%) |
| 45 to 54 Years | 0 (0.0%) | 0 (0.0%) |
| 55 to 64 Years | 109 (100.0%) | 0 (0.0%) |
| 65 to 74 Years | 27 (100.0%) | 0 (0.0%) |
| 75 Years and older | 17 (100.0%) | 0 (0.0%) |
| Total | 368 (85.8%) | 61 (14.2%) |
Health Insurance Coverage by Citizenship Status in Van Bibber Lake
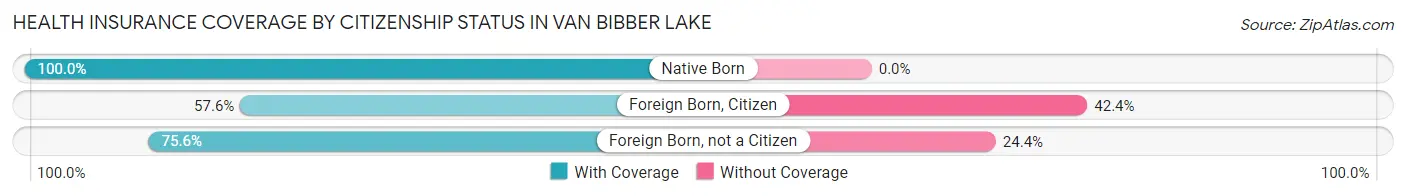
| Citizenship Status | With Coverage | Without Coverage |
| Native Born | 54 (100.0%) | 0 (0.0%) |
| Foreign Born, Citizen | 34 (57.6%) | 25 (42.4%) |
| Foreign Born, not a Citizen | 31 (75.6%) | 10 (24.4%) |
Health Insurance Coverage by Household Income in Van Bibber Lake
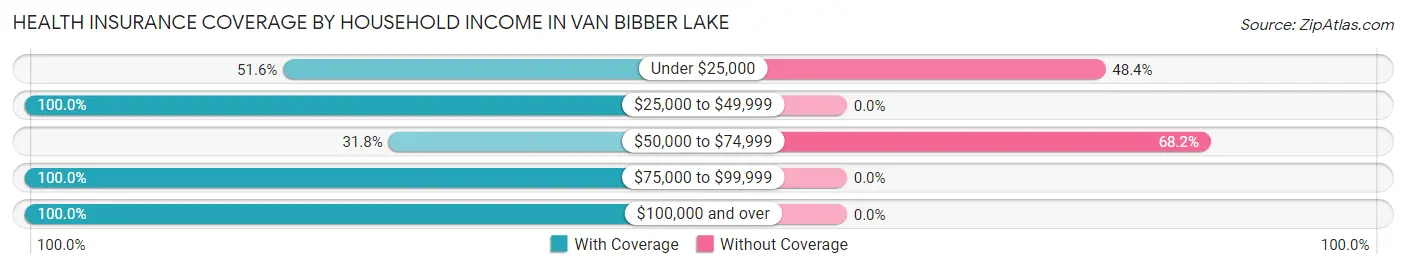
| Household Income | With Coverage | Without Coverage |
| Under $25,000 | 33 (51.6%) | 31 (48.4%) |
| $25,000 to $49,999 | 248 (100.0%) | 0 (0.0%) |
| $50,000 to $74,999 | 14 (31.8%) | 30 (68.2%) |
| $75,000 to $99,999 | 16 (100.0%) | 0 (0.0%) |
| $100,000 and over | 57 (100.0%) | 0 (0.0%) |
Public vs Private Health Insurance Coverage by Age in Van Bibber Lake
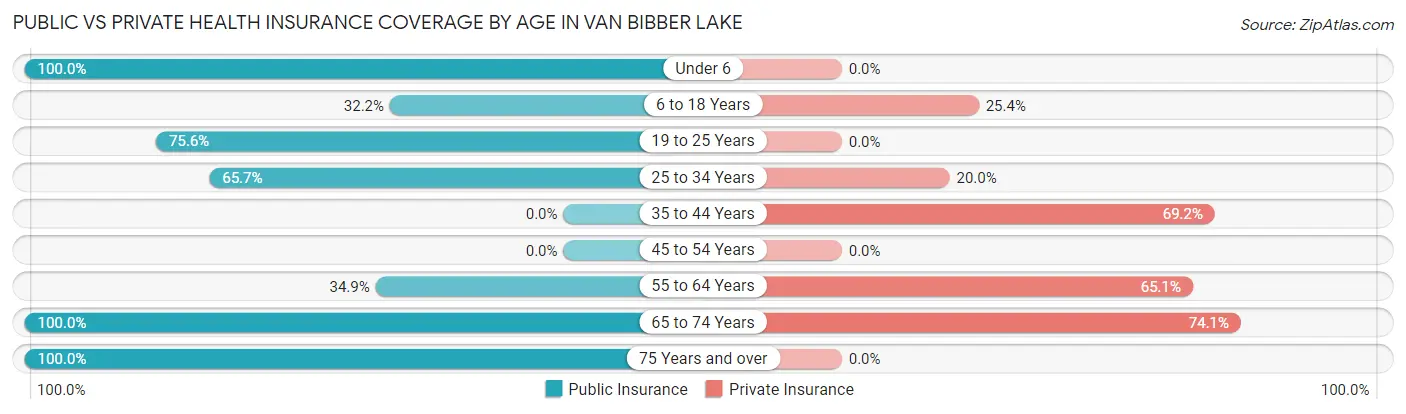
| Age Bracket | Public Insurance | Private Insurance |
| Under 6 | 54 (100.0%) | 0 (0.0%) |
| 6 to 18 Years | 19 (32.2%) | 15 (25.4%) |
| 19 to 25 Years | 31 (75.6%) | 0 (0.0%) |
| 25 to 34 Years | 46 (65.7%) | 14 (20.0%) |
| 35 to 44 Years | 0 (0.0%) | 36 (69.2%) |
| 45 to 54 Years | 0 (0.0%) | 0 (0.0%) |
| 55 to 64 Years | 38 (34.9%) | 71 (65.1%) |
| 65 to 74 Years | 27 (100.0%) | 20 (74.1%) |
| 75 Years and over | 17 (100.0%) | 0 (0.0%) |
| Total | 232 (54.1%) | 156 (36.4%) |
Disability Status by Sex by Age in Van Bibber Lake
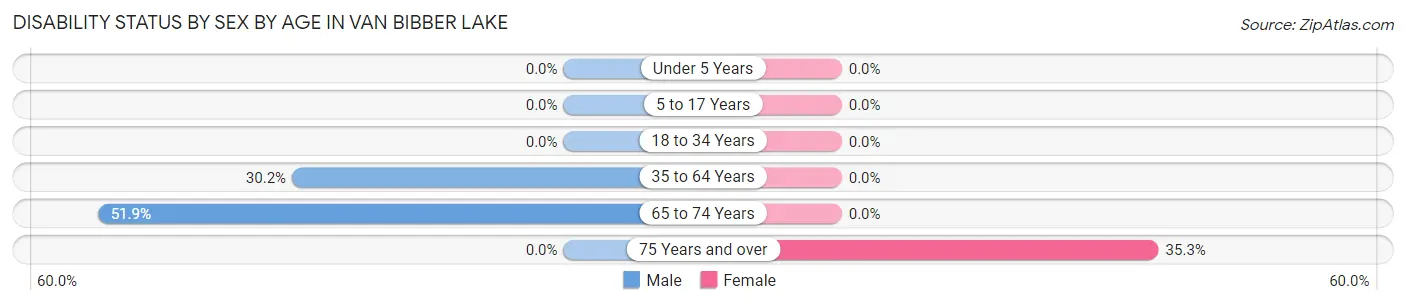
| Age Bracket | Male | Female |
| Under 5 Years | 0 (0.0%) | 0 (0.0%) |
| 5 to 17 Years | 0 (0.0%) | 0 (0.0%) |
| 18 to 34 Years | 0 (0.0%) | 0 (0.0%) |
| 35 to 64 Years | 26 (30.2%) | 0 (0.0%) |
| 65 to 74 Years | 14 (51.8%) | 0 (0.0%) |
| 75 Years and over | 0 (0.0%) | 6 (35.3%) |
Disability Class by Sex by Age in Van Bibber Lake
Disability Class: Hearing Difficulty
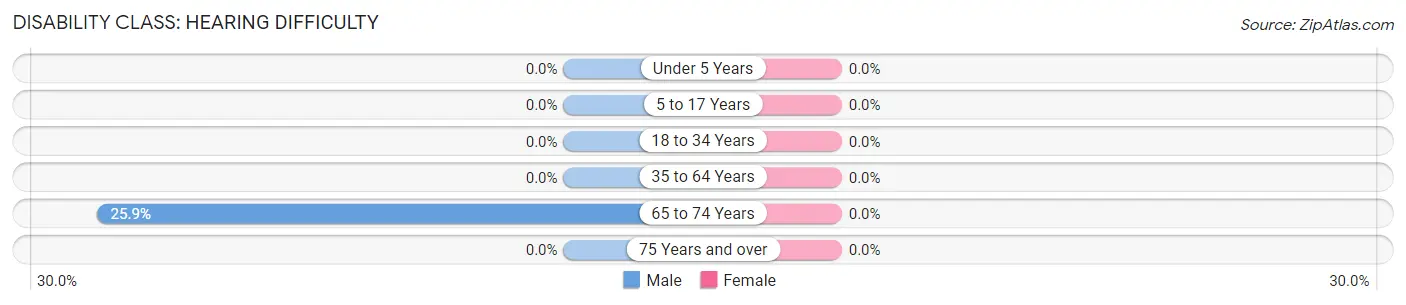
| Age Bracket | Male | Female |
| Under 5 Years | 0 (0.0%) | 0 (0.0%) |
| 5 to 17 Years | 0 (0.0%) | 0 (0.0%) |
| 18 to 34 Years | 0 (0.0%) | 0 (0.0%) |
| 35 to 64 Years | 0 (0.0%) | 0 (0.0%) |
| 65 to 74 Years | 7 (25.9%) | 0 (0.0%) |
| 75 Years and over | 0 (0.0%) | 0 (0.0%) |
Disability Class: Vision Difficulty
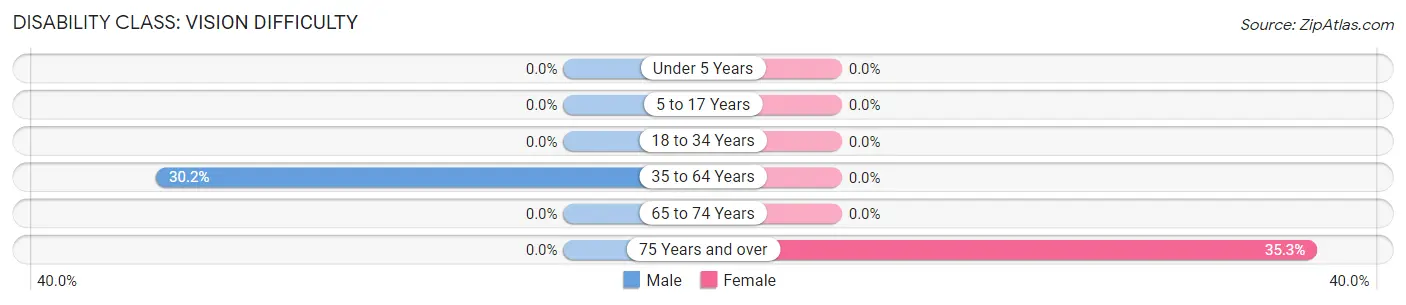
| Age Bracket | Male | Female |
| Under 5 Years | 0 (0.0%) | 0 (0.0%) |
| 5 to 17 Years | 0 (0.0%) | 0 (0.0%) |
| 18 to 34 Years | 0 (0.0%) | 0 (0.0%) |
| 35 to 64 Years | 26 (30.2%) | 0 (0.0%) |
| 65 to 74 Years | 0 (0.0%) | 0 (0.0%) |
| 75 Years and over | 0 (0.0%) | 6 (35.3%) |
Disability Class: Cognitive Difficulty
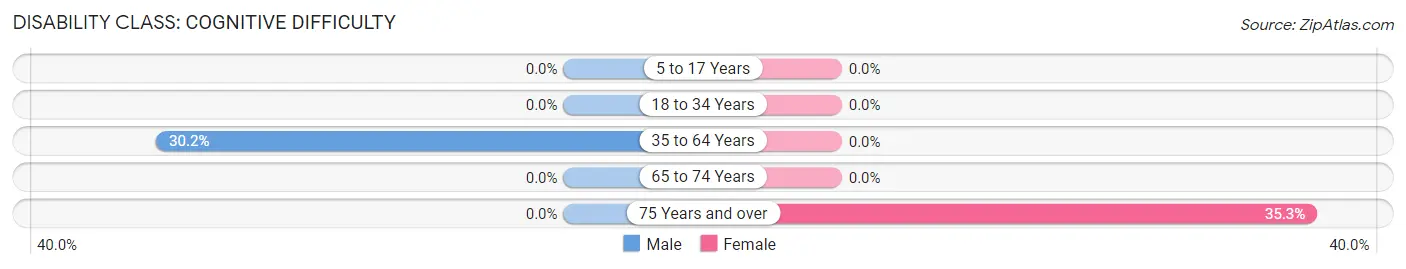
| Age Bracket | Male | Female |
| 5 to 17 Years | 0 (0.0%) | 0 (0.0%) |
| 18 to 34 Years | 0 (0.0%) | 0 (0.0%) |
| 35 to 64 Years | 26 (30.2%) | 0 (0.0%) |
| 65 to 74 Years | 0 (0.0%) | 0 (0.0%) |
| 75 Years and over | 0 (0.0%) | 6 (35.3%) |
Disability Class: Ambulatory Difficulty

| Age Bracket | Male | Female |
| 5 to 17 Years | 0 (0.0%) | 0 (0.0%) |
| 18 to 34 Years | 0 (0.0%) | 0 (0.0%) |
| 35 to 64 Years | 26 (30.2%) | 0 (0.0%) |
| 65 to 74 Years | 14 (51.8%) | 0 (0.0%) |
| 75 Years and over | 0 (0.0%) | 6 (35.3%) |
Disability Class: Self-Care Difficulty
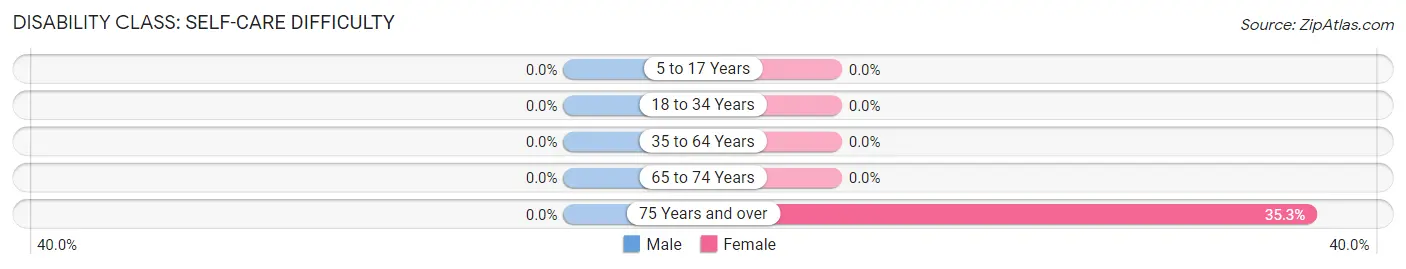
| Age Bracket | Male | Female |
| 5 to 17 Years | 0 (0.0%) | 0 (0.0%) |
| 18 to 34 Years | 0 (0.0%) | 0 (0.0%) |
| 35 to 64 Years | 0 (0.0%) | 0 (0.0%) |
| 65 to 74 Years | 0 (0.0%) | 0 (0.0%) |
| 75 Years and over | 0 (0.0%) | 6 (35.3%) |
Technology Access in Van Bibber Lake
Computing Device Access in Van Bibber Lake
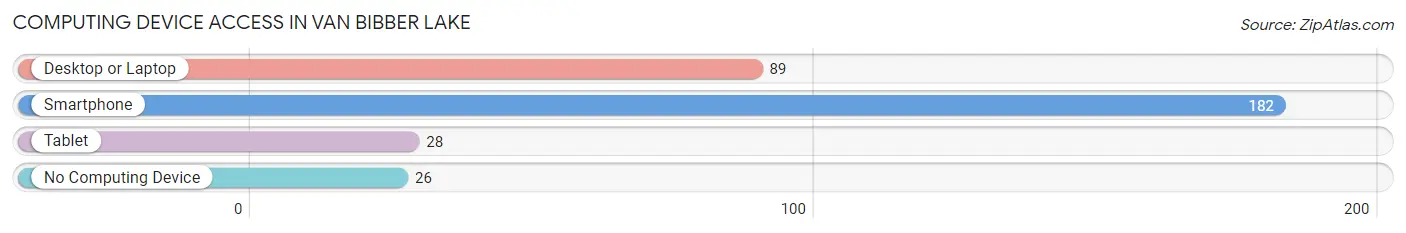
| Device Type | # Households | % Households |
| Desktop or Laptop | 89 | 42.8% |
| Smartphone | 182 | 87.5% |
| Tablet | 28 | 13.5% |
| No Computing Device | 26 | 12.5% |
| Total | 208 | 100.0% |
Internet Access in Van Bibber Lake
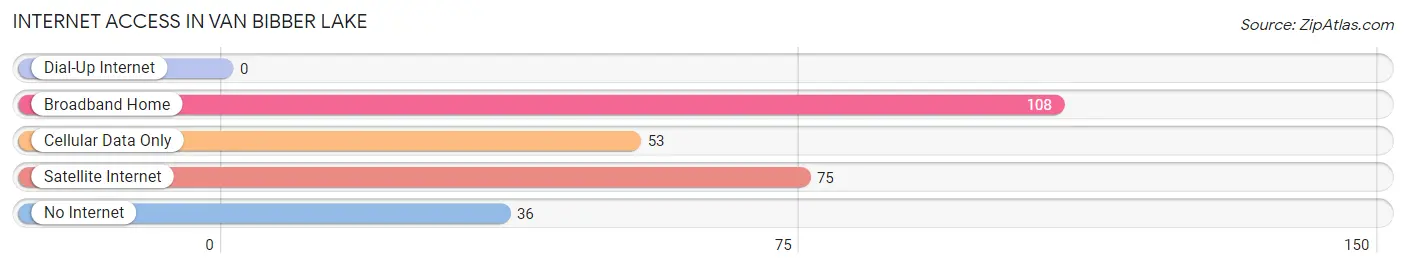
| Internet Type | # Households | % Households |
| Dial-Up Internet | 0 | 0.0% |
| Broadband Home | 108 | 51.9% |
| Cellular Data Only | 53 | 25.5% |
| Satellite Internet | 75 | 36.1% |
| No Internet | 36 | 17.3% |
| Total | 208 | 100.0% |
Van Bibber Lake Summary
Bibber Lake is a small lake located in the state of Indiana, in the United States. It is located in the northern part of the state, in the county of Porter. The lake is approximately 1,000 acres in size and is surrounded by a variety of natural habitats, including wetlands, woodlands, and prairies. The lake is a popular destination for fishing, boating, and other recreational activities.
Geography
Bibber Lake is located in the northern part of Indiana, in the county of Porter. The lake is approximately 1,000 acres in size and is surrounded by a variety of natural habitats, including wetlands, woodlands, and prairies. The lake is fed by several small streams, including the Little Calumet River, which flows into the lake from the south. The lake is also connected to the Kankakee River, which flows into the lake from the north. The lake is located at an elevation of approximately 690 feet above sea level.
Economy
Bibber Lake is a popular destination for fishing, boating, and other recreational activities. The lake is home to a variety of fish species, including largemouth bass, bluegill, crappie, and catfish. The lake is also popular for swimming, canoeing, and kayaking. There are several marinas located around the lake, which offer boat rentals and other services. In addition, there are several campgrounds located around the lake, which offer camping and other recreational activities.
Demographics
The population of Bibber Lake is relatively small, with an estimated population of just over 500 people in 2020. The majority of the population is white, with a small percentage of African Americans and other minority groups. The median household income in the area is approximately $50,000, and the median age is around 40 years old.
History
Bibber Lake has a long and interesting history. The lake was originally created in the late 1800s, when a dam was built on the Little Calumet River. The lake was used for recreational activities, such as fishing and boating, and was also used for commercial purposes, such as logging and milling. In the early 1900s, the lake was used as a source of drinking water for the city of Valparaiso. In the 1950s, the lake was used as a source of hydroelectric power. In the 1970s, the lake was designated as a state park, and it remains a popular destination for recreational activities today.
Conclusion
Bibber Lake is a small lake located in the state of Indiana, in the United States. It is located in the northern part of the state, in the county of Porter. The lake is approximately 1,000 acres in size and is surrounded by a variety of natural habitats, including wetlands, woodlands, and prairies. The lake is a popular destination for fishing, boating, and other recreational activities. The population of Bibber Lake is relatively small, with an estimated population of just over 500 people in 2020. The majority of the population is white, with a small percentage of African Americans and other minority groups. The lake has a long and interesting history, and it remains a popular destination for recreational activities today.
Common Questions
What is Per Capita Income in Van Bibber Lake?
Per Capita income in Van Bibber Lake is $21,144.
What is the Median Family Income in Van Bibber Lake?
Median Family Income in Van Bibber Lake is $32,255.
What is the Median Household income in Van Bibber Lake?
Median Household Income in Van Bibber Lake is $33,056.
What is Income or Wage Gap in Van Bibber Lake?
Income or Wage Gap in Van Bibber Lake is 36.8%.
Women in Van Bibber Lake earn 63.2 cents for every dollar earned by a man.
What is Inequality or Gini Index in Van Bibber Lake?
Inequality or Gini Index in Van Bibber Lake is 0.40.
What is the Total Population of Van Bibber Lake?
Total Population of Van Bibber Lake is 429.
What is the Total Male Population of Van Bibber Lake?
Total Male Population of Van Bibber Lake is 276.
What is the Total Female Population of Van Bibber Lake?
Total Female Population of Van Bibber Lake is 153.
What is the Ratio of Males per 100 Females in Van Bibber Lake?
There are 180.39 Males per 100 Females in Van Bibber Lake.
What is the Ratio of Females per 100 Males in Van Bibber Lake?
There are 55.43 Females per 100 Males in Van Bibber Lake.
What is the Median Population Age in Van Bibber Lake?
Median Population Age in Van Bibber Lake is 34.8 Years.
What is the Average Family Size in Van Bibber Lake
Average Family Size in Van Bibber Lake is 2.2 People.
What is the Average Household Size in Van Bibber Lake
Average Household Size in Van Bibber Lake is 2.1 People.
How Large is the Labor Force in Van Bibber Lake?
There are 194 People in the Labor Forcein in Van Bibber Lake.
What is the Percentage of People in the Labor Force in Van Bibber Lake?
53.7% of People are in the Labor Force in Van Bibber Lake.