Cambridge, MD Map & Demographics
Cambridge Map
Cambridge Overview
$27,408
PER CAPITA INCOME
$54,532
AVG FAMILY INCOME
$44,114
AVG HOUSEHOLD INCOME
20.0%
WAGE / INCOME GAP [ % ]
80.0¢/ $1
WAGE / INCOME GAP [ $ ]
$11,036
FAMILY INCOME DEFICIT
0.48
INEQUALITY / GINI INDEX
13,058
TOTAL POPULATION
6,307
MALE POPULATION
6,751
FEMALE POPULATION
93.42
MALES / 100 FEMALES
107.04
FEMALES / 100 MALES
37.3
MEDIAN AGE
3.2
AVG FAMILY SIZE
2.4
AVG HOUSEHOLD SIZE
6,251
LABOR FORCE [ PEOPLE ]
60.3%
PERCENT IN LABOR FORCE
7.2%
UNEMPLOYMENT RATE
Cambridge Zip Codes
Income in Cambridge
Income Overview in Cambridge
Per Capita Income in Cambridge is $27,408, while median incomes of families and households are $54,532 and $44,114 respectively.
| Characteristic | Number | Measure |
| Per Capita Income | 13,058 | $27,408 |
| Median Family Income | 2,931 | $54,532 |
| Mean Family Income | 2,931 | $79,411 |
| Median Household Income | 5,314 | $44,114 |
| Mean Household Income | 5,314 | $64,331 |
| Income Deficit | 2,931 | $11,036 |
| Wage / Income Gap (%) | 13,058 | 19.98% |
| Wage / Income Gap ($) | 13,058 | 80.02¢ per $1 |
| Gini / Inequality Index | 13,058 | 0.48 |
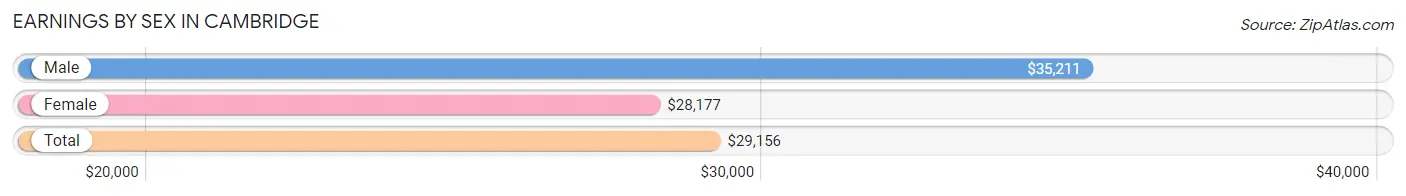
Earnings by Sex in Cambridge
Average Earnings in Cambridge are $29,156, $35,211 for men and $28,177 for women, a difference of 20.0%.
| Sex | Number | Average Earnings |
| Male | 2,982 (46.0%) | $35,211 |
| Female | 3,508 (54.0%) | $28,177 |
| Total | 6,490 (100.0%) | $29,156 |
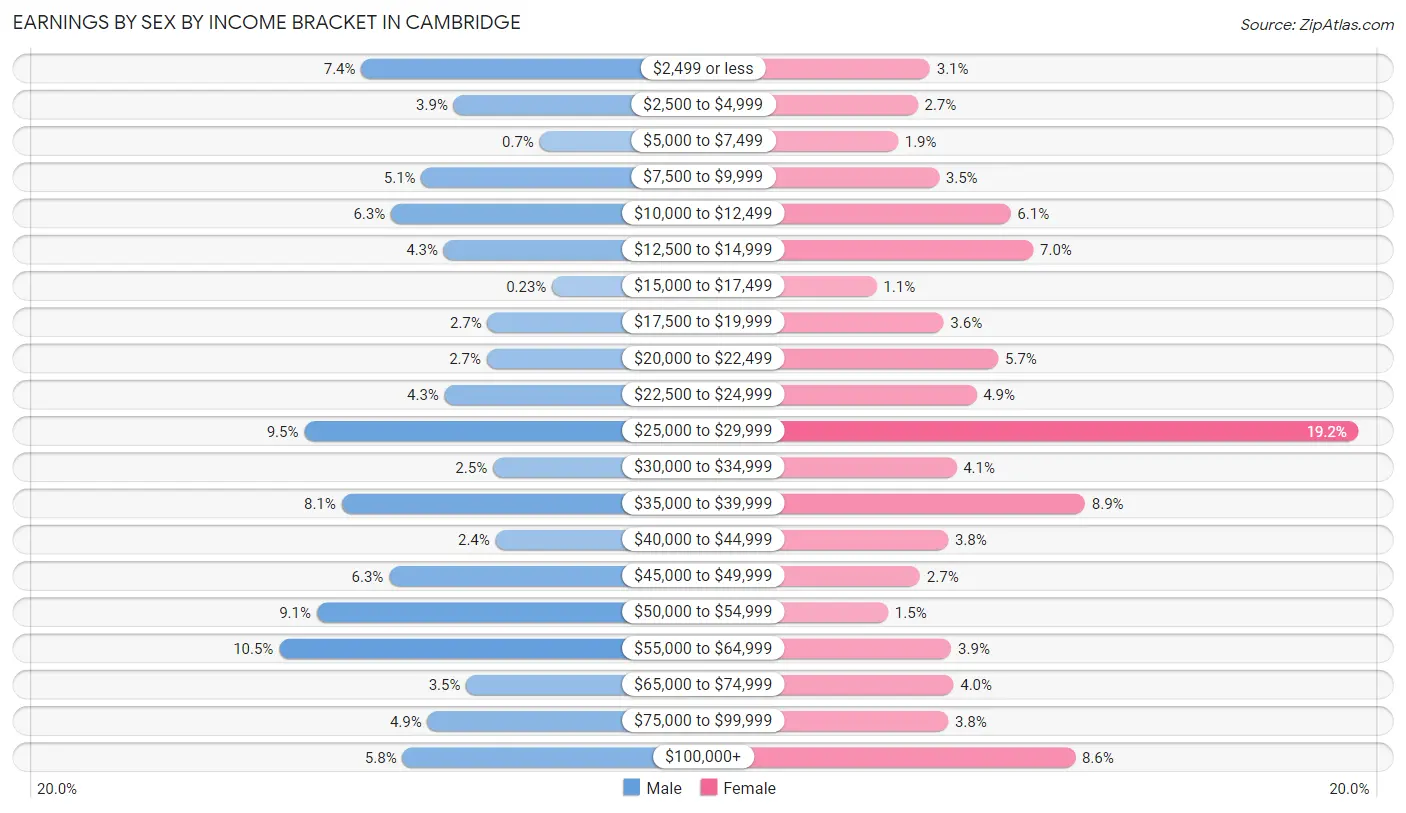
Earnings by Sex by Income Bracket in Cambridge
The most common earnings brackets in Cambridge are $55,000 to $64,999 for men (312 | 10.5%) and $25,000 to $29,999 for women (673 | 19.2%).
| Income | Male | Female |
| $2,499 or less | 220 (7.4%) | 109 (3.1%) |
| $2,500 to $4,999 | 117 (3.9%) | 93 (2.6%) |
| $5,000 to $7,499 | 21 (0.7%) | 67 (1.9%) |
| $7,500 to $9,999 | 153 (5.1%) | 121 (3.5%) |
| $10,000 to $12,499 | 187 (6.3%) | 215 (6.1%) |
| $12,500 to $14,999 | 128 (4.3%) | 245 (7.0%) |
| $15,000 to $17,499 | 7 (0.2%) | 39 (1.1%) |
| $17,500 to $19,999 | 79 (2.6%) | 127 (3.6%) |
| $20,000 to $22,499 | 80 (2.7%) | 199 (5.7%) |
| $22,500 to $24,999 | 127 (4.3%) | 170 (4.9%) |
| $25,000 to $29,999 | 284 (9.5%) | 673 (19.2%) |
| $30,000 to $34,999 | 73 (2.5%) | 144 (4.1%) |
| $35,000 to $39,999 | 242 (8.1%) | 313 (8.9%) |
| $40,000 to $44,999 | 70 (2.4%) | 133 (3.8%) |
| $45,000 to $49,999 | 189 (6.3%) | 96 (2.7%) |
| $50,000 to $54,999 | 270 (9.0%) | 54 (1.5%) |
| $55,000 to $64,999 | 312 (10.5%) | 137 (3.9%) |
| $65,000 to $74,999 | 103 (3.5%) | 140 (4.0%) |
| $75,000 to $99,999 | 146 (4.9%) | 133 (3.8%) |
| $100,000+ | 174 (5.8%) | 300 (8.6%) |
| Total | 2,982 (100.0%) | 3,508 (100.0%) |
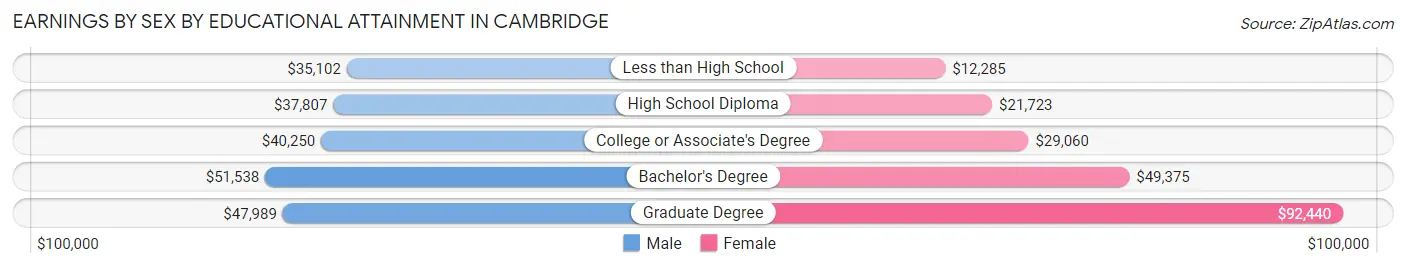
Earnings by Sex by Educational Attainment in Cambridge
Average earnings in Cambridge are $39,151 for men and $29,043 for women, a difference of 25.8%. Men with an educational attainment of bachelor's degree enjoy the highest average annual earnings of $51,538, while those with less than high school education earn the least with $35,102. Women with an educational attainment of graduate degree earn the most with the average annual earnings of $92,440, while those with less than high school education have the smallest earnings of $12,285.
| Educational Attainment | Male Income | Female Income |
| Less than High School | $35,102 | $12,285 |
| High School Diploma | $37,807 | $21,723 |
| College or Associate's Degree | $40,250 | $29,060 |
| Bachelor's Degree | $51,538 | $49,375 |
| Graduate Degree | $47,989 | $92,440 |
| Total | $39,151 | $29,043 |
Family Income in Cambridge
Family Income Brackets in Cambridge
According to the Cambridge family income data, there are 604 families falling into the $35,000 to $49,999 income range, which is the most common income bracket and makes up 20.6% of all families. Conversely, the $10,000 to $14,999 income bracket is the least frequent group with only 111 families (3.8%) belonging to this category.
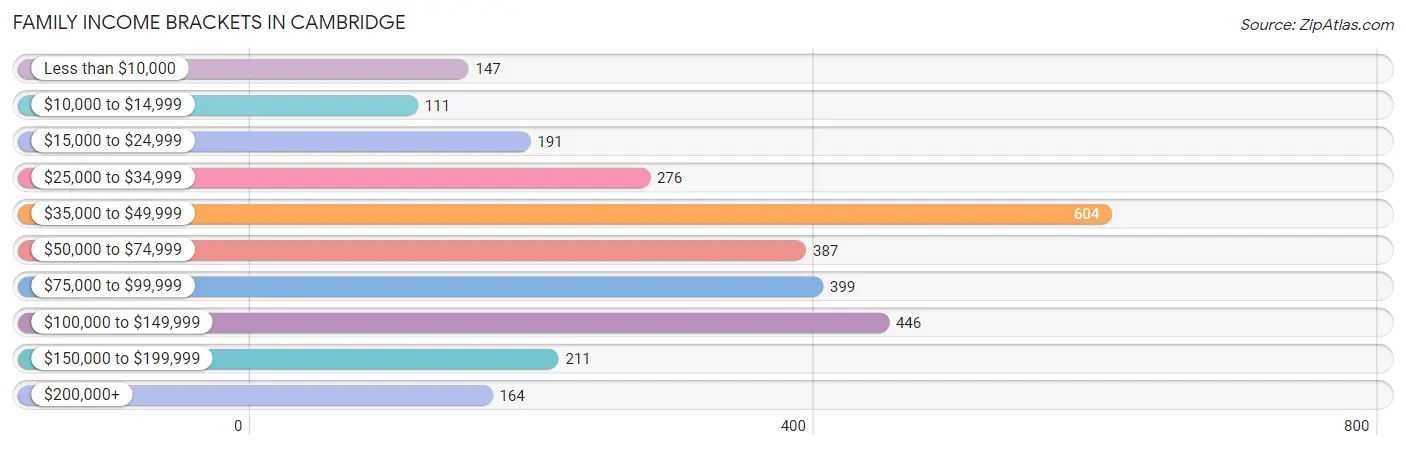
| Income Bracket | # Families | % Families |
| Less than $10,000 | 147 | 5.0% |
| $10,000 to $14,999 | 111 | 3.8% |
| $15,000 to $24,999 | 191 | 6.5% |
| $25,000 to $34,999 | 276 | 9.4% |
| $35,000 to $49,999 | 604 | 20.6% |
| $50,000 to $74,999 | 387 | 13.2% |
| $75,000 to $99,999 | 399 | 13.6% |
| $100,000 to $149,999 | 446 | 15.2% |
| $150,000 to $199,999 | 211 | 7.2% |
| $200,000+ | 164 | 5.6% |
Family Income by Famaliy Size in Cambridge
5-person families (76 | 2.6%) account for the highest median family income in Cambridge with $140,676 per family, while 5-person families (76 | 2.6%) have the highest median income of $28,135 per family member.
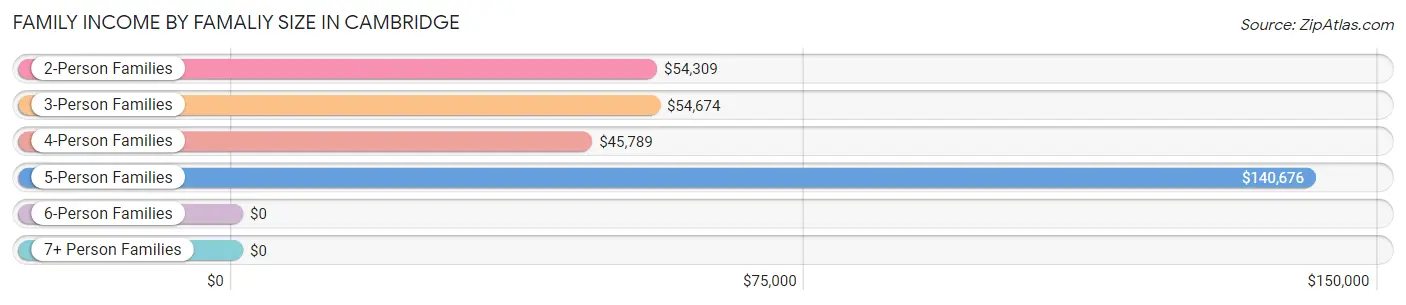
| Income Bracket | # Families | Median Income |
| 2-Person Families | 1,442 (49.2%) | $54,309 |
| 3-Person Families | 734 (25.0%) | $54,674 |
| 4-Person Families | 664 (22.7%) | $45,789 |
| 5-Person Families | 76 (2.6%) | $140,676 |
| 6-Person Families | 0 (0.0%) | $0 |
| 7+ Person Families | 15 (0.5%) | $0 |
| Total | 2,931 (100.0%) | $54,532 |
Family Income by Number of Earners in Cambridge
The median family income in Cambridge is $54,532, with families comprising 3+ earners (369) having the highest median family income of $126,985, while families with no earners (386) have the lowest median family income of $34,167, accounting for 12.6% and 13.2% of families, respectively.
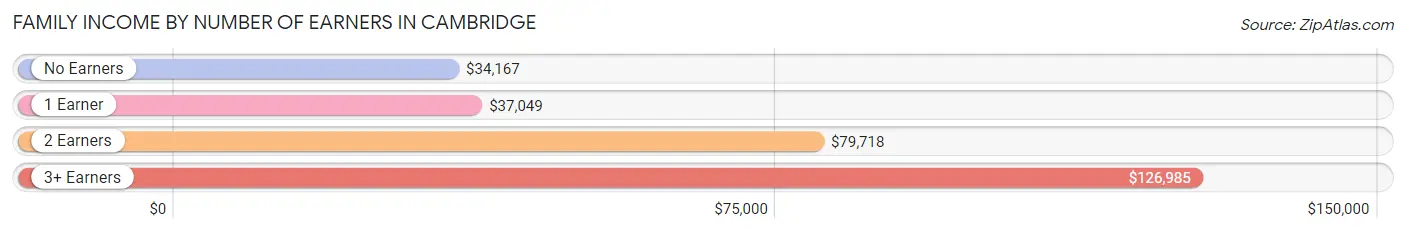
| Number of Earners | # Families | Median Income |
| No Earners | 386 (13.2%) | $34,167 |
| 1 Earner | 1,188 (40.5%) | $37,049 |
| 2 Earners | 988 (33.7%) | $79,718 |
| 3+ Earners | 369 (12.6%) | $126,985 |
| Total | 2,931 (100.0%) | $54,532 |
Household Income in Cambridge
Household Income Brackets in Cambridge
With 882 households falling in the category, the $50,000 to $74,999 income range is the most frequent in Cambridge, accounting for 16.6% of all households. In contrast, only 181 households (3.4%) fall into the $200,000+ income bracket, making it the least populous group.
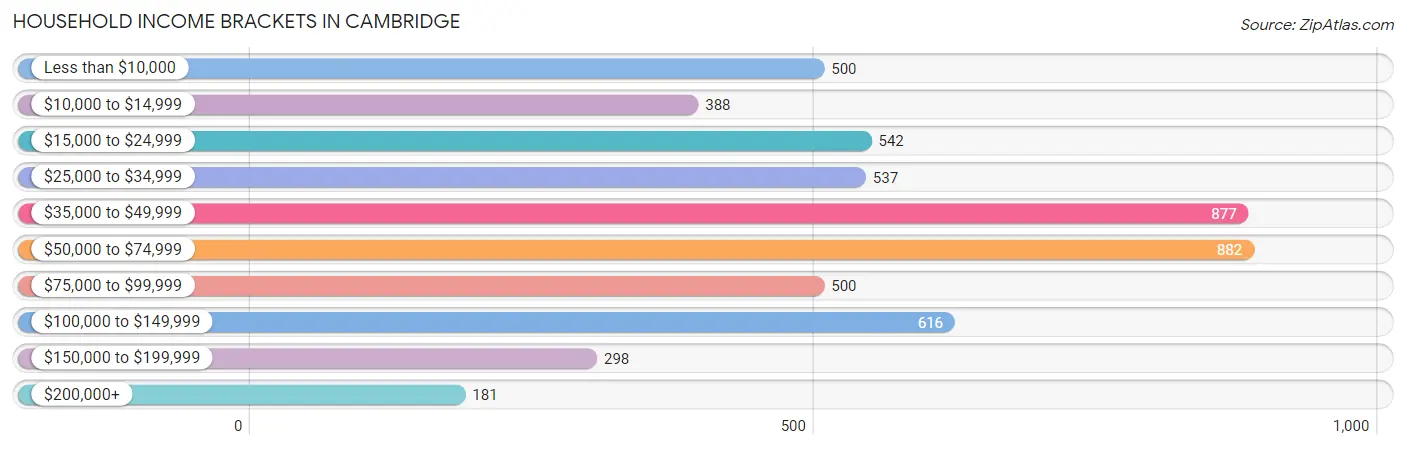
| Income Bracket | # Households | % Households |
| Less than $10,000 | 500 | 9.4% |
| $10,000 to $14,999 | 388 | 7.3% |
| $15,000 to $24,999 | 542 | 10.2% |
| $25,000 to $34,999 | 537 | 10.1% |
| $35,000 to $49,999 | 877 | 16.5% |
| $50,000 to $74,999 | 882 | 16.6% |
| $75,000 to $99,999 | 500 | 9.4% |
| $100,000 to $149,999 | 616 | 11.6% |
| $150,000 to $199,999 | 298 | 5.6% |
| $200,000+ | 181 | 3.4% |
Household Income by Householder Age in Cambridge
The median household income in Cambridge is $44,114, with the highest median household income of $71,080 found in the 45 to 64 years age bracket for the primary householder. A total of 1,691 households (31.8%) fall into this category. Meanwhile, the 25 to 44 years age bracket for the primary householder has the lowest median household income of $36,830, with 1,948 households (36.7%) in this group.
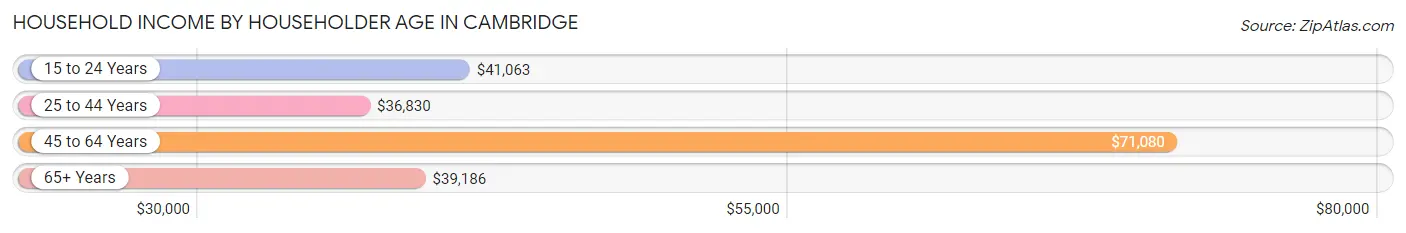
| Income Bracket | # Households | Median Income |
| 15 to 24 Years | 46 (0.9%) | $41,063 |
| 25 to 44 Years | 1,948 (36.7%) | $36,830 |
| 45 to 64 Years | 1,691 (31.8%) | $71,080 |
| 65+ Years | 1,629 (30.6%) | $39,186 |
| Total | 5,314 (100.0%) | $44,114 |
Poverty in Cambridge
Income Below Poverty by Sex and Age in Cambridge
With 20.7% poverty level for males and 23.6% for females among the residents of Cambridge, under 5 year old males and under 5 year old females are the most vulnerable to poverty, with 297 males (50.1%) and 186 females (59.8%) in their respective age groups living below the poverty level.
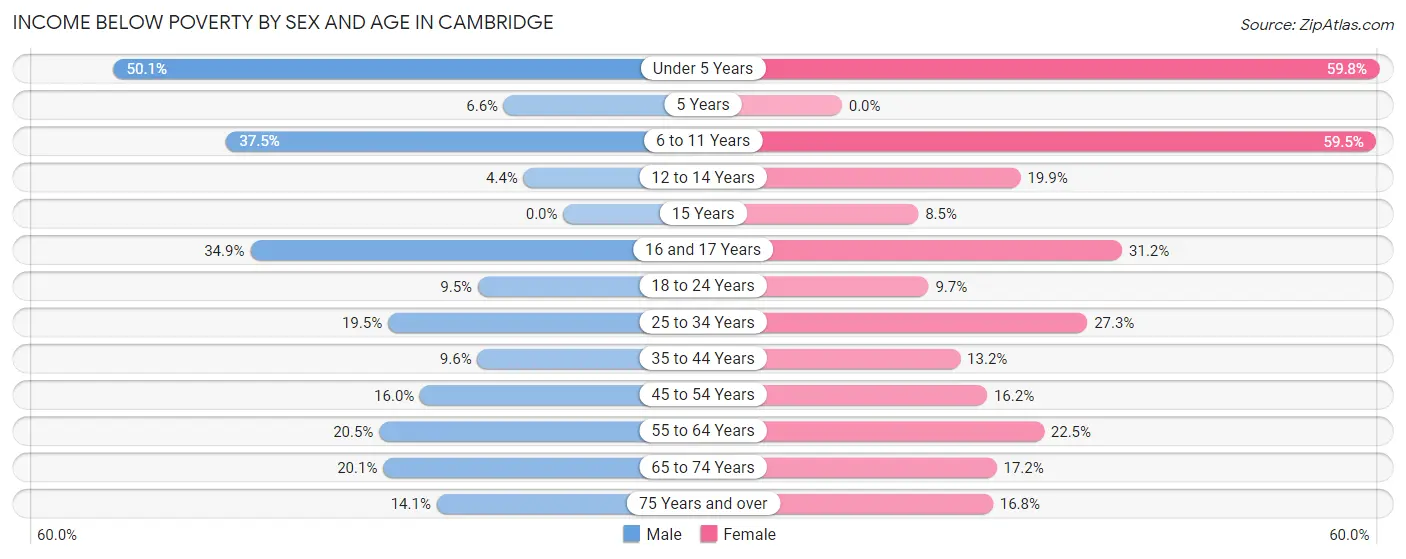
| Age Bracket | Male | Female |
| Under 5 Years | 297 (50.1%) | 186 (59.8%) |
| 5 Years | 10 (6.6%) | 0 (0.0%) |
| 6 to 11 Years | 194 (37.5%) | 258 (59.5%) |
| 12 to 14 Years | 10 (4.4%) | 39 (19.9%) |
| 15 Years | 0 (0.0%) | 8 (8.5%) |
| 16 and 17 Years | 53 (34.9%) | 118 (31.2%) |
| 18 to 24 Years | 56 (9.5%) | 36 (9.7%) |
| 25 to 34 Years | 167 (19.5%) | 293 (27.3%) |
| 35 to 44 Years | 56 (9.6%) | 121 (13.2%) |
| 45 to 54 Years | 85 (16.0%) | 113 (16.2%) |
| 55 to 64 Years | 137 (20.5%) | 164 (22.5%) |
| 65 to 74 Years | 129 (20.1%) | 162 (17.2%) |
| 75 Years and over | 66 (14.1%) | 73 (16.8%) |
| Total | 1,260 (20.7%) | 1,571 (23.6%) |
Income Above Poverty by Sex and Age in Cambridge
According to the poverty statistics in Cambridge, males aged 15 years and females aged 5 years are the age groups that are most secure financially, with 100.0% of males and 100.0% of females in these age groups living above the poverty line.
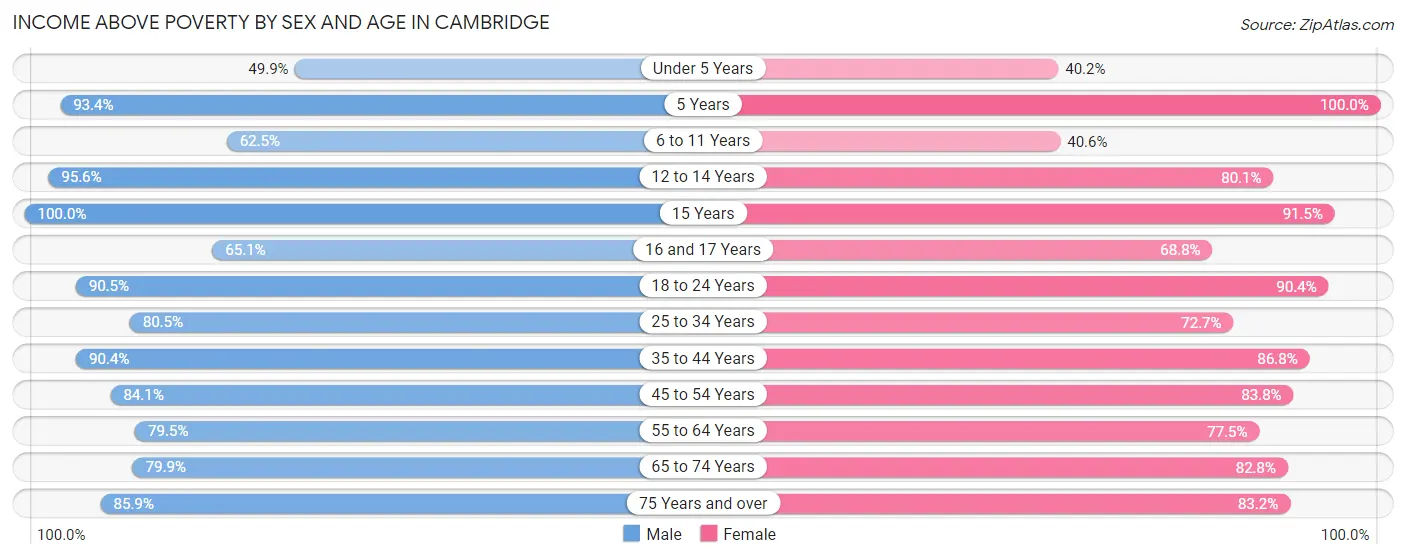
| Age Bracket | Male | Female |
| Under 5 Years | 296 (49.9%) | 125 (40.2%) |
| 5 Years | 141 (93.4%) | 71 (100.0%) |
| 6 to 11 Years | 323 (62.5%) | 176 (40.6%) |
| 12 to 14 Years | 216 (95.6%) | 157 (80.1%) |
| 15 Years | 92 (100.0%) | 86 (91.5%) |
| 16 and 17 Years | 99 (65.1%) | 260 (68.8%) |
| 18 to 24 Years | 533 (90.5%) | 337 (90.3%) |
| 25 to 34 Years | 688 (80.5%) | 779 (72.7%) |
| 35 to 44 Years | 530 (90.4%) | 797 (86.8%) |
| 45 to 54 Years | 448 (84.1%) | 586 (83.8%) |
| 55 to 64 Years | 531 (79.5%) | 565 (77.5%) |
| 65 to 74 Years | 514 (79.9%) | 778 (82.8%) |
| 75 Years and over | 402 (85.9%) | 361 (83.2%) |
| Total | 4,813 (79.2%) | 5,078 (76.4%) |
Income Below Poverty Among Married-Couple Families in Cambridge
The poverty statistics for married-couple families in Cambridge show that 4.3% or 64 of the total 1,489 families live below the poverty line. Families with 1 or 2 children have the highest poverty rate of 8.8%, comprising of 38 families. On the other hand, families with 3 or 4 children have the lowest poverty rate of 0.0%, which includes 0 families.
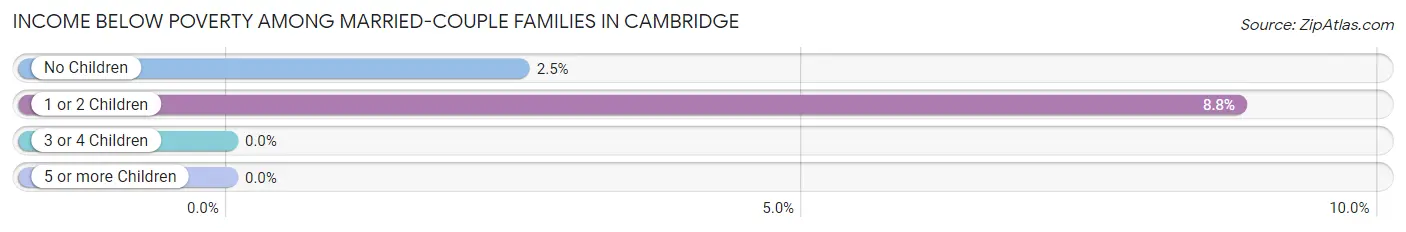
| Children | Above Poverty | Below Poverty |
| No Children | 999 (97.5%) | 26 (2.5%) |
| 1 or 2 Children | 395 (91.2%) | 38 (8.8%) |
| 3 or 4 Children | 31 (100.0%) | 0 (0.0%) |
| 5 or more Children | 0 (0.0%) | 0 (0.0%) |
| Total | 1,425 (95.7%) | 64 (4.3%) |
Income Below Poverty Among Single-Parent Households in Cambridge
According to the poverty data in Cambridge, 21.4% or 52 single-father households and 22.9% or 274 single-mother households are living below the poverty line. Among single-father households, those with 1 or 2 children have the highest poverty rate, with 52 households (38.0%) experiencing poverty. Likewise, among single-mother households, those with 3 or 4 children have the highest poverty rate, with 93 households (59.2%) falling below the poverty line.
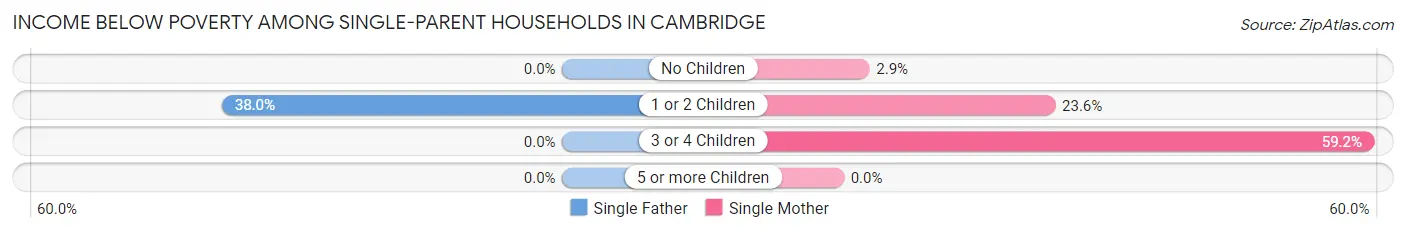
| Children | Single Father | Single Mother |
| No Children | 0 (0.0%) | 9 (2.9%) |
| 1 or 2 Children | 52 (38.0%) | 172 (23.6%) |
| 3 or 4 Children | 0 (0.0%) | 93 (59.2%) |
| 5 or more Children | 0 (0.0%) | 0 (0.0%) |
| Total | 52 (21.4%) | 274 (22.9%) |
Income Below Poverty Among Married-Couple vs Single-Parent Households in Cambridge
The poverty data for Cambridge shows that 64 of the married-couple family households (4.3%) and 326 of the single-parent households (22.6%) are living below the poverty level. Within the married-couple family households, those with 1 or 2 children have the highest poverty rate, with 38 households (8.8%) falling below the poverty line. Among the single-parent households, those with 3 or 4 children have the highest poverty rate, with 93 household (48.9%) living below poverty.
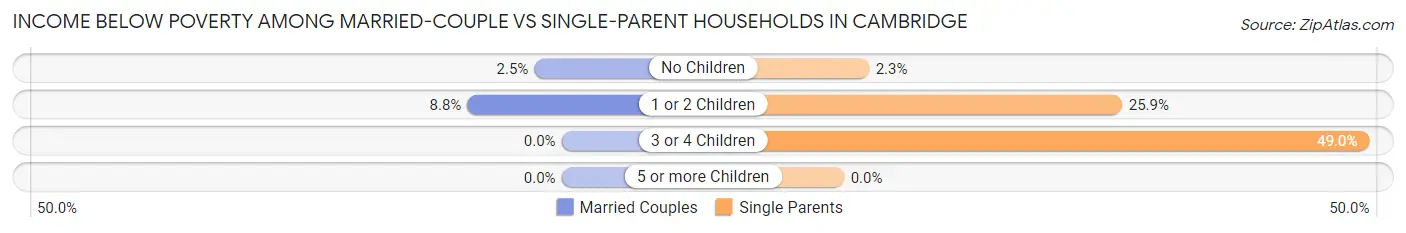
| Children | Married-Couple Families | Single-Parent Households |
| No Children | 26 (2.5%) | 9 (2.3%) |
| 1 or 2 Children | 38 (8.8%) | 224 (25.9%) |
| 3 or 4 Children | 0 (0.0%) | 93 (48.9%) |
| 5 or more Children | 0 (0.0%) | 0 (0.0%) |
| Total | 64 (4.3%) | 326 (22.6%) |
Race in Cambridge
The most populous races in Cambridge are Black / African American (5,817 | 44.6%), White / Caucasian (5,071 | 38.8%), and Two or more Races (1,403 | 10.7%).
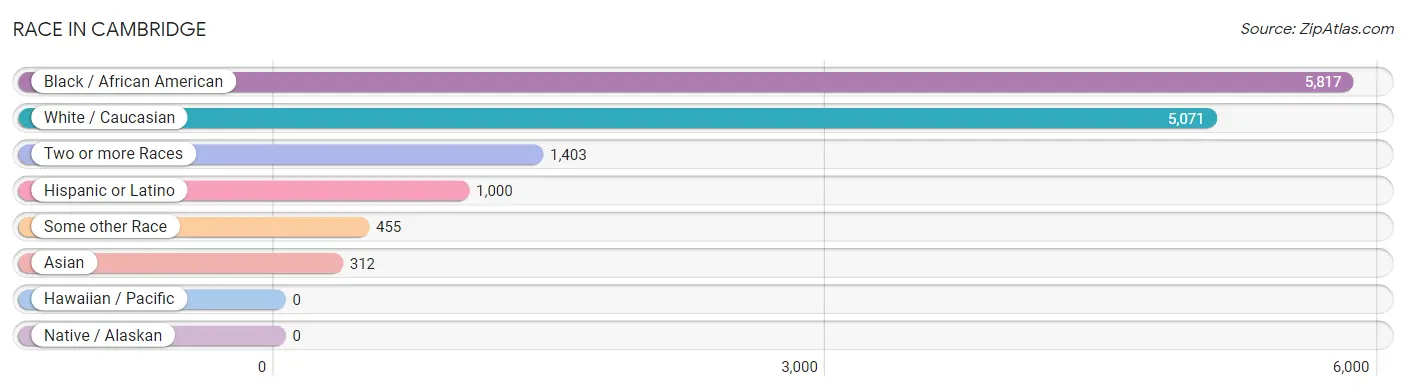
| Race | # Population | % Population |
| Asian | 312 | 2.4% |
| Black / African American | 5,817 | 44.6% |
| Hawaiian / Pacific | 0 | 0.0% |
| Hispanic or Latino | 1,000 | 7.7% |
| Native / Alaskan | 0 | 0.0% |
| White / Caucasian | 5,071 | 38.8% |
| Two or more Races | 1,403 | 10.7% |
| Some other Race | 455 | 3.5% |
| Total | 13,058 | 100.0% |
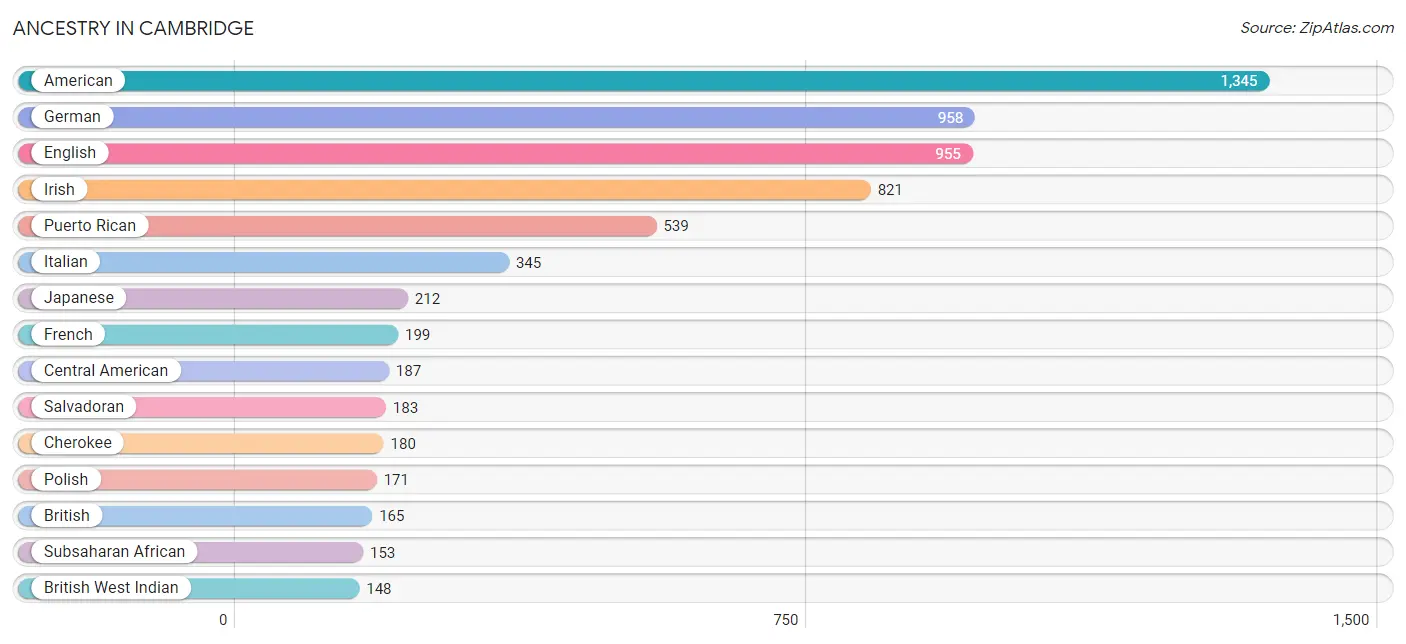
Ancestry in Cambridge
The most populous ancestries reported in Cambridge are American (1,345 | 10.3%), German (958 | 7.3%), English (955 | 7.3%), Irish (821 | 6.3%), and Puerto Rican (539 | 4.1%), together accounting for 35.4% of all Cambridge residents.
| Ancestry | # Population | % Population |
| African | 35 | 0.3% |
| American | 1,345 | 10.3% |
| Arab | 16 | 0.1% |
| Austrian | 17 | 0.1% |
| Barbadian | 5 | 0.0% |
| Bhutanese | 29 | 0.2% |
| Blackfeet | 6 | 0.1% |
| British | 165 | 1.3% |
| British West Indian | 148 | 1.1% |
| Central American | 187 | 1.4% |
| Cherokee | 180 | 1.4% |
| Cuban | 8 | 0.1% |
| Danish | 20 | 0.2% |
| Dominican | 116 | 0.9% |
| Dutch | 87 | 0.7% |
| Eastern European | 9 | 0.1% |
| English | 955 | 7.3% |
| European | 59 | 0.4% |
| French | 199 | 1.5% |
| French Canadian | 15 | 0.1% |
| German | 958 | 7.3% |
| Haitian | 29 | 0.2% |
| Honduran | 4 | 0.0% |
| Indian (Asian) | 34 | 0.3% |
| Irish | 821 | 6.3% |
| Italian | 345 | 2.6% |
| Jamaican | 15 | 0.1% |
| Japanese | 212 | 1.6% |
| Lebanese | 16 | 0.1% |
| Lumbee | 2 | 0.0% |
| Mexican | 112 | 0.9% |
| Navajo | 29 | 0.2% |
| Nigerian | 118 | 0.9% |
| Norwegian | 9 | 0.1% |
| Pakistani | 26 | 0.2% |
| Pennsylvania German | 7 | 0.1% |
| Polish | 171 | 1.3% |
| Puerto Rican | 539 | 4.1% |
| Russian | 13 | 0.1% |
| Salvadoran | 183 | 1.4% |
| Scandinavian | 4 | 0.0% |
| Scotch-Irish | 123 | 0.9% |
| Scottish | 81 | 0.6% |
| Sioux | 53 | 0.4% |
| Slavic | 40 | 0.3% |
| Subsaharan African | 153 | 1.2% |
| Swedish | 62 | 0.5% |
| Swiss | 11 | 0.1% |
| Thai | 37 | 0.3% |
| Trinidadian and Tobagonian | 22 | 0.2% |
| Welsh | 147 | 1.1% |
| West Indian | 22 | 0.2% | View All 52 Rows |
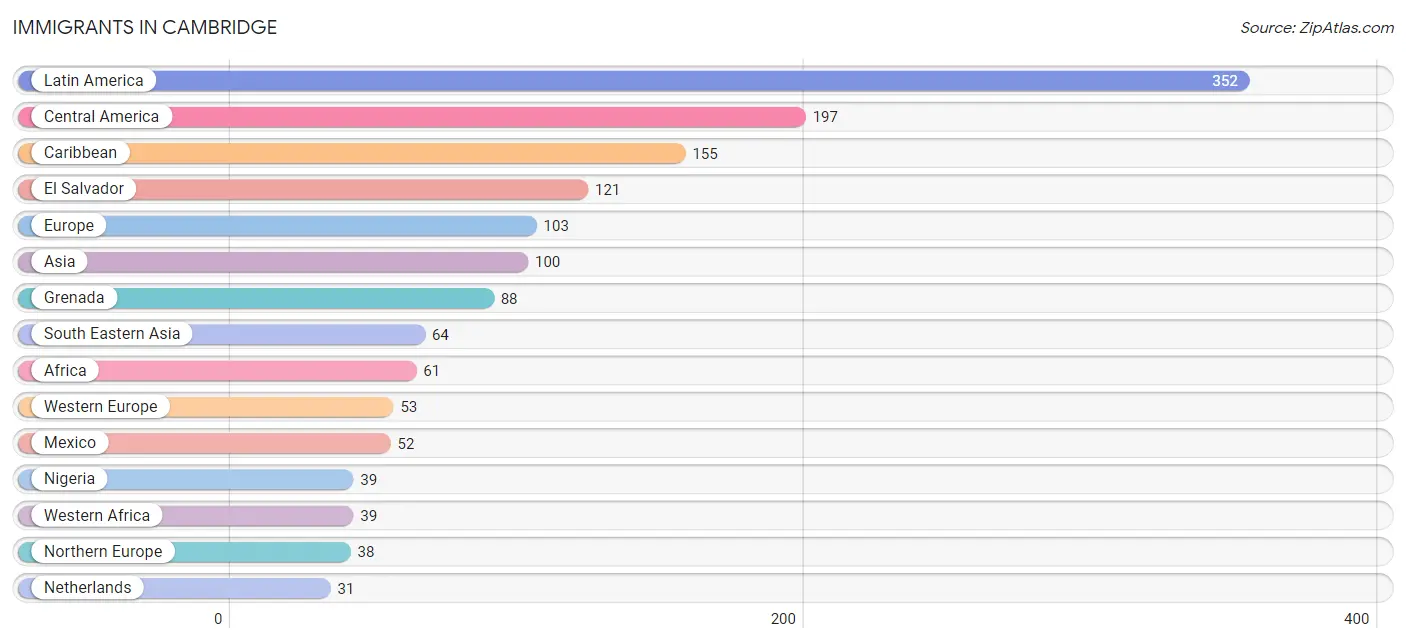
Immigrants in Cambridge
The most numerous immigrant groups reported in Cambridge came from Latin America (352 | 2.7%), Central America (197 | 1.5%), Caribbean (155 | 1.2%), El Salvador (121 | 0.9%), and Europe (103 | 0.8%), together accounting for 7.1% of all Cambridge residents.
| Immigration Origin | # Population | % Population |
| Africa | 61 | 0.5% |
| Asia | 100 | 0.8% |
| Cambodia | 26 | 0.2% |
| Caribbean | 155 | 1.2% |
| Central America | 197 | 1.5% |
| China | 22 | 0.2% |
| Cuba | 8 | 0.1% |
| Eastern Asia | 25 | 0.2% |
| El Salvador | 121 | 0.9% |
| England | 6 | 0.1% |
| Europe | 103 | 0.8% |
| Germany | 22 | 0.2% |
| Grenada | 88 | 0.7% |
| Haiti | 26 | 0.2% |
| Honduras | 24 | 0.2% |
| India | 11 | 0.1% |
| Italy | 12 | 0.1% |
| Jamaica | 15 | 0.1% |
| Japan | 3 | 0.0% |
| Latin America | 352 | 2.7% |
| Malaysia | 12 | 0.1% |
| Mexico | 52 | 0.4% |
| Netherlands | 31 | 0.2% |
| Nigeria | 39 | 0.3% |
| Northern Europe | 38 | 0.3% |
| Norway | 9 | 0.1% |
| South Central Asia | 11 | 0.1% |
| South Eastern Asia | 64 | 0.5% |
| Southern Europe | 12 | 0.1% |
| St. Vincent and the Grenadines | 18 | 0.1% |
| Sweden | 23 | 0.2% |
| Thailand | 26 | 0.2% |
| Western Africa | 39 | 0.3% |
| Western Europe | 53 | 0.4% | View All 34 Rows |
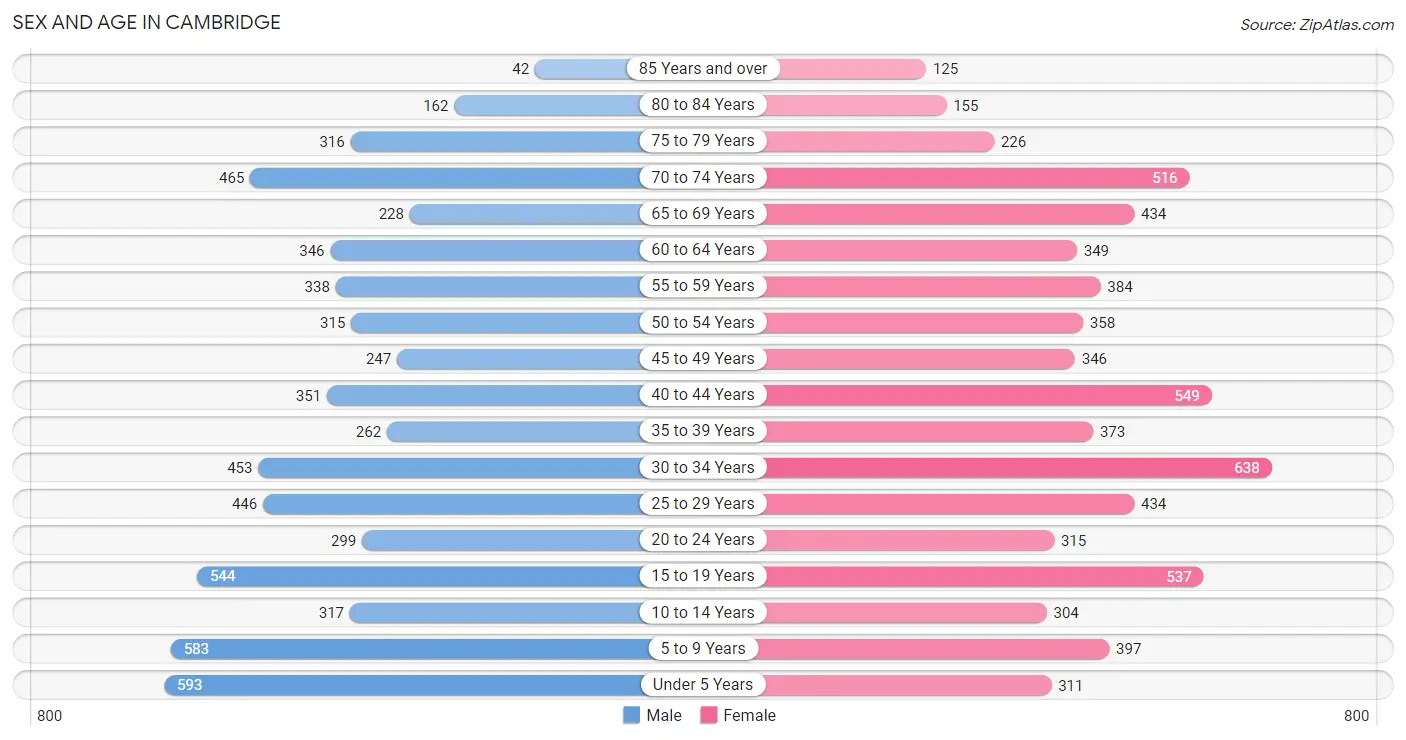
Sex and Age in Cambridge
Sex and Age in Cambridge
The most populous age groups in Cambridge are Under 5 Years (593 | 9.4%) for men and 30 to 34 Years (638 | 9.5%) for women.
| Age Bracket | Male | Female |
| Under 5 Years | 593 (9.4%) | 311 (4.6%) |
| 5 to 9 Years | 583 (9.2%) | 397 (5.9%) |
| 10 to 14 Years | 317 (5.0%) | 304 (4.5%) |
| 15 to 19 Years | 544 (8.6%) | 537 (8.0%) |
| 20 to 24 Years | 299 (4.7%) | 315 (4.7%) |
| 25 to 29 Years | 446 (7.1%) | 434 (6.4%) |
| 30 to 34 Years | 453 (7.2%) | 638 (9.5%) |
| 35 to 39 Years | 262 (4.2%) | 373 (5.5%) |
| 40 to 44 Years | 351 (5.6%) | 549 (8.1%) |
| 45 to 49 Years | 247 (3.9%) | 346 (5.1%) |
| 50 to 54 Years | 315 (5.0%) | 358 (5.3%) |
| 55 to 59 Years | 338 (5.4%) | 384 (5.7%) |
| 60 to 64 Years | 346 (5.5%) | 349 (5.2%) |
| 65 to 69 Years | 228 (3.6%) | 434 (6.4%) |
| 70 to 74 Years | 465 (7.4%) | 516 (7.6%) |
| 75 to 79 Years | 316 (5.0%) | 226 (3.4%) |
| 80 to 84 Years | 162 (2.6%) | 155 (2.3%) |
| 85 Years and over | 42 (0.7%) | 125 (1.8%) |
| Total | 6,307 (100.0%) | 6,751 (100.0%) |
Families and Households in Cambridge
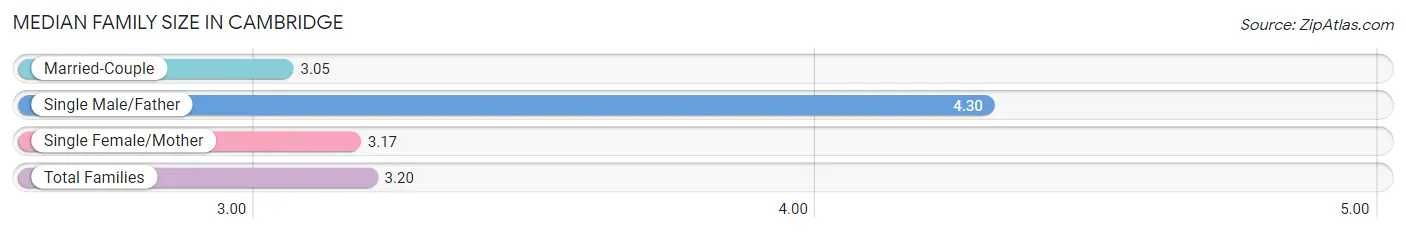
Median Family Size in Cambridge
The median family size in Cambridge is 3.20 persons per family, with single male/father families (243 | 8.3%) accounting for the largest median family size of 4.3 persons per family. On the other hand, married-couple families (1,489 | 50.8%) represent the smallest median family size with 3.05 persons per family.
| Family Type | # Families | Family Size |
| Married-Couple | 1,489 (50.8%) | 3.05 |
| Single Male/Father | 243 (8.3%) | 4.30 |
| Single Female/Mother | 1,199 (40.9%) | 3.17 |
| Total Families | 2,931 (100.0%) | 3.20 |
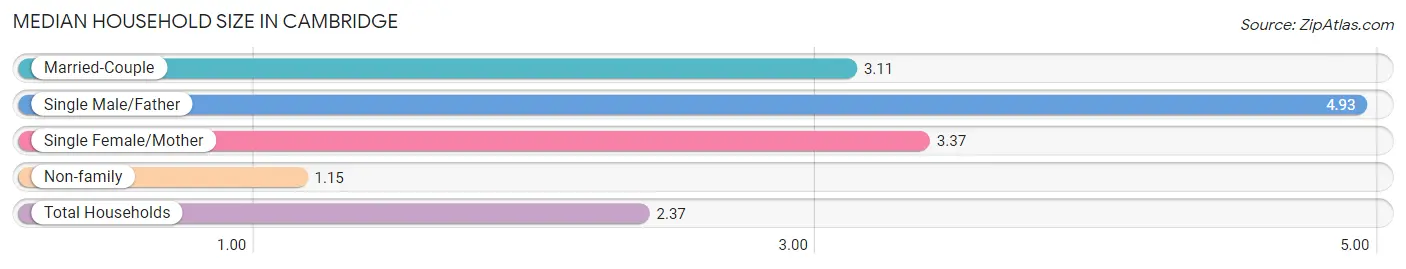
Median Household Size in Cambridge
The median household size in Cambridge is 2.37 persons per household, with single male/father households (243 | 4.6%) accounting for the largest median household size of 4.93 persons per household. non-family households (2,383 | 44.8%) represent the smallest median household size with 1.15 persons per household.
| Household Type | # Households | Household Size |
| Married-Couple | 1,489 (28.0%) | 3.11 |
| Single Male/Father | 243 (4.6%) | 4.93 |
| Single Female/Mother | 1,199 (22.6%) | 3.37 |
| Non-family | 2,383 (44.8%) | 1.15 |
| Total Households | 5,314 (100.0%) | 2.37 |
Household Size by Marriage Status in Cambridge
Out of a total of 5,314 households in Cambridge, 2,931 (55.2%) are family households, while 2,383 (44.8%) are nonfamily households. The most numerous type of family households are 2-person households, comprising 1,379, and the most common type of nonfamily households are 1-person households, comprising 2,062.
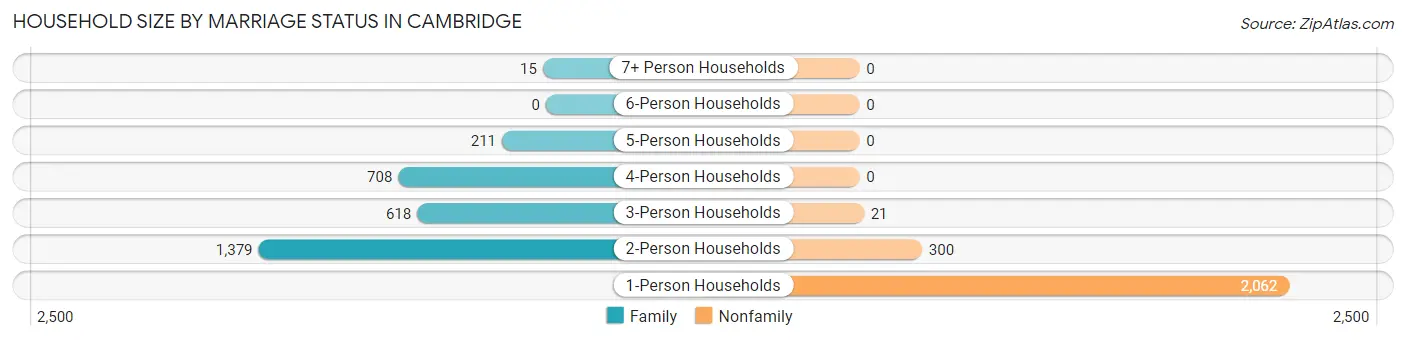
| Household Size | Family Households | Nonfamily Households |
| 1-Person Households | - | 2,062 (38.8%) |
| 2-Person Households | 1,379 (26.0%) | 300 (5.7%) |
| 3-Person Households | 618 (11.6%) | 21 (0.4%) |
| 4-Person Households | 708 (13.3%) | 0 (0.0%) |
| 5-Person Households | 211 (4.0%) | 0 (0.0%) |
| 6-Person Households | 0 (0.0%) | 0 (0.0%) |
| 7+ Person Households | 15 (0.3%) | 0 (0.0%) |
| Total | 2,931 (55.2%) | 2,383 (44.8%) |
Female Fertility in Cambridge
Fertility by Age in Cambridge
Average fertility rate in Cambridge is 43.0 births per 1,000 women. Women in the age bracket of 20 to 34 years have the highest fertility rate with 76.0 births per 1,000 women. Women in the age bracket of 20 to 34 years acount for 75.7% of all women with births.
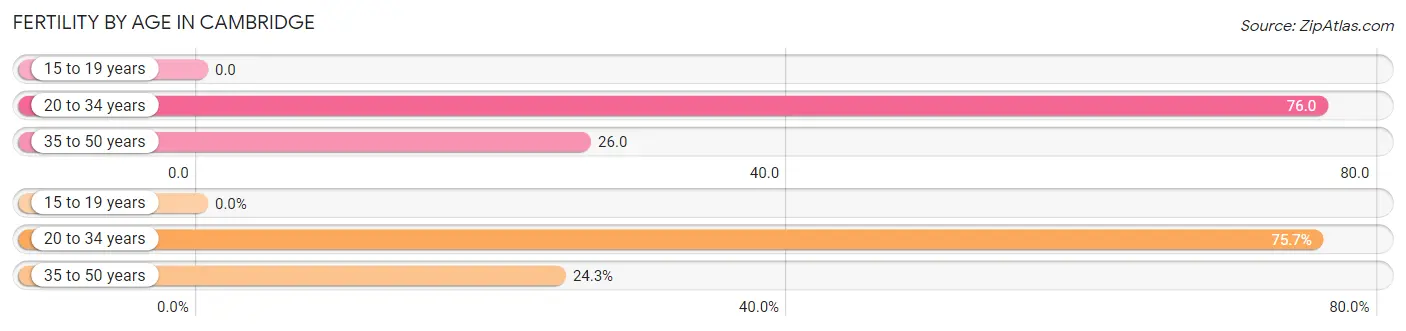
| Age Bracket | Women with Births | Births / 1,000 Women |
| 15 to 19 years | 0 (0.0%) | 0.0 |
| 20 to 34 years | 106 (75.7%) | 76.0 |
| 35 to 50 years | 34 (24.3%) | 26.0 |
| Total | 140 (100.0%) | 43.0 |
Fertility by Age by Marriage Status in Cambridge
45.7% of women with births (140) in Cambridge are married. The highest percentage of unmarried women with births falls into 20 to 34 years age bracket with 71.7% of them unmarried at the time of birth, while the lowest percentage of unmarried women with births belong to 35 to 50 years age bracket with 0.0% of them unmarried.
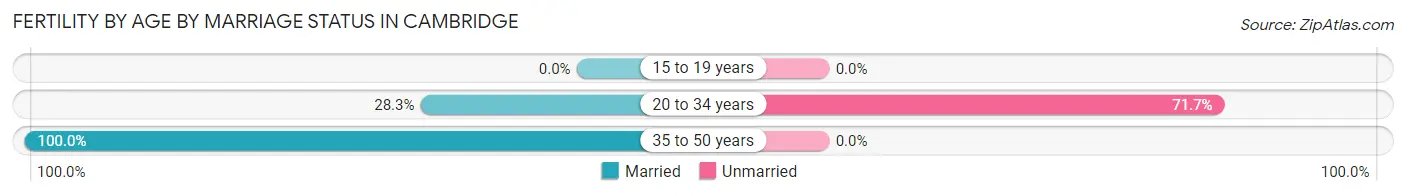
| Age Bracket | Married | Unmarried |
| 15 to 19 years | 0 (0.0%) | 0 (0.0%) |
| 20 to 34 years | 30 (28.3%) | 76 (71.7%) |
| 35 to 50 years | 34 (100.0%) | 0 (0.0%) |
| Total | 64 (45.7%) | 76 (54.3%) |
Fertility by Education in Cambridge
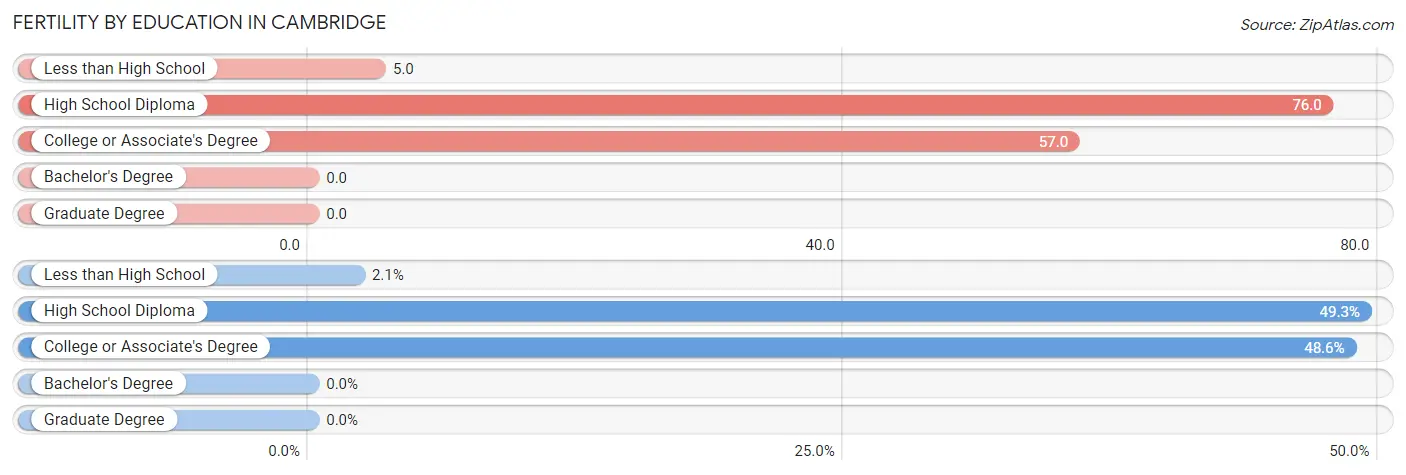
| Educational Attainment | Women with Births | Births / 1,000 Women |
| Less than High School | 3 (2.1%) | 5.0 |
| High School Diploma | 69 (49.3%) | 76.0 |
| College or Associate's Degree | 68 (48.6%) | 57.0 |
| Bachelor's Degree | 0 (0.0%) | 0.0 |
| Graduate Degree | 0 (0.0%) | 0.0 |
| Total | 140 (100.0%) | 43.0 |
Fertility by Education by Marriage Status in Cambridge
54.3% of women with births in Cambridge are unmarried. Women with the educational attainment of high school diploma are most likely to be married with 47.8% of them married at childbirth, while women with the educational attainment of less than high school are least likely to be married with 100.0% of them unmarried at childbirth.
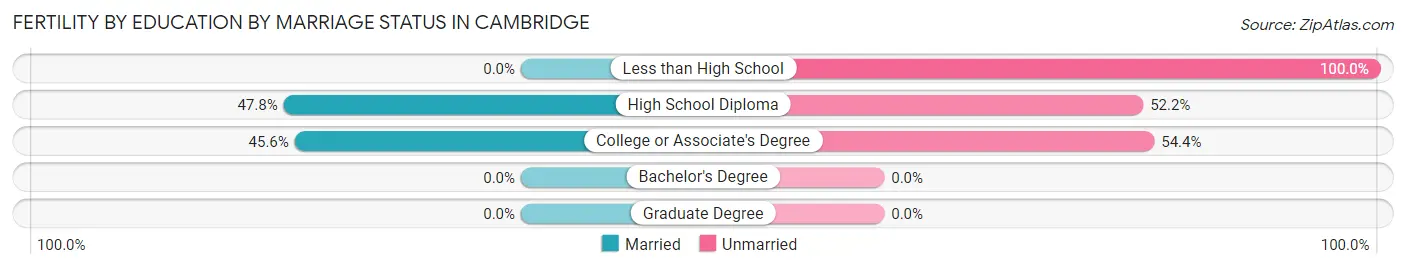
| Educational Attainment | Married | Unmarried |
| Less than High School | 0 (0.0%) | 3 (100.0%) |
| High School Diploma | 33 (47.8%) | 36 (52.2%) |
| College or Associate's Degree | 31 (45.6%) | 37 (54.4%) |
| Bachelor's Degree | 0 (0.0%) | 0 (0.0%) |
| Graduate Degree | 0 (0.0%) | 0 (0.0%) |
| Total | 64 (45.7%) | 76 (54.3%) |
Employment Characteristics in Cambridge
Employment by Class of Employer in Cambridge
Among the 5,666 employed individuals in Cambridge, private company employees (3,509 | 61.9%), local government employees (672 | 11.9%), and not-for-profit organizations (481 | 8.5%) make up the most common classes of employment.
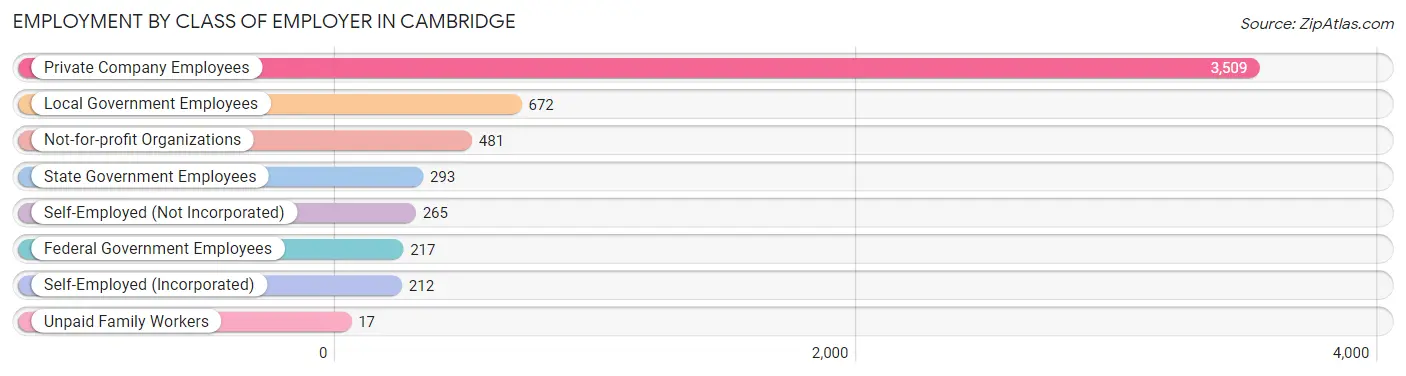
| Employer Class | # Employees | % Employees |
| Private Company Employees | 3,509 | 61.9% |
| Self-Employed (Incorporated) | 212 | 3.7% |
| Self-Employed (Not Incorporated) | 265 | 4.7% |
| Not-for-profit Organizations | 481 | 8.5% |
| Local Government Employees | 672 | 11.9% |
| State Government Employees | 293 | 5.2% |
| Federal Government Employees | 217 | 3.8% |
| Unpaid Family Workers | 17 | 0.3% |
| Total | 5,666 | 100.0% |
Employment Status by Age in Cambridge
According to the labor force statistics for Cambridge, out of the total population over 16 years of age (10,367), 60.3% or 6,251 individuals are in the labor force, with 7.2% or 450 of them unemployed. The age group with the highest labor force participation rate is 25 to 29 years, with 84.4% or 743 individuals in the labor force. Within the labor force, the 16 to 19 years age range has the highest percentage of unemployed individuals, with 15.2% or 52 of them being unemployed.
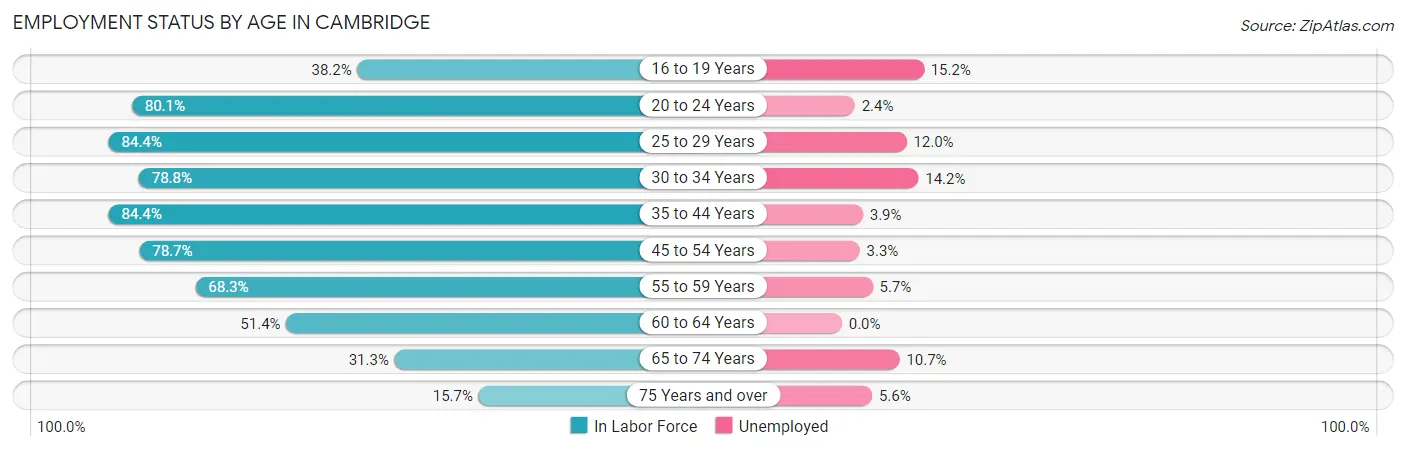
| Age Bracket | In Labor Force | Unemployed |
| 16 to 19 Years | 342 (38.2%) | 52 (15.2%) |
| 20 to 24 Years | 492 (80.1%) | 12 (2.4%) |
| 25 to 29 Years | 743 (84.4%) | 89 (12.0%) |
| 30 to 34 Years | 860 (78.8%) | 122 (14.2%) |
| 35 to 44 Years | 1,296 (84.4%) | 51 (3.9%) |
| 45 to 54 Years | 996 (78.7%) | 33 (3.3%) |
| 55 to 59 Years | 493 (68.3%) | 28 (5.7%) |
| 60 to 64 Years | 357 (51.4%) | 0 (0.0%) |
| 65 to 74 Years | 514 (31.3%) | 55 (10.7%) |
| 75 Years and over | 161 (15.7%) | 9 (5.6%) |
| Total | 6,251 (60.3%) | 450 (7.2%) |
Employment Status by Educational Attainment in Cambridge
According to labor force statistics for Cambridge, 76.7% of individuals (4,747) out of the total population between 25 and 64 years of age (6,189) are in the labor force, with 6.8% or 323 of them being unemployed. The group with the highest labor force participation rate are those with the educational attainment of bachelor's degree or higher, with 88.5% or 955 individuals in the labor force. Within the labor force, individuals with less than high school education have the highest percentage of unemployment, with 24.5% or 74 of them being unemployed.
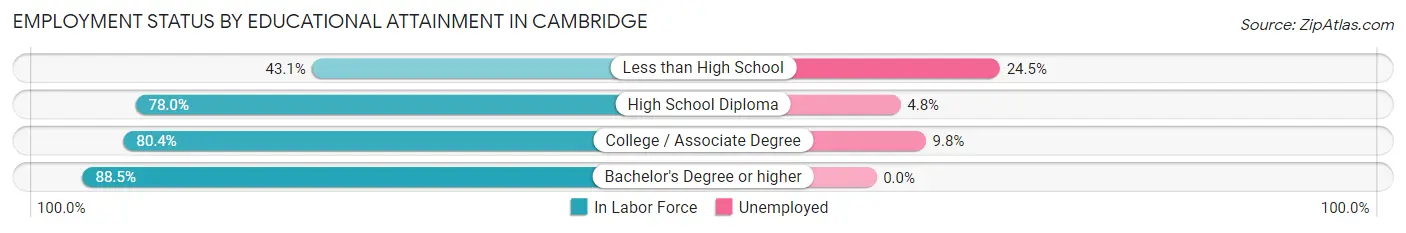
| Educational Attainment | In Labor Force | Unemployed |
| Less than High School | 302 (43.1%) | 172 (24.5%) |
| High School Diploma | 1,871 (78.0%) | 115 (4.8%) |
| College / Associate Degree | 1,617 (80.4%) | 197 (9.8%) |
| Bachelor's Degree or higher | 955 (88.5%) | 0 (0.0%) |
| Total | 4,747 (76.7%) | 421 (6.8%) |
Employment Occupations by Sex in Cambridge
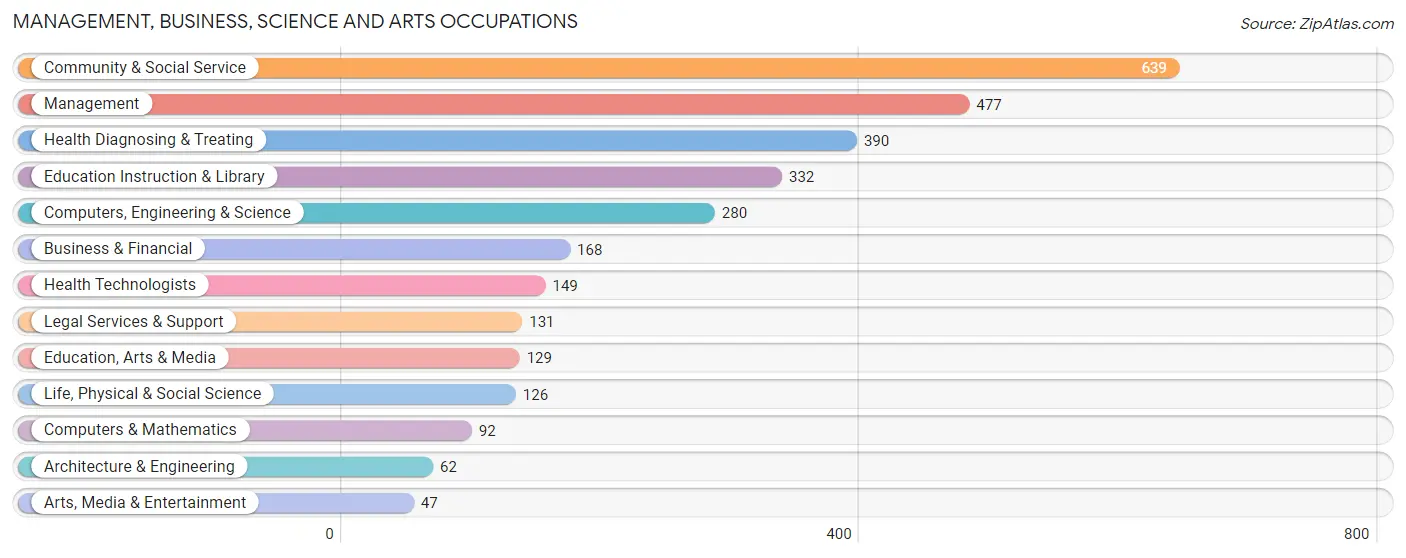
Management, Business, Science and Arts Occupations
The most common Management, Business, Science and Arts occupations in Cambridge are Community & Social Service (639 | 11.0%), Management (477 | 8.2%), Health Diagnosing & Treating (390 | 6.7%), Education Instruction & Library (332 | 5.7%), and Computers, Engineering & Science (280 | 4.8%).
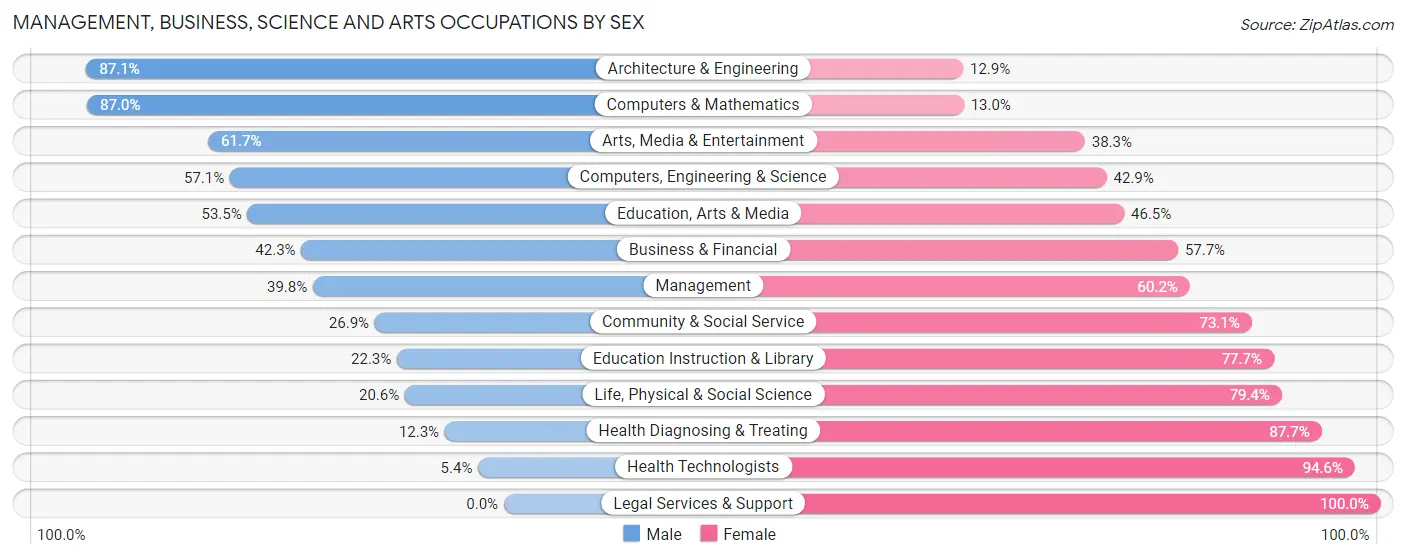
Management, Business, Science and Arts Occupations by Sex
Within the Management, Business, Science and Arts occupations in Cambridge, the most male-oriented occupations are Architecture & Engineering (87.1%), Computers & Mathematics (87.0%), and Arts, Media & Entertainment (61.7%), while the most female-oriented occupations are Legal Services & Support (100.0%), Health Technologists (94.6%), and Health Diagnosing & Treating (87.7%).
| Occupation | Male | Female |
| Management | 190 (39.8%) | 287 (60.2%) |
| Business & Financial | 71 (42.3%) | 97 (57.7%) |
| Computers, Engineering & Science | 160 (57.1%) | 120 (42.9%) |
| Computers & Mathematics | 80 (87.0%) | 12 (13.0%) |
| Architecture & Engineering | 54 (87.1%) | 8 (12.9%) |
| Life, Physical & Social Science | 26 (20.6%) | 100 (79.4%) |
| Community & Social Service | 172 (26.9%) | 467 (73.1%) |
| Education, Arts & Media | 69 (53.5%) | 60 (46.5%) |
| Legal Services & Support | 0 (0.0%) | 131 (100.0%) |
| Education Instruction & Library | 74 (22.3%) | 258 (77.7%) |
| Arts, Media & Entertainment | 29 (61.7%) | 18 (38.3%) |
| Health Diagnosing & Treating | 48 (12.3%) | 342 (87.7%) |
| Health Technologists | 8 (5.4%) | 141 (94.6%) |
| Total (Category) | 641 (32.8%) | 1,313 (67.2%) |
| Total (Overall) | 2,565 (44.2%) | 3,238 (55.8%) |
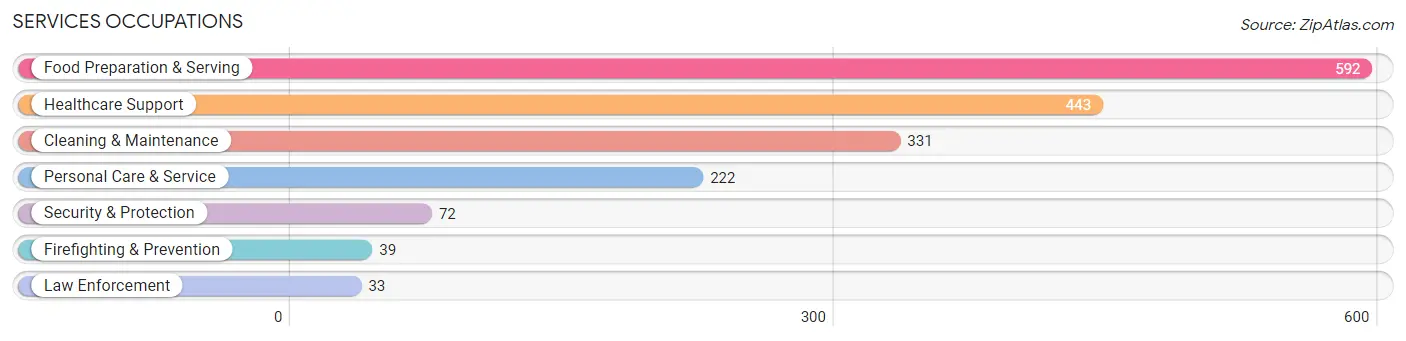
Services Occupations
The most common Services occupations in Cambridge are Food Preparation & Serving (592 | 10.2%), Healthcare Support (443 | 7.6%), Cleaning & Maintenance (331 | 5.7%), Personal Care & Service (222 | 3.8%), and Security & Protection (72 | 1.2%).
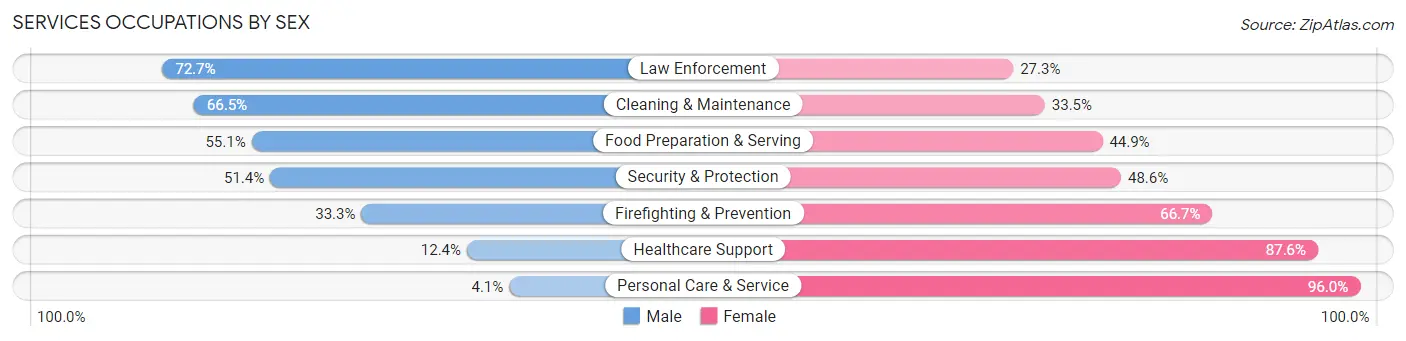
Services Occupations by Sex
Within the Services occupations in Cambridge, the most male-oriented occupations are Law Enforcement (72.7%), Cleaning & Maintenance (66.5%), and Food Preparation & Serving (55.1%), while the most female-oriented occupations are Personal Care & Service (96.0%), Healthcare Support (87.6%), and Firefighting & Prevention (66.7%).
| Occupation | Male | Female |
| Healthcare Support | 55 (12.4%) | 388 (87.6%) |
| Security & Protection | 37 (51.4%) | 35 (48.6%) |
| Firefighting & Prevention | 13 (33.3%) | 26 (66.7%) |
| Law Enforcement | 24 (72.7%) | 9 (27.3%) |
| Food Preparation & Serving | 326 (55.1%) | 266 (44.9%) |
| Cleaning & Maintenance | 220 (66.5%) | 111 (33.5%) |
| Personal Care & Service | 9 (4.1%) | 213 (96.0%) |
| Total (Category) | 647 (39.0%) | 1,013 (61.0%) |
| Total (Overall) | 2,565 (44.2%) | 3,238 (55.8%) |
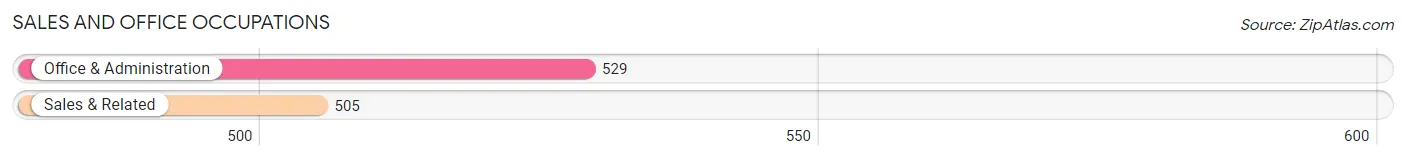
Sales and Office Occupations
The most common Sales and Office occupations in Cambridge are Office & Administration (529 | 9.1%), and Sales & Related (505 | 8.7%).
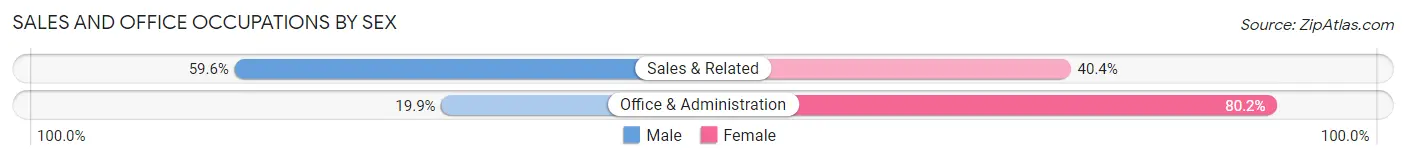
Sales and Office Occupations by Sex
| Occupation | Male | Female |
| Sales & Related | 301 (59.6%) | 204 (40.4%) |
| Office & Administration | 105 (19.9%) | 424 (80.1%) |
| Total (Category) | 406 (39.3%) | 628 (60.7%) |
| Total (Overall) | 2,565 (44.2%) | 3,238 (55.8%) |
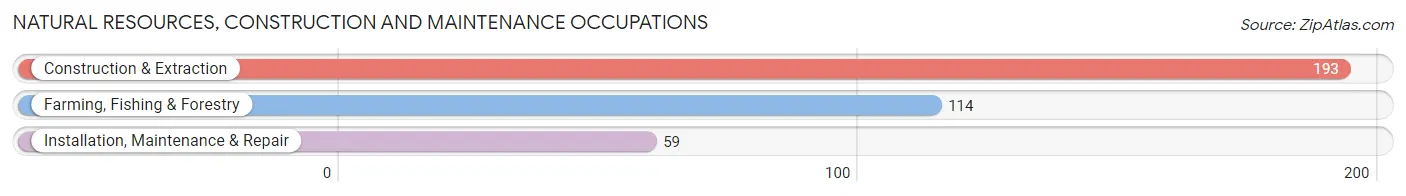
Natural Resources, Construction and Maintenance Occupations
The most common Natural Resources, Construction and Maintenance occupations in Cambridge are Construction & Extraction (193 | 3.3%), Farming, Fishing & Forestry (114 | 2.0%), and Installation, Maintenance & Repair (59 | 1.0%).
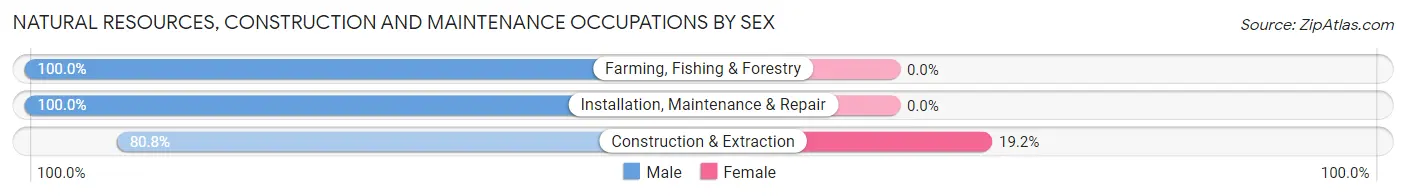
Natural Resources, Construction and Maintenance Occupations by Sex
| Occupation | Male | Female |
| Farming, Fishing & Forestry | 114 (100.0%) | 0 (0.0%) |
| Construction & Extraction | 156 (80.8%) | 37 (19.2%) |
| Installation, Maintenance & Repair | 59 (100.0%) | 0 (0.0%) |
| Total (Category) | 329 (89.9%) | 37 (10.1%) |
| Total (Overall) | 2,565 (44.2%) | 3,238 (55.8%) |
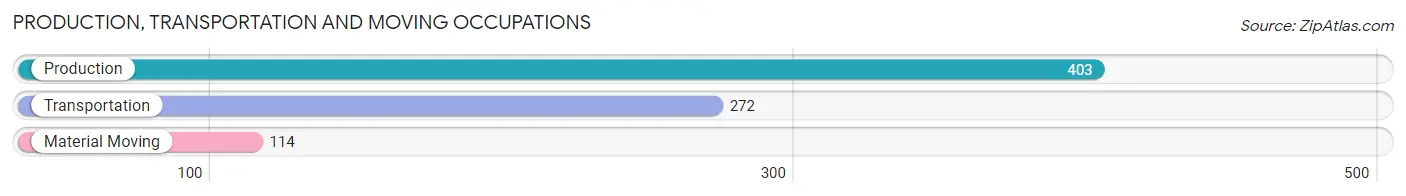
Production, Transportation and Moving Occupations
The most common Production, Transportation and Moving occupations in Cambridge are Production (403 | 6.9%), Transportation (272 | 4.7%), and Material Moving (114 | 2.0%).
Production, Transportation and Moving Occupations by Sex
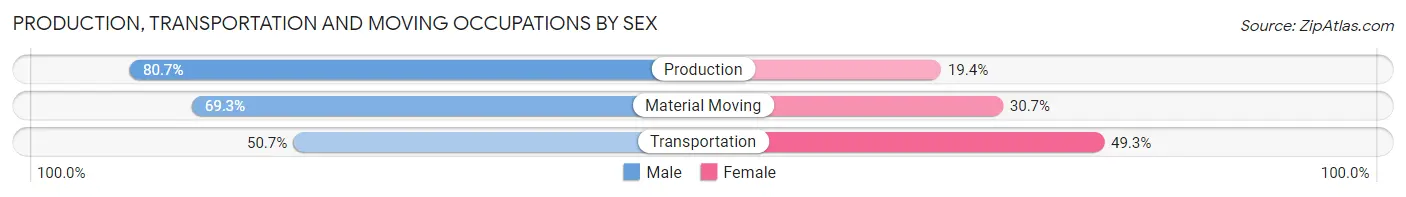
| Occupation | Male | Female |
| Production | 325 (80.6%) | 78 (19.4%) |
| Transportation | 138 (50.7%) | 134 (49.3%) |
| Material Moving | 79 (69.3%) | 35 (30.7%) |
| Total (Category) | 542 (68.7%) | 247 (31.3%) |
| Total (Overall) | 2,565 (44.2%) | 3,238 (55.8%) |
Employment Industries by Sex in Cambridge
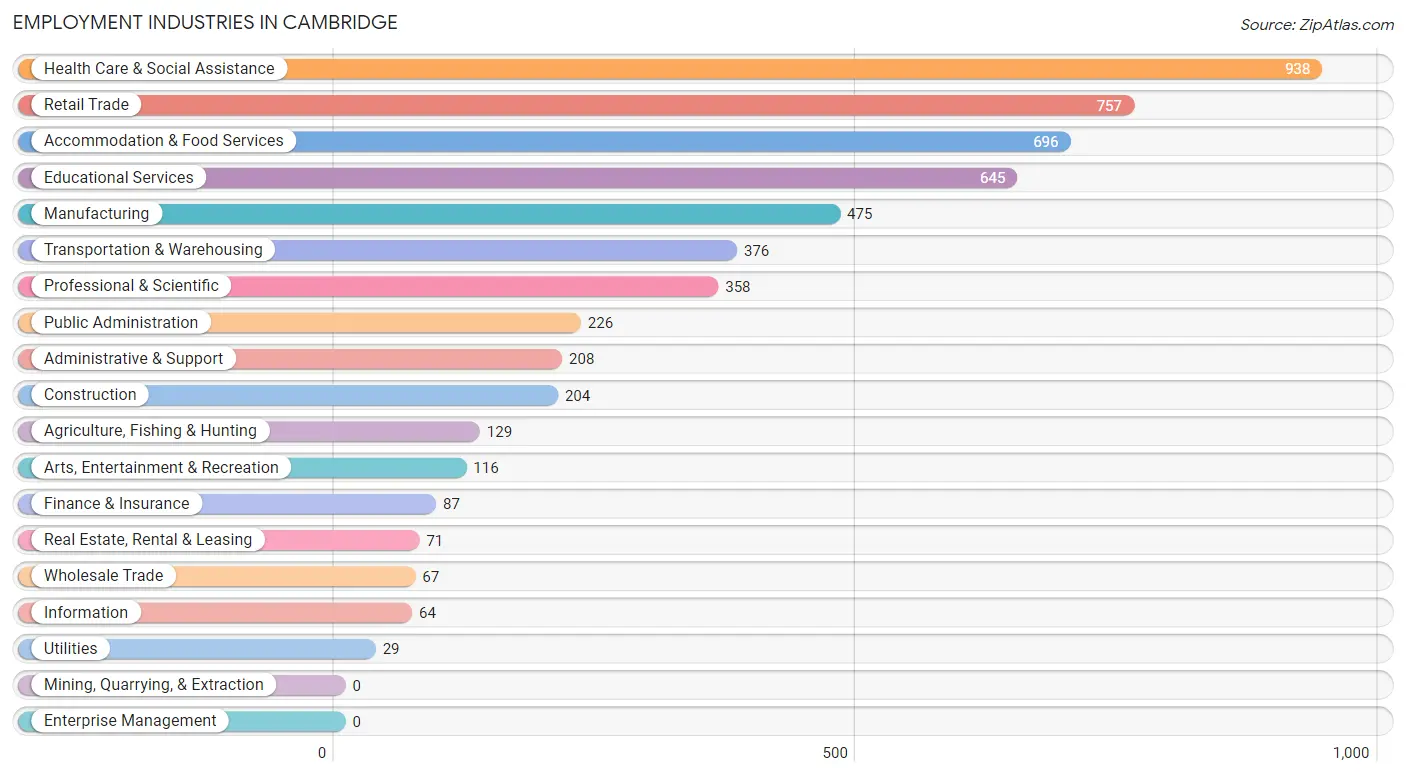
Employment Industries in Cambridge
The major employment industries in Cambridge include Health Care & Social Assistance (938 | 16.2%), Retail Trade (757 | 13.0%), Accommodation & Food Services (696 | 12.0%), Educational Services (645 | 11.1%), and Manufacturing (475 | 8.2%).
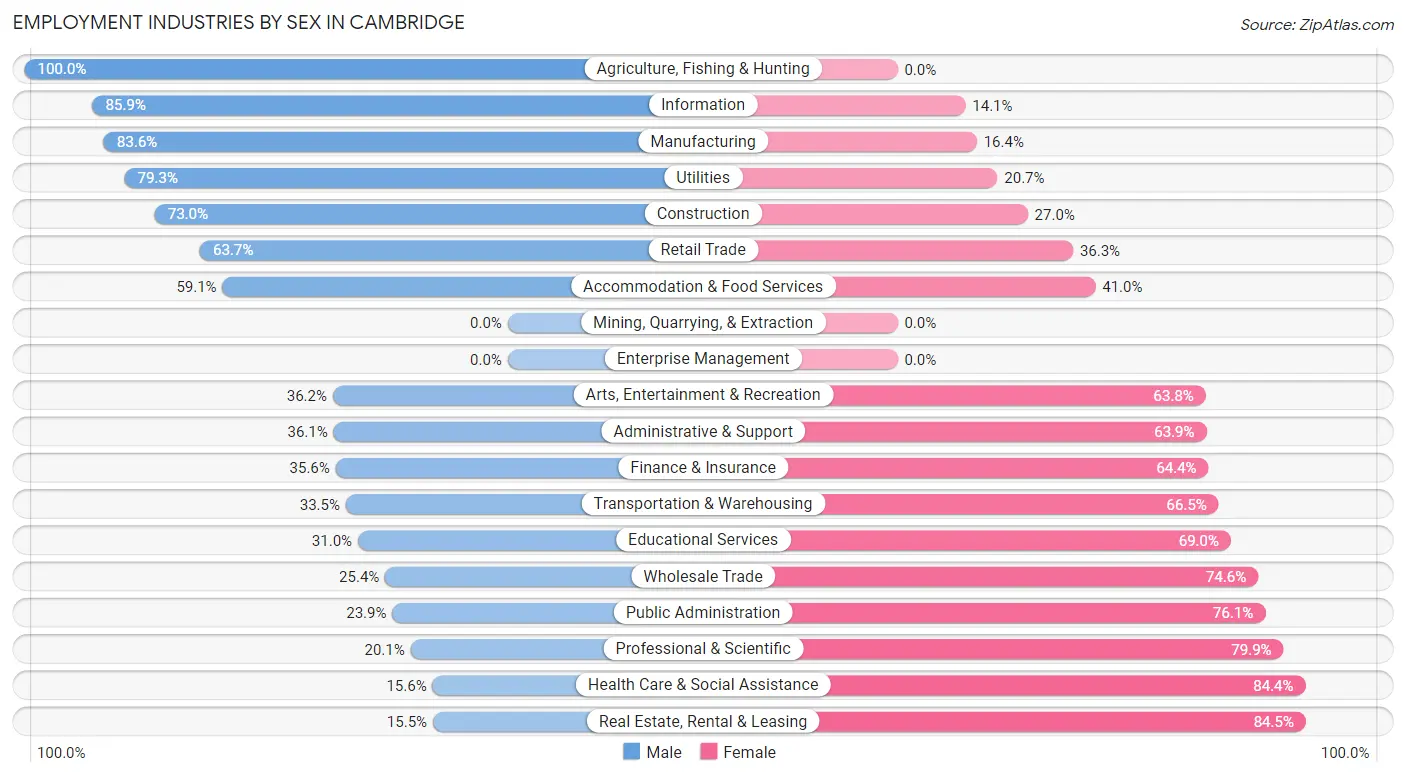
Employment Industries by Sex in Cambridge
The Cambridge industries that see more men than women are Agriculture, Fishing & Hunting (100.0%), Information (85.9%), and Manufacturing (83.6%), whereas the industries that tend to have a higher number of women are Real Estate, Rental & Leasing (84.5%), Health Care & Social Assistance (84.4%), and Professional & Scientific (79.9%).
| Industry | Male | Female |
| Agriculture, Fishing & Hunting | 129 (100.0%) | 0 (0.0%) |
| Mining, Quarrying, & Extraction | 0 (0.0%) | 0 (0.0%) |
| Construction | 149 (73.0%) | 55 (27.0%) |
| Manufacturing | 397 (83.6%) | 78 (16.4%) |
| Wholesale Trade | 17 (25.4%) | 50 (74.6%) |
| Retail Trade | 482 (63.7%) | 275 (36.3%) |
| Transportation & Warehousing | 126 (33.5%) | 250 (66.5%) |
| Utilities | 23 (79.3%) | 6 (20.7%) |
| Information | 55 (85.9%) | 9 (14.1%) |
| Finance & Insurance | 31 (35.6%) | 56 (64.4%) |
| Real Estate, Rental & Leasing | 11 (15.5%) | 60 (84.5%) |
| Professional & Scientific | 72 (20.1%) | 286 (79.9%) |
| Enterprise Management | 0 (0.0%) | 0 (0.0%) |
| Administrative & Support | 75 (36.1%) | 133 (63.9%) |
| Educational Services | 200 (31.0%) | 445 (69.0%) |
| Health Care & Social Assistance | 146 (15.6%) | 792 (84.4%) |
| Arts, Entertainment & Recreation | 42 (36.2%) | 74 (63.8%) |
| Accommodation & Food Services | 411 (59.1%) | 285 (40.9%) |
| Public Administration | 54 (23.9%) | 172 (76.1%) |
| Total | 2,565 (44.2%) | 3,238 (55.8%) |
Education in Cambridge
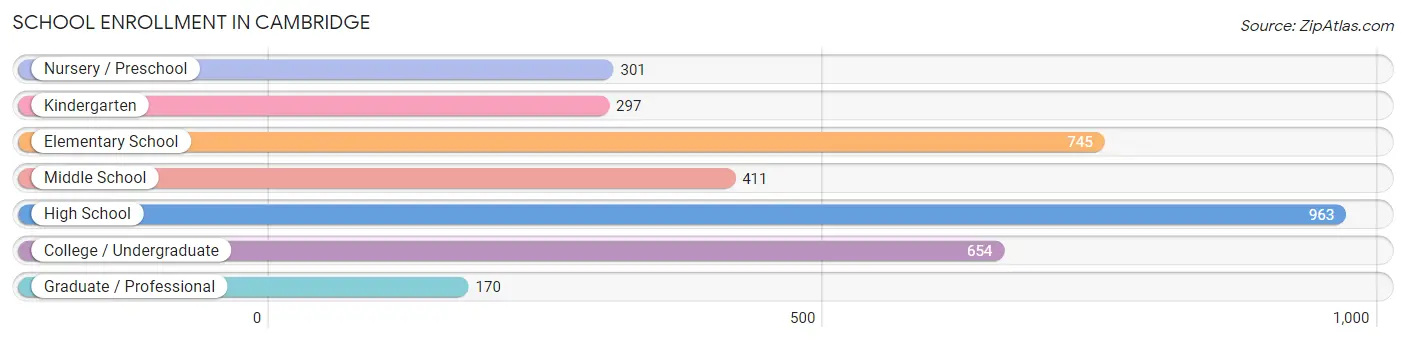
School Enrollment in Cambridge
The most common levels of schooling among the 3,541 students in Cambridge are high school (963 | 27.2%), elementary school (745 | 21.0%), and college / undergraduate (654 | 18.5%).
| School Level | # Students | % Students |
| Nursery / Preschool | 301 | 8.5% |
| Kindergarten | 297 | 8.4% |
| Elementary School | 745 | 21.0% |
| Middle School | 411 | 11.6% |
| High School | 963 | 27.2% |
| College / Undergraduate | 654 | 18.5% |
| Graduate / Professional | 170 | 4.8% |
| Total | 3,541 | 100.0% |
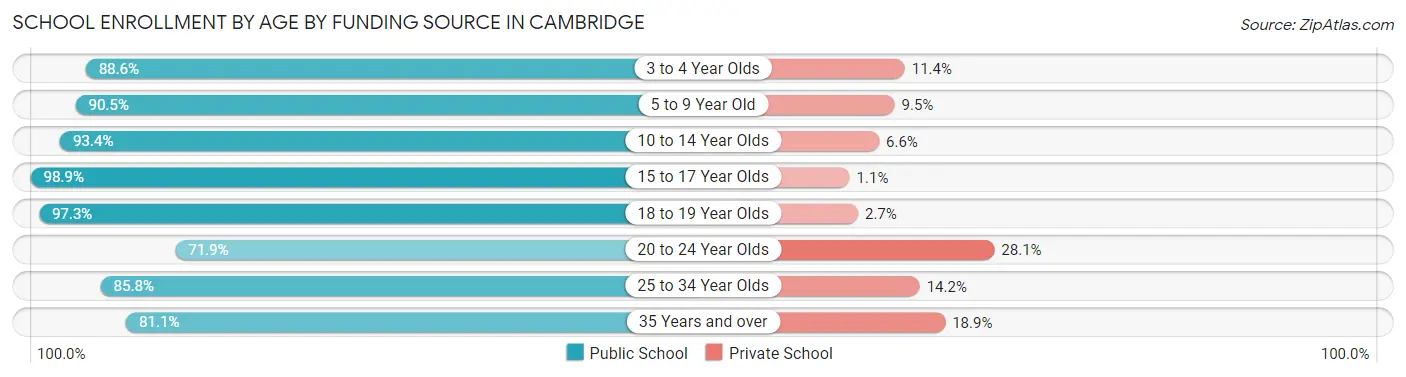
School Enrollment by Age by Funding Source in Cambridge
Out of a total of 3,541 students who are enrolled in schools in Cambridge, 315 (8.9%) attend a private institution, while the remaining 3,226 (91.1%) are enrolled in public schools. The age group of 20 to 24 year olds has the highest likelihood of being enrolled in private schools, with 41 (28.1% in the age bracket) enrolled. Conversely, the age group of 15 to 17 year olds has the lowest likelihood of being enrolled in a private school, with 708 (98.9% in the age bracket) attending a public institution.
| Age Bracket | Public School | Private School |
| 3 to 4 Year Olds | 249 (88.6%) | 32 (11.4%) |
| 5 to 9 Year Old | 887 (90.5%) | 93 (9.5%) |
| 10 to 14 Year Olds | 552 (93.4%) | 39 (6.6%) |
| 15 to 17 Year Olds | 708 (98.9%) | 8 (1.1%) |
| 18 to 19 Year Olds | 218 (97.3%) | 6 (2.7%) |
| 20 to 24 Year Olds | 105 (71.9%) | 41 (28.1%) |
| 25 to 34 Year Olds | 327 (85.8%) | 54 (14.2%) |
| 35 Years and over | 180 (81.1%) | 42 (18.9%) |
| Total | 3,226 (91.1%) | 315 (8.9%) |
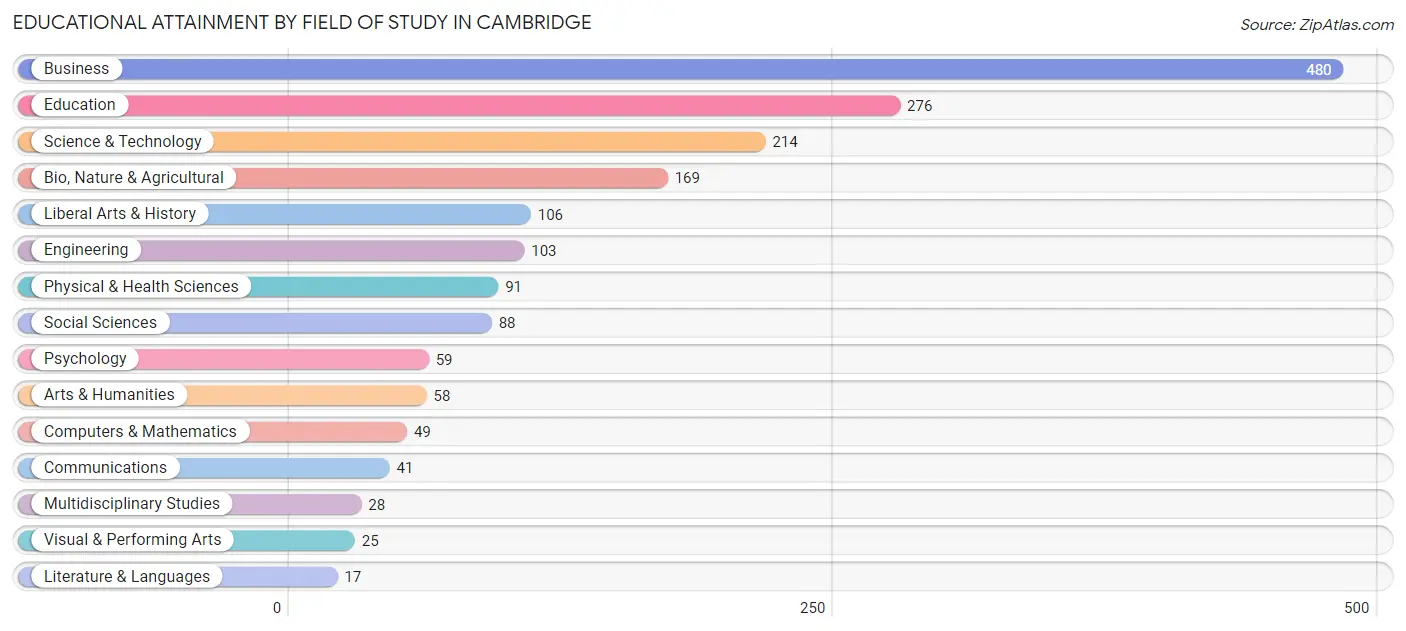
Educational Attainment by Field of Study in Cambridge
Business (480 | 26.6%), education (276 | 15.3%), science & technology (214 | 11.9%), bio, nature & agricultural (169 | 9.4%), and liberal arts & history (106 | 5.9%) are the most common fields of study among 1,804 individuals in Cambridge who have obtained a bachelor's degree or higher.
| Field of Study | # Graduates | % Graduates |
| Computers & Mathematics | 49 | 2.7% |
| Bio, Nature & Agricultural | 169 | 9.4% |
| Physical & Health Sciences | 91 | 5.0% |
| Psychology | 59 | 3.3% |
| Social Sciences | 88 | 4.9% |
| Engineering | 103 | 5.7% |
| Multidisciplinary Studies | 28 | 1.5% |
| Science & Technology | 214 | 11.9% |
| Business | 480 | 26.6% |
| Education | 276 | 15.3% |
| Literature & Languages | 17 | 0.9% |
| Liberal Arts & History | 106 | 5.9% |
| Visual & Performing Arts | 25 | 1.4% |
| Communications | 41 | 2.3% |
| Arts & Humanities | 58 | 3.2% |
| Total | 1,804 | 100.0% |
Transportation & Commute in Cambridge
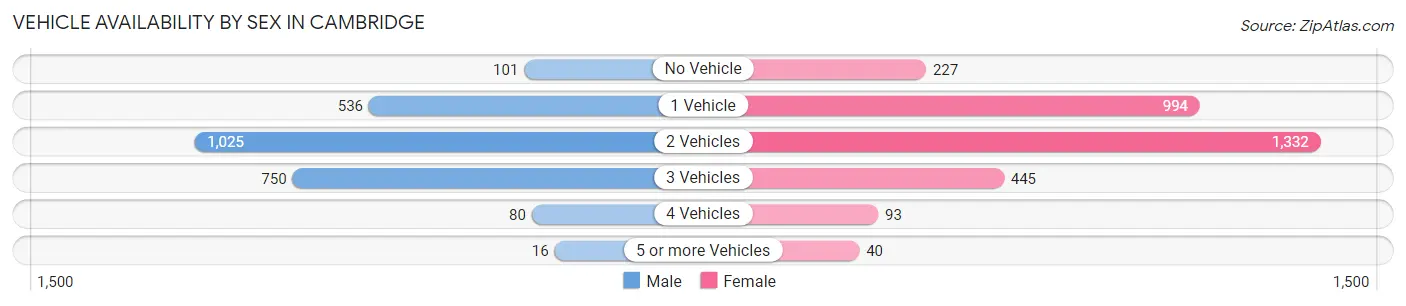
Vehicle Availability by Sex in Cambridge
The most prevalent vehicle ownership categories in Cambridge are males with 2 vehicles (1,025, accounting for 40.9%) and females with 2 vehicles (1,332, making up 32.7%).
| Vehicles Available | Male | Female |
| No Vehicle | 101 (4.0%) | 227 (7.2%) |
| 1 Vehicle | 536 (21.4%) | 994 (31.8%) |
| 2 Vehicles | 1,025 (40.9%) | 1,332 (42.5%) |
| 3 Vehicles | 750 (29.9%) | 445 (14.2%) |
| 4 Vehicles | 80 (3.2%) | 93 (3.0%) |
| 5 or more Vehicles | 16 (0.6%) | 40 (1.3%) |
| Total | 2,508 (100.0%) | 3,131 (100.0%) |
Commute Time in Cambridge
The most frequently occuring commute durations in Cambridge are 5 to 9 minutes (1,357 commuters, 26.0%), 10 to 14 minutes (1,077 commuters, 20.6%), and 20 to 24 minutes (537 commuters, 10.3%).
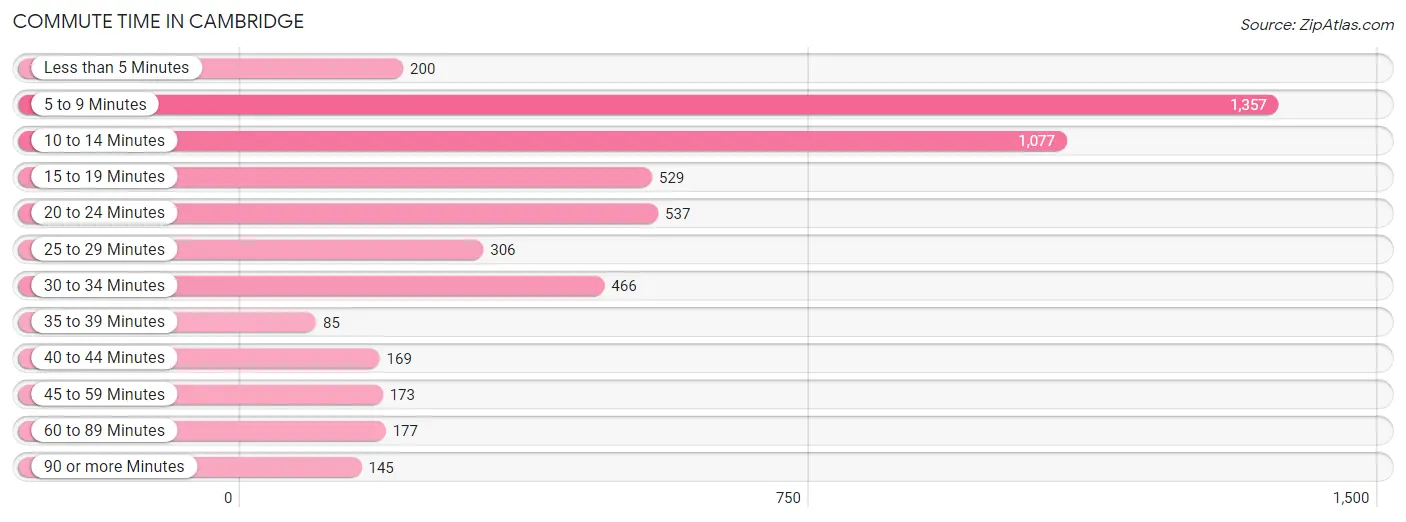
| Commute Time | # Commuters | % Commuters |
| Less than 5 Minutes | 200 | 3.8% |
| 5 to 9 Minutes | 1,357 | 26.0% |
| 10 to 14 Minutes | 1,077 | 20.6% |
| 15 to 19 Minutes | 529 | 10.1% |
| 20 to 24 Minutes | 537 | 10.3% |
| 25 to 29 Minutes | 306 | 5.9% |
| 30 to 34 Minutes | 466 | 8.9% |
| 35 to 39 Minutes | 85 | 1.6% |
| 40 to 44 Minutes | 169 | 3.2% |
| 45 to 59 Minutes | 173 | 3.3% |
| 60 to 89 Minutes | 177 | 3.4% |
| 90 or more Minutes | 145 | 2.8% |
Commute Time by Sex in Cambridge
The most common commute times in Cambridge are 5 to 9 minutes (641 commuters, 27.5%) for males and 5 to 9 minutes (716 commuters, 24.8%) for females.
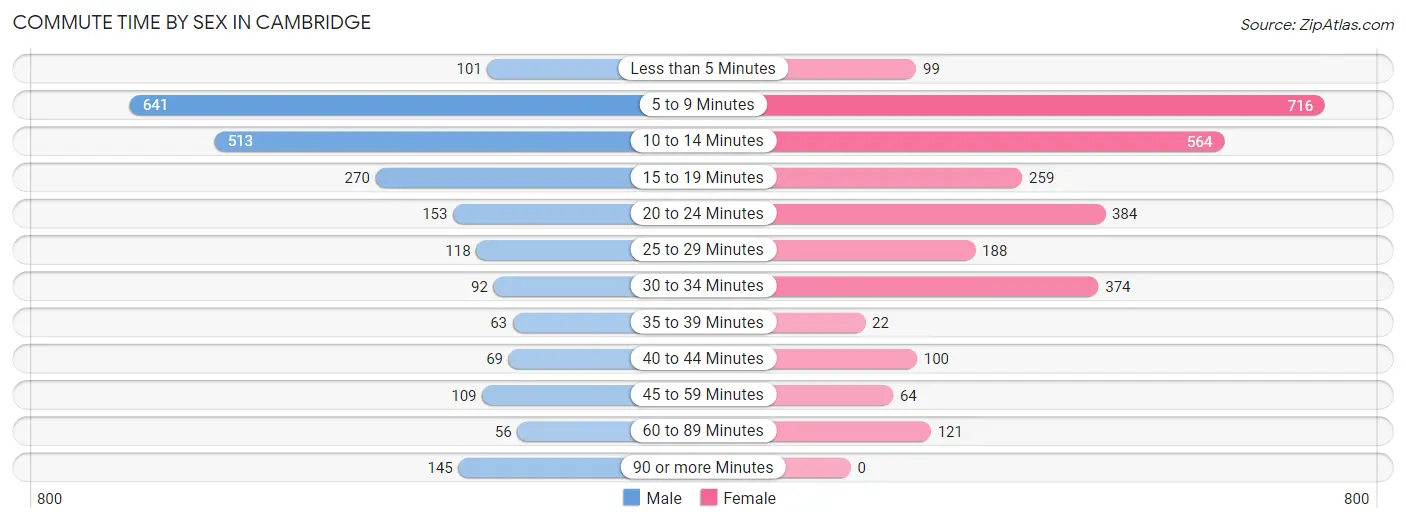
| Commute Time | Male | Female |
| Less than 5 Minutes | 101 (4.3%) | 99 (3.4%) |
| 5 to 9 Minutes | 641 (27.5%) | 716 (24.8%) |
| 10 to 14 Minutes | 513 (22.0%) | 564 (19.5%) |
| 15 to 19 Minutes | 270 (11.6%) | 259 (9.0%) |
| 20 to 24 Minutes | 153 (6.6%) | 384 (13.3%) |
| 25 to 29 Minutes | 118 (5.1%) | 188 (6.5%) |
| 30 to 34 Minutes | 92 (4.0%) | 374 (12.9%) |
| 35 to 39 Minutes | 63 (2.7%) | 22 (0.8%) |
| 40 to 44 Minutes | 69 (3.0%) | 100 (3.5%) |
| 45 to 59 Minutes | 109 (4.7%) | 64 (2.2%) |
| 60 to 89 Minutes | 56 (2.4%) | 121 (4.2%) |
| 90 or more Minutes | 145 (6.2%) | 0 (0.0%) |
Time of Departure to Work by Sex in Cambridge
The most frequent times of departure to work in Cambridge are 8:00 AM to 8:29 AM (321, 13.8%) for males and 7:30 AM to 7:59 AM (605, 20.9%) for females.
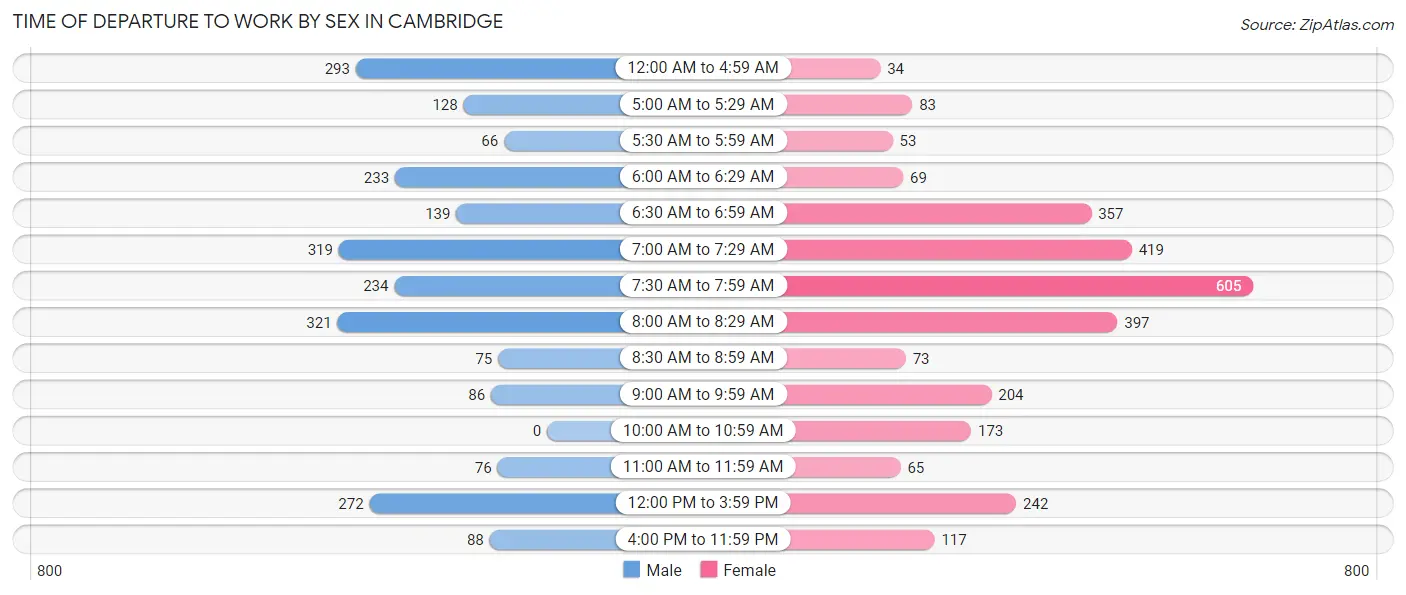
| Time of Departure | Male | Female |
| 12:00 AM to 4:59 AM | 293 (12.6%) | 34 (1.2%) |
| 5:00 AM to 5:29 AM | 128 (5.5%) | 83 (2.9%) |
| 5:30 AM to 5:59 AM | 66 (2.8%) | 53 (1.8%) |
| 6:00 AM to 6:29 AM | 233 (10.0%) | 69 (2.4%) |
| 6:30 AM to 6:59 AM | 139 (6.0%) | 357 (12.3%) |
| 7:00 AM to 7:29 AM | 319 (13.7%) | 419 (14.5%) |
| 7:30 AM to 7:59 AM | 234 (10.0%) | 605 (20.9%) |
| 8:00 AM to 8:29 AM | 321 (13.8%) | 397 (13.7%) |
| 8:30 AM to 8:59 AM | 75 (3.2%) | 73 (2.5%) |
| 9:00 AM to 9:59 AM | 86 (3.7%) | 204 (7.1%) |
| 10:00 AM to 10:59 AM | 0 (0.0%) | 173 (6.0%) |
| 11:00 AM to 11:59 AM | 76 (3.3%) | 65 (2.2%) |
| 12:00 PM to 3:59 PM | 272 (11.7%) | 242 (8.4%) |
| 4:00 PM to 11:59 PM | 88 (3.8%) | 117 (4.1%) |
| Total | 2,330 (100.0%) | 2,891 (100.0%) |
Housing Occupancy in Cambridge
Occupancy by Ownership in Cambridge
Of the total 5,314 dwellings in Cambridge, owner-occupied units account for 2,348 (44.2%), while renter-occupied units make up 2,966 (55.8%).
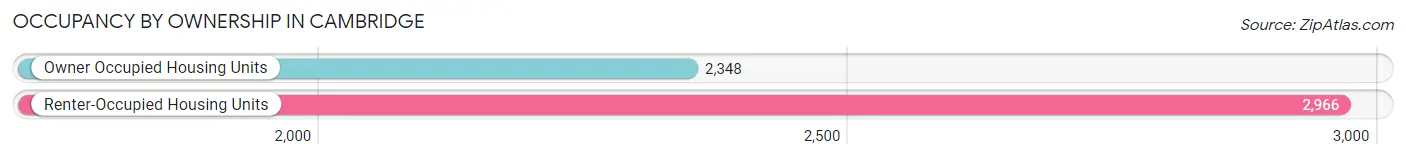
| Occupancy | # Housing Units | % Housing Units |
| Owner Occupied Housing Units | 2,348 | 44.2% |
| Renter-Occupied Housing Units | 2,966 | 55.8% |
| Total Occupied Housing Units | 5,314 | 100.0% |
Occupancy by Household Size in Cambridge
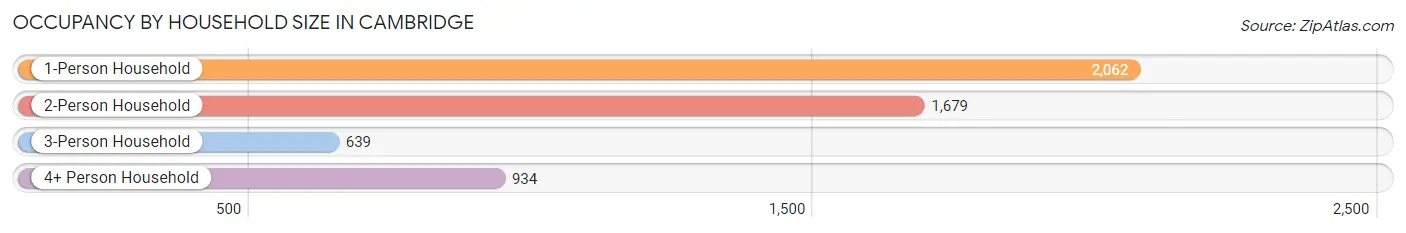
| Household Size | # Housing Units | % Housing Units |
| 1-Person Household | 2,062 | 38.8% |
| 2-Person Household | 1,679 | 31.6% |
| 3-Person Household | 639 | 12.0% |
| 4+ Person Household | 934 | 17.6% |
| Total Housing Units | 5,314 | 100.0% |
Occupancy by Ownership by Household Size in Cambridge
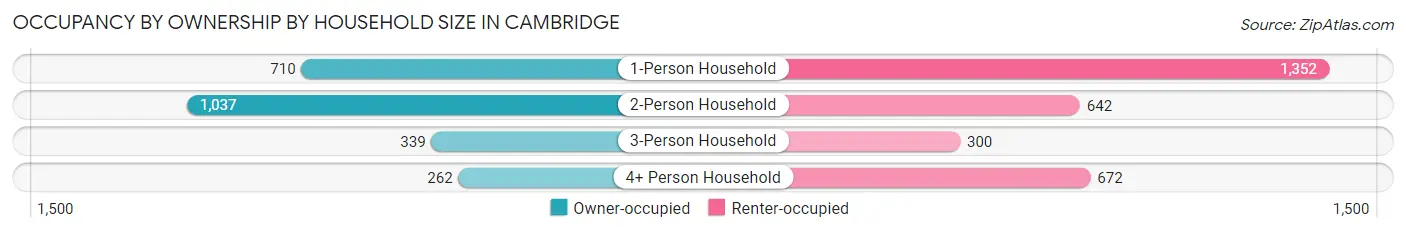
| Household Size | Owner-occupied | Renter-occupied |
| 1-Person Household | 710 (34.4%) | 1,352 (65.6%) |
| 2-Person Household | 1,037 (61.8%) | 642 (38.2%) |
| 3-Person Household | 339 (53.0%) | 300 (46.9%) |
| 4+ Person Household | 262 (28.1%) | 672 (72.0%) |
| Total Housing Units | 2,348 (44.2%) | 2,966 (55.8%) |
Occupancy by Educational Attainment in Cambridge
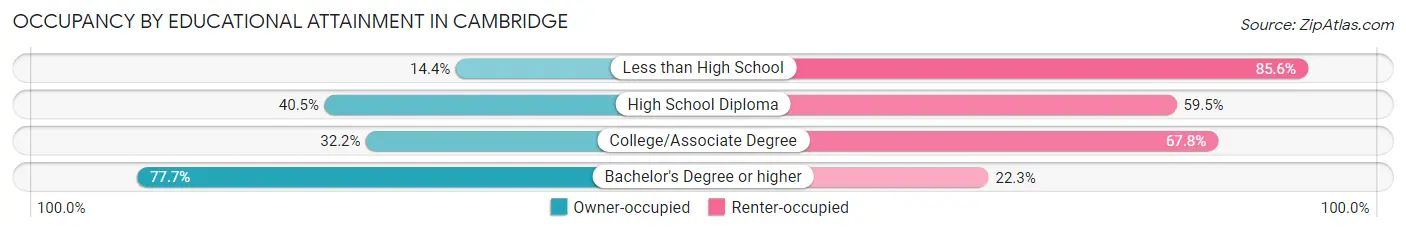
| Household Size | Owner-occupied | Renter-occupied |
| Less than High School | 78 (14.4%) | 462 (85.6%) |
| High School Diploma | 754 (40.5%) | 1,109 (59.5%) |
| College/Associate Degree | 529 (32.2%) | 1,112 (67.8%) |
| Bachelor's Degree or higher | 987 (77.7%) | 283 (22.3%) |
Occupancy by Age of Householder in Cambridge
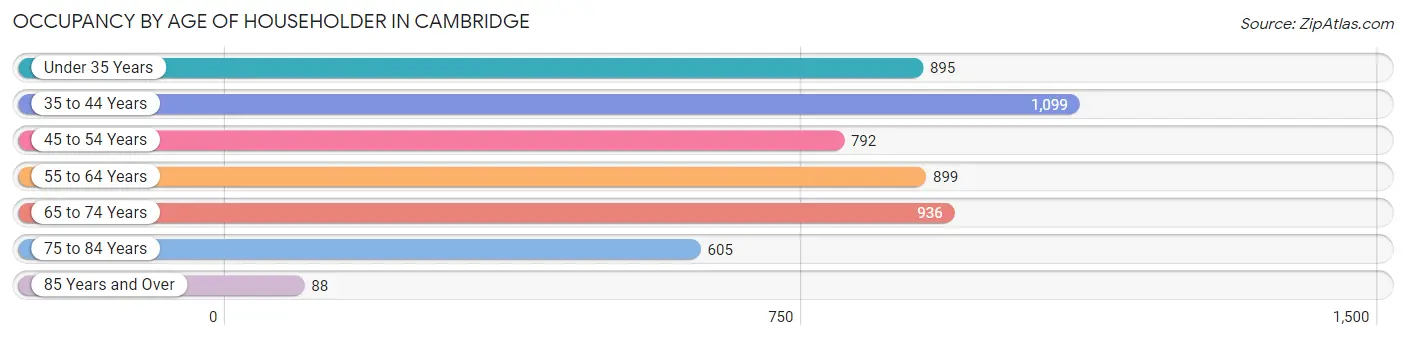
| Age Bracket | # Households | % Households |
| Under 35 Years | 895 | 16.8% |
| 35 to 44 Years | 1,099 | 20.7% |
| 45 to 54 Years | 792 | 14.9% |
| 55 to 64 Years | 899 | 16.9% |
| 65 to 74 Years | 936 | 17.6% |
| 75 to 84 Years | 605 | 11.4% |
| 85 Years and Over | 88 | 1.7% |
| Total | 5,314 | 100.0% |
Housing Finances in Cambridge
Median Income by Occupancy in Cambridge
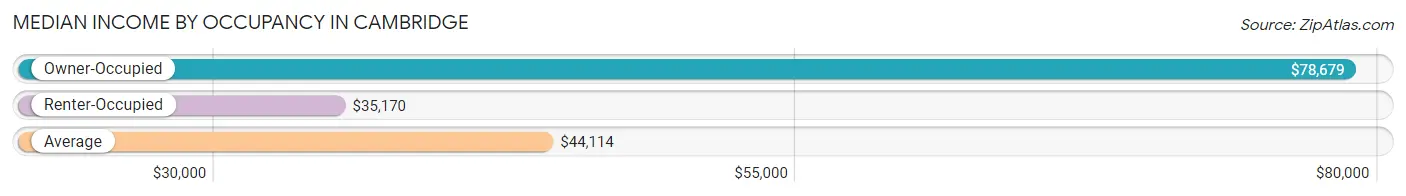
| Occupancy Type | # Households | Median Income |
| Owner-Occupied | 2,348 (44.2%) | $78,679 |
| Renter-Occupied | 2,966 (55.8%) | $35,170 |
| Average | 5,314 (100.0%) | $44,114 |
Occupancy by Householder Income Bracket in Cambridge
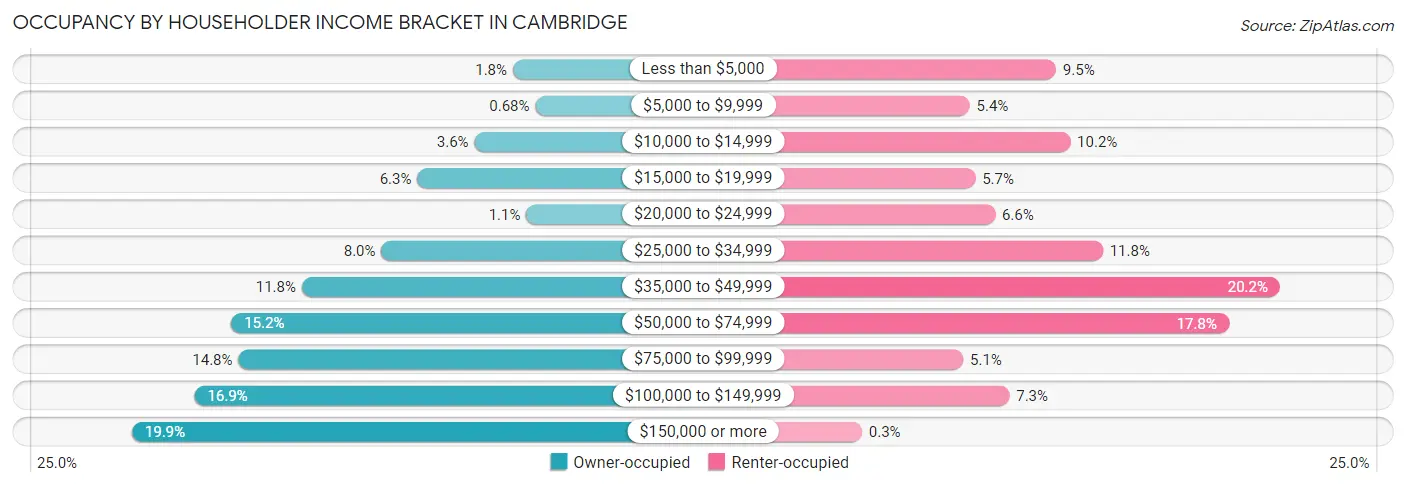
| Income Bracket | Owner-occupied | Renter-occupied |
| Less than $5,000 | 41 (1.8%) | 283 (9.5%) |
| $5,000 to $9,999 | 16 (0.7%) | 161 (5.4%) |
| $10,000 to $14,999 | 84 (3.6%) | 303 (10.2%) |
| $15,000 to $19,999 | 148 (6.3%) | 169 (5.7%) |
| $20,000 to $24,999 | 26 (1.1%) | 197 (6.6%) |
| $25,000 to $34,999 | 188 (8.0%) | 349 (11.8%) |
| $35,000 to $49,999 | 277 (11.8%) | 599 (20.2%) |
| $50,000 to $74,999 | 356 (15.2%) | 527 (17.8%) |
| $75,000 to $99,999 | 348 (14.8%) | 152 (5.1%) |
| $100,000 to $149,999 | 397 (16.9%) | 217 (7.3%) |
| $150,000 or more | 467 (19.9%) | 9 (0.3%) |
| Total | 2,348 (100.0%) | 2,966 (100.0%) |
Monthly Housing Cost Tiers in Cambridge
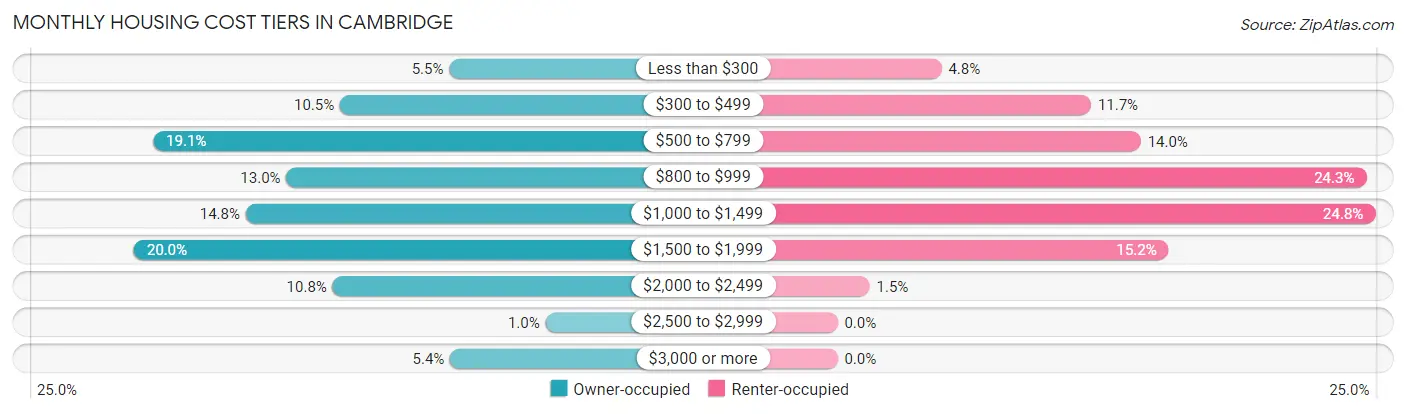
| Monthly Cost | Owner-occupied | Renter-occupied |
| Less than $300 | 128 (5.4%) | 142 (4.8%) |
| $300 to $499 | 246 (10.5%) | 346 (11.7%) |
| $500 to $799 | 448 (19.1%) | 414 (14.0%) |
| $800 to $999 | 304 (13.0%) | 722 (24.3%) |
| $1,000 to $1,499 | 348 (14.8%) | 734 (24.7%) |
| $1,500 to $1,999 | 469 (20.0%) | 452 (15.2%) |
| $2,000 to $2,499 | 254 (10.8%) | 44 (1.5%) |
| $2,500 to $2,999 | 24 (1.0%) | 0 (0.0%) |
| $3,000 or more | 127 (5.4%) | 0 (0.0%) |
| Total | 2,348 (100.0%) | 2,966 (100.0%) |
Physical Housing Characteristics in Cambridge
Housing Structures in Cambridge
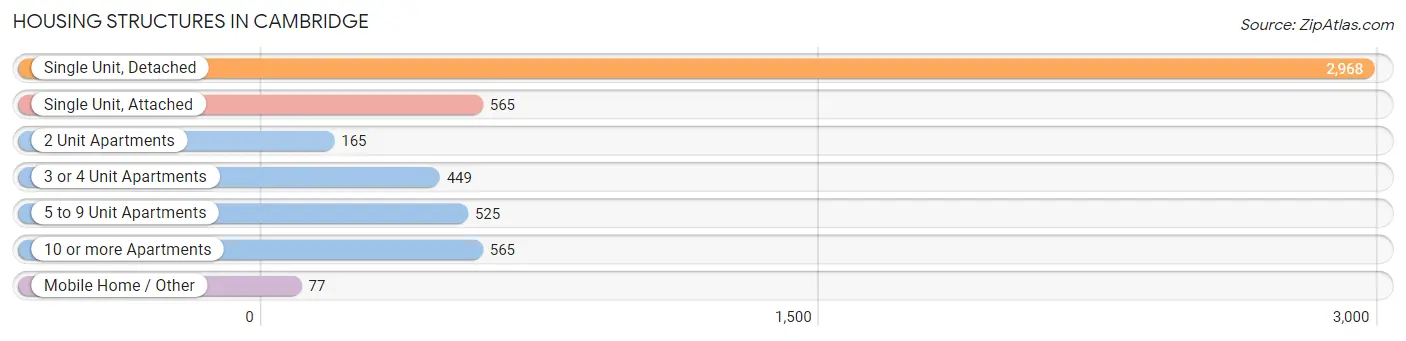
| Structure Type | # Housing Units | % Housing Units |
| Single Unit, Detached | 2,968 | 55.8% |
| Single Unit, Attached | 565 | 10.6% |
| 2 Unit Apartments | 165 | 3.1% |
| 3 or 4 Unit Apartments | 449 | 8.5% |
| 5 to 9 Unit Apartments | 525 | 9.9% |
| 10 or more Apartments | 565 | 10.6% |
| Mobile Home / Other | 77 | 1.5% |
| Total | 5,314 | 100.0% |
Housing Structures by Occupancy in Cambridge
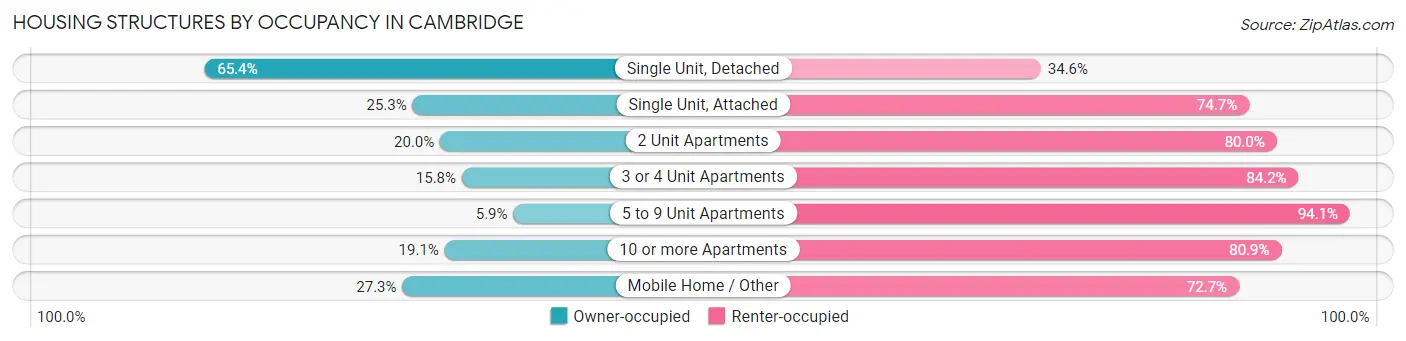
| Structure Type | Owner-occupied | Renter-occupied |
| Single Unit, Detached | 1,941 (65.4%) | 1,027 (34.6%) |
| Single Unit, Attached | 143 (25.3%) | 422 (74.7%) |
| 2 Unit Apartments | 33 (20.0%) | 132 (80.0%) |
| 3 or 4 Unit Apartments | 71 (15.8%) | 378 (84.2%) |
| 5 to 9 Unit Apartments | 31 (5.9%) | 494 (94.1%) |
| 10 or more Apartments | 108 (19.1%) | 457 (80.9%) |
| Mobile Home / Other | 21 (27.3%) | 56 (72.7%) |
| Total | 2,348 (44.2%) | 2,966 (55.8%) |
Housing Structures by Number of Rooms in Cambridge
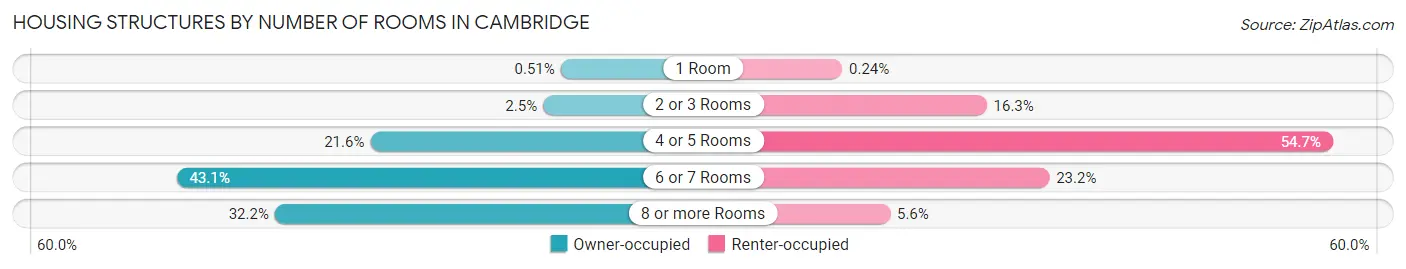
| Number of Rooms | Owner-occupied | Renter-occupied |
| 1 Room | 12 (0.5%) | 7 (0.2%) |
| 2 or 3 Rooms | 58 (2.5%) | 483 (16.3%) |
| 4 or 5 Rooms | 508 (21.6%) | 1,622 (54.7%) |
| 6 or 7 Rooms | 1,013 (43.1%) | 689 (23.2%) |
| 8 or more Rooms | 757 (32.2%) | 165 (5.6%) |
| Total | 2,348 (100.0%) | 2,966 (100.0%) |
Housing Structure by Heating Type in Cambridge
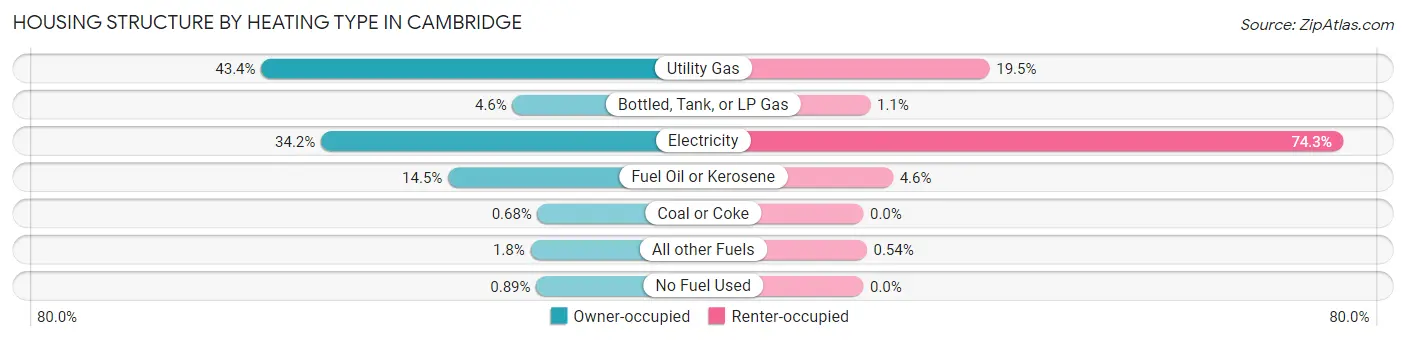
| Heating Type | Owner-occupied | Renter-occupied |
| Utility Gas | 1,019 (43.4%) | 579 (19.5%) |
| Bottled, Tank, or LP Gas | 107 (4.6%) | 32 (1.1%) |
| Electricity | 802 (34.2%) | 2,203 (74.3%) |
| Fuel Oil or Kerosene | 341 (14.5%) | 136 (4.6%) |
| Coal or Coke | 16 (0.7%) | 0 (0.0%) |
| All other Fuels | 42 (1.8%) | 16 (0.5%) |
| No Fuel Used | 21 (0.9%) | 0 (0.0%) |
| Total | 2,348 (100.0%) | 2,966 (100.0%) |
Household Vehicle Usage in Cambridge
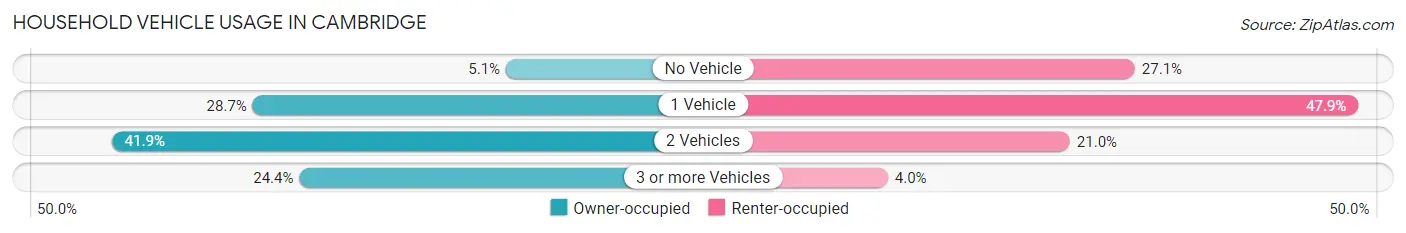
| Vehicles per Household | Owner-occupied | Renter-occupied |
| No Vehicle | 119 (5.1%) | 803 (27.1%) |
| 1 Vehicle | 674 (28.7%) | 1,421 (47.9%) |
| 2 Vehicles | 983 (41.9%) | 623 (21.0%) |
| 3 or more Vehicles | 572 (24.4%) | 119 (4.0%) |
| Total | 2,348 (100.0%) | 2,966 (100.0%) |
Real Estate & Mortgages in Cambridge
Real Estate and Mortgage Overview in Cambridge
| Characteristic | Without Mortgage | With Mortgage |
| Housing Units | 1,034 | 1,314 |
| Median Property Value | $188,900 | $235,100 |
| Median Household Income | $53,462 | $379 |
| Monthly Housing Costs | $620 | $127 |
| Real Estate Taxes | $1,750 | $0 |
Property Value by Mortgage Status in Cambridge
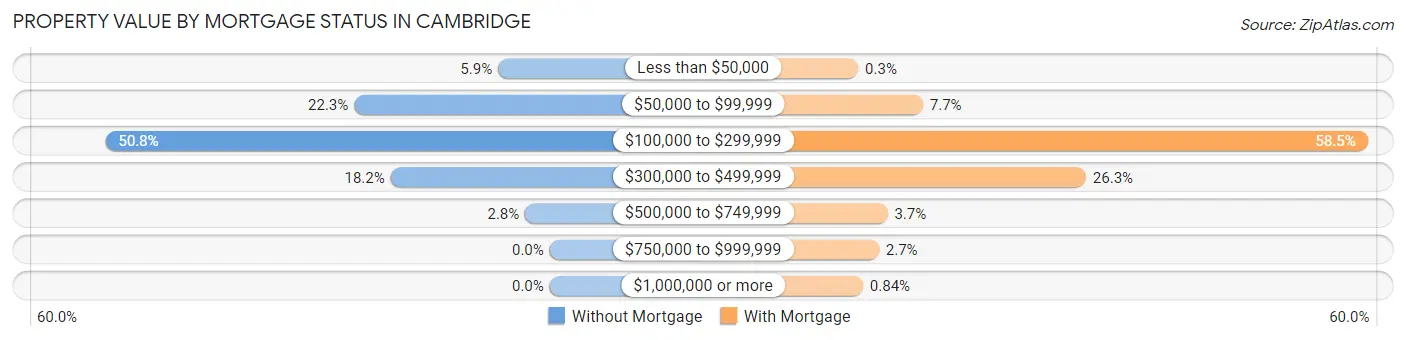
| Property Value | Without Mortgage | With Mortgage |
| Less than $50,000 | 61 (5.9%) | 4 (0.3%) |
| $50,000 to $99,999 | 231 (22.3%) | 101 (7.7%) |
| $100,000 to $299,999 | 525 (50.8%) | 769 (58.5%) |
| $300,000 to $499,999 | 188 (18.2%) | 346 (26.3%) |
| $500,000 to $749,999 | 29 (2.8%) | 48 (3.6%) |
| $750,000 to $999,999 | 0 (0.0%) | 35 (2.7%) |
| $1,000,000 or more | 0 (0.0%) | 11 (0.8%) |
| Total | 1,034 (100.0%) | 1,314 (100.0%) |
Household Income by Mortgage Status in Cambridge
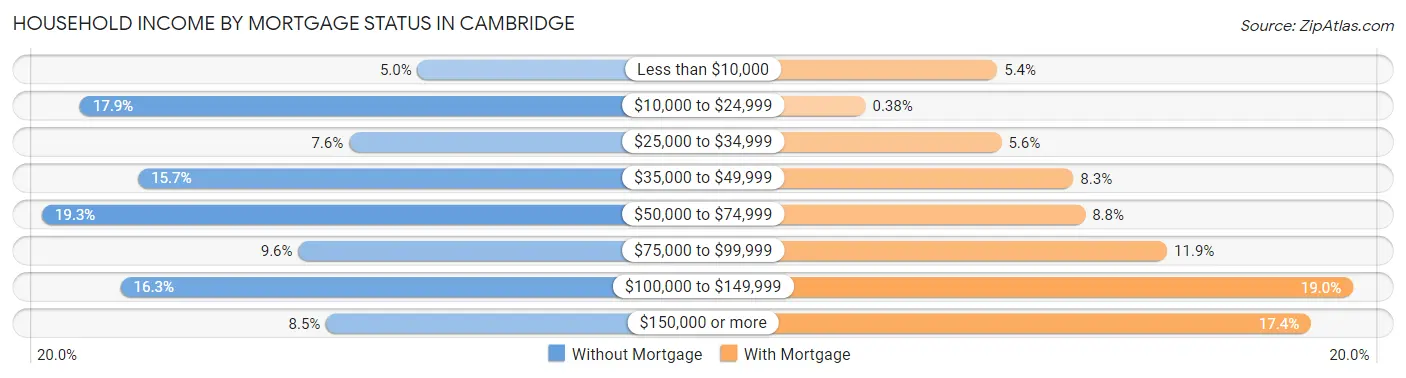
| Household Income | Without Mortgage | With Mortgage |
| Less than $10,000 | 52 (5.0%) | 71 (5.4%) |
| $10,000 to $24,999 | 185 (17.9%) | 5 (0.4%) |
| $25,000 to $34,999 | 79 (7.6%) | 73 (5.6%) |
| $35,000 to $49,999 | 162 (15.7%) | 109 (8.3%) |
| $50,000 to $74,999 | 200 (19.3%) | 115 (8.7%) |
| $75,000 to $99,999 | 99 (9.6%) | 156 (11.9%) |
| $100,000 to $149,999 | 169 (16.3%) | 249 (19.0%) |
| $150,000 or more | 88 (8.5%) | 228 (17.3%) |
| Total | 1,034 (100.0%) | 1,314 (100.0%) |
Property Value to Household Income Ratio in Cambridge
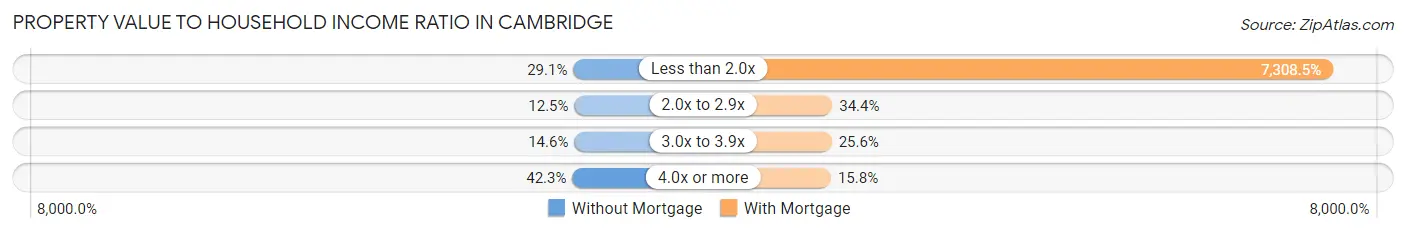
| Value-to-Income Ratio | Without Mortgage | With Mortgage |
| Less than 2.0x | 301 (29.1%) | 96,033 (7,308.5%) |
| 2.0x to 2.9x | 129 (12.5%) | 452 (34.4%) |
| 3.0x to 3.9x | 151 (14.6%) | 336 (25.6%) |
| 4.0x or more | 437 (42.3%) | 208 (15.8%) |
| Total | 1,034 (100.0%) | 1,314 (100.0%) |
Real Estate Taxes by Mortgage Status in Cambridge
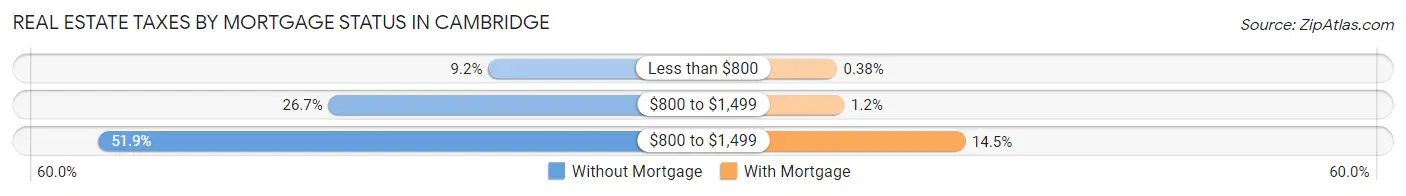
| Property Taxes | Without Mortgage | With Mortgage |
| Less than $800 | 95 (9.2%) | 5 (0.4%) |
| $800 to $1,499 | 276 (26.7%) | 16 (1.2%) |
| $800 to $1,499 | 537 (51.9%) | 190 (14.5%) |
| Total | 1,034 (100.0%) | 1,314 (100.0%) |
Health & Disability in Cambridge
Health Insurance Coverage by Age in Cambridge
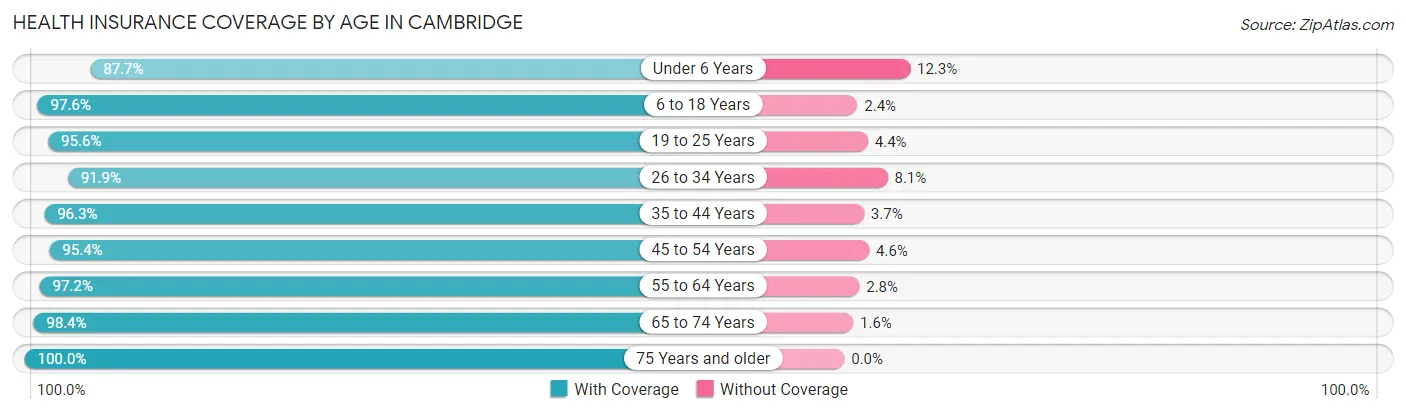
| Age Bracket | With Coverage | Without Coverage |
| Under 6 Years | 988 (87.7%) | 138 (12.3%) |
| 6 to 18 Years | 2,210 (97.6%) | 55 (2.4%) |
| 19 to 25 Years | 980 (95.6%) | 45 (4.4%) |
| 26 to 34 Years | 1,552 (91.9%) | 136 (8.1%) |
| 35 to 44 Years | 1,449 (96.3%) | 55 (3.7%) |
| 45 to 54 Years | 1,175 (95.4%) | 57 (4.6%) |
| 55 to 64 Years | 1,358 (97.2%) | 39 (2.8%) |
| 65 to 74 Years | 1,557 (98.4%) | 26 (1.6%) |
| 75 Years and older | 902 (100.0%) | 0 (0.0%) |
| Total | 12,171 (95.7%) | 551 (4.3%) |
Health Insurance Coverage by Citizenship Status in Cambridge
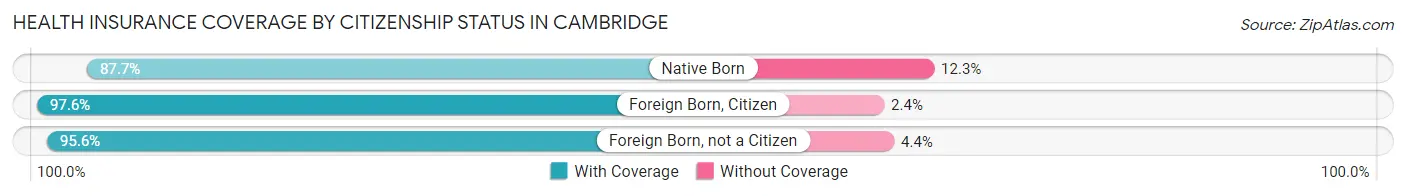
| Citizenship Status | With Coverage | Without Coverage |
| Native Born | 988 (87.7%) | 138 (12.3%) |
| Foreign Born, Citizen | 2,210 (97.6%) | 55 (2.4%) |
| Foreign Born, not a Citizen | 980 (95.6%) | 45 (4.4%) |
Health Insurance Coverage by Household Income in Cambridge
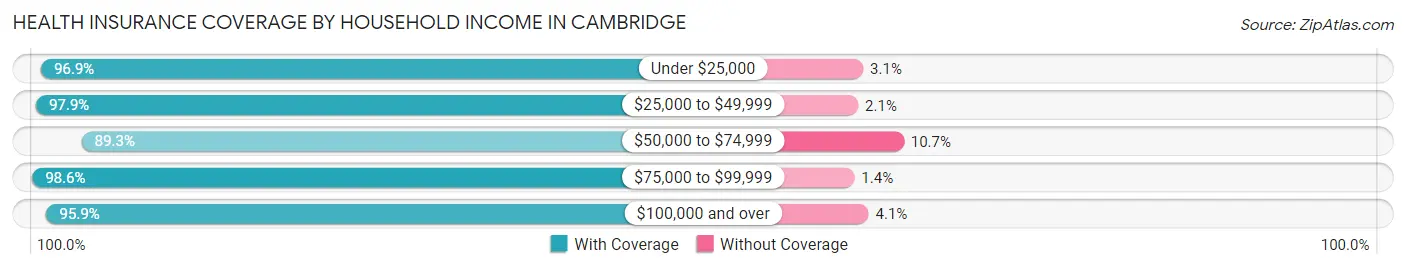
| Household Income | With Coverage | Without Coverage |
| Under $25,000 | 2,687 (96.9%) | 85 (3.1%) |
| $25,000 to $49,999 | 2,848 (97.9%) | 62 (2.1%) |
| $50,000 to $74,999 | 2,140 (89.3%) | 256 (10.7%) |
| $75,000 to $99,999 | 1,378 (98.6%) | 20 (1.4%) |
| $100,000 and over | 2,999 (95.9%) | 128 (4.1%) |
Public vs Private Health Insurance Coverage by Age in Cambridge
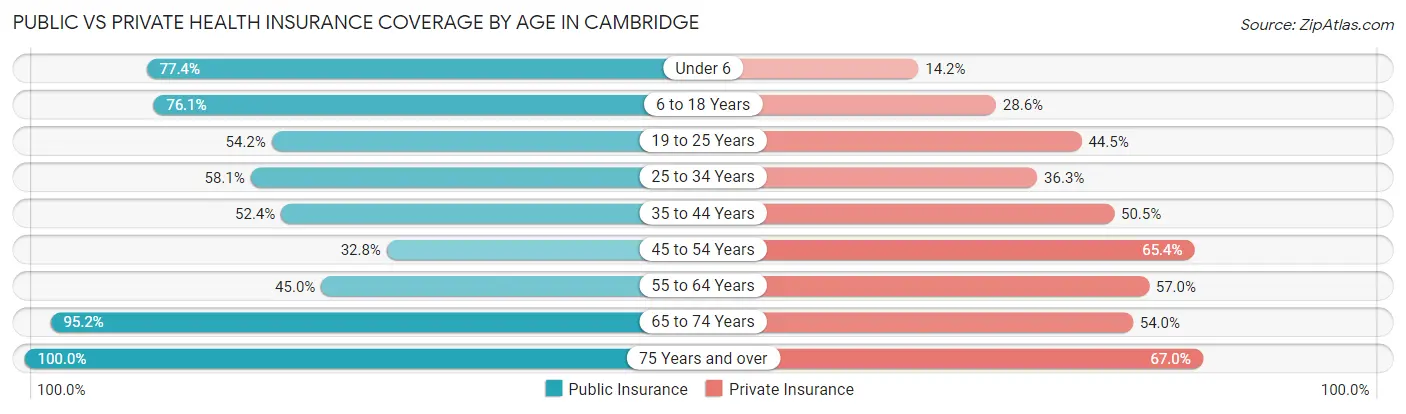
| Age Bracket | Public Insurance | Private Insurance |
| Under 6 | 871 (77.3%) | 160 (14.2%) |
| 6 to 18 Years | 1,724 (76.1%) | 648 (28.6%) |
| 19 to 25 Years | 555 (54.1%) | 456 (44.5%) |
| 25 to 34 Years | 980 (58.1%) | 612 (36.3%) |
| 35 to 44 Years | 788 (52.4%) | 760 (50.5%) |
| 45 to 54 Years | 404 (32.8%) | 806 (65.4%) |
| 55 to 64 Years | 628 (45.0%) | 796 (57.0%) |
| 65 to 74 Years | 1,507 (95.2%) | 855 (54.0%) |
| 75 Years and over | 902 (100.0%) | 604 (67.0%) |
| Total | 8,359 (65.7%) | 5,697 (44.8%) |
Disability Status by Sex by Age in Cambridge
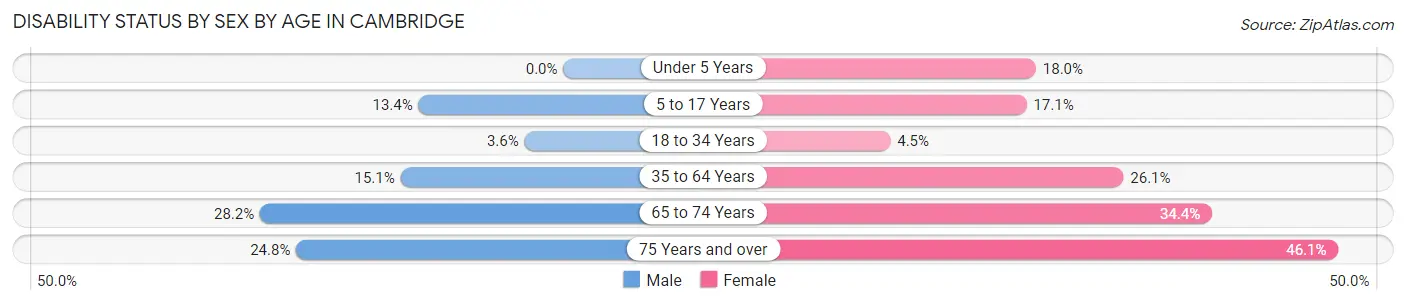
| Age Bracket | Male | Female |
| Under 5 Years | 0 (0.0%) | 56 (18.0%) |
| 5 to 17 Years | 153 (13.4%) | 201 (17.1%) |
| 18 to 34 Years | 52 (3.6%) | 65 (4.5%) |
| 35 to 64 Years | 270 (15.1%) | 613 (26.1%) |
| 65 to 74 Years | 181 (28.1%) | 323 (34.4%) |
| 75 Years and over | 116 (24.8%) | 200 (46.1%) |
Disability Class by Sex by Age in Cambridge
Disability Class: Hearing Difficulty
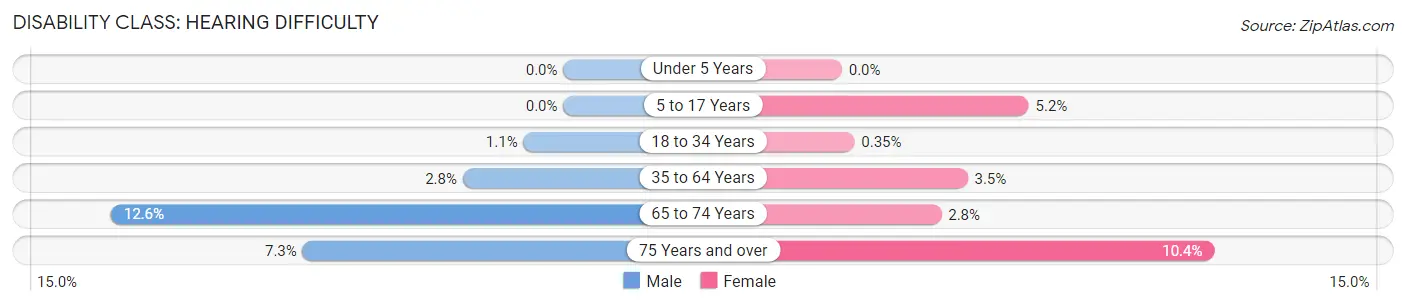
| Age Bracket | Male | Female |
| Under 5 Years | 0 (0.0%) | 0 (0.0%) |
| 5 to 17 Years | 0 (0.0%) | 61 (5.2%) |
| 18 to 34 Years | 16 (1.1%) | 5 (0.4%) |
| 35 to 64 Years | 50 (2.8%) | 82 (3.5%) |
| 65 to 74 Years | 81 (12.6%) | 26 (2.8%) |
| 75 Years and over | 34 (7.3%) | 45 (10.4%) |
Disability Class: Vision Difficulty
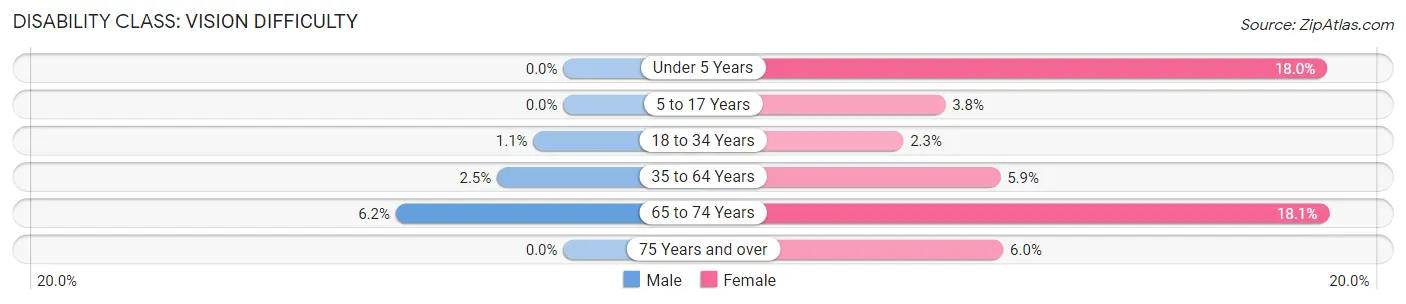
| Age Bracket | Male | Female |
| Under 5 Years | 0 (0.0%) | 56 (18.0%) |
| 5 to 17 Years | 0 (0.0%) | 45 (3.8%) |
| 18 to 34 Years | 16 (1.1%) | 33 (2.3%) |
| 35 to 64 Years | 44 (2.5%) | 138 (5.9%) |
| 65 to 74 Years | 40 (6.2%) | 170 (18.1%) |
| 75 Years and over | 0 (0.0%) | 26 (6.0%) |
Disability Class: Cognitive Difficulty
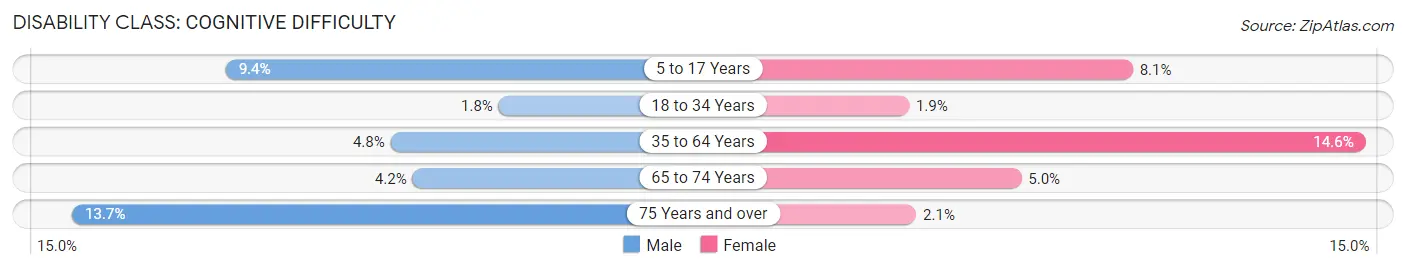
| Age Bracket | Male | Female |
| 5 to 17 Years | 107 (9.4%) | 95 (8.1%) |
| 18 to 34 Years | 26 (1.8%) | 27 (1.9%) |
| 35 to 64 Years | 86 (4.8%) | 342 (14.6%) |
| 65 to 74 Years | 27 (4.2%) | 47 (5.0%) |
| 75 Years and over | 64 (13.7%) | 9 (2.1%) |
Disability Class: Ambulatory Difficulty
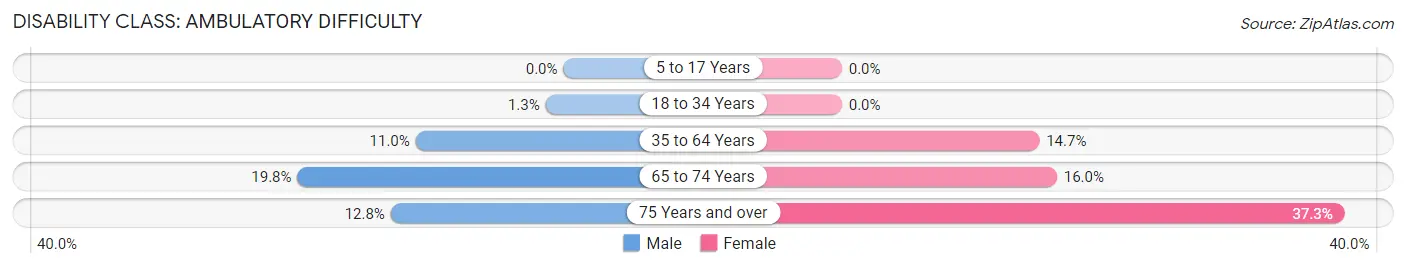
| Age Bracket | Male | Female |
| 5 to 17 Years | 0 (0.0%) | 0 (0.0%) |
| 18 to 34 Years | 19 (1.3%) | 0 (0.0%) |
| 35 to 64 Years | 196 (11.0%) | 344 (14.7%) |
| 65 to 74 Years | 127 (19.8%) | 150 (16.0%) |
| 75 Years and over | 60 (12.8%) | 162 (37.3%) |
Disability Class: Self-Care Difficulty
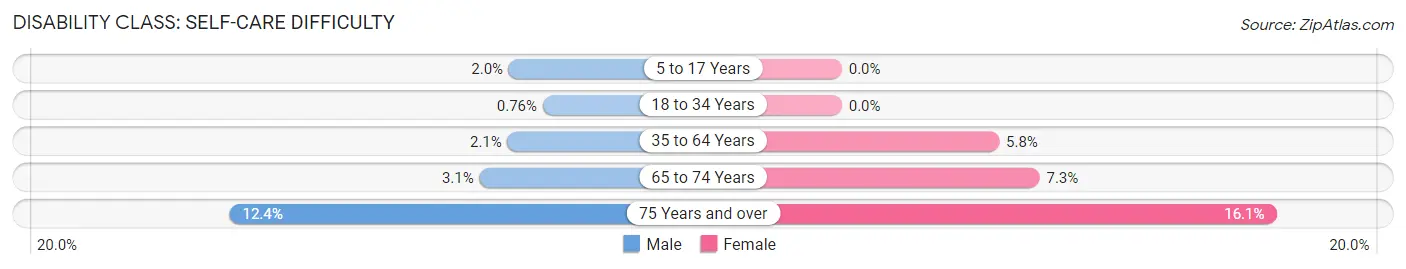
| Age Bracket | Male | Female |
| 5 to 17 Years | 23 (2.0%) | 0 (0.0%) |
| 18 to 34 Years | 11 (0.8%) | 0 (0.0%) |
| 35 to 64 Years | 37 (2.1%) | 137 (5.8%) |
| 65 to 74 Years | 20 (3.1%) | 69 (7.3%) |
| 75 Years and over | 58 (12.4%) | 70 (16.1%) |
Technology Access in Cambridge
Computing Device Access in Cambridge
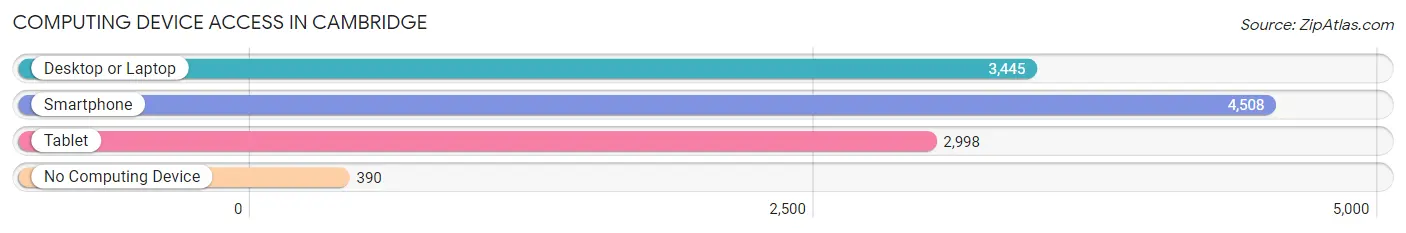
| Device Type | # Households | % Households |
| Desktop or Laptop | 3,445 | 64.8% |
| Smartphone | 4,508 | 84.8% |
| Tablet | 2,998 | 56.4% |
| No Computing Device | 390 | 7.3% |
| Total | 5,314 | 100.0% |
Internet Access in Cambridge
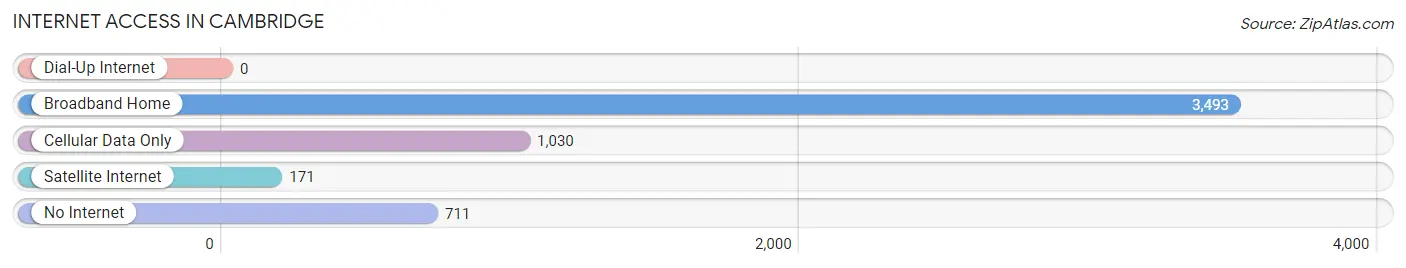
| Internet Type | # Households | % Households |
| Dial-Up Internet | 0 | 0.0% |
| Broadband Home | 3,493 | 65.7% |
| Cellular Data Only | 1,030 | 19.4% |
| Satellite Internet | 171 | 3.2% |
| No Internet | 711 | 13.4% |
| Total | 5,314 | 100.0% |
Cambridge Summary
Cambridge, Maryland is a small city located in Dorchester County on the Eastern Shore of Maryland. It is situated on the banks of the Choptank River, about 30 miles east of Salisbury. The city has a population of 12,326, according to the 2010 census, and is the county seat of Dorchester County.
History
The area that is now Cambridge was first settled in 1684 by English colonists. The town was originally called “New Town” and was renamed Cambridge in 1793. The town was officially incorporated in 1816.
In the 19th century, Cambridge was a major port and shipbuilding center. It was also a major center for the oyster industry. The city was a major stop on the Underground Railroad, and many escaped slaves found refuge in Cambridge.
Geography
Cambridge is located at 38°33′N 76°4′W (38.55, -76.07). It is situated on the banks of the Choptank River, about 30 miles east of Salisbury. The city has a total area of 5.2 square miles, of which 4.9 square miles is land and 0.3 square miles is water.
Economy
Cambridge’s economy is largely based on tourism, agriculture, and manufacturing. The city is home to several seafood processing plants, as well as a number of boatbuilding and repair businesses. The city is also home to a number of retail stores, restaurants, and other businesses.
Demographics
As of the 2010 census, there were 12,326 people, 4,845 households, and 2,945 families residing in the city. The population density was 2,500.3 people per square mile. The racial makeup of the city was 57.2% White, 37.3% African American, 0.4% Native American, 1.2% Asian, 0.1% Pacific Islander, 1.2% from other races, and 2.6% from two or more races. Hispanic or Latino of any race were 3.3% of the population.
The median income for a household in the city was $33,917, and the median income for a family was $41,945. The per capita income for the city was $17,845. About 17.2% of families and 20.7% of the population were below the poverty line, including 28.2% of those under age 18 and 11.2% of those age 65 or over.
Common Questions
What is Per Capita Income in Cambridge?
Per Capita income in Cambridge is $27,408.
What is the Median Family Income in Cambridge?
Median Family Income in Cambridge is $54,532.
What is the Median Household income in Cambridge?
Median Household Income in Cambridge is $44,114.
What is Income or Wage Gap in Cambridge?
Income or Wage Gap in Cambridge is 20.0%.
Women in Cambridge earn 80.0 cents for every dollar earned by a man.
What is Family Income Deficit in Cambridge?
Family Income Deficit in Cambridge is $11,036.
Families that are below poverty line in Cambridge earn $11,036 less on average than the poverty threshold level.
What is Inequality or Gini Index in Cambridge?
Inequality or Gini Index in Cambridge is 0.48.
What is the Total Population of Cambridge?
Total Population of Cambridge is 13,058.
What is the Total Male Population of Cambridge?
Total Male Population of Cambridge is 6,307.
What is the Total Female Population of Cambridge?
Total Female Population of Cambridge is 6,751.
What is the Ratio of Males per 100 Females in Cambridge?
There are 93.42 Males per 100 Females in Cambridge.
What is the Ratio of Females per 100 Males in Cambridge?
There are 107.04 Females per 100 Males in Cambridge.
What is the Median Population Age in Cambridge?
Median Population Age in Cambridge is 37.3 Years.
What is the Average Family Size in Cambridge
Average Family Size in Cambridge is 3.2 People.
What is the Average Household Size in Cambridge
Average Household Size in Cambridge is 2.4 People.
How Large is the Labor Force in Cambridge?
There are 6,251 People in the Labor Forcein in Cambridge.
What is the Percentage of People in the Labor Force in Cambridge?
60.3% of People are in the Labor Force in Cambridge.
What is the Unemployment Rate in Cambridge?
Unemployment Rate in Cambridge is 7.2%.