Poughkeepsie, NY Map & Demographics
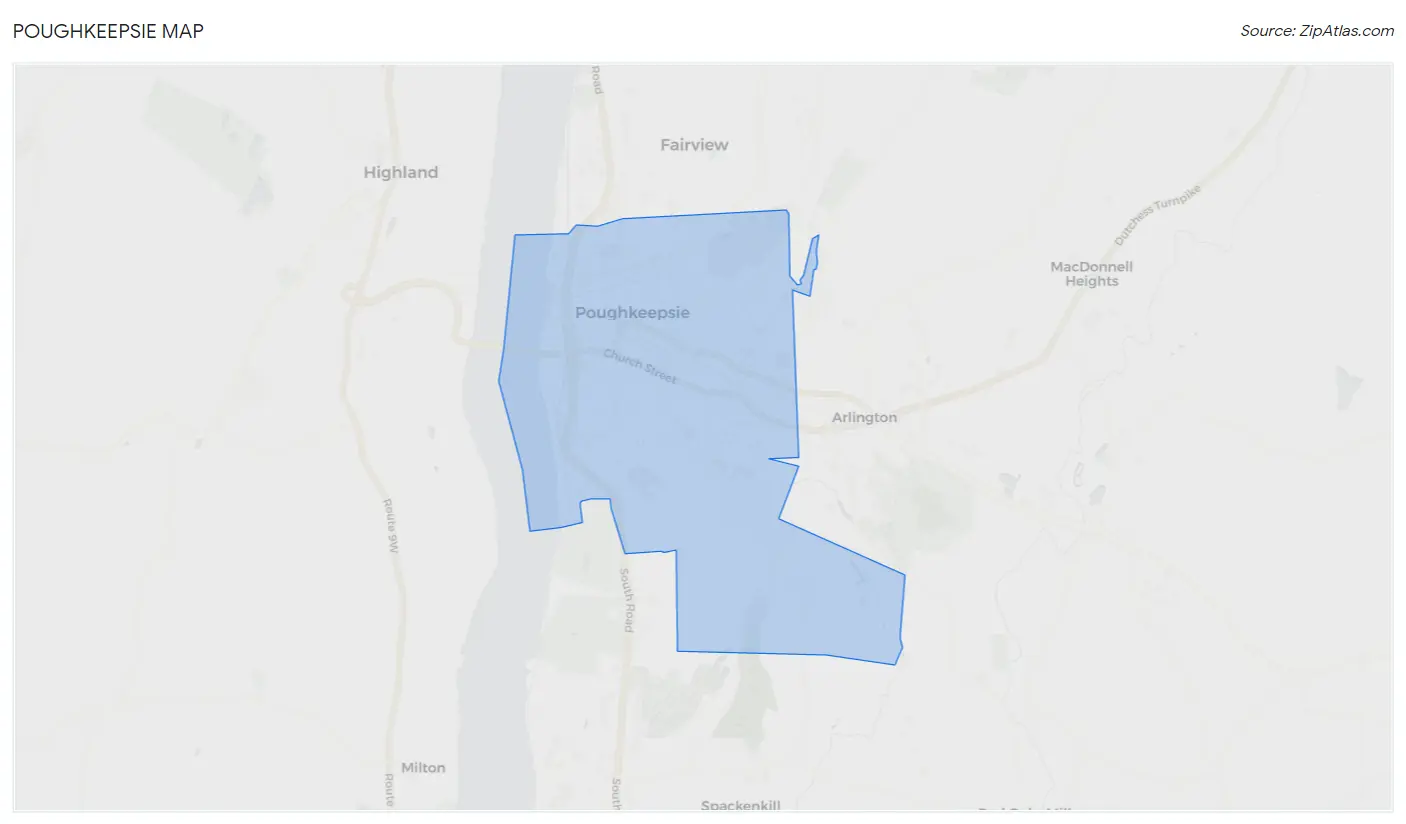
Poughkeepsie Map
Poughkeepsie Overview
$41,582
PER CAPITA INCOME
$70,023
AVG FAMILY INCOME
$53,875
AVG HOUSEHOLD INCOME
21.8%
WAGE / INCOME GAP [ % ]
78.2¢/ $1
WAGE / INCOME GAP [ $ ]
0.57
INEQUALITY / GINI INDEX
31,717
TOTAL POPULATION
14,912
MALE POPULATION
16,805
FEMALE POPULATION
88.74
MALES / 100 FEMALES
112.69
FEMALES / 100 MALES
37.8
MEDIAN AGE
3.2
AVG FAMILY SIZE
2.3
AVG HOUSEHOLD SIZE
16,252
LABOR FORCE [ PEOPLE ]
62.6%
PERCENT IN LABOR FORCE
7.3%
UNEMPLOYMENT RATE
Income in Poughkeepsie
Income Overview in Poughkeepsie
Per Capita Income in Poughkeepsie is $41,582, while median incomes of families and households are $70,023 and $53,875 respectively.
| Characteristic | Number | Measure |
| Per Capita Income | 31,717 | $41,582 |
| Median Family Income | 6,710 | $70,023 |
| Mean Family Income | 6,710 | $95,691 |
| Median Household Income | 13,591 | $53,875 |
| Mean Household Income | 13,591 | $92,652 |
| Income Deficit | 6,710 | $0 |
| Wage / Income Gap (%) | 31,717 | 21.76% |
| Wage / Income Gap ($) | 31,717 | 78.24¢ per $1 |
| Gini / Inequality Index | 31,717 | 0.57 |
Earnings by Sex in Poughkeepsie
Average Earnings in Poughkeepsie are $34,386, $39,291 for men and $30,742 for women, a difference of 21.8%.
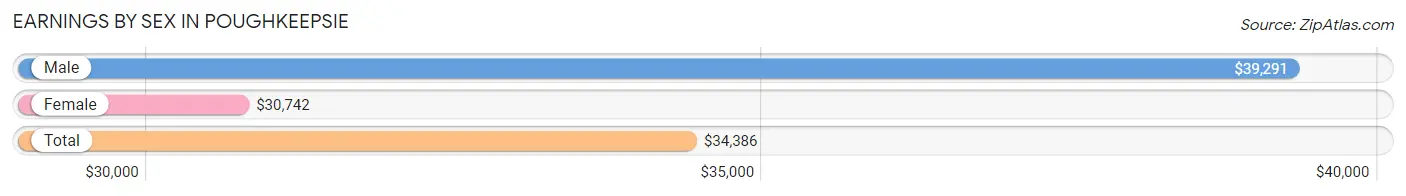
| Sex | Number | Average Earnings |
| Male | 7,993 (47.8%) | $39,291 |
| Female | 8,723 (52.2%) | $30,742 |
| Total | 16,716 (100.0%) | $34,386 |
Earnings by Sex by Income Bracket in Poughkeepsie
The most common earnings brackets in Poughkeepsie are $100,000+ for men (1,145 | 14.3%) and $25,000 to $29,999 for women (884 | 10.1%).
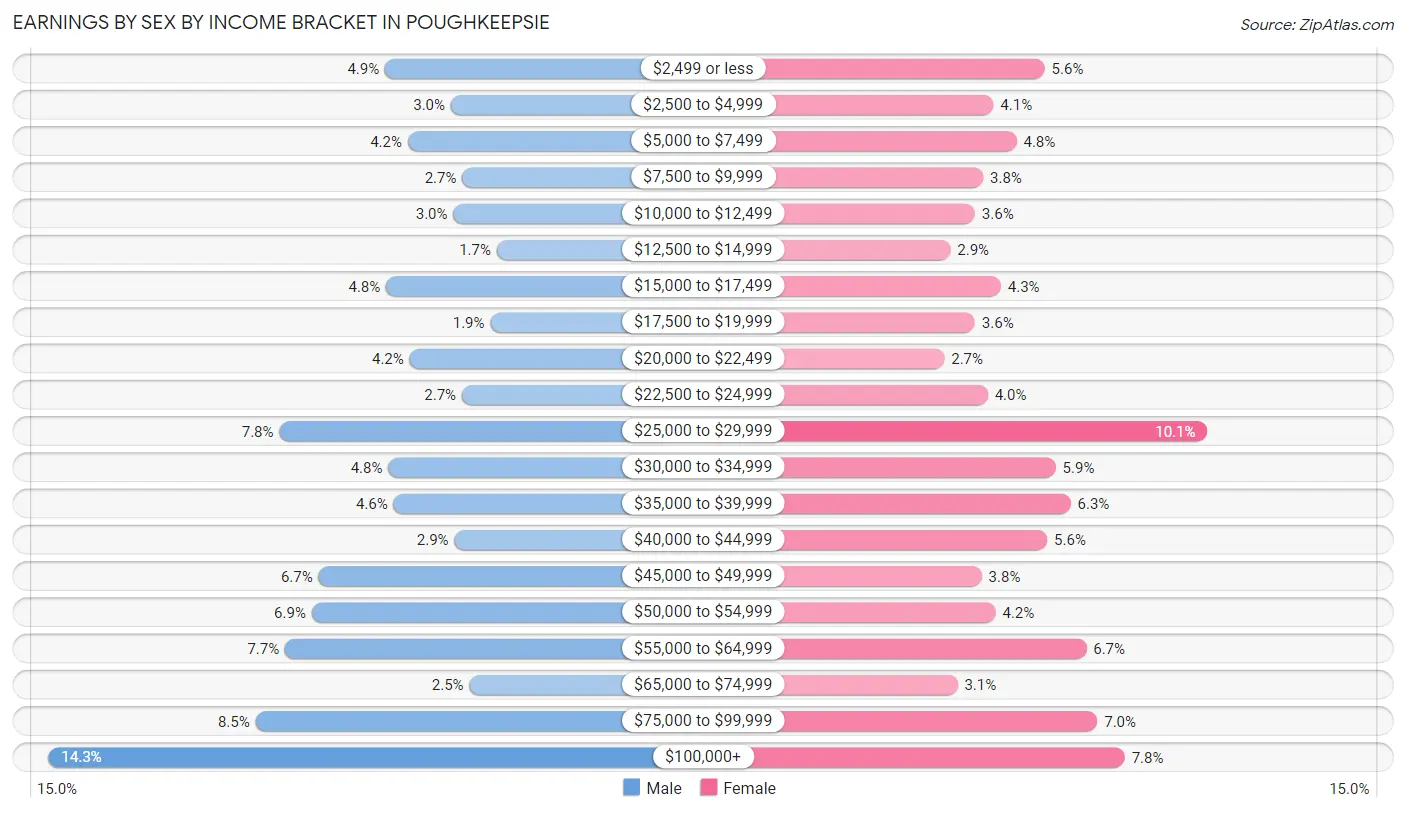
| Income | Male | Female |
| $2,499 or less | 389 (4.9%) | 485 (5.6%) |
| $2,500 to $4,999 | 241 (3.0%) | 359 (4.1%) |
| $5,000 to $7,499 | 338 (4.2%) | 416 (4.8%) |
| $7,500 to $9,999 | 216 (2.7%) | 334 (3.8%) |
| $10,000 to $12,499 | 236 (2.9%) | 314 (3.6%) |
| $12,500 to $14,999 | 138 (1.7%) | 254 (2.9%) |
| $15,000 to $17,499 | 387 (4.8%) | 378 (4.3%) |
| $17,500 to $19,999 | 153 (1.9%) | 314 (3.6%) |
| $20,000 to $22,499 | 334 (4.2%) | 239 (2.7%) |
| $22,500 to $24,999 | 217 (2.7%) | 345 (4.0%) |
| $25,000 to $29,999 | 627 (7.8%) | 884 (10.1%) |
| $30,000 to $34,999 | 382 (4.8%) | 512 (5.9%) |
| $35,000 to $39,999 | 370 (4.6%) | 549 (6.3%) |
| $40,000 to $44,999 | 233 (2.9%) | 491 (5.6%) |
| $45,000 to $49,999 | 539 (6.7%) | 331 (3.8%) |
| $50,000 to $54,999 | 554 (6.9%) | 365 (4.2%) |
| $55,000 to $64,999 | 614 (7.7%) | 587 (6.7%) |
| $65,000 to $74,999 | 200 (2.5%) | 271 (3.1%) |
| $75,000 to $99,999 | 680 (8.5%) | 614 (7.0%) |
| $100,000+ | 1,145 (14.3%) | 681 (7.8%) |
| Total | 7,993 (100.0%) | 8,723 (100.0%) |
Earnings by Sex by Educational Attainment in Poughkeepsie
Average earnings in Poughkeepsie are $45,154 for men and $34,334 for women, a difference of 24.0%. Men with an educational attainment of graduate degree enjoy the highest average annual earnings of $105,248, while those with less than high school education earn the least with $24,351. Women with an educational attainment of graduate degree earn the most with the average annual earnings of $70,911, while those with less than high school education have the smallest earnings of $17,486.
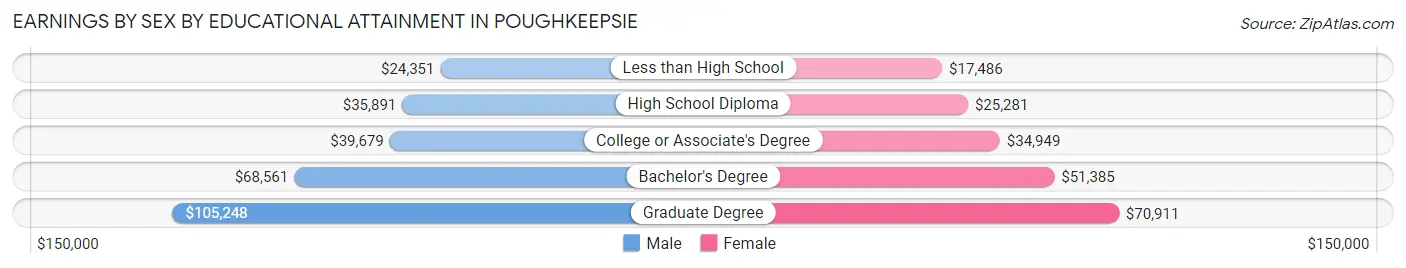
| Educational Attainment | Male Income | Female Income |
| Less than High School | $24,351 | $17,486 |
| High School Diploma | $35,891 | $25,281 |
| College or Associate's Degree | $39,679 | $34,949 |
| Bachelor's Degree | $68,561 | $51,385 |
| Graduate Degree | $105,248 | $70,911 |
| Total | $45,154 | $34,334 |
Family Income in Poughkeepsie
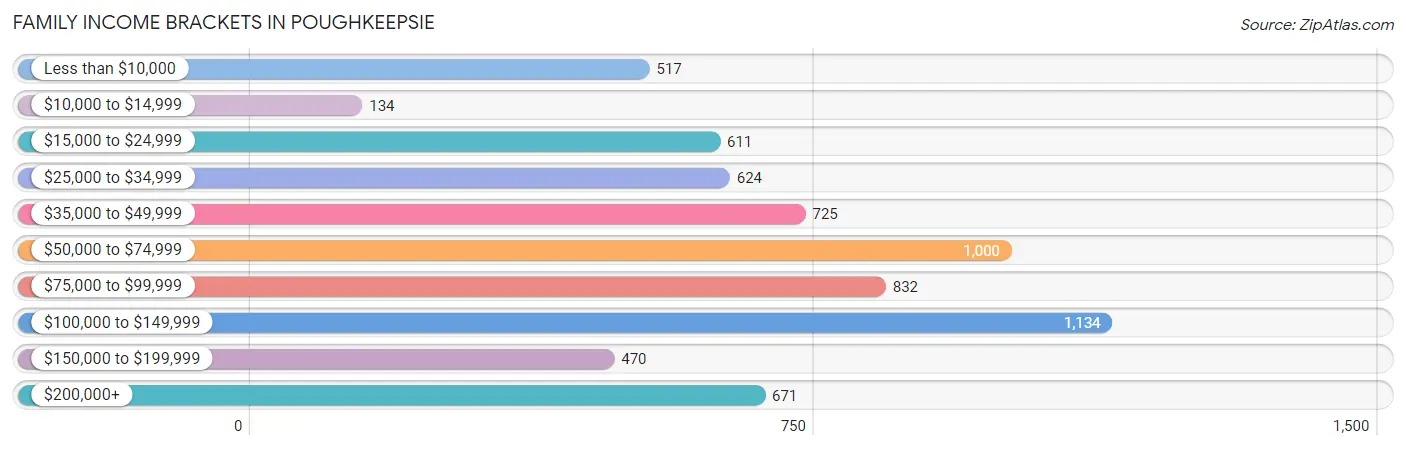
Family Income Brackets in Poughkeepsie
According to the Poughkeepsie family income data, there are 1,134 families falling into the $100,000 to $149,999 income range, which is the most common income bracket and makes up 16.9% of all families. Conversely, the $10,000 to $14,999 income bracket is the least frequent group with only 134 families (2.0%) belonging to this category.
| Income Bracket | # Families | % Families |
| Less than $10,000 | 517 | 7.7% |
| $10,000 to $14,999 | 134 | 2.0% |
| $15,000 to $24,999 | 611 | 9.1% |
| $25,000 to $34,999 | 624 | 9.3% |
| $35,000 to $49,999 | 725 | 10.8% |
| $50,000 to $74,999 | 1,000 | 14.9% |
| $75,000 to $99,999 | 832 | 12.4% |
| $100,000 to $149,999 | 1,134 | 16.9% |
| $150,000 to $199,999 | 470 | 7.0% |
| $200,000+ | 671 | 10.0% |
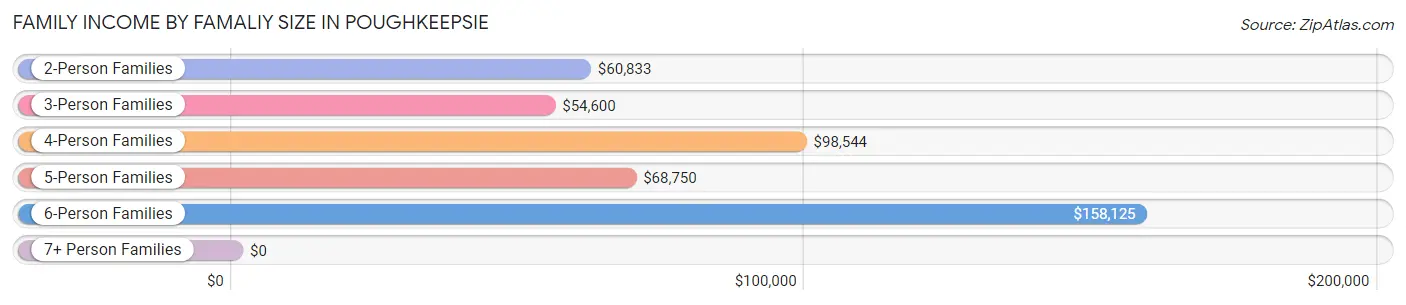
Family Income by Famaliy Size in Poughkeepsie
6-person families (163 | 2.4%) account for the highest median family income in Poughkeepsie with $158,125 per family, while 2-person families (3,114 | 46.4%) have the highest median income of $30,416 per family member.
| Income Bracket | # Families | Median Income |
| 2-Person Families | 3,114 (46.4%) | $60,833 |
| 3-Person Families | 1,698 (25.3%) | $54,600 |
| 4-Person Families | 1,120 (16.7%) | $98,544 |
| 5-Person Families | 594 (8.8%) | $68,750 |
| 6-Person Families | 163 (2.4%) | $158,125 |
| 7+ Person Families | 21 (0.3%) | $0 |
| Total | 6,710 (100.0%) | $70,023 |
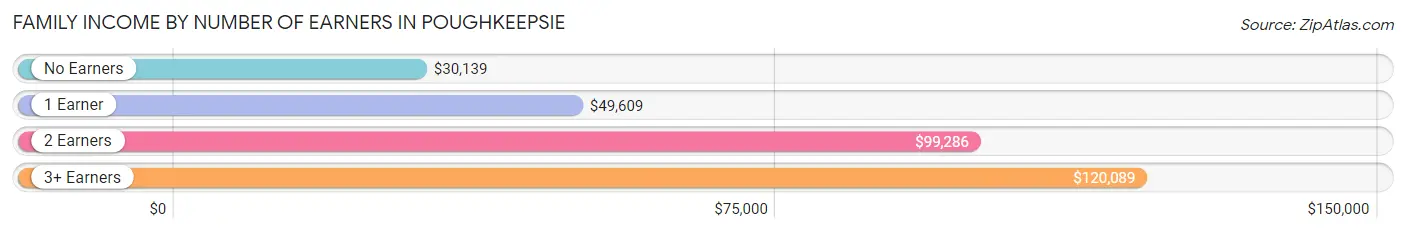
Family Income by Number of Earners in Poughkeepsie
The median family income in Poughkeepsie is $70,023, with families comprising 3+ earners (707) having the highest median family income of $120,089, while families with no earners (892) have the lowest median family income of $30,139, accounting for 10.5% and 13.3% of families, respectively.
| Number of Earners | # Families | Median Income |
| No Earners | 892 (13.3%) | $30,139 |
| 1 Earner | 2,779 (41.4%) | $49,609 |
| 2 Earners | 2,332 (34.7%) | $99,286 |
| 3+ Earners | 707 (10.5%) | $120,089 |
| Total | 6,710 (100.0%) | $70,023 |
Household Income in Poughkeepsie
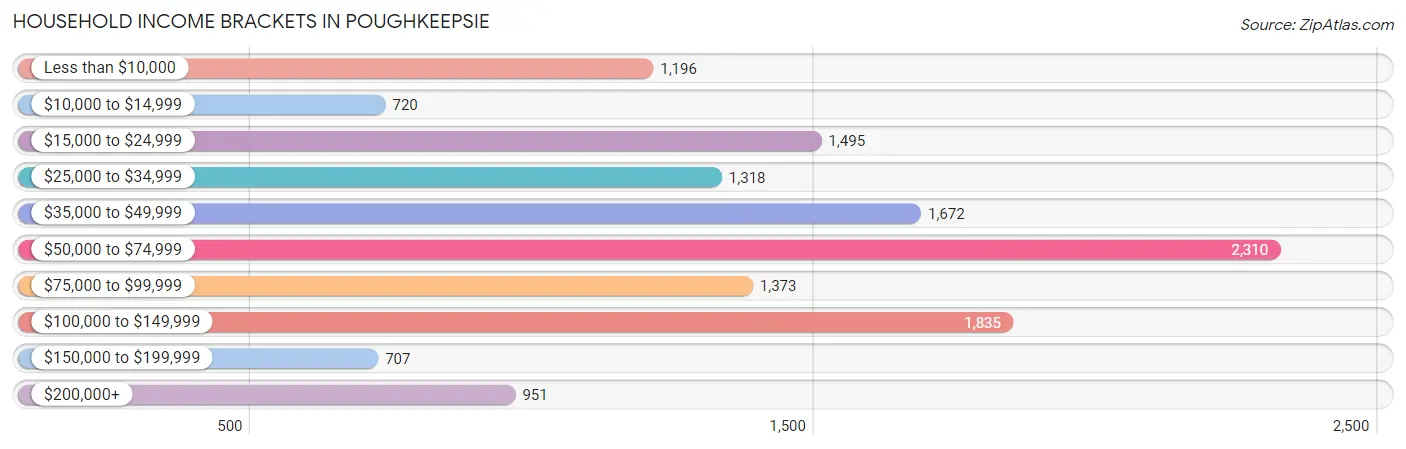
Household Income Brackets in Poughkeepsie
With 2,310 households falling in the category, the $50,000 to $74,999 income range is the most frequent in Poughkeepsie, accounting for 17.0% of all households. In contrast, only 707 households (5.2%) fall into the $150,000 to $199,999 income bracket, making it the least populous group.
| Income Bracket | # Households | % Households |
| Less than $10,000 | 1,196 | 8.8% |
| $10,000 to $14,999 | 720 | 5.3% |
| $15,000 to $24,999 | 1,495 | 11.0% |
| $25,000 to $34,999 | 1,318 | 9.7% |
| $35,000 to $49,999 | 1,672 | 12.3% |
| $50,000 to $74,999 | 2,310 | 17.0% |
| $75,000 to $99,999 | 1,373 | 10.1% |
| $100,000 to $149,999 | 1,835 | 13.5% |
| $150,000 to $199,999 | 707 | 5.2% |
| $200,000+ | 951 | 7.0% |
Household Income by Householder Age in Poughkeepsie
The median household income in Poughkeepsie is $53,875, with the highest median household income of $58,813 found in the 45 to 64 years age bracket for the primary householder. A total of 4,437 households (32.7%) fall into this category. Meanwhile, the 15 to 24 years age bracket for the primary householder has the lowest median household income of $21,813, with 299 households (2.2%) in this group.
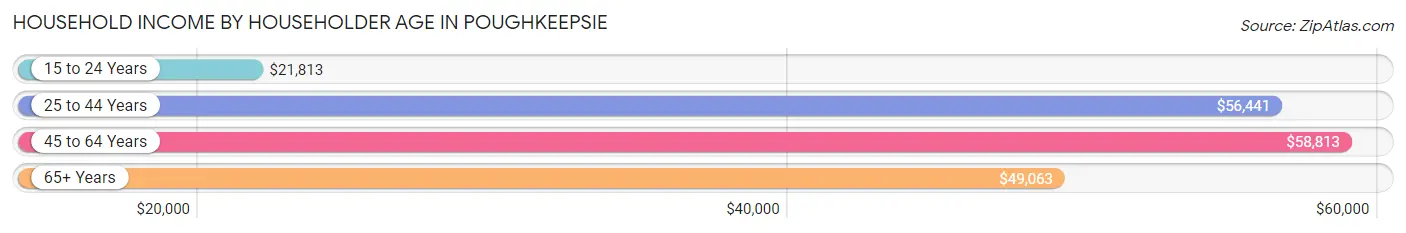
| Income Bracket | # Households | Median Income |
| 15 to 24 Years | 299 (2.2%) | $21,813 |
| 25 to 44 Years | 4,872 (35.8%) | $56,441 |
| 45 to 64 Years | 4,437 (32.7%) | $58,813 |
| 65+ Years | 3,983 (29.3%) | $49,063 |
| Total | 13,591 (100.0%) | $53,875 |
Poverty in Poughkeepsie
Income Below Poverty by Sex and Age in Poughkeepsie
With 17.5% poverty level for males and 19.0% for females among the residents of Poughkeepsie, 5 year old males and 15 year old females are the most vulnerable to poverty, with 86 males (47.0%) and 73 females (37.1%) in their respective age groups living below the poverty level.
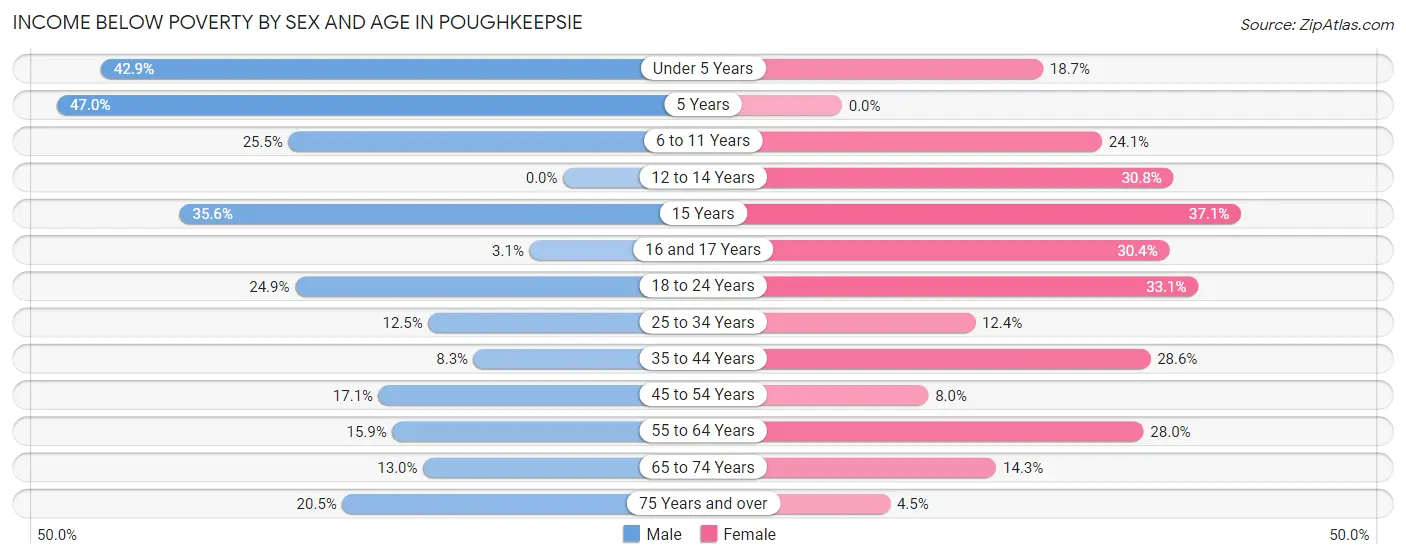
| Age Bracket | Male | Female |
| Under 5 Years | 282 (42.9%) | 195 (18.7%) |
| 5 Years | 86 (47.0%) | 0 (0.0%) |
| 6 to 11 Years | 391 (25.5%) | 147 (24.1%) |
| 12 to 14 Years | 0 (0.0%) | 146 (30.8%) |
| 15 Years | 83 (35.6%) | 73 (37.1%) |
| 16 and 17 Years | 4 (3.1%) | 90 (30.4%) |
| 18 to 24 Years | 377 (24.9%) | 457 (33.1%) |
| 25 to 34 Years | 307 (12.5%) | 375 (12.4%) |
| 35 to 44 Years | 160 (8.3%) | 697 (28.6%) |
| 45 to 54 Years | 243 (17.1%) | 167 (8.0%) |
| 55 to 64 Years | 273 (15.9%) | 477 (28.0%) |
| 65 to 74 Years | 167 (13.0%) | 264 (14.3%) |
| 75 Years and over | 169 (20.5%) | 56 (4.5%) |
| Total | 2,542 (17.5%) | 3,144 (19.0%) |
Income Above Poverty by Sex and Age in Poughkeepsie
According to the poverty statistics in Poughkeepsie, males aged 12 to 14 years and females aged 5 years are the age groups that are most secure financially, with 100.0% of males and 100.0% of females in these age groups living above the poverty line.
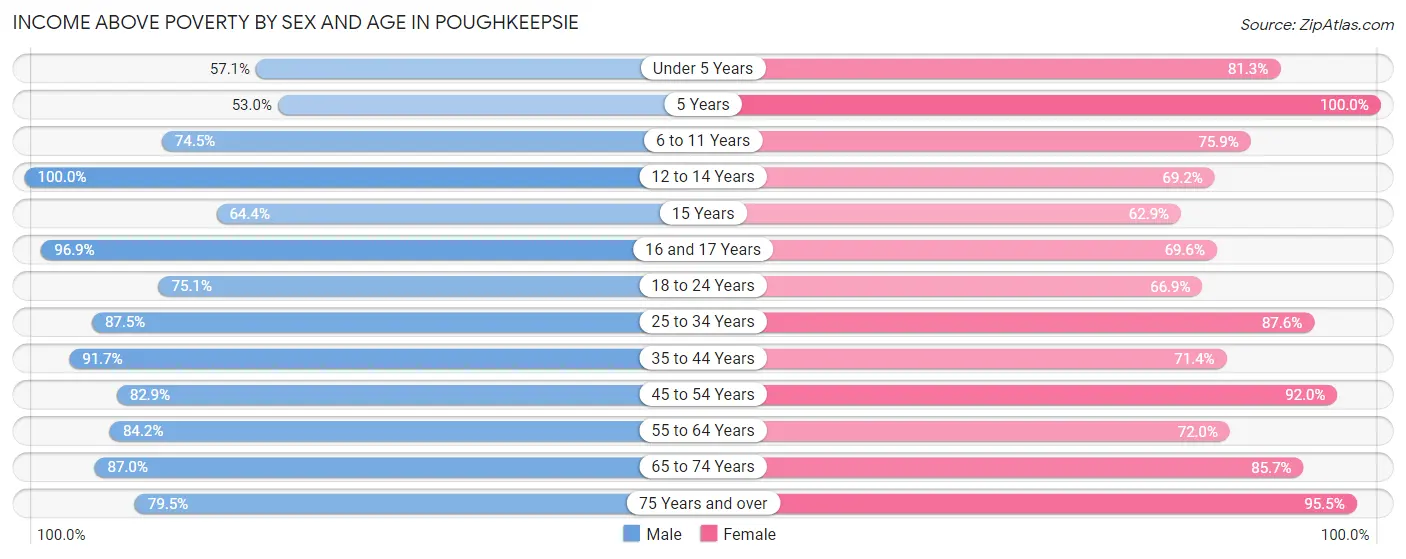
| Age Bracket | Male | Female |
| Under 5 Years | 375 (57.1%) | 850 (81.3%) |
| 5 Years | 97 (53.0%) | 178 (100.0%) |
| 6 to 11 Years | 1,143 (74.5%) | 462 (75.9%) |
| 12 to 14 Years | 632 (100.0%) | 328 (69.2%) |
| 15 Years | 150 (64.4%) | 124 (62.9%) |
| 16 and 17 Years | 124 (96.9%) | 206 (69.6%) |
| 18 to 24 Years | 1,138 (75.1%) | 924 (66.9%) |
| 25 to 34 Years | 2,148 (87.5%) | 2,658 (87.6%) |
| 35 to 44 Years | 1,767 (91.7%) | 1,738 (71.4%) |
| 45 to 54 Years | 1,176 (82.9%) | 1,915 (92.0%) |
| 55 to 64 Years | 1,449 (84.2%) | 1,227 (72.0%) |
| 65 to 74 Years | 1,119 (87.0%) | 1,580 (85.7%) |
| 75 Years and over | 656 (79.5%) | 1,196 (95.5%) |
| Total | 11,974 (82.5%) | 13,386 (81.0%) |
Income Below Poverty Among Married-Couple Families in Poughkeepsie
The poverty statistics for married-couple families in Poughkeepsie show that 4.4% or 154 of the total 3,505 families live below the poverty line. Families with 1 or 2 children have the highest poverty rate of 5.4%, comprising of 67 families. On the other hand, families with 3 or 4 children have the lowest poverty rate of 0.0%, which includes 0 families.
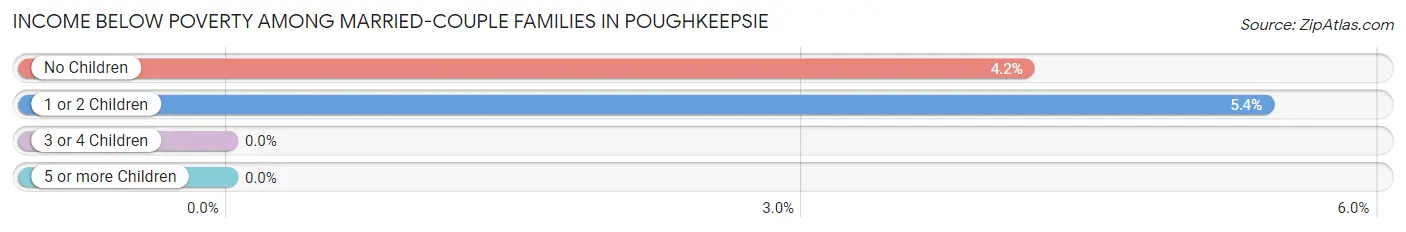
| Children | Above Poverty | Below Poverty |
| No Children | 2,006 (95.8%) | 87 (4.2%) |
| 1 or 2 Children | 1,171 (94.6%) | 67 (5.4%) |
| 3 or 4 Children | 174 (100.0%) | 0 (0.0%) |
| 5 or more Children | 0 (0.0%) | 0 (0.0%) |
| Total | 3,351 (95.6%) | 154 (4.4%) |
Income Below Poverty Among Single-Parent Households in Poughkeepsie
According to the poverty data in Poughkeepsie, 11.6% or 54 single-father households and 31.0% or 850 single-mother households are living below the poverty line. Among single-father households, those with no children have the highest poverty rate, with 41 households (19.4%) experiencing poverty. Likewise, among single-mother households, those with 3 or 4 children have the highest poverty rate, with 130 households (65.0%) falling below the poverty line.
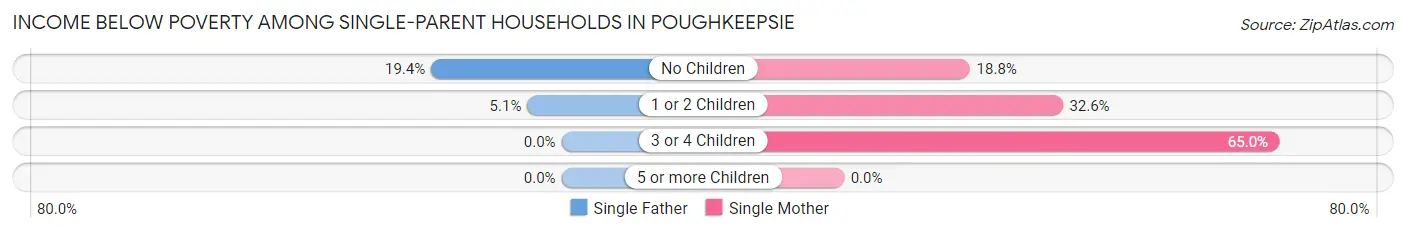
| Children | Single Father | Single Mother |
| No Children | 41 (19.4%) | 146 (18.8%) |
| 1 or 2 Children | 13 (5.1%) | 574 (32.6%) |
| 3 or 4 Children | 0 (0.0%) | 130 (65.0%) |
| 5 or more Children | 0 (0.0%) | 0 (0.0%) |
| Total | 54 (11.6%) | 850 (31.0%) |
Income Below Poverty Among Married-Couple vs Single-Parent Households in Poughkeepsie
The poverty data for Poughkeepsie shows that 154 of the married-couple family households (4.4%) and 904 of the single-parent households (28.2%) are living below the poverty level. Within the married-couple family households, those with 1 or 2 children have the highest poverty rate, with 67 households (5.4%) falling below the poverty line. Among the single-parent households, those with 3 or 4 children have the highest poverty rate, with 130 household (65.0%) living below poverty.
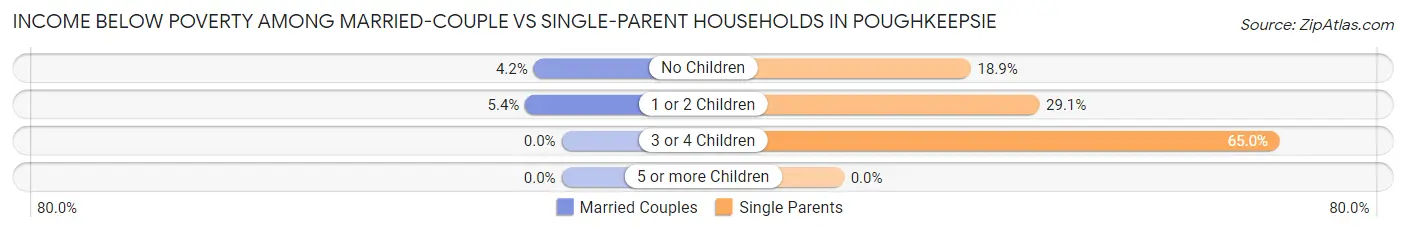
| Children | Married-Couple Families | Single-Parent Households |
| No Children | 87 (4.2%) | 187 (18.9%) |
| 1 or 2 Children | 67 (5.4%) | 587 (29.1%) |
| 3 or 4 Children | 0 (0.0%) | 130 (65.0%) |
| 5 or more Children | 0 (0.0%) | 0 (0.0%) |
| Total | 154 (4.4%) | 904 (28.2%) |
Race in Poughkeepsie
The most populous races in Poughkeepsie are White / Caucasian (14,175 | 44.7%), Black / African American (10,747 | 33.9%), and Hispanic or Latino (6,721 | 21.2%).
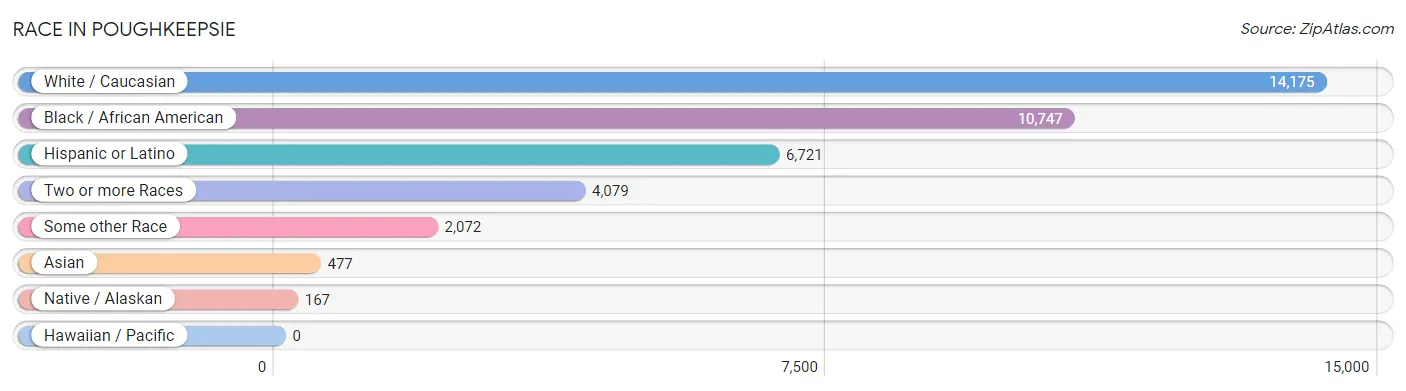
| Race | # Population | % Population |
| Asian | 477 | 1.5% |
| Black / African American | 10,747 | 33.9% |
| Hawaiian / Pacific | 0 | 0.0% |
| Hispanic or Latino | 6,721 | 21.2% |
| Native / Alaskan | 167 | 0.5% |
| White / Caucasian | 14,175 | 44.7% |
| Two or more Races | 4,079 | 12.9% |
| Some other Race | 2,072 | 6.5% |
| Total | 31,717 | 100.0% |
Ancestry in Poughkeepsie
The most populous ancestries reported in Poughkeepsie are Italian (3,671 | 11.6%), Irish (3,019 | 9.5%), Mexican (2,597 | 8.2%), German (2,583 | 8.1%), and Puerto Rican (1,981 | 6.2%), together accounting for 43.7% of all Poughkeepsie residents.
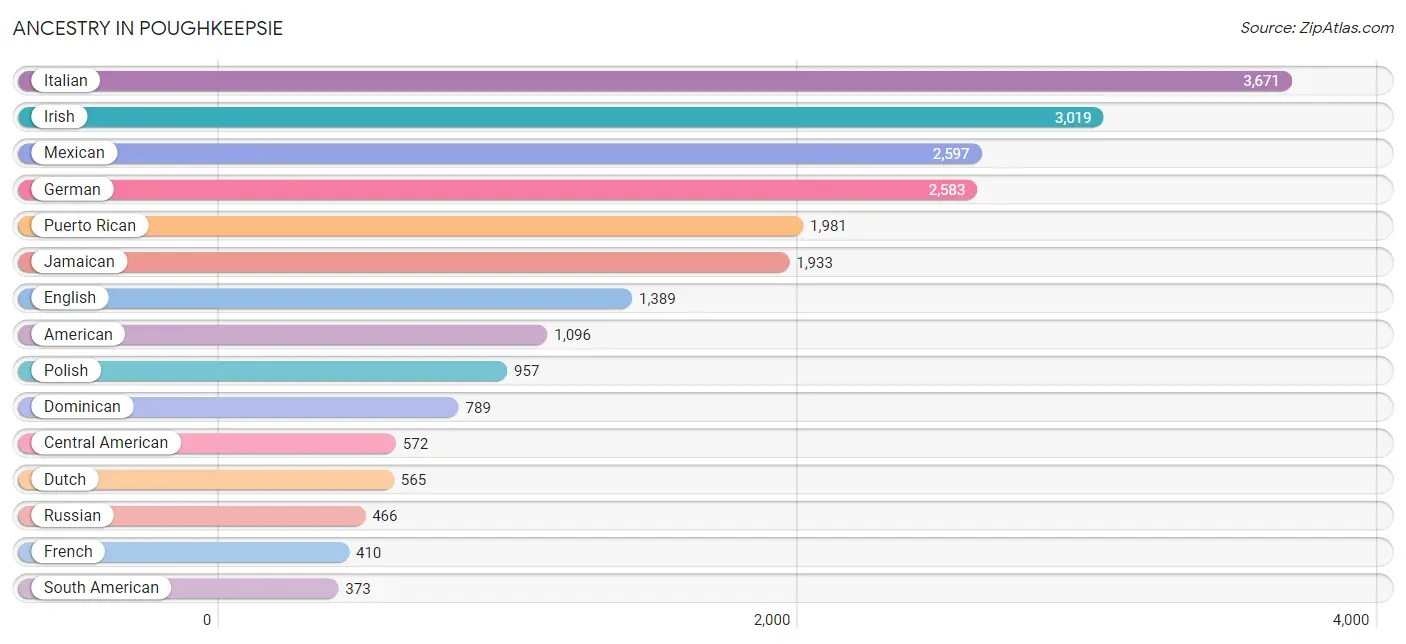
| Ancestry | # Population | % Population |
| African | 115 | 0.4% |
| American | 1,096 | 3.5% |
| Arab | 112 | 0.4% |
| Argentinean | 69 | 0.2% |
| Armenian | 6 | 0.0% |
| Austrian | 58 | 0.2% |
| Barbadian | 56 | 0.2% |
| Basque | 25 | 0.1% |
| Belizean | 27 | 0.1% |
| Bhutanese | 16 | 0.1% |
| Blackfeet | 18 | 0.1% |
| Brazilian | 92 | 0.3% |
| British | 123 | 0.4% |
| British West Indian | 339 | 1.1% |
| Bulgarian | 9 | 0.0% |
| Burmese | 248 | 0.8% |
| Canadian | 21 | 0.1% |
| Central American | 572 | 1.8% |
| Central American Indian | 243 | 0.8% |
| Cherokee | 216 | 0.7% |
| Colombian | 119 | 0.4% |
| Costa Rican | 21 | 0.1% |
| Cuban | 64 | 0.2% |
| Czech | 26 | 0.1% |
| Czechoslovakian | 23 | 0.1% |
| Danish | 74 | 0.2% |
| Dominican | 789 | 2.5% |
| Dutch | 565 | 1.8% |
| Eastern European | 98 | 0.3% |
| Ecuadorian | 20 | 0.1% |
| Egyptian | 16 | 0.1% |
| English | 1,389 | 4.4% |
| Estonian | 29 | 0.1% |
| European | 328 | 1.0% |
| French | 410 | 1.3% |
| French American Indian | 13 | 0.0% |
| French Canadian | 95 | 0.3% |
| German | 2,583 | 8.1% |
| Greek | 195 | 0.6% |
| Guatemalan | 258 | 0.8% |
| Guyanese | 202 | 0.6% |
| Haitian | 175 | 0.5% |
| Honduran | 32 | 0.1% |
| Hungarian | 217 | 0.7% |
| Icelander | 12 | 0.0% |
| Indian (Asian) | 237 | 0.7% |
| Iranian | 38 | 0.1% |
| Irish | 3,019 | 9.5% |
| Israeli | 7 | 0.0% |
| Italian | 3,671 | 11.6% |
| Jamaican | 1,933 | 6.1% |
| Korean | 171 | 0.5% |
| Laotian | 24 | 0.1% |
| Lebanese | 26 | 0.1% |
| Lithuanian | 53 | 0.2% |
| Mexican | 2,597 | 8.2% |
| Mexican American Indian | 142 | 0.4% |
| Moroccan | 50 | 0.2% |
| Navajo | 2 | 0.0% |
| Nigerian | 28 | 0.1% |
| Northern European | 14 | 0.0% |
| Norwegian | 74 | 0.2% |
| Pakistani | 6 | 0.0% |
| Panamanian | 261 | 0.8% |
| Paraguayan | 112 | 0.4% |
| Peruvian | 19 | 0.1% |
| Polish | 957 | 3.0% |
| Portuguese | 57 | 0.2% |
| Puerto Rican | 1,981 | 6.2% |
| Romanian | 48 | 0.2% |
| Russian | 466 | 1.5% |
| Scandinavian | 24 | 0.1% |
| Scotch-Irish | 64 | 0.2% |
| Scottish | 238 | 0.7% |
| Sioux | 19 | 0.1% |
| Slavic | 8 | 0.0% |
| Slovak | 78 | 0.3% |
| Slovene | 5 | 0.0% |
| South African | 12 | 0.0% |
| South American | 373 | 1.2% |
| South American Indian | 24 | 0.1% |
| Spaniard | 19 | 0.1% |
| Spanish | 179 | 0.6% |
| Sri Lankan | 68 | 0.2% |
| Subsaharan African | 170 | 0.5% |
| Swedish | 84 | 0.3% |
| Swiss | 281 | 0.9% |
| Thai | 158 | 0.5% |
| Trinidadian and Tobagonian | 40 | 0.1% |
| Turkish | 21 | 0.1% |
| U.S. Virgin Islander | 229 | 0.7% |
| Ugandan | 15 | 0.1% |
| Ukrainian | 54 | 0.2% |
| Uruguayan | 34 | 0.1% |
| Welsh | 48 | 0.2% |
| West Indian | 229 | 0.7% | View All 96 Rows |
Immigrants in Poughkeepsie
The most numerous immigrant groups reported in Poughkeepsie came from Latin America (4,031 | 12.7%), Caribbean (2,083 | 6.6%), Central America (1,630 | 5.1%), Jamaica (1,611 | 5.1%), and Mexico (1,391 | 4.4%), together accounting for 33.9% of all Poughkeepsie residents.
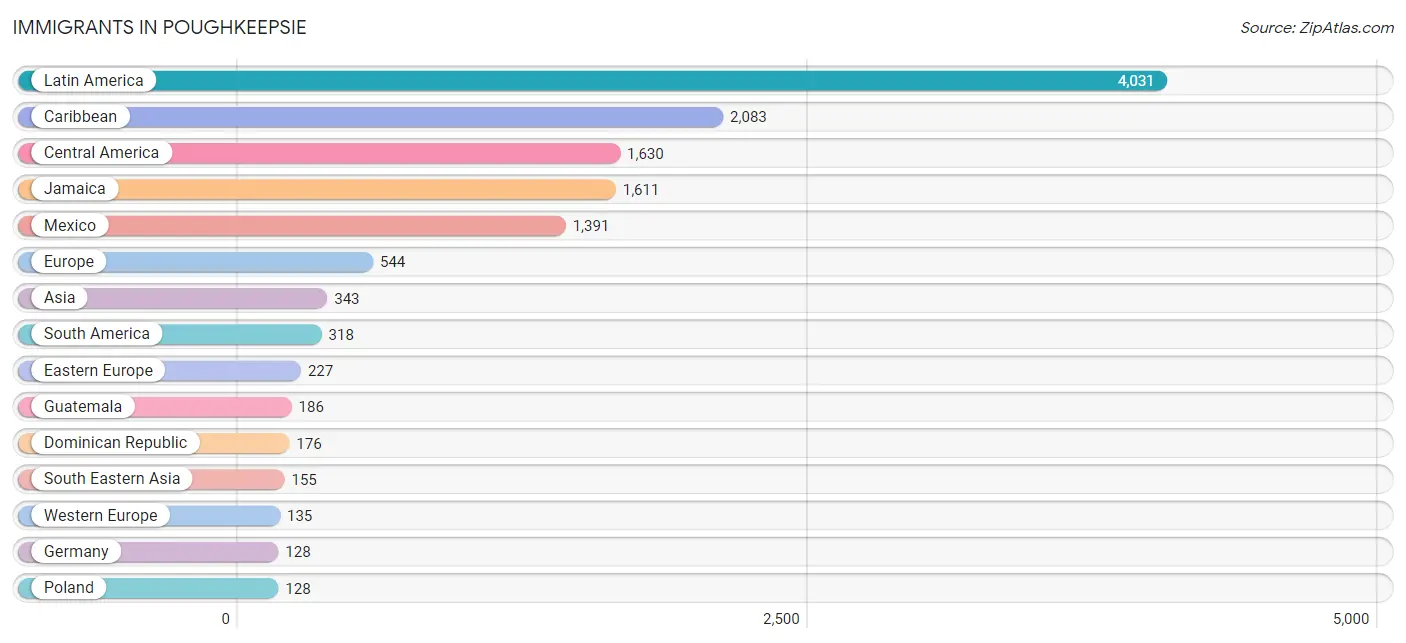
| Immigration Origin | # Population | % Population |
| Africa | 87 | 0.3% |
| Armenia | 6 | 0.0% |
| Asia | 343 | 1.1% |
| Bahamas | 36 | 0.1% |
| Barbados | 56 | 0.2% |
| Belgium | 7 | 0.0% |
| Brazil | 36 | 0.1% |
| Caribbean | 2,083 | 6.6% |
| Central America | 1,630 | 5.1% |
| China | 51 | 0.2% |
| Colombia | 56 | 0.2% |
| Costa Rica | 21 | 0.1% |
| Cuba | 12 | 0.0% |
| Dominican Republic | 176 | 0.5% |
| Eastern Africa | 15 | 0.1% |
| Eastern Asia | 65 | 0.2% |
| Eastern Europe | 227 | 0.7% |
| Europe | 544 | 1.7% |
| Germany | 128 | 0.4% |
| Greece | 51 | 0.2% |
| Grenada | 50 | 0.2% |
| Guatemala | 186 | 0.6% |
| Guyana | 101 | 0.3% |
| Haiti | 108 | 0.3% |
| Honduras | 32 | 0.1% |
| Hong Kong | 8 | 0.0% |
| India | 46 | 0.2% |
| Iran | 25 | 0.1% |
| Ireland | 48 | 0.2% |
| Israel | 13 | 0.0% |
| Italy | 23 | 0.1% |
| Jamaica | 1,611 | 5.1% |
| Japan | 14 | 0.0% |
| Kazakhstan | 8 | 0.0% |
| Latin America | 4,031 | 12.7% |
| Mexico | 1,391 | 4.4% |
| Morocco | 50 | 0.2% |
| Nigeria | 10 | 0.0% |
| Northern Africa | 50 | 0.2% |
| Northern Europe | 108 | 0.3% |
| Pakistan | 25 | 0.1% |
| Peru | 5 | 0.0% |
| Philippines | 81 | 0.3% |
| Poland | 128 | 0.4% |
| Romania | 16 | 0.1% |
| Russia | 38 | 0.1% |
| Scotland | 10 | 0.0% |
| South Africa | 12 | 0.0% |
| South America | 318 | 1.0% |
| South Central Asia | 104 | 0.3% |
| South Eastern Asia | 155 | 0.5% |
| Southern Europe | 74 | 0.2% |
| Thailand | 6 | 0.0% |
| Trinidad and Tobago | 14 | 0.0% |
| Uganda | 15 | 0.1% |
| Ukraine | 18 | 0.1% |
| Uruguay | 8 | 0.0% |
| Vietnam | 68 | 0.2% |
| Western Africa | 10 | 0.0% |
| Western Asia | 19 | 0.1% |
| Western Europe | 135 | 0.4% | View All 61 Rows |
Sex and Age in Poughkeepsie
Sex and Age in Poughkeepsie
The most populous age groups in Poughkeepsie are 25 to 29 Years (1,410 | 9.5%) for men and 30 to 34 Years (1,581 | 9.4%) for women.
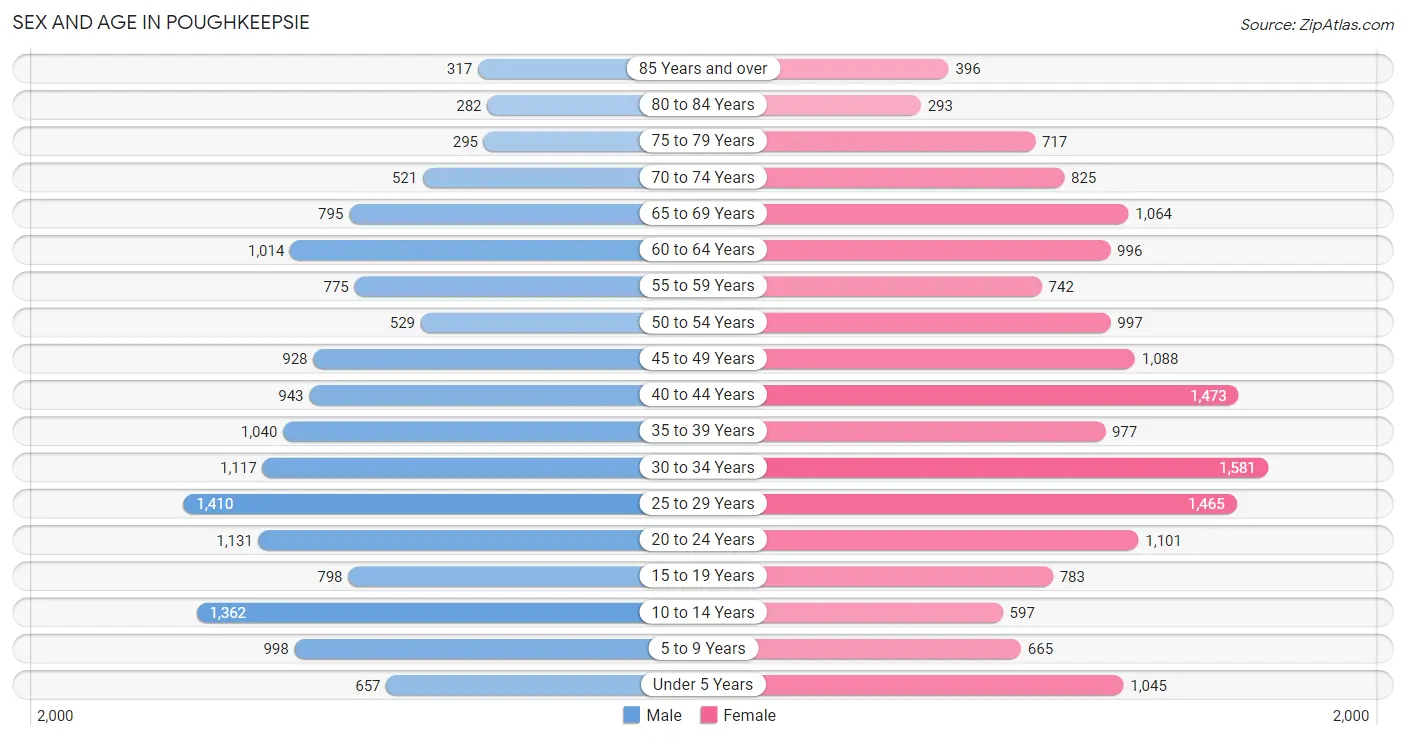
| Age Bracket | Male | Female |
| Under 5 Years | 657 (4.4%) | 1,045 (6.2%) |
| 5 to 9 Years | 998 (6.7%) | 665 (4.0%) |
| 10 to 14 Years | 1,362 (9.1%) | 597 (3.5%) |
| 15 to 19 Years | 798 (5.3%) | 783 (4.7%) |
| 20 to 24 Years | 1,131 (7.6%) | 1,101 (6.6%) |
| 25 to 29 Years | 1,410 (9.5%) | 1,465 (8.7%) |
| 30 to 34 Years | 1,117 (7.5%) | 1,581 (9.4%) |
| 35 to 39 Years | 1,040 (7.0%) | 977 (5.8%) |
| 40 to 44 Years | 943 (6.3%) | 1,473 (8.8%) |
| 45 to 49 Years | 928 (6.2%) | 1,088 (6.5%) |
| 50 to 54 Years | 529 (3.5%) | 997 (5.9%) |
| 55 to 59 Years | 775 (5.2%) | 742 (4.4%) |
| 60 to 64 Years | 1,014 (6.8%) | 996 (5.9%) |
| 65 to 69 Years | 795 (5.3%) | 1,064 (6.3%) |
| 70 to 74 Years | 521 (3.5%) | 825 (4.9%) |
| 75 to 79 Years | 295 (2.0%) | 717 (4.3%) |
| 80 to 84 Years | 282 (1.9%) | 293 (1.7%) |
| 85 Years and over | 317 (2.1%) | 396 (2.4%) |
| Total | 14,912 (100.0%) | 16,805 (100.0%) |
Families and Households in Poughkeepsie
Median Family Size in Poughkeepsie
The median family size in Poughkeepsie is 3.23 persons per family, with single female/mother families (2,739 | 40.8%) accounting for the largest median family size of 3.42 persons per family. On the other hand, married-couple families (3,505 | 52.2%) represent the smallest median family size with 3.07 persons per family.
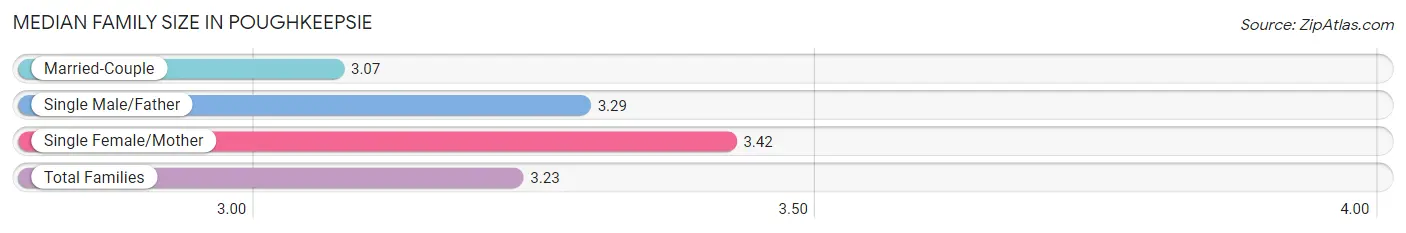
| Family Type | # Families | Family Size |
| Married-Couple | 3,505 (52.2%) | 3.07 |
| Single Male/Father | 466 (6.9%) | 3.29 |
| Single Female/Mother | 2,739 (40.8%) | 3.42 |
| Total Families | 6,710 (100.0%) | 3.23 |
Median Household Size in Poughkeepsie
The median household size in Poughkeepsie is 2.27 persons per household, with single male/father households (466 | 3.4%) accounting for the largest median household size of 3.77 persons per household. non-family households (6,881 | 50.6%) represent the smallest median household size with 1.24 persons per household.
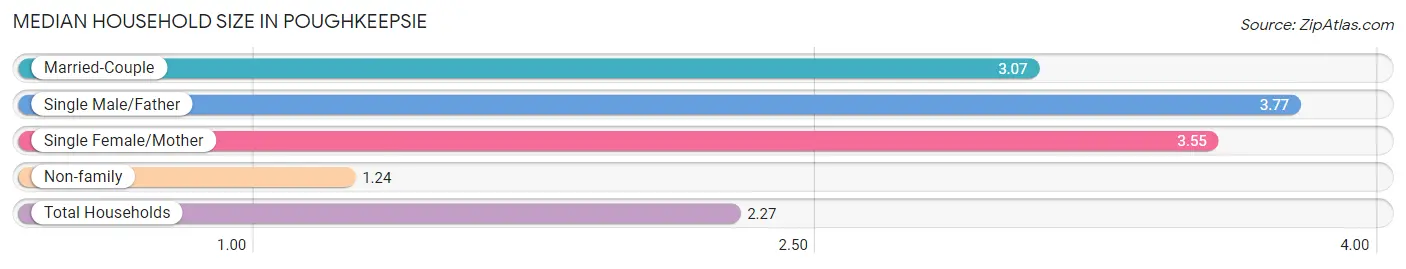
| Household Type | # Households | Household Size |
| Married-Couple | 3,505 (25.8%) | 3.07 |
| Single Male/Father | 466 (3.4%) | 3.77 |
| Single Female/Mother | 2,739 (20.2%) | 3.55 |
| Non-family | 6,881 (50.6%) | 1.24 |
| Total Households | 13,591 (100.0%) | 2.27 |
Household Size by Marriage Status in Poughkeepsie
Out of a total of 13,591 households in Poughkeepsie, 6,710 (49.4%) are family households, while 6,881 (50.6%) are nonfamily households. The most numerous type of family households are 2-person households, comprising 2,810, and the most common type of nonfamily households are 1-person households, comprising 5,714.
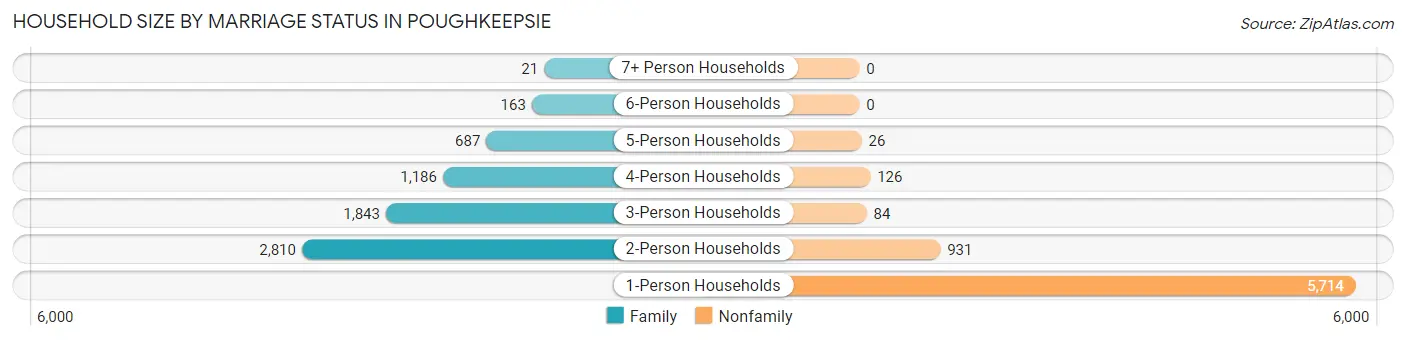
| Household Size | Family Households | Nonfamily Households |
| 1-Person Households | - | 5,714 (42.0%) |
| 2-Person Households | 2,810 (20.7%) | 931 (6.9%) |
| 3-Person Households | 1,843 (13.6%) | 84 (0.6%) |
| 4-Person Households | 1,186 (8.7%) | 126 (0.9%) |
| 5-Person Households | 687 (5.1%) | 26 (0.2%) |
| 6-Person Households | 163 (1.2%) | 0 (0.0%) |
| 7+ Person Households | 21 (0.2%) | 0 (0.0%) |
| Total | 6,710 (49.4%) | 6,881 (50.6%) |
Female Fertility in Poughkeepsie
Fertility by Age in Poughkeepsie
Average fertility rate in Poughkeepsie is 49.0 births per 1,000 women. Women in the age bracket of 20 to 34 years have the highest fertility rate with 68.0 births per 1,000 women. Women in the age bracket of 20 to 34 years acount for 65.4% of all women with births.
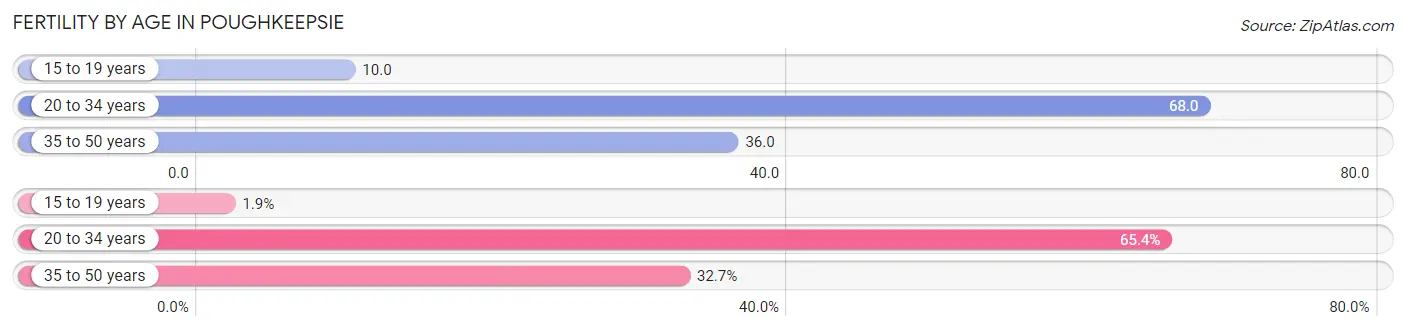
| Age Bracket | Women with Births | Births / 1,000 Women |
| 15 to 19 years | 8 (1.9%) | 10.0 |
| 20 to 34 years | 282 (65.4%) | 68.0 |
| 35 to 50 years | 141 (32.7%) | 36.0 |
| Total | 431 (100.0%) | 49.0 |
Fertility by Age by Marriage Status in Poughkeepsie
59.6% of women with births (431) in Poughkeepsie are married. The highest percentage of unmarried women with births falls into 15 to 19 years age bracket with 100.0% of them unmarried at the time of birth, while the lowest percentage of unmarried women with births belong to 20 to 34 years age bracket with 34.8% of them unmarried.
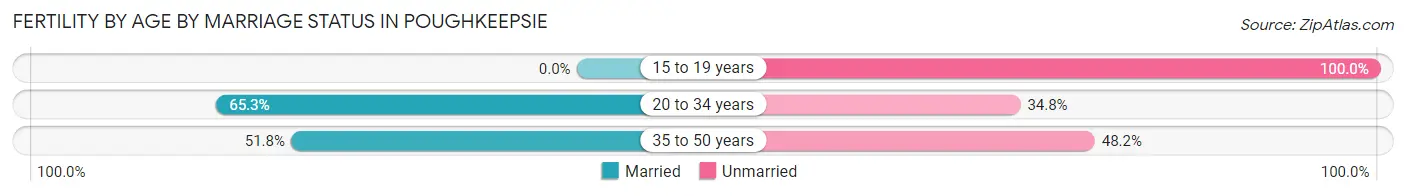
| Age Bracket | Married | Unmarried |
| 15 to 19 years | 0 (0.0%) | 8 (100.0%) |
| 20 to 34 years | 184 (65.2%) | 98 (34.7%) |
| 35 to 50 years | 73 (51.8%) | 68 (48.2%) |
| Total | 257 (59.6%) | 174 (40.4%) |
Fertility by Education in Poughkeepsie
Average fertility rate in Poughkeepsie is 49.0 births per 1,000 women. Women with the education attainment of bachelor's degree have the highest fertility rate of 125.0 births per 1,000 women, while women with the education attainment of high school diploma have the lowest fertility at 4.0 births per 1,000 women. Women with the education attainment of bachelor's degree represent 45.9% of all women with births.
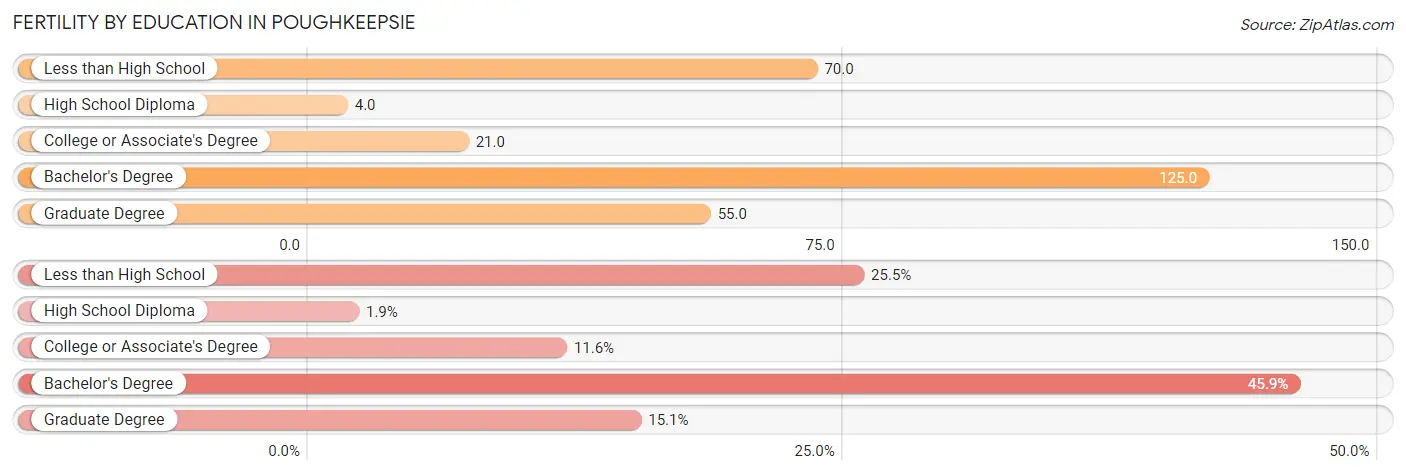
| Educational Attainment | Women with Births | Births / 1,000 Women |
| Less than High School | 110 (25.5%) | 70.0 |
| High School Diploma | 8 (1.9%) | 4.0 |
| College or Associate's Degree | 50 (11.6%) | 21.0 |
| Bachelor's Degree | 198 (45.9%) | 125.0 |
| Graduate Degree | 65 (15.1%) | 55.0 |
| Total | 431 (100.0%) | 49.0 |
Fertility by Education by Marriage Status in Poughkeepsie
40.4% of women with births in Poughkeepsie are unmarried. Women with the educational attainment of bachelor's degree are most likely to be married with 89.9% of them married at childbirth, while women with the educational attainment of less than high school are least likely to be married with 100.0% of them unmarried at childbirth.
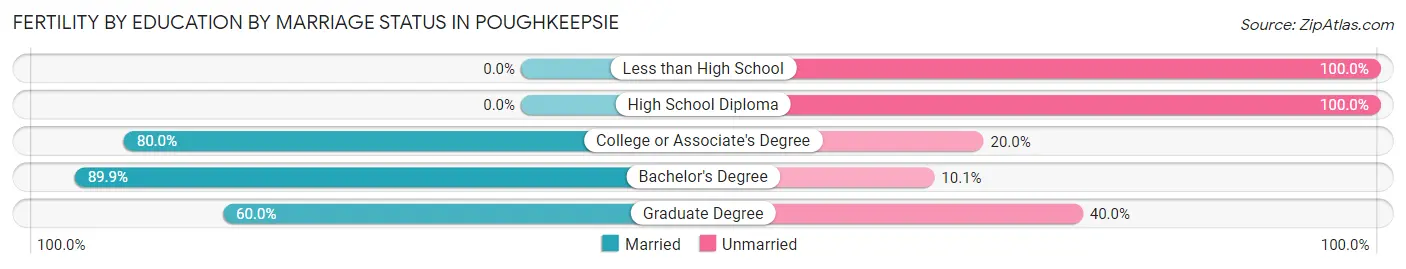
| Educational Attainment | Married | Unmarried |
| Less than High School | 0 (0.0%) | 110 (100.0%) |
| High School Diploma | 0 (0.0%) | 8 (100.0%) |
| College or Associate's Degree | 40 (80.0%) | 10 (20.0%) |
| Bachelor's Degree | 178 (89.9%) | 20 (10.1%) |
| Graduate Degree | 39 (60.0%) | 26 (40.0%) |
| Total | 257 (59.6%) | 174 (40.4%) |
Employment Characteristics in Poughkeepsie
Employment by Class of Employer in Poughkeepsie
Among the 14,751 employed individuals in Poughkeepsie, private company employees (9,320 | 63.2%), not-for-profit organizations (2,307 | 15.6%), and local government employees (1,201 | 8.1%) make up the most common classes of employment.
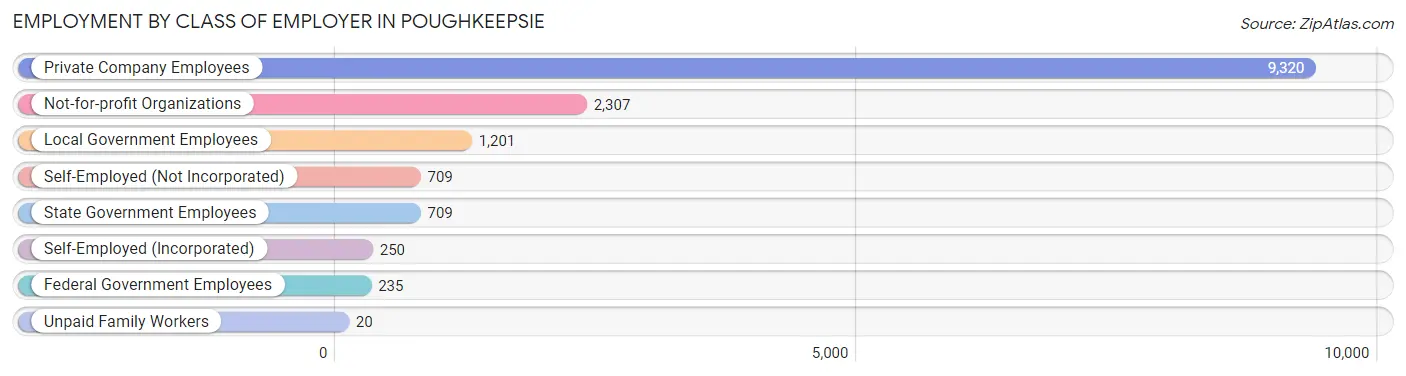
| Employer Class | # Employees | % Employees |
| Private Company Employees | 9,320 | 63.2% |
| Self-Employed (Incorporated) | 250 | 1.7% |
| Self-Employed (Not Incorporated) | 709 | 4.8% |
| Not-for-profit Organizations | 2,307 | 15.6% |
| Local Government Employees | 1,201 | 8.1% |
| State Government Employees | 709 | 4.8% |
| Federal Government Employees | 235 | 1.6% |
| Unpaid Family Workers | 20 | 0.1% |
| Total | 14,751 | 100.0% |
Employment Status by Age in Poughkeepsie
According to the labor force statistics for Poughkeepsie, out of the total population over 16 years of age (25,962), 62.6% or 16,252 individuals are in the labor force, with 7.3% or 1,186 of them unemployed. The age group with the highest labor force participation rate is 30 to 34 years, with 90.3% or 2,436 individuals in the labor force. Within the labor force, the 16 to 19 years age range has the highest percentage of unemployed individuals, with 37.1% or 127 of them being unemployed.
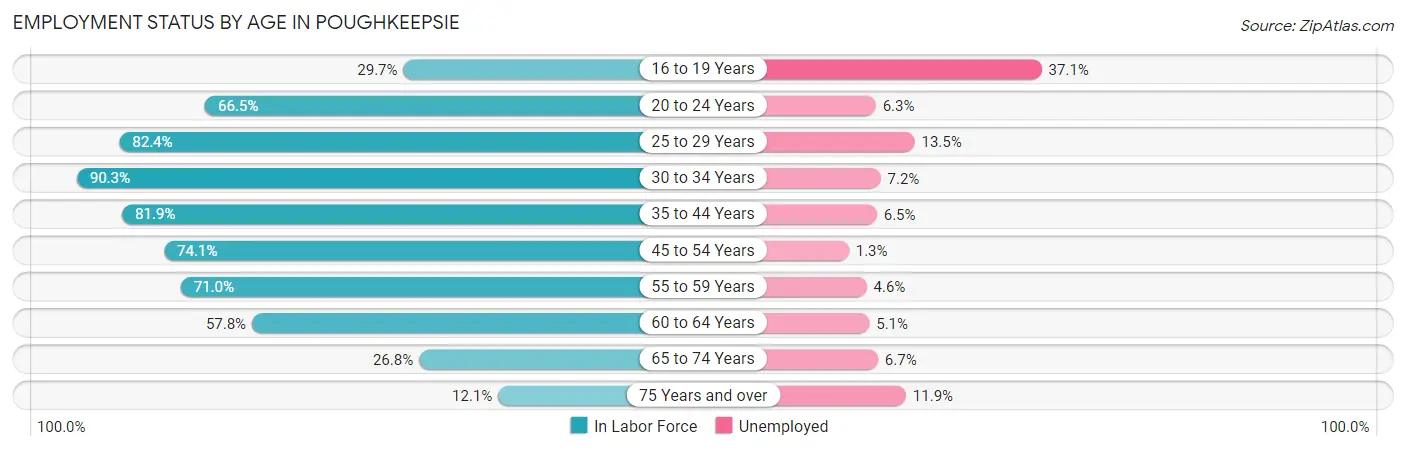
| Age Bracket | In Labor Force | Unemployed |
| 16 to 19 Years | 342 (29.7%) | 127 (37.1%) |
| 20 to 24 Years | 1,484 (66.5%) | 93 (6.3%) |
| 25 to 29 Years | 2,369 (82.4%) | 320 (13.5%) |
| 30 to 34 Years | 2,436 (90.3%) | 175 (7.2%) |
| 35 to 44 Years | 3,631 (81.9%) | 236 (6.5%) |
| 45 to 54 Years | 2,625 (74.1%) | 34 (1.3%) |
| 55 to 59 Years | 1,077 (71.0%) | 50 (4.6%) |
| 60 to 64 Years | 1,162 (57.8%) | 59 (5.1%) |
| 65 to 74 Years | 859 (26.8%) | 58 (6.7%) |
| 75 Years and over | 278 (12.1%) | 33 (11.9%) |
| Total | 16,252 (62.6%) | 1,186 (7.3%) |
Employment Status by Educational Attainment in Poughkeepsie
According to labor force statistics for Poughkeepsie, 77.9% of individuals (13,301) out of the total population between 25 and 64 years of age (17,075) are in the labor force, with 6.6% or 878 of them being unemployed. The group with the highest labor force participation rate are those with the educational attainment of high school diploma, with 81.4% or 4,120 individuals in the labor force. Within the labor force, individuals with high school diploma education have the highest percentage of unemployment, with 10.8% or 445 of them being unemployed.
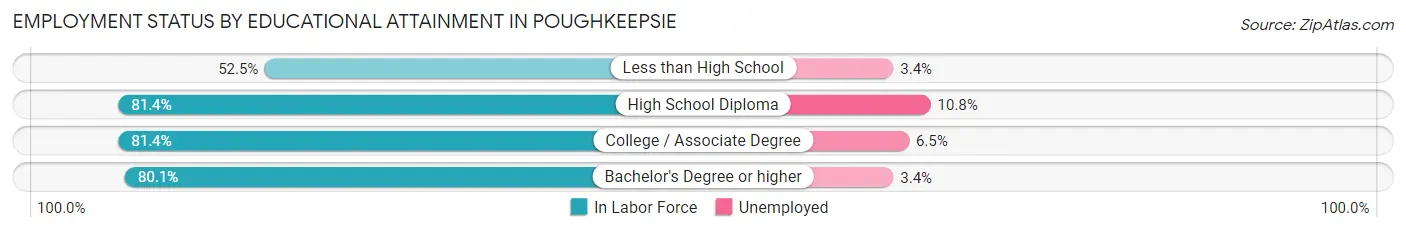
| Educational Attainment | In Labor Force | Unemployed |
| Less than High School | 964 (52.5%) | 62 (3.4%) |
| High School Diploma | 4,120 (81.4%) | 547 (10.8%) |
| College / Associate Degree | 3,873 (81.4%) | 309 (6.5%) |
| Bachelor's Degree or higher | 4,341 (80.1%) | 184 (3.4%) |
| Total | 13,301 (77.9%) | 1,127 (6.6%) |
Employment Occupations by Sex in Poughkeepsie
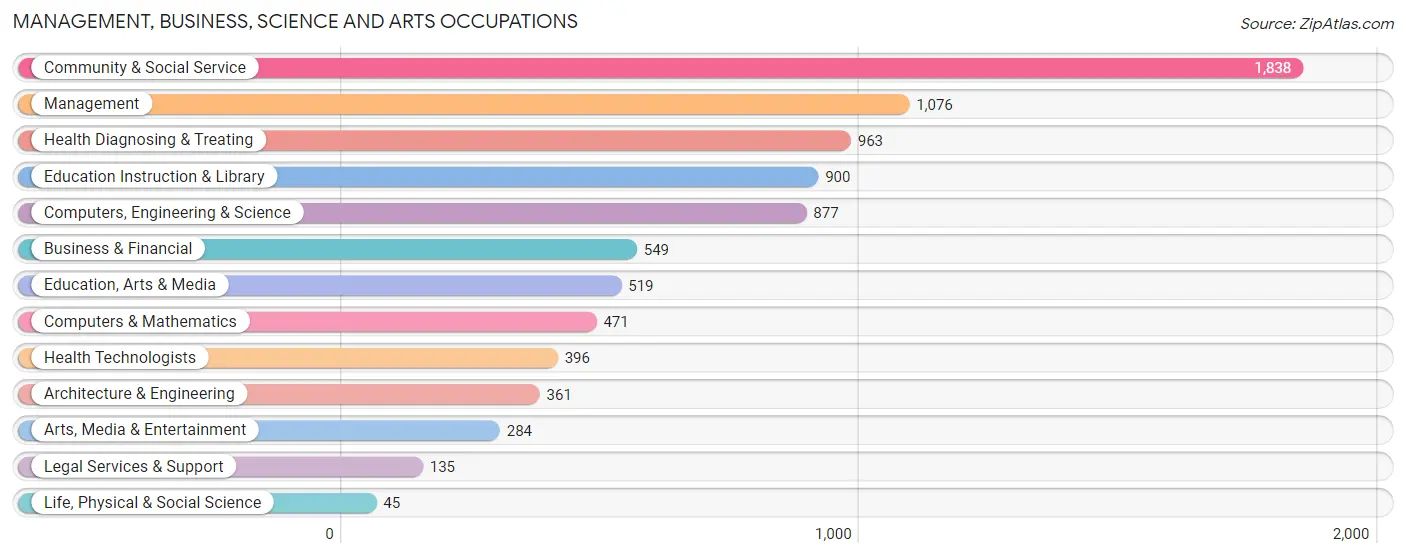
Management, Business, Science and Arts Occupations
The most common Management, Business, Science and Arts occupations in Poughkeepsie are Community & Social Service (1,838 | 12.3%), Management (1,076 | 7.2%), Health Diagnosing & Treating (963 | 6.4%), Education Instruction & Library (900 | 6.0%), and Computers, Engineering & Science (877 | 5.9%).
Management, Business, Science and Arts Occupations by Sex
Within the Management, Business, Science and Arts occupations in Poughkeepsie, the most male-oriented occupations are Computers & Mathematics (80.7%), Computers, Engineering & Science (70.2%), and Architecture & Engineering (60.1%), while the most female-oriented occupations are Health Diagnosing & Treating (85.7%), Health Technologists (79.8%), and Education Instruction & Library (73.1%).
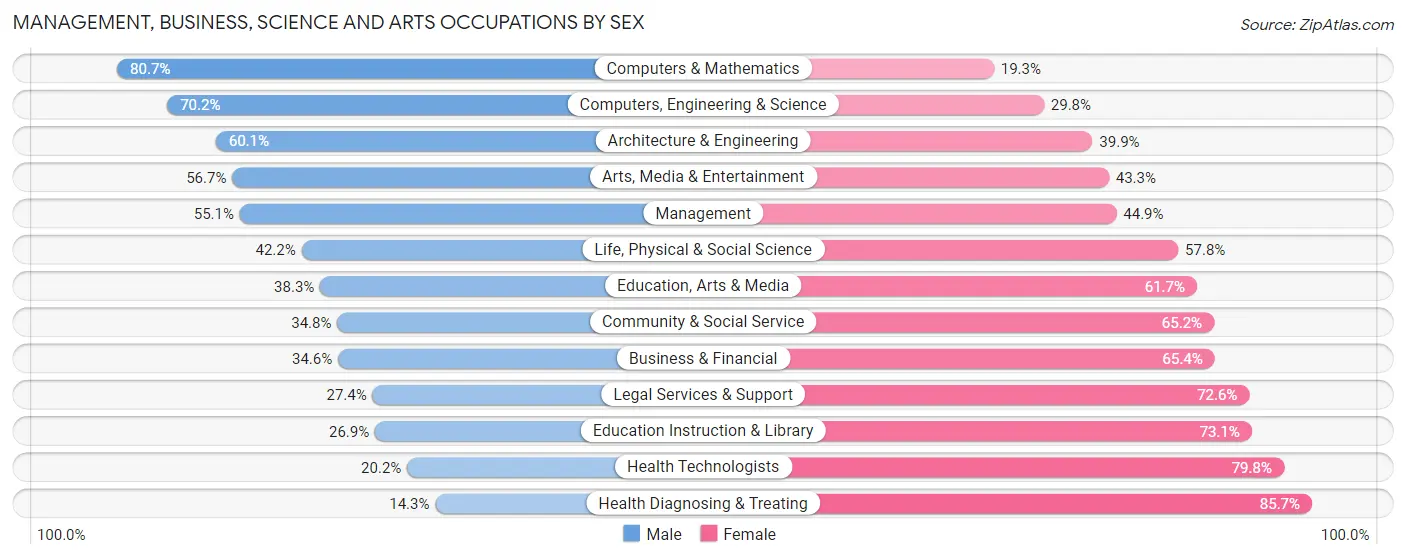
| Occupation | Male | Female |
| Management | 593 (55.1%) | 483 (44.9%) |
| Business & Financial | 190 (34.6%) | 359 (65.4%) |
| Computers, Engineering & Science | 616 (70.2%) | 261 (29.8%) |
| Computers & Mathematics | 380 (80.7%) | 91 (19.3%) |
| Architecture & Engineering | 217 (60.1%) | 144 (39.9%) |
| Life, Physical & Social Science | 19 (42.2%) | 26 (57.8%) |
| Community & Social Service | 639 (34.8%) | 1,199 (65.2%) |
| Education, Arts & Media | 199 (38.3%) | 320 (61.7%) |
| Legal Services & Support | 37 (27.4%) | 98 (72.6%) |
| Education Instruction & Library | 242 (26.9%) | 658 (73.1%) |
| Arts, Media & Entertainment | 161 (56.7%) | 123 (43.3%) |
| Health Diagnosing & Treating | 138 (14.3%) | 825 (85.7%) |
| Health Technologists | 80 (20.2%) | 316 (79.8%) |
| Total (Category) | 2,176 (41.0%) | 3,127 (59.0%) |
| Total (Overall) | 6,996 (46.7%) | 7,982 (53.3%) |
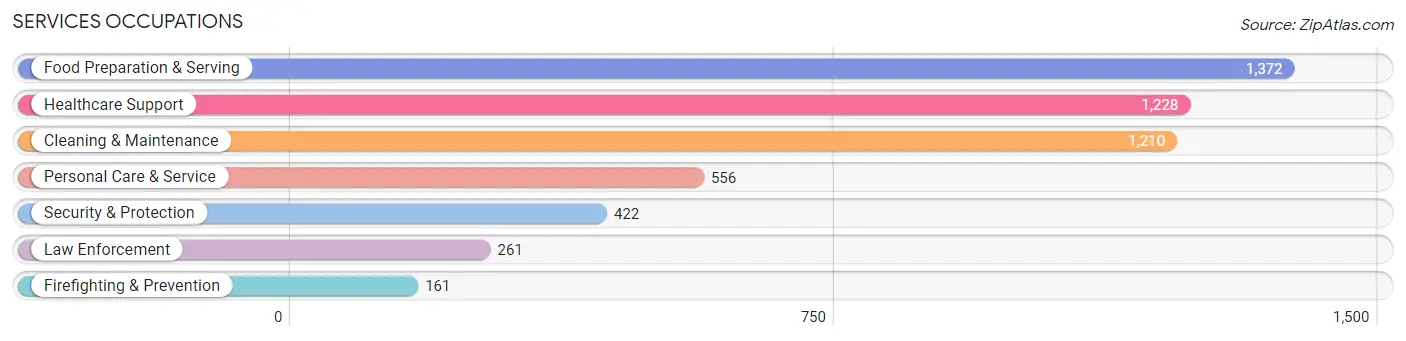
Services Occupations
The most common Services occupations in Poughkeepsie are Food Preparation & Serving (1,372 | 9.2%), Healthcare Support (1,228 | 8.2%), Cleaning & Maintenance (1,210 | 8.1%), Personal Care & Service (556 | 3.7%), and Security & Protection (422 | 2.8%).
Services Occupations by Sex
Within the Services occupations in Poughkeepsie, the most male-oriented occupations are Cleaning & Maintenance (62.4%), Food Preparation & Serving (49.7%), and Firefighting & Prevention (44.7%), while the most female-oriented occupations are Healthcare Support (85.0%), Personal Care & Service (68.7%), and Law Enforcement (57.1%).
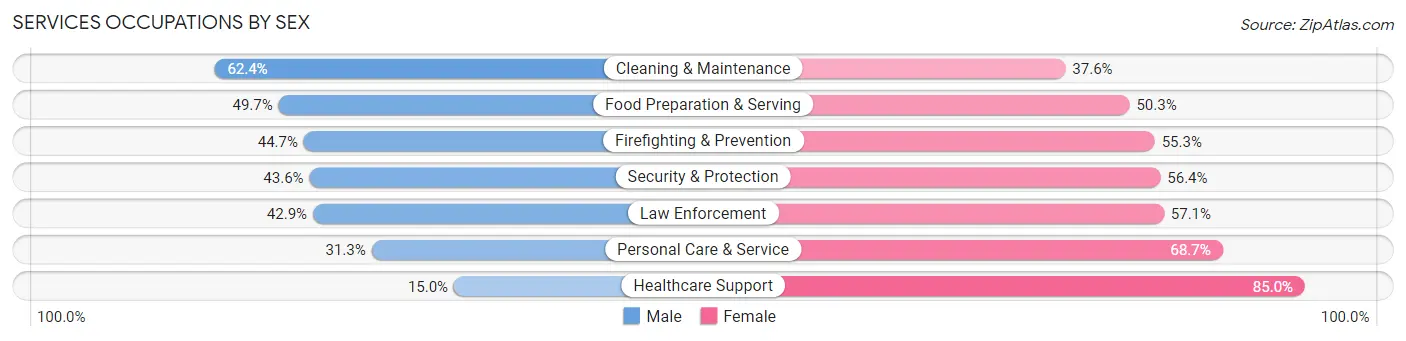
| Occupation | Male | Female |
| Healthcare Support | 184 (15.0%) | 1,044 (85.0%) |
| Security & Protection | 184 (43.6%) | 238 (56.4%) |
| Firefighting & Prevention | 72 (44.7%) | 89 (55.3%) |
| Law Enforcement | 112 (42.9%) | 149 (57.1%) |
| Food Preparation & Serving | 682 (49.7%) | 690 (50.3%) |
| Cleaning & Maintenance | 755 (62.4%) | 455 (37.6%) |
| Personal Care & Service | 174 (31.3%) | 382 (68.7%) |
| Total (Category) | 1,979 (41.3%) | 2,809 (58.7%) |
| Total (Overall) | 6,996 (46.7%) | 7,982 (53.3%) |
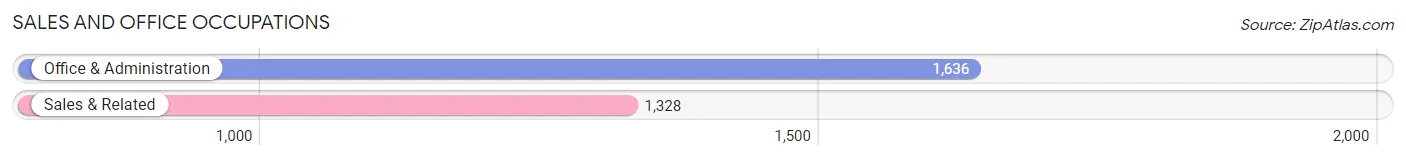
Sales and Office Occupations
The most common Sales and Office occupations in Poughkeepsie are Office & Administration (1,636 | 10.9%), and Sales & Related (1,328 | 8.9%).
Sales and Office Occupations by Sex
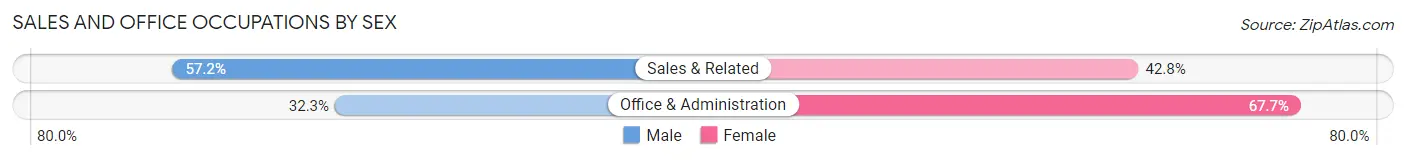
| Occupation | Male | Female |
| Sales & Related | 760 (57.2%) | 568 (42.8%) |
| Office & Administration | 528 (32.3%) | 1,108 (67.7%) |
| Total (Category) | 1,288 (43.4%) | 1,676 (56.6%) |
| Total (Overall) | 6,996 (46.7%) | 7,982 (53.3%) |
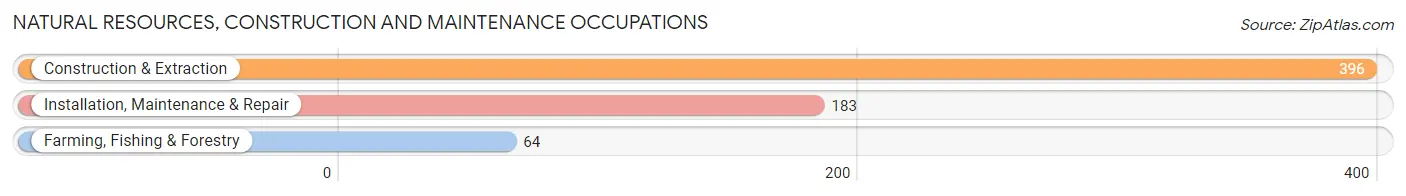
Natural Resources, Construction and Maintenance Occupations
The most common Natural Resources, Construction and Maintenance occupations in Poughkeepsie are Construction & Extraction (396 | 2.6%), Installation, Maintenance & Repair (183 | 1.2%), and Farming, Fishing & Forestry (64 | 0.4%).
Natural Resources, Construction and Maintenance Occupations by Sex
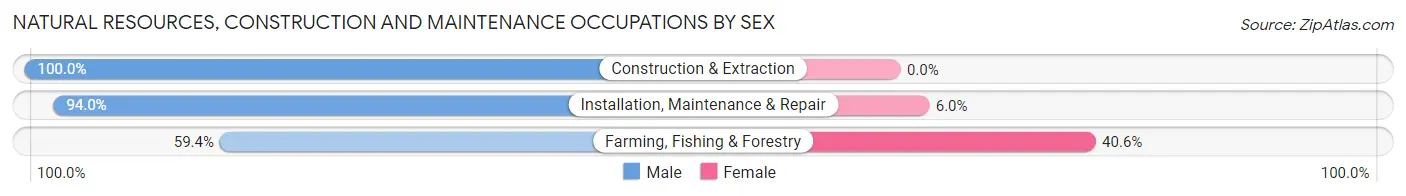
| Occupation | Male | Female |
| Farming, Fishing & Forestry | 38 (59.4%) | 26 (40.6%) |
| Construction & Extraction | 396 (100.0%) | 0 (0.0%) |
| Installation, Maintenance & Repair | 172 (94.0%) | 11 (6.0%) |
| Total (Category) | 606 (94.3%) | 37 (5.8%) |
| Total (Overall) | 6,996 (46.7%) | 7,982 (53.3%) |
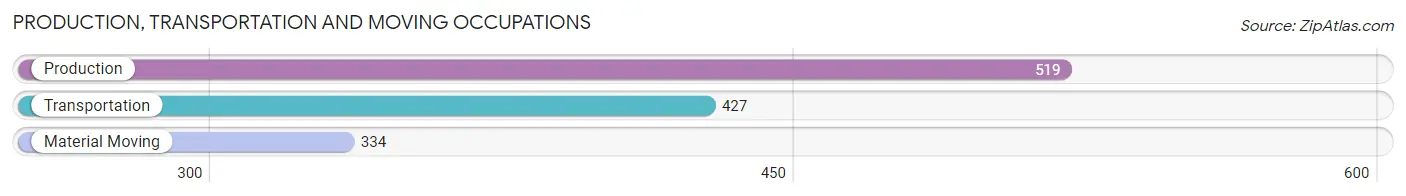
Production, Transportation and Moving Occupations
The most common Production, Transportation and Moving occupations in Poughkeepsie are Production (519 | 3.5%), Transportation (427 | 2.9%), and Material Moving (334 | 2.2%).
Production, Transportation and Moving Occupations by Sex
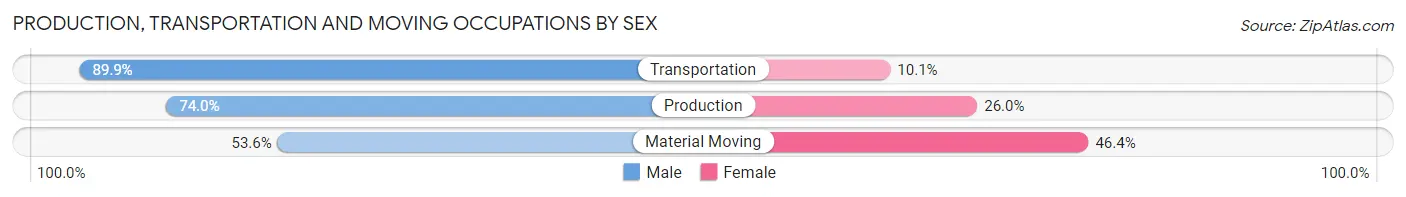
| Occupation | Male | Female |
| Production | 384 (74.0%) | 135 (26.0%) |
| Transportation | 384 (89.9%) | 43 (10.1%) |
| Material Moving | 179 (53.6%) | 155 (46.4%) |
| Total (Category) | 947 (74.0%) | 333 (26.0%) |
| Total (Overall) | 6,996 (46.7%) | 7,982 (53.3%) |
Employment Industries by Sex in Poughkeepsie
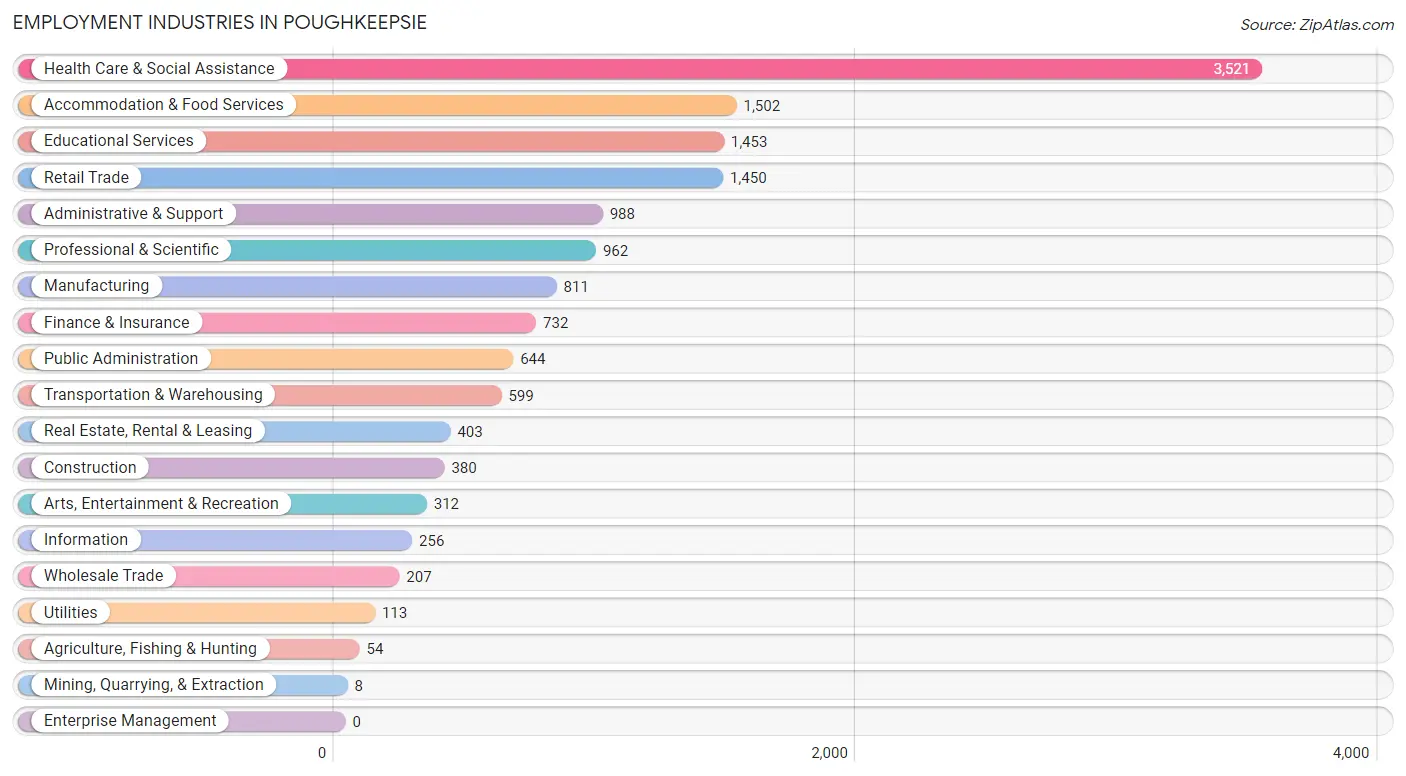
Employment Industries in Poughkeepsie
The major employment industries in Poughkeepsie include Health Care & Social Assistance (3,521 | 23.5%), Accommodation & Food Services (1,502 | 10.0%), Educational Services (1,453 | 9.7%), Retail Trade (1,450 | 9.7%), and Administrative & Support (988 | 6.6%).
Employment Industries by Sex in Poughkeepsie
The Poughkeepsie industries that see more men than women are Mining, Quarrying, & Extraction (100.0%), Construction (93.2%), and Manufacturing (83.7%), whereas the industries that tend to have a higher number of women are Health Care & Social Assistance (73.1%), Educational Services (68.4%), and Professional & Scientific (59.4%).
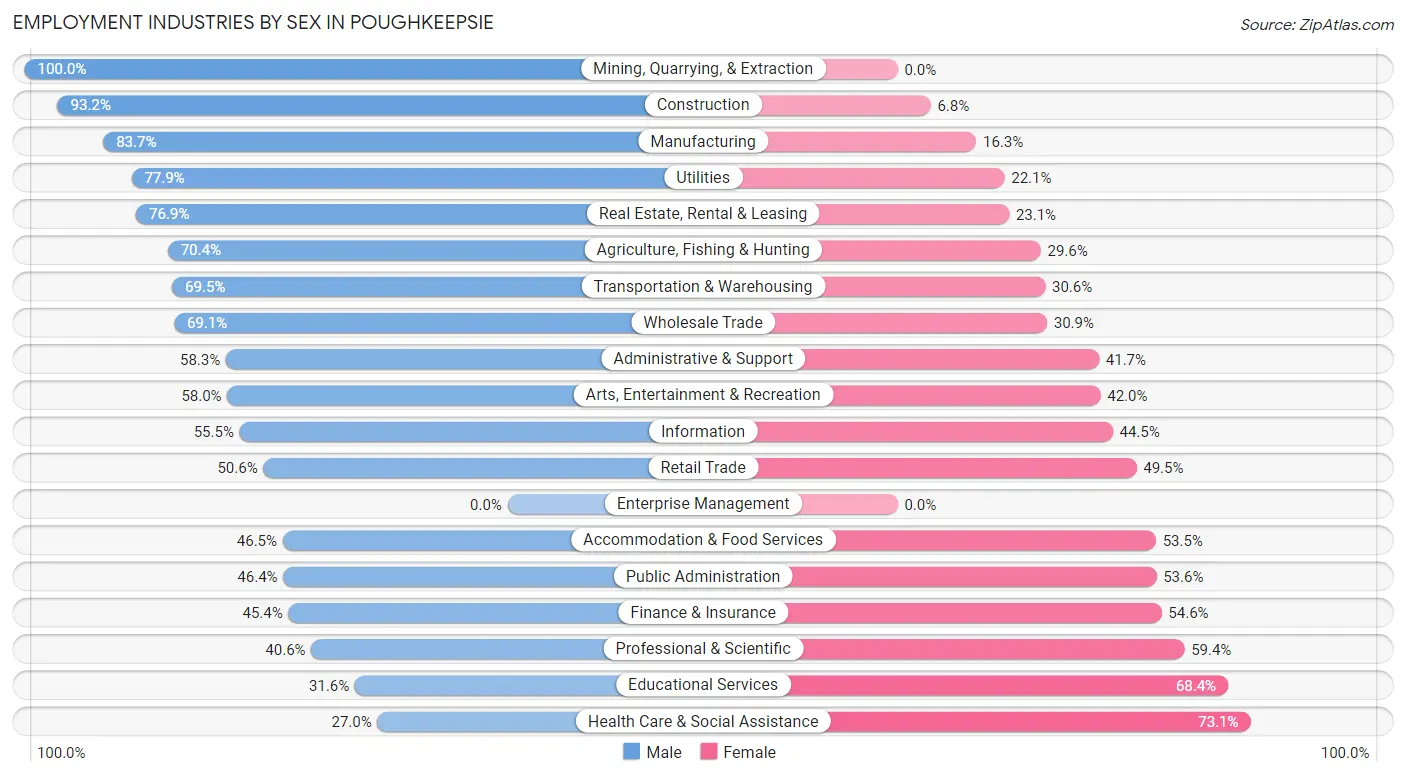
| Industry | Male | Female |
| Agriculture, Fishing & Hunting | 38 (70.4%) | 16 (29.6%) |
| Mining, Quarrying, & Extraction | 8 (100.0%) | 0 (0.0%) |
| Construction | 354 (93.2%) | 26 (6.8%) |
| Manufacturing | 679 (83.7%) | 132 (16.3%) |
| Wholesale Trade | 143 (69.1%) | 64 (30.9%) |
| Retail Trade | 733 (50.5%) | 717 (49.4%) |
| Transportation & Warehousing | 416 (69.5%) | 183 (30.5%) |
| Utilities | 88 (77.9%) | 25 (22.1%) |
| Information | 142 (55.5%) | 114 (44.5%) |
| Finance & Insurance | 332 (45.4%) | 400 (54.6%) |
| Real Estate, Rental & Leasing | 310 (76.9%) | 93 (23.1%) |
| Professional & Scientific | 391 (40.6%) | 571 (59.4%) |
| Enterprise Management | 0 (0.0%) | 0 (0.0%) |
| Administrative & Support | 576 (58.3%) | 412 (41.7%) |
| Educational Services | 459 (31.6%) | 994 (68.4%) |
| Health Care & Social Assistance | 949 (27.0%) | 2,572 (73.1%) |
| Arts, Entertainment & Recreation | 181 (58.0%) | 131 (42.0%) |
| Accommodation & Food Services | 699 (46.5%) | 803 (53.5%) |
| Public Administration | 299 (46.4%) | 345 (53.6%) |
| Total | 6,996 (46.7%) | 7,982 (53.3%) |
Education in Poughkeepsie
School Enrollment in Poughkeepsie
The most common levels of schooling among the 7,583 students in Poughkeepsie are college / undergraduate (2,022 | 26.7%), middle school (1,589 | 20.9%), and high school (1,387 | 18.3%).
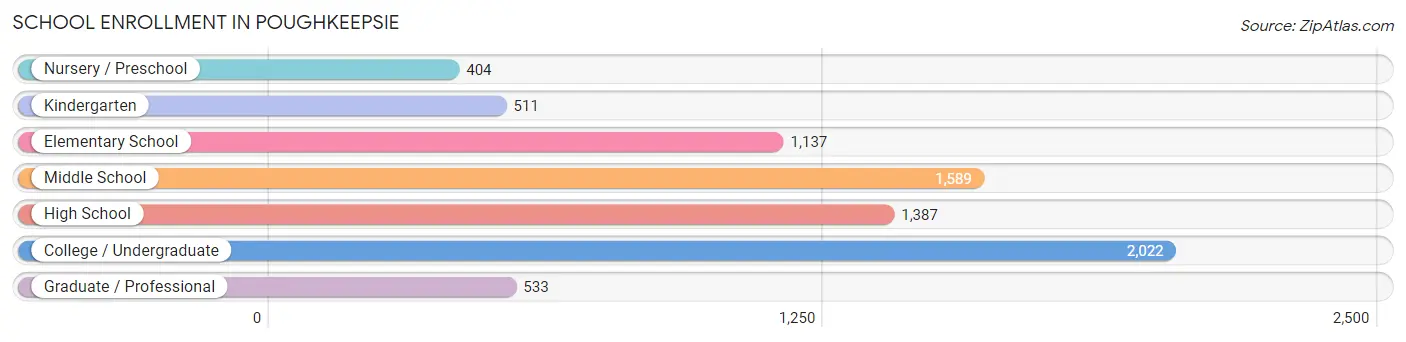
| School Level | # Students | % Students |
| Nursery / Preschool | 404 | 5.3% |
| Kindergarten | 511 | 6.7% |
| Elementary School | 1,137 | 15.0% |
| Middle School | 1,589 | 20.9% |
| High School | 1,387 | 18.3% |
| College / Undergraduate | 2,022 | 26.7% |
| Graduate / Professional | 533 | 7.0% |
| Total | 7,583 | 100.0% |
School Enrollment by Age by Funding Source in Poughkeepsie
Out of a total of 7,583 students who are enrolled in schools in Poughkeepsie, 2,176 (28.7%) attend a private institution, while the remaining 5,407 (71.3%) are enrolled in public schools. The age group of 25 to 34 year olds has the highest likelihood of being enrolled in private schools, with 689 (63.3% in the age bracket) enrolled. Conversely, the age group of 5 to 9 year old has the lowest likelihood of being enrolled in a private school, with 1,381 (86.0% in the age bracket) attending a public institution.
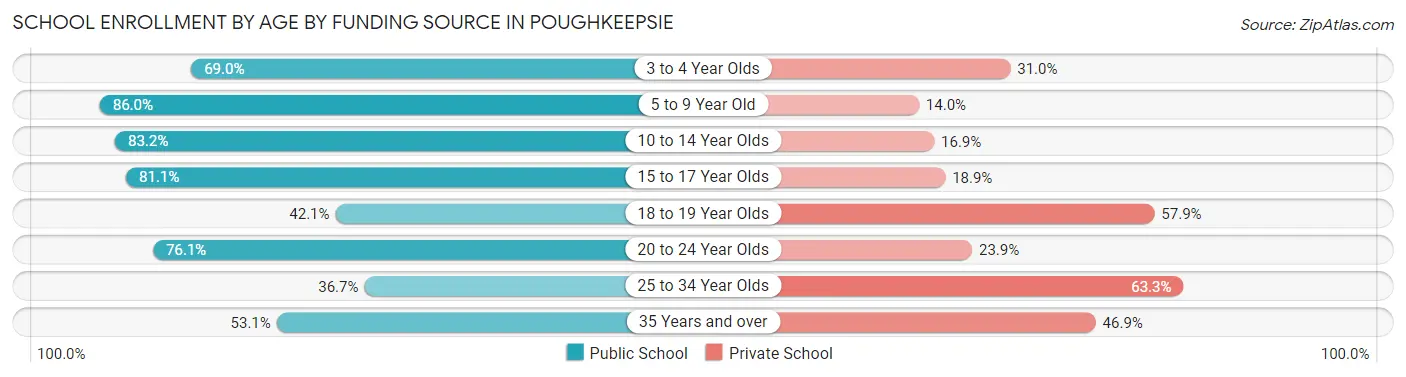
| Age Bracket | Public School | Private School |
| 3 to 4 Year Olds | 291 (69.0%) | 131 (31.0%) |
| 5 to 9 Year Old | 1,381 (86.0%) | 225 (14.0%) |
| 10 to 14 Year Olds | 1,628 (83.2%) | 330 (16.9%) |
| 15 to 17 Year Olds | 656 (81.1%) | 153 (18.9%) |
| 18 to 19 Year Olds | 155 (42.1%) | 213 (57.9%) |
| 20 to 24 Year Olds | 627 (76.1%) | 197 (23.9%) |
| 25 to 34 Year Olds | 400 (36.7%) | 689 (63.3%) |
| 35 Years and over | 269 (53.1%) | 238 (46.9%) |
| Total | 5,407 (71.3%) | 2,176 (28.7%) |
Educational Attainment by Field of Study in Poughkeepsie
Business (1,140 | 13.8%), education (1,097 | 13.3%), psychology (817 | 9.9%), liberal arts & history (749 | 9.0%), and visual & performing arts (721 | 8.7%) are the most common fields of study among 8,278 individuals in Poughkeepsie who have obtained a bachelor's degree or higher.
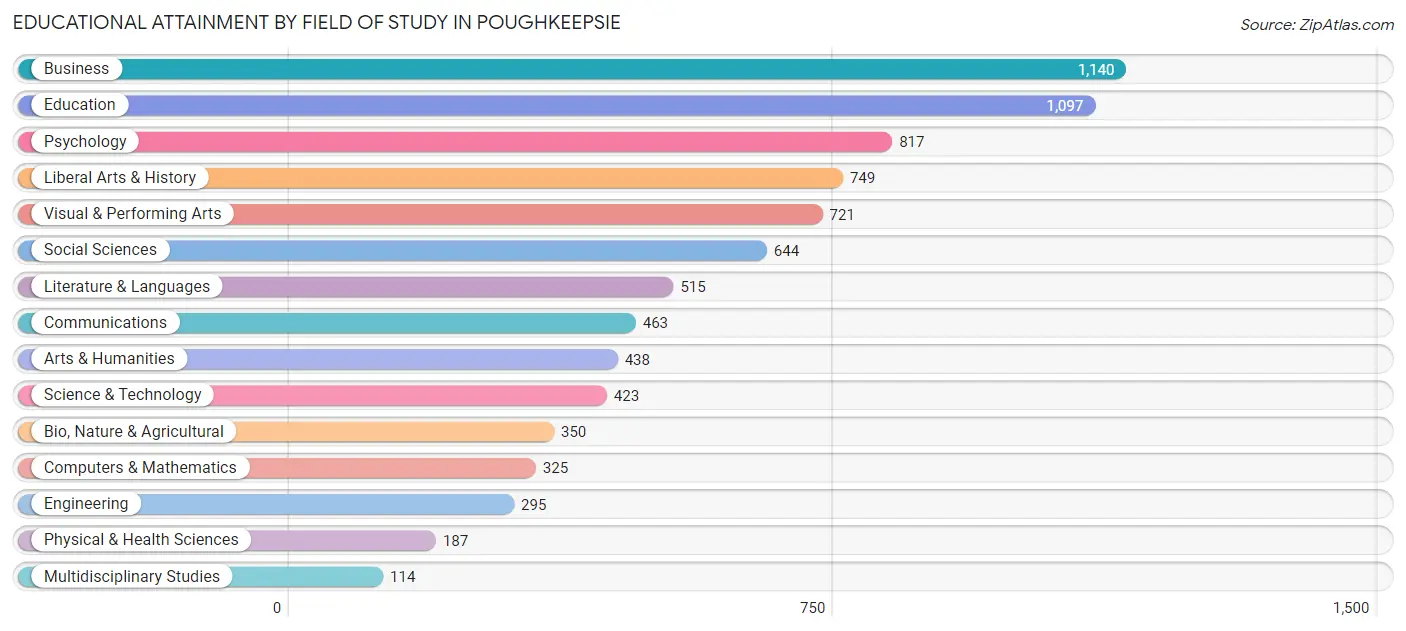
| Field of Study | # Graduates | % Graduates |
| Computers & Mathematics | 325 | 3.9% |
| Bio, Nature & Agricultural | 350 | 4.2% |
| Physical & Health Sciences | 187 | 2.3% |
| Psychology | 817 | 9.9% |
| Social Sciences | 644 | 7.8% |
| Engineering | 295 | 3.6% |
| Multidisciplinary Studies | 114 | 1.4% |
| Science & Technology | 423 | 5.1% |
| Business | 1,140 | 13.8% |
| Education | 1,097 | 13.3% |
| Literature & Languages | 515 | 6.2% |
| Liberal Arts & History | 749 | 9.0% |
| Visual & Performing Arts | 721 | 8.7% |
| Communications | 463 | 5.6% |
| Arts & Humanities | 438 | 5.3% |
| Total | 8,278 | 100.0% |
Transportation & Commute in Poughkeepsie
Vehicle Availability by Sex in Poughkeepsie
The most prevalent vehicle ownership categories in Poughkeepsie are males with 2 vehicles (2,579, accounting for 37.3%) and females with 2 vehicles (2,523, making up 33.0%).
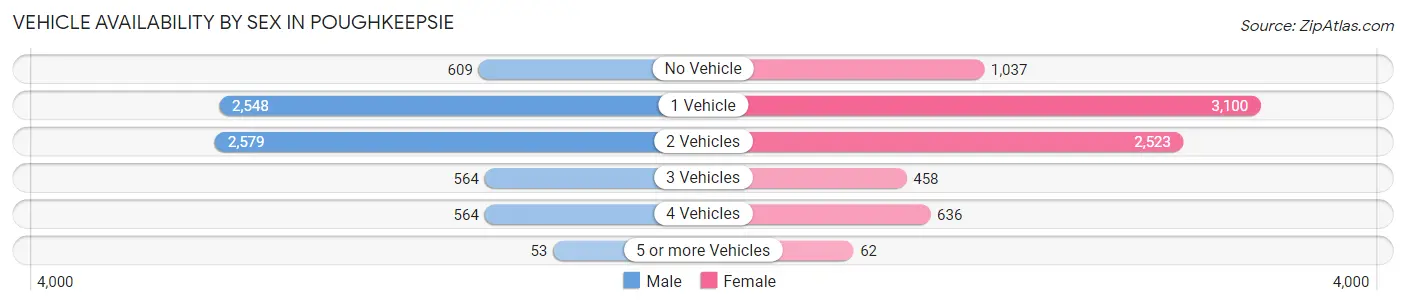
| Vehicles Available | Male | Female |
| No Vehicle | 609 (8.8%) | 1,037 (13.3%) |
| 1 Vehicle | 2,548 (36.8%) | 3,100 (39.7%) |
| 2 Vehicles | 2,579 (37.3%) | 2,523 (32.3%) |
| 3 Vehicles | 564 (8.2%) | 458 (5.9%) |
| 4 Vehicles | 564 (8.2%) | 636 (8.1%) |
| 5 or more Vehicles | 53 (0.8%) | 62 (0.8%) |
| Total | 6,917 (100.0%) | 7,816 (100.0%) |
Commute Time in Poughkeepsie
The most frequently occuring commute durations in Poughkeepsie are 10 to 14 minutes (2,748 commuters, 20.2%), 5 to 9 minutes (2,394 commuters, 17.6%), and 15 to 19 minutes (1,869 commuters, 13.7%).
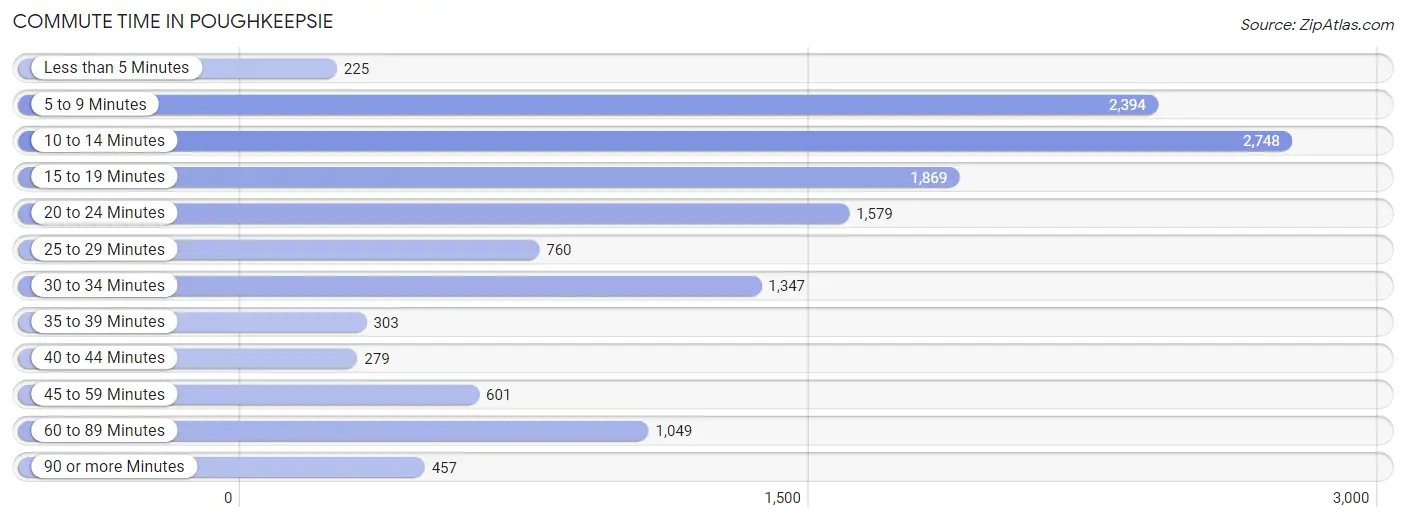
| Commute Time | # Commuters | % Commuters |
| Less than 5 Minutes | 225 | 1.7% |
| 5 to 9 Minutes | 2,394 | 17.6% |
| 10 to 14 Minutes | 2,748 | 20.2% |
| 15 to 19 Minutes | 1,869 | 13.7% |
| 20 to 24 Minutes | 1,579 | 11.6% |
| 25 to 29 Minutes | 760 | 5.6% |
| 30 to 34 Minutes | 1,347 | 9.9% |
| 35 to 39 Minutes | 303 | 2.2% |
| 40 to 44 Minutes | 279 | 2.1% |
| 45 to 59 Minutes | 601 | 4.4% |
| 60 to 89 Minutes | 1,049 | 7.7% |
| 90 or more Minutes | 457 | 3.4% |
Commute Time by Sex in Poughkeepsie
The most common commute times in Poughkeepsie are 10 to 14 minutes (1,097 commuters, 17.4%) for males and 10 to 14 minutes (1,651 commuters, 22.6%) for females.
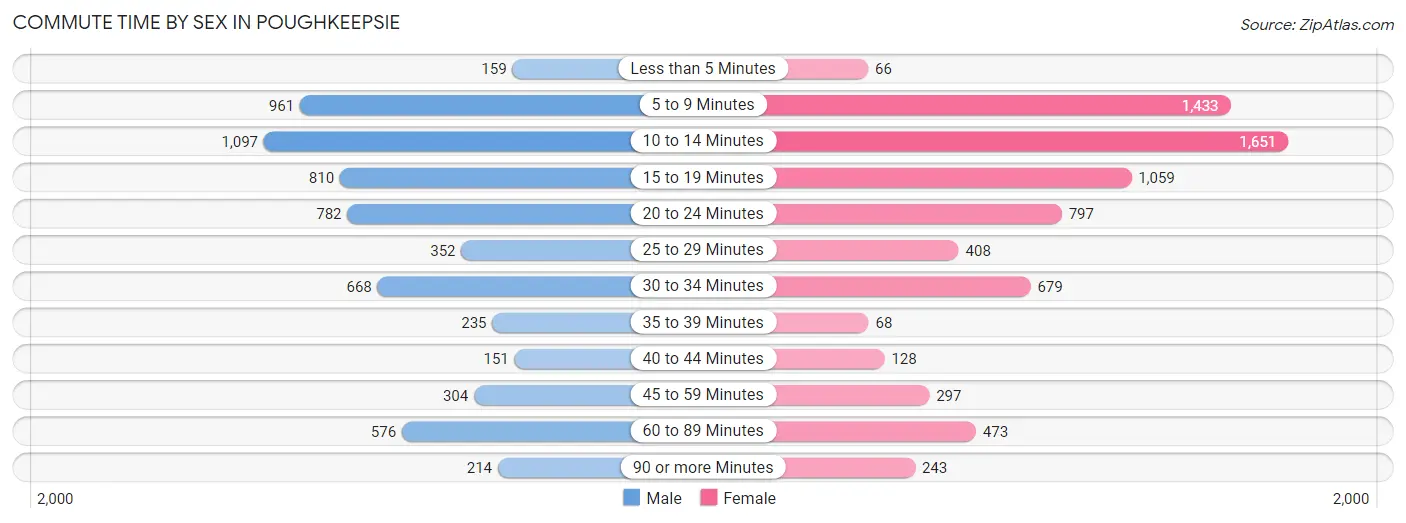
| Commute Time | Male | Female |
| Less than 5 Minutes | 159 (2.5%) | 66 (0.9%) |
| 5 to 9 Minutes | 961 (15.2%) | 1,433 (19.6%) |
| 10 to 14 Minutes | 1,097 (17.4%) | 1,651 (22.6%) |
| 15 to 19 Minutes | 810 (12.8%) | 1,059 (14.5%) |
| 20 to 24 Minutes | 782 (12.4%) | 797 (10.9%) |
| 25 to 29 Minutes | 352 (5.6%) | 408 (5.6%) |
| 30 to 34 Minutes | 668 (10.6%) | 679 (9.3%) |
| 35 to 39 Minutes | 235 (3.7%) | 68 (0.9%) |
| 40 to 44 Minutes | 151 (2.4%) | 128 (1.8%) |
| 45 to 59 Minutes | 304 (4.8%) | 297 (4.1%) |
| 60 to 89 Minutes | 576 (9.1%) | 473 (6.5%) |
| 90 or more Minutes | 214 (3.4%) | 243 (3.3%) |
Time of Departure to Work by Sex in Poughkeepsie
The most frequent times of departure to work in Poughkeepsie are 8:00 AM to 8:29 AM (720, 11.4%) for males and 8:00 AM to 8:29 AM (1,490, 20.4%) for females.
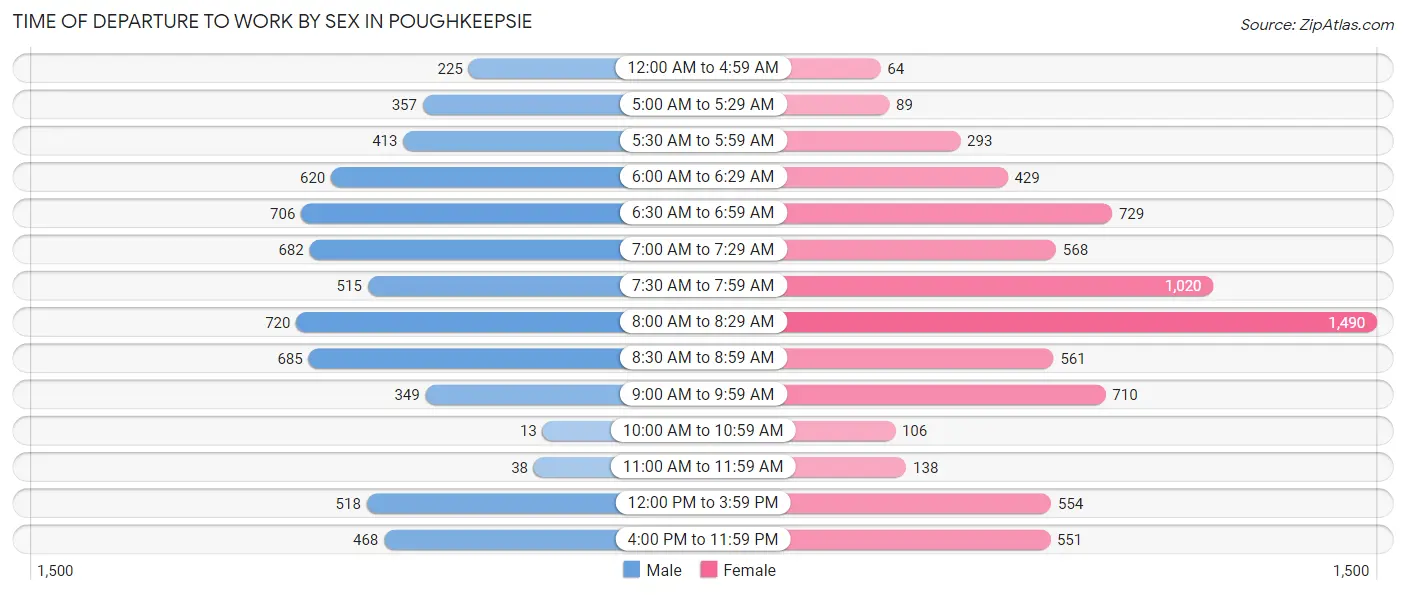
| Time of Departure | Male | Female |
| 12:00 AM to 4:59 AM | 225 (3.6%) | 64 (0.9%) |
| 5:00 AM to 5:29 AM | 357 (5.7%) | 89 (1.2%) |
| 5:30 AM to 5:59 AM | 413 (6.6%) | 293 (4.0%) |
| 6:00 AM to 6:29 AM | 620 (9.8%) | 429 (5.9%) |
| 6:30 AM to 6:59 AM | 706 (11.2%) | 729 (10.0%) |
| 7:00 AM to 7:29 AM | 682 (10.8%) | 568 (7.8%) |
| 7:30 AM to 7:59 AM | 515 (8.2%) | 1,020 (14.0%) |
| 8:00 AM to 8:29 AM | 720 (11.4%) | 1,490 (20.4%) |
| 8:30 AM to 8:59 AM | 685 (10.9%) | 561 (7.7%) |
| 9:00 AM to 9:59 AM | 349 (5.5%) | 710 (9.7%) |
| 10:00 AM to 10:59 AM | 13 (0.2%) | 106 (1.5%) |
| 11:00 AM to 11:59 AM | 38 (0.6%) | 138 (1.9%) |
| 12:00 PM to 3:59 PM | 518 (8.2%) | 554 (7.6%) |
| 4:00 PM to 11:59 PM | 468 (7.4%) | 551 (7.5%) |
| Total | 6,309 (100.0%) | 7,302 (100.0%) |
Housing Occupancy in Poughkeepsie
Occupancy by Ownership in Poughkeepsie
Of the total 13,591 dwellings in Poughkeepsie, owner-occupied units account for 5,089 (37.4%), while renter-occupied units make up 8,502 (62.6%).
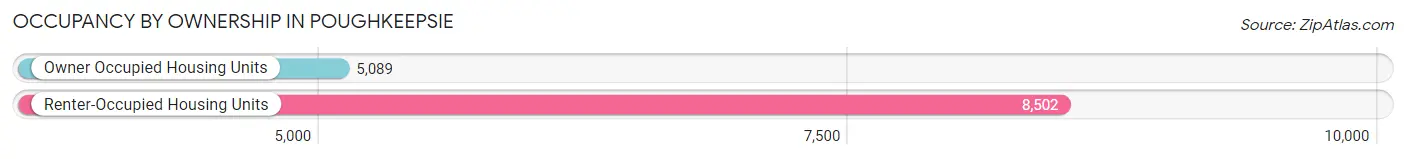
| Occupancy | # Housing Units | % Housing Units |
| Owner Occupied Housing Units | 5,089 | 37.4% |
| Renter-Occupied Housing Units | 8,502 | 62.6% |
| Total Occupied Housing Units | 13,591 | 100.0% |
Occupancy by Household Size in Poughkeepsie
| Household Size | # Housing Units | % Housing Units |
| 1-Person Household | 5,714 | 42.0% |
| 2-Person Household | 3,741 | 27.5% |
| 3-Person Household | 1,927 | 14.2% |
| 4+ Person Household | 2,209 | 16.3% |
| Total Housing Units | 13,591 | 100.0% |
Occupancy by Ownership by Household Size in Poughkeepsie
| Household Size | Owner-occupied | Renter-occupied |
| 1-Person Household | 1,959 (34.3%) | 3,755 (65.7%) |
| 2-Person Household | 1,685 (45.0%) | 2,056 (55.0%) |
| 3-Person Household | 634 (32.9%) | 1,293 (67.1%) |
| 4+ Person Household | 811 (36.7%) | 1,398 (63.3%) |
| Total Housing Units | 5,089 (37.4%) | 8,502 (62.6%) |
Occupancy by Educational Attainment in Poughkeepsie
| Household Size | Owner-occupied | Renter-occupied |
| Less than High School | 145 (9.2%) | 1,424 (90.8%) |
| High School Diploma | 883 (27.5%) | 2,327 (72.5%) |
| College/Associate Degree | 1,265 (30.2%) | 2,929 (69.8%) |
| Bachelor's Degree or higher | 2,796 (60.6%) | 1,822 (39.5%) |
Occupancy by Age of Householder in Poughkeepsie
| Age Bracket | # Households | % Households |
| Under 35 Years | 2,704 | 19.9% |
| 35 to 44 Years | 2,467 | 18.1% |
| 45 to 54 Years | 1,994 | 14.7% |
| 55 to 64 Years | 2,443 | 18.0% |
| 65 to 74 Years | 2,389 | 17.6% |
| 75 to 84 Years | 1,081 | 8.0% |
| 85 Years and Over | 513 | 3.8% |
| Total | 13,591 | 100.0% |
Housing Finances in Poughkeepsie
Median Income by Occupancy in Poughkeepsie
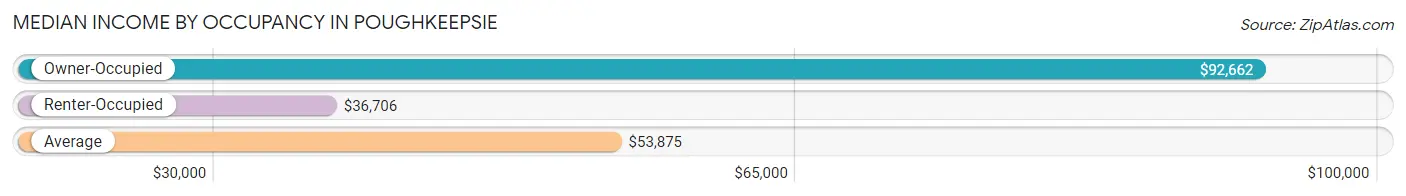
| Occupancy Type | # Households | Median Income |
| Owner-Occupied | 5,089 (37.4%) | $92,662 |
| Renter-Occupied | 8,502 (62.6%) | $36,706 |
| Average | 13,591 (100.0%) | $53,875 |
Occupancy by Householder Income Bracket in Poughkeepsie
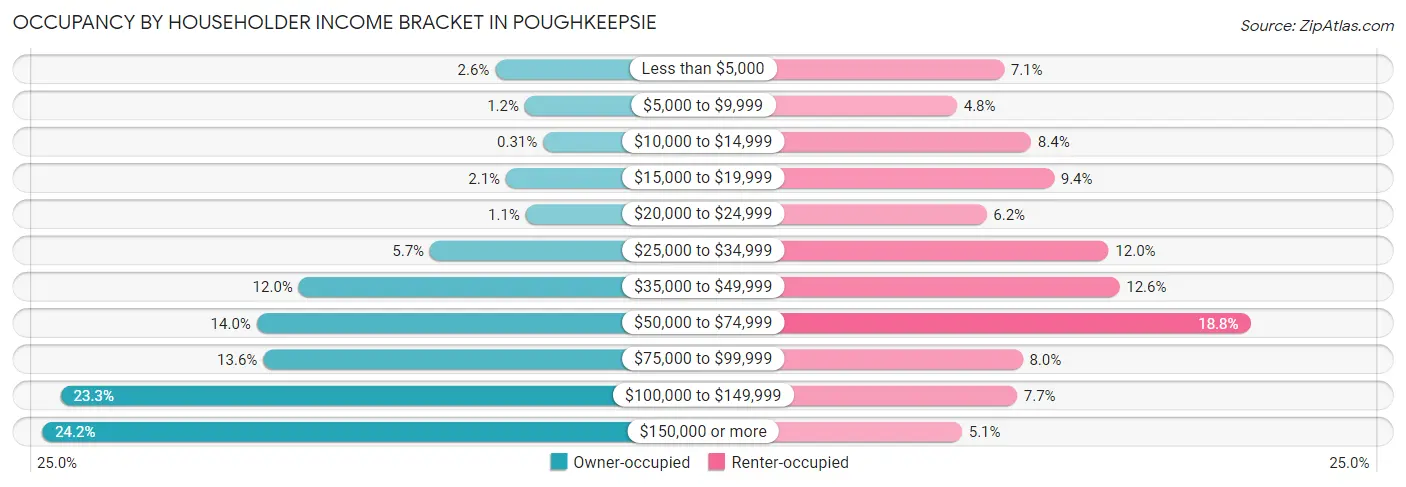
| Income Bracket | Owner-occupied | Renter-occupied |
| Less than $5,000 | 132 (2.6%) | 600 (7.1%) |
| $5,000 to $9,999 | 60 (1.2%) | 410 (4.8%) |
| $10,000 to $14,999 | 16 (0.3%) | 710 (8.4%) |
| $15,000 to $19,999 | 106 (2.1%) | 803 (9.4%) |
| $20,000 to $24,999 | 58 (1.1%) | 530 (6.2%) |
| $25,000 to $34,999 | 290 (5.7%) | 1,024 (12.0%) |
| $35,000 to $49,999 | 608 (11.9%) | 1,068 (12.6%) |
| $50,000 to $74,999 | 710 (14.0%) | 1,598 (18.8%) |
| $75,000 to $99,999 | 694 (13.6%) | 676 (8.0%) |
| $100,000 to $149,999 | 1,185 (23.3%) | 653 (7.7%) |
| $150,000 or more | 1,230 (24.2%) | 430 (5.1%) |
| Total | 5,089 (100.0%) | 8,502 (100.0%) |
Monthly Housing Cost Tiers in Poughkeepsie
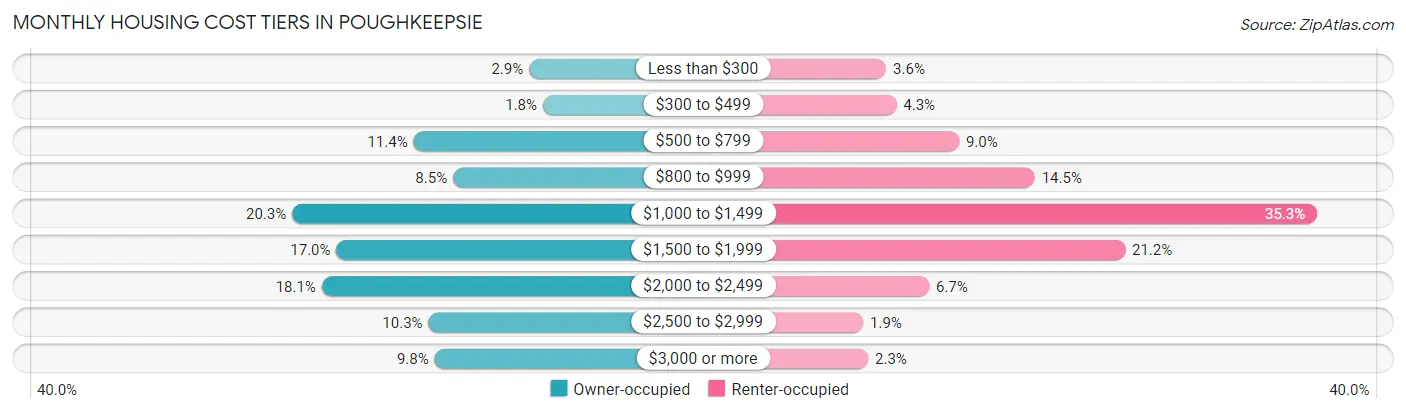
| Monthly Cost | Owner-occupied | Renter-occupied |
| Less than $300 | 145 (2.9%) | 305 (3.6%) |
| $300 to $499 | 93 (1.8%) | 369 (4.3%) |
| $500 to $799 | 578 (11.4%) | 761 (8.9%) |
| $800 to $999 | 430 (8.5%) | 1,235 (14.5%) |
| $1,000 to $1,499 | 1,033 (20.3%) | 3,003 (35.3%) |
| $1,500 to $1,999 | 867 (17.0%) | 1,801 (21.2%) |
| $2,000 to $2,499 | 922 (18.1%) | 573 (6.7%) |
| $2,500 to $2,999 | 522 (10.3%) | 161 (1.9%) |
| $3,000 or more | 499 (9.8%) | 192 (2.3%) |
| Total | 5,089 (100.0%) | 8,502 (100.0%) |
Physical Housing Characteristics in Poughkeepsie
Housing Structures in Poughkeepsie
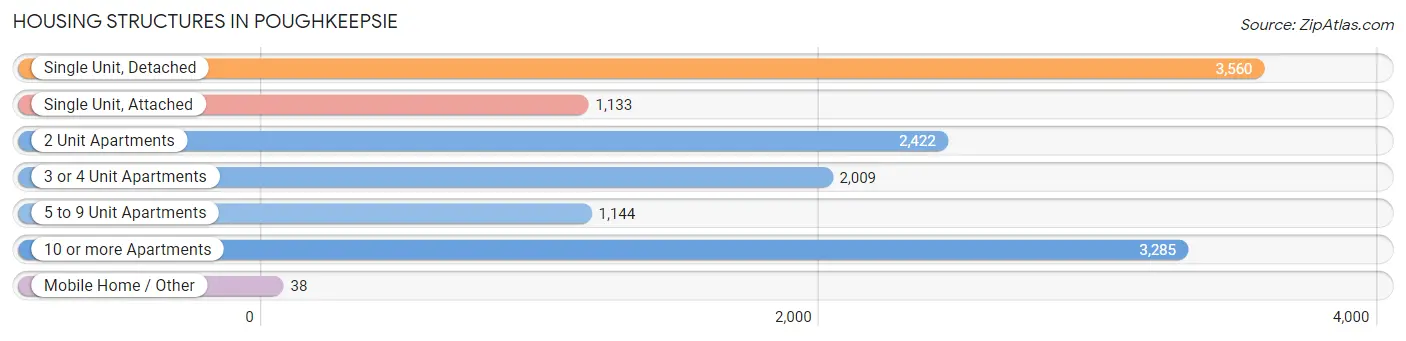
| Structure Type | # Housing Units | % Housing Units |
| Single Unit, Detached | 3,560 | 26.2% |
| Single Unit, Attached | 1,133 | 8.3% |
| 2 Unit Apartments | 2,422 | 17.8% |
| 3 or 4 Unit Apartments | 2,009 | 14.8% |
| 5 to 9 Unit Apartments | 1,144 | 8.4% |
| 10 or more Apartments | 3,285 | 24.2% |
| Mobile Home / Other | 38 | 0.3% |
| Total | 13,591 | 100.0% |
Housing Structures by Occupancy in Poughkeepsie
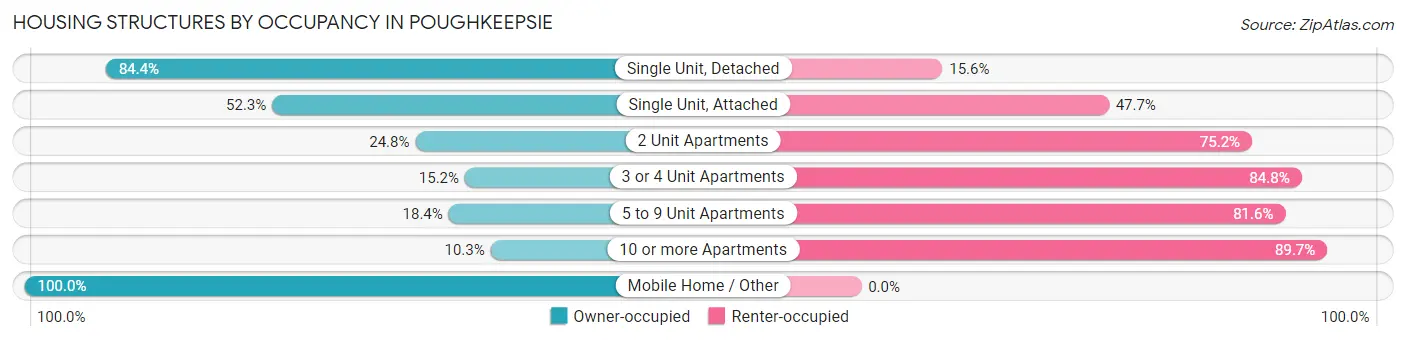
| Structure Type | Owner-occupied | Renter-occupied |
| Single Unit, Detached | 3,004 (84.4%) | 556 (15.6%) |
| Single Unit, Attached | 593 (52.3%) | 540 (47.7%) |
| 2 Unit Apartments | 600 (24.8%) | 1,822 (75.2%) |
| 3 or 4 Unit Apartments | 306 (15.2%) | 1,703 (84.8%) |
| 5 to 9 Unit Apartments | 210 (18.4%) | 934 (81.6%) |
| 10 or more Apartments | 338 (10.3%) | 2,947 (89.7%) |
| Mobile Home / Other | 38 (100.0%) | 0 (0.0%) |
| Total | 5,089 (37.4%) | 8,502 (62.6%) |
Housing Structures by Number of Rooms in Poughkeepsie
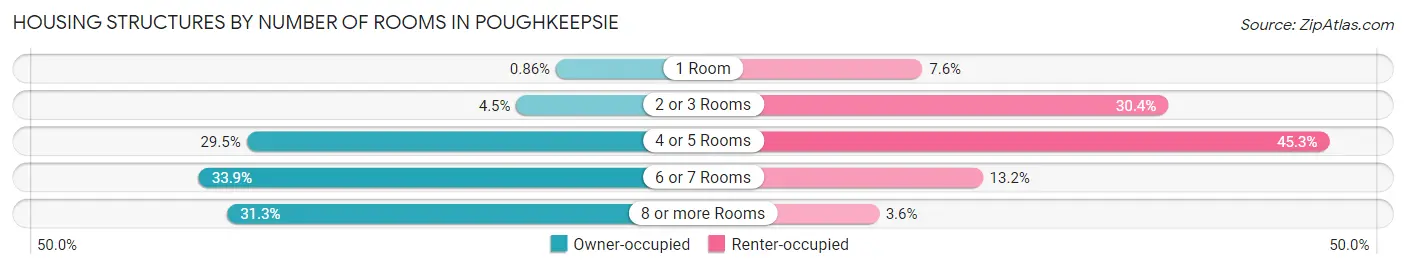
| Number of Rooms | Owner-occupied | Renter-occupied |
| 1 Room | 44 (0.9%) | 648 (7.6%) |
| 2 or 3 Rooms | 230 (4.5%) | 2,580 (30.3%) |
| 4 or 5 Rooms | 1,500 (29.5%) | 3,847 (45.3%) |
| 6 or 7 Rooms | 1,724 (33.9%) | 1,122 (13.2%) |
| 8 or more Rooms | 1,591 (31.3%) | 305 (3.6%) |
| Total | 5,089 (100.0%) | 8,502 (100.0%) |
Housing Structure by Heating Type in Poughkeepsie
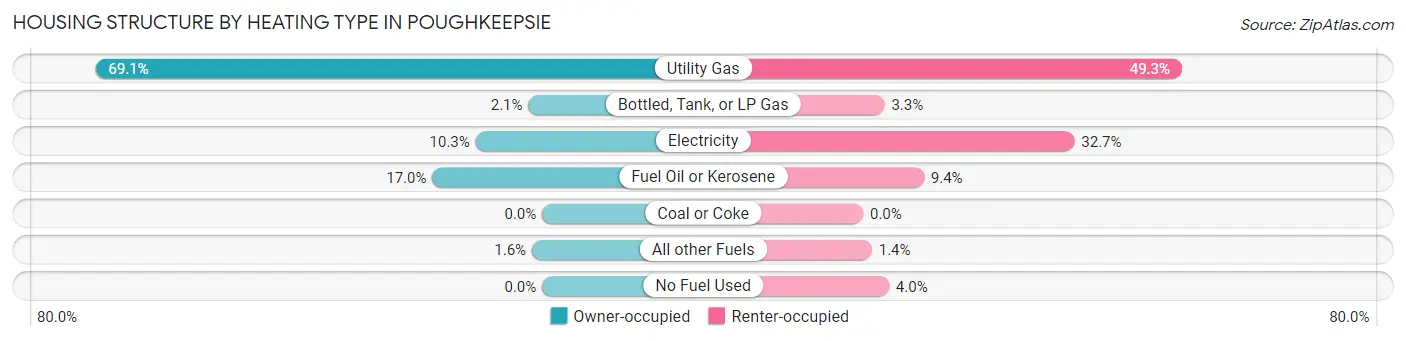
| Heating Type | Owner-occupied | Renter-occupied |
| Utility Gas | 3,514 (69.1%) | 4,189 (49.3%) |
| Bottled, Tank, or LP Gas | 108 (2.1%) | 281 (3.3%) |
| Electricity | 523 (10.3%) | 2,778 (32.7%) |
| Fuel Oil or Kerosene | 864 (17.0%) | 799 (9.4%) |
| Coal or Coke | 0 (0.0%) | 0 (0.0%) |
| All other Fuels | 80 (1.6%) | 115 (1.3%) |
| No Fuel Used | 0 (0.0%) | 340 (4.0%) |
| Total | 5,089 (100.0%) | 8,502 (100.0%) |
Household Vehicle Usage in Poughkeepsie
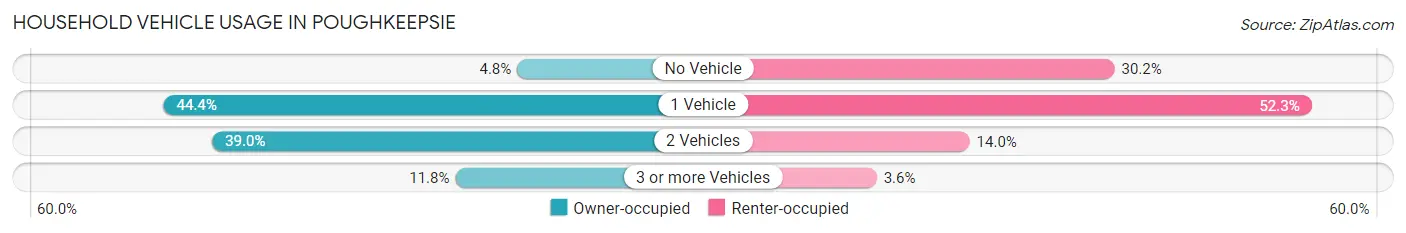
| Vehicles per Household | Owner-occupied | Renter-occupied |
| No Vehicle | 246 (4.8%) | 2,568 (30.2%) |
| 1 Vehicle | 2,261 (44.4%) | 4,443 (52.3%) |
| 2 Vehicles | 1,984 (39.0%) | 1,188 (14.0%) |
| 3 or more Vehicles | 598 (11.7%) | 303 (3.6%) |
| Total | 5,089 (100.0%) | 8,502 (100.0%) |
Real Estate & Mortgages in Poughkeepsie
Real Estate and Mortgage Overview in Poughkeepsie
| Characteristic | Without Mortgage | With Mortgage |
| Housing Units | 1,910 | 3,179 |
| Median Property Value | $241,500 | $248,200 |
| Median Household Income | $80,709 | $818 |
| Monthly Housing Costs | $948 | $497 |
| Real Estate Taxes | $5,027 | $283 |
Property Value by Mortgage Status in Poughkeepsie
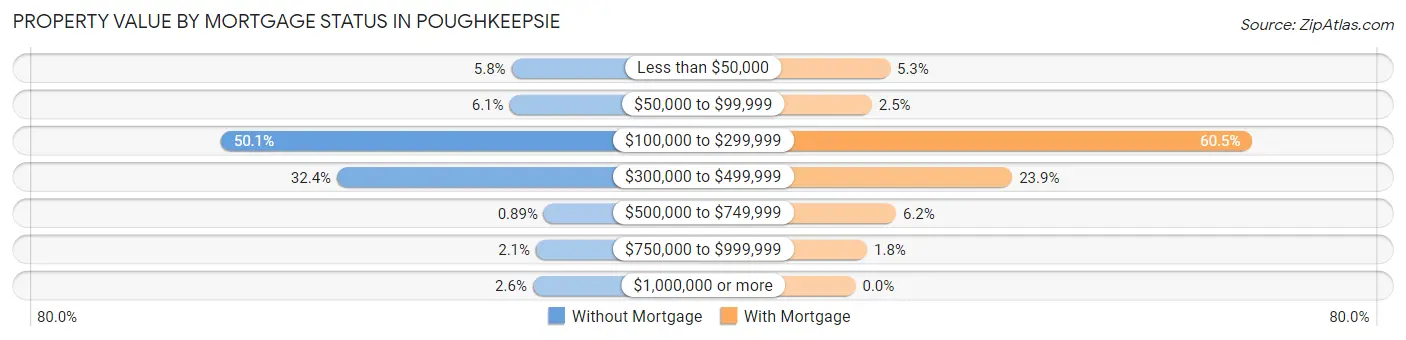
| Property Value | Without Mortgage | With Mortgage |
| Less than $50,000 | 111 (5.8%) | 167 (5.2%) |
| $50,000 to $99,999 | 117 (6.1%) | 79 (2.5%) |
| $100,000 to $299,999 | 957 (50.1%) | 1,922 (60.5%) |
| $300,000 to $499,999 | 619 (32.4%) | 759 (23.9%) |
| $500,000 to $749,999 | 17 (0.9%) | 196 (6.2%) |
| $750,000 to $999,999 | 40 (2.1%) | 56 (1.8%) |
| $1,000,000 or more | 49 (2.6%) | 0 (0.0%) |
| Total | 1,910 (100.0%) | 3,179 (100.0%) |
Household Income by Mortgage Status in Poughkeepsie
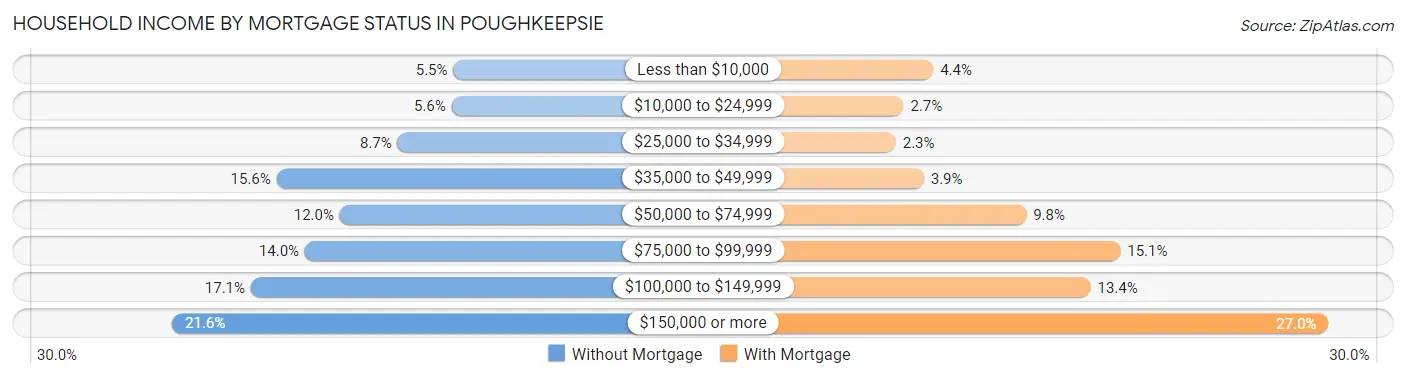
| Household Income | Without Mortgage | With Mortgage |
| Less than $10,000 | 105 (5.5%) | 141 (4.4%) |
| $10,000 to $24,999 | 107 (5.6%) | 87 (2.7%) |
| $25,000 to $34,999 | 166 (8.7%) | 73 (2.3%) |
| $35,000 to $49,999 | 298 (15.6%) | 124 (3.9%) |
| $50,000 to $74,999 | 229 (12.0%) | 310 (9.8%) |
| $75,000 to $99,999 | 267 (14.0%) | 481 (15.1%) |
| $100,000 to $149,999 | 326 (17.1%) | 427 (13.4%) |
| $150,000 or more | 412 (21.6%) | 859 (27.0%) |
| Total | 1,910 (100.0%) | 3,179 (100.0%) |
Property Value to Household Income Ratio in Poughkeepsie
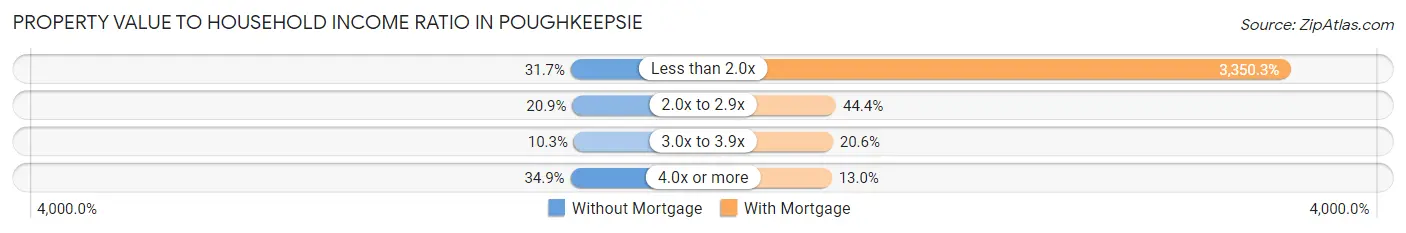
| Value-to-Income Ratio | Without Mortgage | With Mortgage |
| Less than 2.0x | 605 (31.7%) | 106,505 (3,350.3%) |
| 2.0x to 2.9x | 399 (20.9%) | 1,411 (44.4%) |
| 3.0x to 3.9x | 196 (10.3%) | 656 (20.6%) |
| 4.0x or more | 666 (34.9%) | 412 (13.0%) |
| Total | 1,910 (100.0%) | 3,179 (100.0%) |
Real Estate Taxes by Mortgage Status in Poughkeepsie
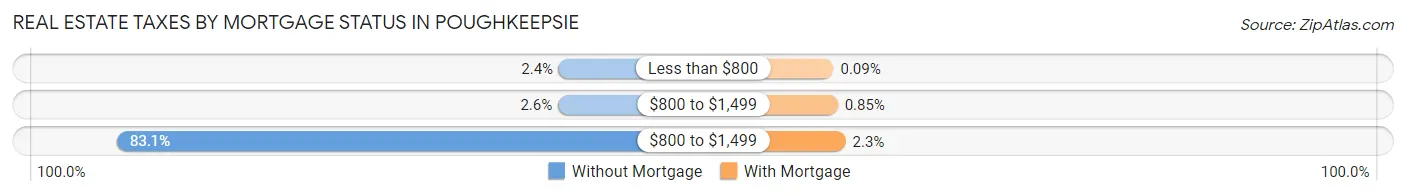
| Property Taxes | Without Mortgage | With Mortgage |
| Less than $800 | 46 (2.4%) | 3 (0.1%) |
| $800 to $1,499 | 49 (2.6%) | 27 (0.9%) |
| $800 to $1,499 | 1,588 (83.1%) | 73 (2.3%) |
| Total | 1,910 (100.0%) | 3,179 (100.0%) |
Health & Disability in Poughkeepsie
Health Insurance Coverage by Age in Poughkeepsie
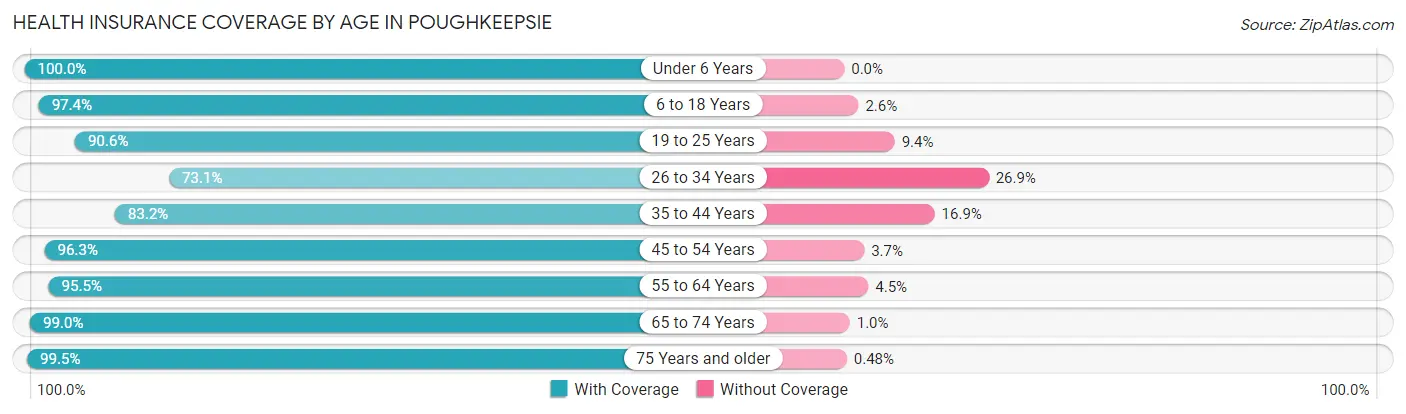
| Age Bracket | With Coverage | Without Coverage |
| Under 6 Years | 2,063 (100.0%) | 0 (0.0%) |
| 6 to 18 Years | 4,320 (97.4%) | 117 (2.6%) |
| 19 to 25 Years | 2,661 (90.6%) | 276 (9.4%) |
| 26 to 34 Years | 3,711 (73.1%) | 1,368 (26.9%) |
| 35 to 44 Years | 3,616 (83.2%) | 733 (16.9%) |
| 45 to 54 Years | 3,360 (96.3%) | 130 (3.7%) |
| 55 to 64 Years | 3,256 (95.5%) | 153 (4.5%) |
| 65 to 74 Years | 3,098 (99.0%) | 32 (1.0%) |
| 75 Years and older | 2,067 (99.5%) | 10 (0.5%) |
| Total | 28,152 (90.9%) | 2,819 (9.1%) |
Health Insurance Coverage by Citizenship Status in Poughkeepsie
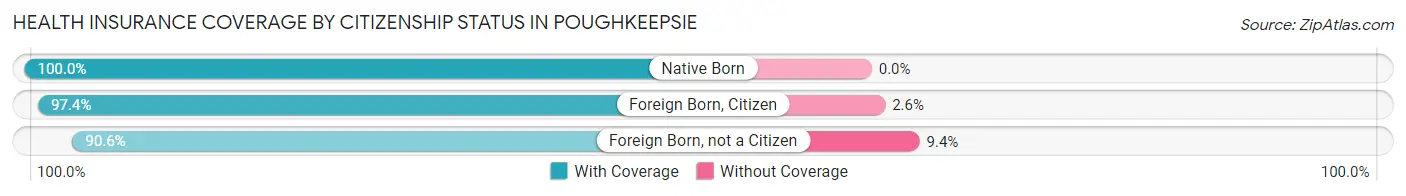
| Citizenship Status | With Coverage | Without Coverage |
| Native Born | 2,063 (100.0%) | 0 (0.0%) |
| Foreign Born, Citizen | 4,320 (97.4%) | 117 (2.6%) |
| Foreign Born, not a Citizen | 2,661 (90.6%) | 276 (9.4%) |
Health Insurance Coverage by Household Income in Poughkeepsie
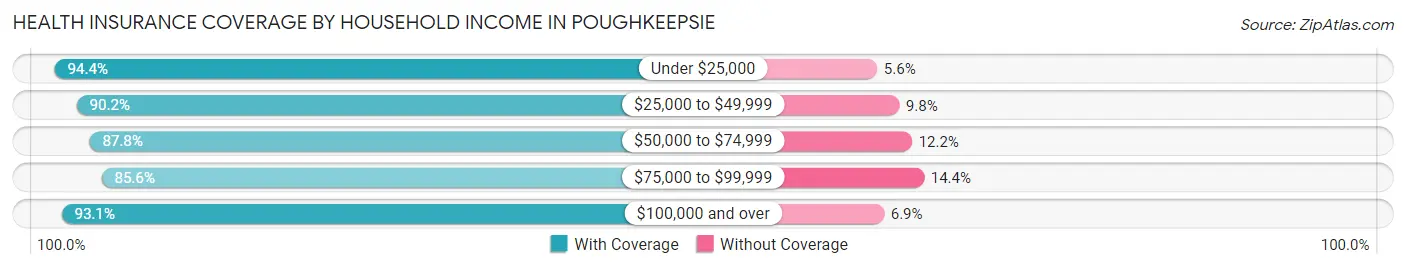
| Household Income | With Coverage | Without Coverage |
| Under $25,000 | 5,501 (94.4%) | 329 (5.6%) |
| $25,000 to $49,999 | 5,448 (90.2%) | 589 (9.8%) |
| $50,000 to $74,999 | 4,550 (87.8%) | 630 (12.2%) |
| $75,000 to $99,999 | 2,897 (85.6%) | 488 (14.4%) |
| $100,000 and over | 9,560 (93.1%) | 712 (6.9%) |
Public vs Private Health Insurance Coverage by Age in Poughkeepsie
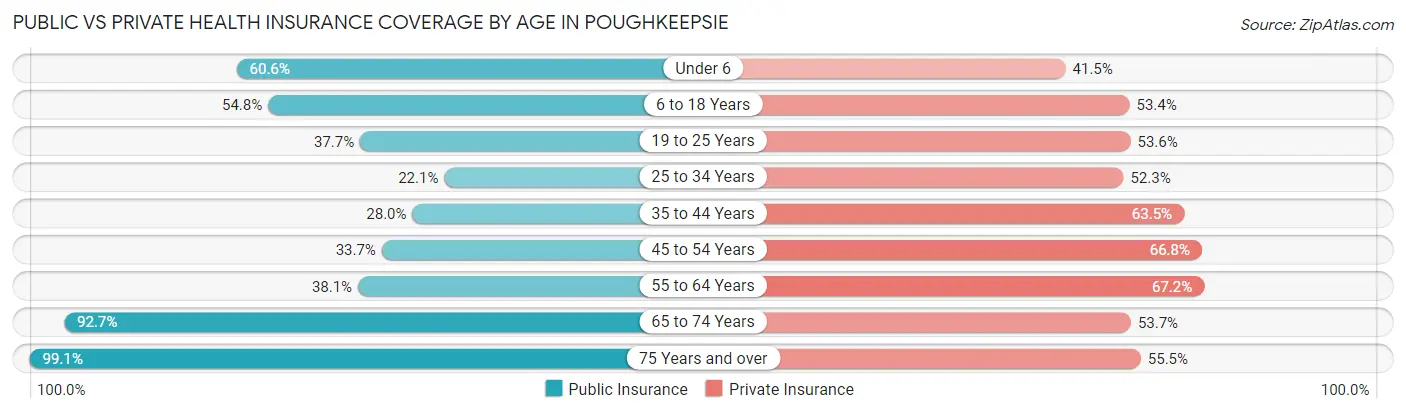
| Age Bracket | Public Insurance | Private Insurance |
| Under 6 | 1,251 (60.6%) | 857 (41.5%) |
| 6 to 18 Years | 2,432 (54.8%) | 2,370 (53.4%) |
| 19 to 25 Years | 1,108 (37.7%) | 1,574 (53.6%) |
| 25 to 34 Years | 1,123 (22.1%) | 2,656 (52.3%) |
| 35 to 44 Years | 1,219 (28.0%) | 2,761 (63.5%) |
| 45 to 54 Years | 1,177 (33.7%) | 2,332 (66.8%) |
| 55 to 64 Years | 1,300 (38.1%) | 2,292 (67.2%) |
| 65 to 74 Years | 2,901 (92.7%) | 1,680 (53.7%) |
| 75 Years and over | 2,058 (99.1%) | 1,153 (55.5%) |
| Total | 14,569 (47.0%) | 17,675 (57.1%) |
Disability Status by Sex by Age in Poughkeepsie
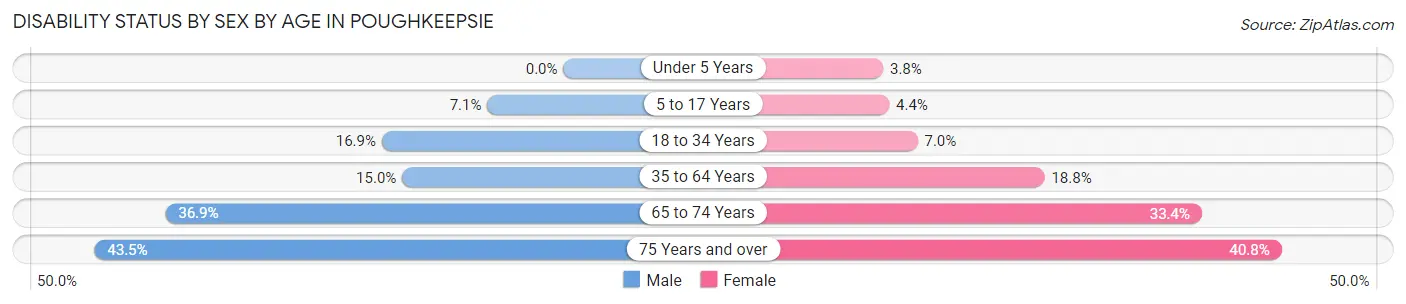
| Age Bracket | Male | Female |
| Under 5 Years | 0 (0.0%) | 40 (3.8%) |
| 5 to 17 Years | 192 (7.1%) | 77 (4.4%) |
| 18 to 34 Years | 660 (16.9%) | 311 (7.0%) |
| 35 to 64 Years | 752 (15.0%) | 1,170 (18.8%) |
| 65 to 74 Years | 475 (36.9%) | 616 (33.4%) |
| 75 Years and over | 359 (43.5%) | 511 (40.8%) |
Disability Class by Sex by Age in Poughkeepsie
Disability Class: Hearing Difficulty
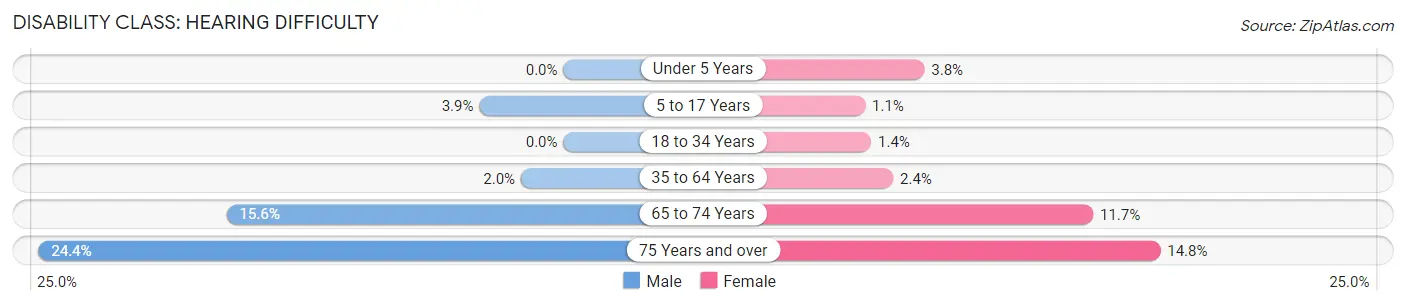
| Age Bracket | Male | Female |
| Under 5 Years | 0 (0.0%) | 40 (3.8%) |
| 5 to 17 Years | 106 (3.9%) | 19 (1.1%) |
| 18 to 34 Years | 0 (0.0%) | 60 (1.4%) |
| 35 to 64 Years | 99 (2.0%) | 148 (2.4%) |
| 65 to 74 Years | 201 (15.6%) | 215 (11.7%) |
| 75 Years and over | 201 (24.4%) | 185 (14.8%) |
Disability Class: Vision Difficulty
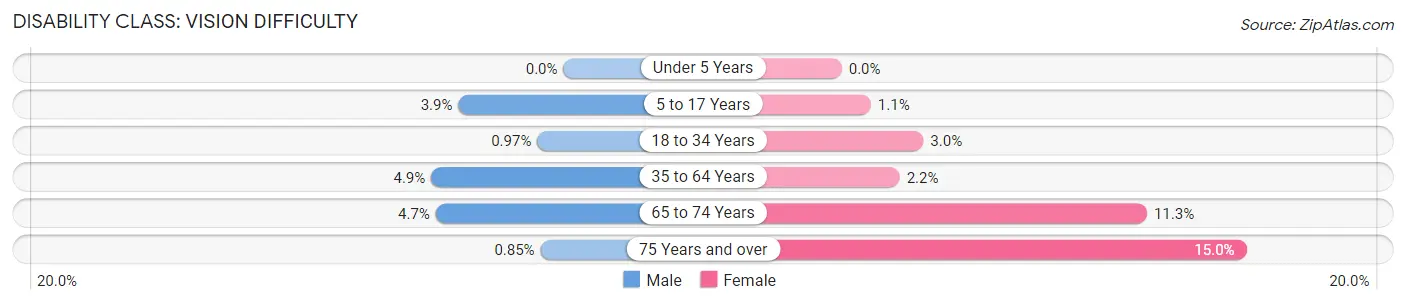
| Age Bracket | Male | Female |
| Under 5 Years | 0 (0.0%) | 0 (0.0%) |
| 5 to 17 Years | 106 (3.9%) | 19 (1.1%) |
| 18 to 34 Years | 38 (1.0%) | 134 (3.0%) |
| 35 to 64 Years | 247 (4.9%) | 134 (2.1%) |
| 65 to 74 Years | 61 (4.7%) | 209 (11.3%) |
| 75 Years and over | 7 (0.9%) | 188 (15.0%) |
Disability Class: Cognitive Difficulty
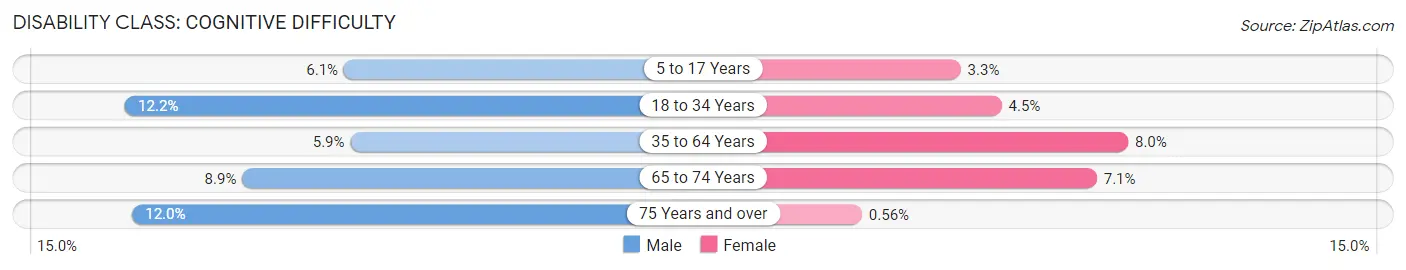
| Age Bracket | Male | Female |
| 5 to 17 Years | 166 (6.1%) | 58 (3.3%) |
| 18 to 34 Years | 478 (12.2%) | 197 (4.4%) |
| 35 to 64 Years | 298 (5.9%) | 496 (8.0%) |
| 65 to 74 Years | 115 (8.9%) | 131 (7.1%) |
| 75 Years and over | 99 (12.0%) | 7 (0.6%) |
Disability Class: Ambulatory Difficulty
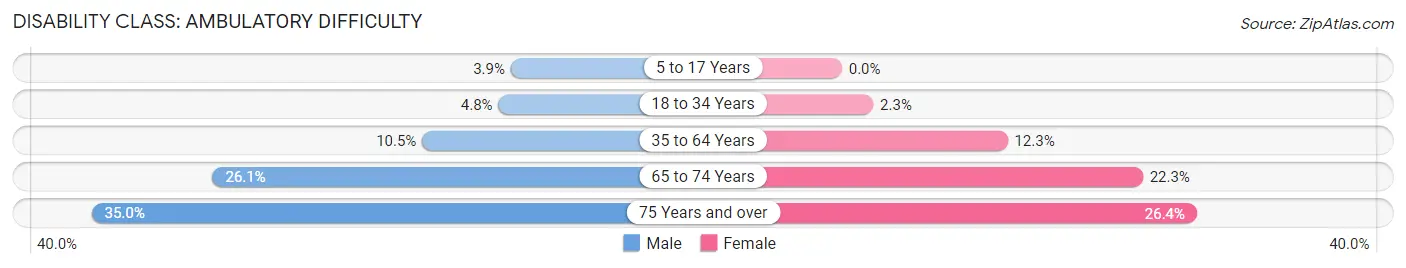
| Age Bracket | Male | Female |
| 5 to 17 Years | 106 (3.9%) | 0 (0.0%) |
| 18 to 34 Years | 189 (4.8%) | 103 (2.3%) |
| 35 to 64 Years | 527 (10.5%) | 765 (12.3%) |
| 65 to 74 Years | 335 (26.1%) | 412 (22.3%) |
| 75 Years and over | 289 (35.0%) | 330 (26.4%) |
Disability Class: Self-Care Difficulty
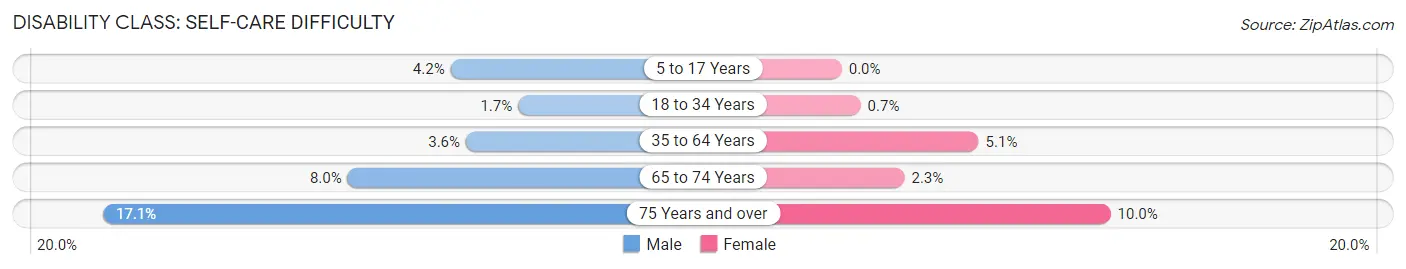
| Age Bracket | Male | Female |
| 5 to 17 Years | 114 (4.2%) | 0 (0.0%) |
| 18 to 34 Years | 66 (1.7%) | 31 (0.7%) |
| 35 to 64 Years | 182 (3.6%) | 316 (5.1%) |
| 65 to 74 Years | 103 (8.0%) | 43 (2.3%) |
| 75 Years and over | 141 (17.1%) | 125 (10.0%) |
Technology Access in Poughkeepsie
Computing Device Access in Poughkeepsie
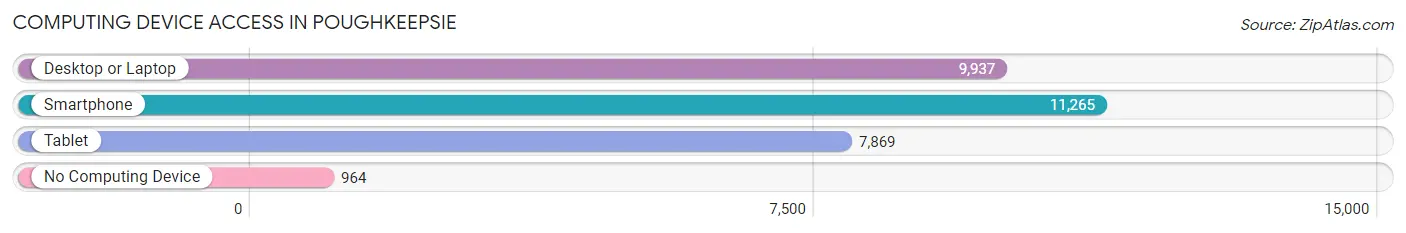
| Device Type | # Households | % Households |
| Desktop or Laptop | 9,937 | 73.1% |
| Smartphone | 11,265 | 82.9% |
| Tablet | 7,869 | 57.9% |
| No Computing Device | 964 | 7.1% |
| Total | 13,591 | 100.0% |
Internet Access in Poughkeepsie
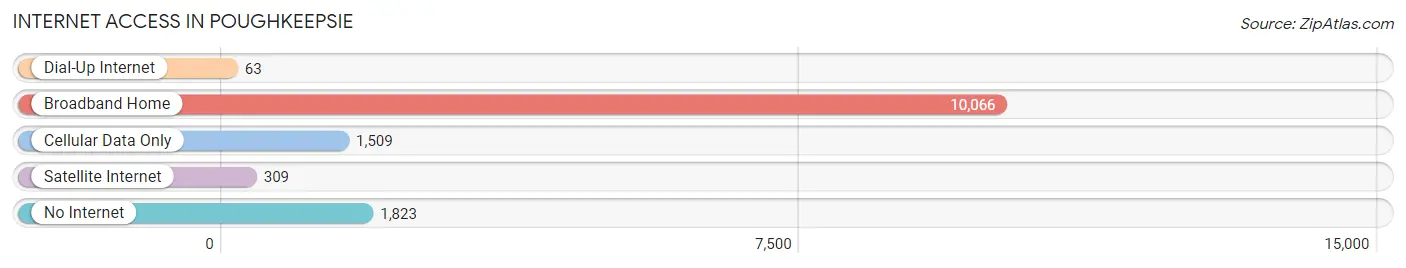
| Internet Type | # Households | % Households |
| Dial-Up Internet | 63 | 0.5% |
| Broadband Home | 10,066 | 74.1% |
| Cellular Data Only | 1,509 | 11.1% |
| Satellite Internet | 309 | 2.3% |
| No Internet | 1,823 | 13.4% |
| Total | 13,591 | 100.0% |
Poughkeepsie Summary
Poughkeepsie, New York is a city located in Dutchess County, New York, United States. It is the county seat of Dutchess County and is located in the Hudson Valley, approximately 90 miles north of New York City. The city has a population of approximately 32,000 people and is the largest city in the county.
History
The area that is now Poughkeepsie was originally inhabited by the Wappinger Native American tribe. The first European settlers arrived in the area in the late 17th century and the city was officially founded in 1799. The city was named after the Wappinger word for “reed-covered lodge by the little-water place”.
In the 19th century, Poughkeepsie was an important industrial center, with several factories and mills located in the city. The city was also an important transportation hub, with the Hudson River providing access to New York City and other cities in the region.
In the 20th century, Poughkeepsie experienced a period of decline as the city’s industrial base declined and the population decreased. However, in recent years, the city has experienced a resurgence, with new businesses and development projects revitalizing the city.
Geography
Poughkeepsie is located in the Hudson Valley region of New York, approximately 90 miles north of New York City. The city is situated on the east bank of the Hudson River and is bordered by the towns of Hyde Park, LaGrange, and Wappinger. The city has a total area of 8.2 square miles, of which 7.9 square miles is land and 0.3 square miles is water.
The city is located in a hilly region, with the highest point in the city being the summit of Prospect Hill, which has an elevation of 590 feet. The city is also home to several parks, including the Walkway Over the Hudson State Historic Park, which is the world’s longest elevated pedestrian bridge.
Economy
Poughkeepsie’s economy is largely based on the service industry, with the city’s largest employers being Vassar College, IBM, and the City of Poughkeepsie. The city is also home to several large corporations, including PepsiCo, IBM, and Central Hudson Gas & Electric.
The city is also home to several small businesses, including restaurants, retail stores, and professional services. The city is also home to several technology companies, including IBM, which has a large research and development facility in the city.
Demographics
As of the 2010 census, the population of Poughkeepsie was 32,736. The city has a population density of 3,976 people per square mile. The racial makeup of the city is 57.3% White, 28.2% African American, 0.3% Native American, 4.2% Asian, 0.1% Pacific Islander, 6.2% from other races, and 3.7% from two or more races.
The median household income in Poughkeepsie is $45,837, and the median family income is $54,837. The per capita income in the city is $25,837. The city’s poverty rate is 22.3%, which is higher than the national average.
Conclusion
Poughkeepsie, New York is a city located in Dutchess County, New York, United States. It is the county seat of Dutchess County and is located in the Hudson Valley, approximately 90 miles north of New York City. The city has a population of approximately 32,000 people and is the largest city in the county. The city has a long history, with the first European settlers arriving in the late 17th century. The city was an important industrial center in the 19th century and is now home to several large corporations and small businesses. The city’s economy is largely based on the service industry, with the city’s largest employers being Vassar College, IBM, and the City of Poughkeepsie. The city has a population of 32,736, with a median household income of $45,837 and a poverty rate of 22.3%.
Common Questions
What is Per Capita Income in Poughkeepsie?
Per Capita income in Poughkeepsie is $41,582.
What is the Median Family Income in Poughkeepsie?
Median Family Income in Poughkeepsie is $70,023.
What is the Median Household income in Poughkeepsie?
Median Household Income in Poughkeepsie is $53,875.
What is Income or Wage Gap in Poughkeepsie?
Income or Wage Gap in Poughkeepsie is 21.8%.
Women in Poughkeepsie earn 78.2 cents for every dollar earned by a man.
What is Inequality or Gini Index in Poughkeepsie?
Inequality or Gini Index in Poughkeepsie is 0.57.
What is the Total Population of Poughkeepsie?
Total Population of Poughkeepsie is 31,717.
What is the Total Male Population of Poughkeepsie?
Total Male Population of Poughkeepsie is 14,912.
What is the Total Female Population of Poughkeepsie?
Total Female Population of Poughkeepsie is 16,805.
What is the Ratio of Males per 100 Females in Poughkeepsie?
There are 88.74 Males per 100 Females in Poughkeepsie.
What is the Ratio of Females per 100 Males in Poughkeepsie?
There are 112.69 Females per 100 Males in Poughkeepsie.
What is the Median Population Age in Poughkeepsie?
Median Population Age in Poughkeepsie is 37.8 Years.
What is the Average Family Size in Poughkeepsie
Average Family Size in Poughkeepsie is 3.2 People.
What is the Average Household Size in Poughkeepsie
Average Household Size in Poughkeepsie is 2.3 People.
How Large is the Labor Force in Poughkeepsie?
There are 16,252 People in the Labor Forcein in Poughkeepsie.
What is the Percentage of People in the Labor Force in Poughkeepsie?
62.6% of People are in the Labor Force in Poughkeepsie.
What is the Unemployment Rate in Poughkeepsie?
Unemployment Rate in Poughkeepsie is 7.3%.