Glasgow, DE Map & Demographics
Glasgow Map
Glasgow Overview
$41,452
PER CAPITA INCOME
$109,668
AVG FAMILY INCOME
$104,692
AVG HOUSEHOLD INCOME
13.8%
WAGE / INCOME GAP [ % ]
86.2¢/ $1
WAGE / INCOME GAP [ $ ]
0.32
INEQUALITY / GINI INDEX
15,405
TOTAL POPULATION
7,216
MALE POPULATION
8,189
FEMALE POPULATION
88.12
MALES / 100 FEMALES
113.48
FEMALES / 100 MALES
42.1
MEDIAN AGE
3.3
AVG FAMILY SIZE
2.8
AVG HOUSEHOLD SIZE
9,170
LABOR FORCE [ PEOPLE ]
71.9%
PERCENT IN LABOR FORCE
6.4%
UNEMPLOYMENT RATE
Income in Glasgow
Income Overview in Glasgow
Per Capita Income in Glasgow is $41,452, while median incomes of families and households are $109,668 and $104,692 respectively.
| Characteristic | Number | Measure |
| Per Capita Income | 15,405 | $41,452 |
| Median Family Income | 3,718 | $109,668 |
| Mean Family Income | 3,718 | $124,616 |
| Median Household Income | 5,434 | $104,692 |
| Mean Household Income | 5,434 | $114,552 |
| Income Deficit | 3,718 | $0 |
| Wage / Income Gap (%) | 15,405 | 13.76% |
| Wage / Income Gap ($) | 15,405 | 86.24¢ per $1 |
| Gini / Inequality Index | 15,405 | 0.32 |
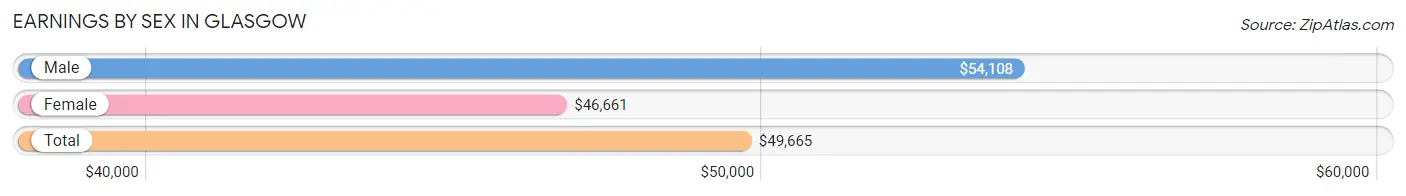
Earnings by Sex in Glasgow
Average Earnings in Glasgow are $49,665, $54,108 for men and $46,661 for women, a difference of 13.8%.
| Sex | Number | Average Earnings |
| Male | 4,649 (50.9%) | $54,108 |
| Female | 4,487 (49.1%) | $46,661 |
| Total | 9,136 (100.0%) | $49,665 |
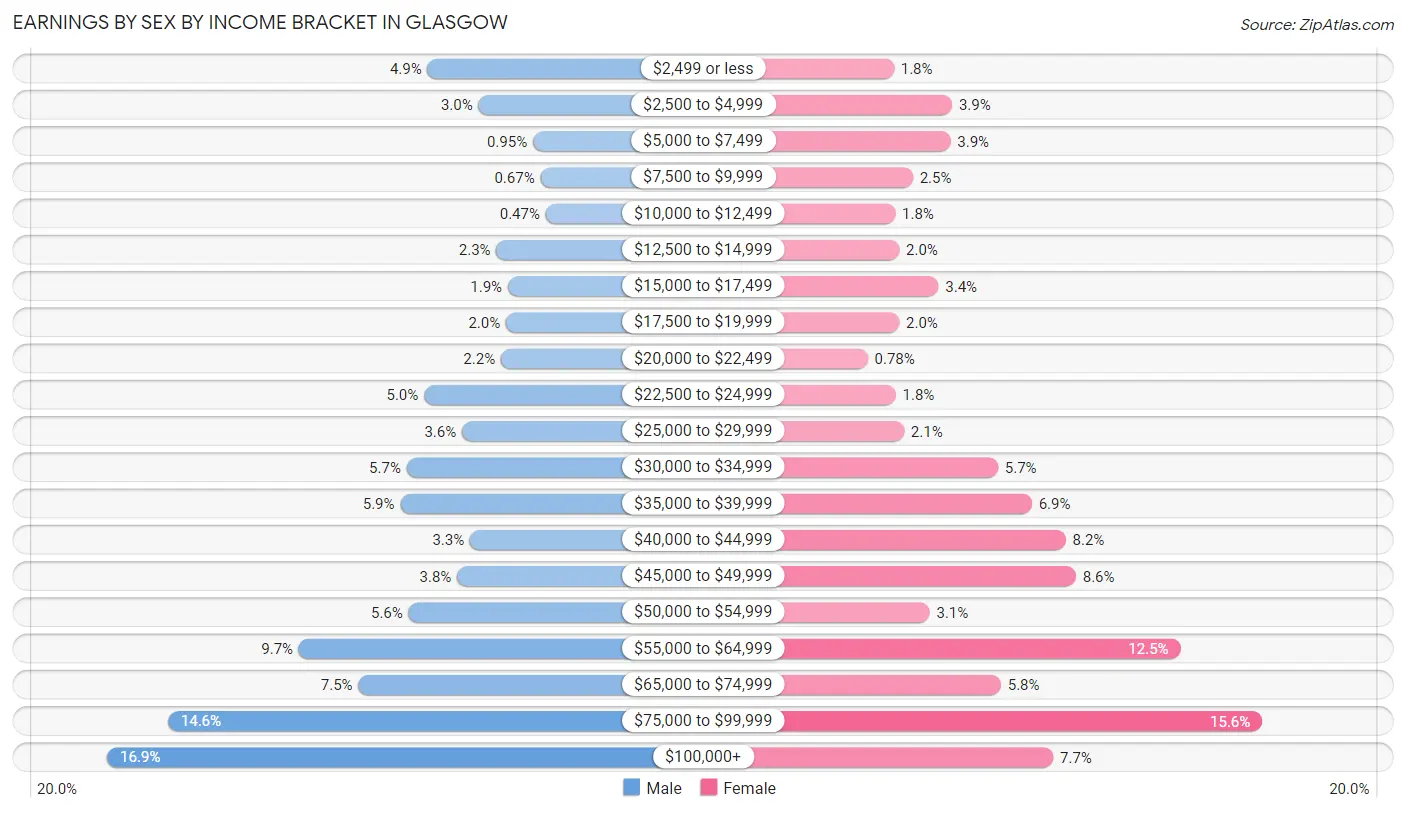
Earnings by Sex by Income Bracket in Glasgow
The most common earnings brackets in Glasgow are $100,000+ for men (786 | 16.9%) and $75,000 to $99,999 for women (698 | 15.6%).
| Income | Male | Female |
| $2,499 or less | 228 (4.9%) | 79 (1.8%) |
| $2,500 to $4,999 | 139 (3.0%) | 177 (3.9%) |
| $5,000 to $7,499 | 44 (0.9%) | 174 (3.9%) |
| $7,500 to $9,999 | 31 (0.7%) | 111 (2.5%) |
| $10,000 to $12,499 | 22 (0.5%) | 81 (1.8%) |
| $12,500 to $14,999 | 108 (2.3%) | 88 (2.0%) |
| $15,000 to $17,499 | 88 (1.9%) | 154 (3.4%) |
| $17,500 to $19,999 | 91 (2.0%) | 88 (2.0%) |
| $20,000 to $22,499 | 100 (2.1%) | 35 (0.8%) |
| $22,500 to $24,999 | 234 (5.0%) | 82 (1.8%) |
| $25,000 to $29,999 | 168 (3.6%) | 96 (2.1%) |
| $30,000 to $34,999 | 264 (5.7%) | 254 (5.7%) |
| $35,000 to $39,999 | 275 (5.9%) | 311 (6.9%) |
| $40,000 to $44,999 | 154 (3.3%) | 368 (8.2%) |
| $45,000 to $49,999 | 176 (3.8%) | 385 (8.6%) |
| $50,000 to $54,999 | 261 (5.6%) | 139 (3.1%) |
| $55,000 to $64,999 | 452 (9.7%) | 561 (12.5%) |
| $65,000 to $74,999 | 348 (7.5%) | 259 (5.8%) |
| $75,000 to $99,999 | 680 (14.6%) | 698 (15.6%) |
| $100,000+ | 786 (16.9%) | 347 (7.7%) |
| Total | 4,649 (100.0%) | 4,487 (100.0%) |
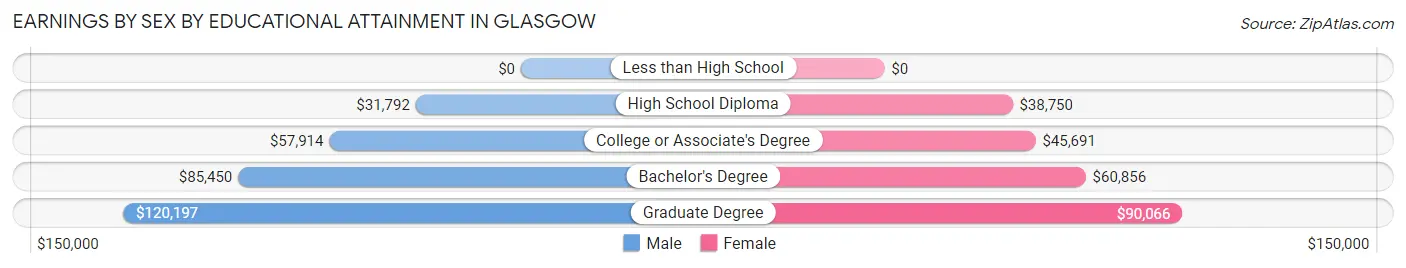
Earnings by Sex by Educational Attainment in Glasgow
Average earnings in Glasgow are $58,241 for men and $49,435 for women, a difference of 15.1%. Men with an educational attainment of graduate degree enjoy the highest average annual earnings of $120,197, while those with high school diploma education earn the least with $31,792. Women with an educational attainment of graduate degree earn the most with the average annual earnings of $90,066, while those with high school diploma education have the smallest earnings of $38,750.
| Educational Attainment | Male Income | Female Income |
| Less than High School | - | - |
| High School Diploma | $31,792 | $38,750 |
| College or Associate's Degree | $57,914 | $45,691 |
| Bachelor's Degree | $85,450 | $60,856 |
| Graduate Degree | $120,197 | $90,066 |
| Total | $58,241 | $49,435 |
Family Income in Glasgow
Family Income Brackets in Glasgow
According to the Glasgow family income data, there are 1,220 families falling into the $100,000 to $149,999 income range, which is the most common income bracket and makes up 32.8% of all families. Conversely, the $10,000 to $14,999 income bracket is the least frequent group with only 7 families (0.2%) belonging to this category.
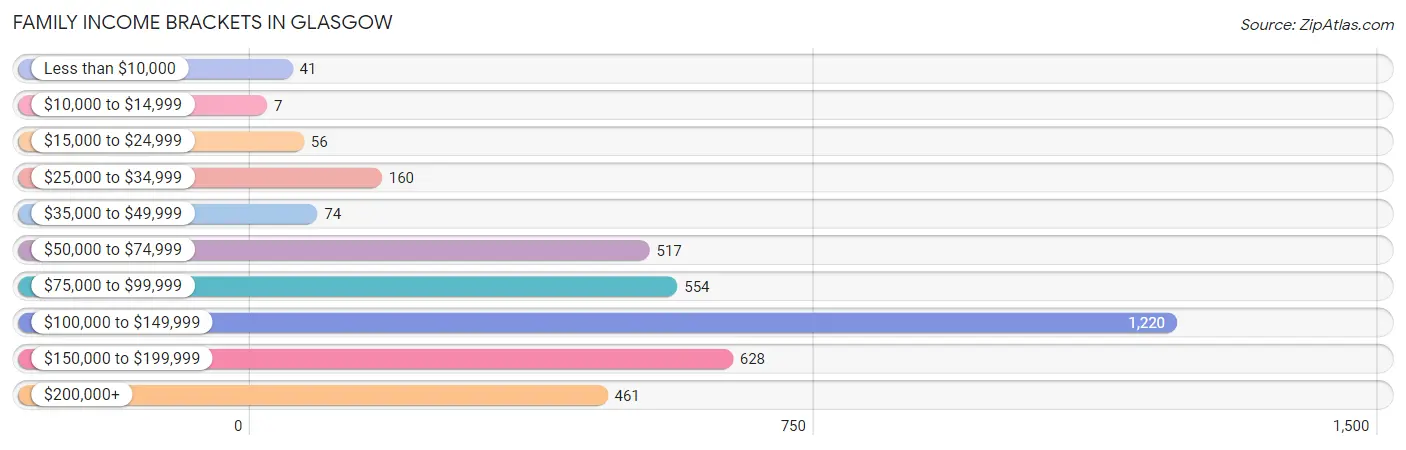
| Income Bracket | # Families | % Families |
| Less than $10,000 | 41 | 1.1% |
| $10,000 to $14,999 | 7 | 0.2% |
| $15,000 to $24,999 | 56 | 1.5% |
| $25,000 to $34,999 | 160 | 4.3% |
| $35,000 to $49,999 | 74 | 2.0% |
| $50,000 to $74,999 | 517 | 13.9% |
| $75,000 to $99,999 | 554 | 14.9% |
| $100,000 to $149,999 | 1,220 | 32.8% |
| $150,000 to $199,999 | 628 | 16.9% |
| $200,000+ | 461 | 12.4% |
Family Income by Famaliy Size in Glasgow
6-person families (50 | 1.3%) account for the highest median family income in Glasgow with $138,162 per family, while 2-person families (1,394 | 37.5%) have the highest median income of $52,383 per family member.
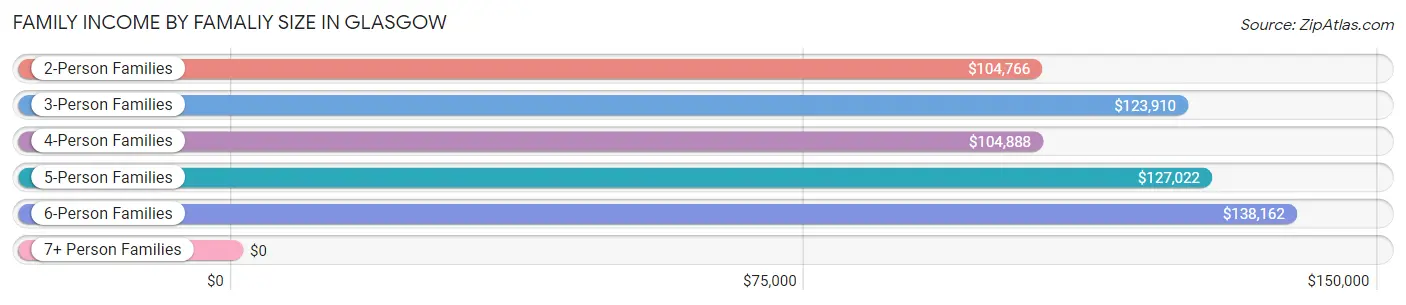
| Income Bracket | # Families | Median Income |
| 2-Person Families | 1,394 (37.5%) | $104,766 |
| 3-Person Families | 1,094 (29.4%) | $123,910 |
| 4-Person Families | 963 (25.9%) | $104,888 |
| 5-Person Families | 161 (4.3%) | $127,022 |
| 6-Person Families | 50 (1.3%) | $138,162 |
| 7+ Person Families | 56 (1.5%) | $0 |
| Total | 3,718 (100.0%) | $109,668 |
Family Income by Number of Earners in Glasgow
The median family income in Glasgow is $109,668, with families comprising 3+ earners (737) having the highest median family income of $138,934, while families with no earners (308) have the lowest median family income of $64,125, accounting for 19.8% and 8.3% of families, respectively.
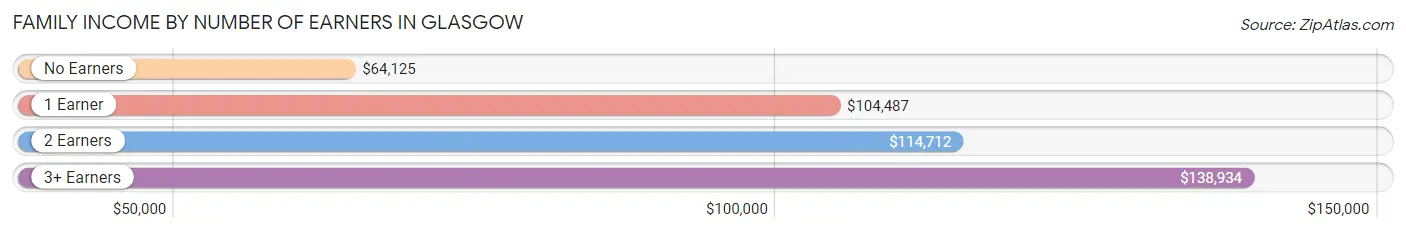
| Number of Earners | # Families | Median Income |
| No Earners | 308 (8.3%) | $64,125 |
| 1 Earner | 1,091 (29.3%) | $104,487 |
| 2 Earners | 1,582 (42.5%) | $114,712 |
| 3+ Earners | 737 (19.8%) | $138,934 |
| Total | 3,718 (100.0%) | $109,668 |
Household Income in Glasgow
Household Income Brackets in Glasgow
With 1,771 households falling in the category, the $100,000 to $149,999 income range is the most frequent in Glasgow, accounting for 32.6% of all households. In contrast, only 38 households (0.7%) fall into the $10,000 to $14,999 income bracket, making it the least populous group.
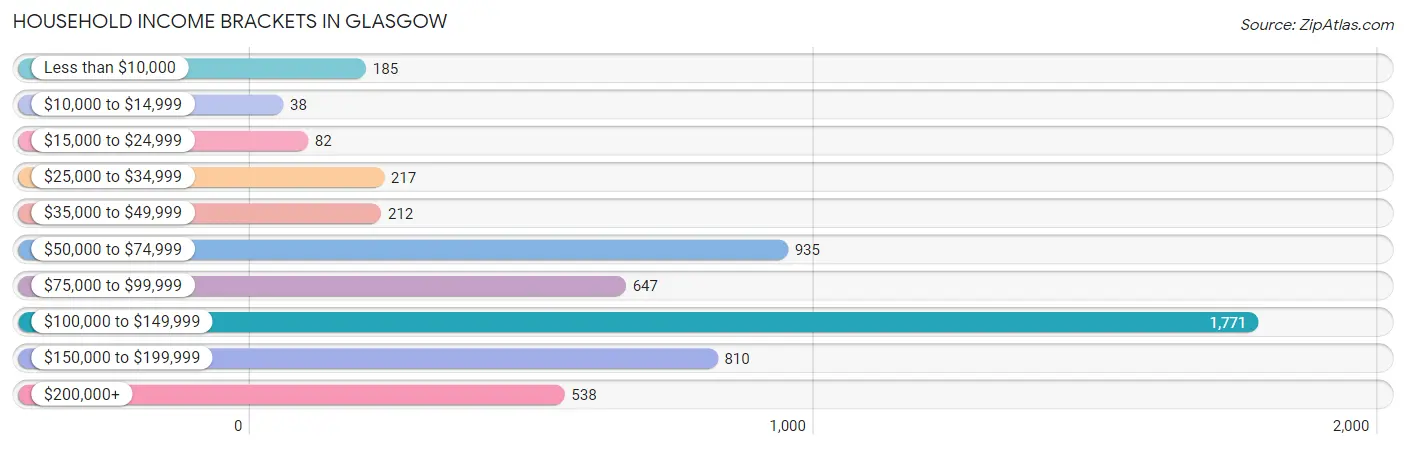
| Income Bracket | # Households | % Households |
| Less than $10,000 | 185 | 3.4% |
| $10,000 to $14,999 | 38 | 0.7% |
| $15,000 to $24,999 | 82 | 1.5% |
| $25,000 to $34,999 | 217 | 4.0% |
| $35,000 to $49,999 | 212 | 3.9% |
| $50,000 to $74,999 | 935 | 17.2% |
| $75,000 to $99,999 | 647 | 11.9% |
| $100,000 to $149,999 | 1,771 | 32.6% |
| $150,000 to $199,999 | 810 | 14.9% |
| $200,000+ | 538 | 9.9% |
Household Income by Householder Age in Glasgow
The median household income in Glasgow is $104,692, with the highest median household income of $107,404 found in the 45 to 64 years age bracket for the primary householder. A total of 2,484 households (45.7%) fall into this category. Meanwhile, the 15 to 24 years age bracket for the primary householder has the lowest median household income of $0, with 24 households (0.4%) in this group.
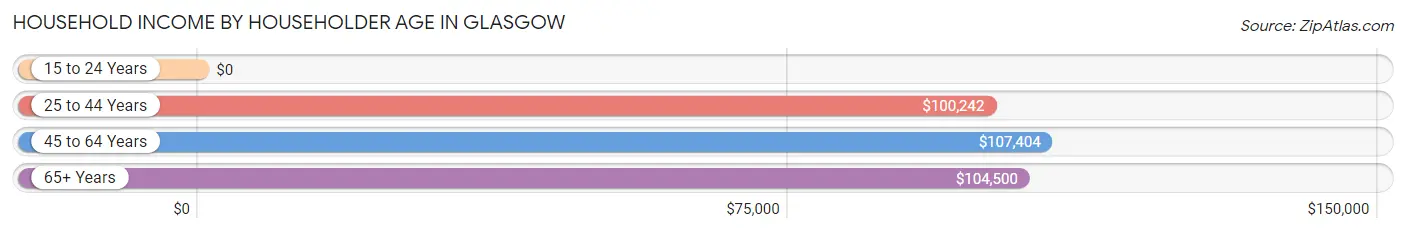
| Income Bracket | # Households | Median Income |
| 15 to 24 Years | 24 (0.4%) | $0 |
| 25 to 44 Years | 1,732 (31.9%) | $100,242 |
| 45 to 64 Years | 2,484 (45.7%) | $107,404 |
| 65+ Years | 1,194 (22.0%) | $104,500 |
| Total | 5,434 (100.0%) | $104,692 |
Poverty in Glasgow
Income Below Poverty by Sex and Age in Glasgow
With 4.4% poverty level for males and 8.4% for females among the residents of Glasgow, 25 to 34 year old males and 35 to 44 year old females are the most vulnerable to poverty, with 146 males (17.2%) and 281 females (22.0%) in their respective age groups living below the poverty level.
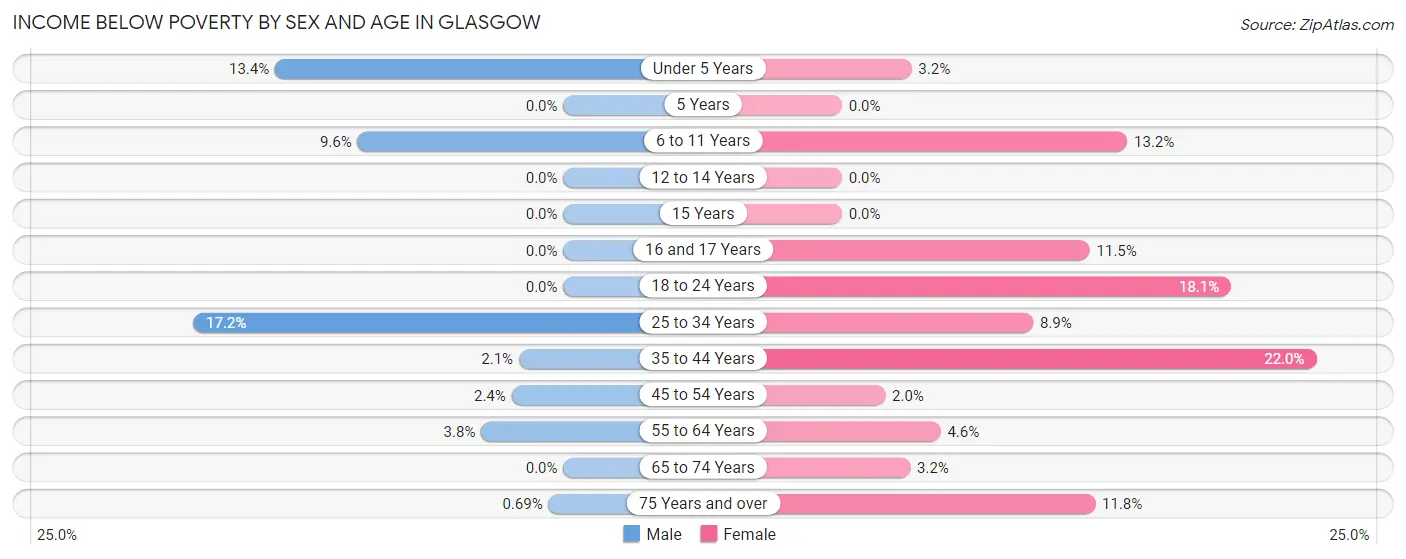
| Age Bracket | Male | Female |
| Under 5 Years | 36 (13.4%) | 27 (3.2%) |
| 5 Years | 0 (0.0%) | 0 (0.0%) |
| 6 to 11 Years | 30 (9.6%) | 38 (13.2%) |
| 12 to 14 Years | 0 (0.0%) | 0 (0.0%) |
| 15 Years | 0 (0.0%) | 0 (0.0%) |
| 16 and 17 Years | 0 (0.0%) | 26 (11.5%) |
| 18 to 24 Years | 0 (0.0%) | 78 (18.1%) |
| 25 to 34 Years | 146 (17.2%) | 94 (8.9%) |
| 35 to 44 Years | 24 (2.1%) | 281 (22.0%) |
| 45 to 54 Years | 31 (2.4%) | 28 (2.0%) |
| 55 to 64 Years | 48 (3.8%) | 53 (4.6%) |
| 65 to 74 Years | 0 (0.0%) | 22 (3.2%) |
| 75 Years and over | 2 (0.7%) | 43 (11.7%) |
| Total | 317 (4.4%) | 690 (8.4%) |
Income Above Poverty by Sex and Age in Glasgow
According to the poverty statistics in Glasgow, males aged 5 years and females aged 5 years are the age groups that are most secure financially, with 100.0% of males and 100.0% of females in these age groups living above the poverty line.
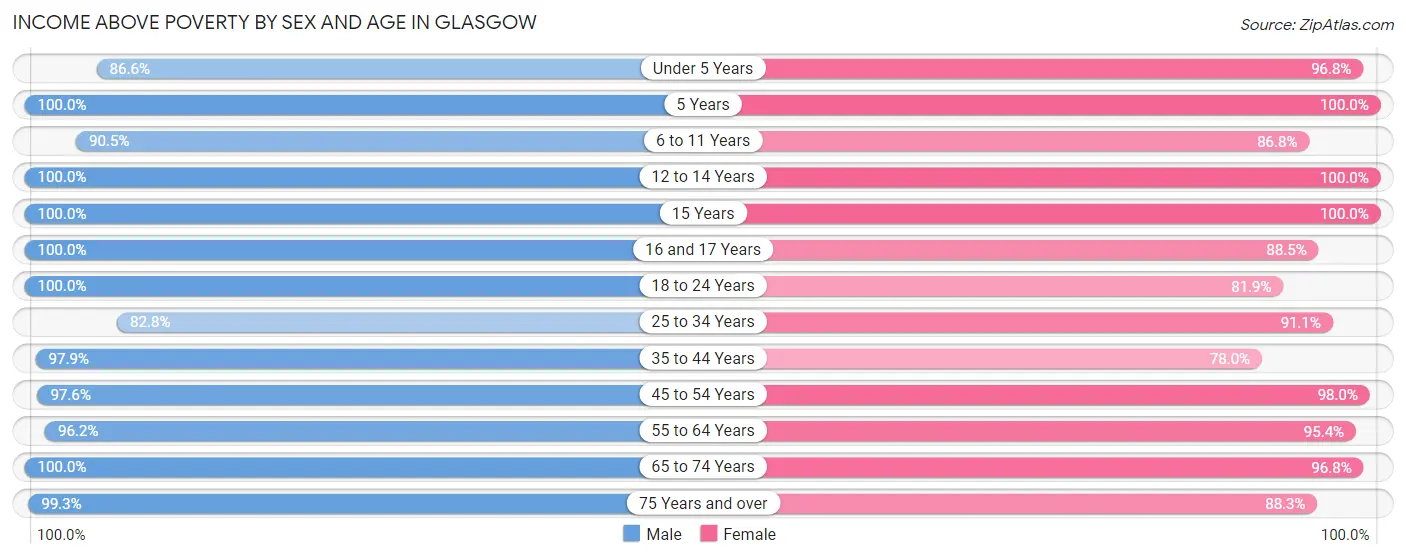
| Age Bracket | Male | Female |
| Under 5 Years | 233 (86.6%) | 808 (96.8%) |
| 5 Years | 95 (100.0%) | 103 (100.0%) |
| 6 to 11 Years | 284 (90.4%) | 249 (86.8%) |
| 12 to 14 Years | 267 (100.0%) | 327 (100.0%) |
| 15 Years | 78 (100.0%) | 36 (100.0%) |
| 16 and 17 Years | 156 (100.0%) | 200 (88.5%) |
| 18 to 24 Years | 514 (100.0%) | 354 (81.9%) |
| 25 to 34 Years | 704 (82.8%) | 966 (91.1%) |
| 35 to 44 Years | 1,142 (97.9%) | 995 (78.0%) |
| 45 to 54 Years | 1,258 (97.6%) | 1,363 (98.0%) |
| 55 to 64 Years | 1,213 (96.2%) | 1,104 (95.4%) |
| 65 to 74 Years | 628 (100.0%) | 671 (96.8%) |
| 75 Years and over | 287 (99.3%) | 323 (88.2%) |
| Total | 6,859 (95.6%) | 7,499 (91.6%) |
Income Below Poverty Among Married-Couple Families in Glasgow
The poverty statistics for married-couple families in Glasgow show that 2.8% or 85 of the total 3,052 families live below the poverty line. Families with 1 or 2 children have the highest poverty rate of 4.1%, comprising of 54 families. On the other hand, families with 3 or 4 children have the lowest poverty rate of 0.0%, which includes 0 families.
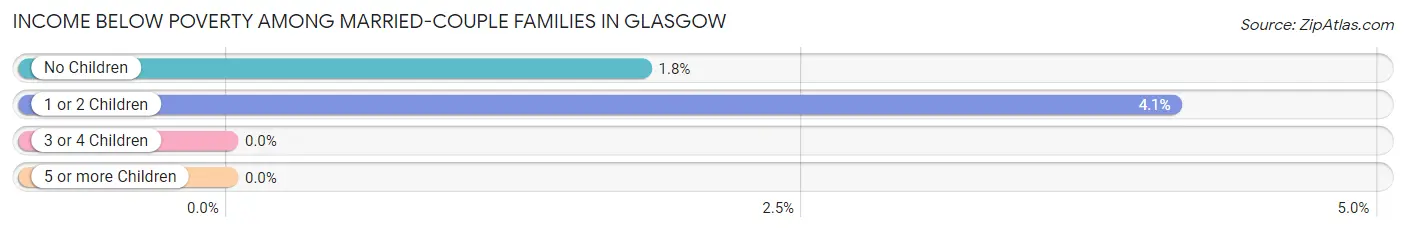
| Children | Above Poverty | Below Poverty |
| No Children | 1,691 (98.2%) | 31 (1.8%) |
| 1 or 2 Children | 1,261 (95.9%) | 54 (4.1%) |
| 3 or 4 Children | 15 (100.0%) | 0 (0.0%) |
| 5 or more Children | 0 (0.0%) | 0 (0.0%) |
| Total | 2,967 (97.2%) | 85 (2.8%) |
Income Below Poverty Among Single-Parent Households in Glasgow
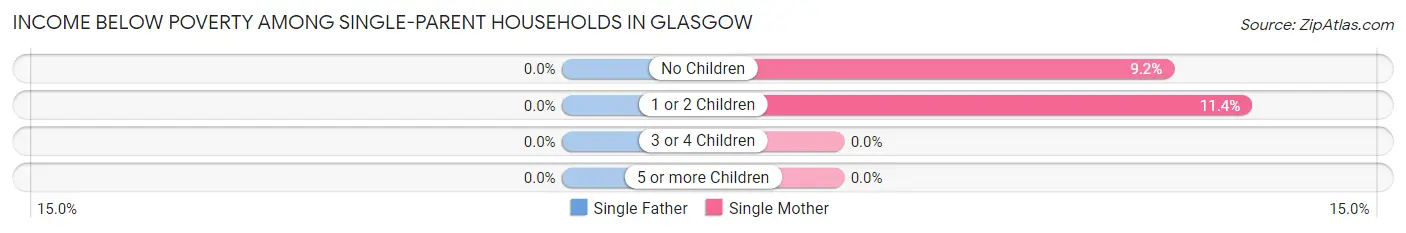
| Children | Single Father | Single Mother |
| No Children | 0 (0.0%) | 18 (9.2%) |
| 1 or 2 Children | 0 (0.0%) | 21 (11.4%) |
| 3 or 4 Children | 0 (0.0%) | 0 (0.0%) |
| 5 or more Children | 0 (0.0%) | 0 (0.0%) |
| Total | 0 (0.0%) | 39 (9.3%) |
Income Below Poverty Among Married-Couple vs Single-Parent Households in Glasgow
The poverty data for Glasgow shows that 85 of the married-couple family households (2.8%) and 39 of the single-parent households (5.9%) are living below the poverty level. Within the married-couple family households, those with 1 or 2 children have the highest poverty rate, with 54 households (4.1%) falling below the poverty line. Among the single-parent households, those with 1 or 2 children have the highest poverty rate, with 21 household (9.0%) living below poverty.
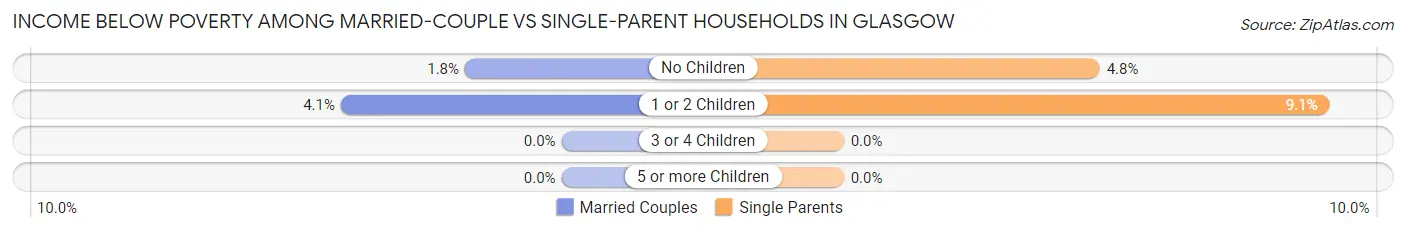
| Children | Married-Couple Families | Single-Parent Households |
| No Children | 31 (1.8%) | 18 (4.8%) |
| 1 or 2 Children | 54 (4.1%) | 21 (9.0%) |
| 3 or 4 Children | 0 (0.0%) | 0 (0.0%) |
| 5 or more Children | 0 (0.0%) | 0 (0.0%) |
| Total | 85 (2.8%) | 39 (5.9%) |
Race in Glasgow
The most populous races in Glasgow are White / Caucasian (9,282 | 60.3%), Black / African American (4,137 | 26.9%), and Asian (1,196 | 7.8%).
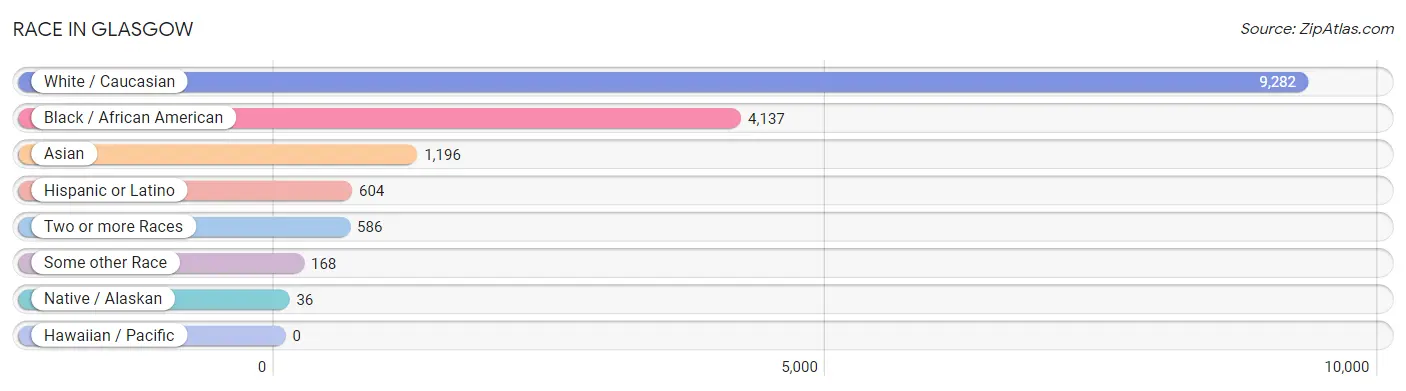
| Race | # Population | % Population |
| Asian | 1,196 | 7.8% |
| Black / African American | 4,137 | 26.9% |
| Hawaiian / Pacific | 0 | 0.0% |
| Hispanic or Latino | 604 | 3.9% |
| Native / Alaskan | 36 | 0.2% |
| White / Caucasian | 9,282 | 60.3% |
| Two or more Races | 586 | 3.8% |
| Some other Race | 168 | 1.1% |
| Total | 15,405 | 100.0% |
Ancestry in Glasgow
The most populous ancestries reported in Glasgow are German (2,901 | 18.8%), Irish (1,818 | 11.8%), English (1,488 | 9.7%), Italian (1,364 | 8.8%), and Polish (990 | 6.4%), together accounting for 55.6% of all Glasgow residents.
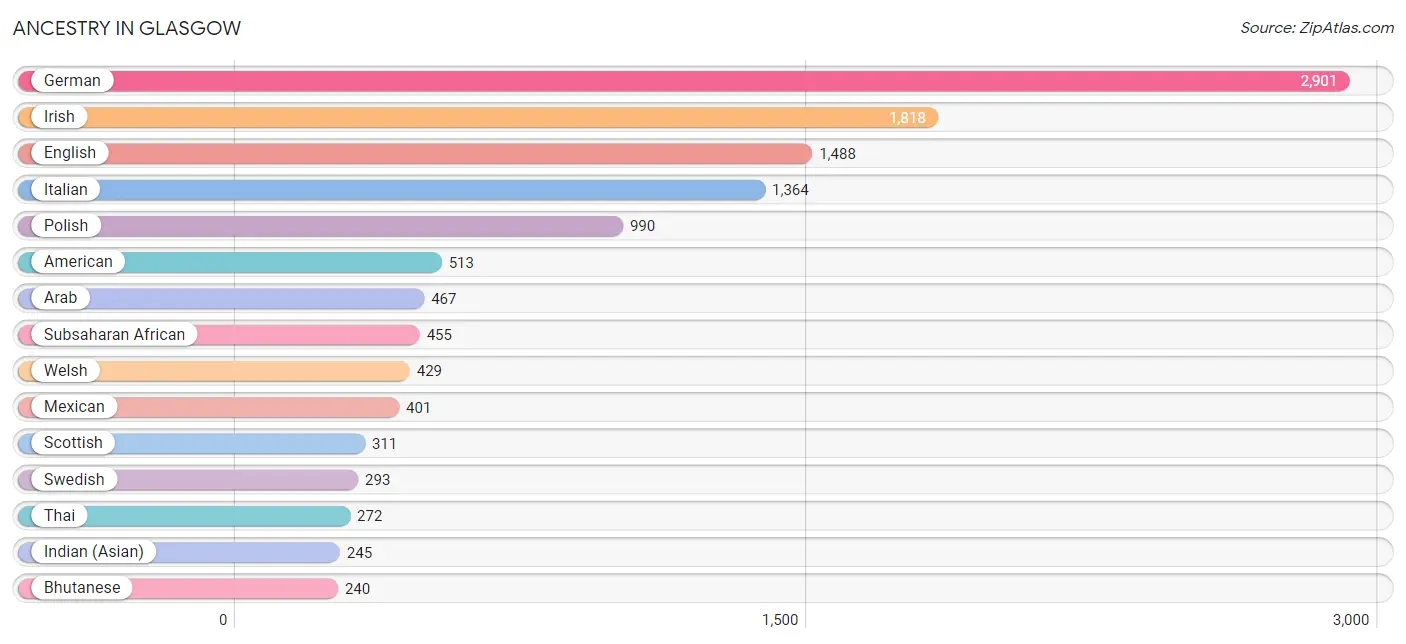
| Ancestry | # Population | % Population |
| African | 87 | 0.6% |
| American | 513 | 3.3% |
| Arab | 467 | 3.0% |
| Bhutanese | 240 | 1.6% |
| Blackfeet | 7 | 0.1% |
| British | 20 | 0.1% |
| Burmese | 37 | 0.2% |
| Central American | 40 | 0.3% |
| Cherokee | 9 | 0.1% |
| Costa Rican | 21 | 0.1% |
| Danish | 21 | 0.1% |
| Dutch | 81 | 0.5% |
| Eastern European | 11 | 0.1% |
| English | 1,488 | 9.7% |
| European | 17 | 0.1% |
| Finnish | 5 | 0.0% |
| French | 92 | 0.6% |
| German | 2,901 | 18.8% |
| Greek | 15 | 0.1% |
| Hungarian | 209 | 1.4% |
| Indian (Asian) | 245 | 1.6% |
| Irish | 1,818 | 11.8% |
| Italian | 1,364 | 8.8% |
| Jamaican | 142 | 0.9% |
| Jordanian | 35 | 0.2% |
| Kenyan | 151 | 1.0% |
| Korean | 22 | 0.1% |
| Lebanese | 14 | 0.1% |
| Lithuanian | 15 | 0.1% |
| Mexican | 401 | 2.6% |
| Mexican American Indian | 29 | 0.2% |
| Nigerian | 217 | 1.4% |
| Northern European | 69 | 0.4% |
| Norwegian | 24 | 0.2% |
| Pennsylvania German | 22 | 0.1% |
| Polish | 990 | 6.4% |
| Puerto Rican | 163 | 1.1% |
| Russian | 181 | 1.2% |
| Salvadoran | 19 | 0.1% |
| Scandinavian | 9 | 0.1% |
| Scotch-Irish | 70 | 0.4% |
| Scottish | 311 | 2.0% |
| Slovak | 22 | 0.1% |
| Slovene | 103 | 0.7% |
| Sri Lankan | 201 | 1.3% |
| Subsaharan African | 455 | 2.9% |
| Swedish | 293 | 1.9% |
| Swiss | 39 | 0.3% |
| Syrian | 29 | 0.2% |
| Thai | 272 | 1.8% |
| Trinidadian and Tobagonian | 21 | 0.1% |
| Ukrainian | 149 | 1.0% |
| Welsh | 429 | 2.8% | View All 53 Rows |
Immigrants in Glasgow
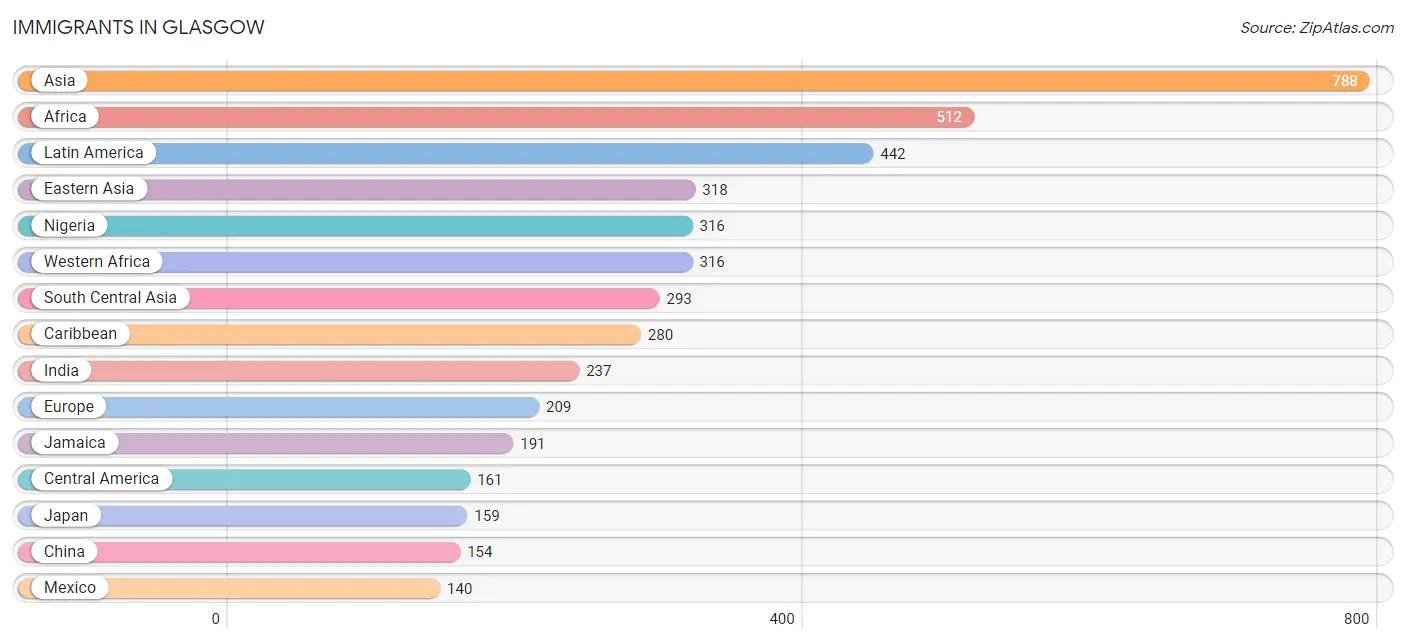
The most numerous immigrant groups reported in Glasgow came from Asia (788 | 5.1%), Africa (512 | 3.3%), Latin America (442 | 2.9%), Eastern Asia (318 | 2.1%), and Nigeria (316 | 2.1%), together accounting for 15.4% of all Glasgow residents.
| Immigration Origin | # Population | % Population |
| Africa | 512 | 3.3% |
| Asia | 788 | 5.1% |
| Brazil | 1 | 0.0% |
| Canada | 25 | 0.2% |
| Caribbean | 280 | 1.8% |
| Central America | 161 | 1.1% |
| China | 154 | 1.0% |
| Costa Rica | 21 | 0.1% |
| Eastern Africa | 79 | 0.5% |
| Eastern Asia | 318 | 2.1% |
| Eastern Europe | 111 | 0.7% |
| Ethiopia | 27 | 0.2% |
| Europe | 209 | 1.4% |
| Germany | 31 | 0.2% |
| Grenada | 89 | 0.6% |
| Hong Kong | 48 | 0.3% |
| India | 237 | 1.5% |
| Jamaica | 191 | 1.2% |
| Japan | 159 | 1.0% |
| Jordan | 21 | 0.1% |
| Kenya | 52 | 0.3% |
| Korea | 5 | 0.0% |
| Kuwait | 18 | 0.1% |
| Latin America | 442 | 2.9% |
| Mexico | 140 | 0.9% |
| Netherlands | 12 | 0.1% |
| Nigeria | 316 | 2.1% |
| Northern Europe | 55 | 0.4% |
| Pakistan | 56 | 0.4% |
| Philippines | 17 | 0.1% |
| Poland | 65 | 0.4% |
| Russia | 46 | 0.3% |
| South America | 1 | 0.0% |
| South Central Asia | 293 | 1.9% |
| South Eastern Asia | 138 | 0.9% |
| Taiwan | 34 | 0.2% |
| Vietnam | 121 | 0.8% |
| Western Africa | 316 | 2.1% |
| Western Asia | 39 | 0.3% |
| Western Europe | 43 | 0.3% | View All 40 Rows |
Sex and Age in Glasgow
Sex and Age in Glasgow
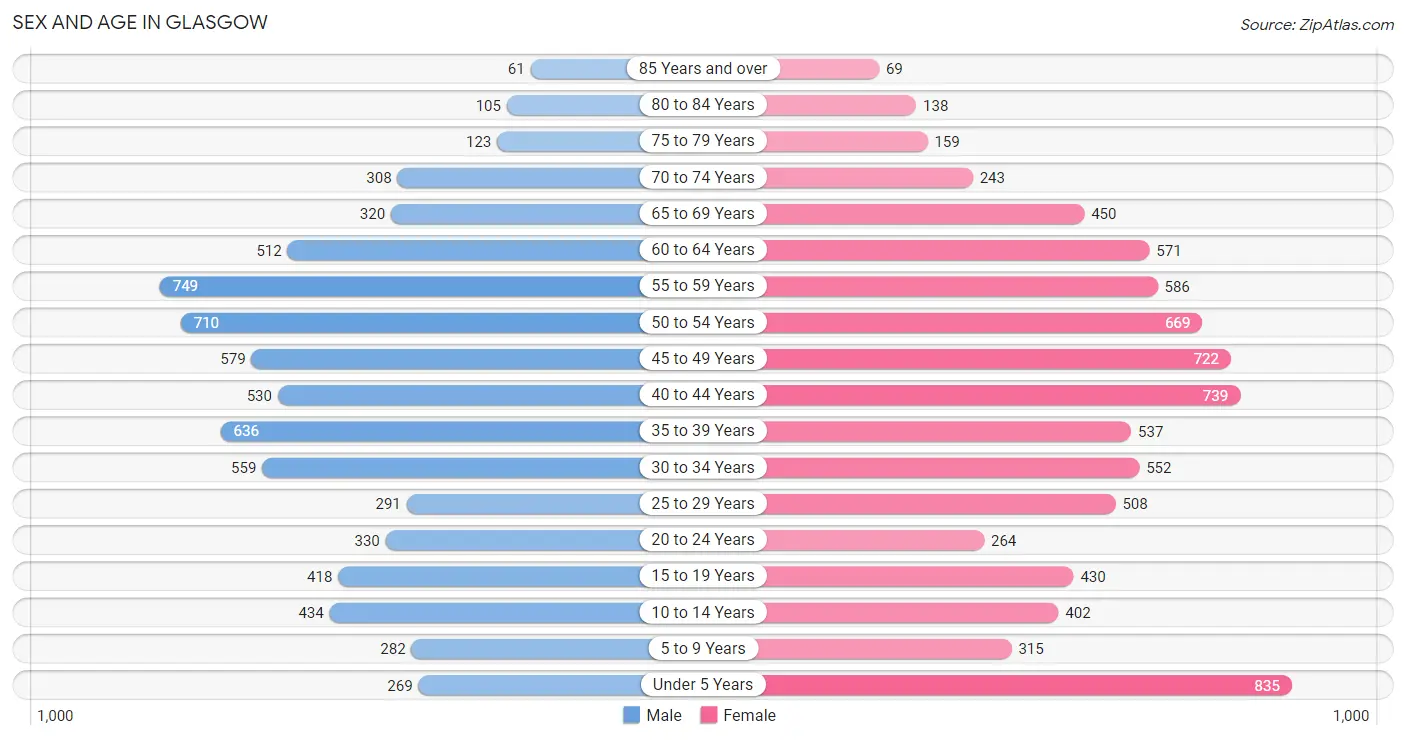
The most populous age groups in Glasgow are 55 to 59 Years (749 | 10.4%) for men and Under 5 Years (835 | 10.2%) for women.
| Age Bracket | Male | Female |
| Under 5 Years | 269 (3.7%) | 835 (10.2%) |
| 5 to 9 Years | 282 (3.9%) | 315 (3.8%) |
| 10 to 14 Years | 434 (6.0%) | 402 (4.9%) |
| 15 to 19 Years | 418 (5.8%) | 430 (5.2%) |
| 20 to 24 Years | 330 (4.6%) | 264 (3.2%) |
| 25 to 29 Years | 291 (4.0%) | 508 (6.2%) |
| 30 to 34 Years | 559 (7.7%) | 552 (6.7%) |
| 35 to 39 Years | 636 (8.8%) | 537 (6.6%) |
| 40 to 44 Years | 530 (7.3%) | 739 (9.0%) |
| 45 to 49 Years | 579 (8.0%) | 722 (8.8%) |
| 50 to 54 Years | 710 (9.8%) | 669 (8.2%) |
| 55 to 59 Years | 749 (10.4%) | 586 (7.2%) |
| 60 to 64 Years | 512 (7.1%) | 571 (7.0%) |
| 65 to 69 Years | 320 (4.4%) | 450 (5.5%) |
| 70 to 74 Years | 308 (4.3%) | 243 (3.0%) |
| 75 to 79 Years | 123 (1.7%) | 159 (1.9%) |
| 80 to 84 Years | 105 (1.5%) | 138 (1.7%) |
| 85 Years and over | 61 (0.9%) | 69 (0.8%) |
| Total | 7,216 (100.0%) | 8,189 (100.0%) |
Families and Households in Glasgow
Median Family Size in Glasgow
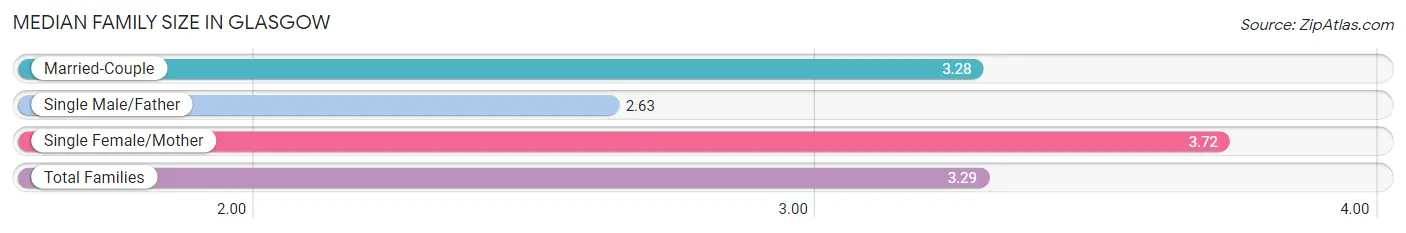
The median family size in Glasgow is 3.29 persons per family, with single female/mother families (420 | 11.3%) accounting for the largest median family size of 3.72 persons per family. On the other hand, single male/father families (246 | 6.6%) represent the smallest median family size with 2.63 persons per family.
| Family Type | # Families | Family Size |
| Married-Couple | 3,052 (82.1%) | 3.28 |
| Single Male/Father | 246 (6.6%) | 2.63 |
| Single Female/Mother | 420 (11.3%) | 3.72 |
| Total Families | 3,718 (100.0%) | 3.29 |
Median Household Size in Glasgow
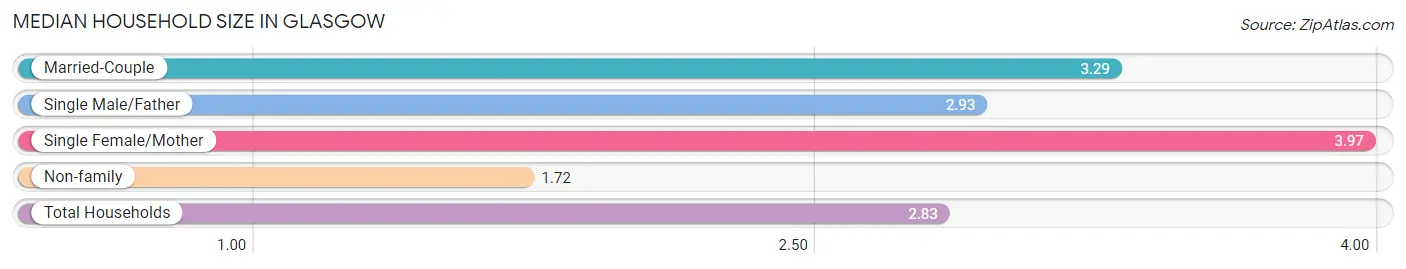
The median household size in Glasgow is 2.83 persons per household, with single female/mother households (420 | 7.7%) accounting for the largest median household size of 3.97 persons per household. non-family households (1,716 | 31.6%) represent the smallest median household size with 1.72 persons per household.
| Household Type | # Households | Household Size |
| Married-Couple | 3,052 (56.2%) | 3.29 |
| Single Male/Father | 246 (4.5%) | 2.93 |
| Single Female/Mother | 420 (7.7%) | 3.97 |
| Non-family | 1,716 (31.6%) | 1.72 |
| Total Households | 5,434 (100.0%) | 2.83 |
Household Size by Marriage Status in Glasgow
Out of a total of 5,434 households in Glasgow, 3,718 (68.4%) are family households, while 1,716 (31.6%) are nonfamily households. The most numerous type of family households are 2-person households, comprising 1,295, and the most common type of nonfamily households are 1-person households, comprising 1,023.
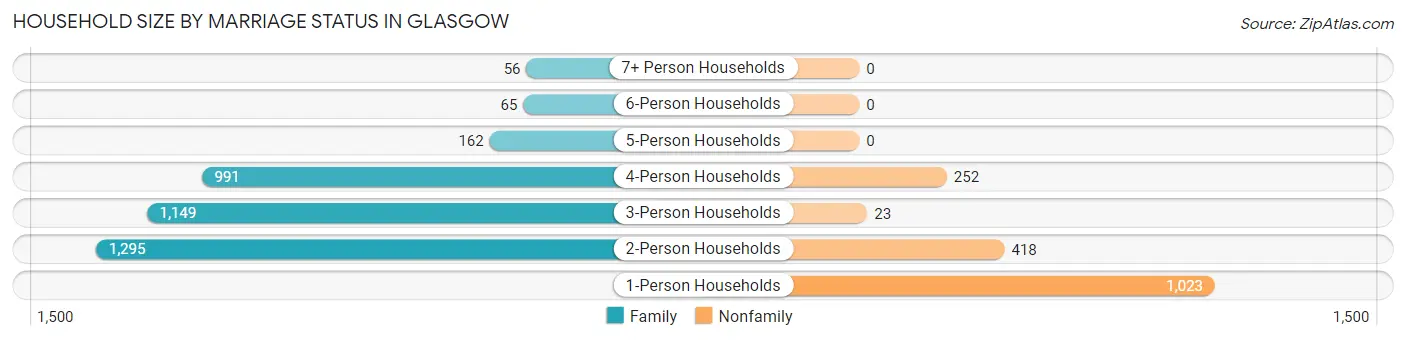
| Household Size | Family Households | Nonfamily Households |
| 1-Person Households | - | 1,023 (18.8%) |
| 2-Person Households | 1,295 (23.8%) | 418 (7.7%) |
| 3-Person Households | 1,149 (21.1%) | 23 (0.4%) |
| 4-Person Households | 991 (18.2%) | 252 (4.6%) |
| 5-Person Households | 162 (3.0%) | 0 (0.0%) |
| 6-Person Households | 65 (1.2%) | 0 (0.0%) |
| 7+ Person Households | 56 (1.0%) | 0 (0.0%) |
| Total | 3,718 (68.4%) | 1,716 (31.6%) |
Female Fertility in Glasgow
Fertility by Age in Glasgow
Average fertility rate in Glasgow is 61.0 births per 1,000 women. Women in the age bracket of 20 to 34 years have the highest fertility rate with 88.0 births per 1,000 women. Women in the age bracket of 35 to 50 years acount for 51.3% of all women with births.
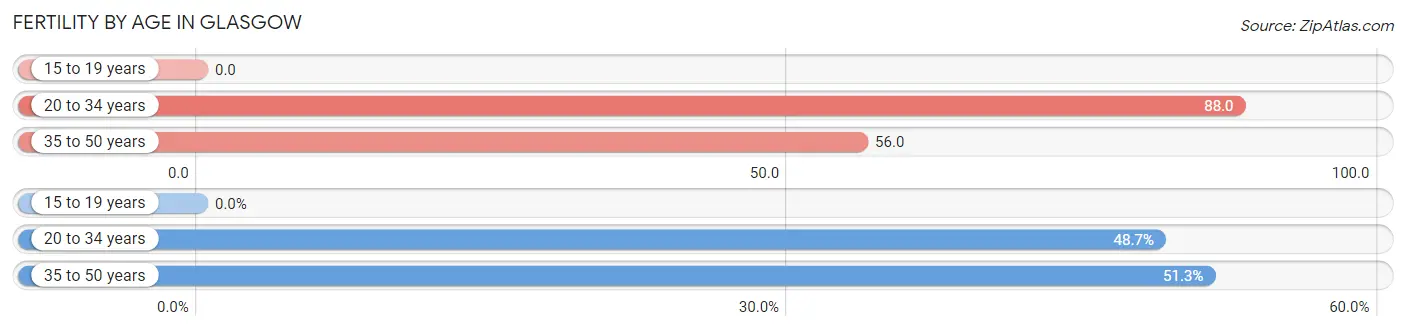
| Age Bracket | Women with Births | Births / 1,000 Women |
| 15 to 19 years | 0 (0.0%) | 0.0 |
| 20 to 34 years | 116 (48.7%) | 88.0 |
| 35 to 50 years | 122 (51.3%) | 56.0 |
| Total | 238 (100.0%) | 61.0 |
Fertility by Age by Marriage Status in Glasgow
82.8% of women with births (238) in Glasgow are married. The highest percentage of unmarried women with births falls into 35 to 50 years age bracket with 27.1% of them unmarried at the time of birth, while the lowest percentage of unmarried women with births belong to 20 to 34 years age bracket with 6.9% of them unmarried.
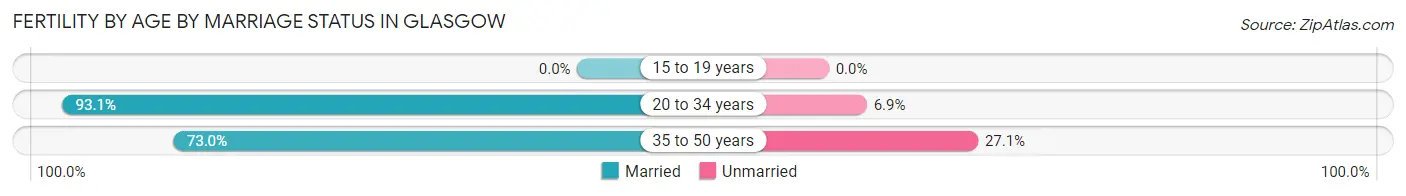
| Age Bracket | Married | Unmarried |
| 15 to 19 years | 0 (0.0%) | 0 (0.0%) |
| 20 to 34 years | 108 (93.1%) | 8 (6.9%) |
| 35 to 50 years | 89 (73.0%) | 33 (27.1%) |
| Total | 197 (82.8%) | 41 (17.2%) |
Fertility by Education in Glasgow
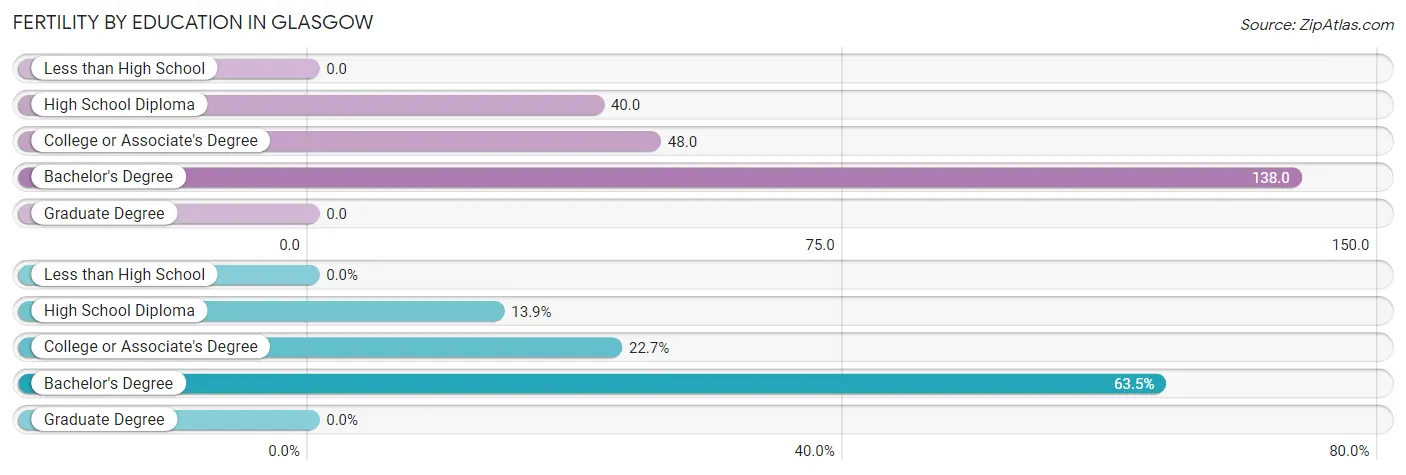
| Educational Attainment | Women with Births | Births / 1,000 Women |
| Less than High School | 0 (0.0%) | 0.0 |
| High School Diploma | 33 (13.9%) | 40.0 |
| College or Associate's Degree | 54 (22.7%) | 48.0 |
| Bachelor's Degree | 151 (63.4%) | 138.0 |
| Graduate Degree | 0 (0.0%) | 0.0 |
| Total | 238 (100.0%) | 61.0 |
Fertility by Education by Marriage Status in Glasgow
17.2% of women with births in Glasgow are unmarried. Women with the educational attainment of college or associate's degree are most likely to be married with 100.0% of them married at childbirth, while women with the educational attainment of high school diploma are least likely to be married with 100.0% of them unmarried at childbirth.
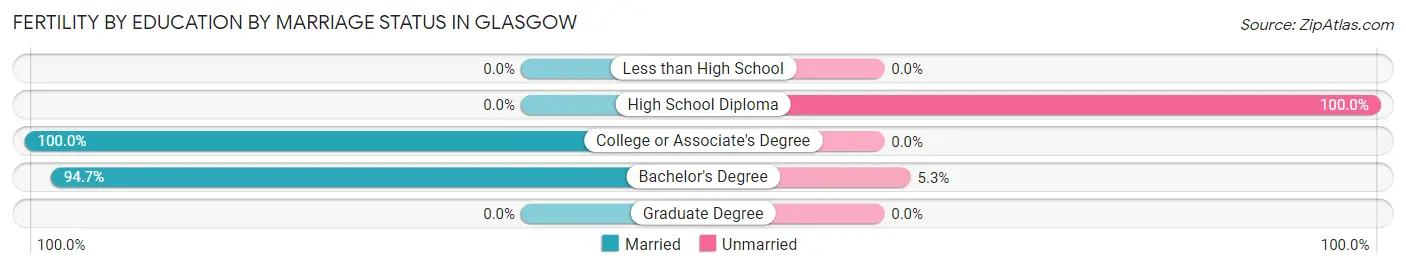
| Educational Attainment | Married | Unmarried |
| Less than High School | 0 (0.0%) | 0 (0.0%) |
| High School Diploma | 0 (0.0%) | 33 (100.0%) |
| College or Associate's Degree | 54 (100.0%) | 0 (0.0%) |
| Bachelor's Degree | 143 (94.7%) | 8 (5.3%) |
| Graduate Degree | 0 (0.0%) | 0 (0.0%) |
| Total | 197 (82.8%) | 41 (17.2%) |
Employment Characteristics in Glasgow
Employment by Class of Employer in Glasgow
Among the 8,408 employed individuals in Glasgow, private company employees (5,980 | 71.1%), not-for-profit organizations (670 | 8.0%), and federal government employees (532 | 6.3%) make up the most common classes of employment.
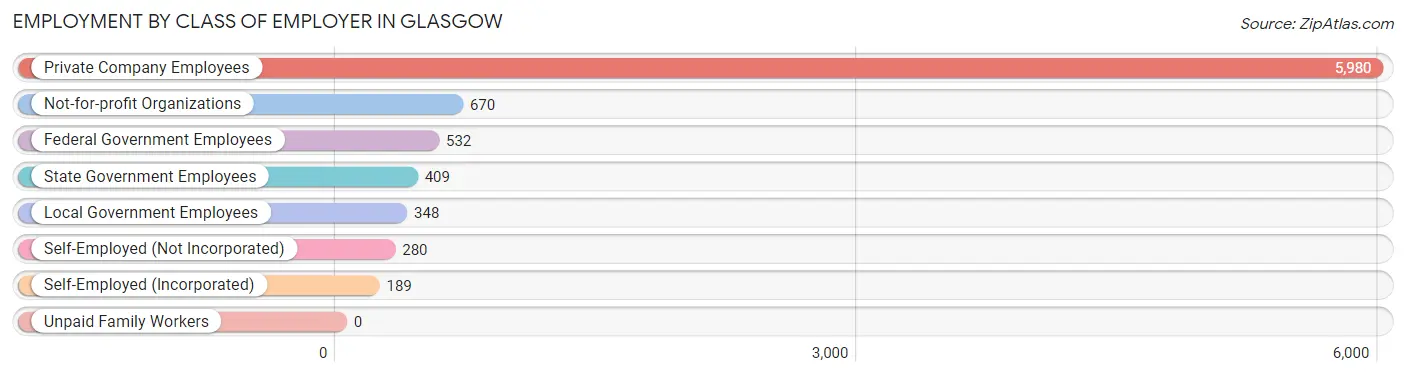
| Employer Class | # Employees | % Employees |
| Private Company Employees | 5,980 | 71.1% |
| Self-Employed (Incorporated) | 189 | 2.2% |
| Self-Employed (Not Incorporated) | 280 | 3.3% |
| Not-for-profit Organizations | 670 | 8.0% |
| Local Government Employees | 348 | 4.1% |
| State Government Employees | 409 | 4.9% |
| Federal Government Employees | 532 | 6.3% |
| Unpaid Family Workers | 0 | 0.0% |
| Total | 8,408 | 100.0% |
Employment Status by Age in Glasgow
According to the labor force statistics for Glasgow, out of the total population over 16 years of age (12,754), 71.9% or 9,170 individuals are in the labor force, with 6.4% or 587 of them unemployed. The age group with the highest labor force participation rate is 25 to 29 years, with 99.2% or 793 individuals in the labor force. Within the labor force, the 55 to 59 years age range has the highest percentage of unemployed individuals, with 16.3% or 170 of them being unemployed.
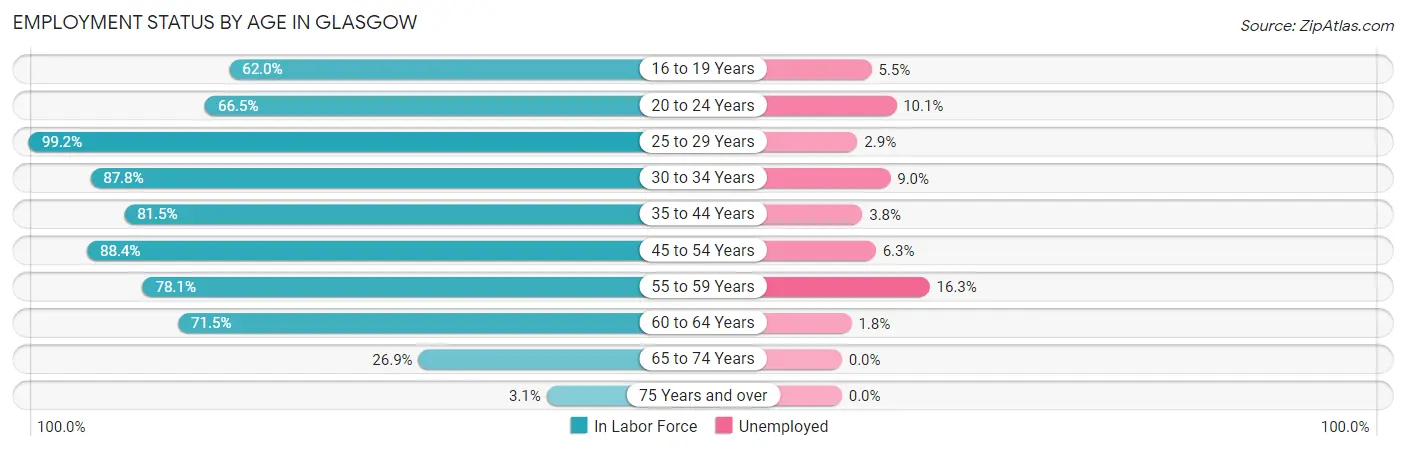
| Age Bracket | In Labor Force | Unemployed |
| 16 to 19 Years | 455 (62.0%) | 25 (5.5%) |
| 20 to 24 Years | 395 (66.5%) | 40 (10.1%) |
| 25 to 29 Years | 793 (99.2%) | 23 (2.9%) |
| 30 to 34 Years | 975 (87.8%) | 88 (9.0%) |
| 35 to 44 Years | 1,990 (81.5%) | 76 (3.8%) |
| 45 to 54 Years | 2,369 (88.4%) | 149 (6.3%) |
| 55 to 59 Years | 1,043 (78.1%) | 170 (16.3%) |
| 60 to 64 Years | 774 (71.5%) | 14 (1.8%) |
| 65 to 74 Years | 355 (26.9%) | 0 (0.0%) |
| 75 Years and over | 20 (3.1%) | 0 (0.0%) |
| Total | 9,170 (71.9%) | 587 (6.4%) |
Employment Status by Educational Attainment in Glasgow
According to labor force statistics for Glasgow, 84.1% of individuals (7,947) out of the total population between 25 and 64 years of age (9,450) are in the labor force, with 6.6% or 525 of them being unemployed. The group with the highest labor force participation rate are those with the educational attainment of bachelor's degree or higher, with 97.0% or 3,221 individuals in the labor force. Within the labor force, individuals with high school diploma education have the highest percentage of unemployment, with 15.6% or 292 of them being unemployed.
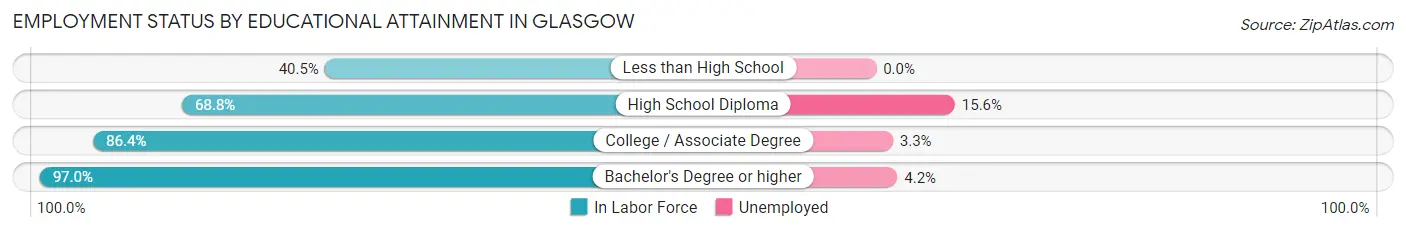
| Educational Attainment | In Labor Force | Unemployed |
| Less than High School | 83 (40.5%) | 0 (0.0%) |
| High School Diploma | 1,873 (68.8%) | 425 (15.6%) |
| College / Associate Degree | 2,767 (86.4%) | 106 (3.3%) |
| Bachelor's Degree or higher | 3,221 (97.0%) | 139 (4.2%) |
| Total | 7,947 (84.1%) | 624 (6.6%) |
Employment Occupations by Sex in Glasgow
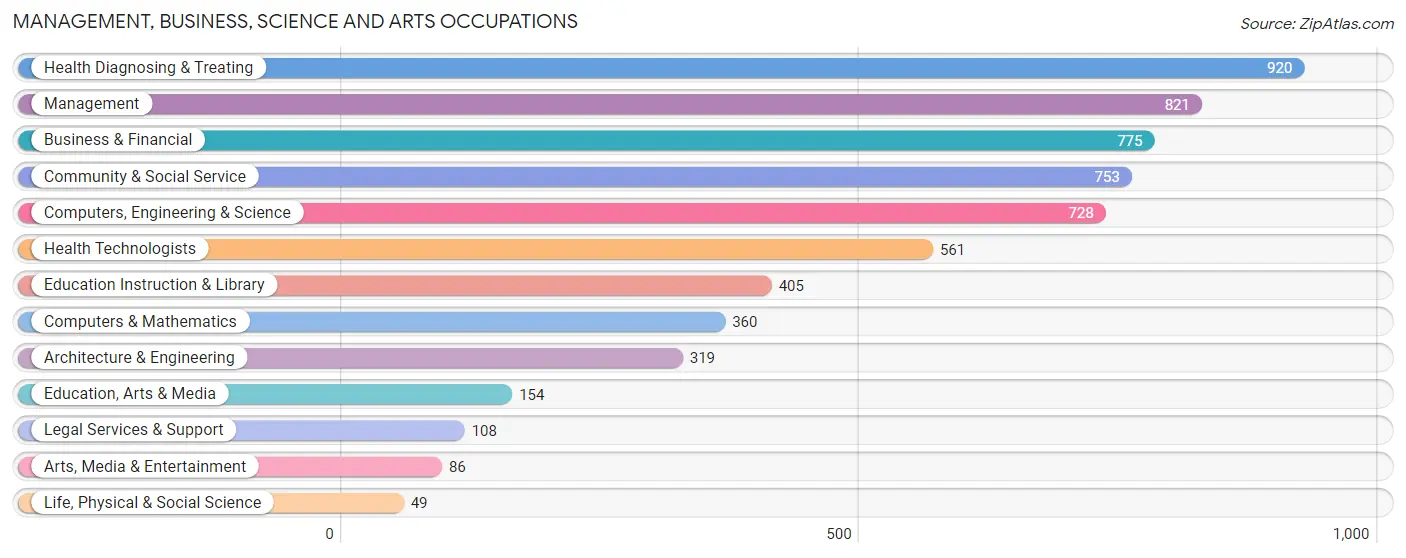
Management, Business, Science and Arts Occupations
The most common Management, Business, Science and Arts occupations in Glasgow are Health Diagnosing & Treating (920 | 10.9%), Management (821 | 9.7%), Business & Financial (775 | 9.2%), Community & Social Service (753 | 8.9%), and Computers, Engineering & Science (728 | 8.6%).
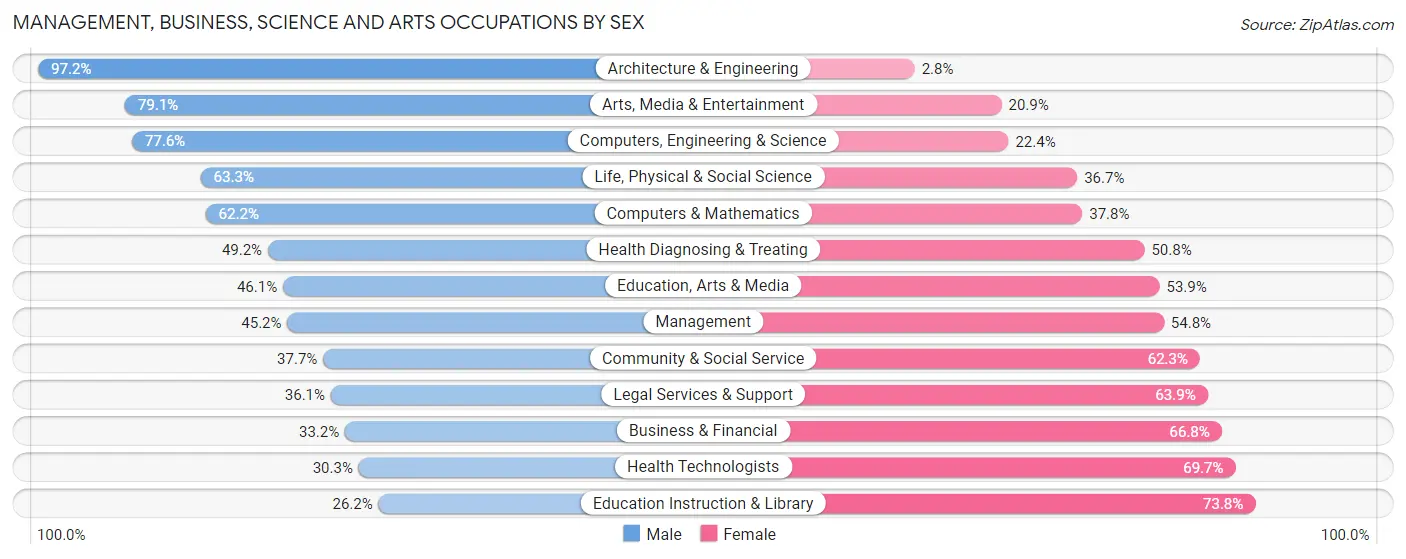
Management, Business, Science and Arts Occupations by Sex
Within the Management, Business, Science and Arts occupations in Glasgow, the most male-oriented occupations are Architecture & Engineering (97.2%), Arts, Media & Entertainment (79.1%), and Computers, Engineering & Science (77.6%), while the most female-oriented occupations are Education Instruction & Library (73.8%), Health Technologists (69.7%), and Business & Financial (66.8%).
| Occupation | Male | Female |
| Management | 371 (45.2%) | 450 (54.8%) |
| Business & Financial | 257 (33.2%) | 518 (66.8%) |
| Computers, Engineering & Science | 565 (77.6%) | 163 (22.4%) |
| Computers & Mathematics | 224 (62.2%) | 136 (37.8%) |
| Architecture & Engineering | 310 (97.2%) | 9 (2.8%) |
| Life, Physical & Social Science | 31 (63.3%) | 18 (36.7%) |
| Community & Social Service | 284 (37.7%) | 469 (62.3%) |
| Education, Arts & Media | 71 (46.1%) | 83 (53.9%) |
| Legal Services & Support | 39 (36.1%) | 69 (63.9%) |
| Education Instruction & Library | 106 (26.2%) | 299 (73.8%) |
| Arts, Media & Entertainment | 68 (79.1%) | 18 (20.9%) |
| Health Diagnosing & Treating | 453 (49.2%) | 467 (50.8%) |
| Health Technologists | 170 (30.3%) | 391 (69.7%) |
| Total (Category) | 1,930 (48.3%) | 2,067 (51.7%) |
| Total (Overall) | 4,324 (51.2%) | 4,128 (48.8%) |
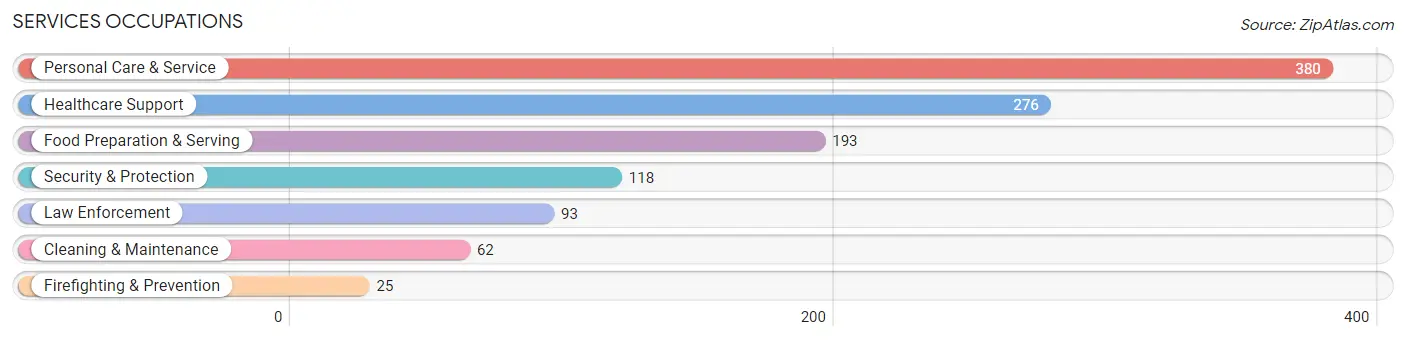
Services Occupations
The most common Services occupations in Glasgow are Personal Care & Service (380 | 4.5%), Healthcare Support (276 | 3.3%), Food Preparation & Serving (193 | 2.3%), Security & Protection (118 | 1.4%), and Law Enforcement (93 | 1.1%).
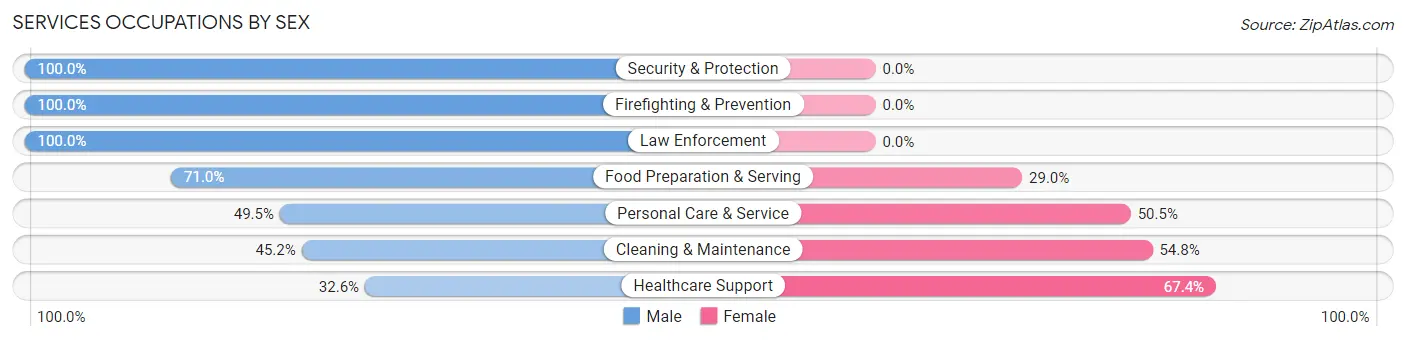
Services Occupations by Sex
Within the Services occupations in Glasgow, the most male-oriented occupations are Security & Protection (100.0%), Firefighting & Prevention (100.0%), and Law Enforcement (100.0%), while the most female-oriented occupations are Healthcare Support (67.4%), Cleaning & Maintenance (54.8%), and Personal Care & Service (50.5%).
| Occupation | Male | Female |
| Healthcare Support | 90 (32.6%) | 186 (67.4%) |
| Security & Protection | 118 (100.0%) | 0 (0.0%) |
| Firefighting & Prevention | 25 (100.0%) | 0 (0.0%) |
| Law Enforcement | 93 (100.0%) | 0 (0.0%) |
| Food Preparation & Serving | 137 (71.0%) | 56 (29.0%) |
| Cleaning & Maintenance | 28 (45.2%) | 34 (54.8%) |
| Personal Care & Service | 188 (49.5%) | 192 (50.5%) |
| Total (Category) | 561 (54.5%) | 468 (45.5%) |
| Total (Overall) | 4,324 (51.2%) | 4,128 (48.8%) |
Sales and Office Occupations
The most common Sales and Office occupations in Glasgow are Office & Administration (1,344 | 15.9%), and Sales & Related (518 | 6.1%).
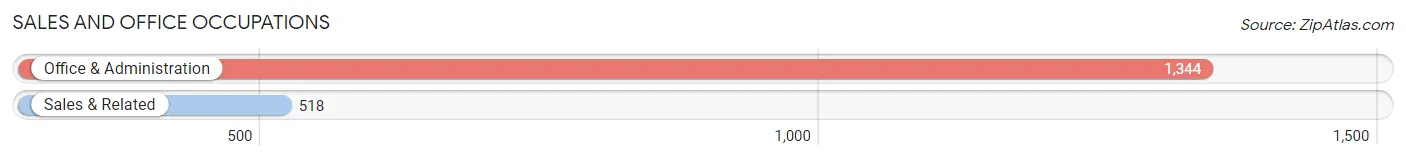
Sales and Office Occupations by Sex
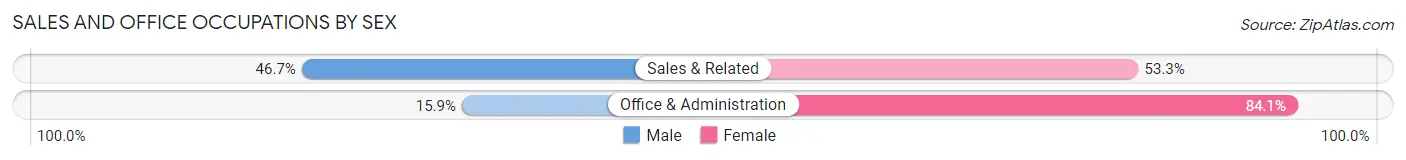
| Occupation | Male | Female |
| Sales & Related | 242 (46.7%) | 276 (53.3%) |
| Office & Administration | 214 (15.9%) | 1,130 (84.1%) |
| Total (Category) | 456 (24.5%) | 1,406 (75.5%) |
| Total (Overall) | 4,324 (51.2%) | 4,128 (48.8%) |
Natural Resources, Construction and Maintenance Occupations
The most common Natural Resources, Construction and Maintenance occupations in Glasgow are Installation, Maintenance & Repair (419 | 5.0%), Construction & Extraction (257 | 3.0%), and Farming, Fishing & Forestry (26 | 0.3%).
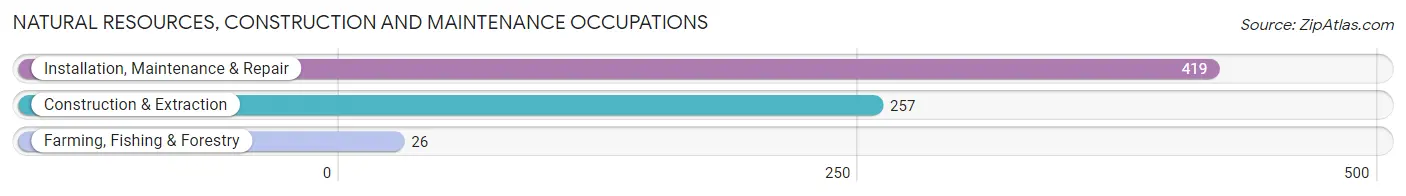
Natural Resources, Construction and Maintenance Occupations by Sex
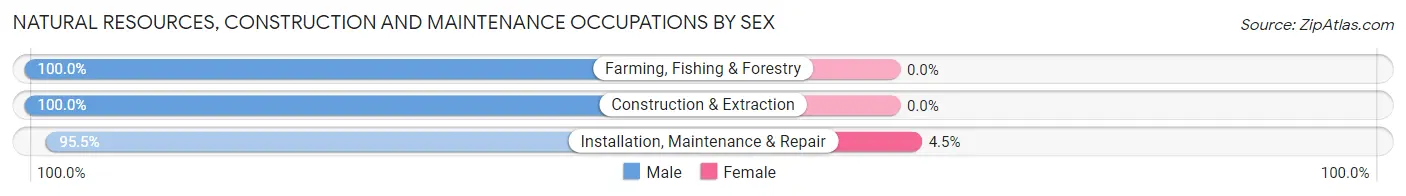
| Occupation | Male | Female |
| Farming, Fishing & Forestry | 26 (100.0%) | 0 (0.0%) |
| Construction & Extraction | 257 (100.0%) | 0 (0.0%) |
| Installation, Maintenance & Repair | 400 (95.5%) | 19 (4.5%) |
| Total (Category) | 683 (97.3%) | 19 (2.7%) |
| Total (Overall) | 4,324 (51.2%) | 4,128 (48.8%) |
Production, Transportation and Moving Occupations
The most common Production, Transportation and Moving occupations in Glasgow are Production (379 | 4.5%), Transportation (275 | 3.3%), and Material Moving (208 | 2.5%).
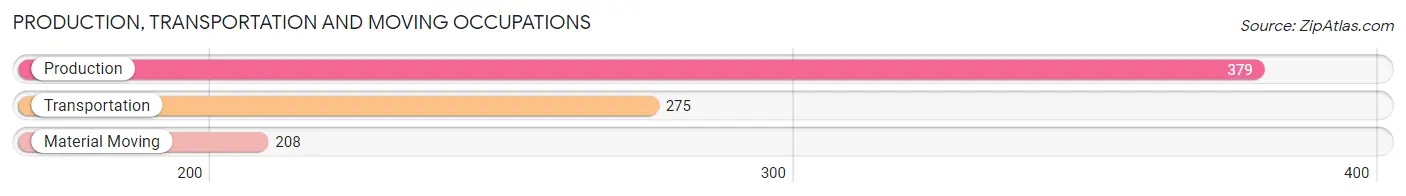
Production, Transportation and Moving Occupations by Sex
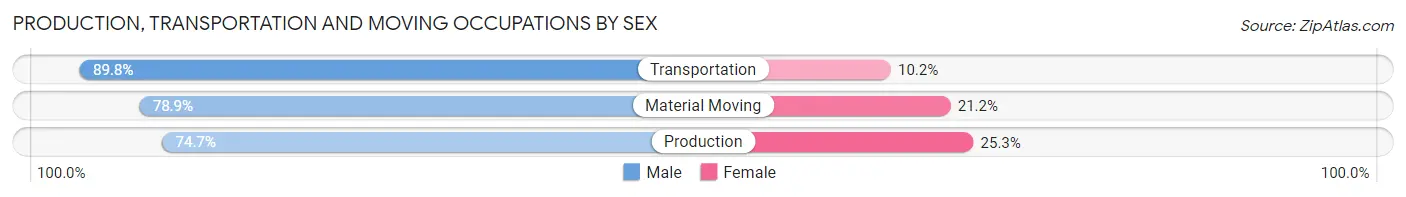
| Occupation | Male | Female |
| Production | 283 (74.7%) | 96 (25.3%) |
| Transportation | 247 (89.8%) | 28 (10.2%) |
| Material Moving | 164 (78.8%) | 44 (21.1%) |
| Total (Category) | 694 (80.5%) | 168 (19.5%) |
| Total (Overall) | 4,324 (51.2%) | 4,128 (48.8%) |
Employment Industries by Sex in Glasgow
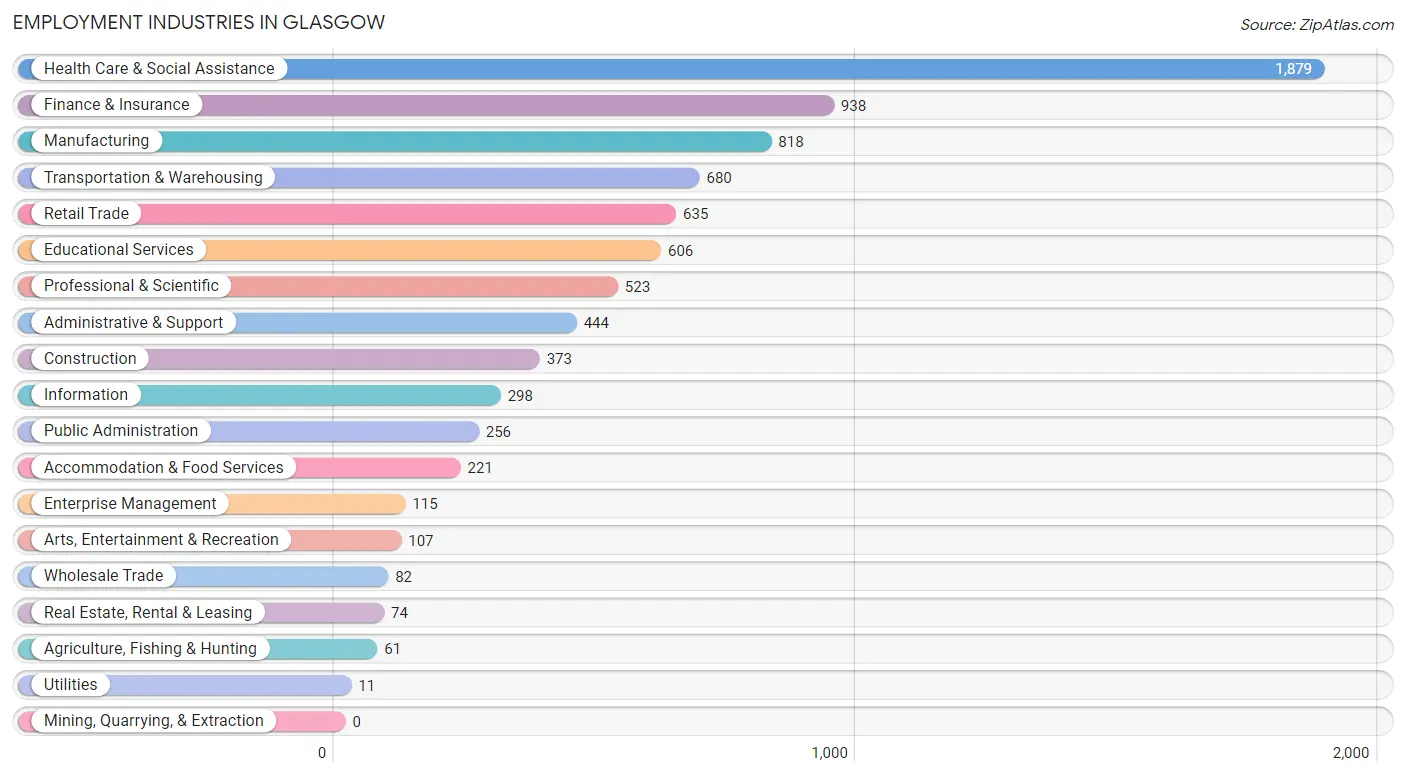
Employment Industries in Glasgow
The major employment industries in Glasgow include Health Care & Social Assistance (1,879 | 22.2%), Finance & Insurance (938 | 11.1%), Manufacturing (818 | 9.7%), Transportation & Warehousing (680 | 8.1%), and Retail Trade (635 | 7.5%).
Employment Industries by Sex in Glasgow
The Glasgow industries that see more men than women are Utilities (100.0%), Enterprise Management (100.0%), and Construction (82.8%), whereas the industries that tend to have a higher number of women are Finance & Insurance (77.1%), Administrative & Support (75.0%), and Educational Services (67.3%).
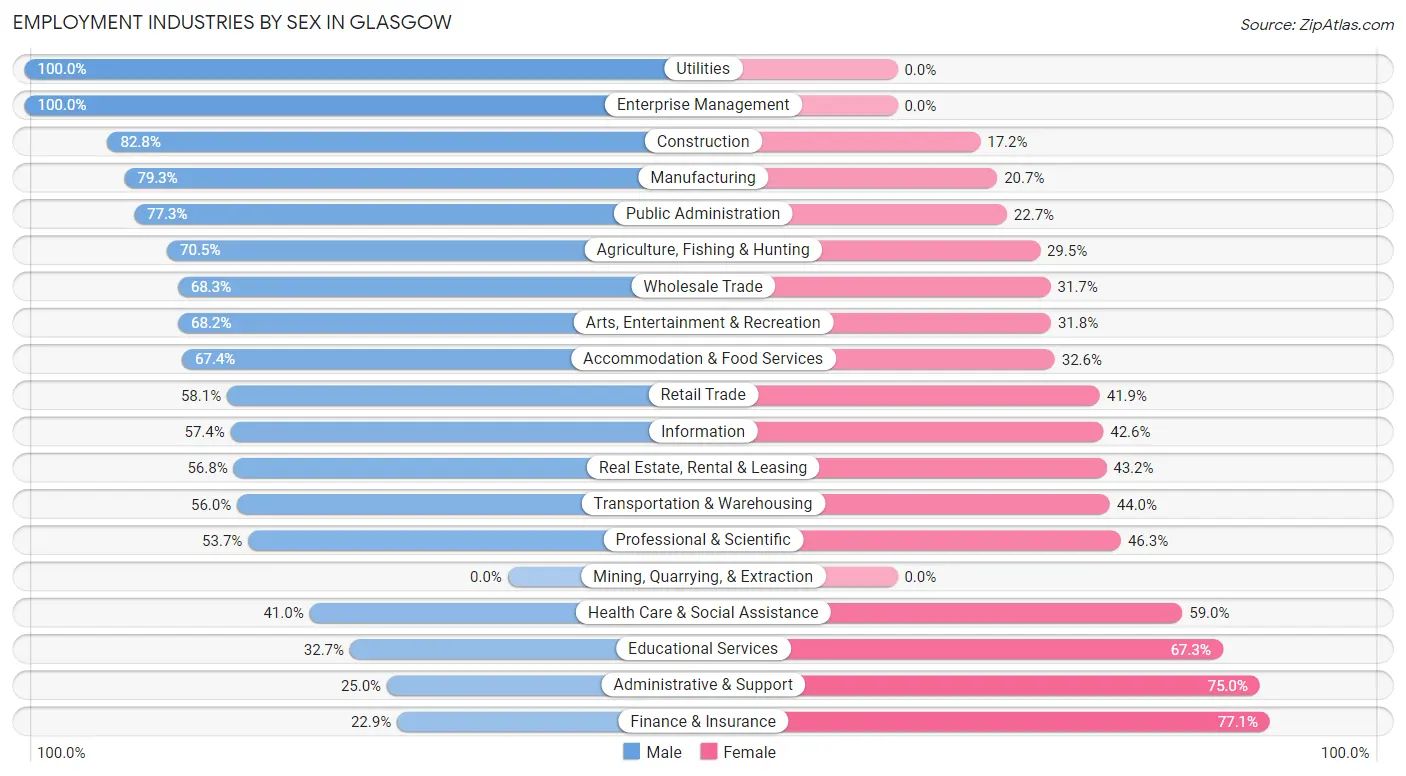
| Industry | Male | Female |
| Agriculture, Fishing & Hunting | 43 (70.5%) | 18 (29.5%) |
| Mining, Quarrying, & Extraction | 0 (0.0%) | 0 (0.0%) |
| Construction | 309 (82.8%) | 64 (17.2%) |
| Manufacturing | 649 (79.3%) | 169 (20.7%) |
| Wholesale Trade | 56 (68.3%) | 26 (31.7%) |
| Retail Trade | 369 (58.1%) | 266 (41.9%) |
| Transportation & Warehousing | 381 (56.0%) | 299 (44.0%) |
| Utilities | 11 (100.0%) | 0 (0.0%) |
| Information | 171 (57.4%) | 127 (42.6%) |
| Finance & Insurance | 215 (22.9%) | 723 (77.1%) |
| Real Estate, Rental & Leasing | 42 (56.8%) | 32 (43.2%) |
| Professional & Scientific | 281 (53.7%) | 242 (46.3%) |
| Enterprise Management | 115 (100.0%) | 0 (0.0%) |
| Administrative & Support | 111 (25.0%) | 333 (75.0%) |
| Educational Services | 198 (32.7%) | 408 (67.3%) |
| Health Care & Social Assistance | 771 (41.0%) | 1,108 (59.0%) |
| Arts, Entertainment & Recreation | 73 (68.2%) | 34 (31.8%) |
| Accommodation & Food Services | 149 (67.4%) | 72 (32.6%) |
| Public Administration | 198 (77.3%) | 58 (22.7%) |
| Total | 4,324 (51.2%) | 4,128 (48.8%) |
Education in Glasgow
School Enrollment in Glasgow
The most common levels of schooling among the 3,234 students in Glasgow are college / undergraduate (966 | 29.9%), middle school (717 | 22.2%), and high school (710 | 22.0%).
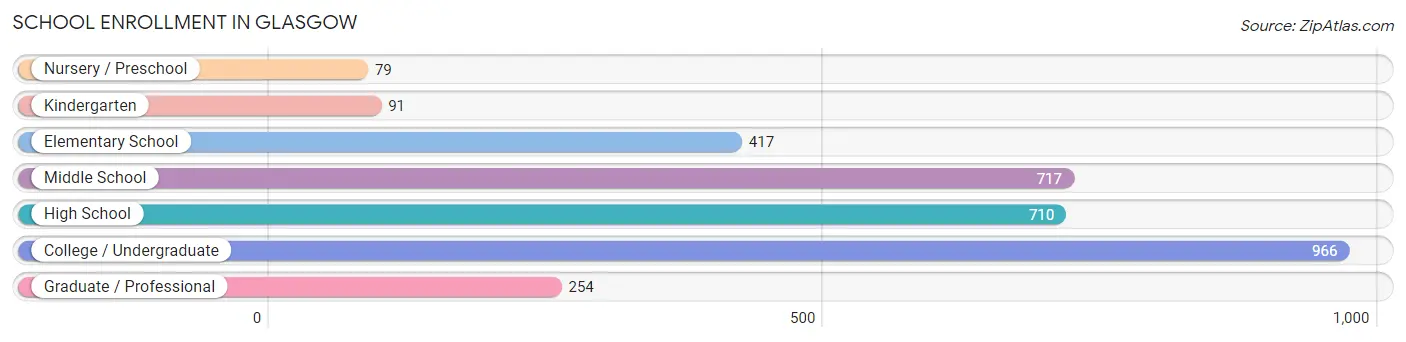
| School Level | # Students | % Students |
| Nursery / Preschool | 79 | 2.4% |
| Kindergarten | 91 | 2.8% |
| Elementary School | 417 | 12.9% |
| Middle School | 717 | 22.2% |
| High School | 710 | 22.0% |
| College / Undergraduate | 966 | 29.9% |
| Graduate / Professional | 254 | 7.9% |
| Total | 3,234 | 100.0% |
School Enrollment by Age by Funding Source in Glasgow
Out of a total of 3,234 students who are enrolled in schools in Glasgow, 744 (23.0%) attend a private institution, while the remaining 2,490 (77.0%) are enrolled in public schools. The age group of 3 to 4 year olds has the highest likelihood of being enrolled in private schools, with 35 (87.5% in the age bracket) enrolled. Conversely, the age group of 18 to 19 year olds has the lowest likelihood of being enrolled in a private school, with 289 (100.0% in the age bracket) attending a public institution.
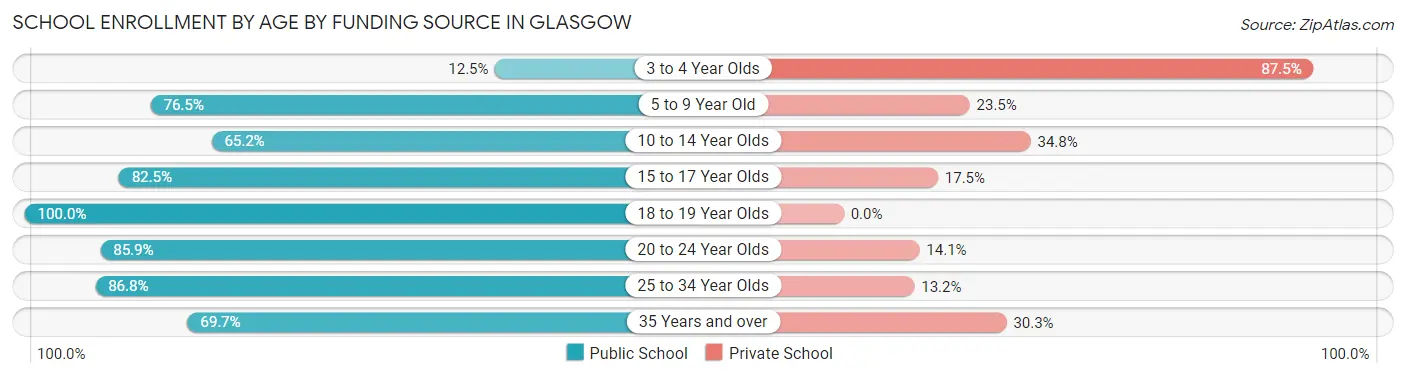
| Age Bracket | Public School | Private School |
| 3 to 4 Year Olds | 5 (12.5%) | 35 (87.5%) |
| 5 to 9 Year Old | 385 (76.5%) | 118 (23.5%) |
| 10 to 14 Year Olds | 545 (65.2%) | 291 (34.8%) |
| 15 to 17 Year Olds | 409 (82.5%) | 87 (17.5%) |
| 18 to 19 Year Olds | 289 (100.0%) | 0 (0.0%) |
| 20 to 24 Year Olds | 274 (85.9%) | 45 (14.1%) |
| 25 to 34 Year Olds | 297 (86.8%) | 45 (13.2%) |
| 35 Years and over | 285 (69.7%) | 124 (30.3%) |
| Total | 2,490 (77.0%) | 744 (23.0%) |
Educational Attainment by Field of Study in Glasgow
Business (909 | 22.7%), computers & mathematics (496 | 12.4%), science & technology (491 | 12.2%), engineering (382 | 9.5%), and arts & humanities (376 | 9.4%) are the most common fields of study among 4,012 individuals in Glasgow who have obtained a bachelor's degree or higher.
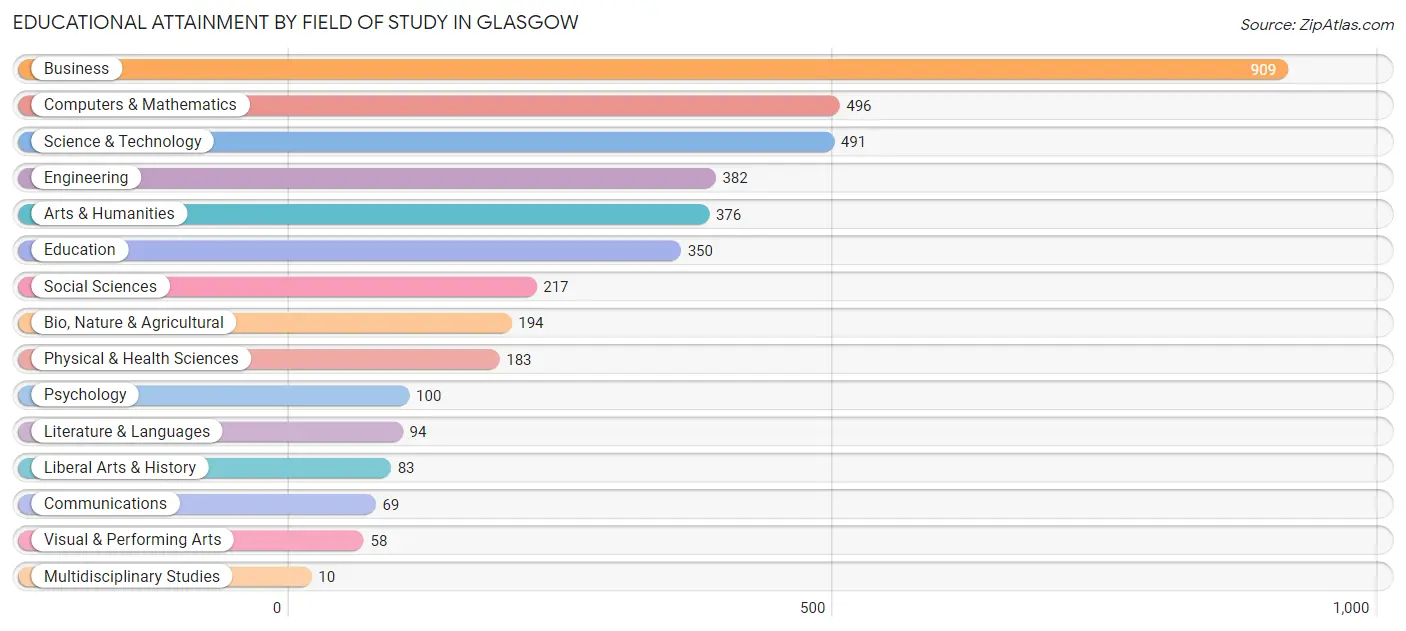
| Field of Study | # Graduates | % Graduates |
| Computers & Mathematics | 496 | 12.4% |
| Bio, Nature & Agricultural | 194 | 4.8% |
| Physical & Health Sciences | 183 | 4.6% |
| Psychology | 100 | 2.5% |
| Social Sciences | 217 | 5.4% |
| Engineering | 382 | 9.5% |
| Multidisciplinary Studies | 10 | 0.3% |
| Science & Technology | 491 | 12.2% |
| Business | 909 | 22.7% |
| Education | 350 | 8.7% |
| Literature & Languages | 94 | 2.3% |
| Liberal Arts & History | 83 | 2.1% |
| Visual & Performing Arts | 58 | 1.5% |
| Communications | 69 | 1.7% |
| Arts & Humanities | 376 | 9.4% |
| Total | 4,012 | 100.0% |
Transportation & Commute in Glasgow
Vehicle Availability by Sex in Glasgow
The most prevalent vehicle ownership categories in Glasgow are males with 2 vehicles (2,041, accounting for 47.8%) and females with 2 vehicles (1,830, making up 49.4%).
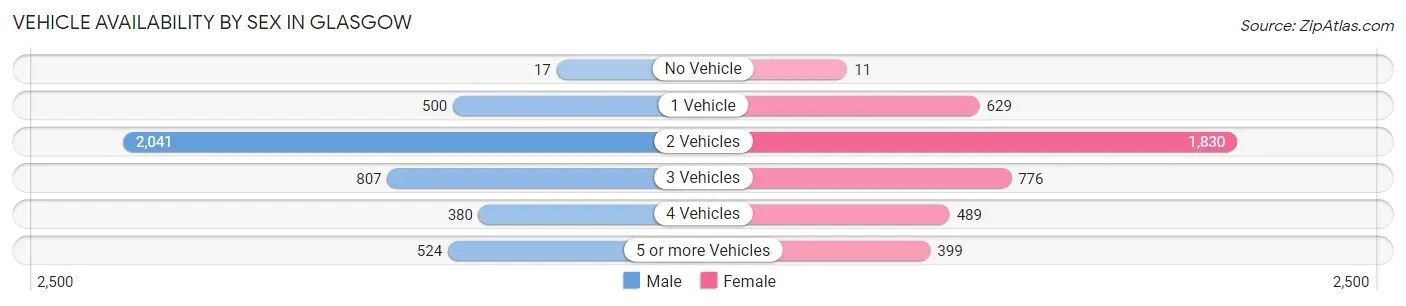
| Vehicles Available | Male | Female |
| No Vehicle | 17 (0.4%) | 11 (0.3%) |
| 1 Vehicle | 500 (11.7%) | 629 (15.2%) |
| 2 Vehicles | 2,041 (47.8%) | 1,830 (44.3%) |
| 3 Vehicles | 807 (18.9%) | 776 (18.8%) |
| 4 Vehicles | 380 (8.9%) | 489 (11.8%) |
| 5 or more Vehicles | 524 (12.3%) | 399 (9.7%) |
| Total | 4,269 (100.0%) | 4,134 (100.0%) |
Commute Time in Glasgow
The most frequently occuring commute durations in Glasgow are 20 to 24 minutes (1,251 commuters, 17.2%), 30 to 34 minutes (1,125 commuters, 15.5%), and 25 to 29 minutes (1,124 commuters, 15.4%).
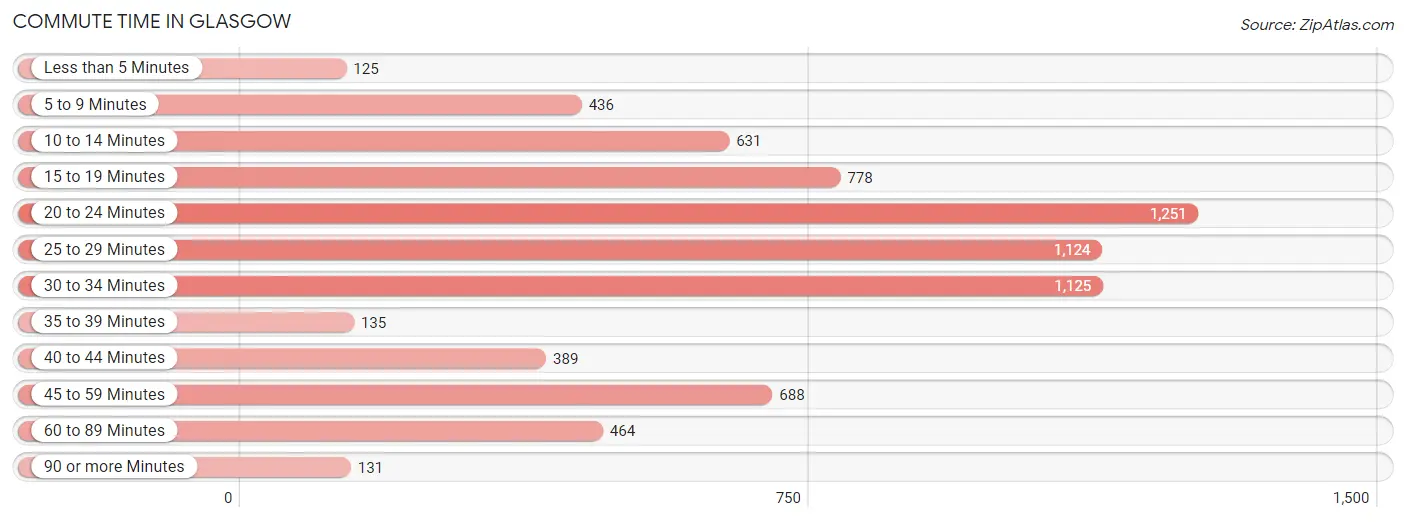
| Commute Time | # Commuters | % Commuters |
| Less than 5 Minutes | 125 | 1.7% |
| 5 to 9 Minutes | 436 | 6.0% |
| 10 to 14 Minutes | 631 | 8.7% |
| 15 to 19 Minutes | 778 | 10.7% |
| 20 to 24 Minutes | 1,251 | 17.2% |
| 25 to 29 Minutes | 1,124 | 15.4% |
| 30 to 34 Minutes | 1,125 | 15.5% |
| 35 to 39 Minutes | 135 | 1.9% |
| 40 to 44 Minutes | 389 | 5.3% |
| 45 to 59 Minutes | 688 | 9.5% |
| 60 to 89 Minutes | 464 | 6.4% |
| 90 or more Minutes | 131 | 1.8% |
Commute Time by Sex in Glasgow
The most common commute times in Glasgow are 20 to 24 minutes (839 commuters, 21.4%) for males and 25 to 29 minutes (532 commuters, 15.9%) for females.
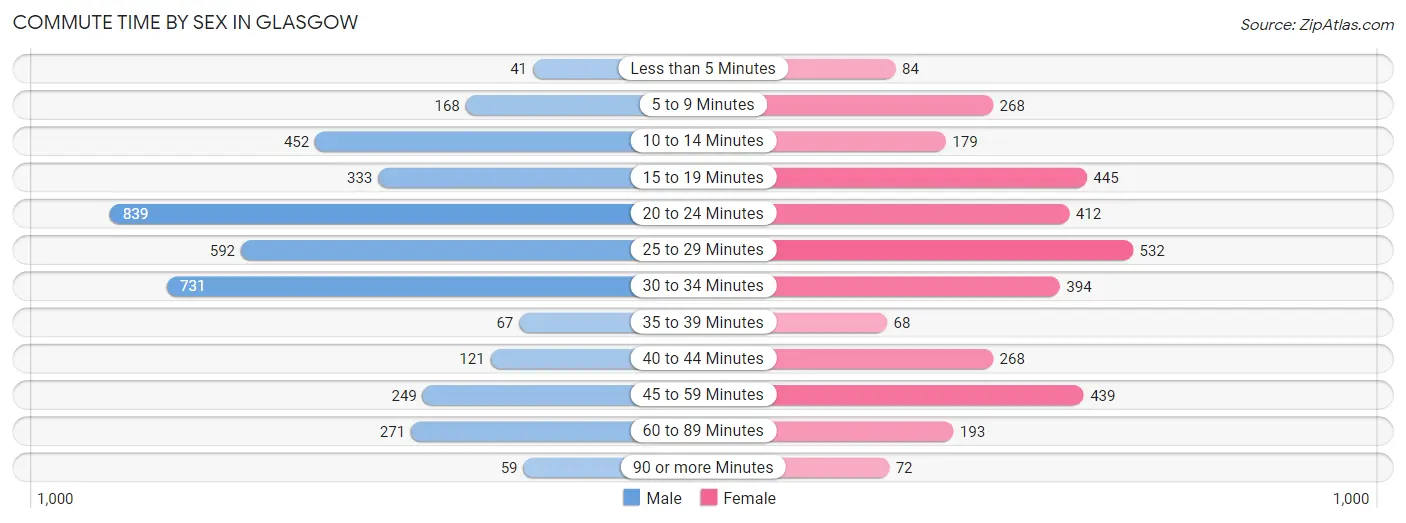
| Commute Time | Male | Female |
| Less than 5 Minutes | 41 (1.1%) | 84 (2.5%) |
| 5 to 9 Minutes | 168 (4.3%) | 268 (8.0%) |
| 10 to 14 Minutes | 452 (11.5%) | 179 (5.3%) |
| 15 to 19 Minutes | 333 (8.5%) | 445 (13.3%) |
| 20 to 24 Minutes | 839 (21.4%) | 412 (12.3%) |
| 25 to 29 Minutes | 592 (15.1%) | 532 (15.9%) |
| 30 to 34 Minutes | 731 (18.6%) | 394 (11.7%) |
| 35 to 39 Minutes | 67 (1.7%) | 68 (2.0%) |
| 40 to 44 Minutes | 121 (3.1%) | 268 (8.0%) |
| 45 to 59 Minutes | 249 (6.4%) | 439 (13.1%) |
| 60 to 89 Minutes | 271 (6.9%) | 193 (5.8%) |
| 90 or more Minutes | 59 (1.5%) | 72 (2.1%) |
Time of Departure to Work by Sex in Glasgow
The most frequent times of departure to work in Glasgow are 7:00 AM to 7:29 AM (887, 22.6%) for males and 7:00 AM to 7:29 AM (845, 25.2%) for females.
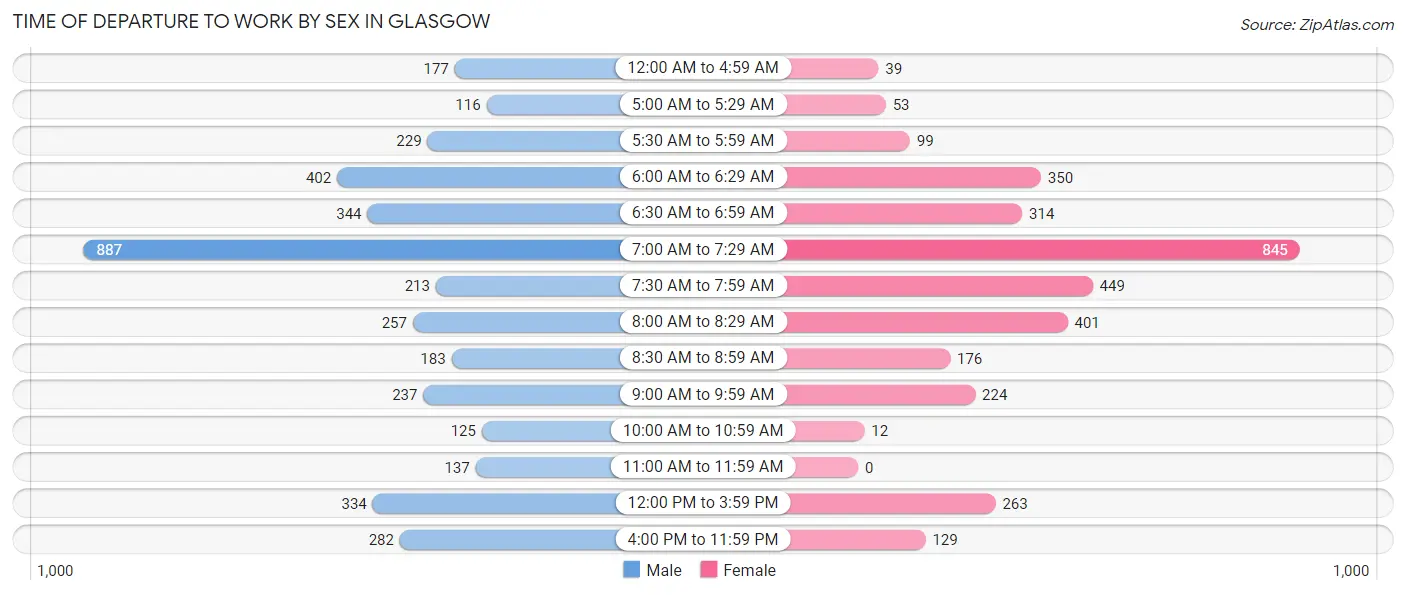
| Time of Departure | Male | Female |
| 12:00 AM to 4:59 AM | 177 (4.5%) | 39 (1.2%) |
| 5:00 AM to 5:29 AM | 116 (3.0%) | 53 (1.6%) |
| 5:30 AM to 5:59 AM | 229 (5.8%) | 99 (2.9%) |
| 6:00 AM to 6:29 AM | 402 (10.2%) | 350 (10.4%) |
| 6:30 AM to 6:59 AM | 344 (8.8%) | 314 (9.4%) |
| 7:00 AM to 7:29 AM | 887 (22.6%) | 845 (25.2%) |
| 7:30 AM to 7:59 AM | 213 (5.4%) | 449 (13.4%) |
| 8:00 AM to 8:29 AM | 257 (6.6%) | 401 (12.0%) |
| 8:30 AM to 8:59 AM | 183 (4.7%) | 176 (5.2%) |
| 9:00 AM to 9:59 AM | 237 (6.0%) | 224 (6.7%) |
| 10:00 AM to 10:59 AM | 125 (3.2%) | 12 (0.4%) |
| 11:00 AM to 11:59 AM | 137 (3.5%) | 0 (0.0%) |
| 12:00 PM to 3:59 PM | 334 (8.5%) | 263 (7.8%) |
| 4:00 PM to 11:59 PM | 282 (7.2%) | 129 (3.8%) |
| Total | 3,923 (100.0%) | 3,354 (100.0%) |
Housing Occupancy in Glasgow
Occupancy by Ownership in Glasgow
Of the total 5,434 dwellings in Glasgow, owner-occupied units account for 4,586 (84.4%), while renter-occupied units make up 848 (15.6%).
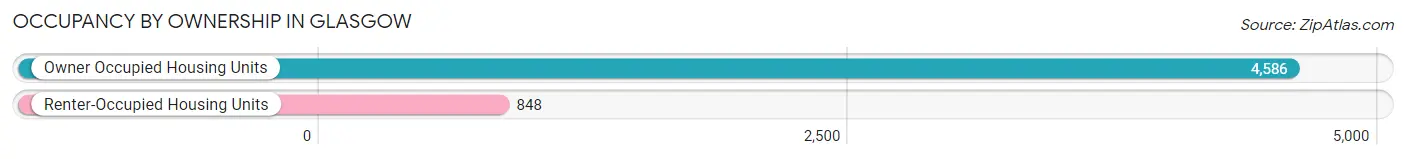
| Occupancy | # Housing Units | % Housing Units |
| Owner Occupied Housing Units | 4,586 | 84.4% |
| Renter-Occupied Housing Units | 848 | 15.6% |
| Total Occupied Housing Units | 5,434 | 100.0% |
Occupancy by Household Size in Glasgow
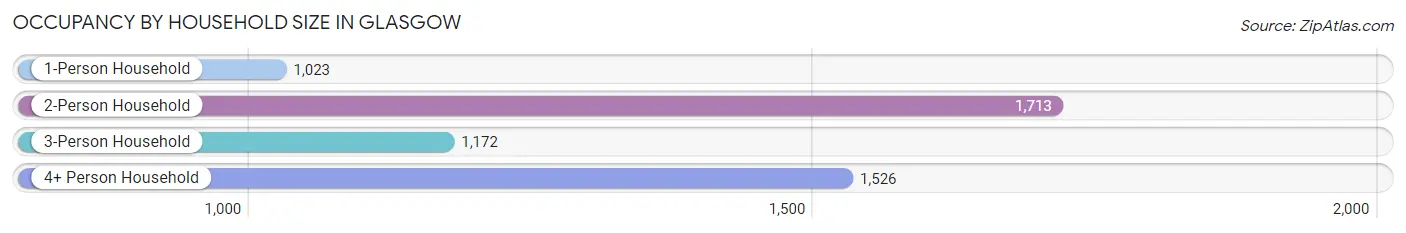
| Household Size | # Housing Units | % Housing Units |
| 1-Person Household | 1,023 | 18.8% |
| 2-Person Household | 1,713 | 31.5% |
| 3-Person Household | 1,172 | 21.6% |
| 4+ Person Household | 1,526 | 28.1% |
| Total Housing Units | 5,434 | 100.0% |
Occupancy by Ownership by Household Size in Glasgow
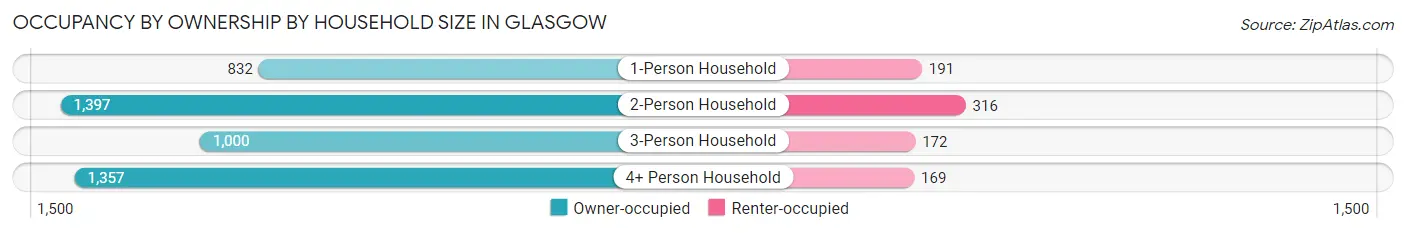
| Household Size | Owner-occupied | Renter-occupied |
| 1-Person Household | 832 (81.3%) | 191 (18.7%) |
| 2-Person Household | 1,397 (81.6%) | 316 (18.4%) |
| 3-Person Household | 1,000 (85.3%) | 172 (14.7%) |
| 4+ Person Household | 1,357 (88.9%) | 169 (11.1%) |
| Total Housing Units | 4,586 (84.4%) | 848 (15.6%) |
Occupancy by Educational Attainment in Glasgow
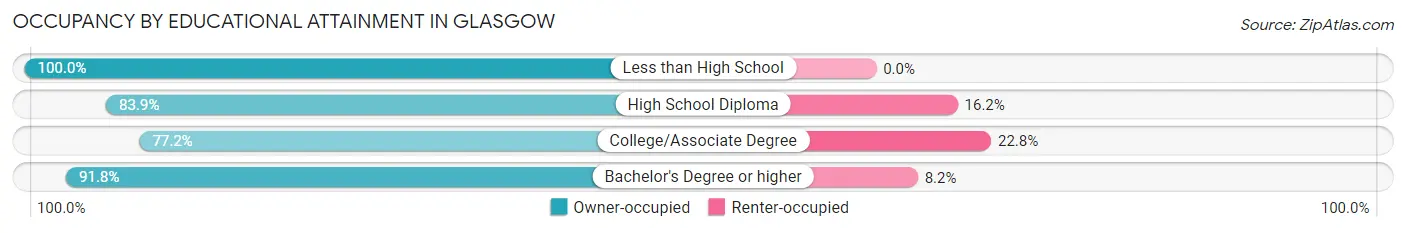
| Household Size | Owner-occupied | Renter-occupied |
| Less than High School | 12 (100.0%) | 0 (0.0%) |
| High School Diploma | 1,116 (83.9%) | 215 (16.2%) |
| College/Associate Degree | 1,573 (77.2%) | 464 (22.8%) |
| Bachelor's Degree or higher | 1,885 (91.8%) | 169 (8.2%) |
Occupancy by Age of Householder in Glasgow
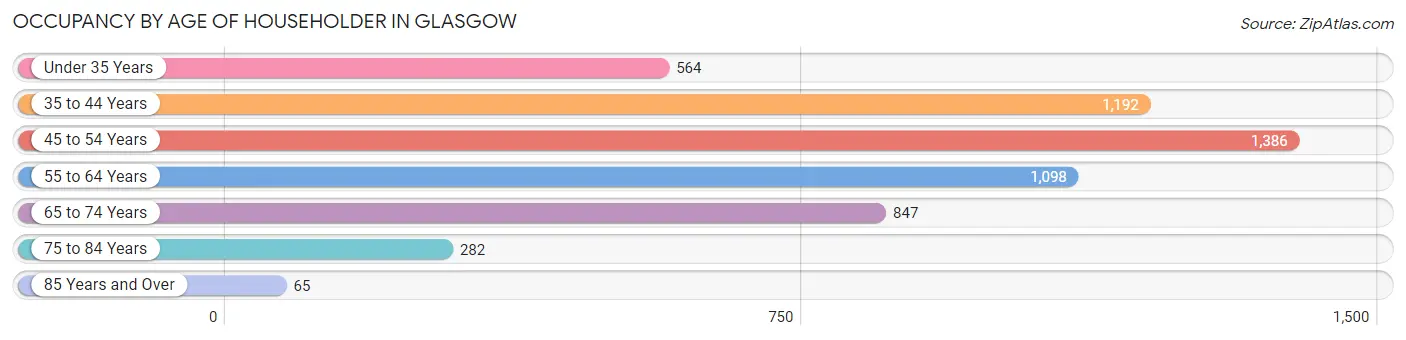
| Age Bracket | # Households | % Households |
| Under 35 Years | 564 | 10.4% |
| 35 to 44 Years | 1,192 | 21.9% |
| 45 to 54 Years | 1,386 | 25.5% |
| 55 to 64 Years | 1,098 | 20.2% |
| 65 to 74 Years | 847 | 15.6% |
| 75 to 84 Years | 282 | 5.2% |
| 85 Years and Over | 65 | 1.2% |
| Total | 5,434 | 100.0% |
Housing Finances in Glasgow
Median Income by Occupancy in Glasgow
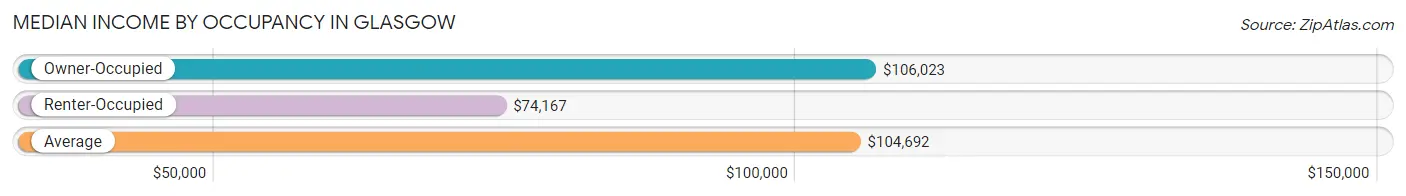
| Occupancy Type | # Households | Median Income |
| Owner-Occupied | 4,586 (84.4%) | $106,023 |
| Renter-Occupied | 848 (15.6%) | $74,167 |
| Average | 5,434 (100.0%) | $104,692 |
Occupancy by Householder Income Bracket in Glasgow
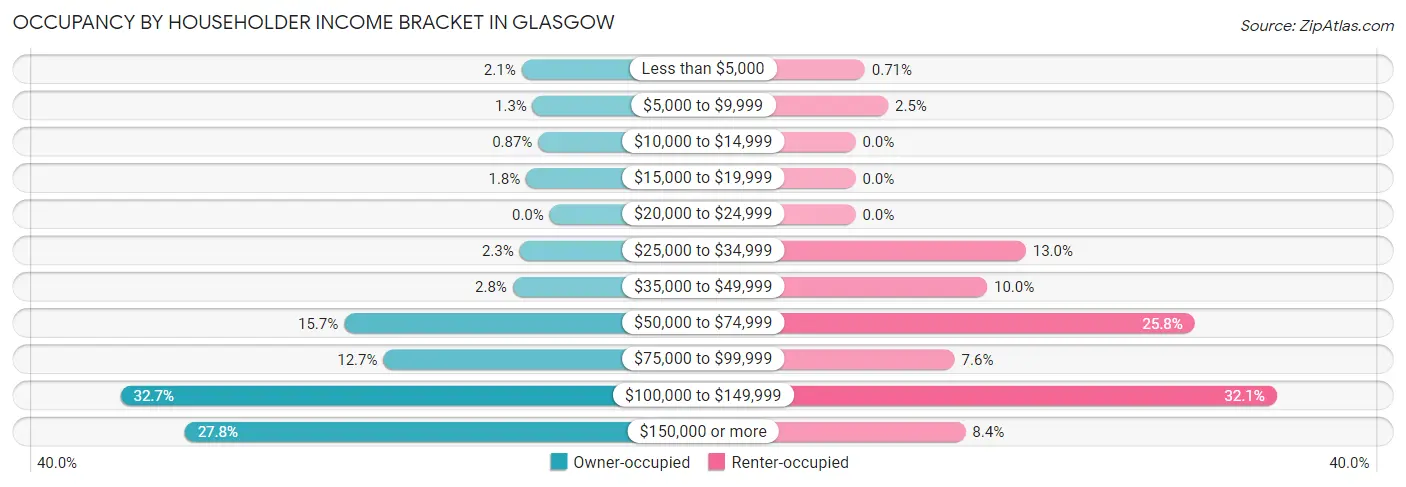
| Income Bracket | Owner-occupied | Renter-occupied |
| Less than $5,000 | 98 (2.1%) | 6 (0.7%) |
| $5,000 to $9,999 | 59 (1.3%) | 21 (2.5%) |
| $10,000 to $14,999 | 40 (0.9%) | 0 (0.0%) |
| $15,000 to $19,999 | 82 (1.8%) | 0 (0.0%) |
| $20,000 to $24,999 | 0 (0.0%) | 0 (0.0%) |
| $25,000 to $34,999 | 105 (2.3%) | 110 (13.0%) |
| $35,000 to $49,999 | 129 (2.8%) | 85 (10.0%) |
| $50,000 to $74,999 | 718 (15.7%) | 219 (25.8%) |
| $75,000 to $99,999 | 581 (12.7%) | 64 (7.5%) |
| $100,000 to $149,999 | 1,499 (32.7%) | 272 (32.1%) |
| $150,000 or more | 1,275 (27.8%) | 71 (8.4%) |
| Total | 4,586 (100.0%) | 848 (100.0%) |
Monthly Housing Cost Tiers in Glasgow
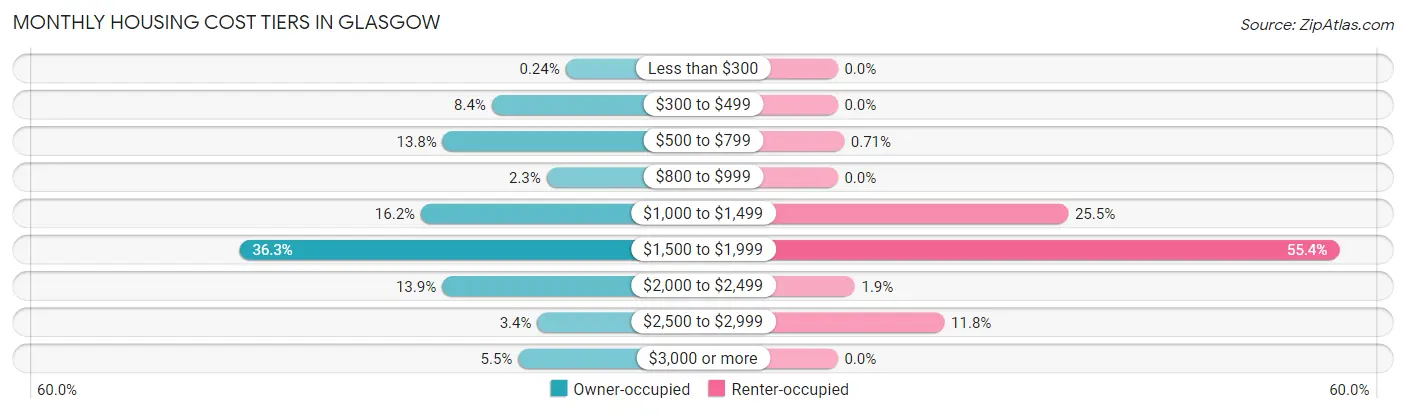
| Monthly Cost | Owner-occupied | Renter-occupied |
| Less than $300 | 11 (0.2%) | 0 (0.0%) |
| $300 to $499 | 385 (8.4%) | 0 (0.0%) |
| $500 to $799 | 634 (13.8%) | 6 (0.7%) |
| $800 to $999 | 107 (2.3%) | 0 (0.0%) |
| $1,000 to $1,499 | 744 (16.2%) | 216 (25.5%) |
| $1,500 to $1,999 | 1,663 (36.3%) | 470 (55.4%) |
| $2,000 to $2,499 | 637 (13.9%) | 16 (1.9%) |
| $2,500 to $2,999 | 154 (3.4%) | 100 (11.8%) |
| $3,000 or more | 251 (5.5%) | 0 (0.0%) |
| Total | 4,586 (100.0%) | 848 (100.0%) |
Physical Housing Characteristics in Glasgow
Housing Structures in Glasgow
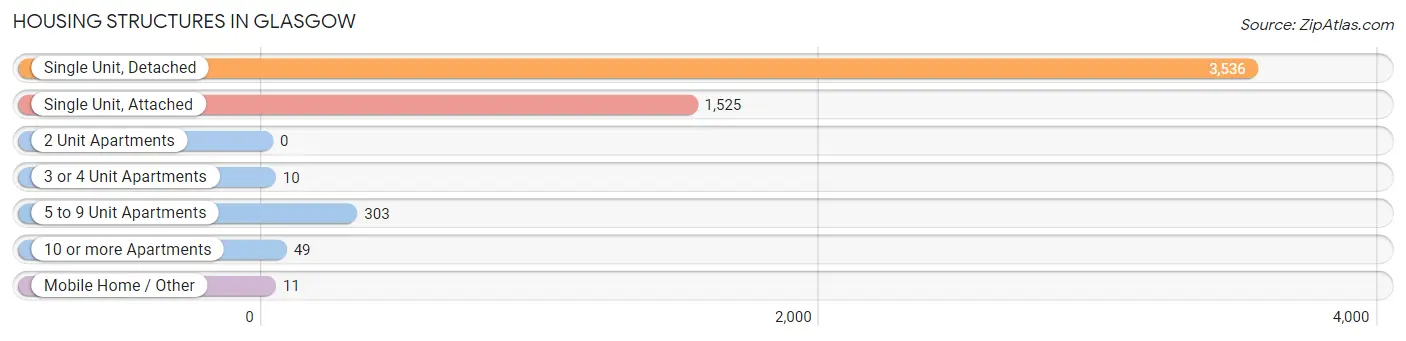
| Structure Type | # Housing Units | % Housing Units |
| Single Unit, Detached | 3,536 | 65.1% |
| Single Unit, Attached | 1,525 | 28.1% |
| 2 Unit Apartments | 0 | 0.0% |
| 3 or 4 Unit Apartments | 10 | 0.2% |
| 5 to 9 Unit Apartments | 303 | 5.6% |
| 10 or more Apartments | 49 | 0.9% |
| Mobile Home / Other | 11 | 0.2% |
| Total | 5,434 | 100.0% |
Housing Structures by Occupancy in Glasgow
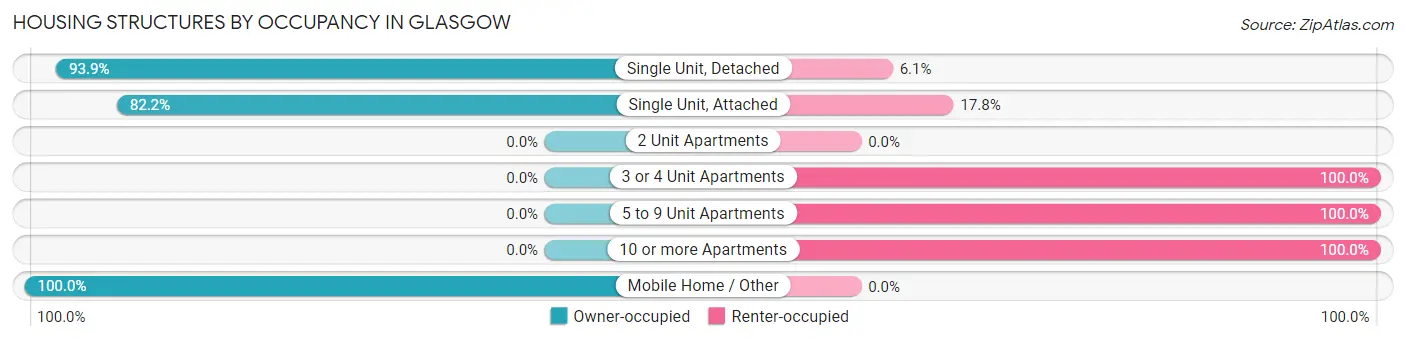
| Structure Type | Owner-occupied | Renter-occupied |
| Single Unit, Detached | 3,321 (93.9%) | 215 (6.1%) |
| Single Unit, Attached | 1,254 (82.2%) | 271 (17.8%) |
| 2 Unit Apartments | 0 (0.0%) | 0 (0.0%) |
| 3 or 4 Unit Apartments | 0 (0.0%) | 10 (100.0%) |
| 5 to 9 Unit Apartments | 0 (0.0%) | 303 (100.0%) |
| 10 or more Apartments | 0 (0.0%) | 49 (100.0%) |
| Mobile Home / Other | 11 (100.0%) | 0 (0.0%) |
| Total | 4,586 (84.4%) | 848 (15.6%) |
Housing Structures by Number of Rooms in Glasgow
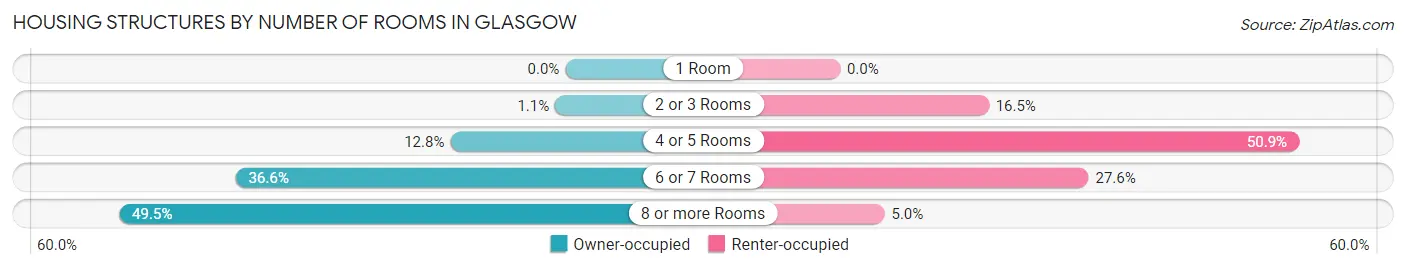
| Number of Rooms | Owner-occupied | Renter-occupied |
| 1 Room | 0 (0.0%) | 0 (0.0%) |
| 2 or 3 Rooms | 52 (1.1%) | 140 (16.5%) |
| 4 or 5 Rooms | 585 (12.8%) | 432 (50.9%) |
| 6 or 7 Rooms | 1,678 (36.6%) | 234 (27.6%) |
| 8 or more Rooms | 2,271 (49.5%) | 42 (5.0%) |
| Total | 4,586 (100.0%) | 848 (100.0%) |
Housing Structure by Heating Type in Glasgow
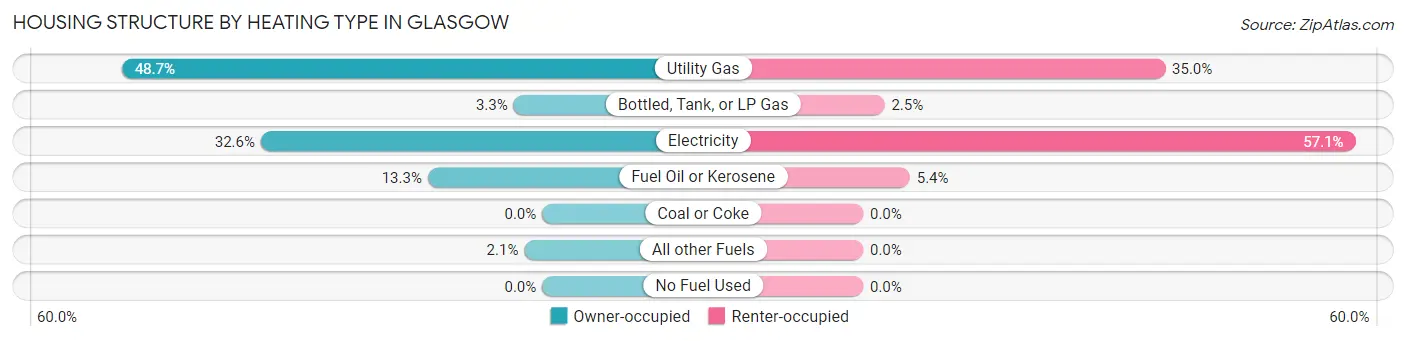
| Heating Type | Owner-occupied | Renter-occupied |
| Utility Gas | 2,235 (48.7%) | 297 (35.0%) |
| Bottled, Tank, or LP Gas | 152 (3.3%) | 21 (2.5%) |
| Electricity | 1,496 (32.6%) | 484 (57.1%) |
| Fuel Oil or Kerosene | 608 (13.3%) | 46 (5.4%) |
| Coal or Coke | 0 (0.0%) | 0 (0.0%) |
| All other Fuels | 95 (2.1%) | 0 (0.0%) |
| No Fuel Used | 0 (0.0%) | 0 (0.0%) |
| Total | 4,586 (100.0%) | 848 (100.0%) |
Household Vehicle Usage in Glasgow
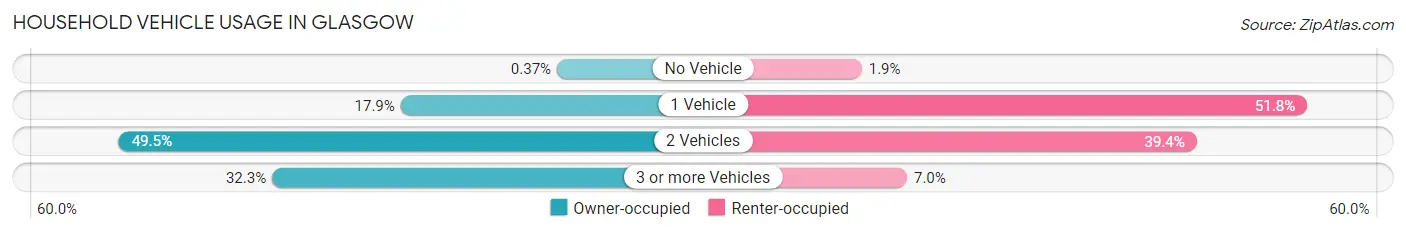
| Vehicles per Household | Owner-occupied | Renter-occupied |
| No Vehicle | 17 (0.4%) | 16 (1.9%) |
| 1 Vehicle | 820 (17.9%) | 439 (51.8%) |
| 2 Vehicles | 2,268 (49.4%) | 334 (39.4%) |
| 3 or more Vehicles | 1,481 (32.3%) | 59 (7.0%) |
| Total | 4,586 (100.0%) | 848 (100.0%) |
Real Estate & Mortgages in Glasgow
Real Estate and Mortgage Overview in Glasgow
| Characteristic | Without Mortgage | With Mortgage |
| Housing Units | 1,049 | 3,537 |
| Median Property Value | $354,000 | $306,000 |
| Median Household Income | $108,176 | $1,109 |
| Monthly Housing Costs | $560 | $251 |
| Real Estate Taxes | $2,448 | $52 |
Property Value by Mortgage Status in Glasgow
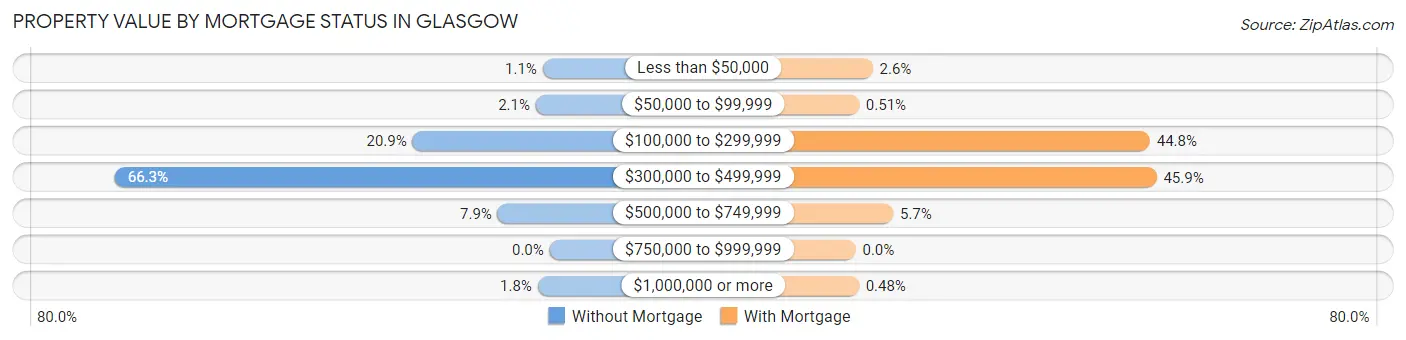
| Property Value | Without Mortgage | With Mortgage |
| Less than $50,000 | 11 (1.1%) | 92 (2.6%) |
| $50,000 to $99,999 | 22 (2.1%) | 18 (0.5%) |
| $100,000 to $299,999 | 219 (20.9%) | 1,586 (44.8%) |
| $300,000 to $499,999 | 695 (66.2%) | 1,622 (45.9%) |
| $500,000 to $749,999 | 83 (7.9%) | 202 (5.7%) |
| $750,000 to $999,999 | 0 (0.0%) | 0 (0.0%) |
| $1,000,000 or more | 19 (1.8%) | 17 (0.5%) |
| Total | 1,049 (100.0%) | 3,537 (100.0%) |
Household Income by Mortgage Status in Glasgow
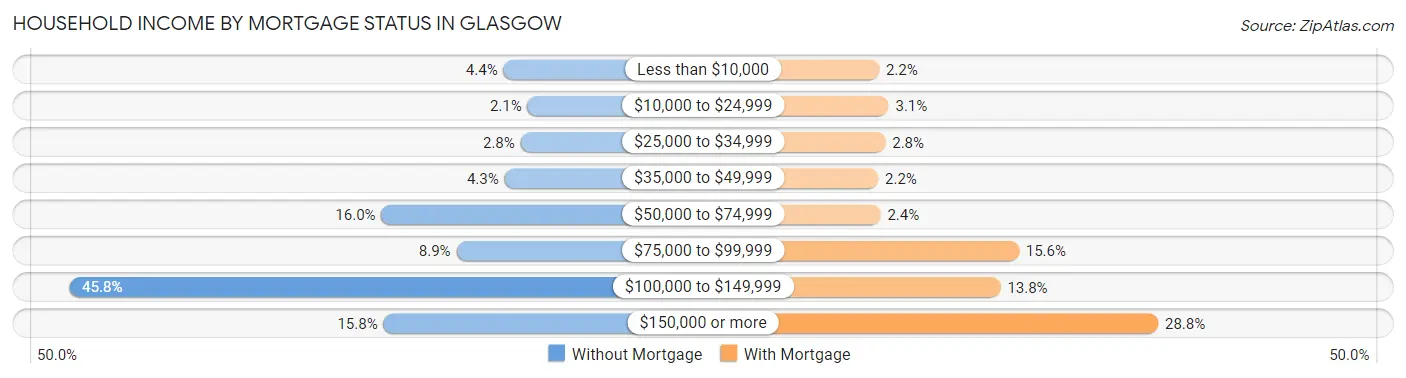
| Household Income | Without Mortgage | With Mortgage |
| Less than $10,000 | 46 (4.4%) | 79 (2.2%) |
| $10,000 to $24,999 | 22 (2.1%) | 111 (3.1%) |
| $25,000 to $34,999 | 29 (2.8%) | 100 (2.8%) |
| $35,000 to $49,999 | 45 (4.3%) | 76 (2.1%) |
| $50,000 to $74,999 | 168 (16.0%) | 84 (2.4%) |
| $75,000 to $99,999 | 93 (8.9%) | 550 (15.5%) |
| $100,000 to $149,999 | 480 (45.8%) | 488 (13.8%) |
| $150,000 or more | 166 (15.8%) | 1,019 (28.8%) |
| Total | 1,049 (100.0%) | 3,537 (100.0%) |
Property Value to Household Income Ratio in Glasgow
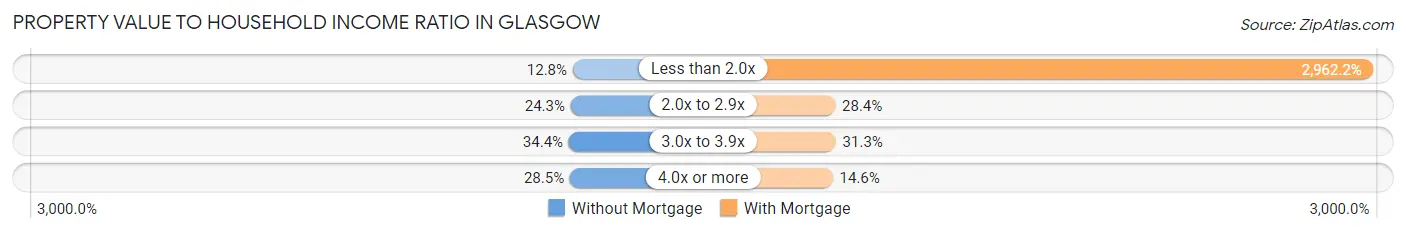
| Value-to-Income Ratio | Without Mortgage | With Mortgage |
| Less than 2.0x | 134 (12.8%) | 104,772 (2,962.2%) |
| 2.0x to 2.9x | 255 (24.3%) | 1,004 (28.4%) |
| 3.0x to 3.9x | 361 (34.4%) | 1,108 (31.3%) |
| 4.0x or more | 299 (28.5%) | 516 (14.6%) |
| Total | 1,049 (100.0%) | 3,537 (100.0%) |
Real Estate Taxes by Mortgage Status in Glasgow
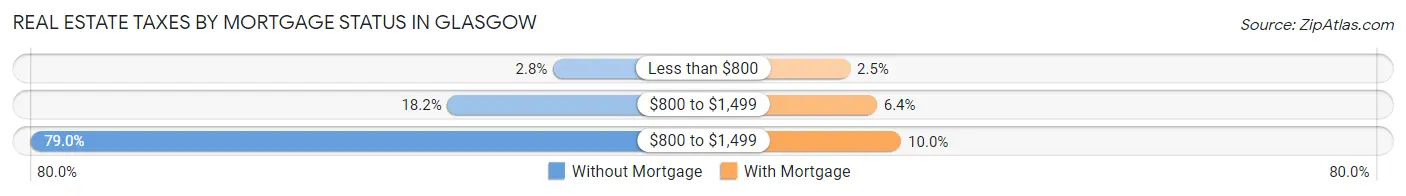
| Property Taxes | Without Mortgage | With Mortgage |
| Less than $800 | 29 (2.8%) | 88 (2.5%) |
| $800 to $1,499 | 191 (18.2%) | 226 (6.4%) |
| $800 to $1,499 | 829 (79.0%) | 352 (10.0%) |
| Total | 1,049 (100.0%) | 3,537 (100.0%) |
Health & Disability in Glasgow
Health Insurance Coverage by Age in Glasgow
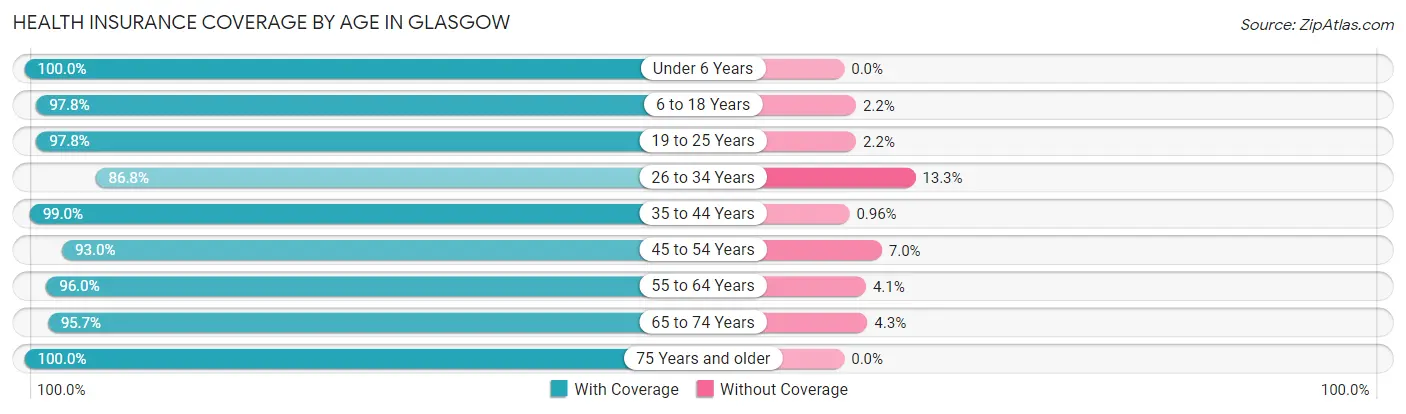
| Age Bracket | With Coverage | Without Coverage |
| Under 6 Years | 1,302 (100.0%) | 0 (0.0%) |
| 6 to 18 Years | 1,836 (97.8%) | 41 (2.2%) |
| 19 to 25 Years | 930 (97.8%) | 21 (2.2%) |
| 26 to 34 Years | 1,526 (86.8%) | 233 (13.3%) |
| 35 to 44 Years | 2,280 (99.0%) | 22 (1.0%) |
| 45 to 54 Years | 2,492 (93.0%) | 188 (7.0%) |
| 55 to 64 Years | 2,320 (96.0%) | 98 (4.1%) |
| 65 to 74 Years | 1,264 (95.7%) | 57 (4.3%) |
| 75 Years and older | 655 (100.0%) | 0 (0.0%) |
| Total | 14,605 (95.7%) | 660 (4.3%) |
Health Insurance Coverage by Citizenship Status in Glasgow
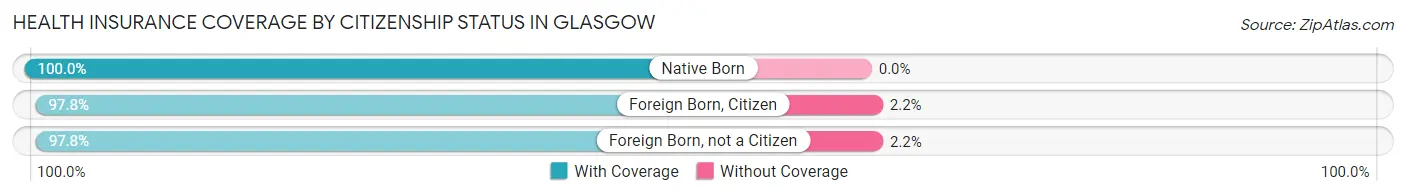
| Citizenship Status | With Coverage | Without Coverage |
| Native Born | 1,302 (100.0%) | 0 (0.0%) |
| Foreign Born, Citizen | 1,836 (97.8%) | 41 (2.2%) |
| Foreign Born, not a Citizen | 930 (97.8%) | 21 (2.2%) |
Health Insurance Coverage by Household Income in Glasgow
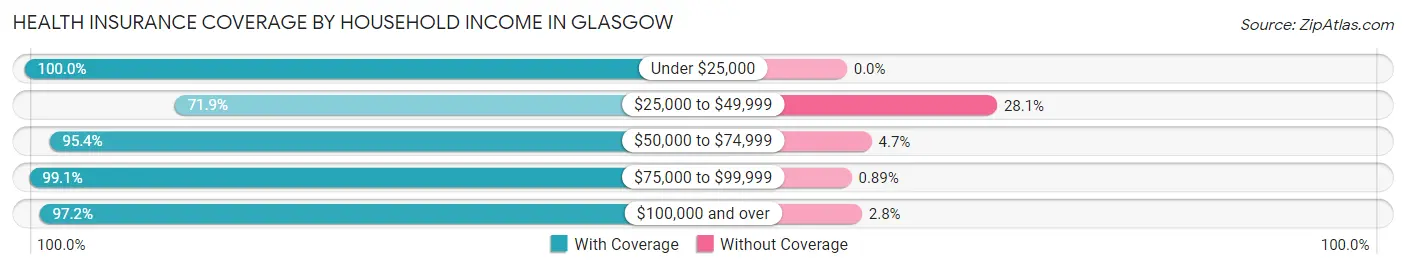
| Household Income | With Coverage | Without Coverage |
| Under $25,000 | 481 (100.0%) | 0 (0.0%) |
| $25,000 to $49,999 | 682 (71.9%) | 267 (28.1%) |
| $50,000 to $74,999 | 1,968 (95.4%) | 96 (4.6%) |
| $75,000 to $99,999 | 1,776 (99.1%) | 16 (0.9%) |
| $100,000 and over | 9,684 (97.2%) | 281 (2.8%) |
Public vs Private Health Insurance Coverage by Age in Glasgow
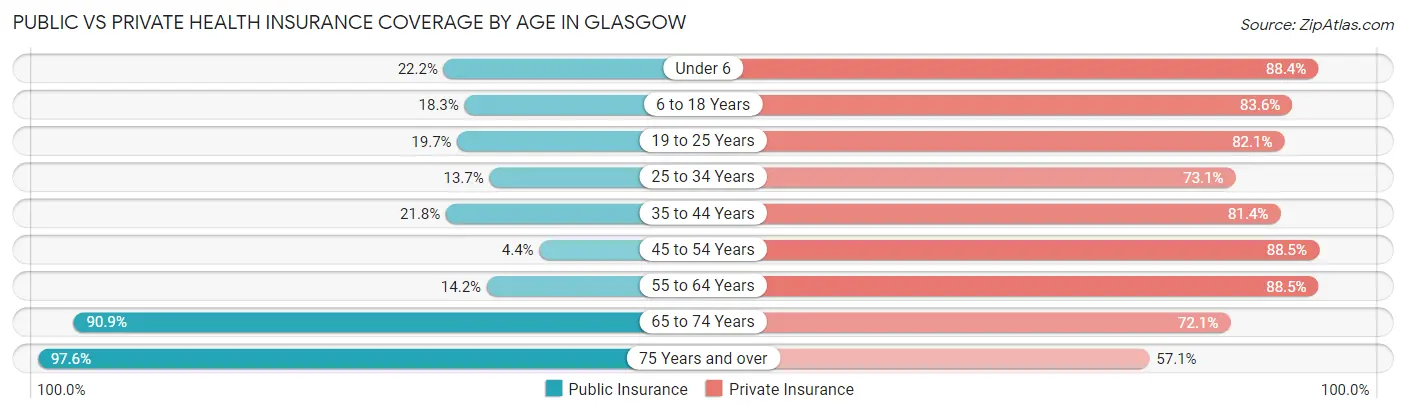
| Age Bracket | Public Insurance | Private Insurance |
| Under 6 | 289 (22.2%) | 1,151 (88.4%) |
| 6 to 18 Years | 344 (18.3%) | 1,569 (83.6%) |
| 19 to 25 Years | 187 (19.7%) | 781 (82.1%) |
| 25 to 34 Years | 241 (13.7%) | 1,285 (73.1%) |
| 35 to 44 Years | 501 (21.8%) | 1,873 (81.4%) |
| 45 to 54 Years | 119 (4.4%) | 2,373 (88.5%) |
| 55 to 64 Years | 343 (14.2%) | 2,139 (88.5%) |
| 65 to 74 Years | 1,201 (90.9%) | 952 (72.1%) |
| 75 Years and over | 639 (97.6%) | 374 (57.1%) |
| Total | 3,864 (25.3%) | 12,497 (81.9%) |
Disability Status by Sex by Age in Glasgow
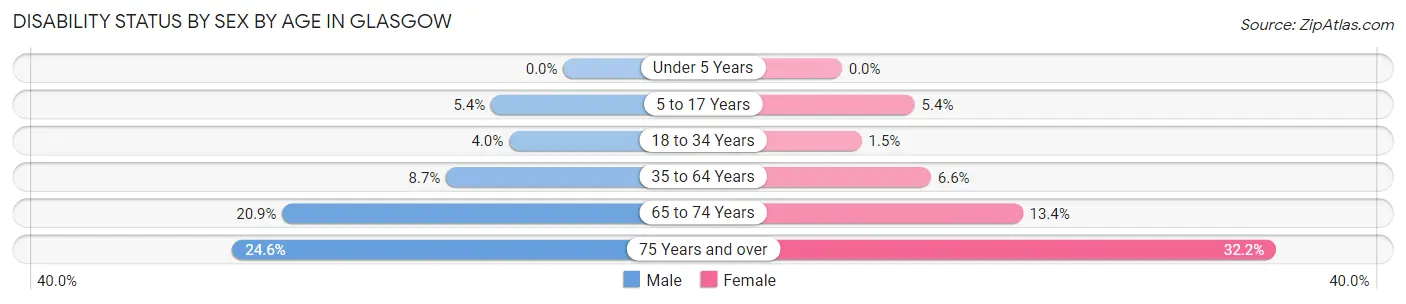
| Age Bracket | Male | Female |
| Under 5 Years | 0 (0.0%) | 0 (0.0%) |
| 5 to 17 Years | 51 (5.4%) | 53 (5.4%) |
| 18 to 34 Years | 55 (4.0%) | 22 (1.5%) |
| 35 to 64 Years | 321 (8.7%) | 245 (6.6%) |
| 65 to 74 Years | 131 (20.9%) | 93 (13.4%) |
| 75 Years and over | 71 (24.6%) | 118 (32.2%) |
Disability Class by Sex by Age in Glasgow
Disability Class: Hearing Difficulty
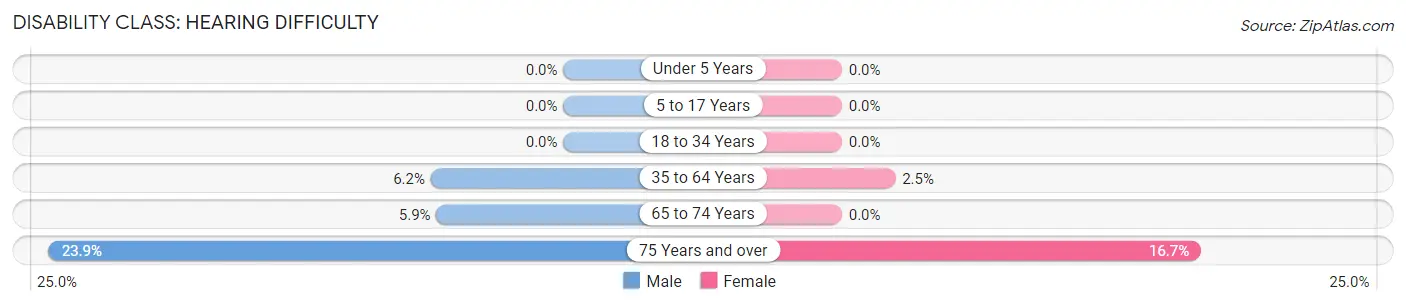
| Age Bracket | Male | Female |
| Under 5 Years | 0 (0.0%) | 0 (0.0%) |
| 5 to 17 Years | 0 (0.0%) | 0 (0.0%) |
| 18 to 34 Years | 0 (0.0%) | 0 (0.0%) |
| 35 to 64 Years | 227 (6.1%) | 92 (2.5%) |
| 65 to 74 Years | 37 (5.9%) | 0 (0.0%) |
| 75 Years and over | 69 (23.9%) | 61 (16.7%) |
Disability Class: Vision Difficulty
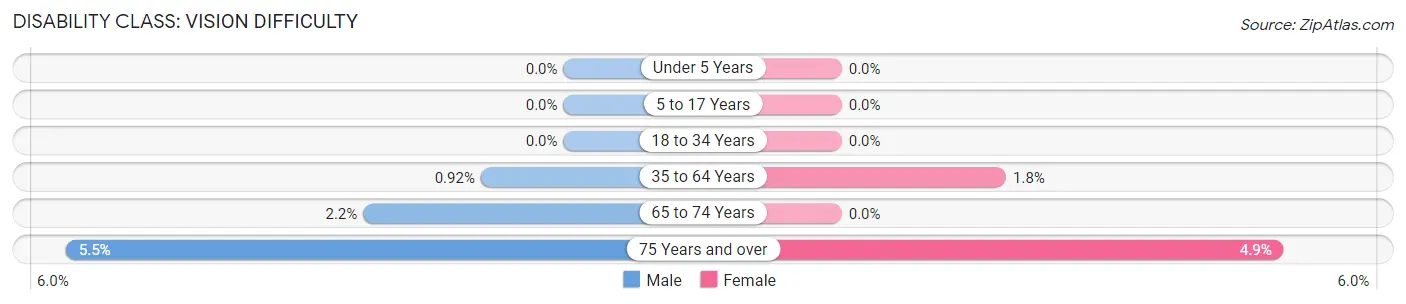
| Age Bracket | Male | Female |
| Under 5 Years | 0 (0.0%) | 0 (0.0%) |
| 5 to 17 Years | 0 (0.0%) | 0 (0.0%) |
| 18 to 34 Years | 0 (0.0%) | 0 (0.0%) |
| 35 to 64 Years | 34 (0.9%) | 68 (1.8%) |
| 65 to 74 Years | 14 (2.2%) | 0 (0.0%) |
| 75 Years and over | 16 (5.5%) | 18 (4.9%) |
Disability Class: Cognitive Difficulty
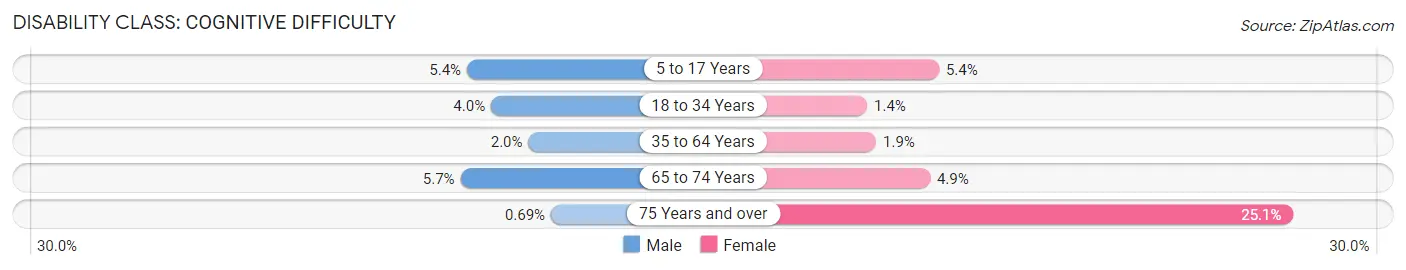
| Age Bracket | Male | Female |
| 5 to 17 Years | 51 (5.4%) | 53 (5.4%) |
| 18 to 34 Years | 55 (4.0%) | 21 (1.4%) |
| 35 to 64 Years | 72 (1.9%) | 71 (1.9%) |
| 65 to 74 Years | 36 (5.7%) | 34 (4.9%) |
| 75 Years and over | 2 (0.7%) | 92 (25.1%) |
Disability Class: Ambulatory Difficulty
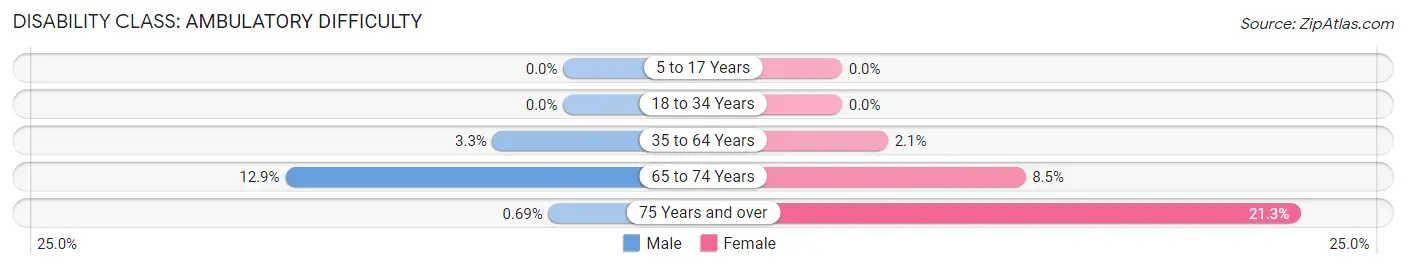
| Age Bracket | Male | Female |
| 5 to 17 Years | 0 (0.0%) | 0 (0.0%) |
| 18 to 34 Years | 0 (0.0%) | 0 (0.0%) |
| 35 to 64 Years | 121 (3.3%) | 79 (2.1%) |
| 65 to 74 Years | 81 (12.9%) | 59 (8.5%) |
| 75 Years and over | 2 (0.7%) | 78 (21.3%) |
Disability Class: Self-Care Difficulty
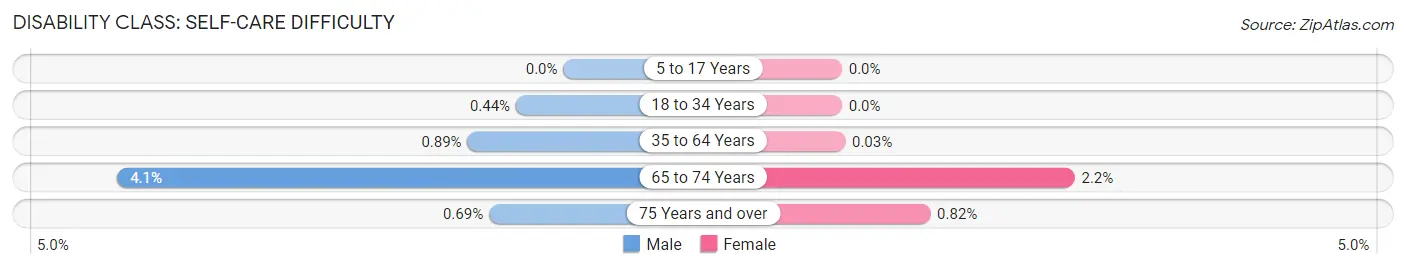
| Age Bracket | Male | Female |
| 5 to 17 Years | 0 (0.0%) | 0 (0.0%) |
| 18 to 34 Years | 6 (0.4%) | 0 (0.0%) |
| 35 to 64 Years | 33 (0.9%) | 1 (0.0%) |
| 65 to 74 Years | 26 (4.1%) | 15 (2.2%) |
| 75 Years and over | 2 (0.7%) | 3 (0.8%) |
Technology Access in Glasgow
Computing Device Access in Glasgow
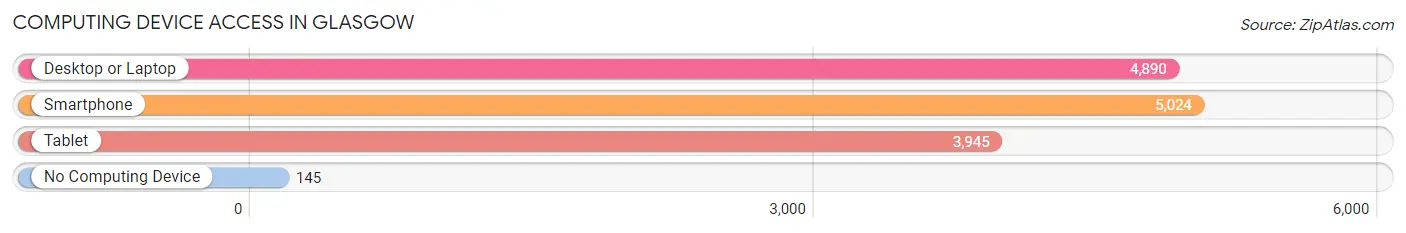
| Device Type | # Households | % Households |
| Desktop or Laptop | 4,890 | 90.0% |
| Smartphone | 5,024 | 92.4% |
| Tablet | 3,945 | 72.6% |
| No Computing Device | 145 | 2.7% |
| Total | 5,434 | 100.0% |
Internet Access in Glasgow
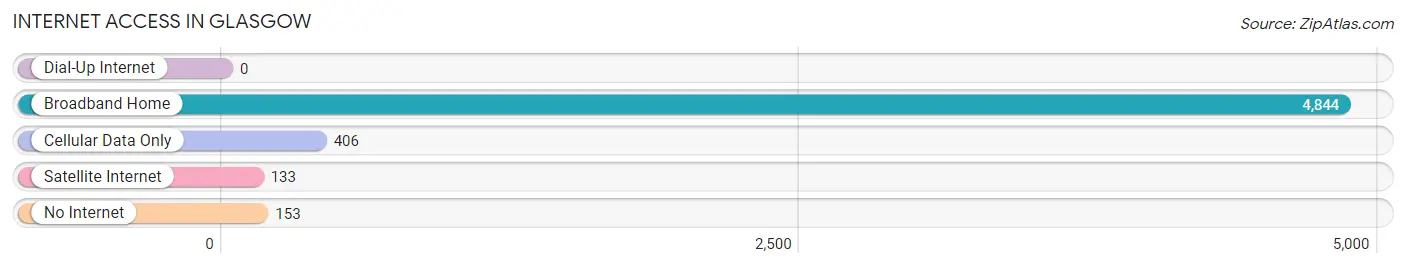
| Internet Type | # Households | % Households |
| Dial-Up Internet | 0 | 0.0% |
| Broadband Home | 4,844 | 89.1% |
| Cellular Data Only | 406 | 7.5% |
| Satellite Internet | 133 | 2.5% |
| No Internet | 153 | 2.8% |
| Total | 5,434 | 100.0% |
Glasgow Summary
Glasgow is the largest city in Scotland and the third largest city in the United Kingdom. It is located on the River Clyde in the country’s West Central Lowlands. Glasgow has a long and rich history, having been founded by the Romans in the first century AD. It has been an important port and trading centre for centuries, and is now a major cultural and economic hub.
History
Glasgow was founded by the Romans in the first century AD, and was known as the ‘fort of the Gaels’. It was an important trading centre for centuries, and was the site of the first transatlantic trade between Scotland and the American colonies in the 17th century. In the 18th century, Glasgow became a major industrial centre, with the development of the shipbuilding and engineering industries. The city was also a major centre of the British Empire, with many of its ships and goods being exported around the world.
In the 19th century, Glasgow was the second city of the British Empire, and was a major centre of the Industrial Revolution. The city was home to many of the world’s first public libraries, museums, and art galleries. It was also the birthplace of the modern trade union movement, and was the site of the first Labour Party conference in 1900.
Geography
Glasgow is located in the West Central Lowlands of Scotland, on the River Clyde. The city is surrounded by hills and mountains, and is close to the sea. The city is divided into two parts, the north and south sides, by the River Clyde. The city centre is located on the south side, and is home to many of the city’s major attractions, including the Glasgow Science Centre, the Glasgow School of Art, and the Glasgow Cathedral.
Economy
Glasgow is a major economic centre in the UK, and is home to a number of large companies, including the Royal Bank of Scotland, Standard Life, and the Glasgow Stock Exchange. The city is also home to a number of universities, including the University of Glasgow, the University of Strathclyde, and the Glasgow School of Art.
Glasgow is a major tourist destination, and is home to a number of attractions, including the Glasgow Science Centre, the Glasgow School of Art, and the Glasgow Cathedral. The city is also home to a number of festivals, including the Glasgow International Comedy Festival, the Glasgow Film Festival, and the Glasgow Jazz Festival.
Demographics
As of the 2011 census, the population of Glasgow was 593,245. The city is home to a diverse population, with people from a variety of backgrounds and cultures. The largest ethnic group in the city is White British, followed by Asian, Black, and Mixed. The city also has a large Irish population, and is home to a number of other ethnic groups, including Polish, Chinese, and Indian. The city is also home to a large number of students, with over 50,000 students enrolled in the city’s universities.
Common Questions
What is Per Capita Income in Glasgow?
Per Capita income in Glasgow is $41,452.
What is the Median Family Income in Glasgow?
Median Family Income in Glasgow is $109,668.
What is the Median Household income in Glasgow?
Median Household Income in Glasgow is $104,692.
What is Income or Wage Gap in Glasgow?
Income or Wage Gap in Glasgow is 13.8%.
Women in Glasgow earn 86.2 cents for every dollar earned by a man.
What is Inequality or Gini Index in Glasgow?
Inequality or Gini Index in Glasgow is 0.32.
What is the Total Population of Glasgow?
Total Population of Glasgow is 15,405.
What is the Total Male Population of Glasgow?
Total Male Population of Glasgow is 7,216.
What is the Total Female Population of Glasgow?
Total Female Population of Glasgow is 8,189.
What is the Ratio of Males per 100 Females in Glasgow?
There are 88.12 Males per 100 Females in Glasgow.
What is the Ratio of Females per 100 Males in Glasgow?
There are 113.48 Females per 100 Males in Glasgow.
What is the Median Population Age in Glasgow?
Median Population Age in Glasgow is 42.1 Years.
What is the Average Family Size in Glasgow
Average Family Size in Glasgow is 3.3 People.
What is the Average Household Size in Glasgow
Average Household Size in Glasgow is 2.8 People.
How Large is the Labor Force in Glasgow?
There are 9,170 People in the Labor Forcein in Glasgow.
What is the Percentage of People in the Labor Force in Glasgow?
71.9% of People are in the Labor Force in Glasgow.
What is the Unemployment Rate in Glasgow?
Unemployment Rate in Glasgow is 6.4%.