Bowie, MD Map & Demographics
Bowie Map
Bowie Overview
$57,492
PER CAPITA INCOME
$150,120
AVG FAMILY INCOME
$138,797
AVG HOUSEHOLD INCOME
3.1%
WAGE / INCOME GAP [ % ]
96.9¢/ $1
WAGE / INCOME GAP [ $ ]
$11,550
FAMILY INCOME DEFICIT
0.35
INEQUALITY / GINI INDEX
57,922
TOTAL POPULATION
27,333
MALE POPULATION
30,589
FEMALE POPULATION
89.36
MALES / 100 FEMALES
111.91
FEMALES / 100 MALES
43.2
MEDIAN AGE
3.3
AVG FAMILY SIZE
2.8
AVG HOUSEHOLD SIZE
34,295
LABOR FORCE [ PEOPLE ]
72.7%
PERCENT IN LABOR FORCE
5.1%
UNEMPLOYMENT RATE
Income in Bowie
Income Overview in Bowie
Per Capita Income in Bowie is $57,492, while median incomes of families and households are $150,120 and $138,797 respectively.
| Characteristic | Number | Measure |
| Per Capita Income | 57,922 | $57,492 |
| Median Family Income | 15,039 | $150,120 |
| Mean Family Income | 15,039 | $171,668 |
| Median Household Income | 20,875 | $138,797 |
| Mean Household Income | 20,875 | $156,749 |
| Income Deficit | 15,039 | $11,550 |
| Wage / Income Gap (%) | 57,922 | 3.14% |
| Wage / Income Gap ($) | 57,922 | 96.86¢ per $1 |
| Gini / Inequality Index | 57,922 | 0.35 |
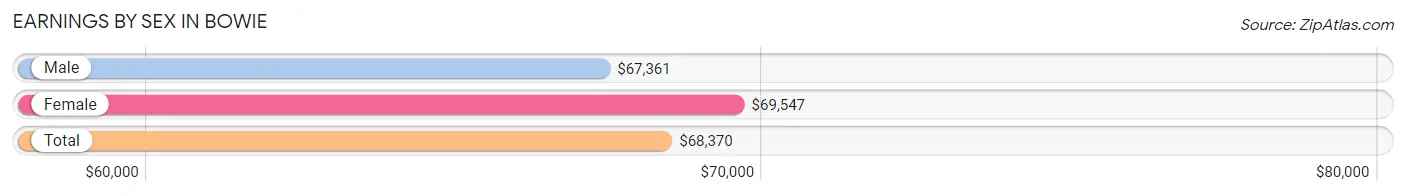
Earnings by Sex in Bowie
Average Earnings in Bowie are $68,370, $67,361 for men and $69,547 for women, a difference of 3.1%.
| Sex | Number | Average Earnings |
| Male | 17,155 (48.7%) | $67,361 |
| Female | 18,090 (51.3%) | $69,547 |
| Total | 35,245 (100.0%) | $68,370 |
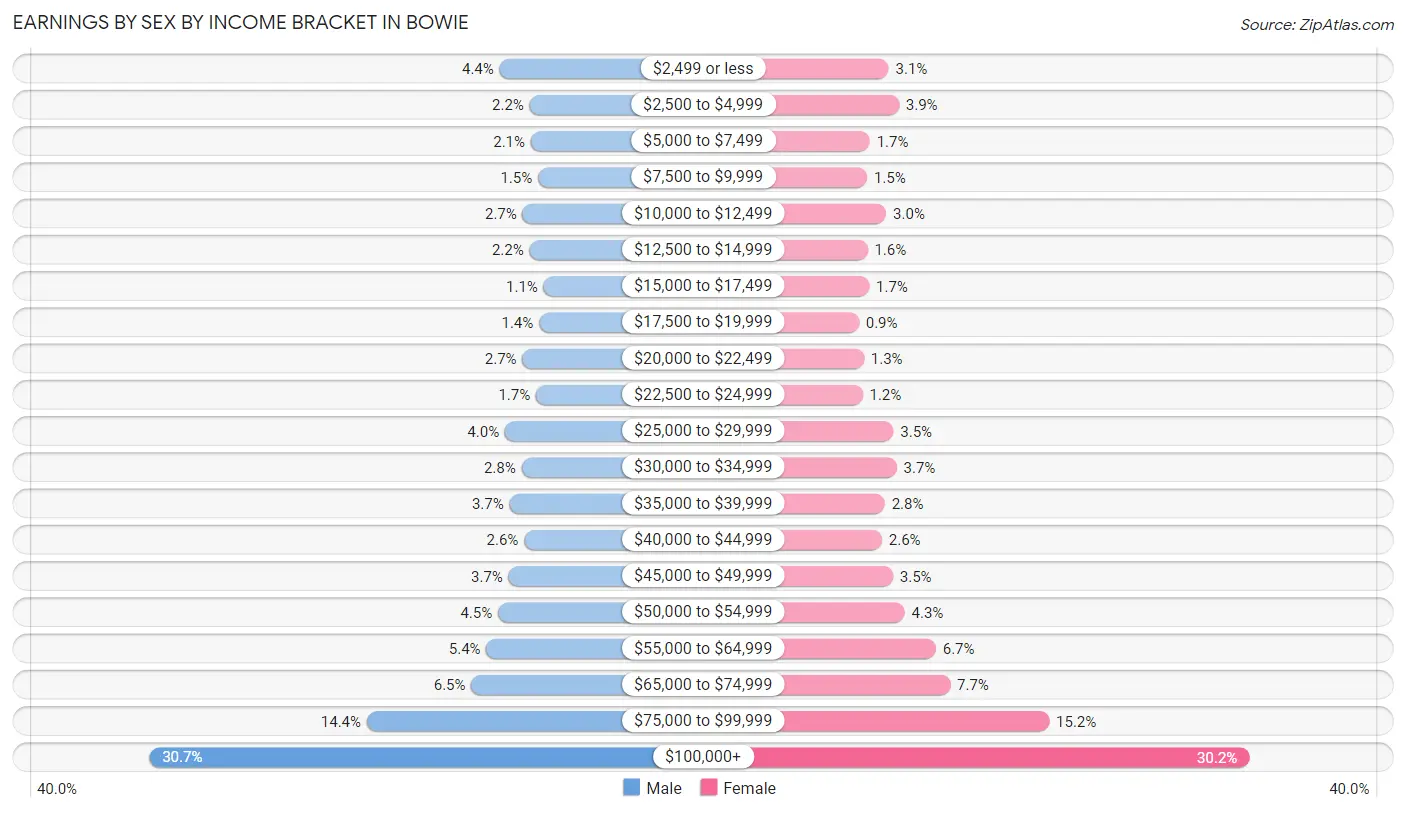
Earnings by Sex by Income Bracket in Bowie
The most common earnings brackets in Bowie are $100,000+ for men (5,260 | 30.7%) and $100,000+ for women (5,455 | 30.1%).
| Income | Male | Female |
| $2,499 or less | 754 (4.4%) | 567 (3.1%) |
| $2,500 to $4,999 | 368 (2.1%) | 705 (3.9%) |
| $5,000 to $7,499 | 354 (2.1%) | 311 (1.7%) |
| $7,500 to $9,999 | 261 (1.5%) | 274 (1.5%) |
| $10,000 to $12,499 | 459 (2.7%) | 533 (2.9%) |
| $12,500 to $14,999 | 370 (2.2%) | 280 (1.5%) |
| $15,000 to $17,499 | 188 (1.1%) | 303 (1.7%) |
| $17,500 to $19,999 | 247 (1.4%) | 163 (0.9%) |
| $20,000 to $22,499 | 462 (2.7%) | 231 (1.3%) |
| $22,500 to $24,999 | 286 (1.7%) | 214 (1.2%) |
| $25,000 to $29,999 | 687 (4.0%) | 632 (3.5%) |
| $30,000 to $34,999 | 473 (2.8%) | 674 (3.7%) |
| $35,000 to $39,999 | 628 (3.7%) | 513 (2.8%) |
| $40,000 to $44,999 | 440 (2.6%) | 476 (2.6%) |
| $45,000 to $49,999 | 638 (3.7%) | 625 (3.5%) |
| $50,000 to $54,999 | 776 (4.5%) | 784 (4.3%) |
| $55,000 to $64,999 | 924 (5.4%) | 1,207 (6.7%) |
| $65,000 to $74,999 | 1,118 (6.5%) | 1,401 (7.7%) |
| $75,000 to $99,999 | 2,462 (14.3%) | 2,742 (15.2%) |
| $100,000+ | 5,260 (30.7%) | 5,455 (30.1%) |
| Total | 17,155 (100.0%) | 18,090 (100.0%) |
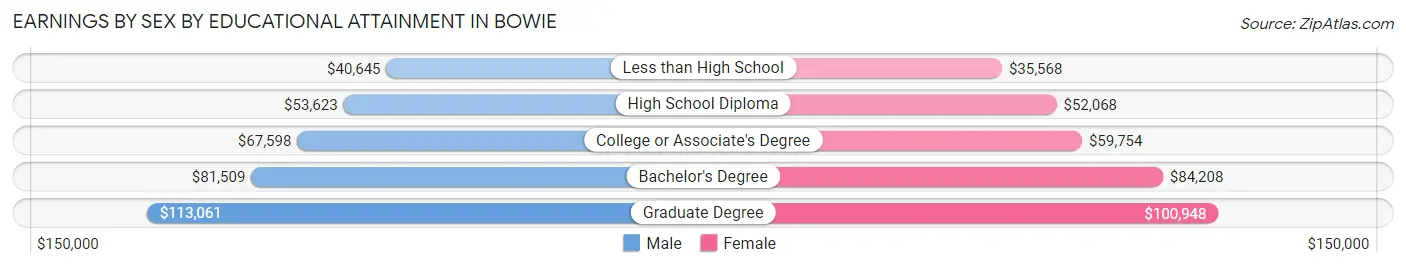
Earnings by Sex by Educational Attainment in Bowie
Average earnings in Bowie are $75,827 for men and $75,838 for women, a difference of 0.0%. Men with an educational attainment of graduate degree enjoy the highest average annual earnings of $113,061, while those with less than high school education earn the least with $40,645. Women with an educational attainment of graduate degree earn the most with the average annual earnings of $100,948, while those with less than high school education have the smallest earnings of $35,568.
| Educational Attainment | Male Income | Female Income |
| Less than High School | $40,645 | $35,568 |
| High School Diploma | $53,623 | $52,068 |
| College or Associate's Degree | $67,598 | $59,754 |
| Bachelor's Degree | $81,509 | $84,208 |
| Graduate Degree | $113,061 | $100,948 |
| Total | $75,827 | $75,838 |
Family Income in Bowie
Family Income Brackets in Bowie
According to the Bowie family income data, there are 4,421 families falling into the $200,000+ income range, which is the most common income bracket and makes up 29.4% of all families. Conversely, the less than $10,000 income bracket is the least frequent group with only 90 families (0.6%) belonging to this category.
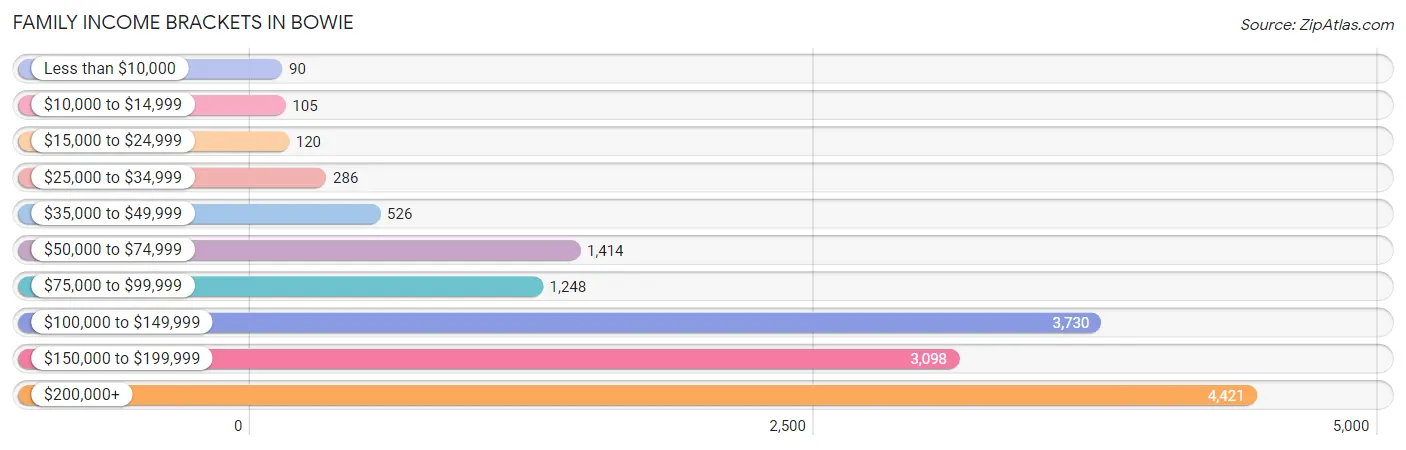
| Income Bracket | # Families | % Families |
| Less than $10,000 | 90 | 0.6% |
| $10,000 to $14,999 | 105 | 0.7% |
| $15,000 to $24,999 | 120 | 0.8% |
| $25,000 to $34,999 | 286 | 1.9% |
| $35,000 to $49,999 | 526 | 3.5% |
| $50,000 to $74,999 | 1,414 | 9.4% |
| $75,000 to $99,999 | 1,248 | 8.3% |
| $100,000 to $149,999 | 3,730 | 24.8% |
| $150,000 to $199,999 | 3,098 | 20.6% |
| $200,000+ | 4,421 | 29.4% |
Family Income by Famaliy Size in Bowie
7+ person families (270 | 1.8%) account for the highest median family income in Bowie with $226,667 per family, while 2-person families (6,239 | 41.5%) have the highest median income of $63,916 per family member.
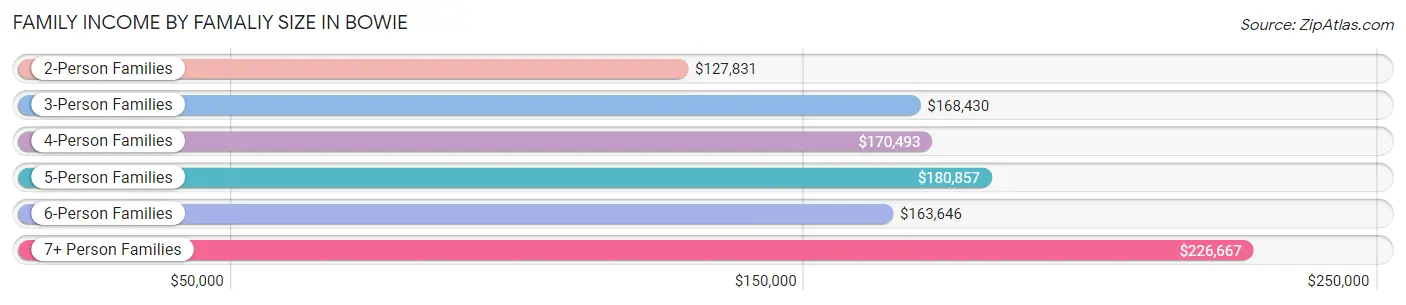
| Income Bracket | # Families | Median Income |
| 2-Person Families | 6,239 (41.5%) | $127,831 |
| 3-Person Families | 3,752 (24.9%) | $168,430 |
| 4-Person Families | 3,082 (20.5%) | $170,493 |
| 5-Person Families | 1,256 (8.4%) | $180,857 |
| 6-Person Families | 440 (2.9%) | $163,646 |
| 7+ Person Families | 270 (1.8%) | $226,667 |
| Total | 15,039 (100.0%) | $150,120 |
Family Income by Number of Earners in Bowie
The median family income in Bowie is $150,120, with families comprising 3+ earners (3,187) having the highest median family income of $198,794, while families with no earners (1,021) have the lowest median family income of $89,255, accounting for 21.2% and 6.8% of families, respectively.
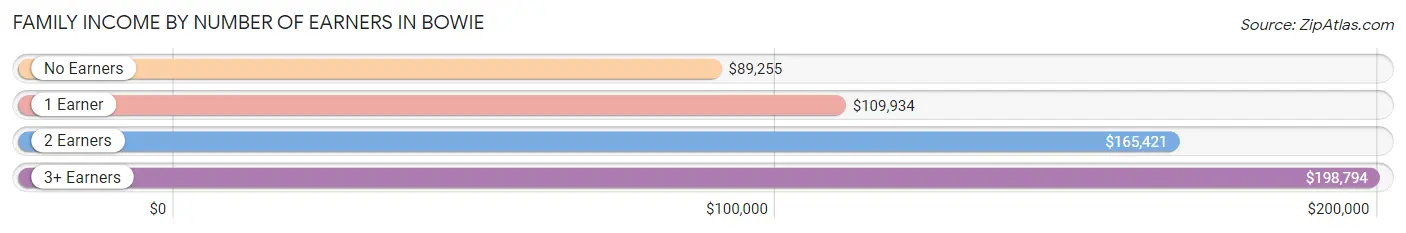
| Number of Earners | # Families | Median Income |
| No Earners | 1,021 (6.8%) | $89,255 |
| 1 Earner | 3,994 (26.6%) | $109,934 |
| 2 Earners | 6,837 (45.5%) | $165,421 |
| 3+ Earners | 3,187 (21.2%) | $198,794 |
| Total | 15,039 (100.0%) | $150,120 |
Household Income in Bowie
Household Income Brackets in Bowie
With 5,344 households falling in the category, the $200,000+ income range is the most frequent in Bowie, accounting for 25.6% of all households. In contrast, only 188 households (0.9%) fall into the $10,000 to $14,999 income bracket, making it the least populous group.
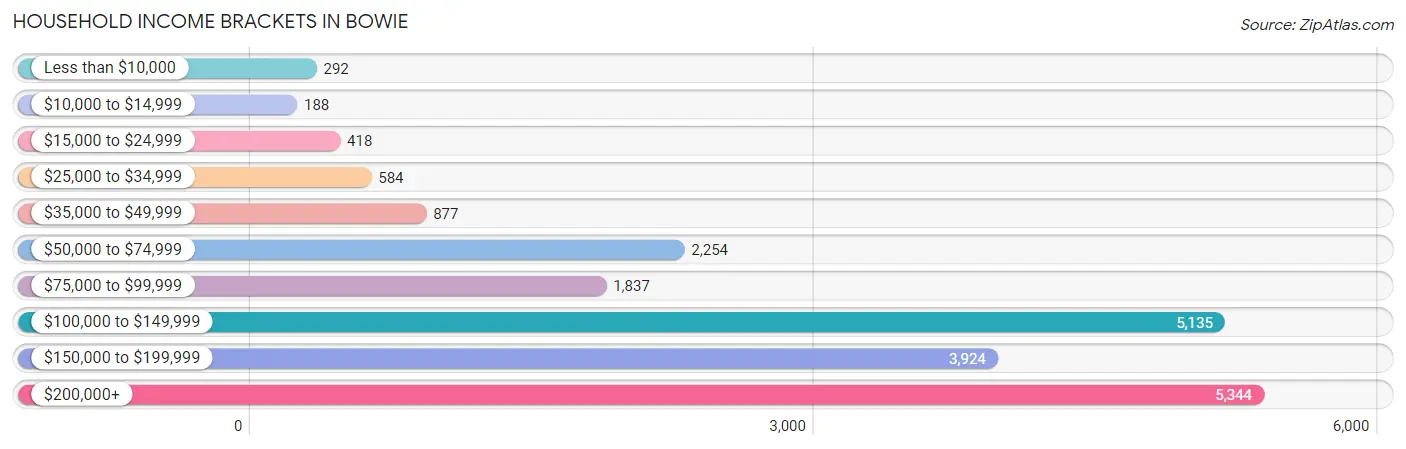
| Income Bracket | # Households | % Households |
| Less than $10,000 | 292 | 1.4% |
| $10,000 to $14,999 | 188 | 0.9% |
| $15,000 to $24,999 | 418 | 2.0% |
| $25,000 to $34,999 | 584 | 2.8% |
| $35,000 to $49,999 | 877 | 4.2% |
| $50,000 to $74,999 | 2,254 | 10.8% |
| $75,000 to $99,999 | 1,837 | 8.8% |
| $100,000 to $149,999 | 5,135 | 24.6% |
| $150,000 to $199,999 | 3,924 | 18.8% |
| $200,000+ | 5,344 | 25.6% |
Household Income by Householder Age in Bowie
The median household income in Bowie is $138,797, with the highest median household income of $161,690 found in the 45 to 64 years age bracket for the primary householder. A total of 10,498 households (50.3%) fall into this category. Meanwhile, the 65+ years age bracket for the primary householder has the lowest median household income of $88,328, with 4,999 households (23.9%) in this group.
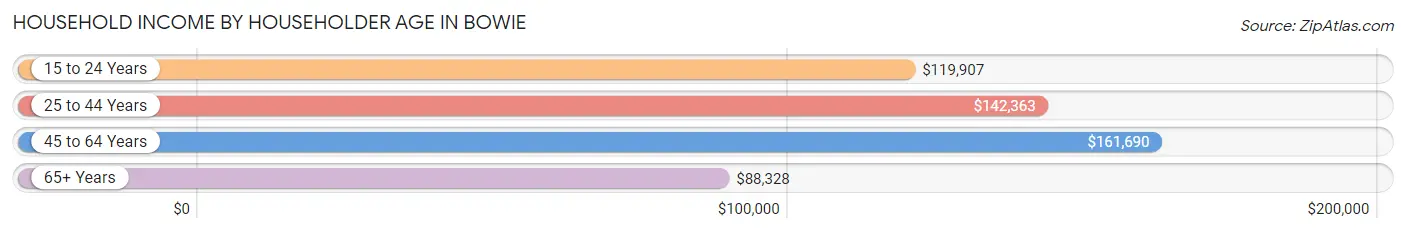
| Income Bracket | # Households | Median Income |
| 15 to 24 Years | 100 (0.5%) | $119,907 |
| 25 to 44 Years | 5,278 (25.3%) | $142,363 |
| 45 to 64 Years | 10,498 (50.3%) | $161,690 |
| 65+ Years | 4,999 (23.9%) | $88,328 |
| Total | 20,875 (100.0%) | $138,797 |
Poverty in Bowie
Income Below Poverty by Sex and Age in Bowie
With 3.4% poverty level for males and 3.5% for females among the residents of Bowie, 5 year old males and 12 to 14 year old females are the most vulnerable to poverty, with 24 males (8.8%) and 128 females (13.7%) in their respective age groups living below the poverty level.
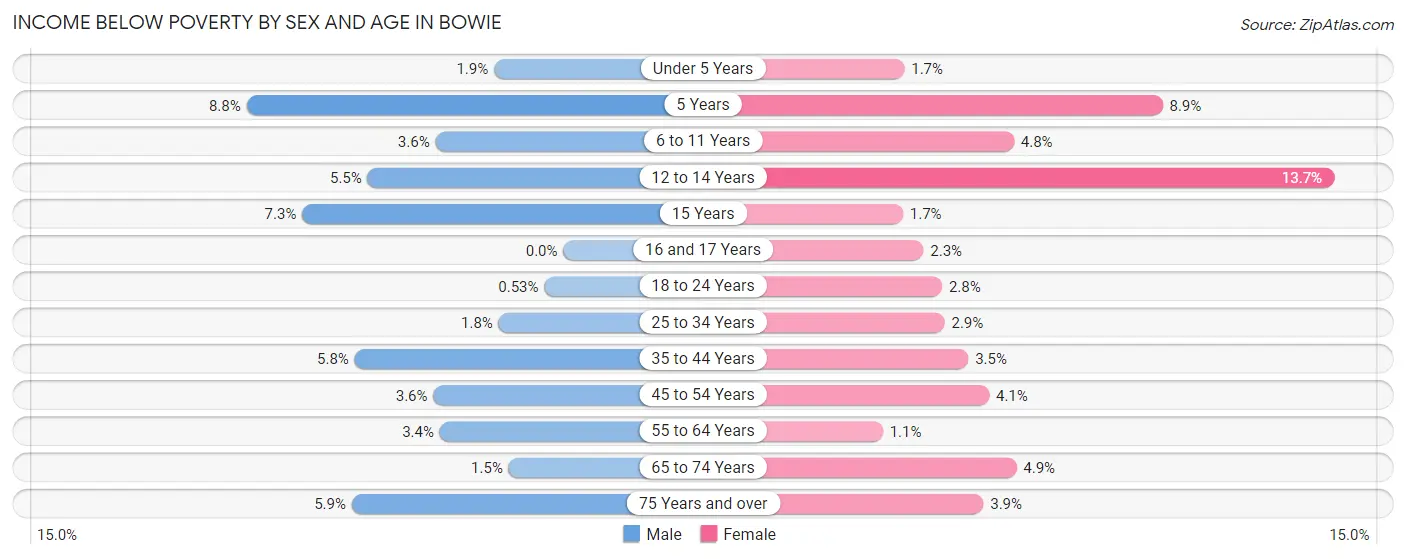
| Age Bracket | Male | Female |
| Under 5 Years | 29 (1.9%) | 23 (1.7%) |
| 5 Years | 24 (8.8%) | 26 (8.9%) |
| 6 to 11 Years | 64 (3.6%) | 97 (4.8%) |
| 12 to 14 Years | 68 (5.4%) | 128 (13.7%) |
| 15 Years | 53 (7.3%) | 6 (1.7%) |
| 16 and 17 Years | 0 (0.0%) | 23 (2.3%) |
| 18 to 24 Years | 11 (0.5%) | 51 (2.8%) |
| 25 to 34 Years | 61 (1.8%) | 94 (2.9%) |
| 35 to 44 Years | 196 (5.8%) | 134 (3.5%) |
| 45 to 54 Years | 143 (3.6%) | 199 (4.1%) |
| 55 to 64 Years | 162 (3.4%) | 64 (1.1%) |
| 65 to 74 Years | 36 (1.5%) | 136 (4.9%) |
| 75 Years and over | 65 (5.9%) | 84 (3.9%) |
| Total | 912 (3.4%) | 1,065 (3.5%) |
Income Above Poverty by Sex and Age in Bowie
According to the poverty statistics in Bowie, males aged 16 and 17 years and females aged 55 to 64 years are the age groups that are most secure financially, with 100.0% of males and 98.9% of females in these age groups living above the poverty line.
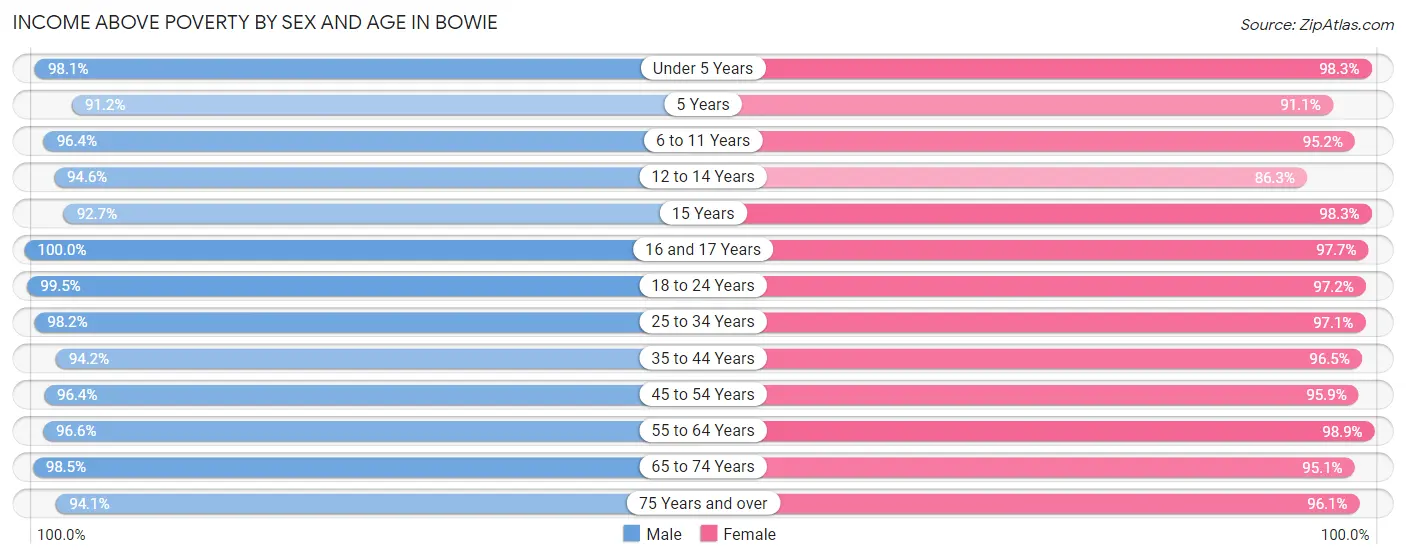
| Age Bracket | Male | Female |
| Under 5 Years | 1,474 (98.1%) | 1,301 (98.3%) |
| 5 Years | 248 (91.2%) | 265 (91.1%) |
| 6 to 11 Years | 1,735 (96.4%) | 1,928 (95.2%) |
| 12 to 14 Years | 1,179 (94.6%) | 806 (86.3%) |
| 15 Years | 676 (92.7%) | 347 (98.3%) |
| 16 and 17 Years | 585 (100.0%) | 988 (97.7%) |
| 18 to 24 Years | 2,072 (99.5%) | 1,779 (97.2%) |
| 25 to 34 Years | 3,322 (98.2%) | 3,189 (97.1%) |
| 35 to 44 Years | 3,180 (94.2%) | 3,678 (96.5%) |
| 45 to 54 Years | 3,802 (96.4%) | 4,652 (95.9%) |
| 55 to 64 Years | 4,543 (96.6%) | 5,554 (98.9%) |
| 65 to 74 Years | 2,334 (98.5%) | 2,664 (95.1%) |
| 75 Years and over | 1,039 (94.1%) | 2,046 (96.1%) |
| Total | 26,189 (96.6%) | 29,197 (96.5%) |
Income Below Poverty Among Married-Couple Families in Bowie
The poverty statistics for married-couple families in Bowie show that 1.3% or 136 of the total 10,820 families live below the poverty line. Families with 3 or 4 children have the highest poverty rate of 6.3%, comprising of 44 families. On the other hand, families with 1 or 2 children have the lowest poverty rate of 0.0%, which includes 0 families.
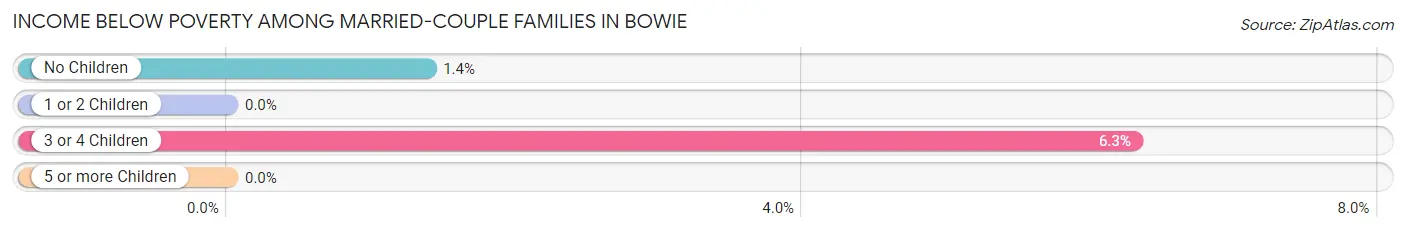
| Children | Above Poverty | Below Poverty |
| No Children | 6,585 (98.6%) | 92 (1.4%) |
| 1 or 2 Children | 3,366 (100.0%) | 0 (0.0%) |
| 3 or 4 Children | 654 (93.7%) | 44 (6.3%) |
| 5 or more Children | 79 (100.0%) | 0 (0.0%) |
| Total | 10,684 (98.7%) | 136 (1.3%) |
Income Below Poverty Among Single-Parent Households in Bowie
According to the poverty data in Bowie, 4.1% or 36 single-father households and 4.8% or 159 single-mother households are living below the poverty line. Among single-father households, those with 1 or 2 children have the highest poverty rate, with 31 households (7.4%) experiencing poverty. Likewise, among single-mother households, those with 5 or more children have the highest poverty rate, with 18 households (100.0%) falling below the poverty line.
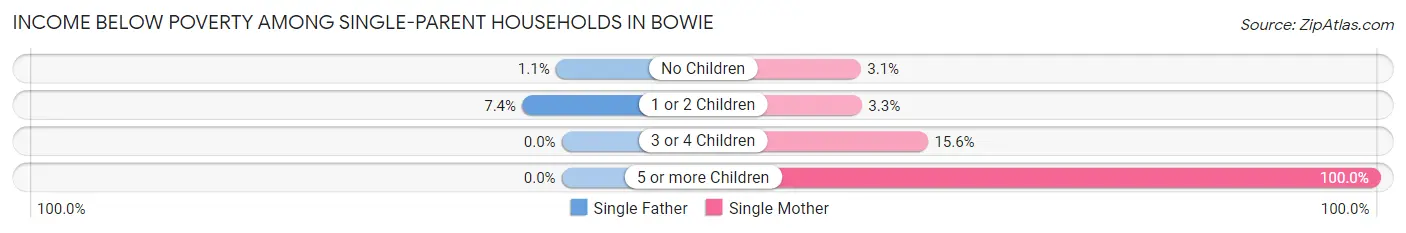
| Children | Single Father | Single Mother |
| No Children | 5 (1.1%) | 52 (3.1%) |
| 1 or 2 Children | 31 (7.4%) | 45 (3.3%) |
| 3 or 4 Children | 0 (0.0%) | 44 (15.6%) |
| 5 or more Children | 0 (0.0%) | 18 (100.0%) |
| Total | 36 (4.1%) | 159 (4.8%) |
Income Below Poverty Among Married-Couple vs Single-Parent Households in Bowie
The poverty data for Bowie shows that 136 of the married-couple family households (1.3%) and 195 of the single-parent households (4.6%) are living below the poverty level. Within the married-couple family households, those with 3 or 4 children have the highest poverty rate, with 44 households (6.3%) falling below the poverty line. Among the single-parent households, those with 5 or more children have the highest poverty rate, with 18 household (100.0%) living below poverty.
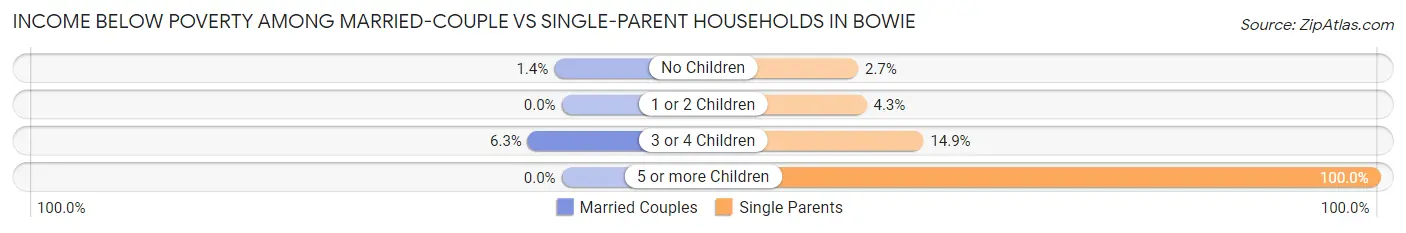
| Children | Married-Couple Families | Single-Parent Households |
| No Children | 92 (1.4%) | 57 (2.7%) |
| 1 or 2 Children | 0 (0.0%) | 76 (4.3%) |
| 3 or 4 Children | 44 (6.3%) | 44 (14.9%) |
| 5 or more Children | 0 (0.0%) | 18 (100.0%) |
| Total | 136 (1.3%) | 195 (4.6%) |
Race in Bowie
The most populous races in Bowie are Black / African American (33,095 | 57.1%), White / Caucasian (16,674 | 28.8%), and Hispanic or Latino (4,761 | 8.2%).
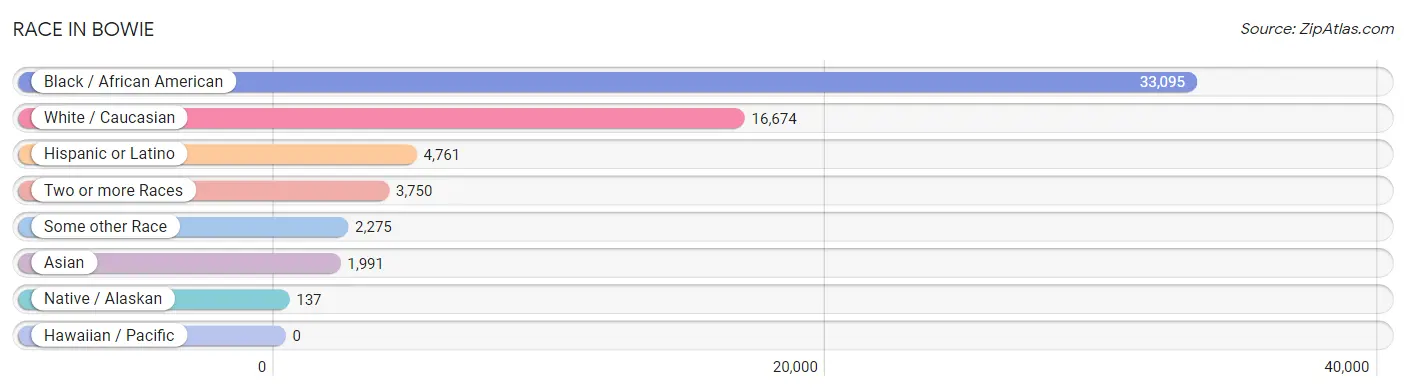
| Race | # Population | % Population |
| Asian | 1,991 | 3.4% |
| Black / African American | 33,095 | 57.1% |
| Hawaiian / Pacific | 0 | 0.0% |
| Hispanic or Latino | 4,761 | 8.2% |
| Native / Alaskan | 137 | 0.2% |
| White / Caucasian | 16,674 | 28.8% |
| Two or more Races | 3,750 | 6.5% |
| Some other Race | 2,275 | 3.9% |
| Total | 57,922 | 100.0% |
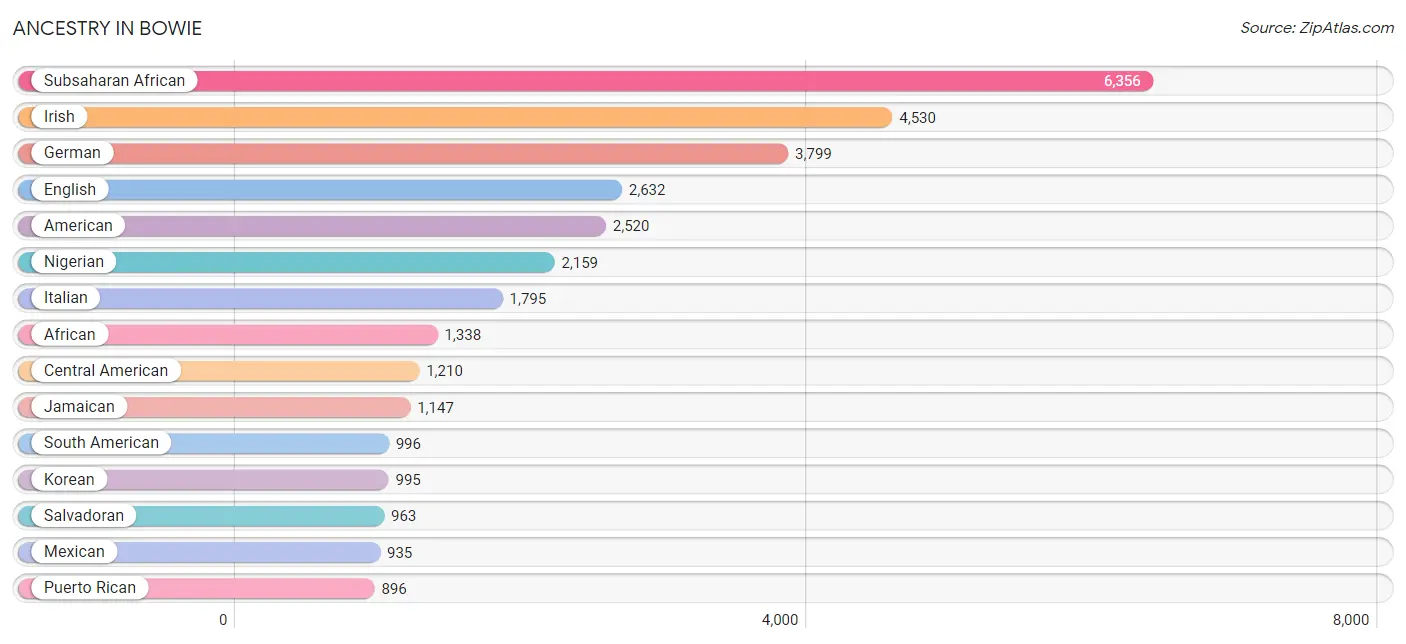
Ancestry in Bowie
The most populous ancestries reported in Bowie are Subsaharan African (6,356 | 11.0%), Irish (4,530 | 7.8%), German (3,799 | 6.6%), English (2,632 | 4.5%), and American (2,520 | 4.3%), together accounting for 34.2% of all Bowie residents.
| Ancestry | # Population | % Population |
| Afghan | 13 | 0.0% |
| African | 1,338 | 2.3% |
| Albanian | 73 | 0.1% |
| American | 2,520 | 4.3% |
| Apache | 12 | 0.0% |
| Arab | 319 | 0.5% |
| Argentinean | 233 | 0.4% |
| Armenian | 126 | 0.2% |
| Austrian | 92 | 0.2% |
| Bahamian | 36 | 0.1% |
| Bangladeshi | 37 | 0.1% |
| Barbadian | 61 | 0.1% |
| Belgian | 7 | 0.0% |
| Belizean | 9 | 0.0% |
| Bhutanese | 85 | 0.2% |
| Blackfeet | 6 | 0.0% |
| Bolivian | 197 | 0.3% |
| British | 173 | 0.3% |
| British West Indian | 188 | 0.3% |
| Bulgarian | 16 | 0.0% |
| Burmese | 180 | 0.3% |
| Canadian | 28 | 0.1% |
| Cape Verdean | 69 | 0.1% |
| Carpatho Rusyn | 20 | 0.0% |
| Celtic | 18 | 0.0% |
| Central American | 1,210 | 2.1% |
| Central American Indian | 37 | 0.1% |
| Cherokee | 317 | 0.5% |
| Chilean | 83 | 0.1% |
| Chinese | 13 | 0.0% |
| Chippewa | 25 | 0.0% |
| Choctaw | 33 | 0.1% |
| Colombian | 250 | 0.4% |
| Costa Rican | 21 | 0.0% |
| Croatian | 22 | 0.0% |
| Cuban | 231 | 0.4% |
| Czech | 70 | 0.1% |
| Czechoslovakian | 33 | 0.1% |
| Danish | 44 | 0.1% |
| Dominican | 341 | 0.6% |
| Dutch | 147 | 0.3% |
| Eastern European | 142 | 0.3% |
| Ecuadorian | 86 | 0.2% |
| Egyptian | 74 | 0.1% |
| English | 2,632 | 4.5% |
| Ethiopian | 261 | 0.4% |
| European | 793 | 1.4% |
| Finnish | 18 | 0.0% |
| French | 393 | 0.7% |
| French Canadian | 253 | 0.4% |
| German | 3,799 | 6.6% |
| German Russian | 18 | 0.0% |
| Ghanaian | 243 | 0.4% |
| Greek | 108 | 0.2% |
| Guatemalan | 75 | 0.1% |
| Guyanese | 512 | 0.9% |
| Haitian | 235 | 0.4% |
| Honduran | 20 | 0.0% |
| Hungarian | 102 | 0.2% |
| Indian (Asian) | 290 | 0.5% |
| Iranian | 107 | 0.2% |
| Iraqi | 9 | 0.0% |
| Irish | 4,530 | 7.8% |
| Italian | 1,795 | 3.1% |
| Jamaican | 1,147 | 2.0% |
| Kenyan | 18 | 0.0% |
| Korean | 995 | 1.7% |
| Lebanese | 32 | 0.1% |
| Liberian | 214 | 0.4% |
| Lithuanian | 186 | 0.3% |
| Lumbee | 10 | 0.0% |
| Malaysian | 51 | 0.1% |
| Maltese | 7 | 0.0% |
| Mexican | 935 | 1.6% |
| Mexican American Indian | 18 | 0.0% |
| Native Hawaiian | 11 | 0.0% |
| Nigerian | 2,159 | 3.7% |
| Northern European | 67 | 0.1% |
| Norwegian | 228 | 0.4% |
| Okinawan | 7 | 0.0% |
| Pakistani | 29 | 0.1% |
| Palestinian | 96 | 0.2% |
| Panamanian | 131 | 0.2% |
| Peruvian | 87 | 0.2% |
| Polish | 809 | 1.4% |
| Portuguese | 84 | 0.2% |
| Puerto Rican | 896 | 1.5% |
| Romanian | 17 | 0.0% |
| Russian | 177 | 0.3% |
| Salvadoran | 963 | 1.7% |
| Scandinavian | 27 | 0.1% |
| Scotch-Irish | 339 | 0.6% |
| Scottish | 580 | 1.0% |
| Senegalese | 45 | 0.1% |
| Serbian | 11 | 0.0% |
| Sierra Leonean | 467 | 0.8% |
| Slavic | 11 | 0.0% |
| Slovak | 123 | 0.2% |
| Slovene | 6 | 0.0% |
| South African | 41 | 0.1% |
| South American | 996 | 1.7% |
| South American Indian | 40 | 0.1% |
| Spaniard | 73 | 0.1% |
| Spanish | 31 | 0.1% |
| Sri Lankan | 141 | 0.2% |
| Subsaharan African | 6,356 | 11.0% |
| Swedish | 200 | 0.4% |
| Swiss | 18 | 0.0% |
| Syrian | 8 | 0.0% |
| Thai | 651 | 1.1% |
| Trinidadian and Tobagonian | 341 | 0.6% |
| Ukrainian | 56 | 0.1% |
| Venezuelan | 50 | 0.1% |
| Welsh | 252 | 0.4% |
| West Indian | 389 | 0.7% |
| Yugoslavian | 8 | 0.0% |
| Yup'ik | 9 | 0.0% | View All 117 Rows |
Immigrants in Bowie
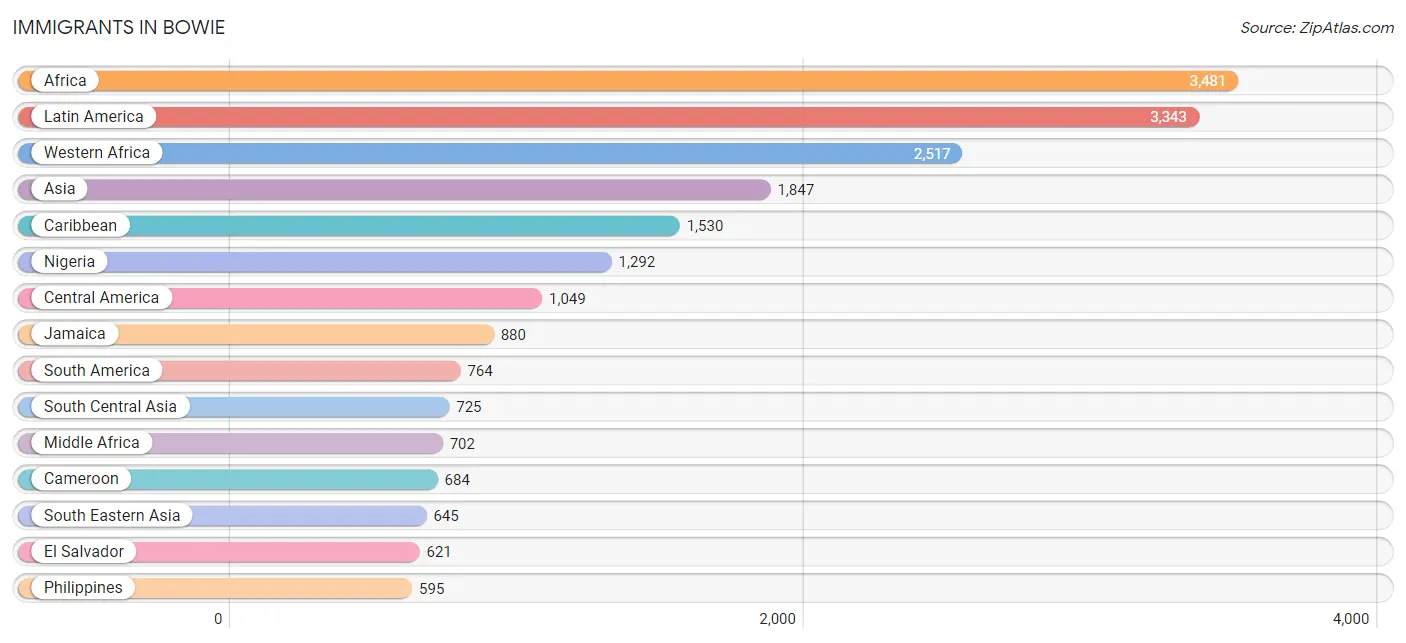
The most numerous immigrant groups reported in Bowie came from Africa (3,481 | 6.0%), Latin America (3,343 | 5.8%), Western Africa (2,517 | 4.3%), Asia (1,847 | 3.2%), and Caribbean (1,530 | 2.6%), together accounting for 22.0% of all Bowie residents.
| Immigration Origin | # Population | % Population |
| Africa | 3,481 | 6.0% |
| Argentina | 6 | 0.0% |
| Asia | 1,847 | 3.2% |
| Bangladesh | 44 | 0.1% |
| Barbados | 145 | 0.3% |
| Bolivia | 105 | 0.2% |
| Bulgaria | 16 | 0.0% |
| Cameroon | 684 | 1.2% |
| Canada | 58 | 0.1% |
| Caribbean | 1,530 | 2.6% |
| Central America | 1,049 | 1.8% |
| Chile | 18 | 0.0% |
| China | 147 | 0.3% |
| Colombia | 128 | 0.2% |
| Congo | 18 | 0.0% |
| Cuba | 55 | 0.1% |
| Dominica | 3 | 0.0% |
| Dominican Republic | 204 | 0.4% |
| Eastern Africa | 128 | 0.2% |
| Eastern Asia | 311 | 0.5% |
| Eastern Europe | 78 | 0.1% |
| Ecuador | 60 | 0.1% |
| Egypt | 45 | 0.1% |
| El Salvador | 621 | 1.1% |
| England | 105 | 0.2% |
| Ethiopia | 82 | 0.1% |
| Europe | 488 | 0.8% |
| Germany | 130 | 0.2% |
| Ghana | 183 | 0.3% |
| Grenada | 34 | 0.1% |
| Guatemala | 34 | 0.1% |
| Guyana | 381 | 0.7% |
| Haiti | 14 | 0.0% |
| Hong Kong | 33 | 0.1% |
| Hungary | 7 | 0.0% |
| India | 307 | 0.5% |
| Iran | 72 | 0.1% |
| Ireland | 31 | 0.1% |
| Israel | 130 | 0.2% |
| Italy | 30 | 0.1% |
| Jamaica | 880 | 1.5% |
| Japan | 33 | 0.1% |
| Jordan | 15 | 0.0% |
| Kenya | 8 | 0.0% |
| Korea | 131 | 0.2% |
| Laos | 11 | 0.0% |
| Latin America | 3,343 | 5.8% |
| Liberia | 315 | 0.5% |
| Mexico | 352 | 0.6% |
| Middle Africa | 702 | 1.2% |
| Nepal | 9 | 0.0% |
| Nigeria | 1,292 | 2.2% |
| Northern Africa | 45 | 0.1% |
| Northern Europe | 238 | 0.4% |
| Pakistan | 293 | 0.5% |
| Panama | 42 | 0.1% |
| Peru | 22 | 0.0% |
| Philippines | 595 | 1.0% |
| Russia | 23 | 0.0% |
| Scotland | 8 | 0.0% |
| Senegal | 39 | 0.1% |
| Sierra Leone | 475 | 0.8% |
| Singapore | 15 | 0.0% |
| South Africa | 41 | 0.1% |
| South America | 764 | 1.3% |
| South Central Asia | 725 | 1.3% |
| South Eastern Asia | 645 | 1.1% |
| Southern Europe | 42 | 0.1% |
| Spain | 12 | 0.0% |
| Taiwan | 23 | 0.0% |
| Thailand | 6 | 0.0% |
| Trinidad and Tobago | 114 | 0.2% |
| Venezuela | 8 | 0.0% |
| Vietnam | 18 | 0.0% |
| Western Africa | 2,517 | 4.3% |
| Western Asia | 145 | 0.3% |
| Western Europe | 130 | 0.2% | View All 77 Rows |
Sex and Age in Bowie
Sex and Age in Bowie
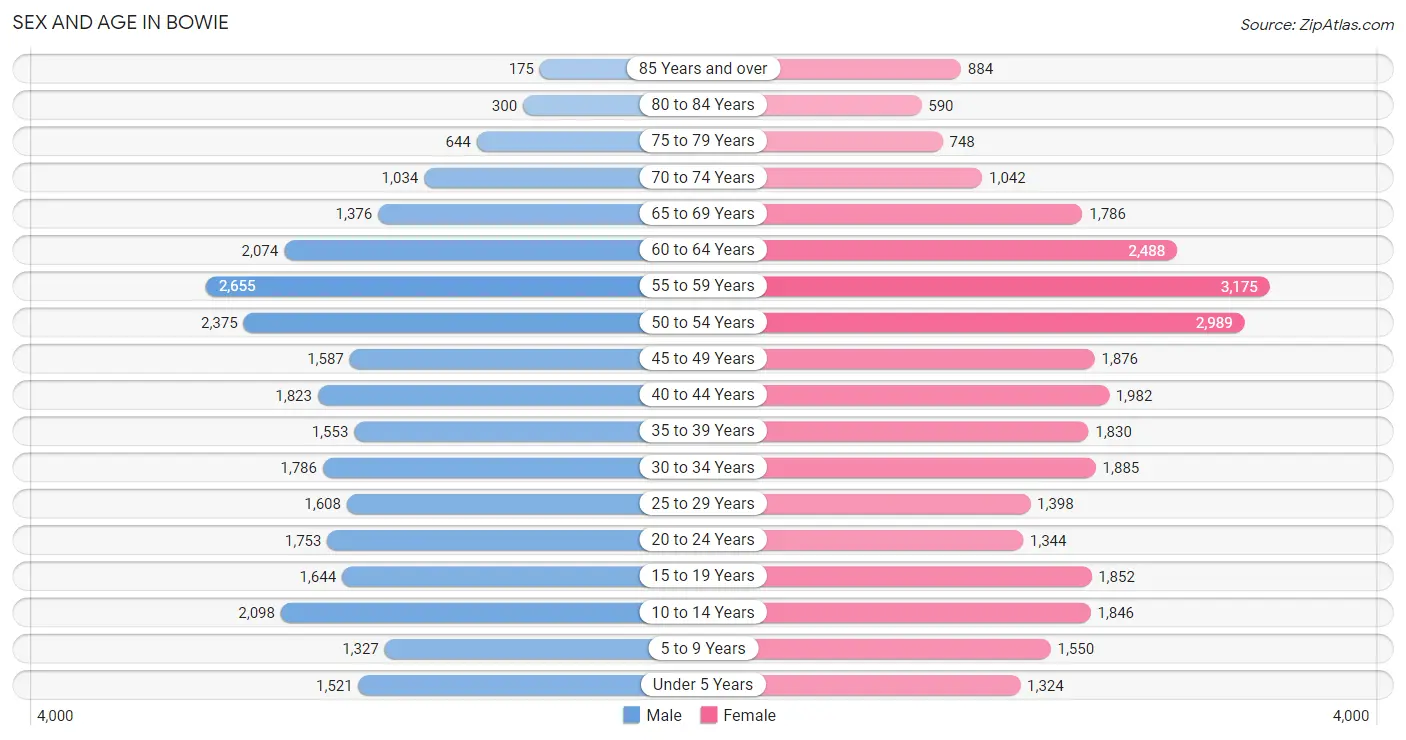
The most populous age groups in Bowie are 55 to 59 Years (2,655 | 9.7%) for men and 55 to 59 Years (3,175 | 10.4%) for women.
| Age Bracket | Male | Female |
| Under 5 Years | 1,521 (5.6%) | 1,324 (4.3%) |
| 5 to 9 Years | 1,327 (4.9%) | 1,550 (5.1%) |
| 10 to 14 Years | 2,098 (7.7%) | 1,846 (6.0%) |
| 15 to 19 Years | 1,644 (6.0%) | 1,852 (6.0%) |
| 20 to 24 Years | 1,753 (6.4%) | 1,344 (4.4%) |
| 25 to 29 Years | 1,608 (5.9%) | 1,398 (4.6%) |
| 30 to 34 Years | 1,786 (6.5%) | 1,885 (6.2%) |
| 35 to 39 Years | 1,553 (5.7%) | 1,830 (6.0%) |
| 40 to 44 Years | 1,823 (6.7%) | 1,982 (6.5%) |
| 45 to 49 Years | 1,587 (5.8%) | 1,876 (6.1%) |
| 50 to 54 Years | 2,375 (8.7%) | 2,989 (9.8%) |
| 55 to 59 Years | 2,655 (9.7%) | 3,175 (10.4%) |
| 60 to 64 Years | 2,074 (7.6%) | 2,488 (8.1%) |
| 65 to 69 Years | 1,376 (5.0%) | 1,786 (5.8%) |
| 70 to 74 Years | 1,034 (3.8%) | 1,042 (3.4%) |
| 75 to 79 Years | 644 (2.4%) | 748 (2.5%) |
| 80 to 84 Years | 300 (1.1%) | 590 (1.9%) |
| 85 Years and over | 175 (0.6%) | 884 (2.9%) |
| Total | 27,333 (100.0%) | 30,589 (100.0%) |
Families and Households in Bowie
Median Family Size in Bowie
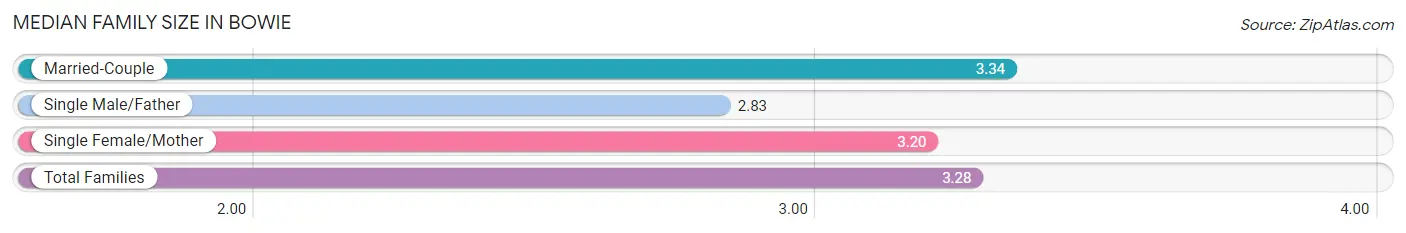
The median family size in Bowie is 3.28 persons per family, with married-couple families (10,820 | 72.0%) accounting for the largest median family size of 3.34 persons per family. On the other hand, single male/father families (879 | 5.8%) represent the smallest median family size with 2.83 persons per family.
| Family Type | # Families | Family Size |
| Married-Couple | 10,820 (72.0%) | 3.34 |
| Single Male/Father | 879 (5.8%) | 2.83 |
| Single Female/Mother | 3,340 (22.2%) | 3.20 |
| Total Families | 15,039 (100.0%) | 3.28 |
Median Household Size in Bowie
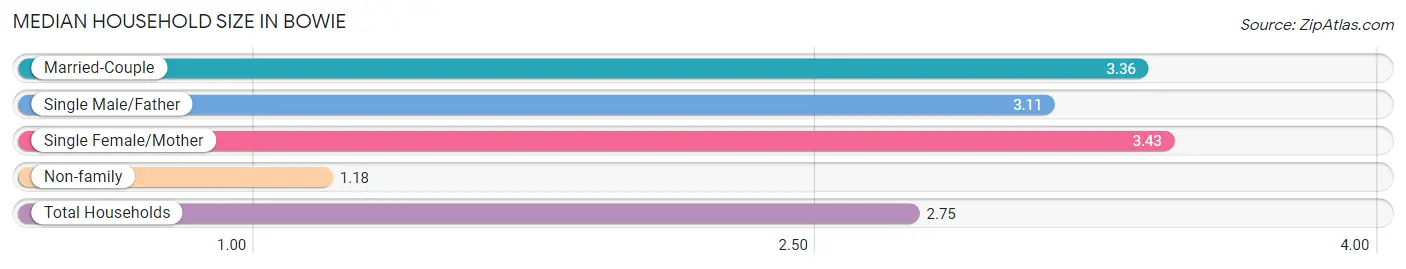
The median household size in Bowie is 2.75 persons per household, with single female/mother households (3,340 | 16.0%) accounting for the largest median household size of 3.43 persons per household. non-family households (5,836 | 28.0%) represent the smallest median household size with 1.18 persons per household.
| Household Type | # Households | Household Size |
| Married-Couple | 10,820 (51.8%) | 3.36 |
| Single Male/Father | 879 (4.2%) | 3.11 |
| Single Female/Mother | 3,340 (16.0%) | 3.43 |
| Non-family | 5,836 (28.0%) | 1.18 |
| Total Households | 20,875 (100.0%) | 2.75 |
Household Size by Marriage Status in Bowie
Out of a total of 20,875 households in Bowie, 15,039 (72.0%) are family households, while 5,836 (28.0%) are nonfamily households. The most numerous type of family households are 2-person households, comprising 5,826, and the most common type of nonfamily households are 1-person households, comprising 4,995.
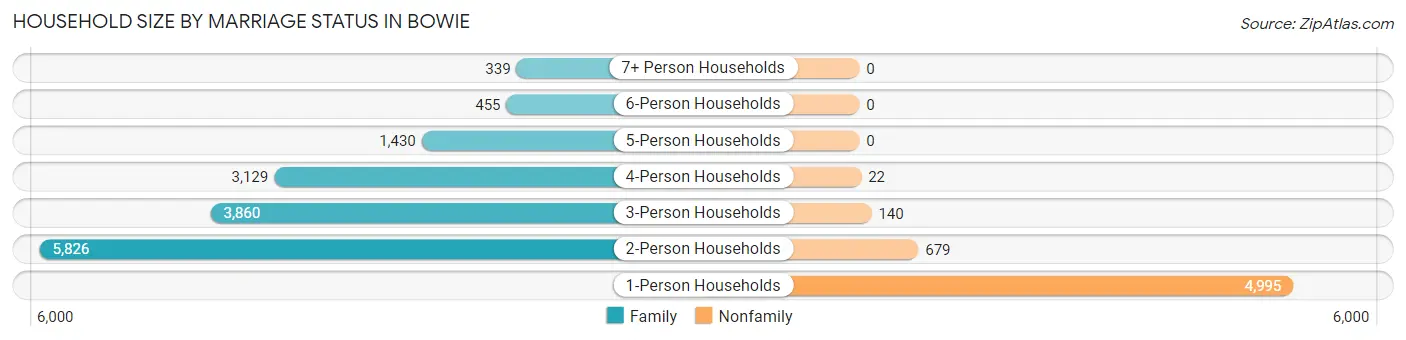
| Household Size | Family Households | Nonfamily Households |
| 1-Person Households | - | 4,995 (23.9%) |
| 2-Person Households | 5,826 (27.9%) | 679 (3.3%) |
| 3-Person Households | 3,860 (18.5%) | 140 (0.7%) |
| 4-Person Households | 3,129 (15.0%) | 22 (0.1%) |
| 5-Person Households | 1,430 (6.9%) | 0 (0.0%) |
| 6-Person Households | 455 (2.2%) | 0 (0.0%) |
| 7+ Person Households | 339 (1.6%) | 0 (0.0%) |
| Total | 15,039 (72.0%) | 5,836 (28.0%) |
Female Fertility in Bowie
Fertility by Age in Bowie
Average fertility rate in Bowie is 50.0 births per 1,000 women. Women in the age bracket of 20 to 34 years have the highest fertility rate with 95.0 births per 1,000 women. Women in the age bracket of 20 to 34 years acount for 69.1% of all women with births.
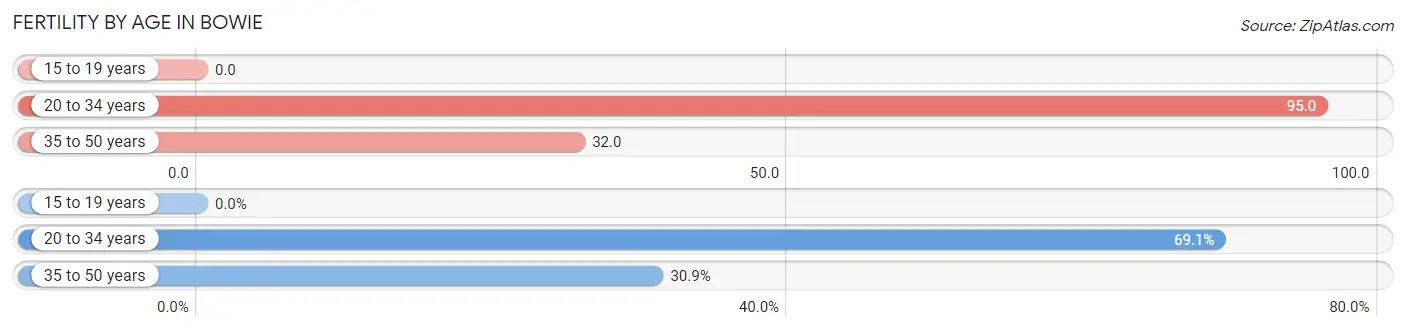
| Age Bracket | Women with Births | Births / 1,000 Women |
| 15 to 19 years | 0 (0.0%) | 0.0 |
| 20 to 34 years | 438 (69.1%) | 95.0 |
| 35 to 50 years | 196 (30.9%) | 32.0 |
| Total | 634 (100.0%) | 50.0 |
Fertility by Age by Marriage Status in Bowie
68.6% of women with births (634) in Bowie are married. The highest percentage of unmarried women with births falls into 20 to 34 years age bracket with 41.5% of them unmarried at the time of birth, while the lowest percentage of unmarried women with births belong to 35 to 50 years age bracket with 8.7% of them unmarried.
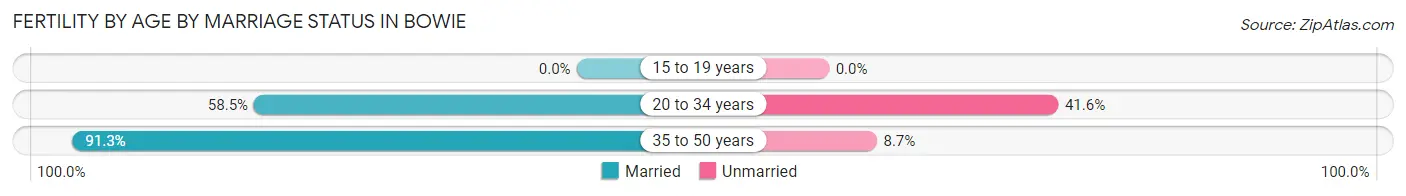
| Age Bracket | Married | Unmarried |
| 15 to 19 years | 0 (0.0%) | 0 (0.0%) |
| 20 to 34 years | 256 (58.5%) | 182 (41.5%) |
| 35 to 50 years | 179 (91.3%) | 17 (8.7%) |
| Total | 435 (68.6%) | 199 (31.4%) |
Fertility by Education in Bowie
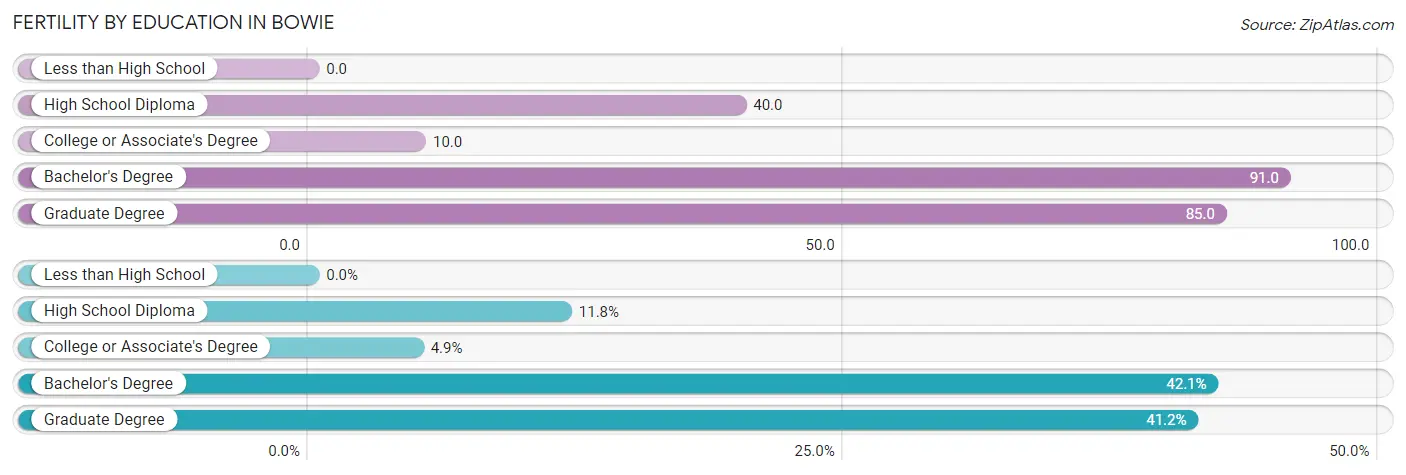
| Educational Attainment | Women with Births | Births / 1,000 Women |
| Less than High School | 0 (0.0%) | 0.0 |
| High School Diploma | 75 (11.8%) | 40.0 |
| College or Associate's Degree | 31 (4.9%) | 10.0 |
| Bachelor's Degree | 267 (42.1%) | 91.0 |
| Graduate Degree | 261 (41.2%) | 85.0 |
| Total | 634 (100.0%) | 50.0 |
Fertility by Education by Marriage Status in Bowie
31.4% of women with births in Bowie are unmarried. Women with the educational attainment of graduate degree are most likely to be married with 94.3% of them married at childbirth, while women with the educational attainment of bachelor's degree are least likely to be married with 54.3% of them unmarried at childbirth.
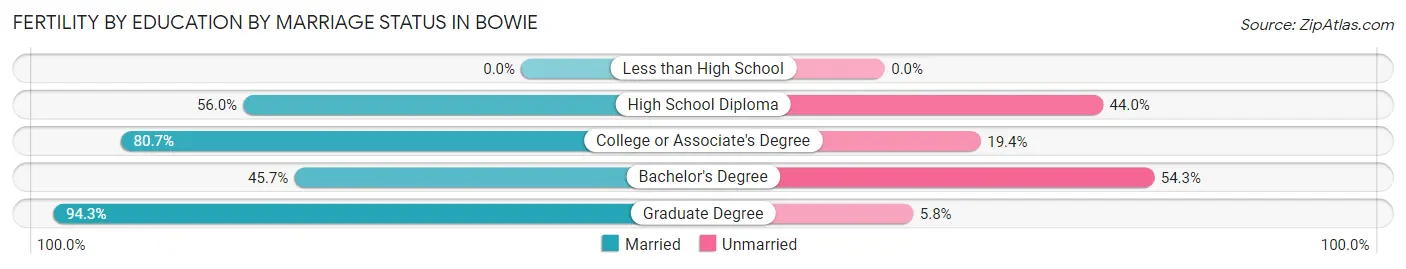
| Educational Attainment | Married | Unmarried |
| Less than High School | 0 (0.0%) | 0 (0.0%) |
| High School Diploma | 42 (56.0%) | 33 (44.0%) |
| College or Associate's Degree | 25 (80.6%) | 6 (19.4%) |
| Bachelor's Degree | 122 (45.7%) | 145 (54.3%) |
| Graduate Degree | 246 (94.3%) | 15 (5.8%) |
| Total | 435 (68.6%) | 199 (31.4%) |
Employment Characteristics in Bowie
Employment by Class of Employer in Bowie
Among the 31,608 employed individuals in Bowie, private company employees (16,026 | 50.7%), federal government employees (6,147 | 19.5%), and not-for-profit organizations (3,732 | 11.8%) make up the most common classes of employment.
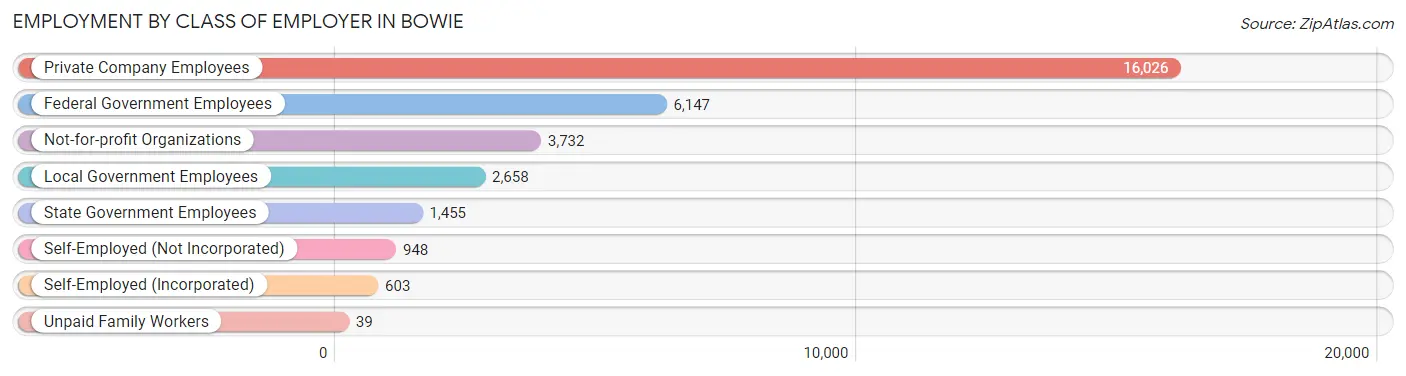
| Employer Class | # Employees | % Employees |
| Private Company Employees | 16,026 | 50.7% |
| Self-Employed (Incorporated) | 603 | 1.9% |
| Self-Employed (Not Incorporated) | 948 | 3.0% |
| Not-for-profit Organizations | 3,732 | 11.8% |
| Local Government Employees | 2,658 | 8.4% |
| State Government Employees | 1,455 | 4.6% |
| Federal Government Employees | 6,147 | 19.5% |
| Unpaid Family Workers | 39 | 0.1% |
| Total | 31,608 | 100.0% |
Employment Status by Age in Bowie
According to the labor force statistics for Bowie, out of the total population over 16 years of age (47,174), 72.7% or 34,295 individuals are in the labor force, with 5.1% or 1,749 of them unemployed. The age group with the highest labor force participation rate is 25 to 29 years, with 93.0% or 2,796 individuals in the labor force. Within the labor force, the 20 to 24 years age range has the highest percentage of unemployed individuals, with 15.3% or 349 of them being unemployed.
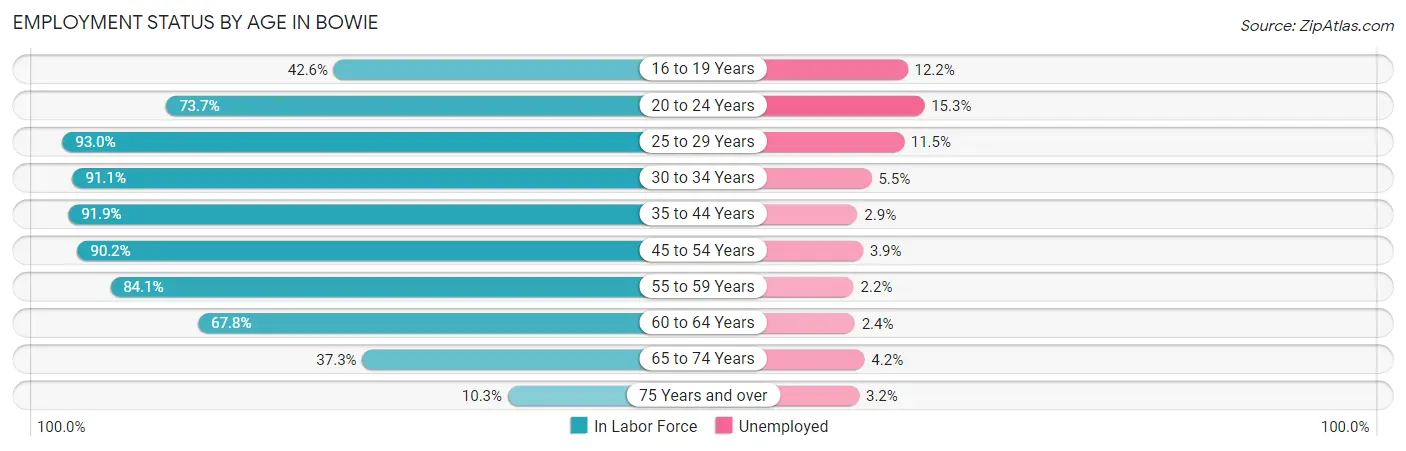
| Age Bracket | In Labor Force | Unemployed |
| 16 to 19 Years | 1,028 (42.6%) | 125 (12.2%) |
| 20 to 24 Years | 2,282 (73.7%) | 349 (15.3%) |
| 25 to 29 Years | 2,796 (93.0%) | 322 (11.5%) |
| 30 to 34 Years | 3,344 (91.1%) | 184 (5.5%) |
| 35 to 44 Years | 6,606 (91.9%) | 192 (2.9%) |
| 45 to 54 Years | 7,962 (90.2%) | 311 (3.9%) |
| 55 to 59 Years | 4,903 (84.1%) | 108 (2.2%) |
| 60 to 64 Years | 3,093 (67.8%) | 74 (2.4%) |
| 65 to 74 Years | 1,954 (37.3%) | 82 (4.2%) |
| 75 Years and over | 344 (10.3%) | 11 (3.2%) |
| Total | 34,295 (72.7%) | 1,749 (5.1%) |
Employment Status by Educational Attainment in Bowie
According to labor force statistics for Bowie, 86.8% of individuals (28,717) out of the total population between 25 and 64 years of age (33,084) are in the labor force, with 4.1% or 1,177 of them being unemployed. The group with the highest labor force participation rate are those with the educational attainment of bachelor's degree or higher, with 91.8% or 15,444 individuals in the labor force. Within the labor force, individuals with college / associate degree education have the highest percentage of unemployment, with 6.8% or 518 of them being unemployed.
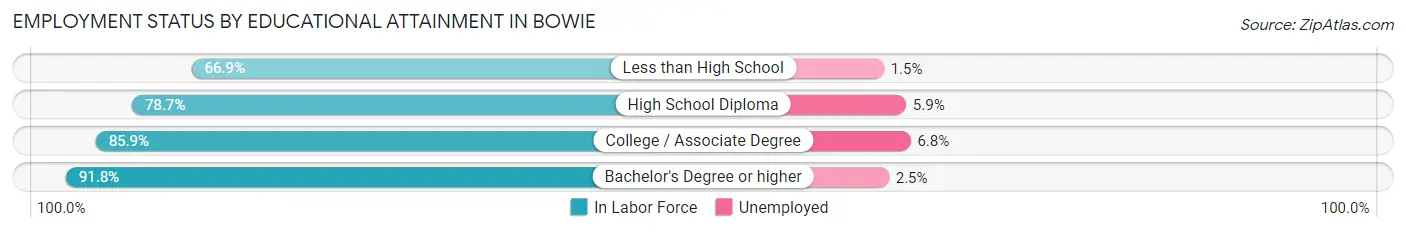
| Educational Attainment | In Labor Force | Unemployed |
| Less than High School | 968 (66.9%) | 22 (1.5%) |
| High School Diploma | 4,673 (78.7%) | 350 (5.9%) |
| College / Associate Degree | 7,624 (85.9%) | 604 (6.8%) |
| Bachelor's Degree or higher | 15,444 (91.8%) | 421 (2.5%) |
| Total | 28,717 (86.8%) | 1,356 (4.1%) |
Employment Occupations by Sex in Bowie
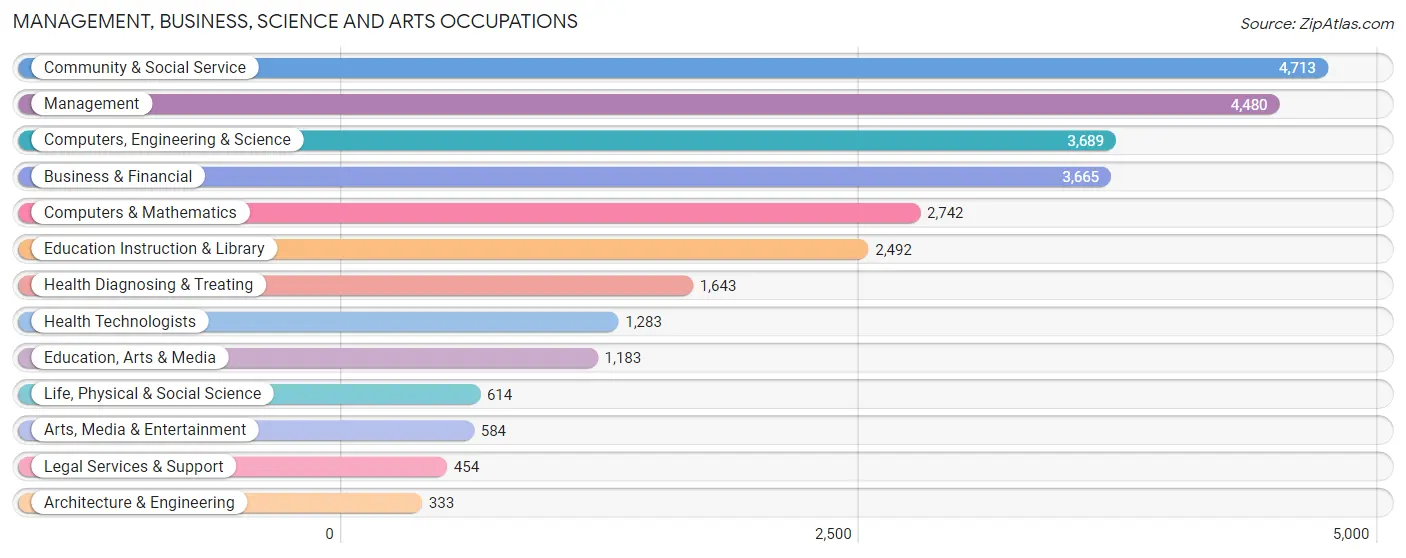
Management, Business, Science and Arts Occupations
The most common Management, Business, Science and Arts occupations in Bowie are Community & Social Service (4,713 | 14.6%), Management (4,480 | 13.9%), Computers, Engineering & Science (3,689 | 11.4%), Business & Financial (3,665 | 11.4%), and Computers & Mathematics (2,742 | 8.5%).
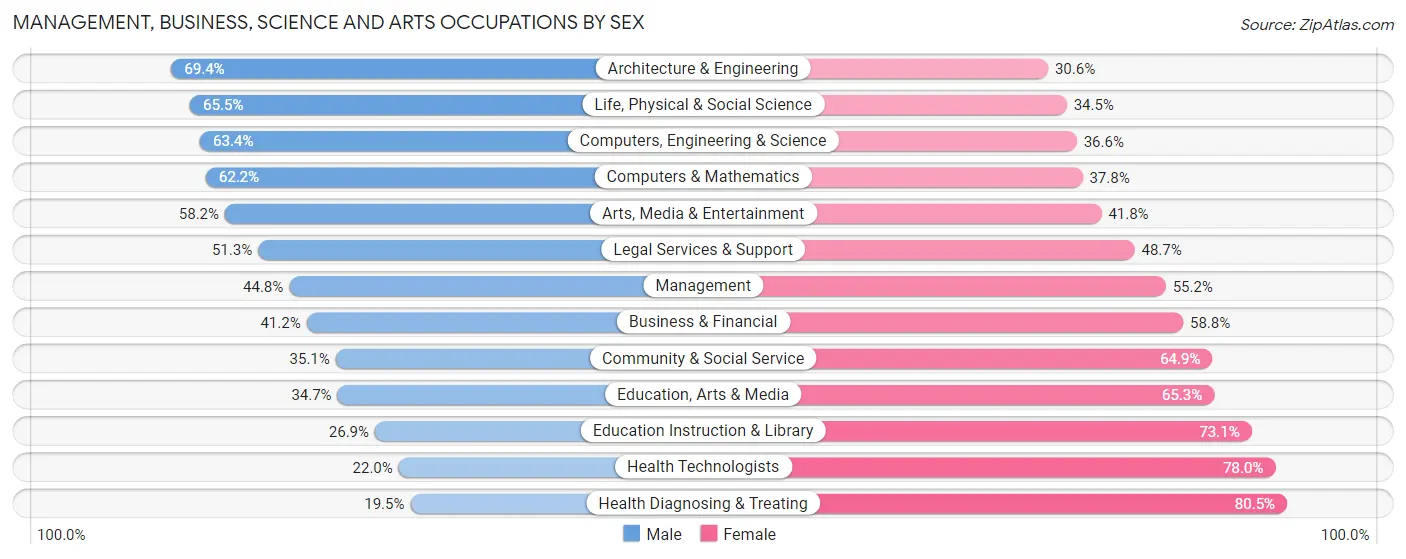
Management, Business, Science and Arts Occupations by Sex
Within the Management, Business, Science and Arts occupations in Bowie, the most male-oriented occupations are Architecture & Engineering (69.4%), Life, Physical & Social Science (65.5%), and Computers, Engineering & Science (63.4%), while the most female-oriented occupations are Health Diagnosing & Treating (80.5%), Health Technologists (78.0%), and Education Instruction & Library (73.1%).
| Occupation | Male | Female |
| Management | 2,008 (44.8%) | 2,472 (55.2%) |
| Business & Financial | 1,510 (41.2%) | 2,155 (58.8%) |
| Computers, Engineering & Science | 2,338 (63.4%) | 1,351 (36.6%) |
| Computers & Mathematics | 1,705 (62.2%) | 1,037 (37.8%) |
| Architecture & Engineering | 231 (69.4%) | 102 (30.6%) |
| Life, Physical & Social Science | 402 (65.5%) | 212 (34.5%) |
| Community & Social Service | 1,655 (35.1%) | 3,058 (64.9%) |
| Education, Arts & Media | 411 (34.7%) | 772 (65.3%) |
| Legal Services & Support | 233 (51.3%) | 221 (48.7%) |
| Education Instruction & Library | 671 (26.9%) | 1,821 (73.1%) |
| Arts, Media & Entertainment | 340 (58.2%) | 244 (41.8%) |
| Health Diagnosing & Treating | 321 (19.5%) | 1,322 (80.5%) |
| Health Technologists | 282 (22.0%) | 1,001 (78.0%) |
| Total (Category) | 7,832 (43.1%) | 10,358 (56.9%) |
| Total (Overall) | 15,524 (48.1%) | 16,770 (51.9%) |
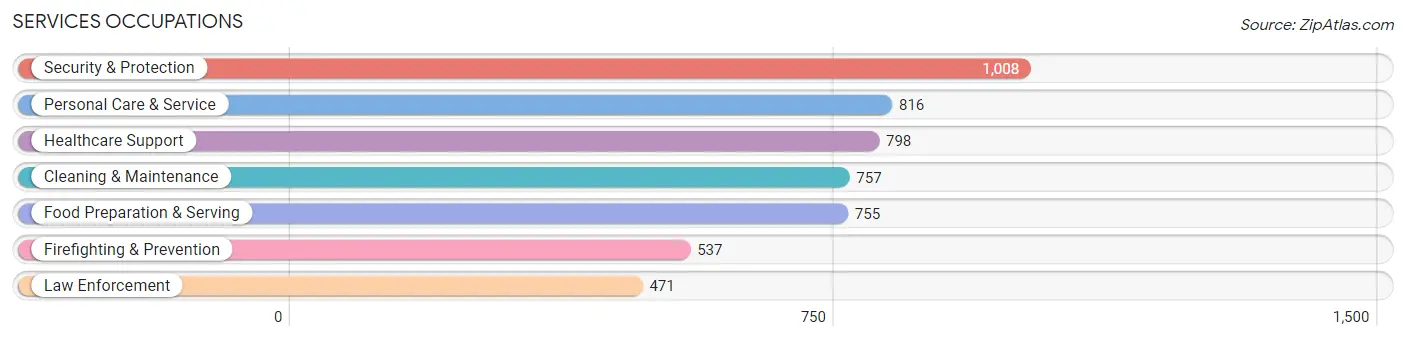
Services Occupations
The most common Services occupations in Bowie are Security & Protection (1,008 | 3.1%), Personal Care & Service (816 | 2.5%), Healthcare Support (798 | 2.5%), Cleaning & Maintenance (757 | 2.3%), and Food Preparation & Serving (755 | 2.3%).
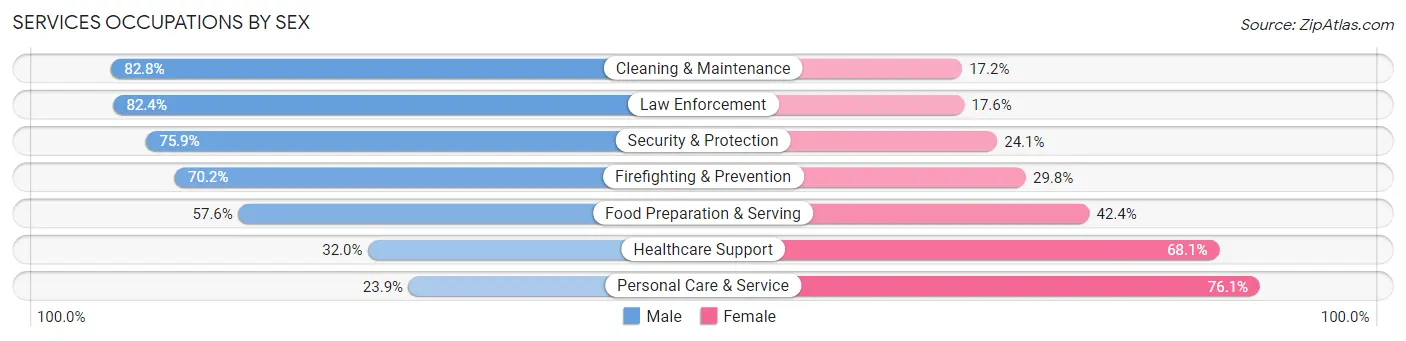
Services Occupations by Sex
Within the Services occupations in Bowie, the most male-oriented occupations are Cleaning & Maintenance (82.8%), Law Enforcement (82.4%), and Security & Protection (75.9%), while the most female-oriented occupations are Personal Care & Service (76.1%), Healthcare Support (68.0%), and Food Preparation & Serving (42.4%).
| Occupation | Male | Female |
| Healthcare Support | 255 (32.0%) | 543 (68.0%) |
| Security & Protection | 765 (75.9%) | 243 (24.1%) |
| Firefighting & Prevention | 377 (70.2%) | 160 (29.8%) |
| Law Enforcement | 388 (82.4%) | 83 (17.6%) |
| Food Preparation & Serving | 435 (57.6%) | 320 (42.4%) |
| Cleaning & Maintenance | 627 (82.8%) | 130 (17.2%) |
| Personal Care & Service | 195 (23.9%) | 621 (76.1%) |
| Total (Category) | 2,277 (55.1%) | 1,857 (44.9%) |
| Total (Overall) | 15,524 (48.1%) | 16,770 (51.9%) |
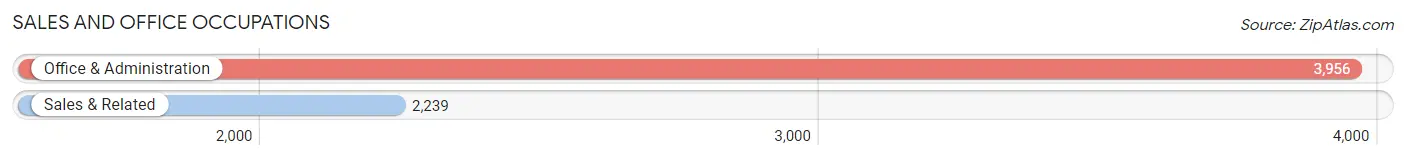
Sales and Office Occupations
The most common Sales and Office occupations in Bowie are Office & Administration (3,956 | 12.2%), and Sales & Related (2,239 | 6.9%).
Sales and Office Occupations by Sex
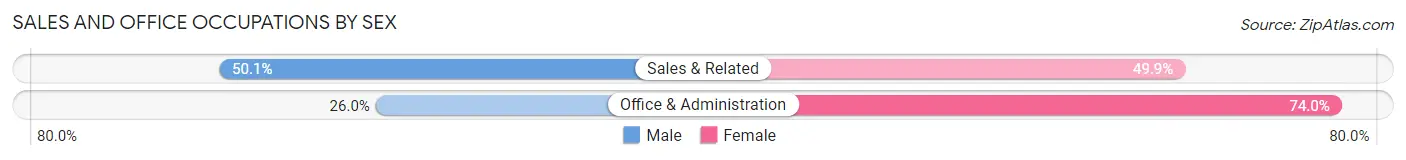
| Occupation | Male | Female |
| Sales & Related | 1,121 (50.1%) | 1,118 (49.9%) |
| Office & Administration | 1,028 (26.0%) | 2,928 (74.0%) |
| Total (Category) | 2,149 (34.7%) | 4,046 (65.3%) |
| Total (Overall) | 15,524 (48.1%) | 16,770 (51.9%) |
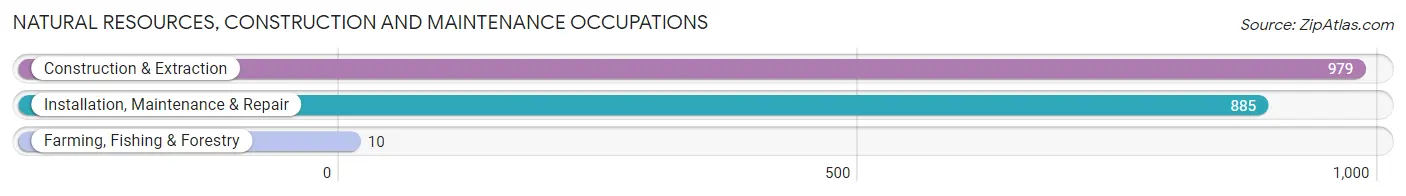
Natural Resources, Construction and Maintenance Occupations
The most common Natural Resources, Construction and Maintenance occupations in Bowie are Construction & Extraction (979 | 3.0%), Installation, Maintenance & Repair (885 | 2.7%), and Farming, Fishing & Forestry (10 | 0.0%).
Natural Resources, Construction and Maintenance Occupations by Sex
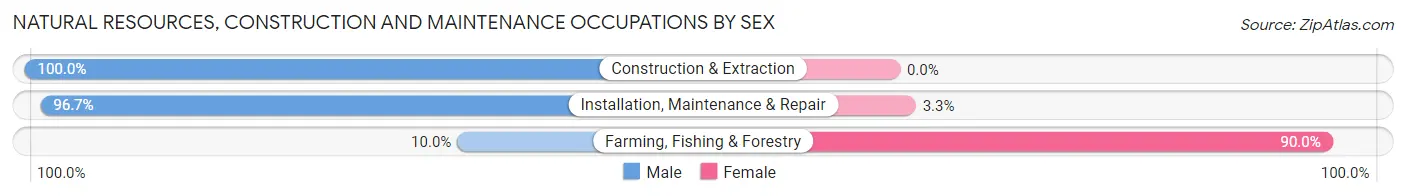
| Occupation | Male | Female |
| Farming, Fishing & Forestry | 1 (10.0%) | 9 (90.0%) |
| Construction & Extraction | 979 (100.0%) | 0 (0.0%) |
| Installation, Maintenance & Repair | 856 (96.7%) | 29 (3.3%) |
| Total (Category) | 1,836 (98.0%) | 38 (2.0%) |
| Total (Overall) | 15,524 (48.1%) | 16,770 (51.9%) |
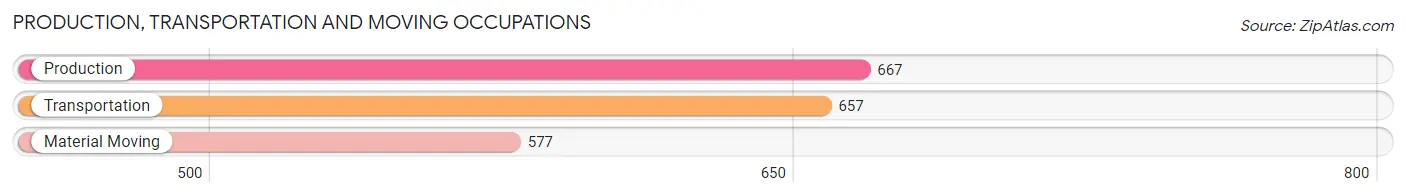
Production, Transportation and Moving Occupations
The most common Production, Transportation and Moving occupations in Bowie are Production (667 | 2.1%), Transportation (657 | 2.0%), and Material Moving (577 | 1.8%).
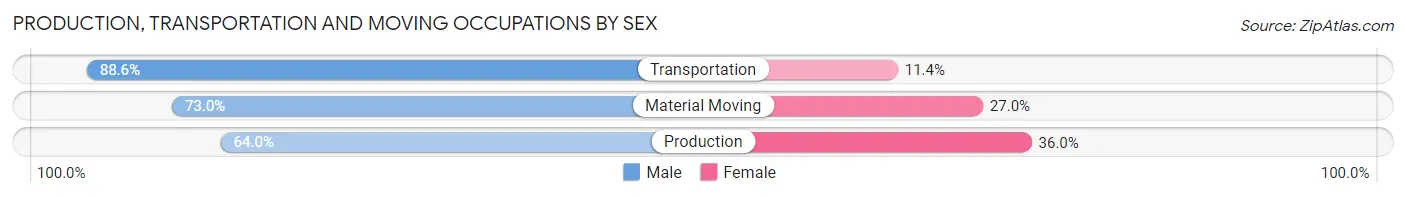
Production, Transportation and Moving Occupations by Sex
| Occupation | Male | Female |
| Production | 427 (64.0%) | 240 (36.0%) |
| Transportation | 582 (88.6%) | 75 (11.4%) |
| Material Moving | 421 (73.0%) | 156 (27.0%) |
| Total (Category) | 1,430 (75.2%) | 471 (24.8%) |
| Total (Overall) | 15,524 (48.1%) | 16,770 (51.9%) |
Employment Industries by Sex in Bowie
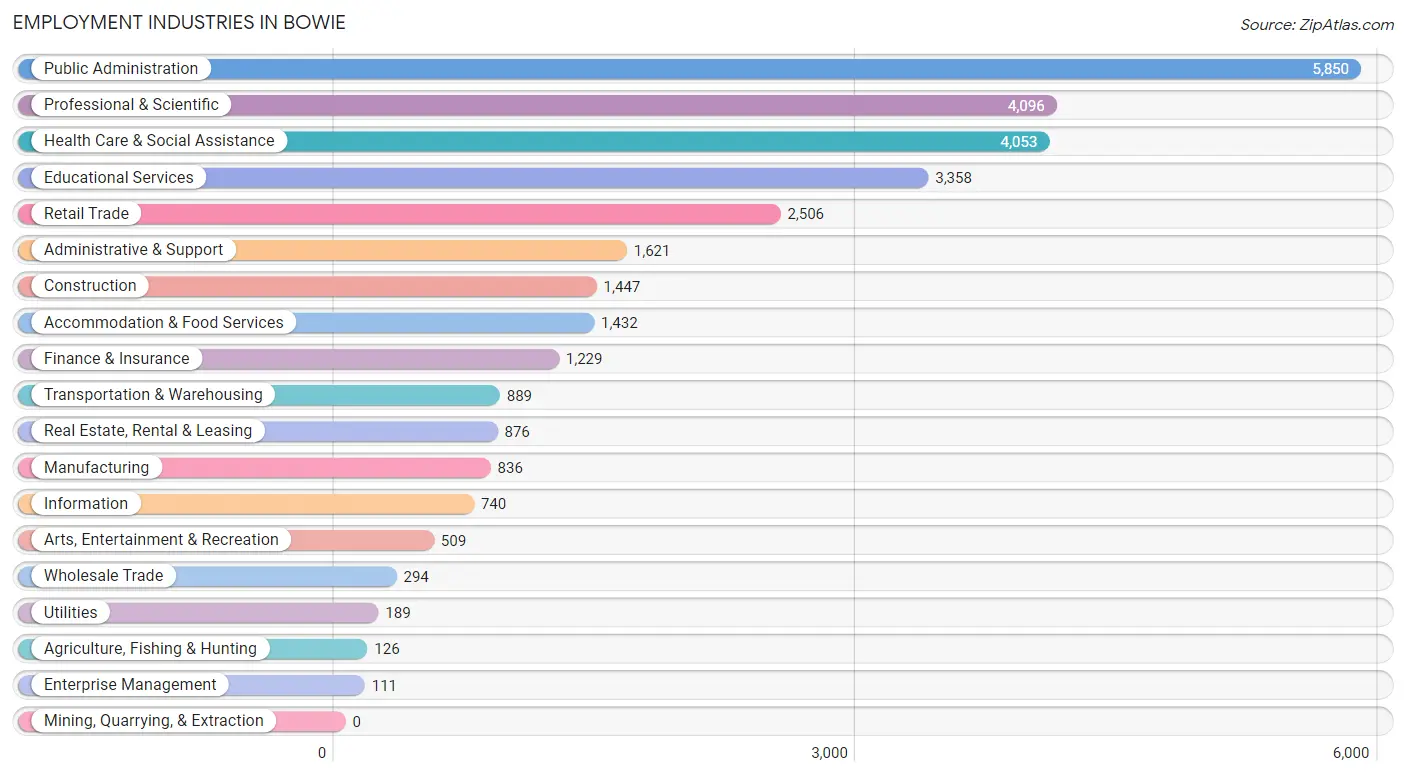
Employment Industries in Bowie
The major employment industries in Bowie include Public Administration (5,850 | 18.1%), Professional & Scientific (4,096 | 12.7%), Health Care & Social Assistance (4,053 | 12.6%), Educational Services (3,358 | 10.4%), and Retail Trade (2,506 | 7.8%).
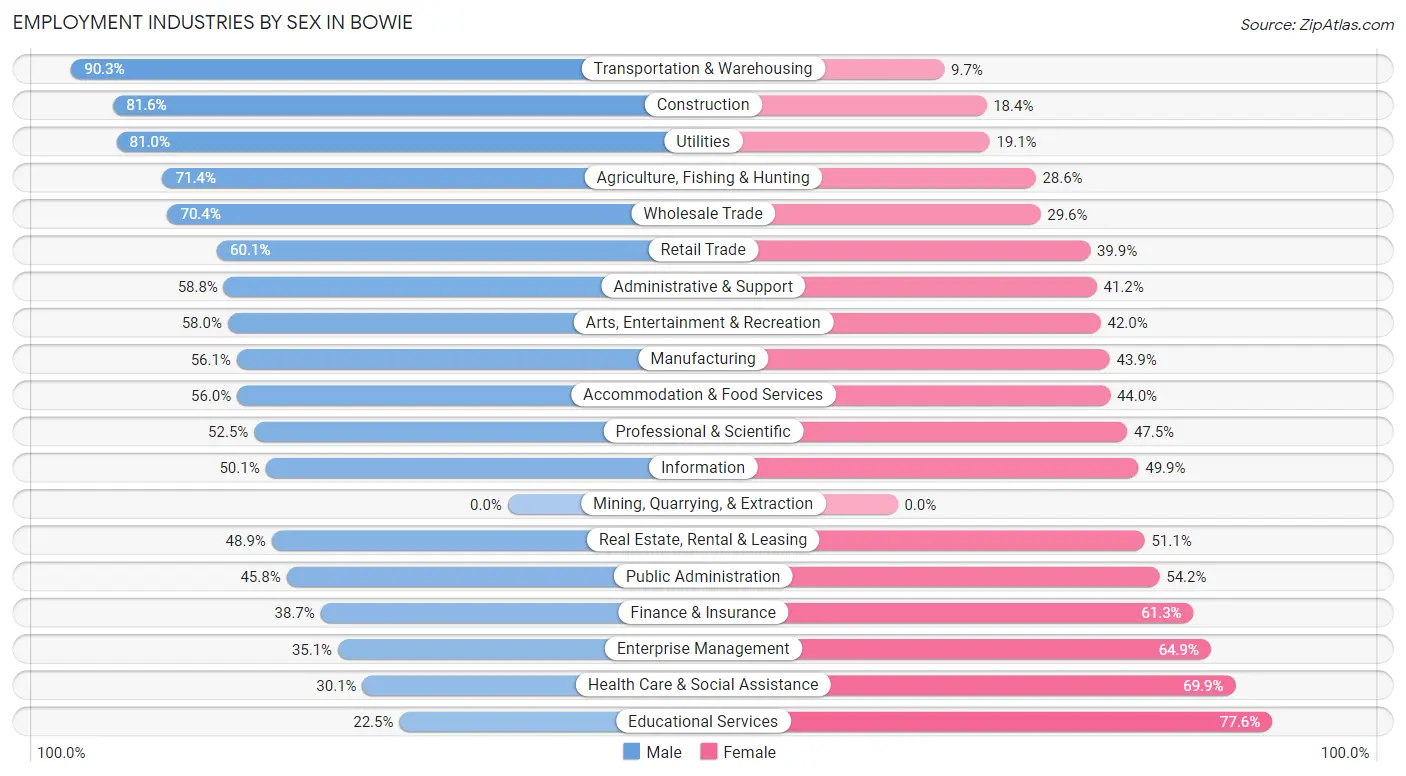
Employment Industries by Sex in Bowie
The Bowie industries that see more men than women are Transportation & Warehousing (90.3%), Construction (81.6%), and Utilities (80.9%), whereas the industries that tend to have a higher number of women are Educational Services (77.5%), Health Care & Social Assistance (69.9%), and Enterprise Management (64.9%).
| Industry | Male | Female |
| Agriculture, Fishing & Hunting | 90 (71.4%) | 36 (28.6%) |
| Mining, Quarrying, & Extraction | 0 (0.0%) | 0 (0.0%) |
| Construction | 1,181 (81.6%) | 266 (18.4%) |
| Manufacturing | 469 (56.1%) | 367 (43.9%) |
| Wholesale Trade | 207 (70.4%) | 87 (29.6%) |
| Retail Trade | 1,507 (60.1%) | 999 (39.9%) |
| Transportation & Warehousing | 803 (90.3%) | 86 (9.7%) |
| Utilities | 153 (80.9%) | 36 (19.1%) |
| Information | 371 (50.1%) | 369 (49.9%) |
| Finance & Insurance | 476 (38.7%) | 753 (61.3%) |
| Real Estate, Rental & Leasing | 428 (48.9%) | 448 (51.1%) |
| Professional & Scientific | 2,150 (52.5%) | 1,946 (47.5%) |
| Enterprise Management | 39 (35.1%) | 72 (64.9%) |
| Administrative & Support | 953 (58.8%) | 668 (41.2%) |
| Educational Services | 754 (22.5%) | 2,604 (77.5%) |
| Health Care & Social Assistance | 1,219 (30.1%) | 2,834 (69.9%) |
| Arts, Entertainment & Recreation | 295 (58.0%) | 214 (42.0%) |
| Accommodation & Food Services | 802 (56.0%) | 630 (44.0%) |
| Public Administration | 2,679 (45.8%) | 3,171 (54.2%) |
| Total | 15,524 (48.1%) | 16,770 (51.9%) |
Education in Bowie
School Enrollment in Bowie
The most common levels of schooling among the 14,408 students in Bowie are high school (3,263 | 22.7%), middle school (3,157 | 21.9%), and college / undergraduate (2,731 | 19.0%).
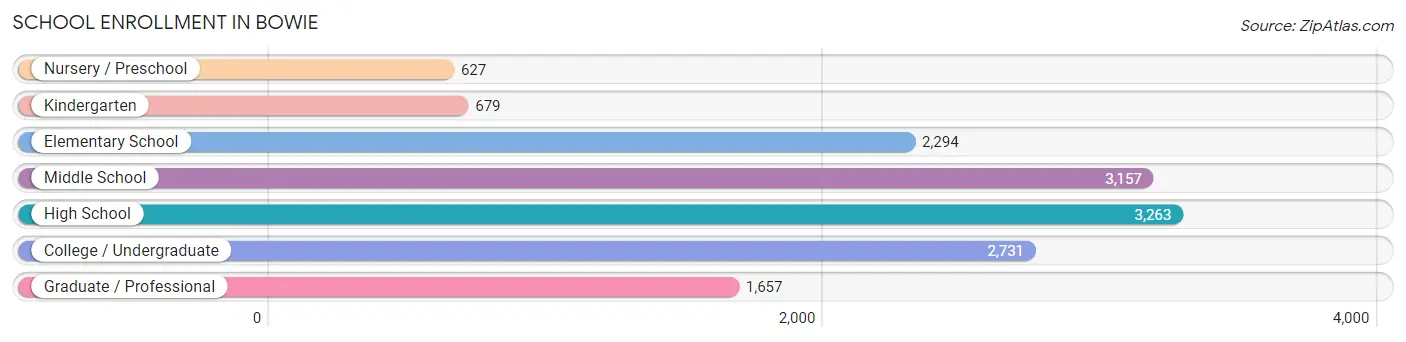
| School Level | # Students | % Students |
| Nursery / Preschool | 627 | 4.3% |
| Kindergarten | 679 | 4.7% |
| Elementary School | 2,294 | 15.9% |
| Middle School | 3,157 | 21.9% |
| High School | 3,263 | 22.7% |
| College / Undergraduate | 2,731 | 19.0% |
| Graduate / Professional | 1,657 | 11.5% |
| Total | 14,408 | 100.0% |
School Enrollment by Age by Funding Source in Bowie
Out of a total of 14,408 students who are enrolled in schools in Bowie, 3,631 (25.2%) attend a private institution, while the remaining 10,777 (74.8%) are enrolled in public schools. The age group of 3 to 4 year olds has the highest likelihood of being enrolled in private schools, with 236 (51.2% in the age bracket) enrolled. Conversely, the age group of 18 to 19 year olds has the lowest likelihood of being enrolled in a private school, with 577 (85.5% in the age bracket) attending a public institution.
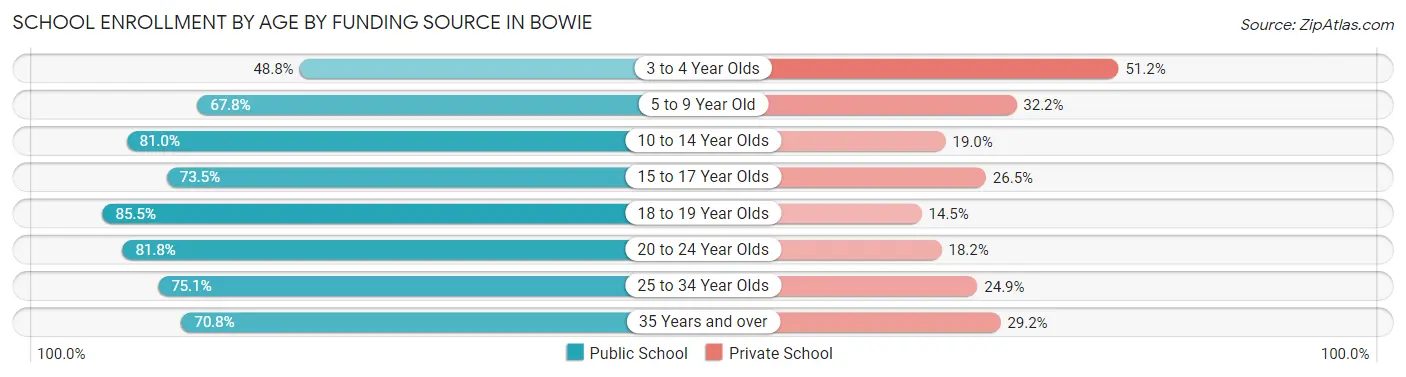
| Age Bracket | Public School | Private School |
| 3 to 4 Year Olds | 225 (48.8%) | 236 (51.2%) |
| 5 to 9 Year Old | 1,870 (67.8%) | 887 (32.2%) |
| 10 to 14 Year Olds | 3,136 (81.0%) | 735 (19.0%) |
| 15 to 17 Year Olds | 1,943 (73.5%) | 700 (26.5%) |
| 18 to 19 Year Olds | 577 (85.5%) | 98 (14.5%) |
| 20 to 24 Year Olds | 1,090 (81.8%) | 243 (18.2%) |
| 25 to 34 Year Olds | 733 (75.1%) | 243 (24.9%) |
| 35 Years and over | 1,198 (70.8%) | 494 (29.2%) |
| Total | 10,777 (74.8%) | 3,631 (25.2%) |
Educational Attainment by Field of Study in Bowie
Business (4,975 | 22.7%), social sciences (2,472 | 11.3%), science & technology (1,740 | 7.9%), education (1,706 | 7.8%), and computers & mathematics (1,626 | 7.4%) are the most common fields of study among 21,941 individuals in Bowie who have obtained a bachelor's degree or higher.
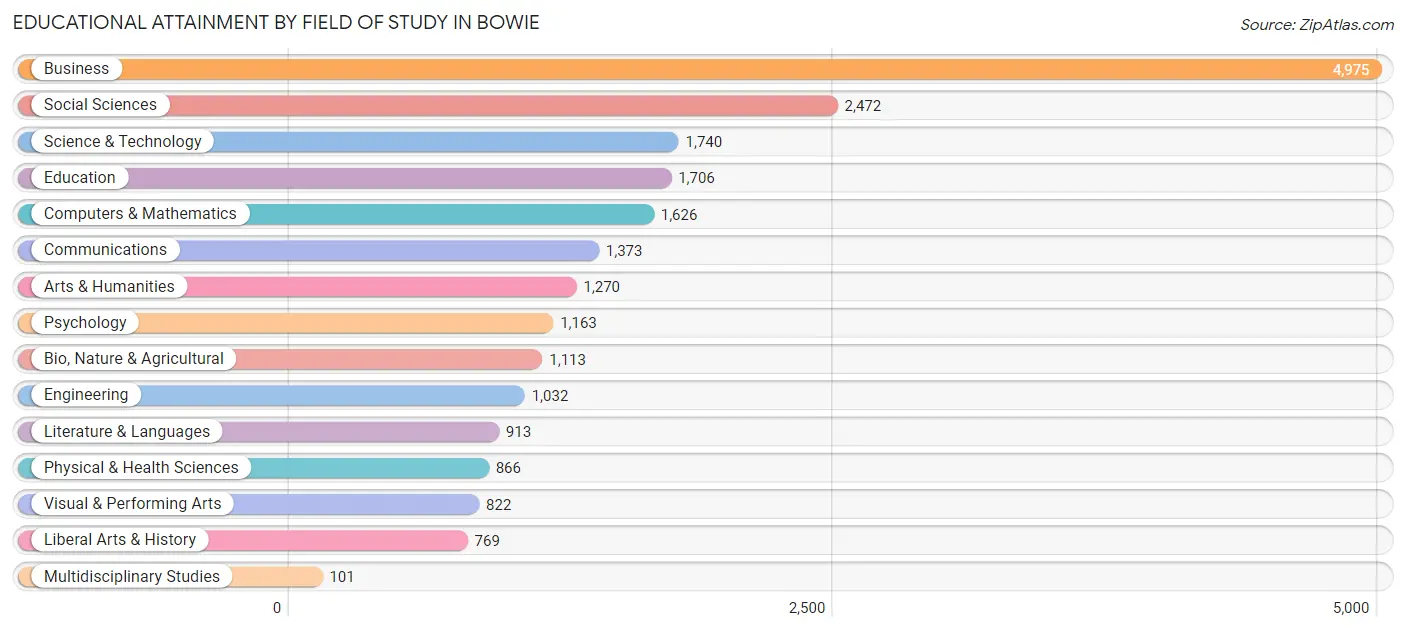
| Field of Study | # Graduates | % Graduates |
| Computers & Mathematics | 1,626 | 7.4% |
| Bio, Nature & Agricultural | 1,113 | 5.1% |
| Physical & Health Sciences | 866 | 4.0% |
| Psychology | 1,163 | 5.3% |
| Social Sciences | 2,472 | 11.3% |
| Engineering | 1,032 | 4.7% |
| Multidisciplinary Studies | 101 | 0.5% |
| Science & Technology | 1,740 | 7.9% |
| Business | 4,975 | 22.7% |
| Education | 1,706 | 7.8% |
| Literature & Languages | 913 | 4.2% |
| Liberal Arts & History | 769 | 3.5% |
| Visual & Performing Arts | 822 | 3.7% |
| Communications | 1,373 | 6.3% |
| Arts & Humanities | 1,270 | 5.8% |
| Total | 21,941 | 100.0% |
Transportation & Commute in Bowie
Vehicle Availability by Sex in Bowie
The most prevalent vehicle ownership categories in Bowie are males with 2 vehicles (5,716, accounting for 37.6%) and females with 2 vehicles (6,310, making up 34.9%).
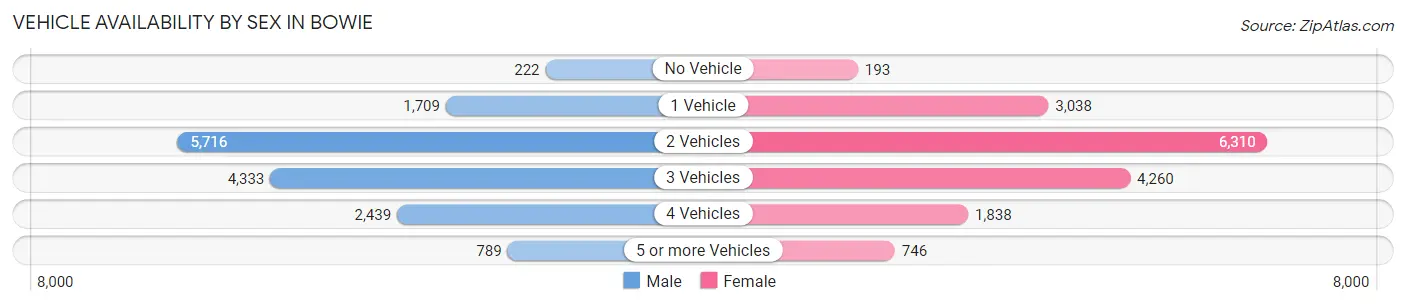
| Vehicles Available | Male | Female |
| No Vehicle | 222 (1.5%) | 193 (1.2%) |
| 1 Vehicle | 1,709 (11.2%) | 3,038 (18.5%) |
| 2 Vehicles | 5,716 (37.6%) | 6,310 (38.5%) |
| 3 Vehicles | 4,333 (28.5%) | 4,260 (26.0%) |
| 4 Vehicles | 2,439 (16.0%) | 1,838 (11.2%) |
| 5 or more Vehicles | 789 (5.2%) | 746 (4.5%) |
| Total | 15,208 (100.0%) | 16,385 (100.0%) |
Commute Time in Bowie
The most frequently occuring commute durations in Bowie are 30 to 34 minutes (4,118 commuters, 16.6%), 45 to 59 minutes (3,872 commuters, 15.6%), and 60 to 89 minutes (3,735 commuters, 15.0%).
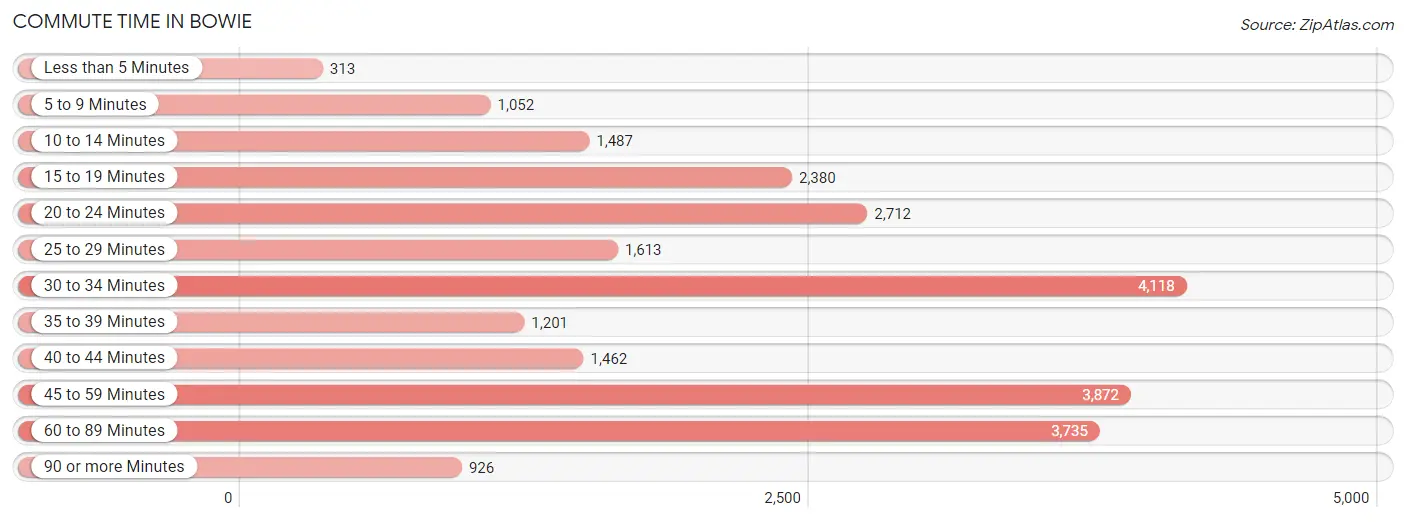
| Commute Time | # Commuters | % Commuters |
| Less than 5 Minutes | 313 | 1.3% |
| 5 to 9 Minutes | 1,052 | 4.2% |
| 10 to 14 Minutes | 1,487 | 6.0% |
| 15 to 19 Minutes | 2,380 | 9.6% |
| 20 to 24 Minutes | 2,712 | 10.9% |
| 25 to 29 Minutes | 1,613 | 6.5% |
| 30 to 34 Minutes | 4,118 | 16.6% |
| 35 to 39 Minutes | 1,201 | 4.8% |
| 40 to 44 Minutes | 1,462 | 5.9% |
| 45 to 59 Minutes | 3,872 | 15.6% |
| 60 to 89 Minutes | 3,735 | 15.0% |
| 90 or more Minutes | 926 | 3.7% |
Commute Time by Sex in Bowie
The most common commute times in Bowie are 30 to 34 minutes (2,205 commuters, 17.7%) for males and 30 to 34 minutes (1,913 commuters, 15.4%) for females.
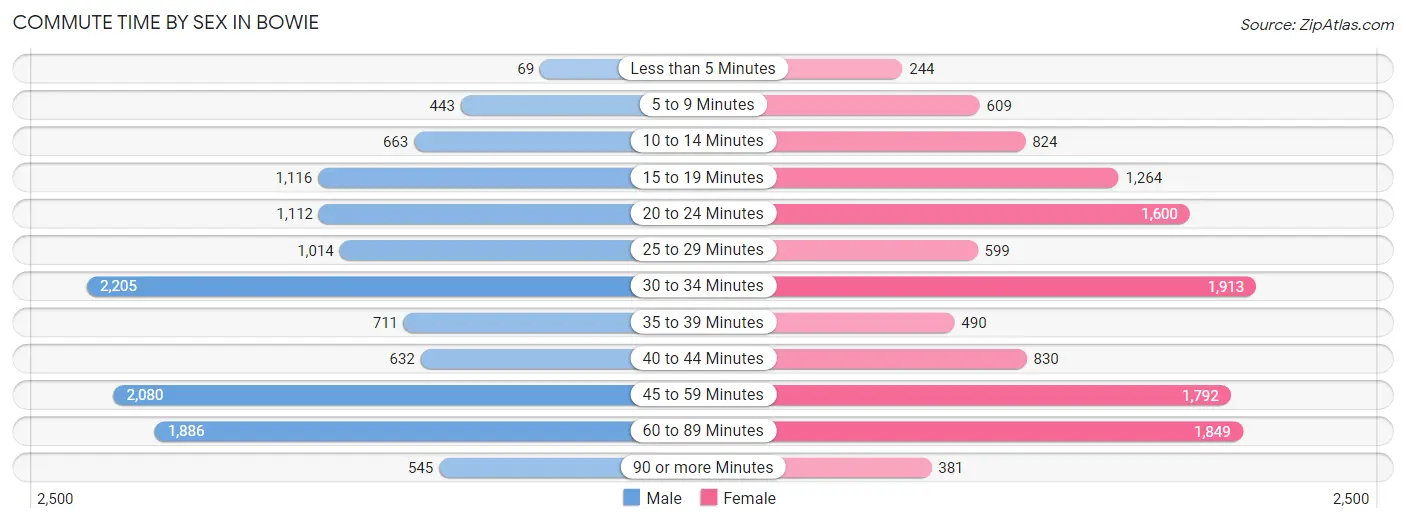
| Commute Time | Male | Female |
| Less than 5 Minutes | 69 (0.5%) | 244 (2.0%) |
| 5 to 9 Minutes | 443 (3.5%) | 609 (4.9%) |
| 10 to 14 Minutes | 663 (5.3%) | 824 (6.7%) |
| 15 to 19 Minutes | 1,116 (8.9%) | 1,264 (10.2%) |
| 20 to 24 Minutes | 1,112 (8.9%) | 1,600 (12.9%) |
| 25 to 29 Minutes | 1,014 (8.1%) | 599 (4.8%) |
| 30 to 34 Minutes | 2,205 (17.7%) | 1,913 (15.4%) |
| 35 to 39 Minutes | 711 (5.7%) | 490 (4.0%) |
| 40 to 44 Minutes | 632 (5.1%) | 830 (6.7%) |
| 45 to 59 Minutes | 2,080 (16.7%) | 1,792 (14.5%) |
| 60 to 89 Minutes | 1,886 (15.1%) | 1,849 (14.9%) |
| 90 or more Minutes | 545 (4.4%) | 381 (3.1%) |
Time of Departure to Work by Sex in Bowie
The most frequent times of departure to work in Bowie are 7:00 AM to 7:29 AM (1,542, 12.4%) for males and 7:00 AM to 7:29 AM (2,117, 17.1%) for females.
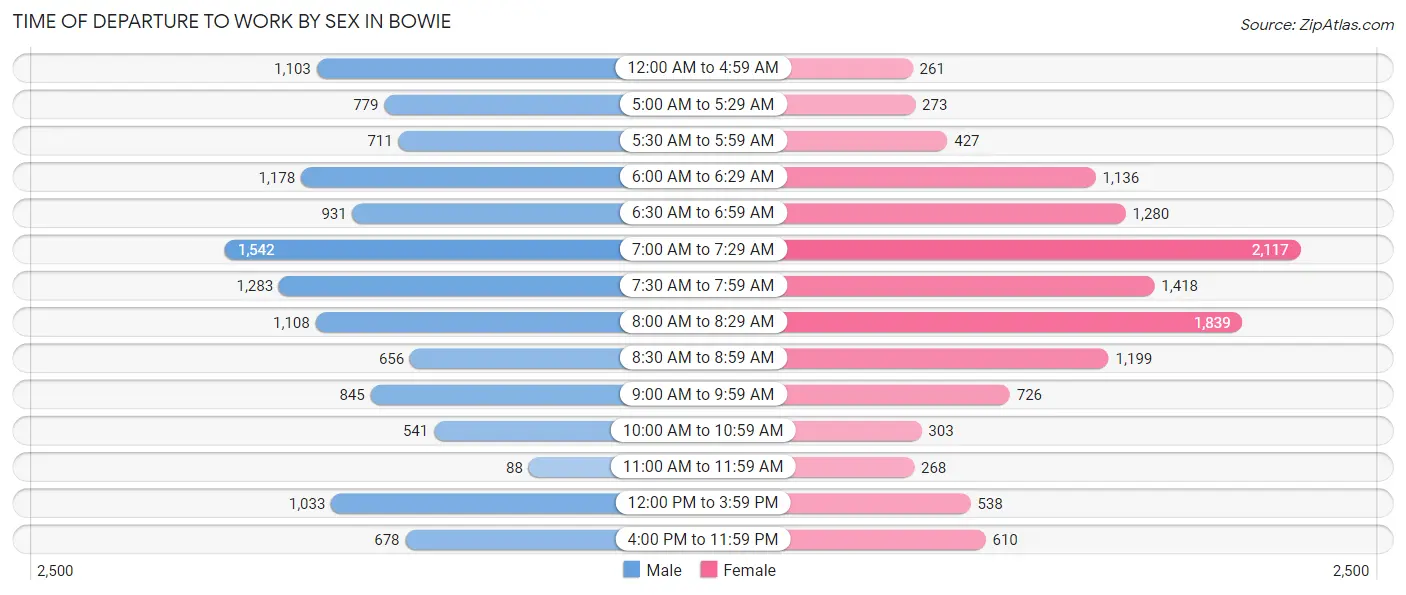
| Time of Departure | Male | Female |
| 12:00 AM to 4:59 AM | 1,103 (8.8%) | 261 (2.1%) |
| 5:00 AM to 5:29 AM | 779 (6.2%) | 273 (2.2%) |
| 5:30 AM to 5:59 AM | 711 (5.7%) | 427 (3.4%) |
| 6:00 AM to 6:29 AM | 1,178 (9.4%) | 1,136 (9.2%) |
| 6:30 AM to 6:59 AM | 931 (7.5%) | 1,280 (10.3%) |
| 7:00 AM to 7:29 AM | 1,542 (12.4%) | 2,117 (17.1%) |
| 7:30 AM to 7:59 AM | 1,283 (10.3%) | 1,418 (11.4%) |
| 8:00 AM to 8:29 AM | 1,108 (8.9%) | 1,839 (14.8%) |
| 8:30 AM to 8:59 AM | 656 (5.3%) | 1,199 (9.7%) |
| 9:00 AM to 9:59 AM | 845 (6.8%) | 726 (5.9%) |
| 10:00 AM to 10:59 AM | 541 (4.3%) | 303 (2.4%) |
| 11:00 AM to 11:59 AM | 88 (0.7%) | 268 (2.2%) |
| 12:00 PM to 3:59 PM | 1,033 (8.3%) | 538 (4.3%) |
| 4:00 PM to 11:59 PM | 678 (5.4%) | 610 (4.9%) |
| Total | 12,476 (100.0%) | 12,395 (100.0%) |
Housing Occupancy in Bowie
Occupancy by Ownership in Bowie
Of the total 20,875 dwellings in Bowie, owner-occupied units account for 17,963 (86.1%), while renter-occupied units make up 2,912 (14.0%).
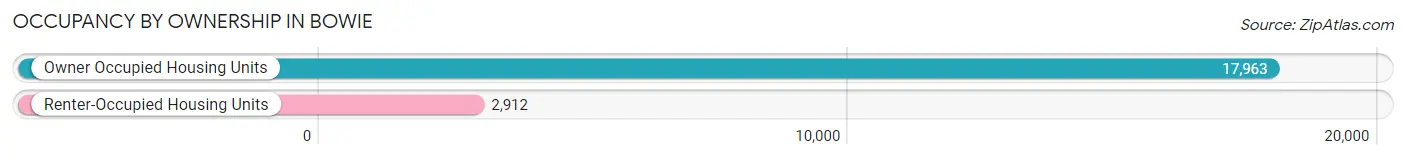
| Occupancy | # Housing Units | % Housing Units |
| Owner Occupied Housing Units | 17,963 | 86.1% |
| Renter-Occupied Housing Units | 2,912 | 14.0% |
| Total Occupied Housing Units | 20,875 | 100.0% |
Occupancy by Household Size in Bowie
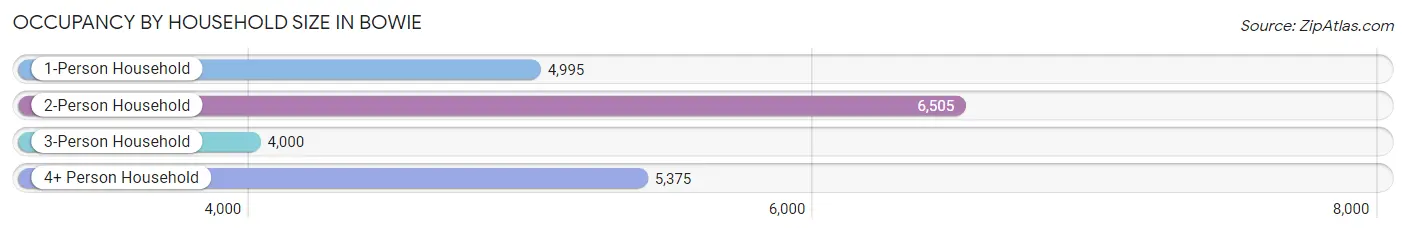
| Household Size | # Housing Units | % Housing Units |
| 1-Person Household | 4,995 | 23.9% |
| 2-Person Household | 6,505 | 31.2% |
| 3-Person Household | 4,000 | 19.2% |
| 4+ Person Household | 5,375 | 25.8% |
| Total Housing Units | 20,875 | 100.0% |
Occupancy by Ownership by Household Size in Bowie
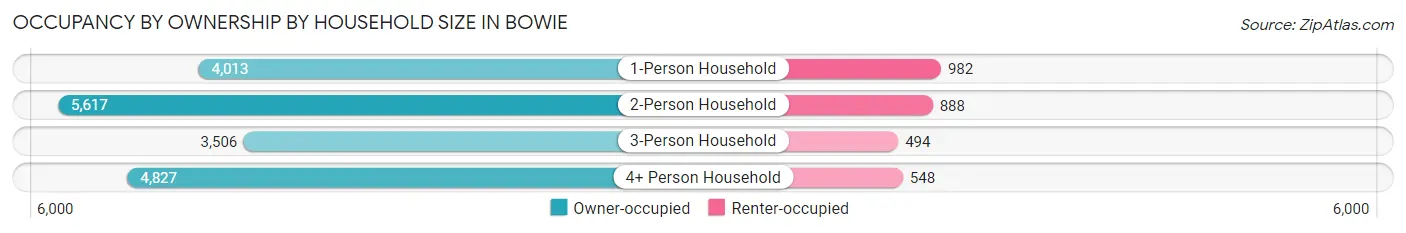
| Household Size | Owner-occupied | Renter-occupied |
| 1-Person Household | 4,013 (80.3%) | 982 (19.7%) |
| 2-Person Household | 5,617 (86.4%) | 888 (13.7%) |
| 3-Person Household | 3,506 (87.6%) | 494 (12.3%) |
| 4+ Person Household | 4,827 (89.8%) | 548 (10.2%) |
| Total Housing Units | 17,963 (86.1%) | 2,912 (14.0%) |
Occupancy by Educational Attainment in Bowie
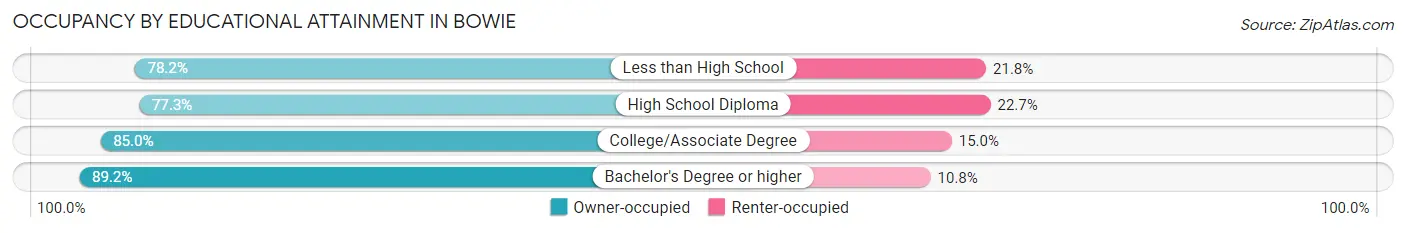
| Household Size | Owner-occupied | Renter-occupied |
| Less than High School | 531 (78.2%) | 148 (21.8%) |
| High School Diploma | 2,328 (77.3%) | 683 (22.7%) |
| College/Associate Degree | 4,545 (85.0%) | 802 (15.0%) |
| Bachelor's Degree or higher | 10,559 (89.2%) | 1,279 (10.8%) |
Occupancy by Age of Householder in Bowie
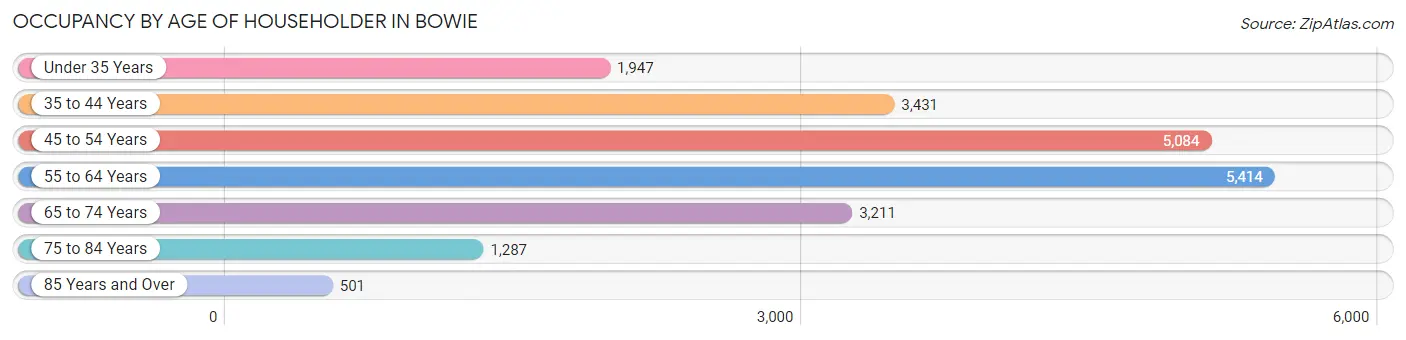
| Age Bracket | # Households | % Households |
| Under 35 Years | 1,947 | 9.3% |
| 35 to 44 Years | 3,431 | 16.4% |
| 45 to 54 Years | 5,084 | 24.3% |
| 55 to 64 Years | 5,414 | 25.9% |
| 65 to 74 Years | 3,211 | 15.4% |
| 75 to 84 Years | 1,287 | 6.2% |
| 85 Years and Over | 501 | 2.4% |
| Total | 20,875 | 100.0% |
Housing Finances in Bowie
Median Income by Occupancy in Bowie
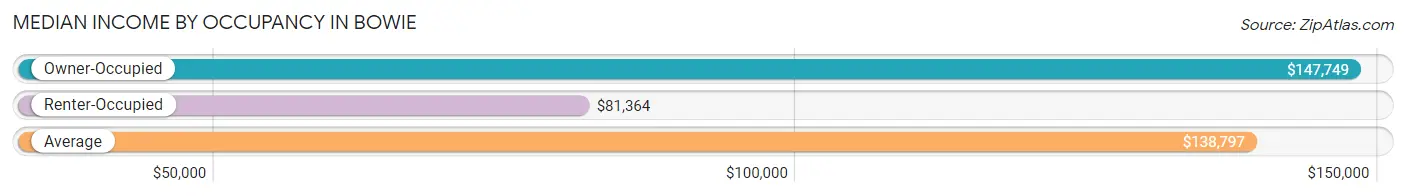
| Occupancy Type | # Households | Median Income |
| Owner-Occupied | 17,963 (86.1%) | $147,749 |
| Renter-Occupied | 2,912 (14.0%) | $81,364 |
| Average | 20,875 (100.0%) | $138,797 |
Occupancy by Householder Income Bracket in Bowie
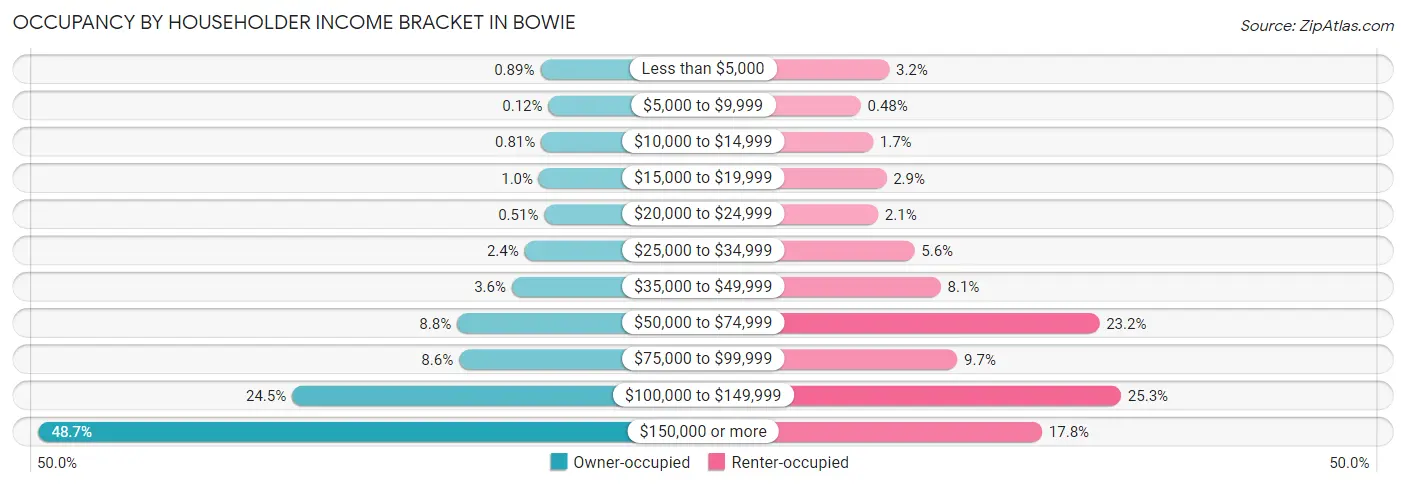
| Income Bracket | Owner-occupied | Renter-occupied |
| Less than $5,000 | 160 (0.9%) | 93 (3.2%) |
| $5,000 to $9,999 | 22 (0.1%) | 14 (0.5%) |
| $10,000 to $14,999 | 146 (0.8%) | 48 (1.7%) |
| $15,000 to $19,999 | 183 (1.0%) | 85 (2.9%) |
| $20,000 to $24,999 | 92 (0.5%) | 62 (2.1%) |
| $25,000 to $34,999 | 429 (2.4%) | 163 (5.6%) |
| $35,000 to $49,999 | 647 (3.6%) | 236 (8.1%) |
| $50,000 to $74,999 | 1,585 (8.8%) | 676 (23.2%) |
| $75,000 to $99,999 | 1,551 (8.6%) | 282 (9.7%) |
| $100,000 to $149,999 | 4,406 (24.5%) | 736 (25.3%) |
| $150,000 or more | 8,742 (48.7%) | 517 (17.7%) |
| Total | 17,963 (100.0%) | 2,912 (100.0%) |
Monthly Housing Cost Tiers in Bowie
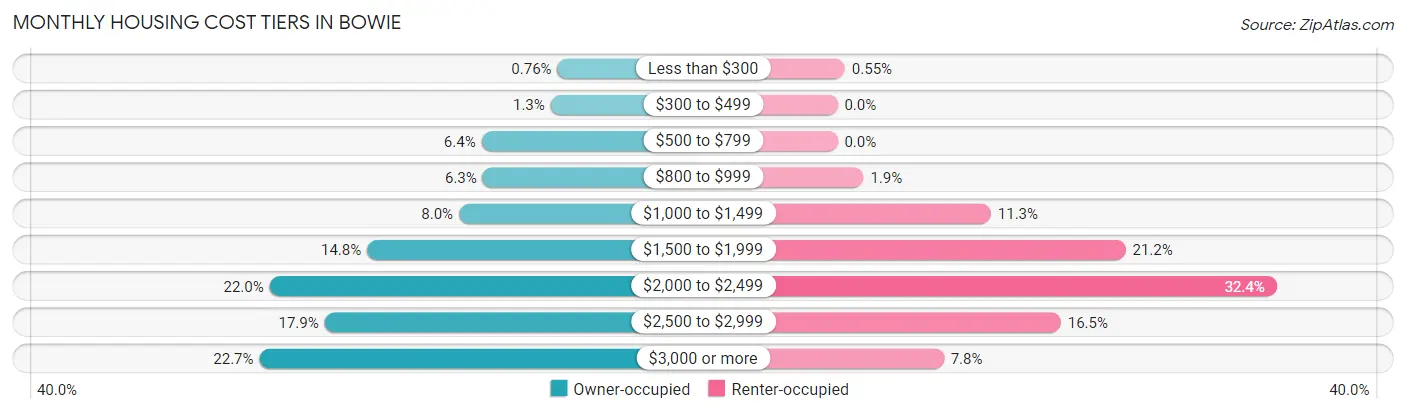
| Monthly Cost | Owner-occupied | Renter-occupied |
| Less than $300 | 136 (0.8%) | 16 (0.5%) |
| $300 to $499 | 227 (1.3%) | 0 (0.0%) |
| $500 to $799 | 1,140 (6.4%) | 0 (0.0%) |
| $800 to $999 | 1,126 (6.3%) | 56 (1.9%) |
| $1,000 to $1,499 | 1,439 (8.0%) | 329 (11.3%) |
| $1,500 to $1,999 | 2,655 (14.8%) | 618 (21.2%) |
| $2,000 to $2,499 | 3,944 (22.0%) | 942 (32.4%) |
| $2,500 to $2,999 | 3,217 (17.9%) | 479 (16.5%) |
| $3,000 or more | 4,079 (22.7%) | 228 (7.8%) |
| Total | 17,963 (100.0%) | 2,912 (100.0%) |
Physical Housing Characteristics in Bowie
Housing Structures in Bowie
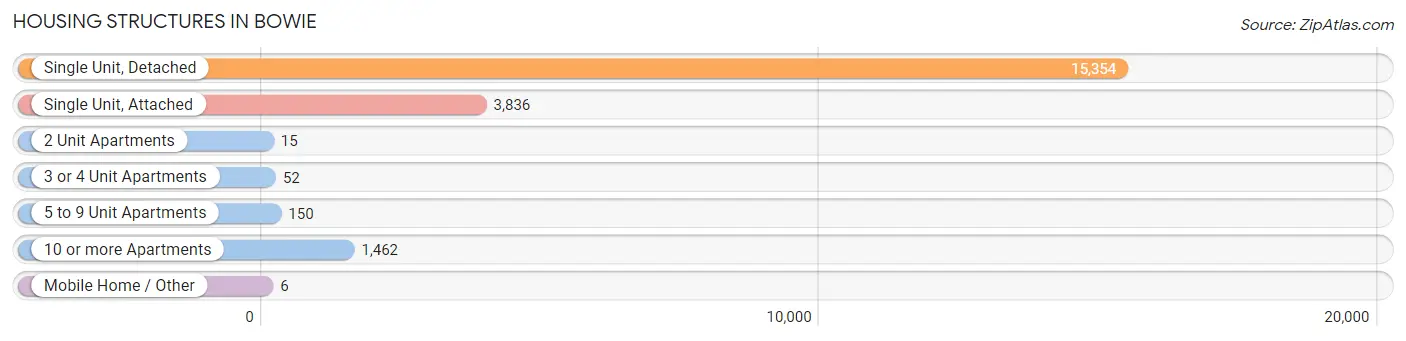
| Structure Type | # Housing Units | % Housing Units |
| Single Unit, Detached | 15,354 | 73.6% |
| Single Unit, Attached | 3,836 | 18.4% |
| 2 Unit Apartments | 15 | 0.1% |
| 3 or 4 Unit Apartments | 52 | 0.3% |
| 5 to 9 Unit Apartments | 150 | 0.7% |
| 10 or more Apartments | 1,462 | 7.0% |
| Mobile Home / Other | 6 | 0.0% |
| Total | 20,875 | 100.0% |
Housing Structures by Occupancy in Bowie
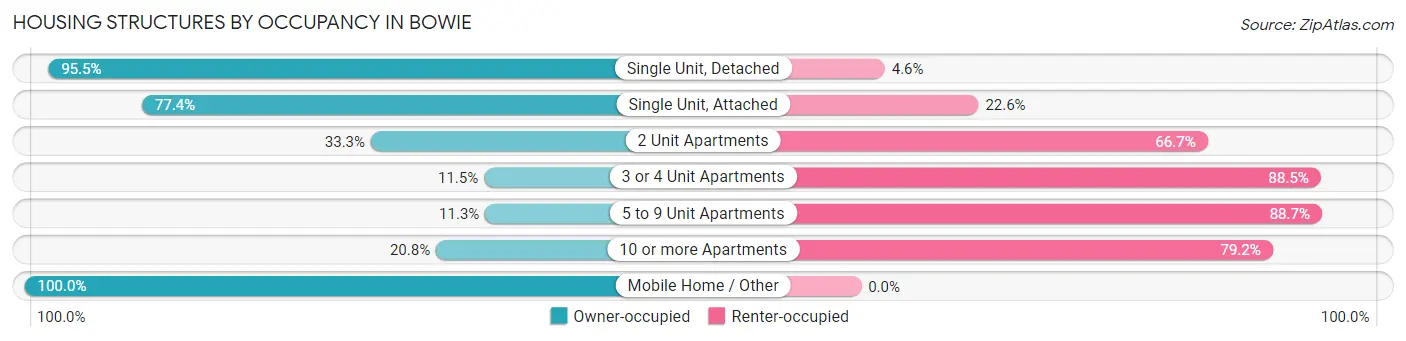
| Structure Type | Owner-occupied | Renter-occupied |
| Single Unit, Detached | 14,655 (95.5%) | 699 (4.5%) |
| Single Unit, Attached | 2,970 (77.4%) | 866 (22.6%) |
| 2 Unit Apartments | 5 (33.3%) | 10 (66.7%) |
| 3 or 4 Unit Apartments | 6 (11.5%) | 46 (88.5%) |
| 5 to 9 Unit Apartments | 17 (11.3%) | 133 (88.7%) |
| 10 or more Apartments | 304 (20.8%) | 1,158 (79.2%) |
| Mobile Home / Other | 6 (100.0%) | 0 (0.0%) |
| Total | 17,963 (86.1%) | 2,912 (14.0%) |
Housing Structures by Number of Rooms in Bowie
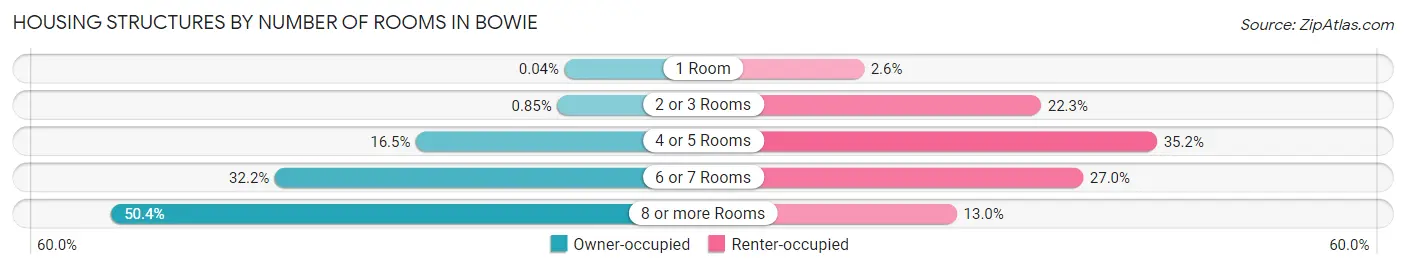
| Number of Rooms | Owner-occupied | Renter-occupied |
| 1 Room | 8 (0.0%) | 77 (2.6%) |
| 2 or 3 Rooms | 153 (0.9%) | 649 (22.3%) |
| 4 or 5 Rooms | 2,970 (16.5%) | 1,024 (35.2%) |
| 6 or 7 Rooms | 5,782 (32.2%) | 785 (27.0%) |
| 8 or more Rooms | 9,050 (50.4%) | 377 (13.0%) |
| Total | 17,963 (100.0%) | 2,912 (100.0%) |
Housing Structure by Heating Type in Bowie
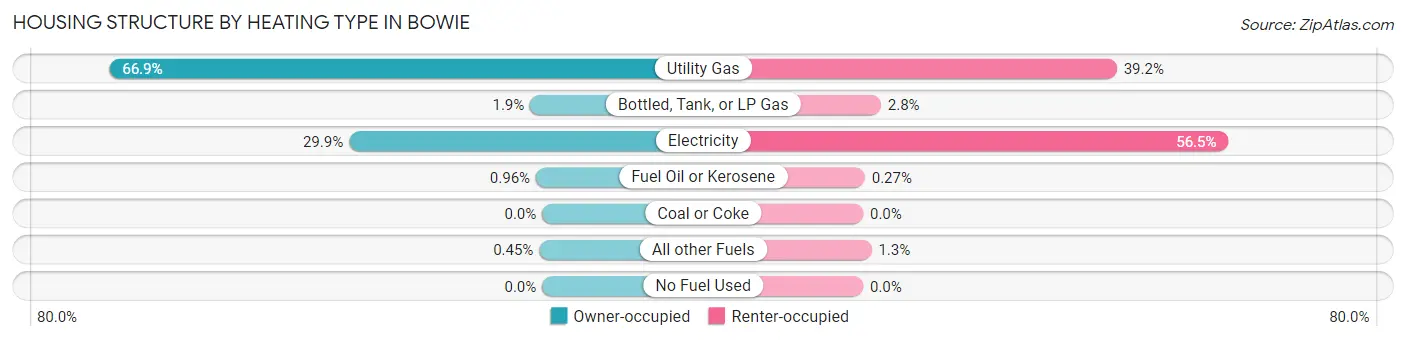
| Heating Type | Owner-occupied | Renter-occupied |
| Utility Gas | 12,017 (66.9%) | 1,142 (39.2%) |
| Bottled, Tank, or LP Gas | 332 (1.8%) | 80 (2.8%) |
| Electricity | 5,362 (29.8%) | 1,644 (56.5%) |
| Fuel Oil or Kerosene | 172 (1.0%) | 8 (0.3%) |
| Coal or Coke | 0 (0.0%) | 0 (0.0%) |
| All other Fuels | 80 (0.4%) | 38 (1.3%) |
| No Fuel Used | 0 (0.0%) | 0 (0.0%) |
| Total | 17,963 (100.0%) | 2,912 (100.0%) |
Household Vehicle Usage in Bowie
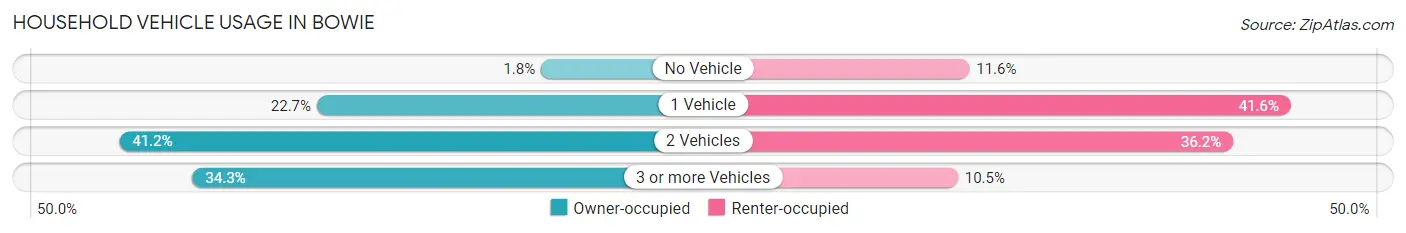
| Vehicles per Household | Owner-occupied | Renter-occupied |
| No Vehicle | 322 (1.8%) | 338 (11.6%) |
| 1 Vehicle | 4,081 (22.7%) | 1,212 (41.6%) |
| 2 Vehicles | 7,394 (41.2%) | 1,055 (36.2%) |
| 3 or more Vehicles | 6,166 (34.3%) | 307 (10.5%) |
| Total | 17,963 (100.0%) | 2,912 (100.0%) |
Real Estate & Mortgages in Bowie
Real Estate and Mortgage Overview in Bowie
| Characteristic | Without Mortgage | With Mortgage |
| Housing Units | 3,143 | 14,820 |
| Median Property Value | $412,100 | $420,300 |
| Median Household Income | $119,263 | $7,590 |
| Monthly Housing Costs | $830 | $4,064 |
| Real Estate Taxes | $5,036 | $267 |
Property Value by Mortgage Status in Bowie
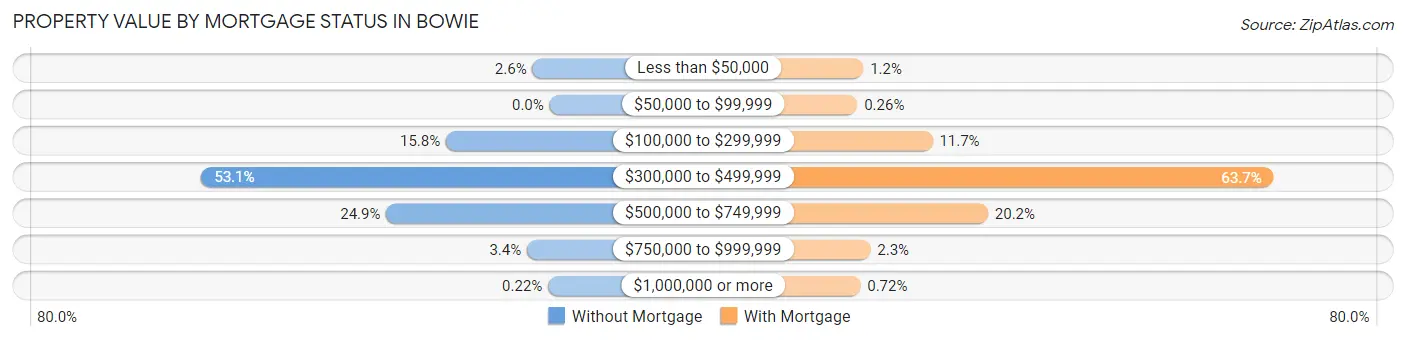
| Property Value | Without Mortgage | With Mortgage |
| Less than $50,000 | 82 (2.6%) | 174 (1.2%) |
| $50,000 to $99,999 | 0 (0.0%) | 38 (0.3%) |
| $100,000 to $299,999 | 496 (15.8%) | 1,737 (11.7%) |
| $300,000 to $499,999 | 1,668 (53.1%) | 9,441 (63.7%) |
| $500,000 to $749,999 | 782 (24.9%) | 2,988 (20.2%) |
| $750,000 to $999,999 | 108 (3.4%) | 335 (2.3%) |
| $1,000,000 or more | 7 (0.2%) | 107 (0.7%) |
| Total | 3,143 (100.0%) | 14,820 (100.0%) |
Household Income by Mortgage Status in Bowie
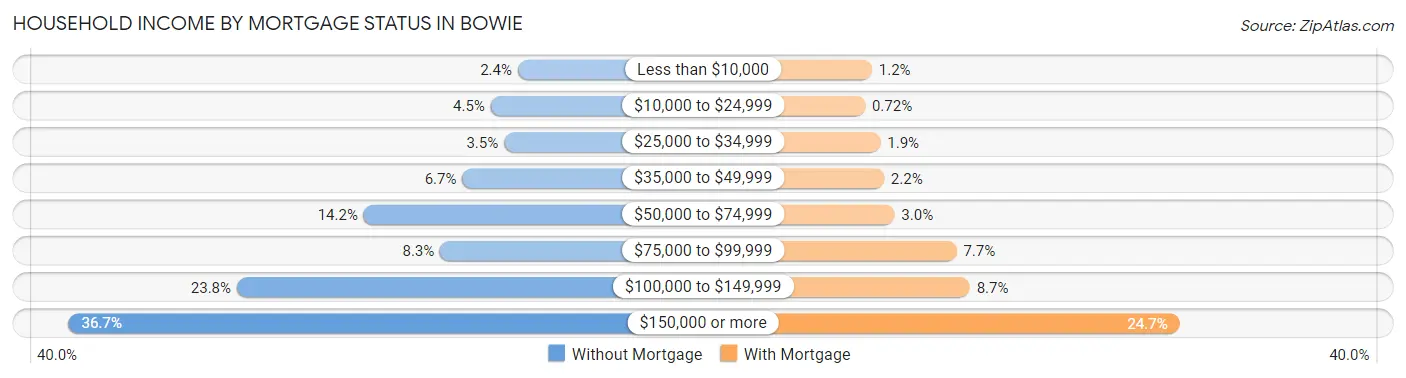
| Household Income | Without Mortgage | With Mortgage |
| Less than $10,000 | 76 (2.4%) | 184 (1.2%) |
| $10,000 to $24,999 | 141 (4.5%) | 106 (0.7%) |
| $25,000 to $34,999 | 109 (3.5%) | 280 (1.9%) |
| $35,000 to $49,999 | 209 (6.7%) | 320 (2.2%) |
| $50,000 to $74,999 | 445 (14.2%) | 438 (3.0%) |
| $75,000 to $99,999 | 262 (8.3%) | 1,140 (7.7%) |
| $100,000 to $149,999 | 749 (23.8%) | 1,289 (8.7%) |
| $150,000 or more | 1,152 (36.6%) | 3,657 (24.7%) |
| Total | 3,143 (100.0%) | 14,820 (100.0%) |
Property Value to Household Income Ratio in Bowie
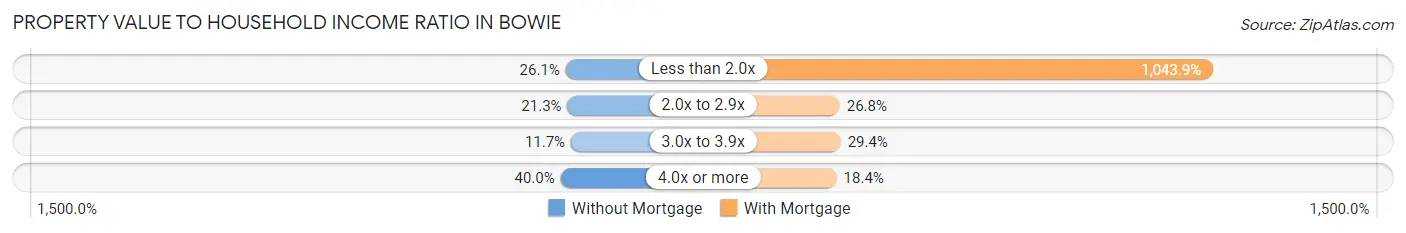
| Value-to-Income Ratio | Without Mortgage | With Mortgage |
| Less than 2.0x | 821 (26.1%) | 154,712 (1,043.9%) |
| 2.0x to 2.9x | 668 (21.2%) | 3,978 (26.8%) |
| 3.0x to 3.9x | 367 (11.7%) | 4,360 (29.4%) |
| 4.0x or more | 1,257 (40.0%) | 2,720 (18.3%) |
| Total | 3,143 (100.0%) | 14,820 (100.0%) |
Real Estate Taxes by Mortgage Status in Bowie
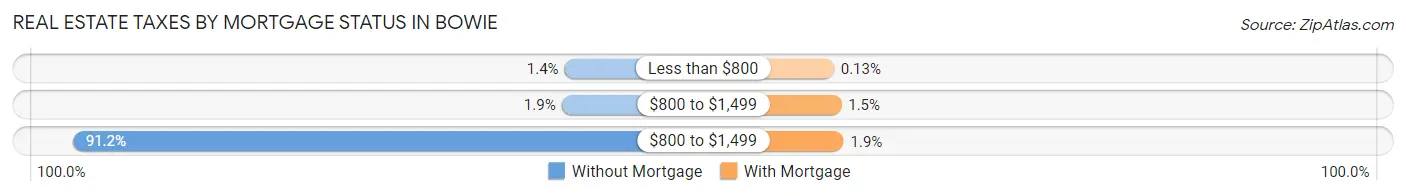
| Property Taxes | Without Mortgage | With Mortgage |
| Less than $800 | 44 (1.4%) | 20 (0.1%) |
| $800 to $1,499 | 61 (1.9%) | 222 (1.5%) |
| $800 to $1,499 | 2,866 (91.2%) | 284 (1.9%) |
| Total | 3,143 (100.0%) | 14,820 (100.0%) |
Health & Disability in Bowie
Health Insurance Coverage by Age in Bowie
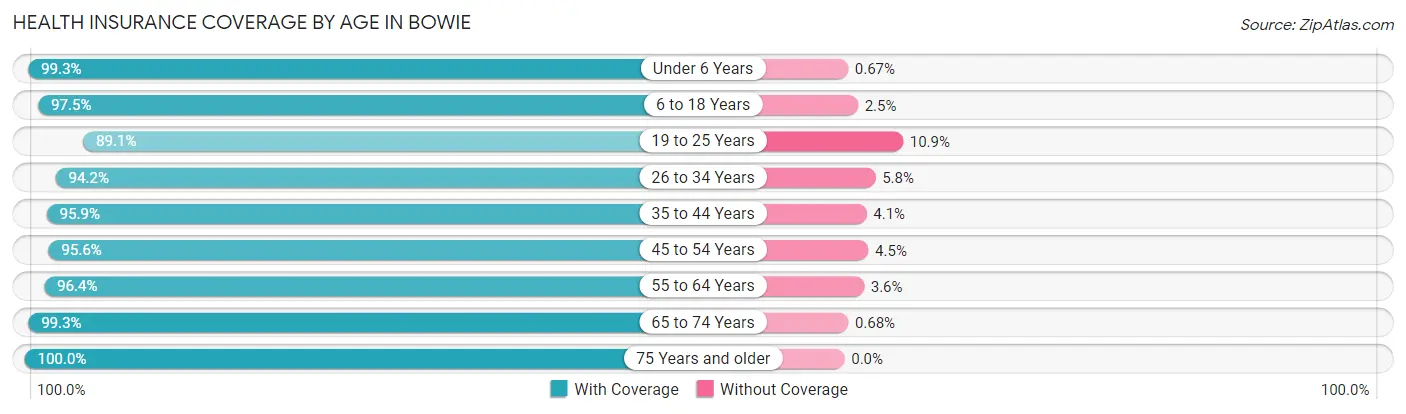
| Age Bracket | With Coverage | Without Coverage |
| Under 6 Years | 3,419 (99.3%) | 23 (0.7%) |
| 6 to 18 Years | 9,100 (97.5%) | 233 (2.5%) |
| 19 to 25 Years | 3,642 (89.1%) | 446 (10.9%) |
| 26 to 34 Years | 5,606 (94.2%) | 343 (5.8%) |
| 35 to 44 Years | 6,788 (95.9%) | 291 (4.1%) |
| 45 to 54 Years | 8,347 (95.6%) | 389 (4.4%) |
| 55 to 64 Years | 9,948 (96.4%) | 375 (3.6%) |
| 65 to 74 Years | 5,135 (99.3%) | 35 (0.7%) |
| 75 Years and older | 3,234 (100.0%) | 0 (0.0%) |
| Total | 55,219 (96.3%) | 2,135 (3.7%) |
Health Insurance Coverage by Citizenship Status in Bowie
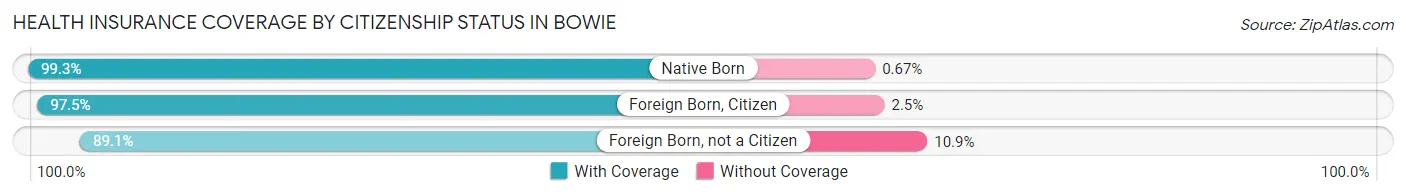
| Citizenship Status | With Coverage | Without Coverage |
| Native Born | 3,419 (99.3%) | 23 (0.7%) |
| Foreign Born, Citizen | 9,100 (97.5%) | 233 (2.5%) |
| Foreign Born, not a Citizen | 3,642 (89.1%) | 446 (10.9%) |
Health Insurance Coverage by Household Income in Bowie
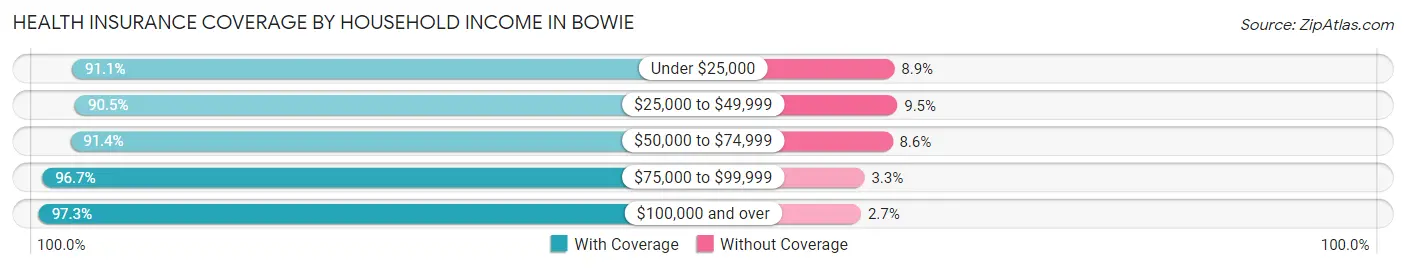
| Household Income | With Coverage | Without Coverage |
| Under $25,000 | 1,350 (91.1%) | 132 (8.9%) |
| $25,000 to $49,999 | 2,679 (90.5%) | 280 (9.5%) |
| $50,000 to $74,999 | 4,495 (91.4%) | 421 (8.6%) |
| $75,000 to $99,999 | 3,939 (96.7%) | 135 (3.3%) |
| $100,000 and over | 42,516 (97.3%) | 1,164 (2.7%) |
Public vs Private Health Insurance Coverage by Age in Bowie
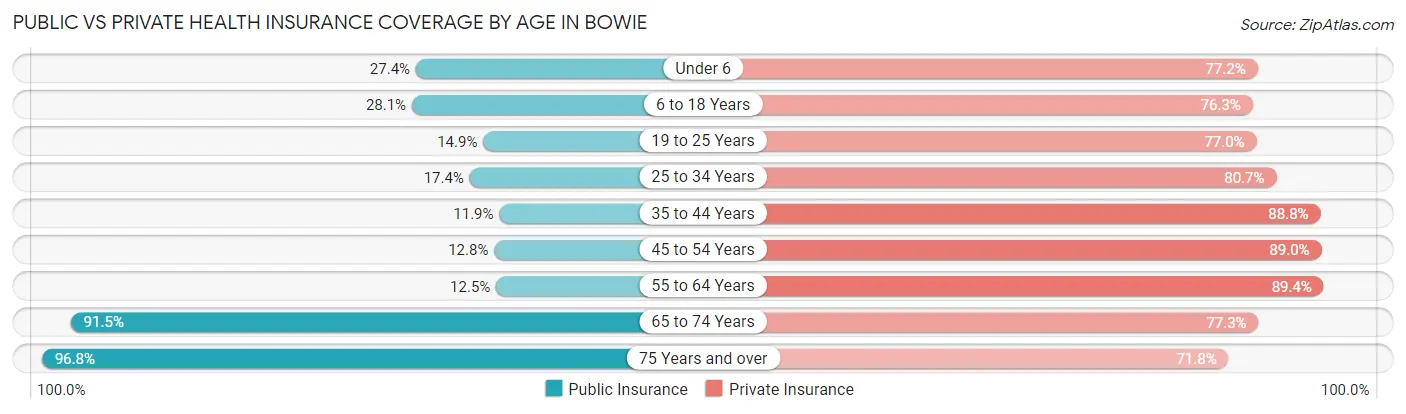
| Age Bracket | Public Insurance | Private Insurance |
| Under 6 | 942 (27.4%) | 2,656 (77.2%) |
| 6 to 18 Years | 2,623 (28.1%) | 7,117 (76.3%) |
| 19 to 25 Years | 608 (14.9%) | 3,146 (77.0%) |
| 25 to 34 Years | 1,034 (17.4%) | 4,798 (80.6%) |
| 35 to 44 Years | 841 (11.9%) | 6,288 (88.8%) |
| 45 to 54 Years | 1,121 (12.8%) | 7,777 (89.0%) |
| 55 to 64 Years | 1,287 (12.5%) | 9,233 (89.4%) |
| 65 to 74 Years | 4,728 (91.4%) | 3,998 (77.3%) |
| 75 Years and over | 3,131 (96.8%) | 2,321 (71.8%) |
| Total | 16,315 (28.4%) | 47,334 (82.5%) |
Disability Status by Sex by Age in Bowie
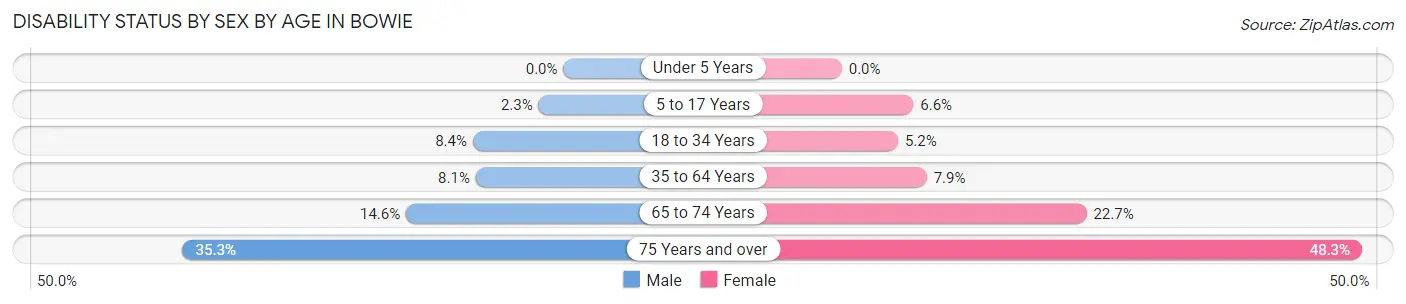
| Age Bracket | Male | Female |
| Under 5 Years | 0 (0.0%) | 0 (0.0%) |
| 5 to 17 Years | 109 (2.3%) | 316 (6.6%) |
| 18 to 34 Years | 452 (8.4%) | 265 (5.2%) |
| 35 to 64 Years | 966 (8.1%) | 1,123 (7.9%) |
| 65 to 74 Years | 346 (14.6%) | 636 (22.7%) |
| 75 Years and over | 390 (35.3%) | 1,028 (48.3%) |
Disability Class by Sex by Age in Bowie
Disability Class: Hearing Difficulty
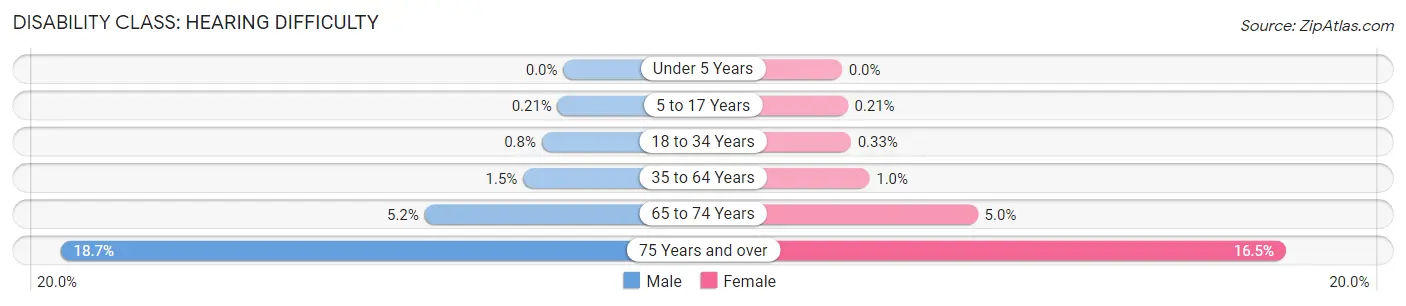
| Age Bracket | Male | Female |
| Under 5 Years | 0 (0.0%) | 0 (0.0%) |
| 5 to 17 Years | 10 (0.2%) | 10 (0.2%) |
| 18 to 34 Years | 43 (0.8%) | 17 (0.3%) |
| 35 to 64 Years | 177 (1.5%) | 146 (1.0%) |
| 65 to 74 Years | 122 (5.1%) | 141 (5.0%) |
| 75 Years and over | 206 (18.7%) | 351 (16.5%) |
Disability Class: Vision Difficulty
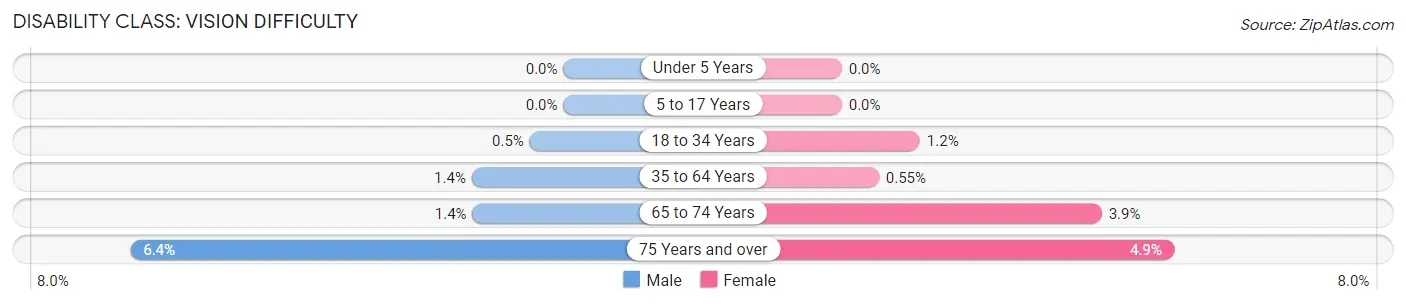
| Age Bracket | Male | Female |
| Under 5 Years | 0 (0.0%) | 0 (0.0%) |
| 5 to 17 Years | 0 (0.0%) | 0 (0.0%) |
| 18 to 34 Years | 27 (0.5%) | 59 (1.2%) |
| 35 to 64 Years | 162 (1.4%) | 79 (0.5%) |
| 65 to 74 Years | 32 (1.3%) | 108 (3.9%) |
| 75 Years and over | 71 (6.4%) | 105 (4.9%) |
Disability Class: Cognitive Difficulty
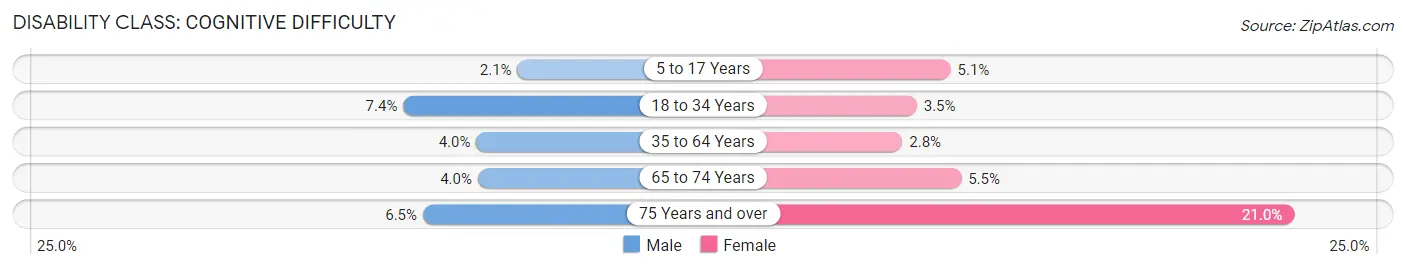
| Age Bracket | Male | Female |
| 5 to 17 Years | 101 (2.1%) | 240 (5.1%) |
| 18 to 34 Years | 400 (7.4%) | 177 (3.5%) |
| 35 to 64 Years | 480 (4.0%) | 400 (2.8%) |
| 65 to 74 Years | 94 (4.0%) | 155 (5.5%) |
| 75 Years and over | 72 (6.5%) | 447 (21.0%) |
Disability Class: Ambulatory Difficulty
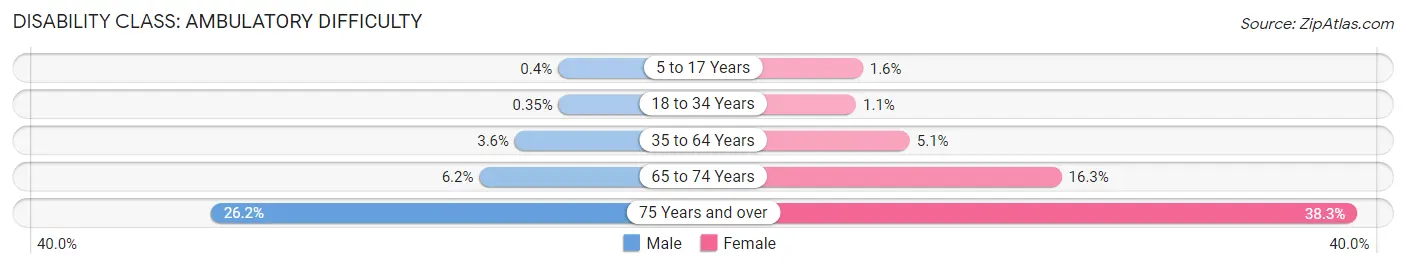
| Age Bracket | Male | Female |
| 5 to 17 Years | 19 (0.4%) | 74 (1.6%) |
| 18 to 34 Years | 19 (0.4%) | 54 (1.1%) |
| 35 to 64 Years | 428 (3.6%) | 719 (5.1%) |
| 65 to 74 Years | 148 (6.2%) | 457 (16.3%) |
| 75 Years and over | 289 (26.2%) | 815 (38.3%) |
Disability Class: Self-Care Difficulty
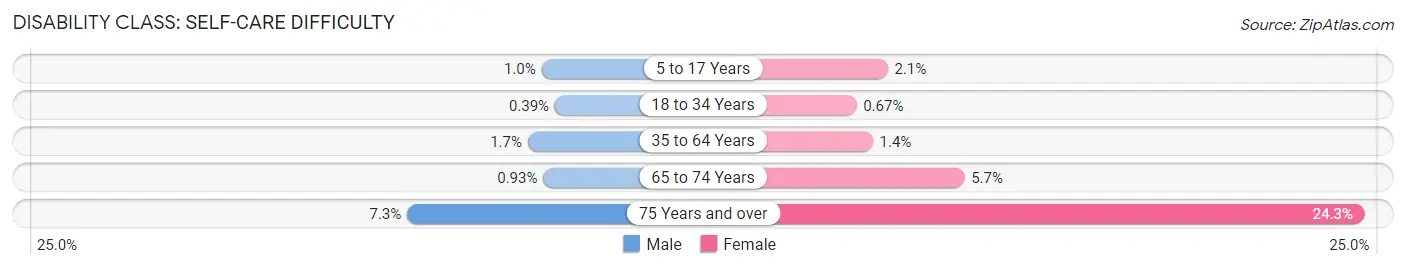
| Age Bracket | Male | Female |
| 5 to 17 Years | 48 (1.0%) | 101 (2.1%) |
| 18 to 34 Years | 21 (0.4%) | 34 (0.7%) |
| 35 to 64 Years | 196 (1.7%) | 204 (1.4%) |
| 65 to 74 Years | 22 (0.9%) | 159 (5.7%) |
| 75 Years and over | 80 (7.2%) | 517 (24.3%) |
Technology Access in Bowie
Computing Device Access in Bowie
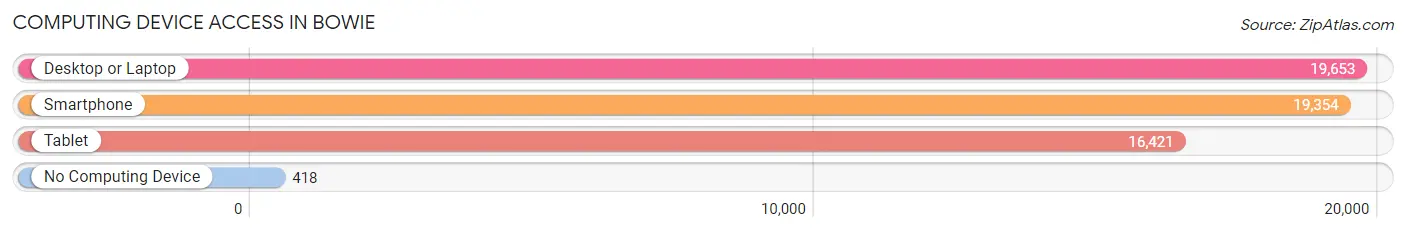
| Device Type | # Households | % Households |
| Desktop or Laptop | 19,653 | 94.2% |
| Smartphone | 19,354 | 92.7% |
| Tablet | 16,421 | 78.7% |
| No Computing Device | 418 | 2.0% |
| Total | 20,875 | 100.0% |
Internet Access in Bowie
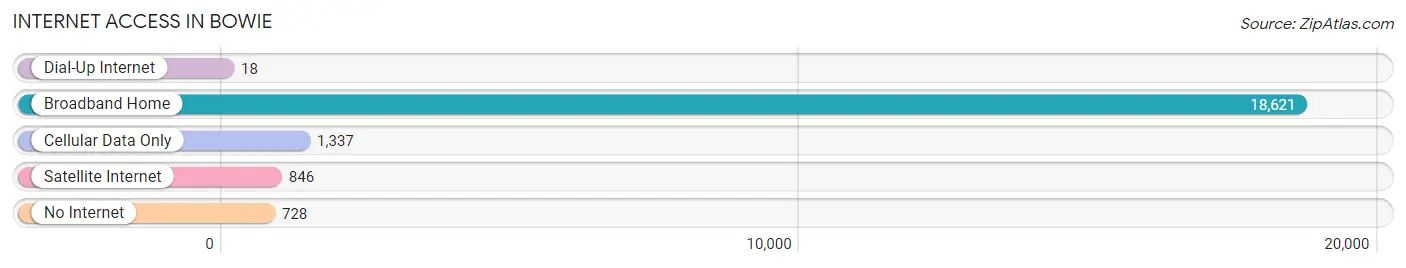
| Internet Type | # Households | % Households |
| Dial-Up Internet | 18 | 0.1% |
| Broadband Home | 18,621 | 89.2% |
| Cellular Data Only | 1,337 | 6.4% |
| Satellite Internet | 846 | 4.1% |
| No Internet | 728 | 3.5% |
| Total | 20,875 | 100.0% |
Bowie Summary
Bowie, Maryland is a city located in Prince George’s County, Maryland, United States. It is located approximately 15 miles east of Washington, D.C. and is part of the Washington metropolitan area. As of the 2010 census, the population of Bowie was 54,727, making it the largest city in Prince George’s County.
History
The area that is now Bowie was first settled in the early 1700s by the Piscataway tribe. The area was then known as Huntington, and was part of Anne Arundel County. In 1853, the area was renamed Bowie, after Governor Oden Bowie. The city was officially incorporated in 1916.
In the early 20th century, Bowie was a rural farming community. In the 1950s, the city began to experience rapid growth as the Washington metropolitan area expanded. This growth was fueled by the construction of the Capital Beltway and the Bowie Race Track, which opened in 1949.
Geography
Bowie is located at 38°57'45"N 76°44'45"W (38.9625, -76.7458). According to the United States Census Bureau, the city has a total area of 24.2 square miles, of which 23.9 square miles is land and 0.3 square miles is water.
The city is located in the Piedmont region of Maryland, and is bordered by the Patuxent River to the east and the Patapsco River to the west. The city is located in a hilly area, with elevations ranging from 100 to 400 feet above sea level.
Economy
Bowie’s economy is largely based on the service industry. The city is home to several large employers, including the Bowie Baysox minor league baseball team, the Bowie State University, and the Bowie Race Track. The city is also home to several large retail centers, including the Bowie Town Center and the Bowie Marketplace.
Demographics
As of the 2010 census, there were 54,727 people, 19,845 households, and 14,845 families residing in the city. The population density was 2,279.3 people per square mile. The racial makeup of the city was 54.2% White, 33.3% African American, 0.4% Native American, 5.2% Asian, 0.1% Pacific Islander, 3.7% from other races, and 3.1% from two or more races. Hispanic or Latino of any race were 8.7% of the population.
The median income for a household in the city was $76,845, and the median income for a family was $90,945. The per capita income for the city was $35,945. About 4.2% of families and 6.2% of the population were below the poverty line, including 8.2% of those under age 18 and 5.2% of those age 65 or over.
Common Questions
What is Per Capita Income in Bowie?
Per Capita income in Bowie is $57,492.
What is the Median Family Income in Bowie?
Median Family Income in Bowie is $150,120.
What is the Median Household income in Bowie?
Median Household Income in Bowie is $138,797.
What is Income or Wage Gap in Bowie?
Income or Wage Gap in Bowie is 3.1%.
Women in Bowie earn 96.9 cents for every dollar earned by a man.
What is Family Income Deficit in Bowie?
Family Income Deficit in Bowie is $11,550.
Families that are below poverty line in Bowie earn $11,550 less on average than the poverty threshold level.
What is Inequality or Gini Index in Bowie?
Inequality or Gini Index in Bowie is 0.35.
What is the Total Population of Bowie?
Total Population of Bowie is 57,922.
What is the Total Male Population of Bowie?
Total Male Population of Bowie is 27,333.
What is the Total Female Population of Bowie?
Total Female Population of Bowie is 30,589.
What is the Ratio of Males per 100 Females in Bowie?
There are 89.36 Males per 100 Females in Bowie.
What is the Ratio of Females per 100 Males in Bowie?
There are 111.91 Females per 100 Males in Bowie.
What is the Median Population Age in Bowie?
Median Population Age in Bowie is 43.2 Years.
What is the Average Family Size in Bowie
Average Family Size in Bowie is 3.3 People.
What is the Average Household Size in Bowie
Average Household Size in Bowie is 2.8 People.
How Large is the Labor Force in Bowie?
There are 34,295 People in the Labor Forcein in Bowie.
What is the Percentage of People in the Labor Force in Bowie?
72.7% of People are in the Labor Force in Bowie.
What is the Unemployment Rate in Bowie?
Unemployment Rate in Bowie is 5.1%.