Rockwall, TX Map & Demographics
Rockwall Map
Rockwall Overview
$50,916
PER CAPITA INCOME
$129,992
AVG FAMILY INCOME
$114,799
AVG HOUSEHOLD INCOME
33.8%
WAGE / INCOME GAP [ % ]
66.2¢/ $1
WAGE / INCOME GAP [ $ ]
0.40
INEQUALITY / GINI INDEX
47,859
TOTAL POPULATION
23,597
MALE POPULATION
24,262
FEMALE POPULATION
97.26
MALES / 100 FEMALES
102.82
FEMALES / 100 MALES
38.6
MEDIAN AGE
3.1
AVG FAMILY SIZE
2.8
AVG HOUSEHOLD SIZE
26,477
LABOR FORCE [ PEOPLE ]
70.6%
PERCENT IN LABOR FORCE
3.1%
UNEMPLOYMENT RATE
Income in Rockwall
Income Overview in Rockwall
Per Capita Income in Rockwall is $50,916, while median incomes of families and households are $129,992 and $114,799 respectively.
| Characteristic | Number | Measure |
| Per Capita Income | 47,859 | $50,916 |
| Median Family Income | 13,451 | $129,992 |
| Mean Family Income | 13,451 | $157,654 |
| Median Household Income | 17,092 | $114,799 |
| Mean Household Income | 17,092 | $141,266 |
| Income Deficit | 13,451 | $0 |
| Wage / Income Gap (%) | 47,859 | 33.77% |
| Wage / Income Gap ($) | 47,859 | 66.23¢ per $1 |
| Gini / Inequality Index | 47,859 | 0.40 |
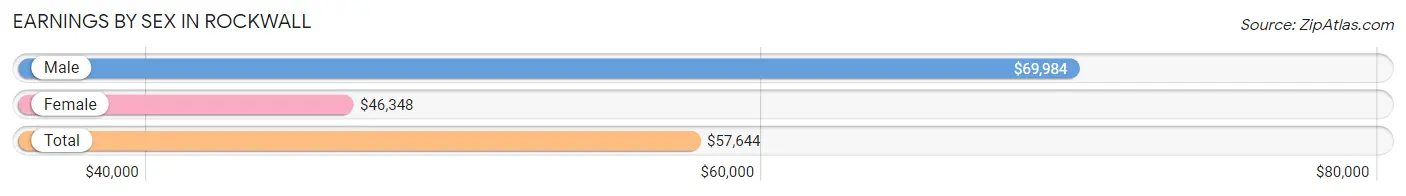
Earnings by Sex in Rockwall
Average Earnings in Rockwall are $57,644, $69,984 for men and $46,348 for women, a difference of 33.8%.
| Sex | Number | Average Earnings |
| Male | 14,527 (52.0%) | $69,984 |
| Female | 13,408 (48.0%) | $46,348 |
| Total | 27,935 (100.0%) | $57,644 |
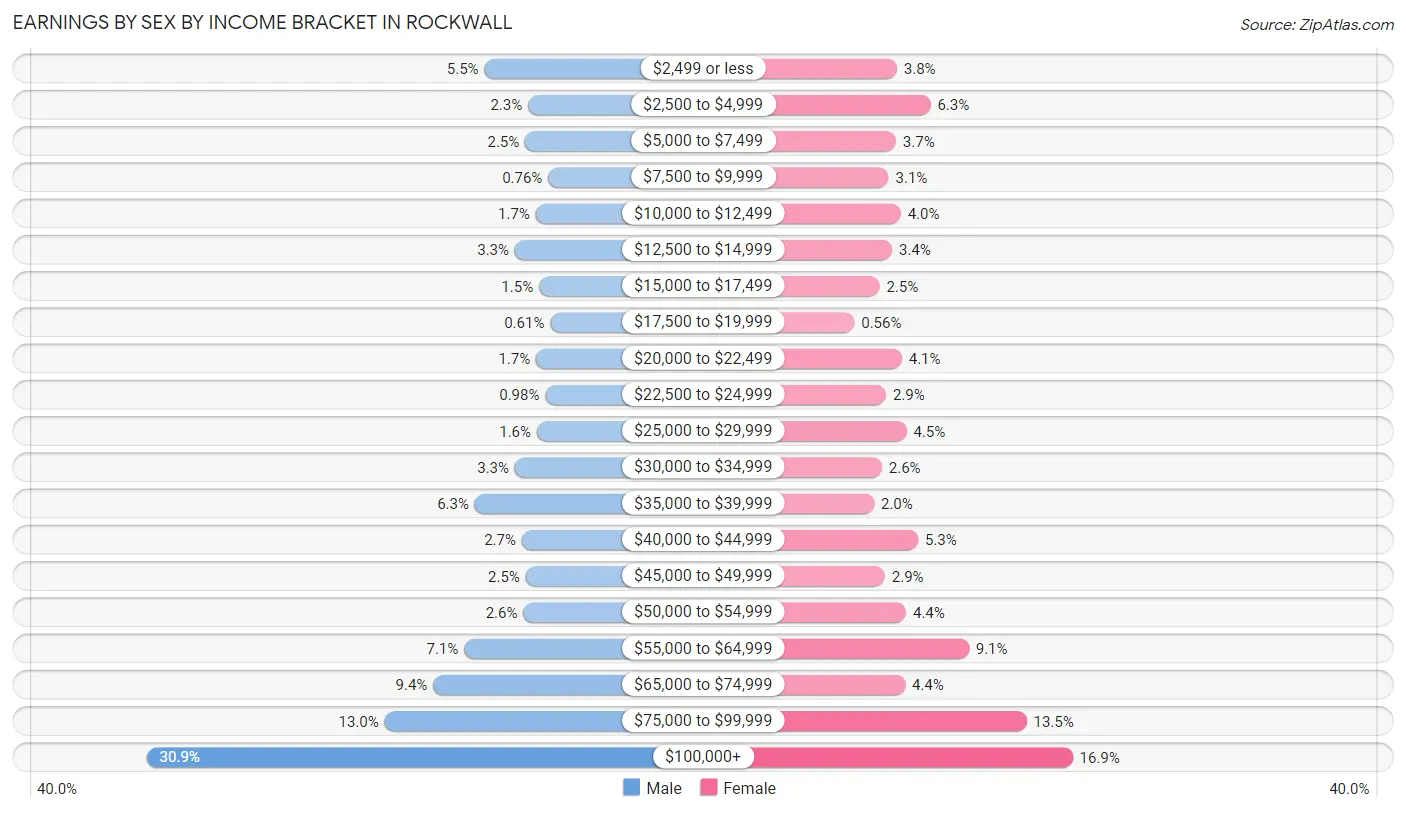
Earnings by Sex by Income Bracket in Rockwall
The most common earnings brackets in Rockwall are $100,000+ for men (4,481 | 30.8%) and $100,000+ for women (2,269 | 16.9%).
| Income | Male | Female |
| $2,499 or less | 805 (5.5%) | 503 (3.7%) |
| $2,500 to $4,999 | 330 (2.3%) | 841 (6.3%) |
| $5,000 to $7,499 | 361 (2.5%) | 494 (3.7%) |
| $7,500 to $9,999 | 111 (0.8%) | 420 (3.1%) |
| $10,000 to $12,499 | 247 (1.7%) | 542 (4.0%) |
| $12,500 to $14,999 | 474 (3.3%) | 455 (3.4%) |
| $15,000 to $17,499 | 211 (1.5%) | 328 (2.5%) |
| $17,500 to $19,999 | 88 (0.6%) | 75 (0.6%) |
| $20,000 to $22,499 | 242 (1.7%) | 552 (4.1%) |
| $22,500 to $24,999 | 143 (1.0%) | 394 (2.9%) |
| $25,000 to $29,999 | 234 (1.6%) | 600 (4.5%) |
| $30,000 to $34,999 | 473 (3.3%) | 352 (2.6%) |
| $35,000 to $39,999 | 910 (6.3%) | 274 (2.0%) |
| $40,000 to $44,999 | 398 (2.7%) | 716 (5.3%) |
| $45,000 to $49,999 | 356 (2.5%) | 382 (2.9%) |
| $50,000 to $54,999 | 382 (2.6%) | 595 (4.4%) |
| $55,000 to $64,999 | 1,026 (7.1%) | 1,226 (9.1%) |
| $65,000 to $74,999 | 1,363 (9.4%) | 584 (4.4%) |
| $75,000 to $99,999 | 1,892 (13.0%) | 1,806 (13.5%) |
| $100,000+ | 4,481 (30.8%) | 2,269 (16.9%) |
| Total | 14,527 (100.0%) | 13,408 (100.0%) |
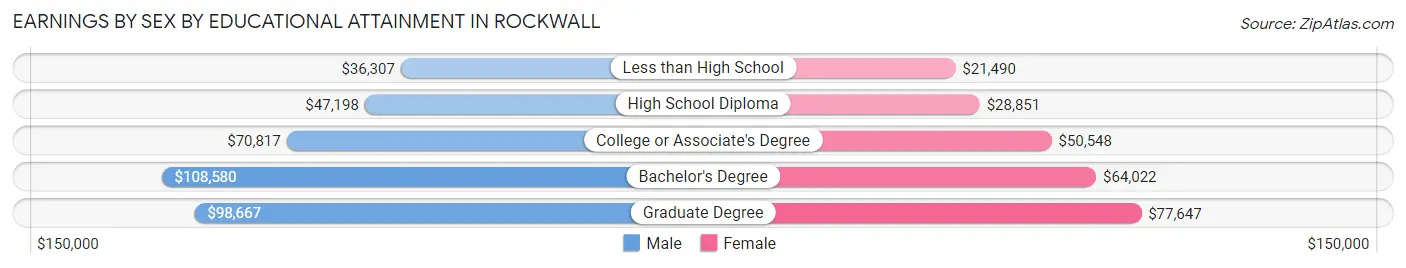
Earnings by Sex by Educational Attainment in Rockwall
Average earnings in Rockwall are $75,655 for men and $54,956 for women, a difference of 27.4%. Men with an educational attainment of bachelor's degree enjoy the highest average annual earnings of $108,580, while those with less than high school education earn the least with $36,307. Women with an educational attainment of graduate degree earn the most with the average annual earnings of $77,647, while those with less than high school education have the smallest earnings of $21,490.
| Educational Attainment | Male Income | Female Income |
| Less than High School | $36,307 | $21,490 |
| High School Diploma | $47,198 | $28,851 |
| College or Associate's Degree | $70,817 | $50,548 |
| Bachelor's Degree | $108,580 | $64,022 |
| Graduate Degree | $98,667 | $77,647 |
| Total | $75,655 | $54,956 |
Family Income in Rockwall
Family Income Brackets in Rockwall
According to the Rockwall family income data, there are 3,430 families falling into the $200,000+ income range, which is the most common income bracket and makes up 25.5% of all families. Conversely, the $10,000 to $14,999 income bracket is the least frequent group with only 81 families (0.6%) belonging to this category.
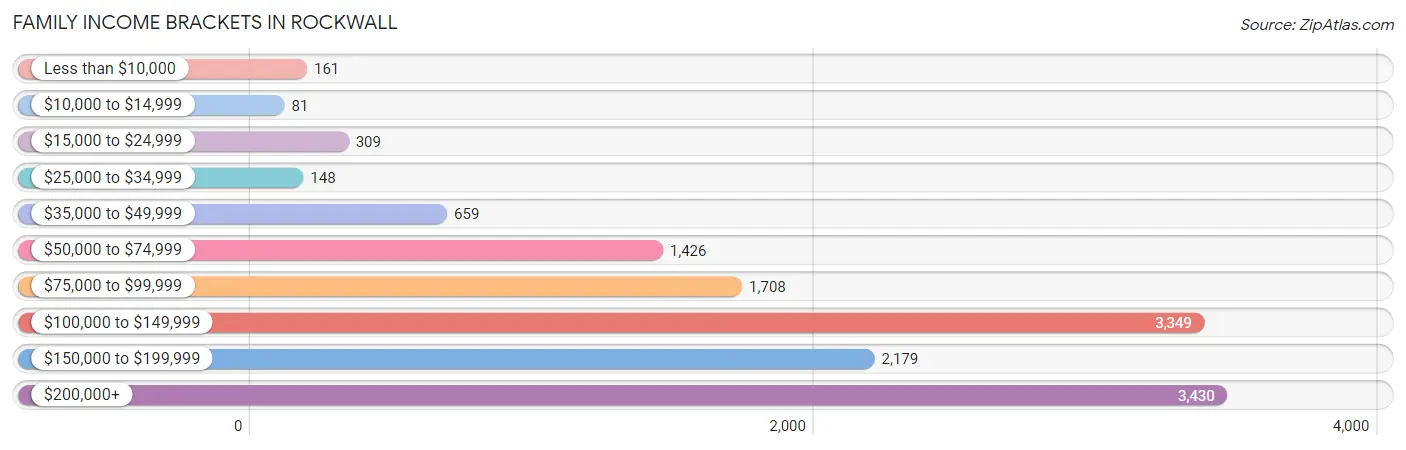
| Income Bracket | # Families | % Families |
| Less than $10,000 | 161 | 1.2% |
| $10,000 to $14,999 | 81 | 0.6% |
| $15,000 to $24,999 | 309 | 2.3% |
| $25,000 to $34,999 | 148 | 1.1% |
| $35,000 to $49,999 | 659 | 4.9% |
| $50,000 to $74,999 | 1,426 | 10.6% |
| $75,000 to $99,999 | 1,708 | 12.7% |
| $100,000 to $149,999 | 3,349 | 24.9% |
| $150,000 to $199,999 | 2,179 | 16.2% |
| $200,000+ | 3,430 | 25.5% |
Family Income by Famaliy Size in Rockwall
5-person families (1,528 | 11.4%) account for the highest median family income in Rockwall with $192,138 per family, while 2-person families (5,372 | 39.9%) have the highest median income of $56,568 per family member.
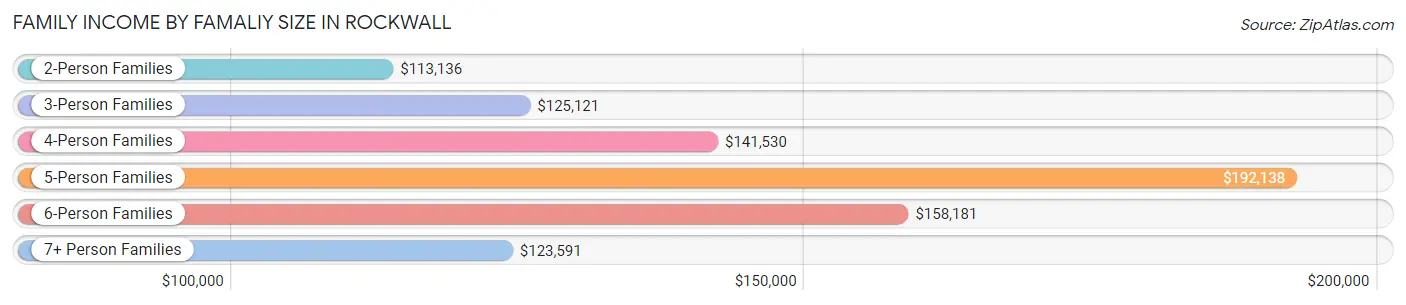
| Income Bracket | # Families | Median Income |
| 2-Person Families | 5,372 (39.9%) | $113,136 |
| 3-Person Families | 3,092 (23.0%) | $125,121 |
| 4-Person Families | 2,835 (21.1%) | $141,530 |
| 5-Person Families | 1,528 (11.4%) | $192,138 |
| 6-Person Families | 466 (3.5%) | $158,181 |
| 7+ Person Families | 158 (1.2%) | $123,591 |
| Total | 13,451 (100.0%) | $129,992 |
Family Income by Number of Earners in Rockwall
The median family income in Rockwall is $129,992, with families comprising 3+ earners (2,295) having the highest median family income of $161,477, while families with no earners (1,099) have the lowest median family income of $67,039, accounting for 17.1% and 8.2% of families, respectively.
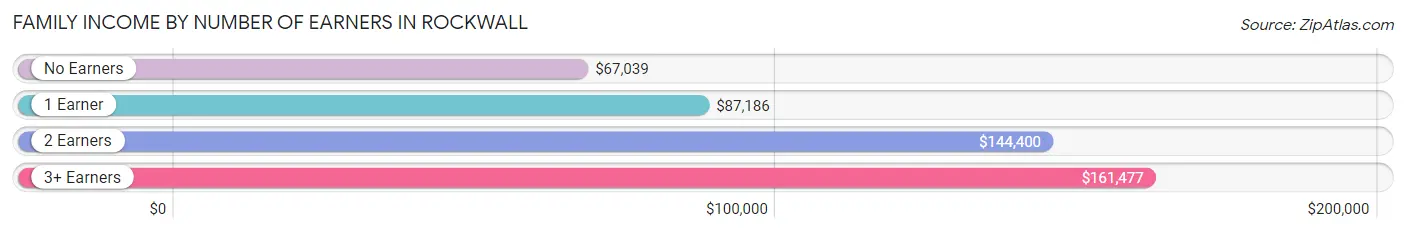
| Number of Earners | # Families | Median Income |
| No Earners | 1,099 (8.2%) | $67,039 |
| 1 Earner | 3,519 (26.2%) | $87,186 |
| 2 Earners | 6,538 (48.6%) | $144,400 |
| 3+ Earners | 2,295 (17.1%) | $161,477 |
| Total | 13,451 (100.0%) | $129,992 |
Household Income in Rockwall
Household Income Brackets in Rockwall
With 3,692 households falling in the category, the $200,000+ income range is the most frequent in Rockwall, accounting for 21.6% of all households. In contrast, only 171 households (1.0%) fall into the $10,000 to $14,999 income bracket, making it the least populous group.
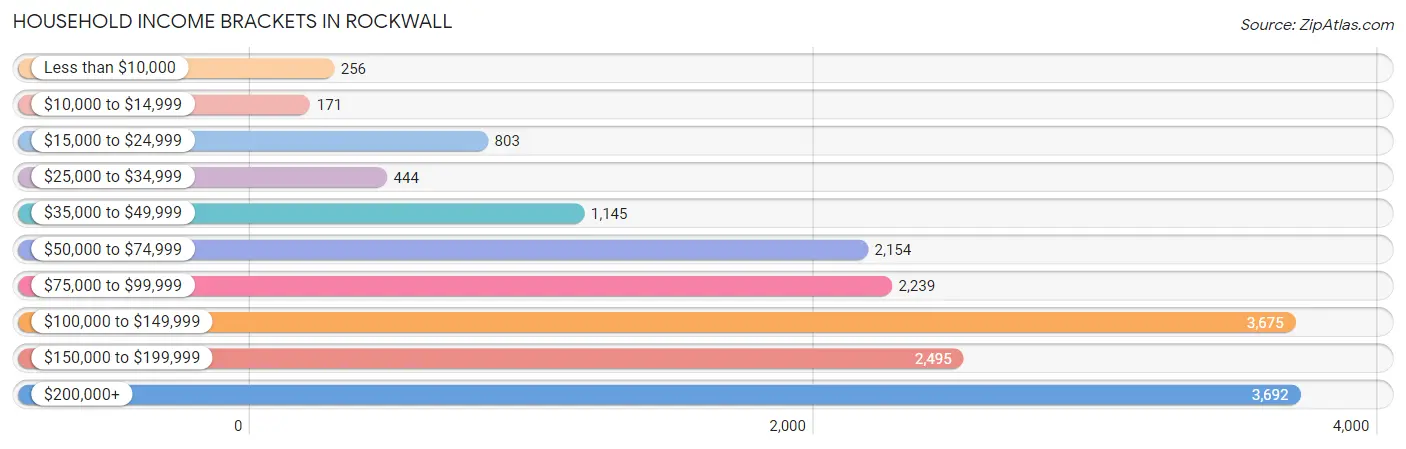
| Income Bracket | # Households | % Households |
| Less than $10,000 | 256 | 1.5% |
| $10,000 to $14,999 | 171 | 1.0% |
| $15,000 to $24,999 | 803 | 4.7% |
| $25,000 to $34,999 | 444 | 2.6% |
| $35,000 to $49,999 | 1,145 | 6.7% |
| $50,000 to $74,999 | 2,154 | 12.6% |
| $75,000 to $99,999 | 2,239 | 13.1% |
| $100,000 to $149,999 | 3,675 | 21.5% |
| $150,000 to $199,999 | 2,495 | 14.6% |
| $200,000+ | 3,692 | 21.6% |
Household Income by Householder Age in Rockwall
The median household income in Rockwall is $114,799, with the highest median household income of $143,824 found in the 45 to 64 years age bracket for the primary householder. A total of 6,832 households (40.0%) fall into this category. Meanwhile, the 65+ years age bracket for the primary householder has the lowest median household income of $73,713, with 3,994 households (23.4%) in this group.
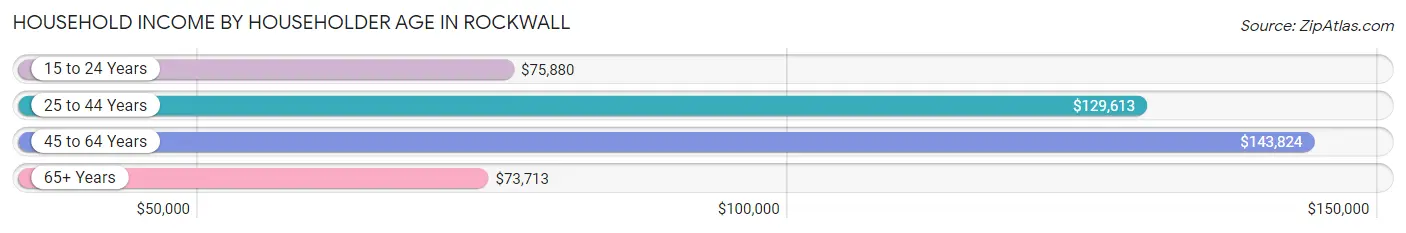
| Income Bracket | # Households | Median Income |
| 15 to 24 Years | 506 (3.0%) | $75,880 |
| 25 to 44 Years | 5,760 (33.7%) | $129,613 |
| 45 to 64 Years | 6,832 (40.0%) | $143,824 |
| 65+ Years | 3,994 (23.4%) | $73,713 |
| Total | 17,092 (100.0%) | $114,799 |
Poverty in Rockwall
Income Below Poverty by Sex and Age in Rockwall
With 2.8% poverty level for males and 3.3% for females among the residents of Rockwall, 5 year old males and 25 to 34 year old females are the most vulnerable to poverty, with 28 males (11.4%) and 226 females (8.5%) in their respective age groups living below the poverty level.
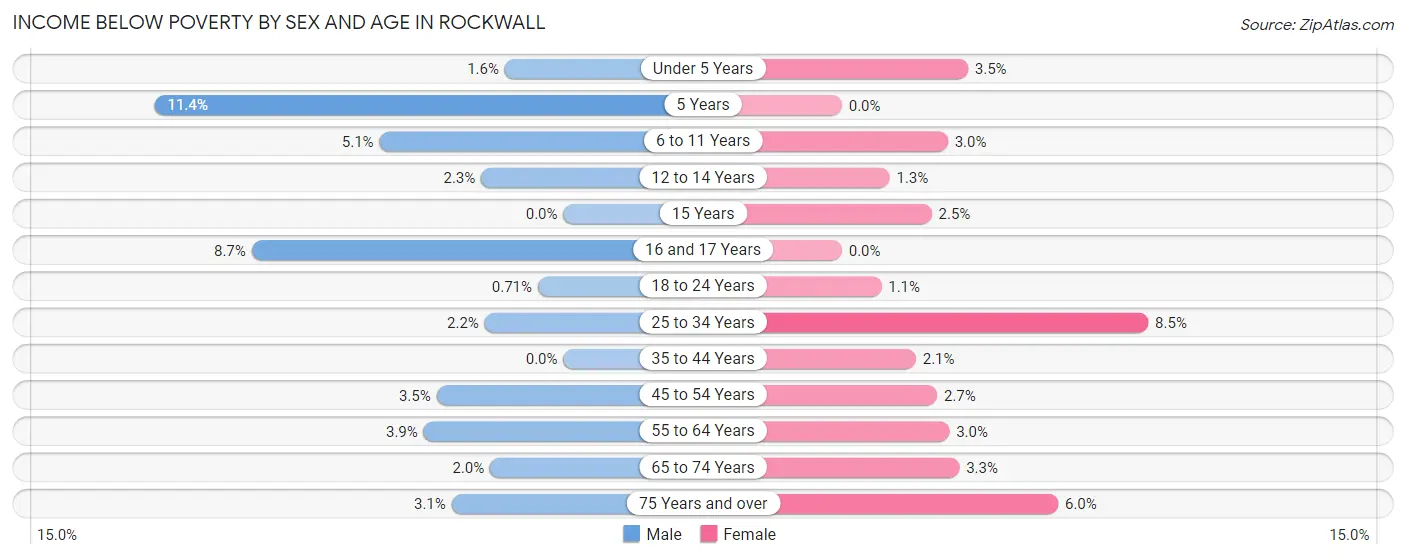
| Age Bracket | Male | Female |
| Under 5 Years | 23 (1.6%) | 50 (3.5%) |
| 5 Years | 28 (11.4%) | 0 (0.0%) |
| 6 to 11 Years | 104 (5.1%) | 47 (2.9%) |
| 12 to 14 Years | 29 (2.3%) | 14 (1.3%) |
| 15 Years | 0 (0.0%) | 13 (2.5%) |
| 16 and 17 Years | 92 (8.7%) | 0 (0.0%) |
| 18 to 24 Years | 14 (0.7%) | 23 (1.1%) |
| 25 to 34 Years | 57 (2.2%) | 226 (8.5%) |
| 35 to 44 Years | 0 (0.0%) | 71 (2.1%) |
| 45 to 54 Years | 125 (3.5%) | 103 (2.6%) |
| 55 to 64 Years | 105 (3.9%) | 80 (3.0%) |
| 65 to 74 Years | 35 (2.0%) | 63 (3.3%) |
| 75 Years and over | 31 (3.1%) | 102 (6.0%) |
| Total | 643 (2.8%) | 792 (3.3%) |
Income Above Poverty by Sex and Age in Rockwall
According to the poverty statistics in Rockwall, males aged 15 years and females aged 5 years are the age groups that are most secure financially, with 100.0% of males and 100.0% of females in these age groups living above the poverty line.
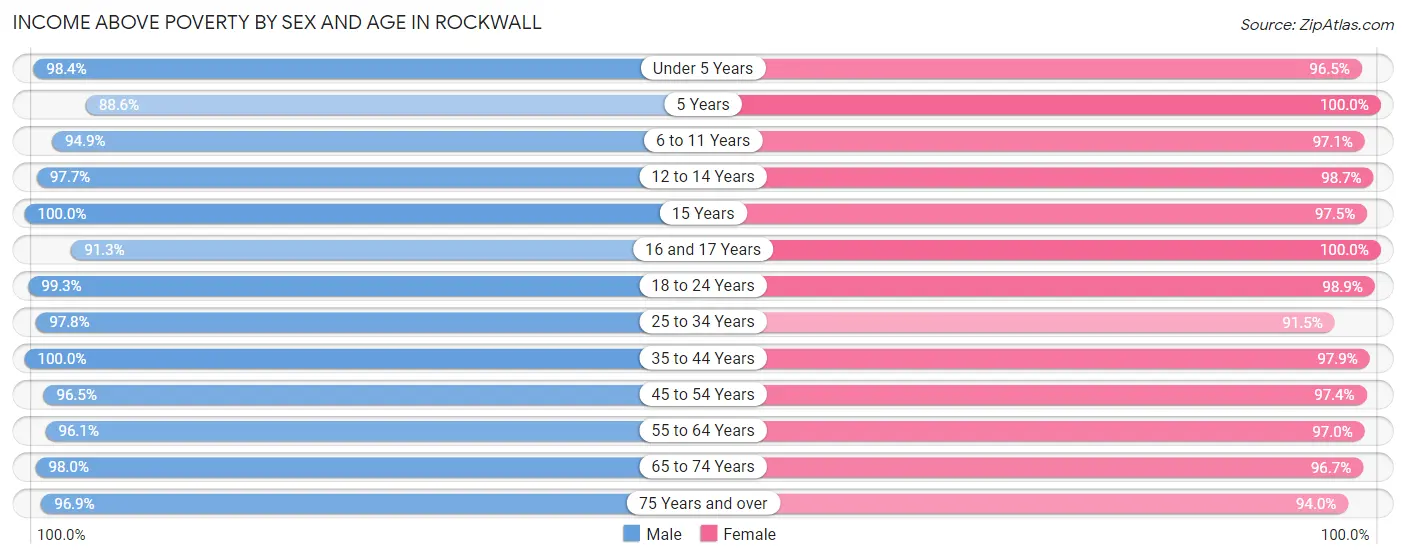
| Age Bracket | Male | Female |
| Under 5 Years | 1,392 (98.4%) | 1,376 (96.5%) |
| 5 Years | 218 (88.6%) | 205 (100.0%) |
| 6 to 11 Years | 1,927 (94.9%) | 1,547 (97.1%) |
| 12 to 14 Years | 1,238 (97.7%) | 1,035 (98.7%) |
| 15 Years | 344 (100.0%) | 506 (97.5%) |
| 16 and 17 Years | 968 (91.3%) | 743 (100.0%) |
| 18 to 24 Years | 1,961 (99.3%) | 2,060 (98.9%) |
| 25 to 34 Years | 2,549 (97.8%) | 2,425 (91.5%) |
| 35 to 44 Years | 3,464 (100.0%) | 3,376 (97.9%) |
| 45 to 54 Years | 3,420 (96.5%) | 3,790 (97.4%) |
| 55 to 64 Years | 2,593 (96.1%) | 2,596 (97.0%) |
| 65 to 74 Years | 1,677 (98.0%) | 1,862 (96.7%) |
| 75 Years and over | 966 (96.9%) | 1,591 (94.0%) |
| Total | 22,717 (97.3%) | 23,112 (96.7%) |
Income Below Poverty Among Married-Couple Families in Rockwall
The poverty statistics for married-couple families in Rockwall show that 1.2% or 137 of the total 11,498 families live below the poverty line. Families with no children have the highest poverty rate of 1.5%, comprising of 79 families. On the other hand, families with 3 or 4 children have the lowest poverty rate of 0.0%, which includes 0 families.
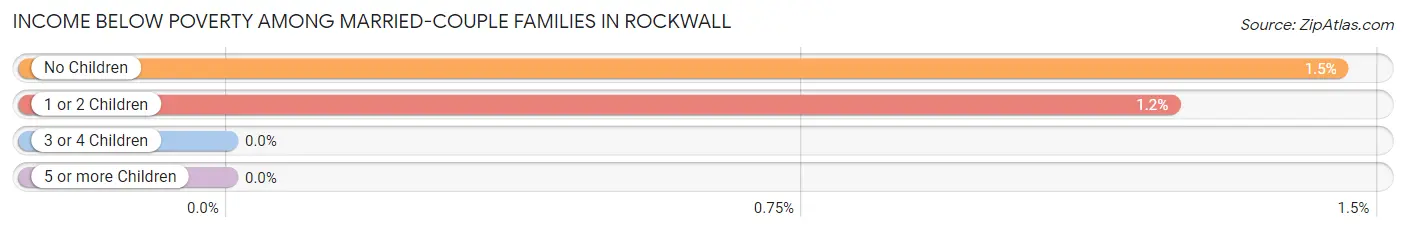
| Children | Above Poverty | Below Poverty |
| No Children | 5,354 (98.6%) | 79 (1.5%) |
| 1 or 2 Children | 4,666 (98.8%) | 58 (1.2%) |
| 3 or 4 Children | 1,285 (100.0%) | 0 (0.0%) |
| 5 or more Children | 56 (100.0%) | 0 (0.0%) |
| Total | 11,361 (98.8%) | 137 (1.2%) |
Income Below Poverty Among Single-Parent Households in Rockwall
According to the poverty data in Rockwall, 15.7% or 78 single-father households and 10.1% or 147 single-mother households are living below the poverty line. Among single-father households, those with no children have the highest poverty rate, with 27 households (18.4%) experiencing poverty. Likewise, among single-mother households, those with 3 or 4 children have the highest poverty rate, with 23 households (33.8%) falling below the poverty line.
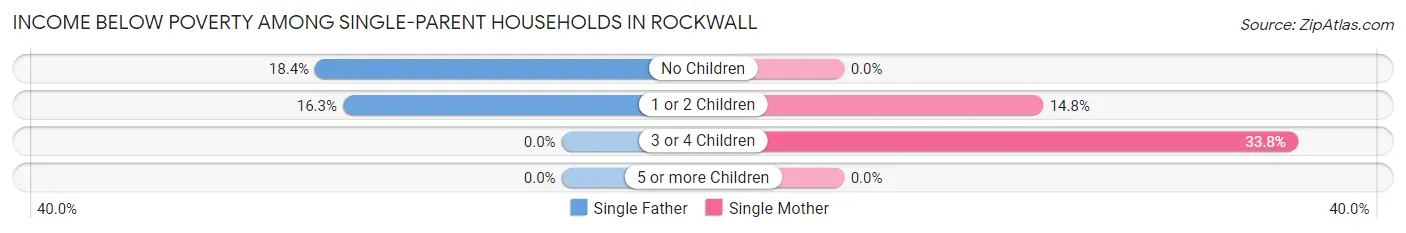
| Children | Single Father | Single Mother |
| No Children | 27 (18.4%) | 0 (0.0%) |
| 1 or 2 Children | 51 (16.3%) | 124 (14.8%) |
| 3 or 4 Children | 0 (0.0%) | 23 (33.8%) |
| 5 or more Children | 0 (0.0%) | 0 (0.0%) |
| Total | 78 (15.7%) | 147 (10.1%) |
Income Below Poverty Among Married-Couple vs Single-Parent Households in Rockwall
The poverty data for Rockwall shows that 137 of the married-couple family households (1.2%) and 225 of the single-parent households (11.5%) are living below the poverty level. Within the married-couple family households, those with no children have the highest poverty rate, with 79 households (1.5%) falling below the poverty line. Among the single-parent households, those with 3 or 4 children have the highest poverty rate, with 23 household (21.7%) living below poverty.
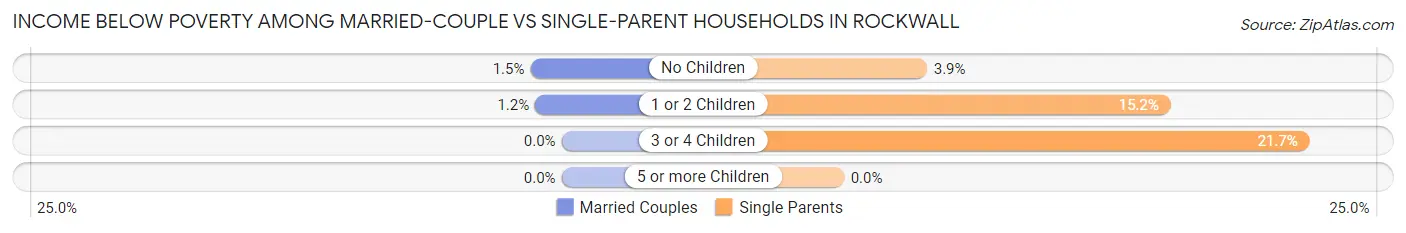
| Children | Married-Couple Families | Single-Parent Households |
| No Children | 79 (1.5%) | 27 (3.9%) |
| 1 or 2 Children | 58 (1.2%) | 175 (15.2%) |
| 3 or 4 Children | 0 (0.0%) | 23 (21.7%) |
| 5 or more Children | 0 (0.0%) | 0 (0.0%) |
| Total | 137 (1.2%) | 225 (11.5%) |
Race in Rockwall
The most populous races in Rockwall are White / Caucasian (36,774 | 76.8%), Hispanic or Latino (8,337 | 17.4%), and Two or more Races (3,707 | 7.7%).
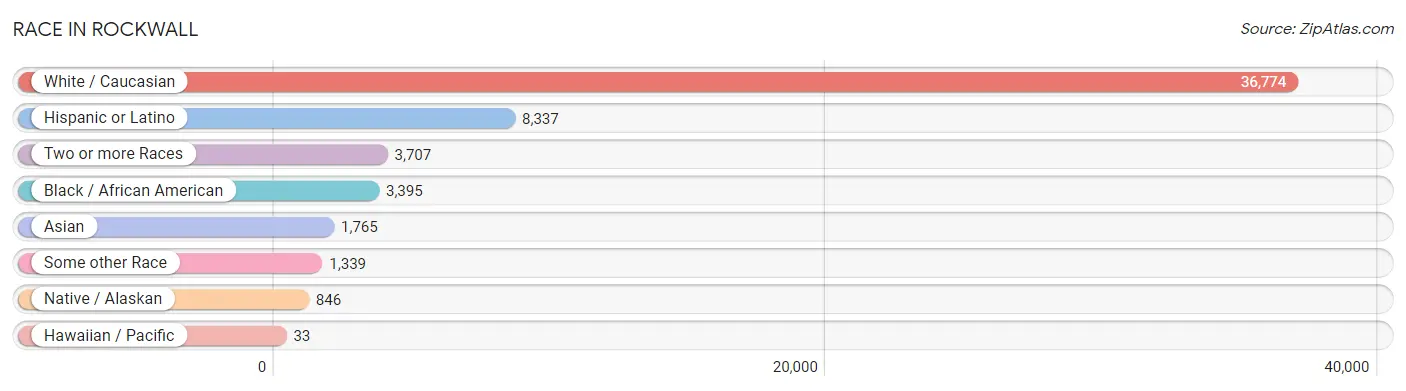
| Race | # Population | % Population |
| Asian | 1,765 | 3.7% |
| Black / African American | 3,395 | 7.1% |
| Hawaiian / Pacific | 33 | 0.1% |
| Hispanic or Latino | 8,337 | 17.4% |
| Native / Alaskan | 846 | 1.8% |
| White / Caucasian | 36,774 | 76.8% |
| Two or more Races | 3,707 | 7.7% |
| Some other Race | 1,339 | 2.8% |
| Total | 47,859 | 100.0% |
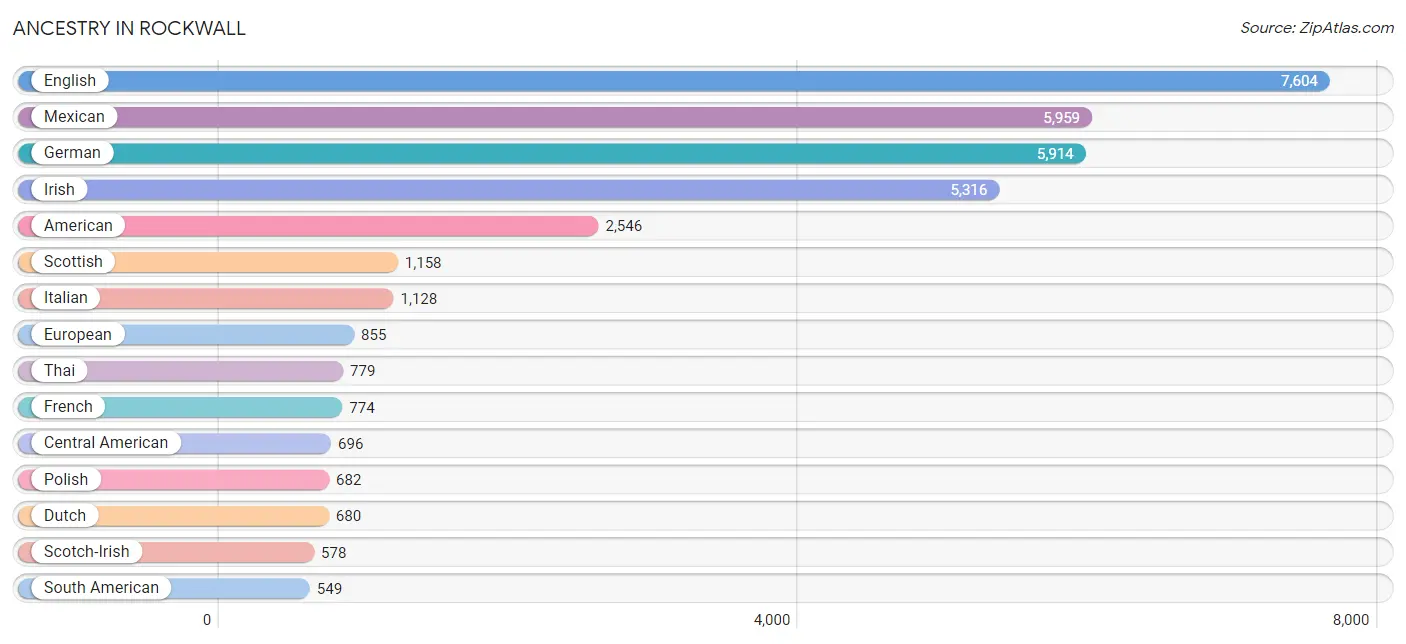
Ancestry in Rockwall
The most populous ancestries reported in Rockwall are English (7,604 | 15.9%), Mexican (5,959 | 12.4%), German (5,914 | 12.4%), Irish (5,316 | 11.1%), and American (2,546 | 5.3%), together accounting for 57.1% of all Rockwall residents.
| Ancestry | # Population | % Population |
| African | 16 | 0.0% |
| Albanian | 15 | 0.0% |
| American | 2,546 | 5.3% |
| Arab | 275 | 0.6% |
| Argentinean | 62 | 0.1% |
| Armenian | 87 | 0.2% |
| Australian | 62 | 0.1% |
| Austrian | 182 | 0.4% |
| Bahamian | 77 | 0.2% |
| Bhutanese | 124 | 0.3% |
| Blackfeet | 94 | 0.2% |
| British | 315 | 0.7% |
| Bulgarian | 264 | 0.5% |
| Burmese | 252 | 0.5% |
| Canadian | 22 | 0.1% |
| Central American | 696 | 1.5% |
| Cherokee | 196 | 0.4% |
| Chickasaw | 10 | 0.0% |
| Choctaw | 138 | 0.3% |
| Colombian | 82 | 0.2% |
| Comanche | 11 | 0.0% |
| Croatian | 41 | 0.1% |
| Cuban | 160 | 0.3% |
| Czech | 153 | 0.3% |
| Danish | 177 | 0.4% |
| Delaware | 82 | 0.2% |
| Dominican | 29 | 0.1% |
| Dutch | 680 | 1.4% |
| Eastern European | 183 | 0.4% |
| Ecuadorian | 89 | 0.2% |
| English | 7,604 | 15.9% |
| European | 855 | 1.8% |
| Finnish | 353 | 0.7% |
| French | 774 | 1.6% |
| French American Indian | 44 | 0.1% |
| French Canadian | 60 | 0.1% |
| German | 5,914 | 12.4% |
| Greek | 273 | 0.6% |
| Guamanian / Chamorro | 34 | 0.1% |
| Guatemalan | 119 | 0.3% |
| Honduran | 220 | 0.5% |
| Hungarian | 112 | 0.2% |
| Indian (Asian) | 417 | 0.9% |
| Iranian | 98 | 0.2% |
| Iraqi | 50 | 0.1% |
| Irish | 5,316 | 11.1% |
| Italian | 1,128 | 2.4% |
| Japanese | 144 | 0.3% |
| Korean | 275 | 0.6% |
| Latvian | 17 | 0.0% |
| Lebanese | 29 | 0.1% |
| Lithuanian | 77 | 0.2% |
| Malaysian | 13 | 0.0% |
| Mexican | 5,959 | 12.4% |
| Mexican American Indian | 83 | 0.2% |
| Native Hawaiian | 63 | 0.1% |
| Nicaraguan | 41 | 0.1% |
| Northern European | 84 | 0.2% |
| Norwegian | 282 | 0.6% |
| Pakistani | 21 | 0.0% |
| Palestinian | 59 | 0.1% |
| Panamanian | 115 | 0.2% |
| Pennsylvania German | 36 | 0.1% |
| Peruvian | 176 | 0.4% |
| Polish | 682 | 1.4% |
| Portuguese | 130 | 0.3% |
| Puerto Rican | 370 | 0.8% |
| Romanian | 208 | 0.4% |
| Russian | 173 | 0.4% |
| Salvadoran | 201 | 0.4% |
| Scandinavian | 118 | 0.3% |
| Scotch-Irish | 578 | 1.2% |
| Scottish | 1,158 | 2.4% |
| Serbian | 23 | 0.1% |
| Sierra Leonean | 62 | 0.1% |
| Slovene | 16 | 0.0% |
| South American | 549 | 1.1% |
| Spaniard | 236 | 0.5% |
| Spanish | 166 | 0.4% |
| Sri Lankan | 145 | 0.3% |
| Subsaharan African | 166 | 0.4% |
| Sudanese | 71 | 0.2% |
| Swedish | 498 | 1.0% |
| Swiss | 222 | 0.5% |
| Syrian | 84 | 0.2% |
| Thai | 779 | 1.6% |
| Ukrainian | 16 | 0.0% |
| Venezuelan | 140 | 0.3% |
| Welsh | 354 | 0.7% |
| West Indian | 24 | 0.1% |
| Yugoslavian | 9 | 0.0% | View All 91 Rows |
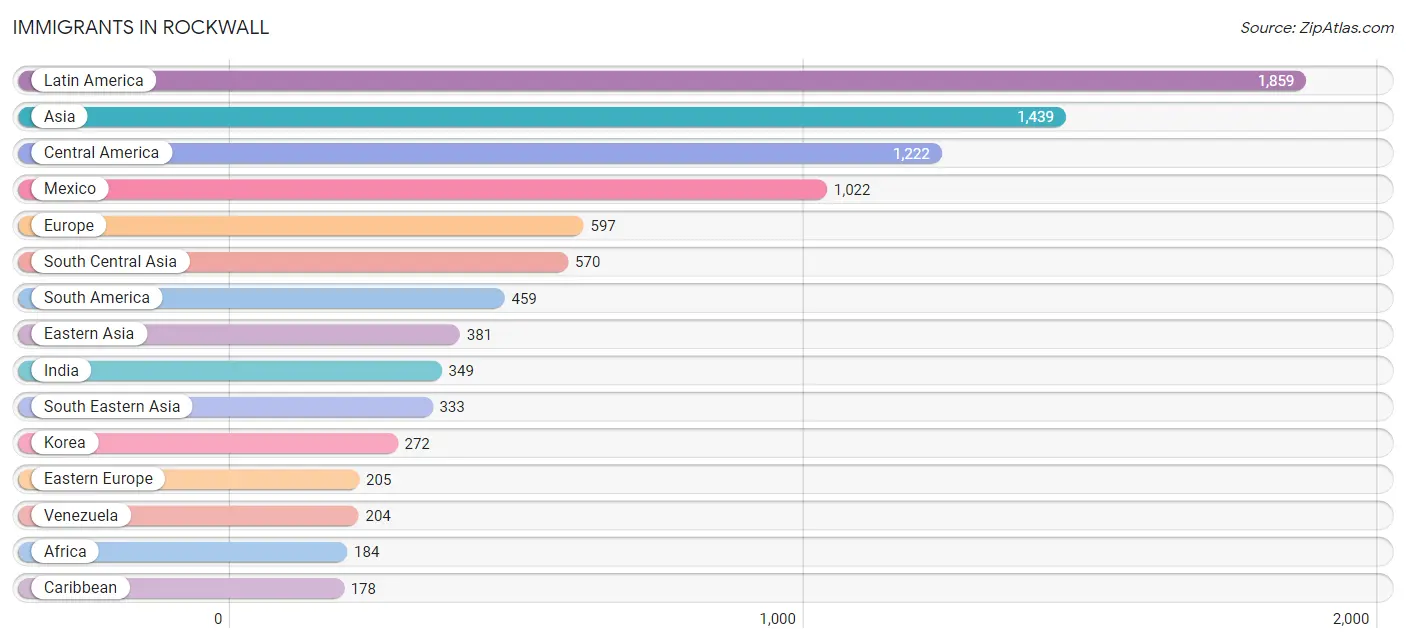
Immigrants in Rockwall
The most numerous immigrant groups reported in Rockwall came from Latin America (1,859 | 3.9%), Asia (1,439 | 3.0%), Central America (1,222 | 2.5%), Mexico (1,022 | 2.1%), and Europe (597 | 1.3%), together accounting for 12.8% of all Rockwall residents.
| Immigration Origin | # Population | % Population |
| Africa | 184 | 0.4% |
| Armenia | 25 | 0.1% |
| Asia | 1,439 | 3.0% |
| Australia | 62 | 0.1% |
| Austria | 14 | 0.0% |
| Bahamas | 77 | 0.2% |
| Bosnia and Herzegovina | 26 | 0.1% |
| Brazil | 44 | 0.1% |
| Cambodia | 54 | 0.1% |
| Canada | 64 | 0.1% |
| Caribbean | 178 | 0.4% |
| Central America | 1,222 | 2.5% |
| Chile | 69 | 0.1% |
| China | 76 | 0.2% |
| Colombia | 36 | 0.1% |
| Cuba | 35 | 0.1% |
| Eastern Africa | 30 | 0.1% |
| Eastern Asia | 381 | 0.8% |
| Eastern Europe | 205 | 0.4% |
| Ecuador | 41 | 0.1% |
| Egypt | 41 | 0.1% |
| El Salvador | 75 | 0.2% |
| England | 45 | 0.1% |
| Ethiopia | 30 | 0.1% |
| Europe | 597 | 1.3% |
| Germany | 97 | 0.2% |
| Grenada | 50 | 0.1% |
| Guatemala | 23 | 0.1% |
| Honduras | 102 | 0.2% |
| India | 349 | 0.7% |
| Iran | 74 | 0.2% |
| Iraq | 46 | 0.1% |
| Jamaica | 16 | 0.0% |
| Japan | 33 | 0.1% |
| Jordan | 15 | 0.0% |
| Korea | 272 | 0.6% |
| Laos | 13 | 0.0% |
| Latin America | 1,859 | 3.9% |
| Latvia | 9 | 0.0% |
| Lithuania | 20 | 0.0% |
| Mexico | 1,022 | 2.1% |
| Moldova | 5 | 0.0% |
| Nepal | 147 | 0.3% |
| Netherlands | 10 | 0.0% |
| Northern Africa | 92 | 0.2% |
| Northern Europe | 162 | 0.3% |
| Oceania | 80 | 0.2% |
| Peru | 65 | 0.1% |
| Philippines | 148 | 0.3% |
| Romania | 76 | 0.2% |
| Russia | 34 | 0.1% |
| Serbia | 10 | 0.0% |
| Sierra Leone | 62 | 0.1% |
| South America | 459 | 1.0% |
| South Central Asia | 570 | 1.2% |
| South Eastern Asia | 333 | 0.7% |
| Southern Europe | 109 | 0.2% |
| Spain | 109 | 0.2% |
| Sudan | 51 | 0.1% |
| Syria | 69 | 0.1% |
| Taiwan | 14 | 0.0% |
| Thailand | 21 | 0.0% |
| Ukraine | 11 | 0.0% |
| Venezuela | 204 | 0.4% |
| Vietnam | 97 | 0.2% |
| Western Africa | 62 | 0.1% |
| Western Asia | 155 | 0.3% |
| Western Europe | 121 | 0.3% | View All 68 Rows |
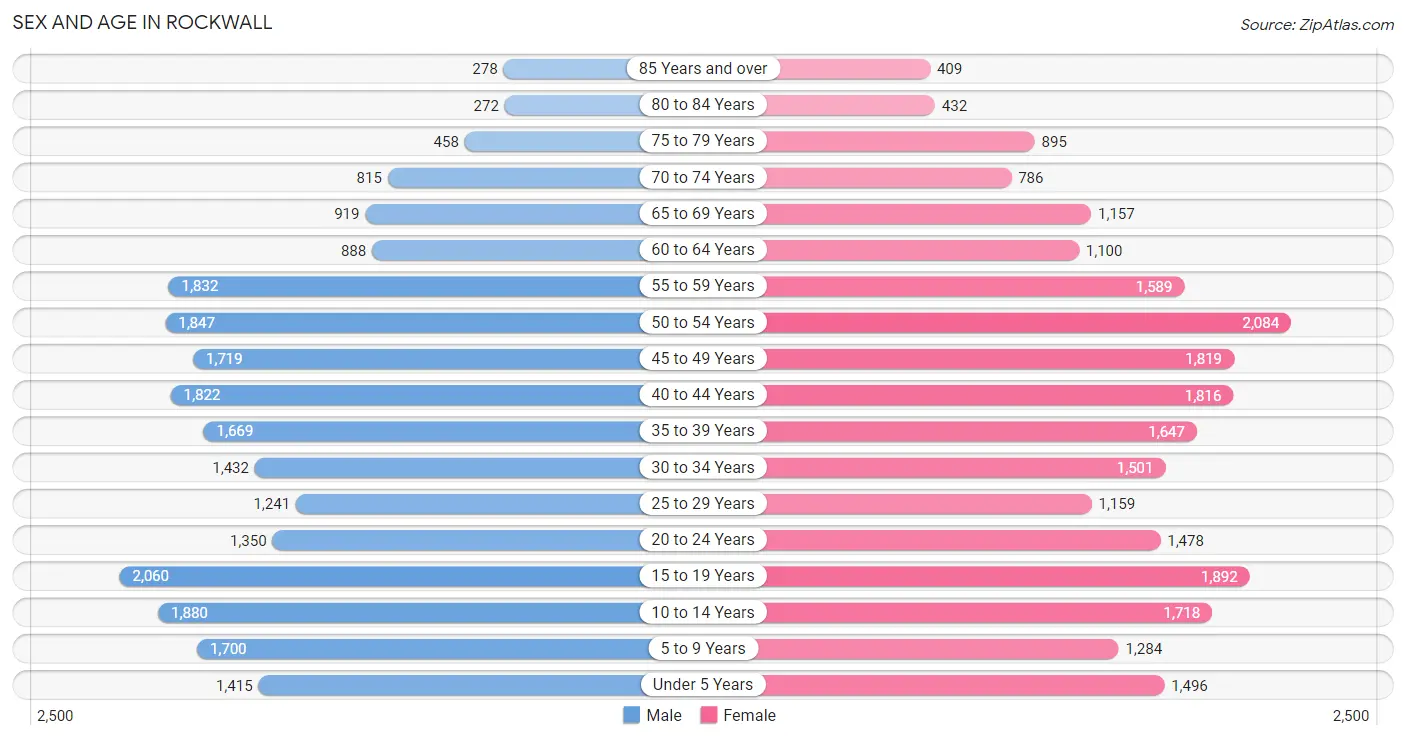
Sex and Age in Rockwall
Sex and Age in Rockwall
The most populous age groups in Rockwall are 15 to 19 Years (2,060 | 8.7%) for men and 50 to 54 Years (2,084 | 8.6%) for women.
| Age Bracket | Male | Female |
| Under 5 Years | 1,415 (6.0%) | 1,496 (6.2%) |
| 5 to 9 Years | 1,700 (7.2%) | 1,284 (5.3%) |
| 10 to 14 Years | 1,880 (8.0%) | 1,718 (7.1%) |
| 15 to 19 Years | 2,060 (8.7%) | 1,892 (7.8%) |
| 20 to 24 Years | 1,350 (5.7%) | 1,478 (6.1%) |
| 25 to 29 Years | 1,241 (5.3%) | 1,159 (4.8%) |
| 30 to 34 Years | 1,432 (6.1%) | 1,501 (6.2%) |
| 35 to 39 Years | 1,669 (7.1%) | 1,647 (6.8%) |
| 40 to 44 Years | 1,822 (7.7%) | 1,816 (7.5%) |
| 45 to 49 Years | 1,719 (7.3%) | 1,819 (7.5%) |
| 50 to 54 Years | 1,847 (7.8%) | 2,084 (8.6%) |
| 55 to 59 Years | 1,832 (7.8%) | 1,589 (6.6%) |
| 60 to 64 Years | 888 (3.8%) | 1,100 (4.5%) |
| 65 to 69 Years | 919 (3.9%) | 1,157 (4.8%) |
| 70 to 74 Years | 815 (3.5%) | 786 (3.2%) |
| 75 to 79 Years | 458 (1.9%) | 895 (3.7%) |
| 80 to 84 Years | 272 (1.1%) | 432 (1.8%) |
| 85 Years and over | 278 (1.2%) | 409 (1.7%) |
| Total | 23,597 (100.0%) | 24,262 (100.0%) |
Families and Households in Rockwall
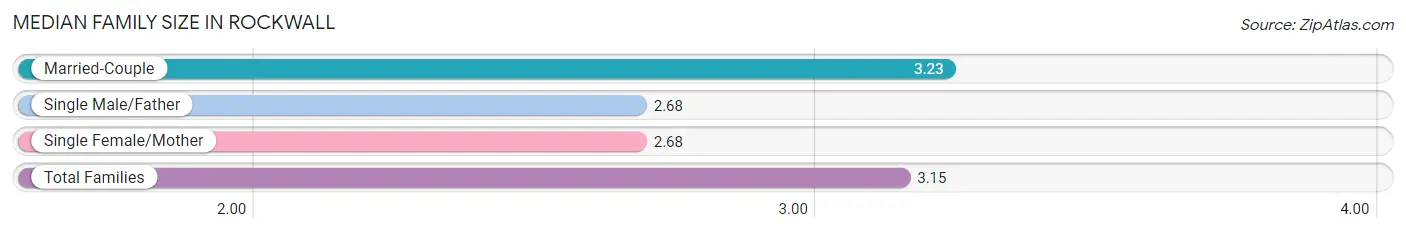
Median Family Size in Rockwall
The median family size in Rockwall is 3.15 persons per family, with married-couple families (11,498 | 85.5%) accounting for the largest median family size of 3.23 persons per family. On the other hand, single male/father families (498 | 3.7%) represent the smallest median family size with 2.68 persons per family.
| Family Type | # Families | Family Size |
| Married-Couple | 11,498 (85.5%) | 3.23 |
| Single Male/Father | 498 (3.7%) | 2.68 |
| Single Female/Mother | 1,455 (10.8%) | 2.68 |
| Total Families | 13,451 (100.0%) | 3.15 |
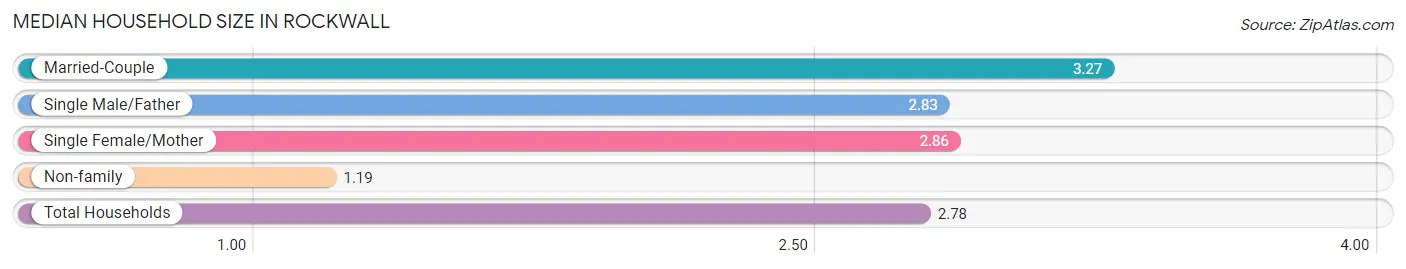
Median Household Size in Rockwall
The median household size in Rockwall is 2.78 persons per household, with married-couple households (11,498 | 67.3%) accounting for the largest median household size of 3.27 persons per household. non-family households (3,641 | 21.3%) represent the smallest median household size with 1.19 persons per household.
| Household Type | # Households | Household Size |
| Married-Couple | 11,498 (67.3%) | 3.27 |
| Single Male/Father | 498 (2.9%) | 2.83 |
| Single Female/Mother | 1,455 (8.5%) | 2.86 |
| Non-family | 3,641 (21.3%) | 1.19 |
| Total Households | 17,092 (100.0%) | 2.78 |
Household Size by Marriage Status in Rockwall
Out of a total of 17,092 households in Rockwall, 13,451 (78.7%) are family households, while 3,641 (21.3%) are nonfamily households. The most numerous type of family households are 2-person households, comprising 5,108, and the most common type of nonfamily households are 1-person households, comprising 3,013.
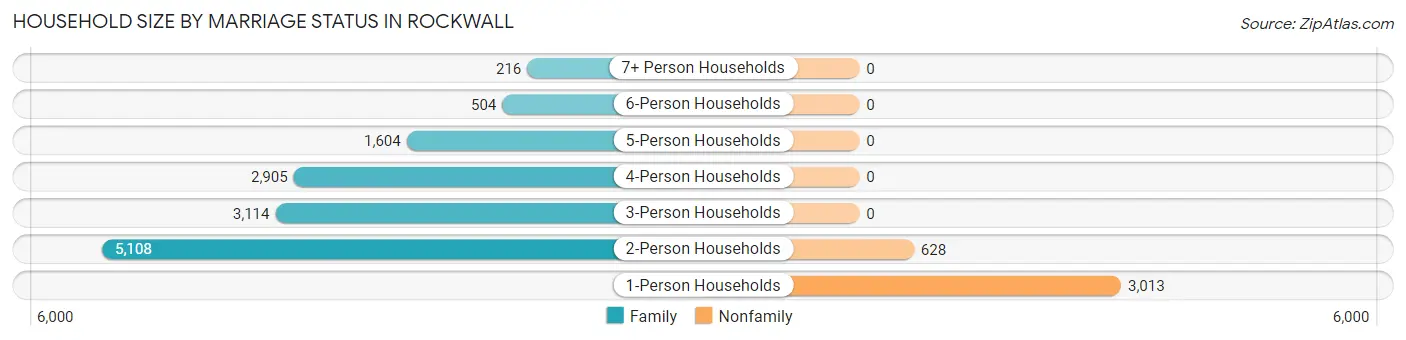
| Household Size | Family Households | Nonfamily Households |
| 1-Person Households | - | 3,013 (17.6%) |
| 2-Person Households | 5,108 (29.9%) | 628 (3.7%) |
| 3-Person Households | 3,114 (18.2%) | 0 (0.0%) |
| 4-Person Households | 2,905 (17.0%) | 0 (0.0%) |
| 5-Person Households | 1,604 (9.4%) | 0 (0.0%) |
| 6-Person Households | 504 (2.9%) | 0 (0.0%) |
| 7+ Person Households | 216 (1.3%) | 0 (0.0%) |
| Total | 13,451 (78.7%) | 3,641 (21.3%) |
Female Fertility in Rockwall
Fertility by Age in Rockwall
Average fertility rate in Rockwall is 62.0 births per 1,000 women. Women in the age bracket of 20 to 34 years have the highest fertility rate with 142.0 births per 1,000 women. Women in the age bracket of 20 to 34 years acount for 79.6% of all women with births.
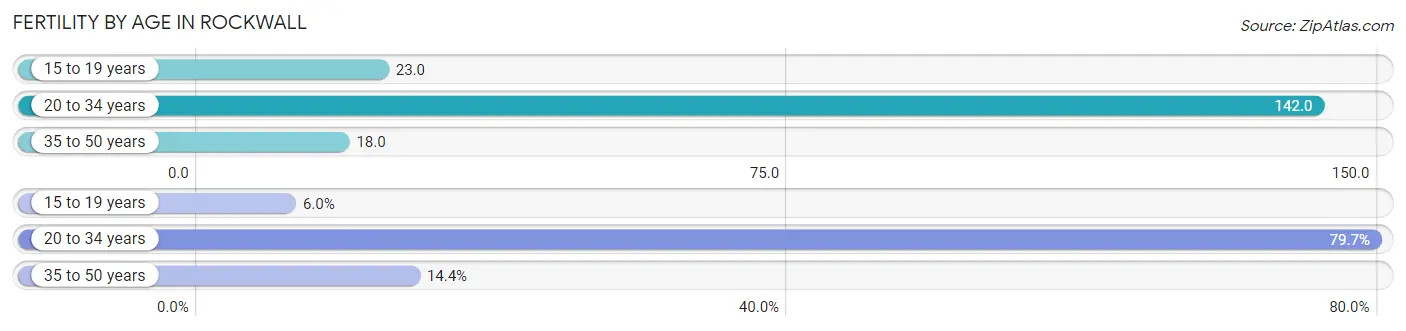
| Age Bracket | Women with Births | Births / 1,000 Women |
| 15 to 19 years | 44 (6.0%) | 23.0 |
| 20 to 34 years | 587 (79.6%) | 142.0 |
| 35 to 50 years | 106 (14.4%) | 18.0 |
| Total | 737 (100.0%) | 62.0 |
Fertility by Age by Marriage Status in Rockwall
75.6% of women with births (737) in Rockwall are married. The highest percentage of unmarried women with births falls into 20 to 34 years age bracket with 30.0% of them unmarried at the time of birth, while the lowest percentage of unmarried women with births belong to 35 to 50 years age bracket with 0.0% of them unmarried.
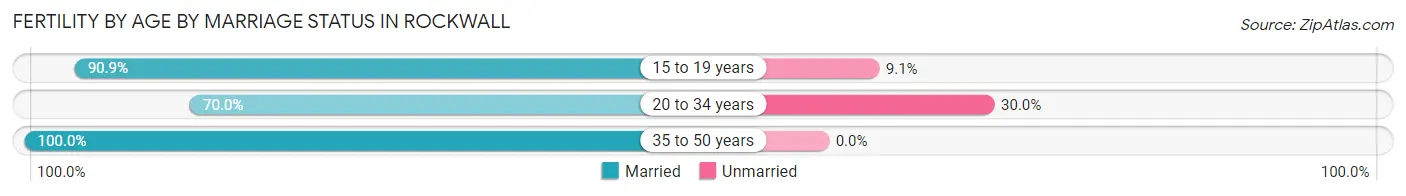
| Age Bracket | Married | Unmarried |
| 15 to 19 years | 40 (90.9%) | 4 (9.1%) |
| 20 to 34 years | 411 (70.0%) | 176 (30.0%) |
| 35 to 50 years | 106 (100.0%) | 0 (0.0%) |
| Total | 557 (75.6%) | 180 (24.4%) |
Fertility by Education in Rockwall
Average fertility rate in Rockwall is 62.0 births per 1,000 women. Women with the education attainment of college or associate's degree have the highest fertility rate of 113.0 births per 1,000 women, while women with the education attainment of high school diploma have the lowest fertility at 15.0 births per 1,000 women. Women with the education attainment of college or associate's degree represent 58.6% of all women with births.
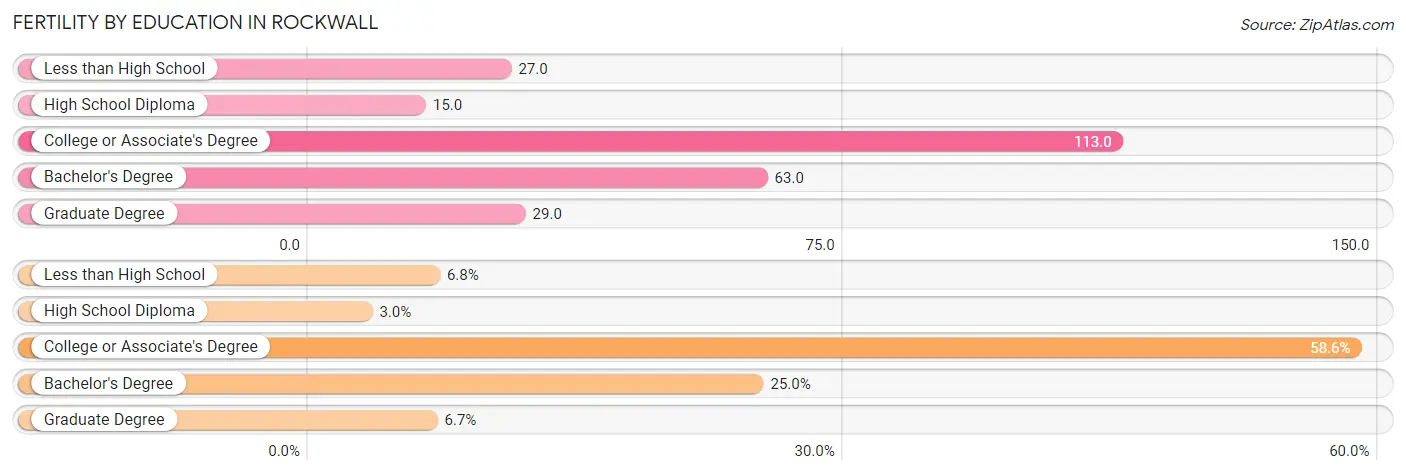
| Educational Attainment | Women with Births | Births / 1,000 Women |
| Less than High School | 50 (6.8%) | 27.0 |
| High School Diploma | 22 (3.0%) | 15.0 |
| College or Associate's Degree | 432 (58.6%) | 113.0 |
| Bachelor's Degree | 184 (25.0%) | 63.0 |
| Graduate Degree | 49 (6.7%) | 29.0 |
| Total | 737 (100.0%) | 62.0 |
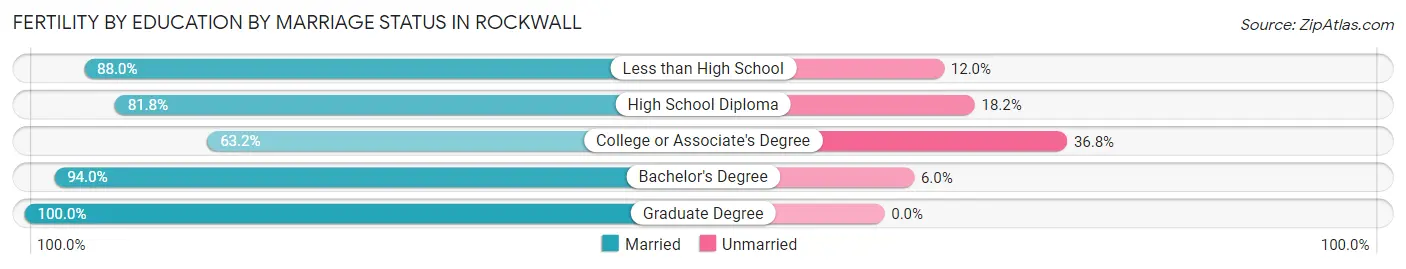
Fertility by Education by Marriage Status in Rockwall
24.4% of women with births in Rockwall are unmarried. Women with the educational attainment of graduate degree are most likely to be married with 100.0% of them married at childbirth, while women with the educational attainment of college or associate's degree are least likely to be married with 36.8% of them unmarried at childbirth.
| Educational Attainment | Married | Unmarried |
| Less than High School | 44 (88.0%) | 6 (12.0%) |
| High School Diploma | 18 (81.8%) | 4 (18.2%) |
| College or Associate's Degree | 273 (63.2%) | 159 (36.8%) |
| Bachelor's Degree | 173 (94.0%) | 11 (6.0%) |
| Graduate Degree | 49 (100.0%) | 0 (0.0%) |
| Total | 557 (75.6%) | 180 (24.4%) |
Employment Characteristics in Rockwall
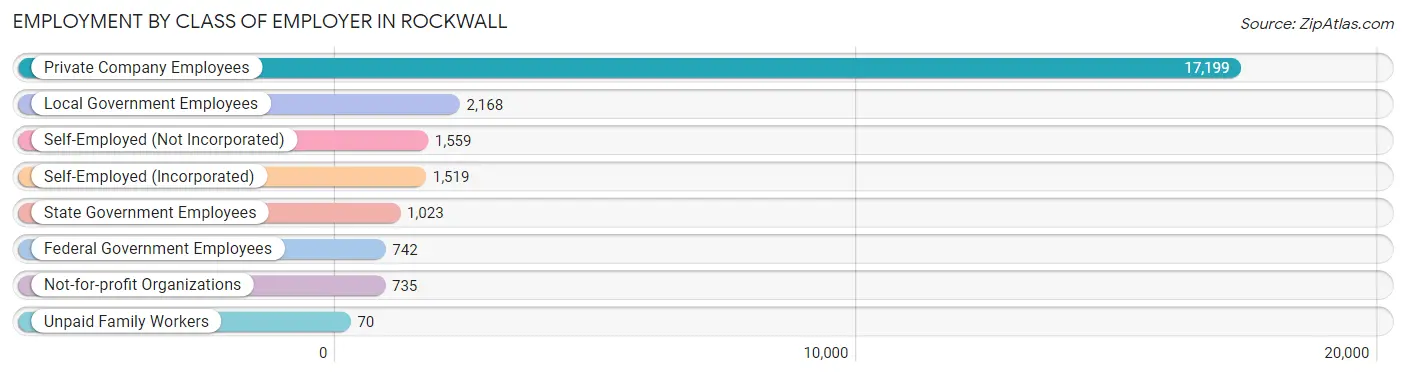
Employment by Class of Employer in Rockwall
Among the 25,015 employed individuals in Rockwall, private company employees (17,199 | 68.8%), local government employees (2,168 | 8.7%), and self-employed (not incorporated) (1,559 | 6.2%) make up the most common classes of employment.
| Employer Class | # Employees | % Employees |
| Private Company Employees | 17,199 | 68.8% |
| Self-Employed (Incorporated) | 1,519 | 6.1% |
| Self-Employed (Not Incorporated) | 1,559 | 6.2% |
| Not-for-profit Organizations | 735 | 2.9% |
| Local Government Employees | 2,168 | 8.7% |
| State Government Employees | 1,023 | 4.1% |
| Federal Government Employees | 742 | 3.0% |
| Unpaid Family Workers | 70 | 0.3% |
| Total | 25,015 | 100.0% |
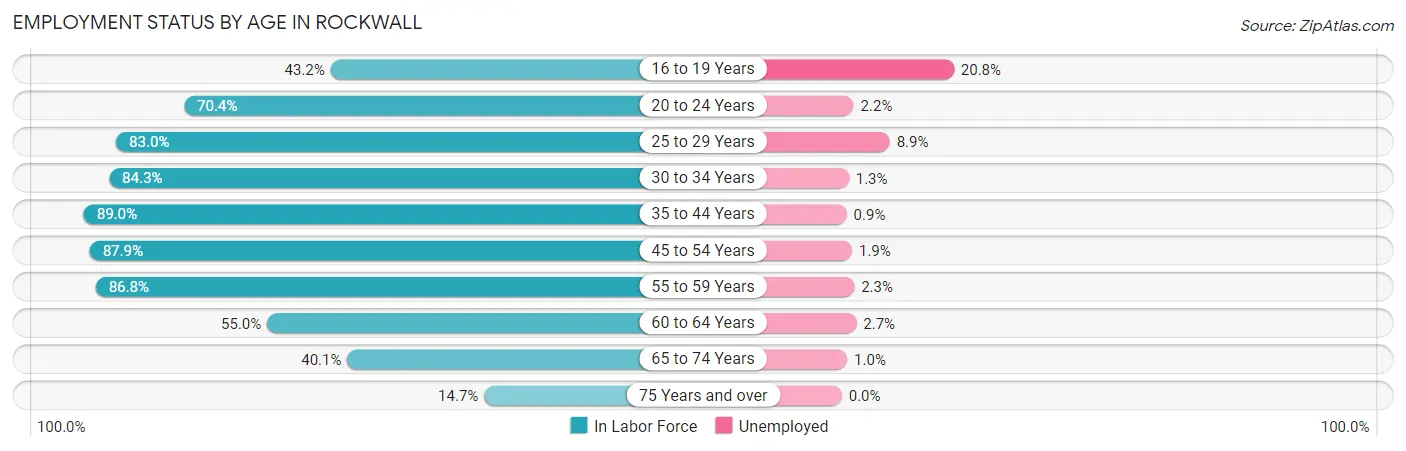
Employment Status by Age in Rockwall
According to the labor force statistics for Rockwall, out of the total population over 16 years of age (37,503), 70.6% or 26,477 individuals are in the labor force, with 3.1% or 821 of them unemployed. The age group with the highest labor force participation rate is 35 to 44 years, with 89.0% or 6,189 individuals in the labor force. Within the labor force, the 16 to 19 years age range has the highest percentage of unemployed individuals, with 20.8% or 277 of them being unemployed.
| Age Bracket | In Labor Force | Unemployed |
| 16 to 19 Years | 1,334 (43.2%) | 277 (20.8%) |
| 20 to 24 Years | 1,991 (70.4%) | 44 (2.2%) |
| 25 to 29 Years | 1,992 (83.0%) | 177 (8.9%) |
| 30 to 34 Years | 2,473 (84.3%) | 32 (1.3%) |
| 35 to 44 Years | 6,189 (89.0%) | 56 (0.9%) |
| 45 to 54 Years | 6,565 (87.9%) | 125 (1.9%) |
| 55 to 59 Years | 2,969 (86.8%) | 68 (2.3%) |
| 60 to 64 Years | 1,093 (55.0%) | 30 (2.7%) |
| 65 to 74 Years | 1,474 (40.1%) | 15 (1.0%) |
| 75 Years and over | 403 (14.7%) | 0 (0.0%) |
| Total | 26,477 (70.6%) | 821 (3.1%) |
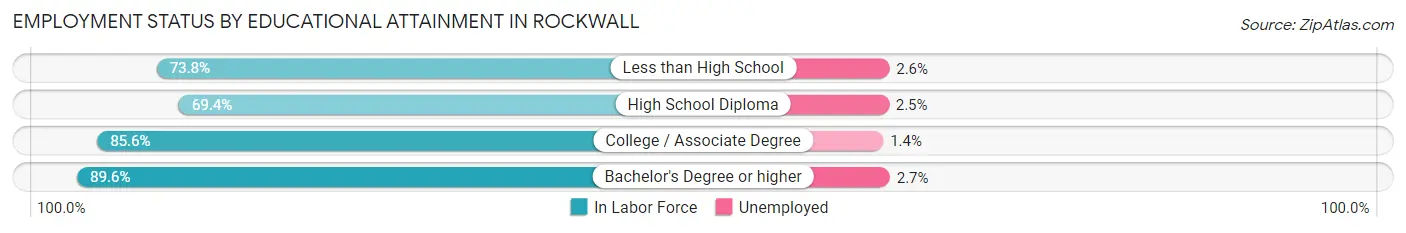
Employment Status by Educational Attainment in Rockwall
According to labor force statistics for Rockwall, 84.6% of individuals (21,290) out of the total population between 25 and 64 years of age (25,165) are in the labor force, with 2.3% or 490 of them being unemployed. The group with the highest labor force participation rate are those with the educational attainment of bachelor's degree or higher, with 89.6% or 11,125 individuals in the labor force. Within the labor force, individuals with bachelor's degree or higher education have the highest percentage of unemployment, with 2.7% or 300 of them being unemployed.
| Educational Attainment | In Labor Force | Unemployed |
| Less than High School | 801 (73.8%) | 28 (2.6%) |
| High School Diploma | 2,698 (69.4%) | 97 (2.5%) |
| College / Associate Degree | 6,655 (85.6%) | 109 (1.4%) |
| Bachelor's Degree or higher | 11,125 (89.6%) | 335 (2.7%) |
| Total | 21,290 (84.6%) | 579 (2.3%) |
Employment Occupations by Sex in Rockwall
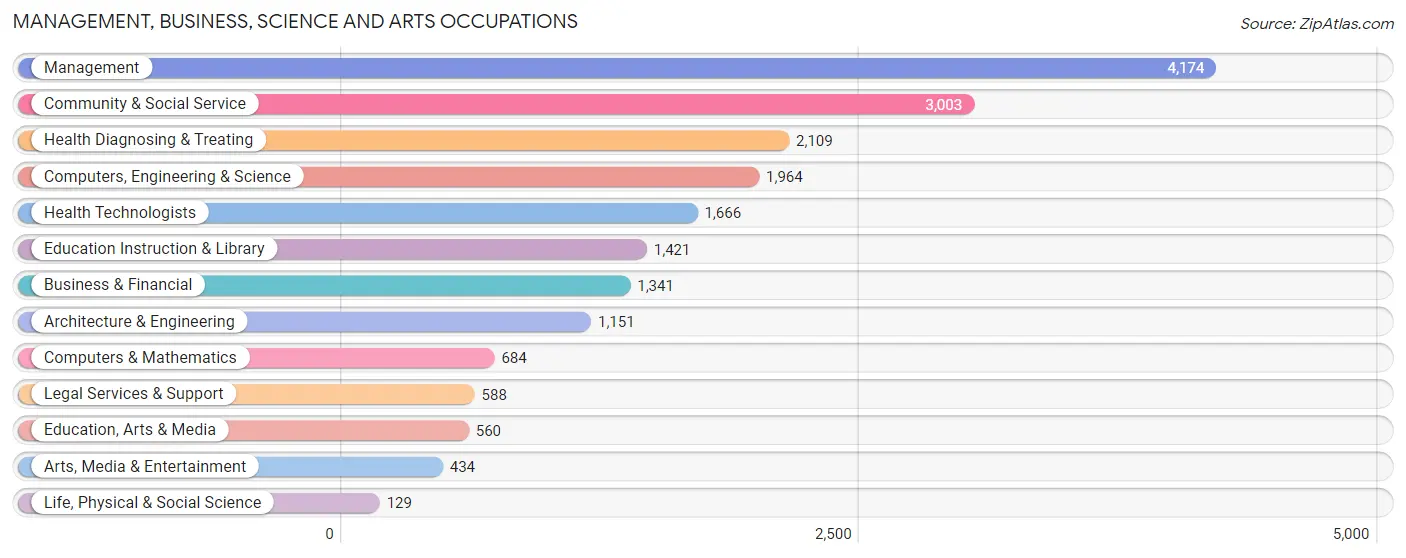
Management, Business, Science and Arts Occupations
The most common Management, Business, Science and Arts occupations in Rockwall are Management (4,174 | 16.3%), Community & Social Service (3,003 | 11.7%), Health Diagnosing & Treating (2,109 | 8.2%), Computers, Engineering & Science (1,964 | 7.7%), and Health Technologists (1,666 | 6.5%).
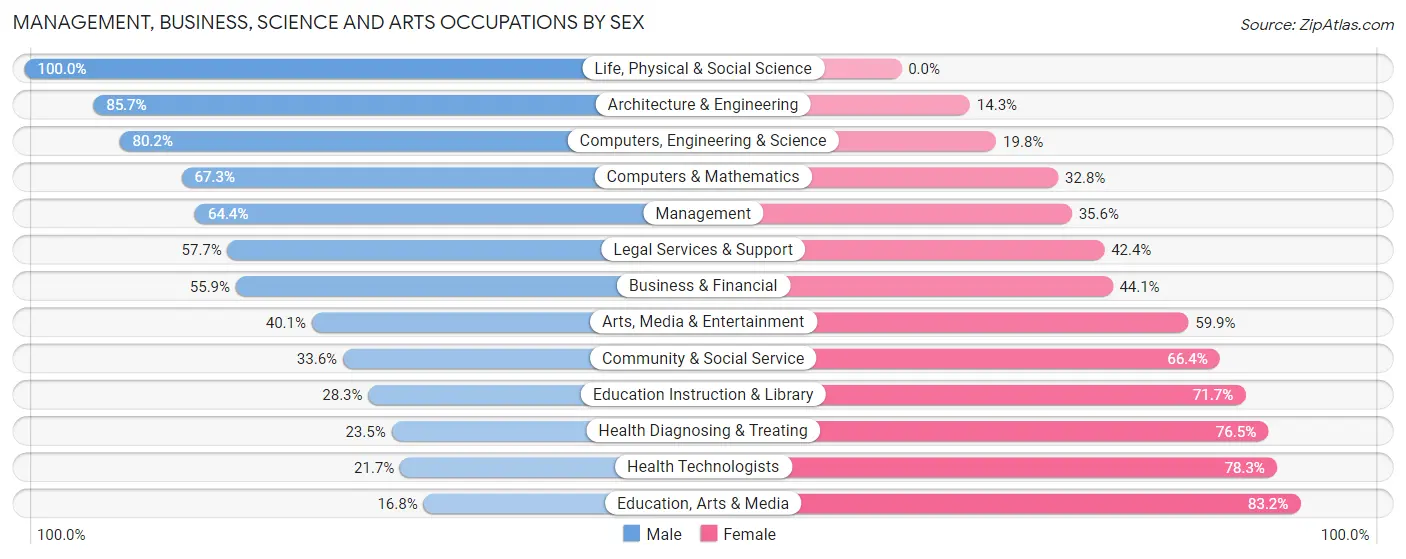
Management, Business, Science and Arts Occupations by Sex
Within the Management, Business, Science and Arts occupations in Rockwall, the most male-oriented occupations are Life, Physical & Social Science (100.0%), Architecture & Engineering (85.7%), and Computers, Engineering & Science (80.2%), while the most female-oriented occupations are Education, Arts & Media (83.2%), Health Technologists (78.3%), and Health Diagnosing & Treating (76.5%).
| Occupation | Male | Female |
| Management | 2,689 (64.4%) | 1,485 (35.6%) |
| Business & Financial | 750 (55.9%) | 591 (44.1%) |
| Computers, Engineering & Science | 1,575 (80.2%) | 389 (19.8%) |
| Computers & Mathematics | 460 (67.2%) | 224 (32.8%) |
| Architecture & Engineering | 986 (85.7%) | 165 (14.3%) |
| Life, Physical & Social Science | 129 (100.0%) | 0 (0.0%) |
| Community & Social Service | 1,009 (33.6%) | 1,994 (66.4%) |
| Education, Arts & Media | 94 (16.8%) | 466 (83.2%) |
| Legal Services & Support | 339 (57.7%) | 249 (42.3%) |
| Education Instruction & Library | 402 (28.3%) | 1,019 (71.7%) |
| Arts, Media & Entertainment | 174 (40.1%) | 260 (59.9%) |
| Health Diagnosing & Treating | 495 (23.5%) | 1,614 (76.5%) |
| Health Technologists | 361 (21.7%) | 1,305 (78.3%) |
| Total (Category) | 6,518 (51.8%) | 6,073 (48.2%) |
| Total (Overall) | 13,364 (52.2%) | 12,259 (47.8%) |
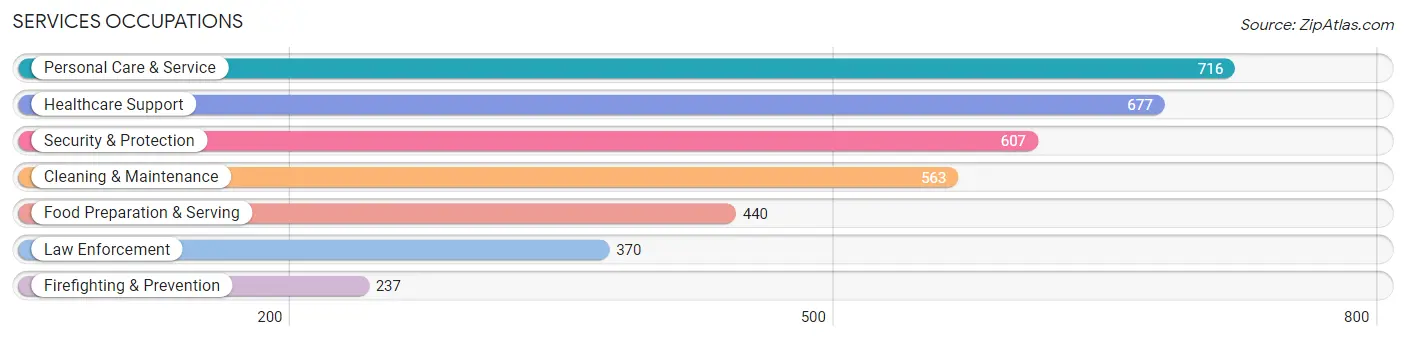
Services Occupations
The most common Services occupations in Rockwall are Personal Care & Service (716 | 2.8%), Healthcare Support (677 | 2.6%), Security & Protection (607 | 2.4%), Cleaning & Maintenance (563 | 2.2%), and Food Preparation & Serving (440 | 1.7%).
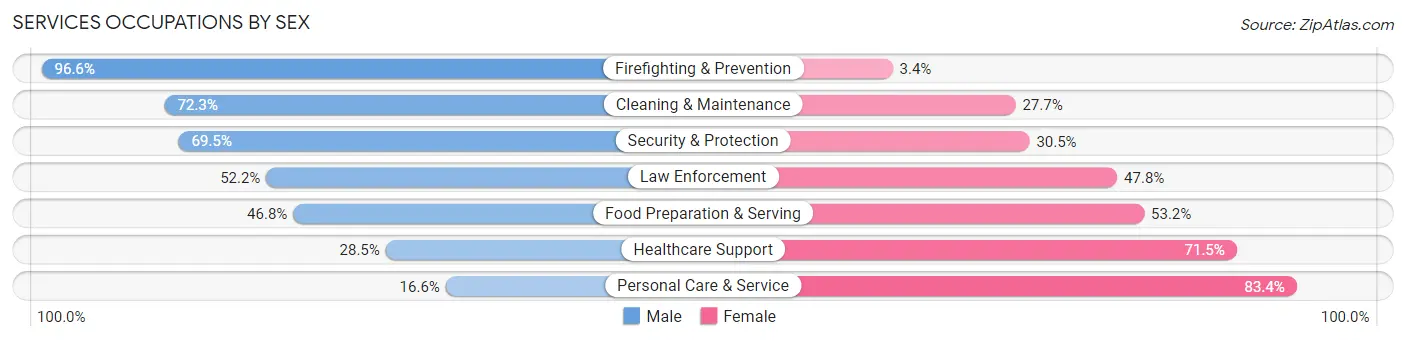
Services Occupations by Sex
Within the Services occupations in Rockwall, the most male-oriented occupations are Firefighting & Prevention (96.6%), Cleaning & Maintenance (72.3%), and Security & Protection (69.5%), while the most female-oriented occupations are Personal Care & Service (83.4%), Healthcare Support (71.5%), and Food Preparation & Serving (53.2%).
| Occupation | Male | Female |
| Healthcare Support | 193 (28.5%) | 484 (71.5%) |
| Security & Protection | 422 (69.5%) | 185 (30.5%) |
| Firefighting & Prevention | 229 (96.6%) | 8 (3.4%) |
| Law Enforcement | 193 (52.2%) | 177 (47.8%) |
| Food Preparation & Serving | 206 (46.8%) | 234 (53.2%) |
| Cleaning & Maintenance | 407 (72.3%) | 156 (27.7%) |
| Personal Care & Service | 119 (16.6%) | 597 (83.4%) |
| Total (Category) | 1,347 (44.9%) | 1,656 (55.1%) |
| Total (Overall) | 13,364 (52.2%) | 12,259 (47.8%) |
Sales and Office Occupations
The most common Sales and Office occupations in Rockwall are Sales & Related (3,874 | 15.1%), and Office & Administration (3,173 | 12.4%).

Sales and Office Occupations by Sex
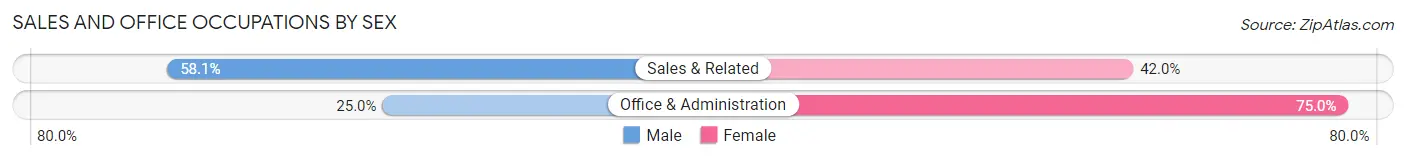
| Occupation | Male | Female |
| Sales & Related | 2,249 (58.1%) | 1,625 (41.9%) |
| Office & Administration | 792 (25.0%) | 2,381 (75.0%) |
| Total (Category) | 3,041 (43.1%) | 4,006 (56.9%) |
| Total (Overall) | 13,364 (52.2%) | 12,259 (47.8%) |
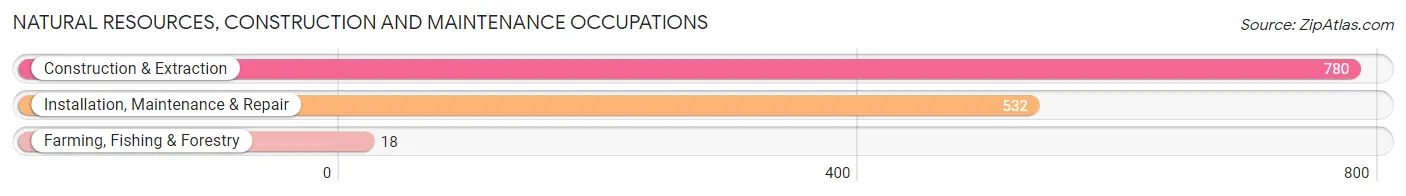
Natural Resources, Construction and Maintenance Occupations
The most common Natural Resources, Construction and Maintenance occupations in Rockwall are Construction & Extraction (780 | 3.0%), Installation, Maintenance & Repair (532 | 2.1%), and Farming, Fishing & Forestry (18 | 0.1%).
Natural Resources, Construction and Maintenance Occupations by Sex
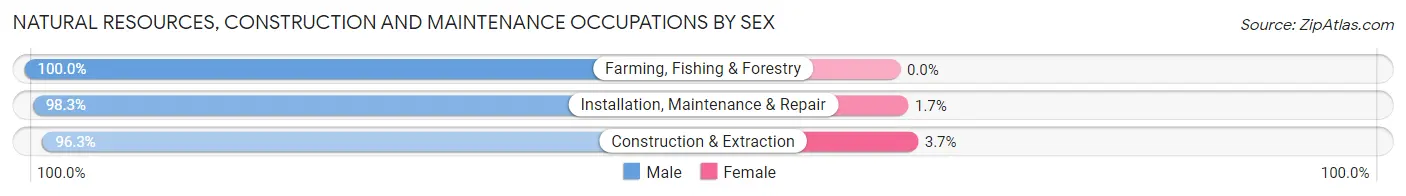
| Occupation | Male | Female |
| Farming, Fishing & Forestry | 18 (100.0%) | 0 (0.0%) |
| Construction & Extraction | 751 (96.3%) | 29 (3.7%) |
| Installation, Maintenance & Repair | 523 (98.3%) | 9 (1.7%) |
| Total (Category) | 1,292 (97.1%) | 38 (2.9%) |
| Total (Overall) | 13,364 (52.2%) | 12,259 (47.8%) |
Production, Transportation and Moving Occupations
The most common Production, Transportation and Moving occupations in Rockwall are Transportation (742 | 2.9%), Material Moving (541 | 2.1%), and Production (369 | 1.4%).
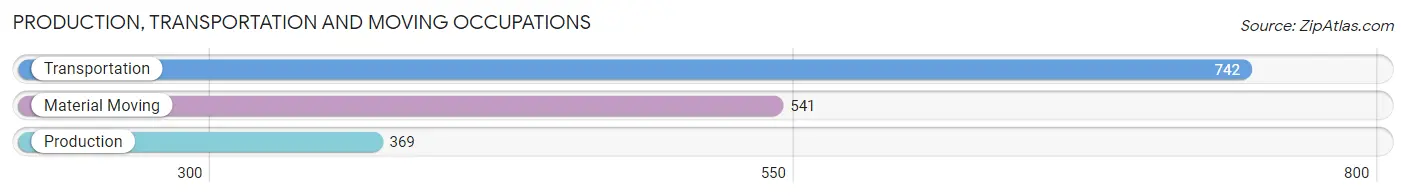
Production, Transportation and Moving Occupations by Sex
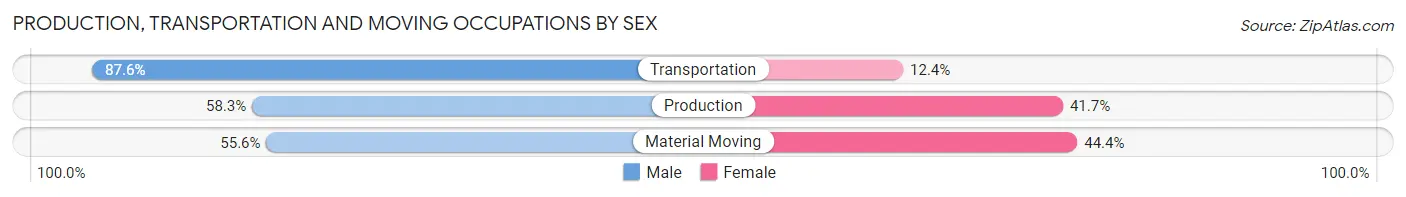
| Occupation | Male | Female |
| Production | 215 (58.3%) | 154 (41.7%) |
| Transportation | 650 (87.6%) | 92 (12.4%) |
| Material Moving | 301 (55.6%) | 240 (44.4%) |
| Total (Category) | 1,166 (70.6%) | 486 (29.4%) |
| Total (Overall) | 13,364 (52.2%) | 12,259 (47.8%) |
Employment Industries by Sex in Rockwall
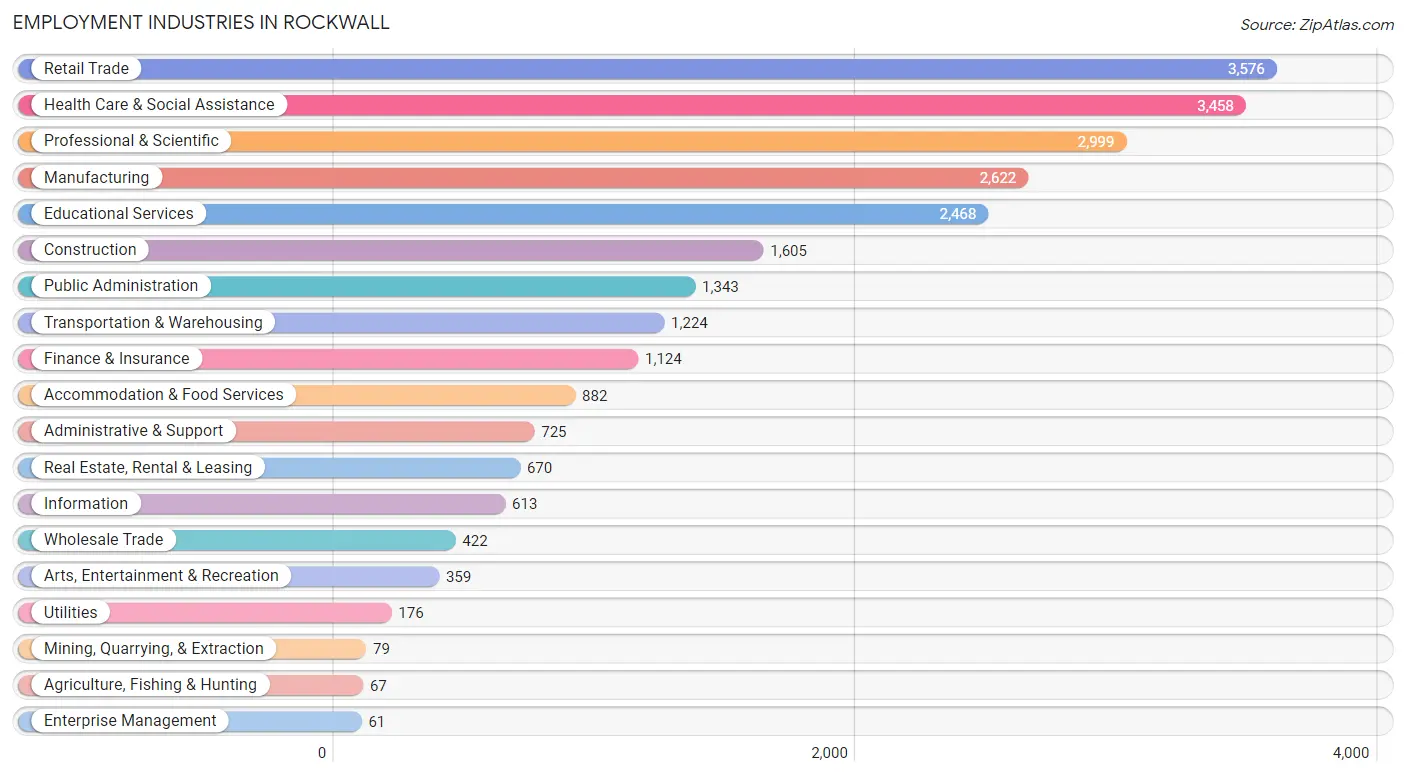
Employment Industries in Rockwall
The major employment industries in Rockwall include Retail Trade (3,576 | 14.0%), Health Care & Social Assistance (3,458 | 13.5%), Professional & Scientific (2,999 | 11.7%), Manufacturing (2,622 | 10.2%), and Educational Services (2,468 | 9.6%).
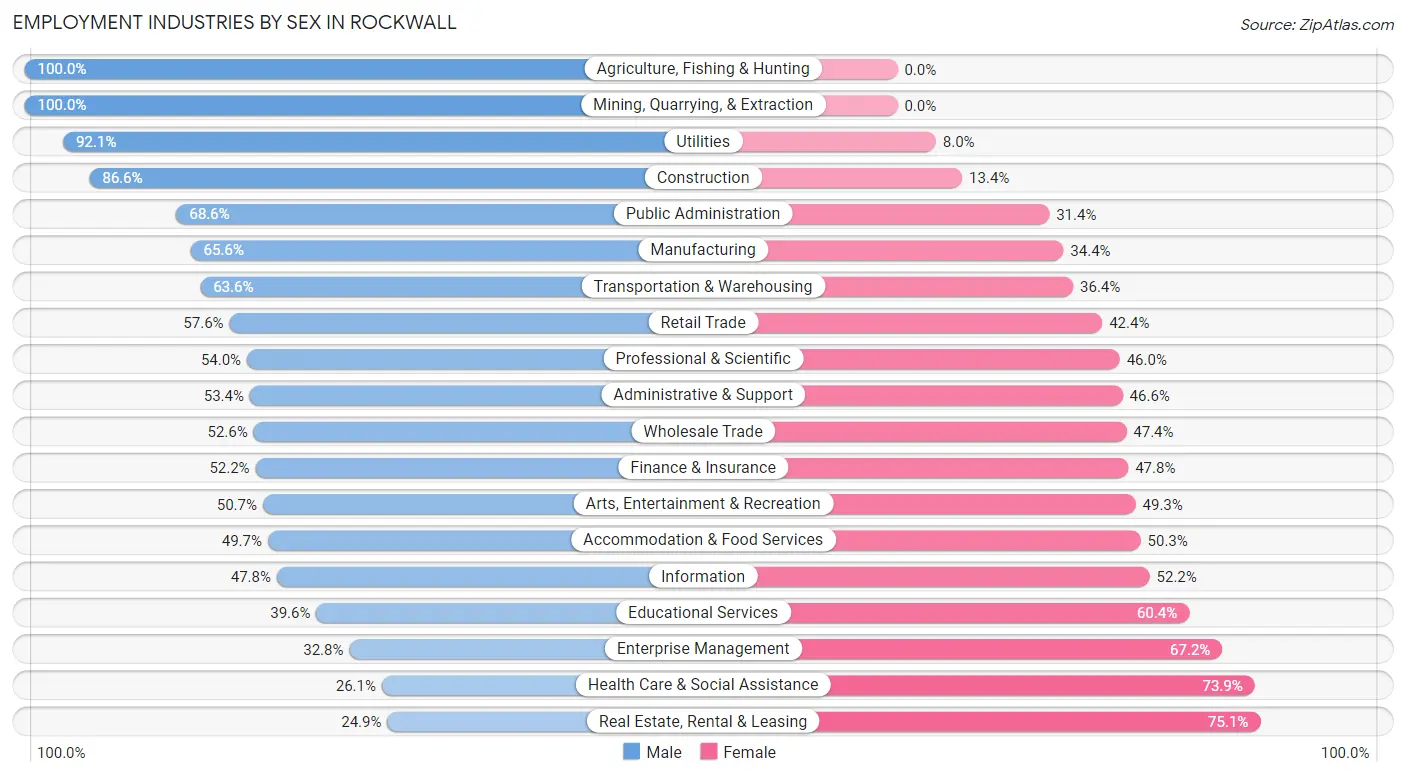
Employment Industries by Sex in Rockwall
The Rockwall industries that see more men than women are Agriculture, Fishing & Hunting (100.0%), Mining, Quarrying, & Extraction (100.0%), and Utilities (92.0%), whereas the industries that tend to have a higher number of women are Real Estate, Rental & Leasing (75.1%), Health Care & Social Assistance (73.9%), and Enterprise Management (67.2%).
| Industry | Male | Female |
| Agriculture, Fishing & Hunting | 67 (100.0%) | 0 (0.0%) |
| Mining, Quarrying, & Extraction | 79 (100.0%) | 0 (0.0%) |
| Construction | 1,390 (86.6%) | 215 (13.4%) |
| Manufacturing | 1,721 (65.6%) | 901 (34.4%) |
| Wholesale Trade | 222 (52.6%) | 200 (47.4%) |
| Retail Trade | 2,060 (57.6%) | 1,516 (42.4%) |
| Transportation & Warehousing | 779 (63.6%) | 445 (36.4%) |
| Utilities | 162 (92.0%) | 14 (8.0%) |
| Information | 293 (47.8%) | 320 (52.2%) |
| Finance & Insurance | 587 (52.2%) | 537 (47.8%) |
| Real Estate, Rental & Leasing | 167 (24.9%) | 503 (75.1%) |
| Professional & Scientific | 1,619 (54.0%) | 1,380 (46.0%) |
| Enterprise Management | 20 (32.8%) | 41 (67.2%) |
| Administrative & Support | 387 (53.4%) | 338 (46.6%) |
| Educational Services | 978 (39.6%) | 1,490 (60.4%) |
| Health Care & Social Assistance | 901 (26.1%) | 2,557 (73.9%) |
| Arts, Entertainment & Recreation | 182 (50.7%) | 177 (49.3%) |
| Accommodation & Food Services | 438 (49.7%) | 444 (50.3%) |
| Public Administration | 921 (68.6%) | 422 (31.4%) |
| Total | 13,364 (52.2%) | 12,259 (47.8%) |
Education in Rockwall
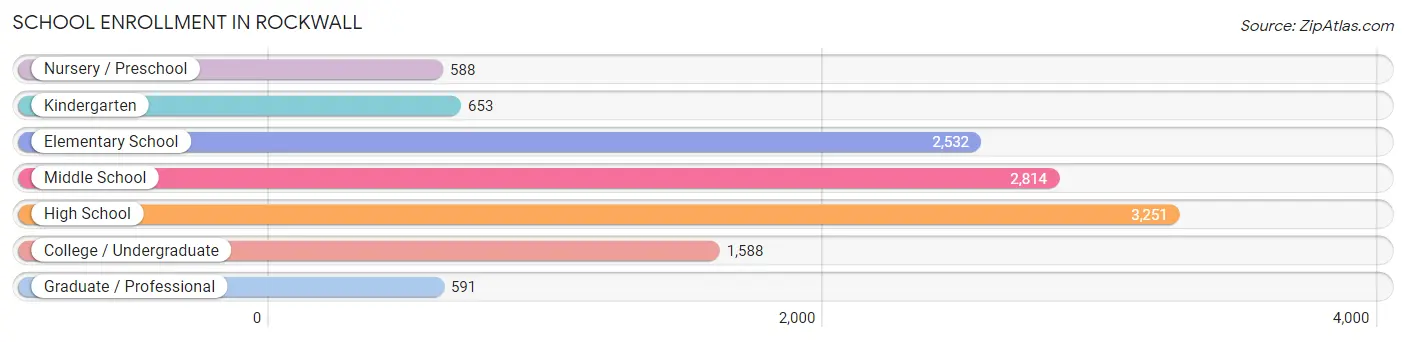
School Enrollment in Rockwall
The most common levels of schooling among the 12,017 students in Rockwall are high school (3,251 | 27.1%), middle school (2,814 | 23.4%), and elementary school (2,532 | 21.1%).
| School Level | # Students | % Students |
| Nursery / Preschool | 588 | 4.9% |
| Kindergarten | 653 | 5.4% |
| Elementary School | 2,532 | 21.1% |
| Middle School | 2,814 | 23.4% |
| High School | 3,251 | 27.1% |
| College / Undergraduate | 1,588 | 13.2% |
| Graduate / Professional | 591 | 4.9% |
| Total | 12,017 | 100.0% |
School Enrollment by Age by Funding Source in Rockwall
Out of a total of 12,017 students who are enrolled in schools in Rockwall, 1,694 (14.1%) attend a private institution, while the remaining 10,323 (85.9%) are enrolled in public schools. The age group of 35 years and over has the highest likelihood of being enrolled in private schools, with 190 (45.0% in the age bracket) enrolled. Conversely, the age group of 15 to 17 year olds has the lowest likelihood of being enrolled in a private school, with 2,463 (93.7% in the age bracket) attending a public institution.
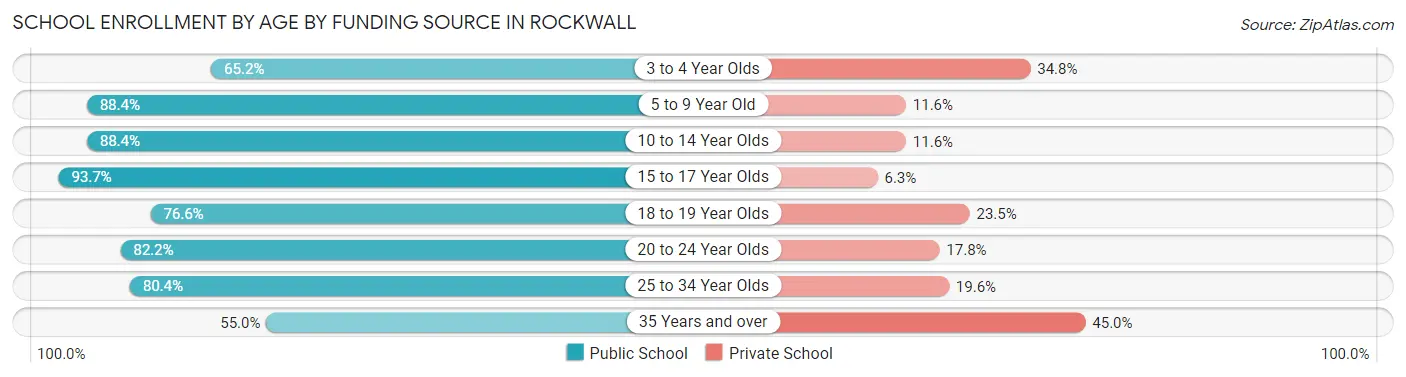
| Age Bracket | Public School | Private School |
| 3 to 4 Year Olds | 321 (65.2%) | 171 (34.8%) |
| 5 to 9 Year Old | 2,535 (88.4%) | 332 (11.6%) |
| 10 to 14 Year Olds | 3,089 (88.4%) | 405 (11.6%) |
| 15 to 17 Year Olds | 2,463 (93.7%) | 166 (6.3%) |
| 18 to 19 Year Olds | 630 (76.5%) | 193 (23.4%) |
| 20 to 24 Year Olds | 645 (82.2%) | 140 (17.8%) |
| 25 to 34 Year Olds | 406 (80.4%) | 99 (19.6%) |
| 35 Years and over | 232 (55.0%) | 190 (45.0%) |
| Total | 10,323 (85.9%) | 1,694 (14.1%) |
Educational Attainment by Field of Study in Rockwall
Business (3,597 | 21.6%), education (1,877 | 11.3%), science & technology (1,650 | 9.9%), arts & humanities (1,413 | 8.5%), and engineering (1,402 | 8.4%) are the most common fields of study among 16,637 individuals in Rockwall who have obtained a bachelor's degree or higher.
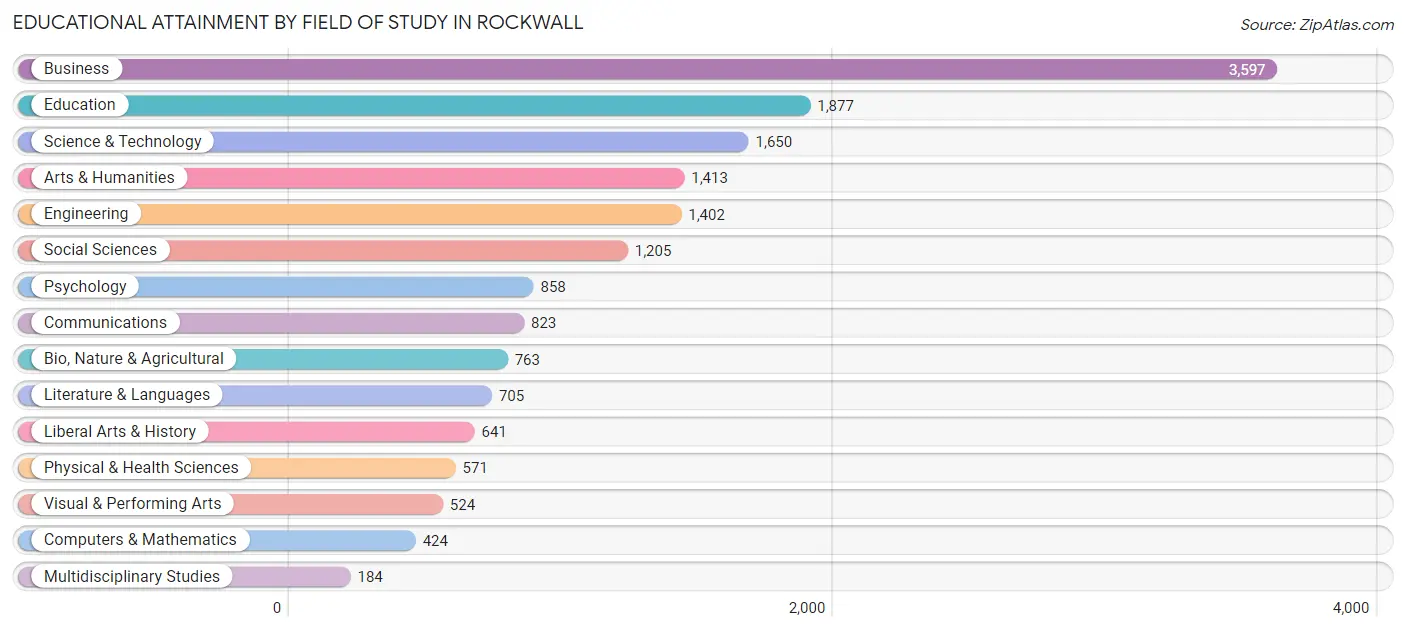
| Field of Study | # Graduates | % Graduates |
| Computers & Mathematics | 424 | 2.5% |
| Bio, Nature & Agricultural | 763 | 4.6% |
| Physical & Health Sciences | 571 | 3.4% |
| Psychology | 858 | 5.2% |
| Social Sciences | 1,205 | 7.2% |
| Engineering | 1,402 | 8.4% |
| Multidisciplinary Studies | 184 | 1.1% |
| Science & Technology | 1,650 | 9.9% |
| Business | 3,597 | 21.6% |
| Education | 1,877 | 11.3% |
| Literature & Languages | 705 | 4.2% |
| Liberal Arts & History | 641 | 3.8% |
| Visual & Performing Arts | 524 | 3.2% |
| Communications | 823 | 5.0% |
| Arts & Humanities | 1,413 | 8.5% |
| Total | 16,637 | 100.0% |
Transportation & Commute in Rockwall
Vehicle Availability by Sex in Rockwall
The most prevalent vehicle ownership categories in Rockwall are males with 2 vehicles (5,983, accounting for 46.3%) and females with 2 vehicles (5,069, making up 49.5%).
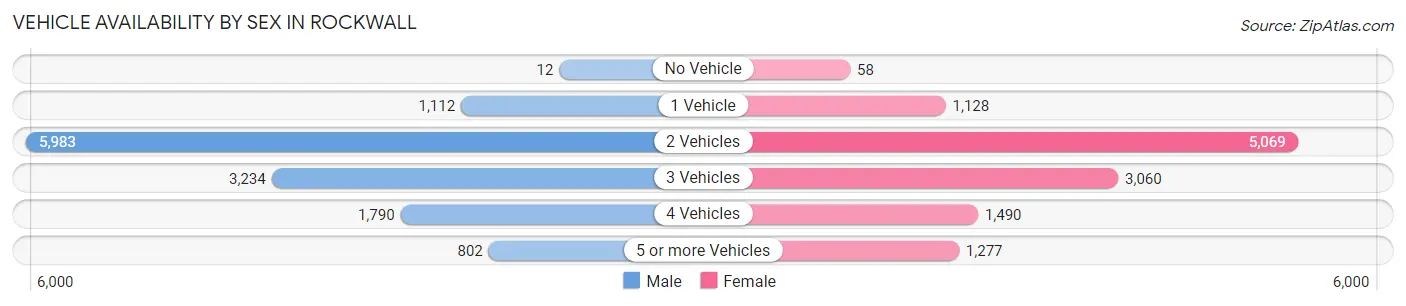
| Vehicles Available | Male | Female |
| No Vehicle | 12 (0.1%) | 58 (0.5%) |
| 1 Vehicle | 1,112 (8.6%) | 1,128 (9.3%) |
| 2 Vehicles | 5,983 (46.3%) | 5,069 (41.9%) |
| 3 Vehicles | 3,234 (25.0%) | 3,060 (25.3%) |
| 4 Vehicles | 1,790 (13.8%) | 1,490 (12.3%) |
| 5 or more Vehicles | 802 (6.2%) | 1,277 (10.6%) |
| Total | 12,933 (100.0%) | 12,082 (100.0%) |
Commute Time in Rockwall
The most frequently occuring commute durations in Rockwall are 45 to 59 minutes (3,336 commuters, 16.0%), 30 to 34 minutes (2,804 commuters, 13.5%), and 10 to 14 minutes (2,415 commuters, 11.6%).
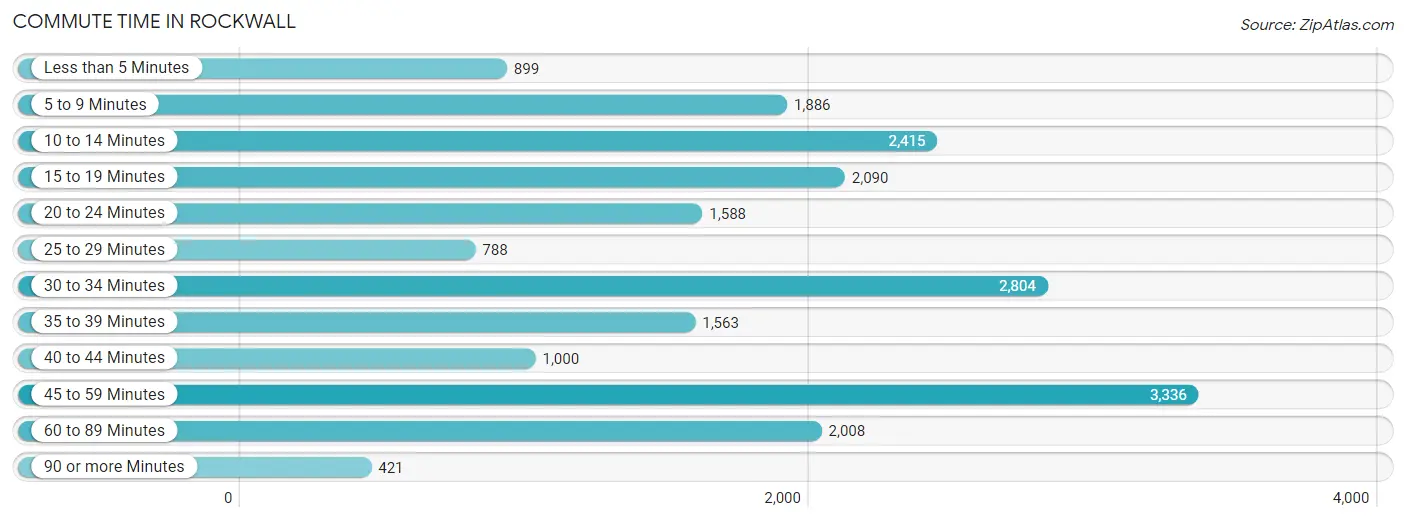
| Commute Time | # Commuters | % Commuters |
| Less than 5 Minutes | 899 | 4.3% |
| 5 to 9 Minutes | 1,886 | 9.1% |
| 10 to 14 Minutes | 2,415 | 11.6% |
| 15 to 19 Minutes | 2,090 | 10.1% |
| 20 to 24 Minutes | 1,588 | 7.6% |
| 25 to 29 Minutes | 788 | 3.8% |
| 30 to 34 Minutes | 2,804 | 13.5% |
| 35 to 39 Minutes | 1,563 | 7.5% |
| 40 to 44 Minutes | 1,000 | 4.8% |
| 45 to 59 Minutes | 3,336 | 16.0% |
| 60 to 89 Minutes | 2,008 | 9.7% |
| 90 or more Minutes | 421 | 2.0% |
Commute Time by Sex in Rockwall
The most common commute times in Rockwall are 45 to 59 minutes (1,883 commuters, 17.6%) for males and 10 to 14 minutes (1,519 commuters, 15.0%) for females.
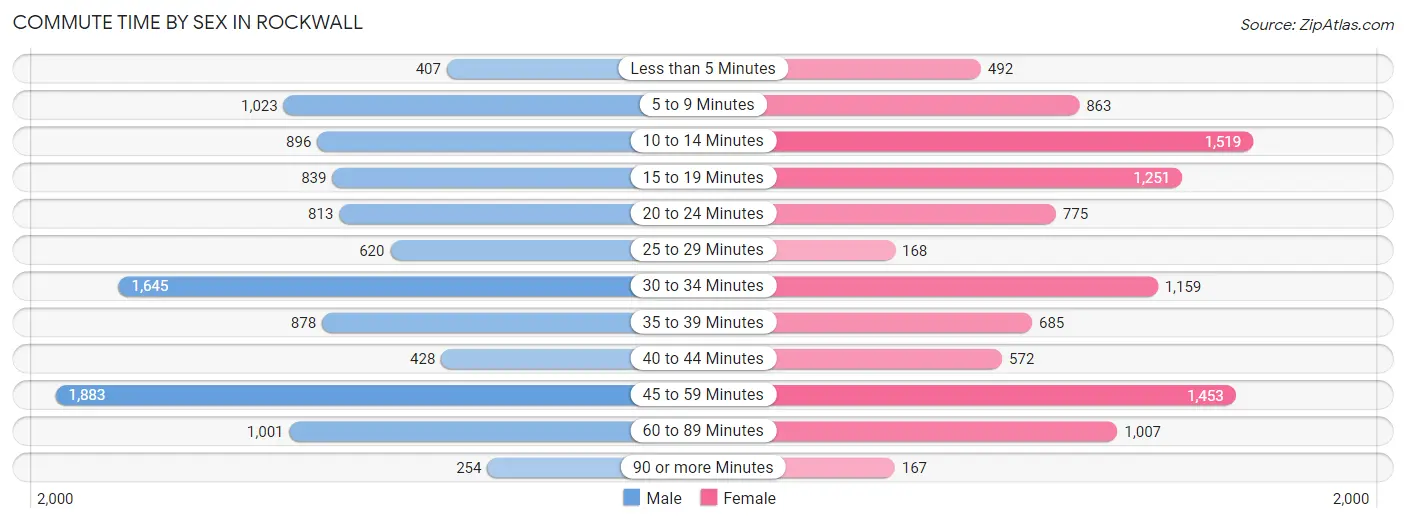
| Commute Time | Male | Female |
| Less than 5 Minutes | 407 (3.8%) | 492 (4.9%) |
| 5 to 9 Minutes | 1,023 (9.6%) | 863 (8.5%) |
| 10 to 14 Minutes | 896 (8.4%) | 1,519 (15.0%) |
| 15 to 19 Minutes | 839 (7.9%) | 1,251 (12.4%) |
| 20 to 24 Minutes | 813 (7.6%) | 775 (7.7%) |
| 25 to 29 Minutes | 620 (5.8%) | 168 (1.7%) |
| 30 to 34 Minutes | 1,645 (15.4%) | 1,159 (11.5%) |
| 35 to 39 Minutes | 878 (8.2%) | 685 (6.8%) |
| 40 to 44 Minutes | 428 (4.0%) | 572 (5.7%) |
| 45 to 59 Minutes | 1,883 (17.6%) | 1,453 (14.4%) |
| 60 to 89 Minutes | 1,001 (9.4%) | 1,007 (10.0%) |
| 90 or more Minutes | 254 (2.4%) | 167 (1.7%) |
Time of Departure to Work by Sex in Rockwall
The most frequent times of departure to work in Rockwall are 7:00 AM to 7:29 AM (1,783, 16.7%) for males and 7:00 AM to 7:29 AM (1,677, 16.6%) for females.
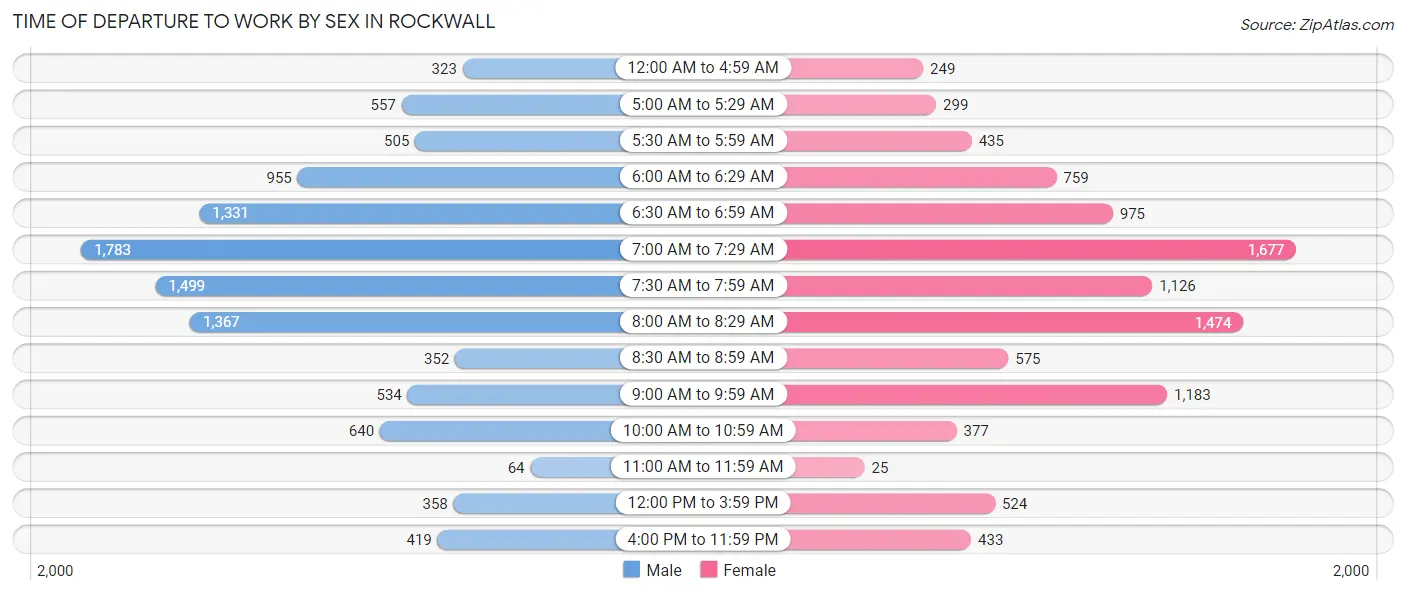
| Time of Departure | Male | Female |
| 12:00 AM to 4:59 AM | 323 (3.0%) | 249 (2.5%) |
| 5:00 AM to 5:29 AM | 557 (5.2%) | 299 (3.0%) |
| 5:30 AM to 5:59 AM | 505 (4.7%) | 435 (4.3%) |
| 6:00 AM to 6:29 AM | 955 (8.9%) | 759 (7.5%) |
| 6:30 AM to 6:59 AM | 1,331 (12.4%) | 975 (9.6%) |
| 7:00 AM to 7:29 AM | 1,783 (16.7%) | 1,677 (16.6%) |
| 7:30 AM to 7:59 AM | 1,499 (14.0%) | 1,126 (11.1%) |
| 8:00 AM to 8:29 AM | 1,367 (12.8%) | 1,474 (14.6%) |
| 8:30 AM to 8:59 AM | 352 (3.3%) | 575 (5.7%) |
| 9:00 AM to 9:59 AM | 534 (5.0%) | 1,183 (11.7%) |
| 10:00 AM to 10:59 AM | 640 (6.0%) | 377 (3.7%) |
| 11:00 AM to 11:59 AM | 64 (0.6%) | 25 (0.3%) |
| 12:00 PM to 3:59 PM | 358 (3.4%) | 524 (5.2%) |
| 4:00 PM to 11:59 PM | 419 (3.9%) | 433 (4.3%) |
| Total | 10,687 (100.0%) | 10,111 (100.0%) |
Housing Occupancy in Rockwall
Occupancy by Ownership in Rockwall
Of the total 17,092 dwellings in Rockwall, owner-occupied units account for 12,906 (75.5%), while renter-occupied units make up 4,186 (24.5%).
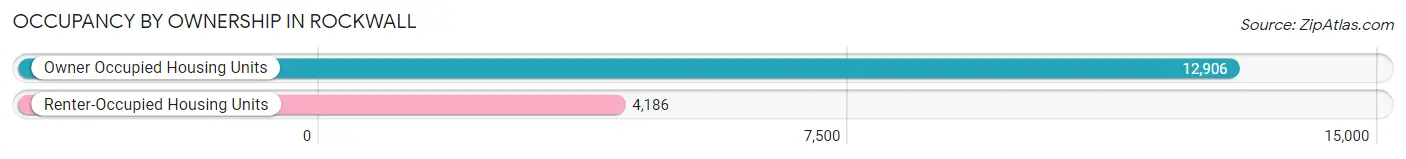
| Occupancy | # Housing Units | % Housing Units |
| Owner Occupied Housing Units | 12,906 | 75.5% |
| Renter-Occupied Housing Units | 4,186 | 24.5% |
| Total Occupied Housing Units | 17,092 | 100.0% |
Occupancy by Household Size in Rockwall
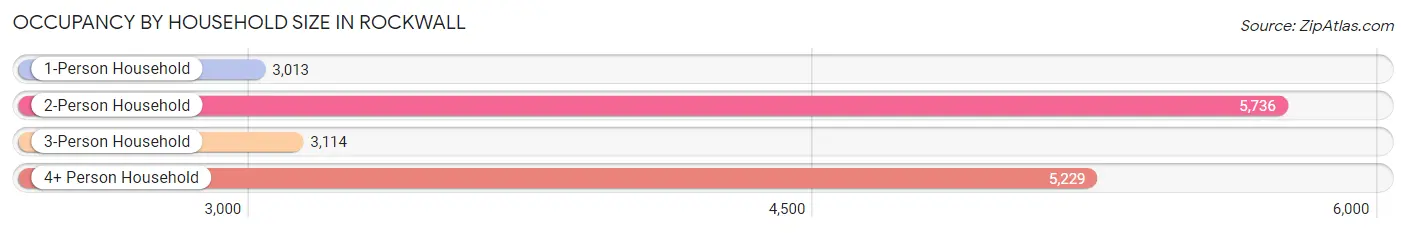
| Household Size | # Housing Units | % Housing Units |
| 1-Person Household | 3,013 | 17.6% |
| 2-Person Household | 5,736 | 33.6% |
| 3-Person Household | 3,114 | 18.2% |
| 4+ Person Household | 5,229 | 30.6% |
| Total Housing Units | 17,092 | 100.0% |
Occupancy by Ownership by Household Size in Rockwall
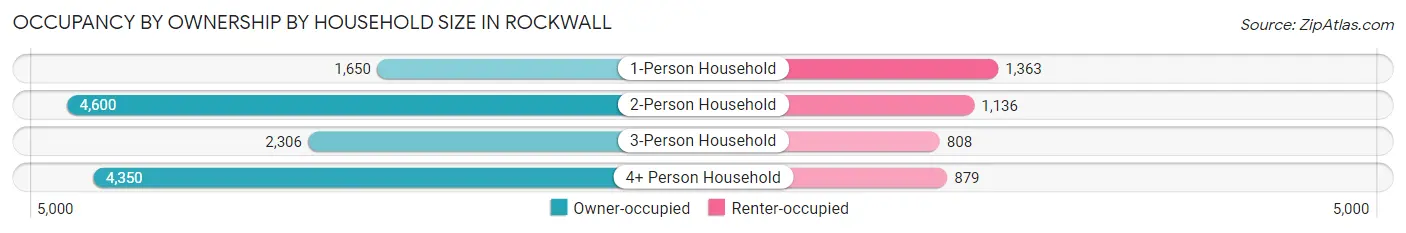
| Household Size | Owner-occupied | Renter-occupied |
| 1-Person Household | 1,650 (54.8%) | 1,363 (45.2%) |
| 2-Person Household | 4,600 (80.2%) | 1,136 (19.8%) |
| 3-Person Household | 2,306 (74.1%) | 808 (26.0%) |
| 4+ Person Household | 4,350 (83.2%) | 879 (16.8%) |
| Total Housing Units | 12,906 (75.5%) | 4,186 (24.5%) |
Occupancy by Educational Attainment in Rockwall
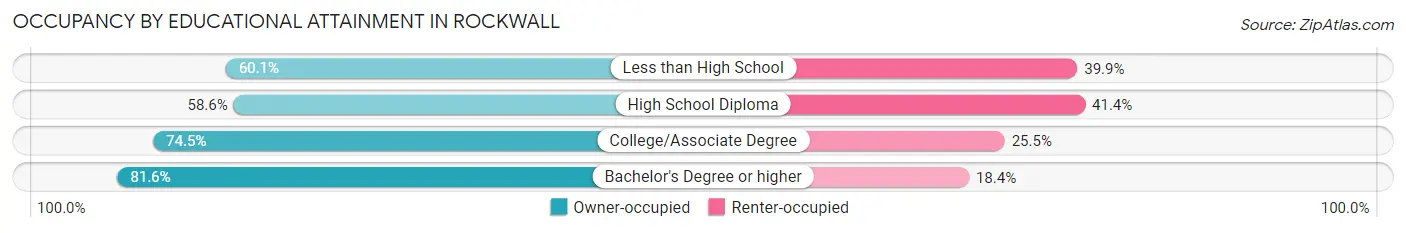
| Household Size | Owner-occupied | Renter-occupied |
| Less than High School | 389 (60.1%) | 258 (39.9%) |
| High School Diploma | 1,391 (58.6%) | 984 (41.4%) |
| College/Associate Degree | 3,732 (74.5%) | 1,277 (25.5%) |
| Bachelor's Degree or higher | 7,394 (81.6%) | 1,667 (18.4%) |
Occupancy by Age of Householder in Rockwall
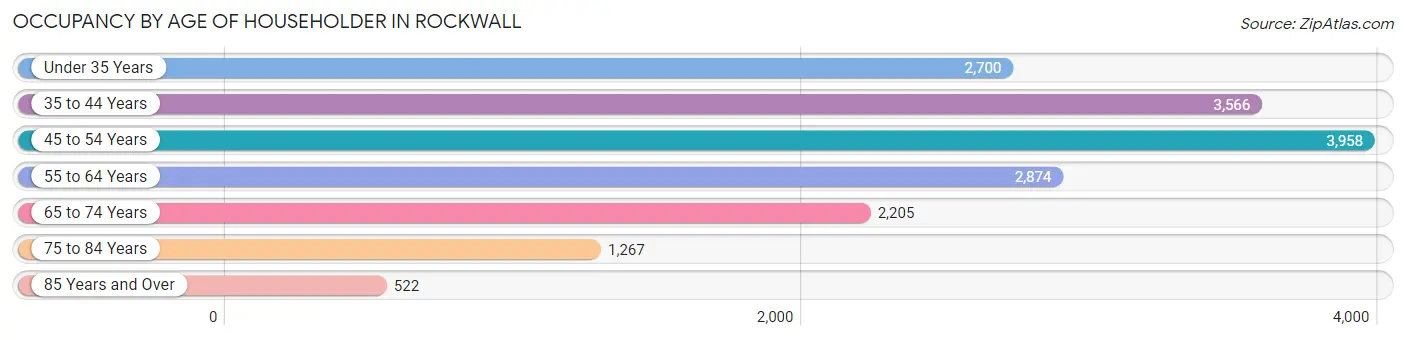
| Age Bracket | # Households | % Households |
| Under 35 Years | 2,700 | 15.8% |
| 35 to 44 Years | 3,566 | 20.9% |
| 45 to 54 Years | 3,958 | 23.2% |
| 55 to 64 Years | 2,874 | 16.8% |
| 65 to 74 Years | 2,205 | 12.9% |
| 75 to 84 Years | 1,267 | 7.4% |
| 85 Years and Over | 522 | 3.0% |
| Total | 17,092 | 100.0% |
Housing Finances in Rockwall
Median Income by Occupancy in Rockwall
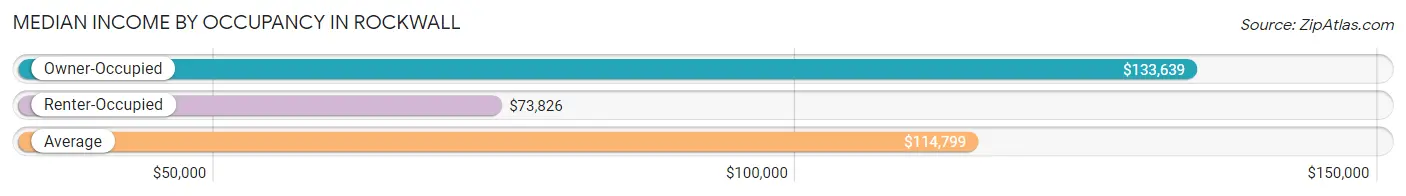
| Occupancy Type | # Households | Median Income |
| Owner-Occupied | 12,906 (75.5%) | $133,639 |
| Renter-Occupied | 4,186 (24.5%) | $73,826 |
| Average | 17,092 (100.0%) | $114,799 |
Occupancy by Householder Income Bracket in Rockwall
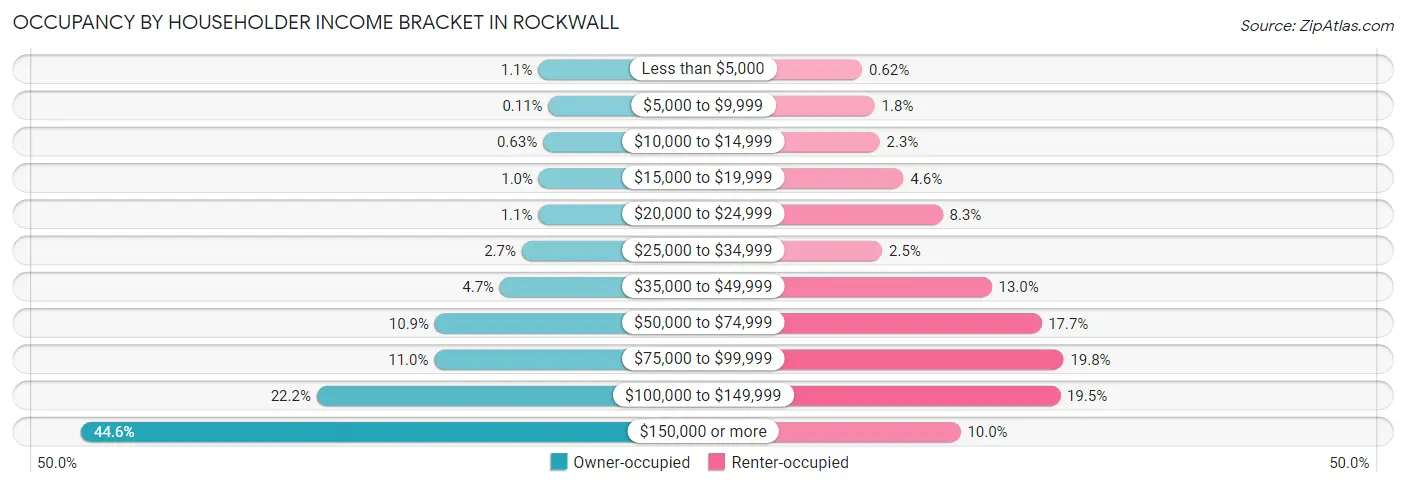
| Income Bracket | Owner-occupied | Renter-occupied |
| Less than $5,000 | 138 (1.1%) | 26 (0.6%) |
| $5,000 to $9,999 | 14 (0.1%) | 76 (1.8%) |
| $10,000 to $14,999 | 81 (0.6%) | 96 (2.3%) |
| $15,000 to $19,999 | 132 (1.0%) | 191 (4.6%) |
| $20,000 to $24,999 | 140 (1.1%) | 347 (8.3%) |
| $25,000 to $34,999 | 342 (2.6%) | 106 (2.5%) |
| $35,000 to $49,999 | 610 (4.7%) | 542 (13.0%) |
| $50,000 to $74,999 | 1,410 (10.9%) | 740 (17.7%) |
| $75,000 to $99,999 | 1,417 (11.0%) | 829 (19.8%) |
| $100,000 to $149,999 | 2,863 (22.2%) | 815 (19.5%) |
| $150,000 or more | 5,759 (44.6%) | 418 (10.0%) |
| Total | 12,906 (100.0%) | 4,186 (100.0%) |
Monthly Housing Cost Tiers in Rockwall
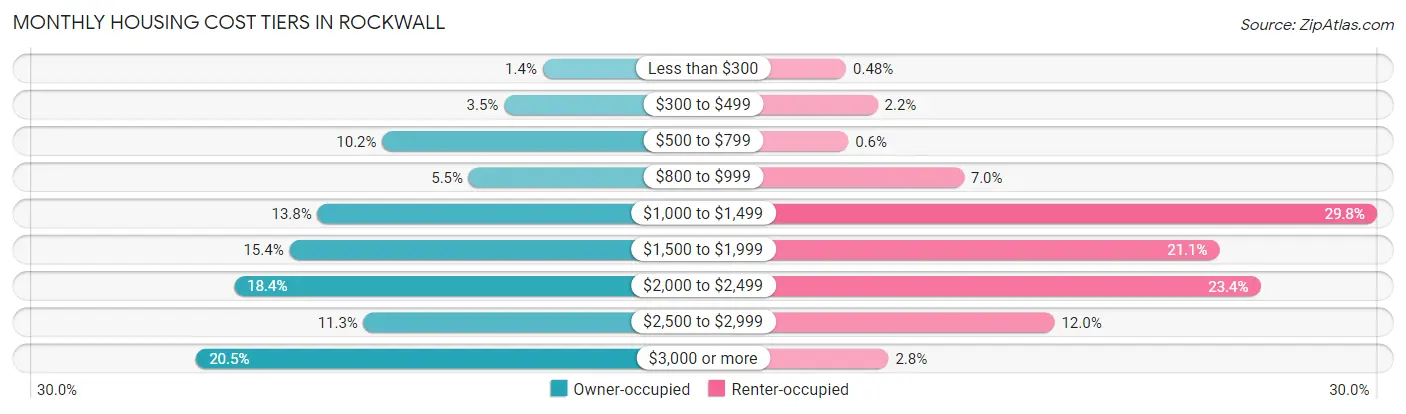
| Monthly Cost | Owner-occupied | Renter-occupied |
| Less than $300 | 178 (1.4%) | 20 (0.5%) |
| $300 to $499 | 453 (3.5%) | 93 (2.2%) |
| $500 to $799 | 1,322 (10.2%) | 25 (0.6%) |
| $800 to $999 | 705 (5.5%) | 292 (7.0%) |
| $1,000 to $1,499 | 1,783 (13.8%) | 1,247 (29.8%) |
| $1,500 to $1,999 | 1,984 (15.4%) | 883 (21.1%) |
| $2,000 to $2,499 | 2,379 (18.4%) | 978 (23.4%) |
| $2,500 to $2,999 | 1,454 (11.3%) | 502 (12.0%) |
| $3,000 or more | 2,648 (20.5%) | 118 (2.8%) |
| Total | 12,906 (100.0%) | 4,186 (100.0%) |
Physical Housing Characteristics in Rockwall
Housing Structures in Rockwall
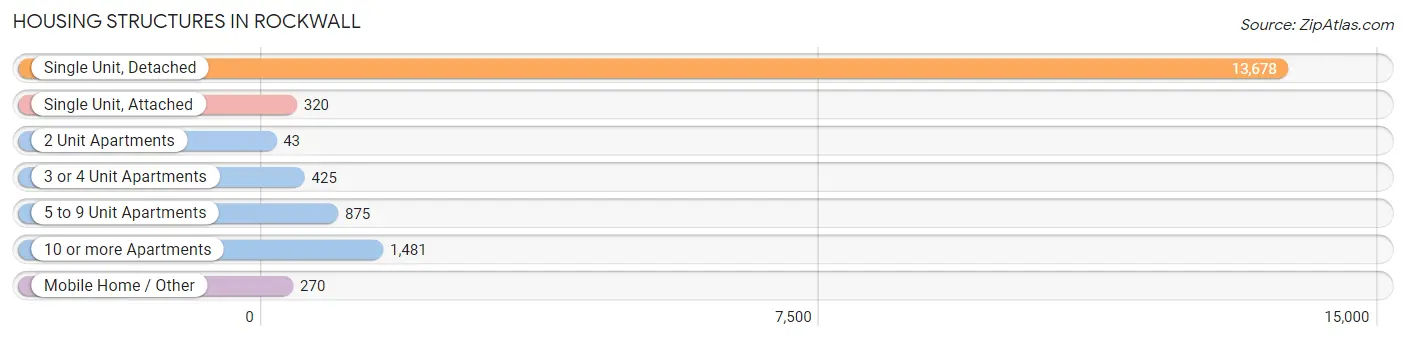
| Structure Type | # Housing Units | % Housing Units |
| Single Unit, Detached | 13,678 | 80.0% |
| Single Unit, Attached | 320 | 1.9% |
| 2 Unit Apartments | 43 | 0.3% |
| 3 or 4 Unit Apartments | 425 | 2.5% |
| 5 to 9 Unit Apartments | 875 | 5.1% |
| 10 or more Apartments | 1,481 | 8.7% |
| Mobile Home / Other | 270 | 1.6% |
| Total | 17,092 | 100.0% |
Housing Structures by Occupancy in Rockwall
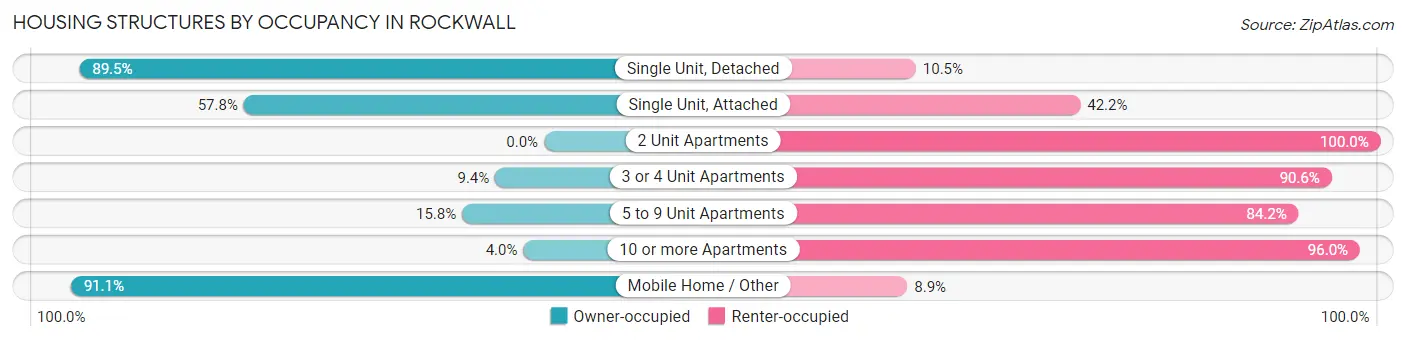
| Structure Type | Owner-occupied | Renter-occupied |
| Single Unit, Detached | 12,238 (89.5%) | 1,440 (10.5%) |
| Single Unit, Attached | 185 (57.8%) | 135 (42.2%) |
| 2 Unit Apartments | 0 (0.0%) | 43 (100.0%) |
| 3 or 4 Unit Apartments | 40 (9.4%) | 385 (90.6%) |
| 5 to 9 Unit Apartments | 138 (15.8%) | 737 (84.2%) |
| 10 or more Apartments | 59 (4.0%) | 1,422 (96.0%) |
| Mobile Home / Other | 246 (91.1%) | 24 (8.9%) |
| Total | 12,906 (75.5%) | 4,186 (24.5%) |
Housing Structures by Number of Rooms in Rockwall
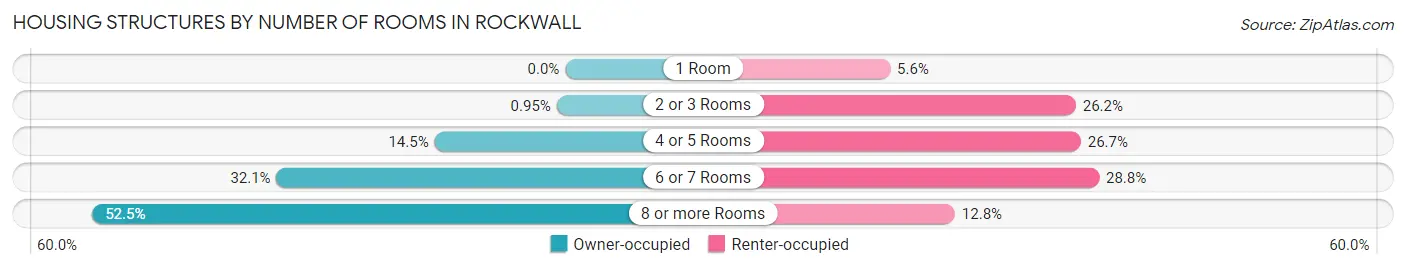
| Number of Rooms | Owner-occupied | Renter-occupied |
| 1 Room | 0 (0.0%) | 233 (5.6%) |
| 2 or 3 Rooms | 123 (0.9%) | 1,096 (26.2%) |
| 4 or 5 Rooms | 1,873 (14.5%) | 1,119 (26.7%) |
| 6 or 7 Rooms | 4,136 (32.1%) | 1,204 (28.8%) |
| 8 or more Rooms | 6,774 (52.5%) | 534 (12.8%) |
| Total | 12,906 (100.0%) | 4,186 (100.0%) |
Housing Structure by Heating Type in Rockwall
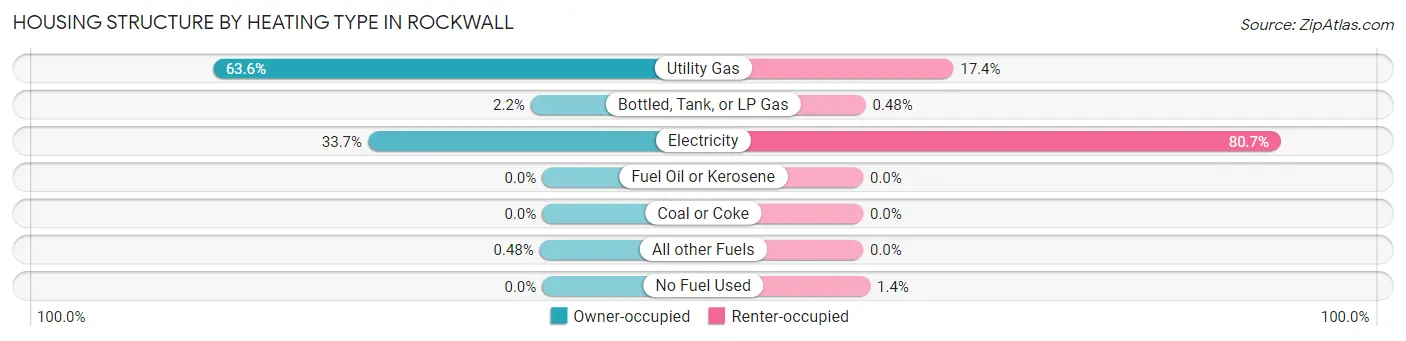
| Heating Type | Owner-occupied | Renter-occupied |
| Utility Gas | 8,214 (63.6%) | 730 (17.4%) |
| Bottled, Tank, or LP Gas | 285 (2.2%) | 20 (0.5%) |
| Electricity | 4,345 (33.7%) | 3,379 (80.7%) |
| Fuel Oil or Kerosene | 0 (0.0%) | 0 (0.0%) |
| Coal or Coke | 0 (0.0%) | 0 (0.0%) |
| All other Fuels | 62 (0.5%) | 0 (0.0%) |
| No Fuel Used | 0 (0.0%) | 57 (1.4%) |
| Total | 12,906 (100.0%) | 4,186 (100.0%) |
Household Vehicle Usage in Rockwall
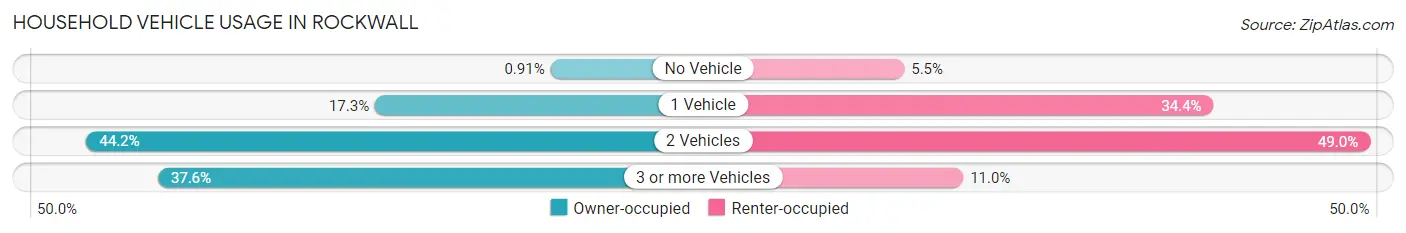
| Vehicles per Household | Owner-occupied | Renter-occupied |
| No Vehicle | 118 (0.9%) | 232 (5.5%) |
| 1 Vehicle | 2,232 (17.3%) | 1,440 (34.4%) |
| 2 Vehicles | 5,708 (44.2%) | 2,052 (49.0%) |
| 3 or more Vehicles | 4,848 (37.6%) | 462 (11.0%) |
| Total | 12,906 (100.0%) | 4,186 (100.0%) |
Real Estate & Mortgages in Rockwall
Real Estate and Mortgage Overview in Rockwall
| Characteristic | Without Mortgage | With Mortgage |
| Housing Units | 3,714 | 9,192 |
| Median Property Value | $304,900 | $376,000 |
| Median Household Income | $90,313 | $4,903 |
| Monthly Housing Costs | $780 | $2,629 |
| Real Estate Taxes | $4,325 | $134 |
Property Value by Mortgage Status in Rockwall
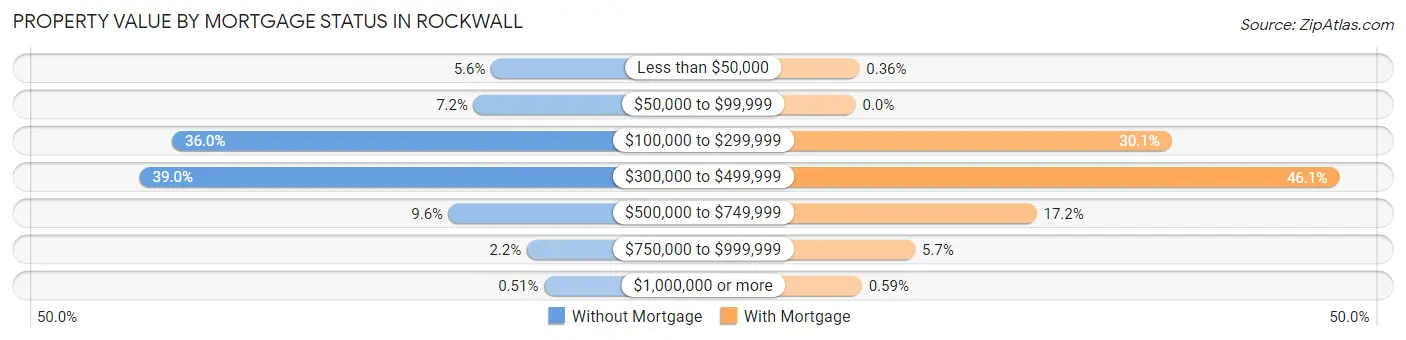
| Property Value | Without Mortgage | With Mortgage |
| Less than $50,000 | 206 (5.6%) | 33 (0.4%) |
| $50,000 to $99,999 | 268 (7.2%) | 0 (0.0%) |
| $100,000 to $299,999 | 1,335 (35.9%) | 2,766 (30.1%) |
| $300,000 to $499,999 | 1,450 (39.0%) | 4,234 (46.1%) |
| $500,000 to $749,999 | 356 (9.6%) | 1,585 (17.2%) |
| $750,000 to $999,999 | 80 (2.1%) | 520 (5.7%) |
| $1,000,000 or more | 19 (0.5%) | 54 (0.6%) |
| Total | 3,714 (100.0%) | 9,192 (100.0%) |
Household Income by Mortgage Status in Rockwall
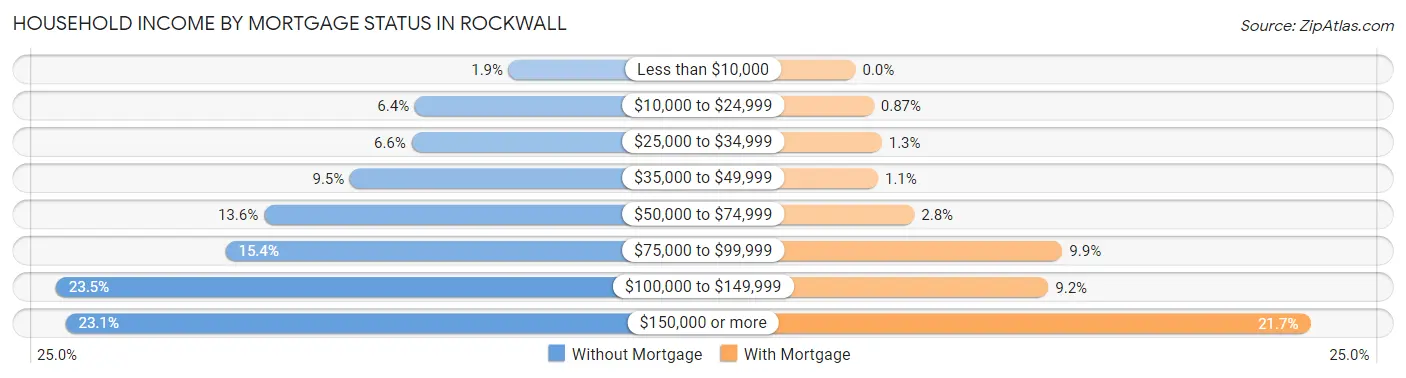
| Household Income | Without Mortgage | With Mortgage |
| Less than $10,000 | 72 (1.9%) | 0 (0.0%) |
| $10,000 to $24,999 | 238 (6.4%) | 80 (0.9%) |
| $25,000 to $34,999 | 244 (6.6%) | 115 (1.3%) |
| $35,000 to $49,999 | 353 (9.5%) | 98 (1.1%) |
| $50,000 to $74,999 | 505 (13.6%) | 257 (2.8%) |
| $75,000 to $99,999 | 573 (15.4%) | 905 (9.9%) |
| $100,000 to $149,999 | 873 (23.5%) | 844 (9.2%) |
| $150,000 or more | 856 (23.1%) | 1,990 (21.6%) |
| Total | 3,714 (100.0%) | 9,192 (100.0%) |
Property Value to Household Income Ratio in Rockwall
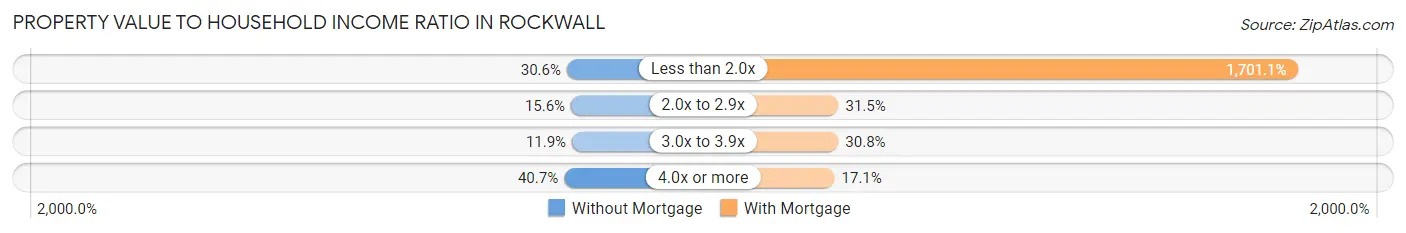
| Value-to-Income Ratio | Without Mortgage | With Mortgage |
| Less than 2.0x | 1,136 (30.6%) | 156,366 (1,701.1%) |
| 2.0x to 2.9x | 578 (15.6%) | 2,893 (31.5%) |
| 3.0x to 3.9x | 443 (11.9%) | 2,835 (30.8%) |
| 4.0x or more | 1,513 (40.7%) | 1,570 (17.1%) |
| Total | 3,714 (100.0%) | 9,192 (100.0%) |
Real Estate Taxes by Mortgage Status in Rockwall
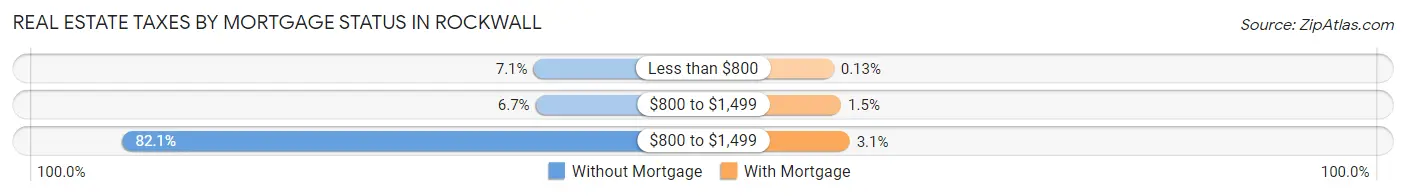
| Property Taxes | Without Mortgage | With Mortgage |
| Less than $800 | 263 (7.1%) | 12 (0.1%) |
| $800 to $1,499 | 249 (6.7%) | 136 (1.5%) |
| $800 to $1,499 | 3,049 (82.1%) | 280 (3.0%) |
| Total | 3,714 (100.0%) | 9,192 (100.0%) |
Health & Disability in Rockwall
Health Insurance Coverage by Age in Rockwall
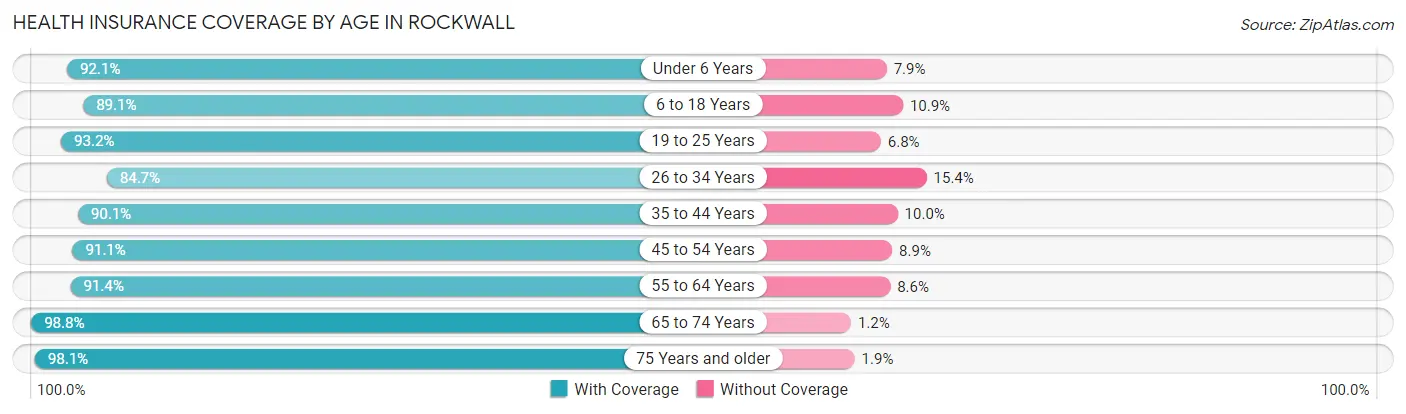
| Age Bracket | With Coverage | Without Coverage |
| Under 6 Years | 3,096 (92.1%) | 266 (7.9%) |
| 6 to 18 Years | 8,455 (89.1%) | 1,039 (10.9%) |
| 19 to 25 Years | 3,580 (93.2%) | 262 (6.8%) |
| 26 to 34 Years | 4,020 (84.7%) | 729 (15.3%) |
| 35 to 44 Years | 6,211 (90.0%) | 686 (10.0%) |
| 45 to 54 Years | 6,774 (91.1%) | 664 (8.9%) |
| 55 to 64 Years | 4,914 (91.4%) | 460 (8.6%) |
| 65 to 74 Years | 3,592 (98.8%) | 45 (1.2%) |
| 75 Years and older | 2,638 (98.1%) | 52 (1.9%) |
| Total | 43,280 (91.1%) | 4,203 (8.8%) |
Health Insurance Coverage by Citizenship Status in Rockwall
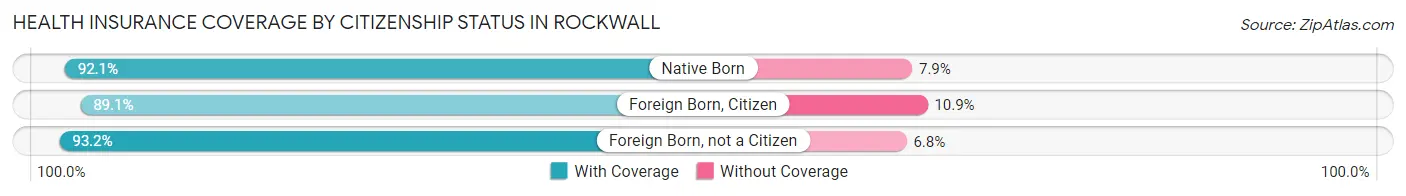
| Citizenship Status | With Coverage | Without Coverage |
| Native Born | 3,096 (92.1%) | 266 (7.9%) |
| Foreign Born, Citizen | 8,455 (89.1%) | 1,039 (10.9%) |
| Foreign Born, not a Citizen | 3,580 (93.2%) | 262 (6.8%) |
Health Insurance Coverage by Household Income in Rockwall
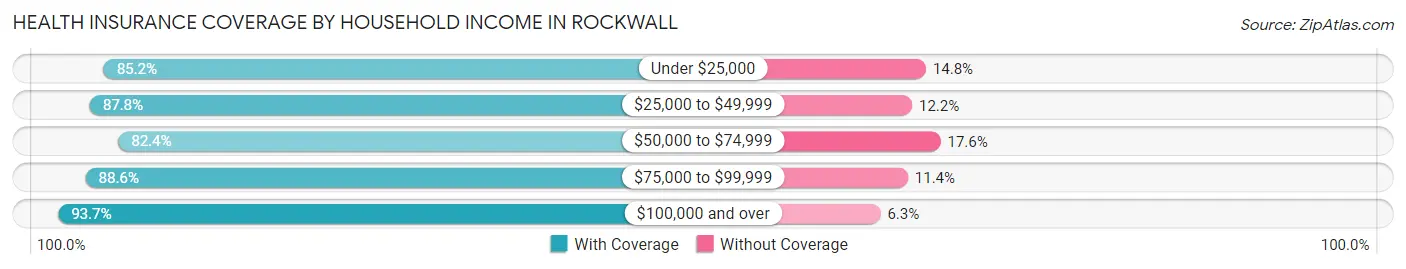
| Household Income | With Coverage | Without Coverage |
| Under $25,000 | 1,769 (85.2%) | 308 (14.8%) |
| $25,000 to $49,999 | 2,147 (87.8%) | 299 (12.2%) |
| $50,000 to $74,999 | 4,250 (82.4%) | 905 (17.6%) |
| $75,000 to $99,999 | 5,297 (88.6%) | 684 (11.4%) |
| $100,000 and over | 29,812 (93.7%) | 2,007 (6.3%) |
Public vs Private Health Insurance Coverage by Age in Rockwall
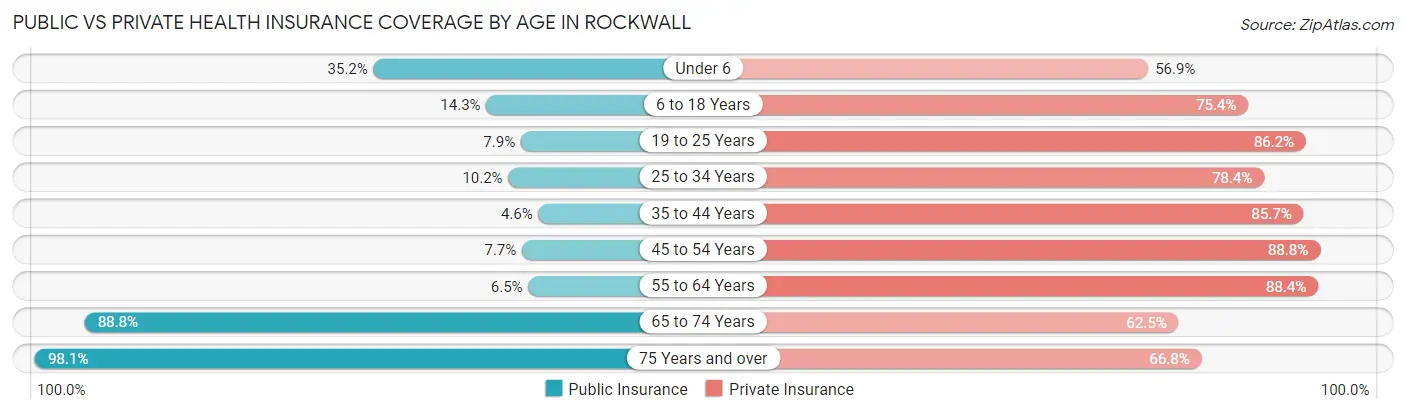
| Age Bracket | Public Insurance | Private Insurance |
| Under 6 | 1,184 (35.2%) | 1,912 (56.9%) |
| 6 to 18 Years | 1,356 (14.3%) | 7,161 (75.4%) |
| 19 to 25 Years | 302 (7.9%) | 3,310 (86.2%) |
| 25 to 34 Years | 484 (10.2%) | 3,723 (78.4%) |
| 35 to 44 Years | 318 (4.6%) | 5,912 (85.7%) |
| 45 to 54 Years | 570 (7.7%) | 6,602 (88.8%) |
| 55 to 64 Years | 348 (6.5%) | 4,750 (88.4%) |
| 65 to 74 Years | 3,231 (88.8%) | 2,274 (62.5%) |
| 75 Years and over | 2,638 (98.1%) | 1,796 (66.8%) |
| Total | 10,431 (22.0%) | 37,440 (78.8%) |
Disability Status by Sex by Age in Rockwall
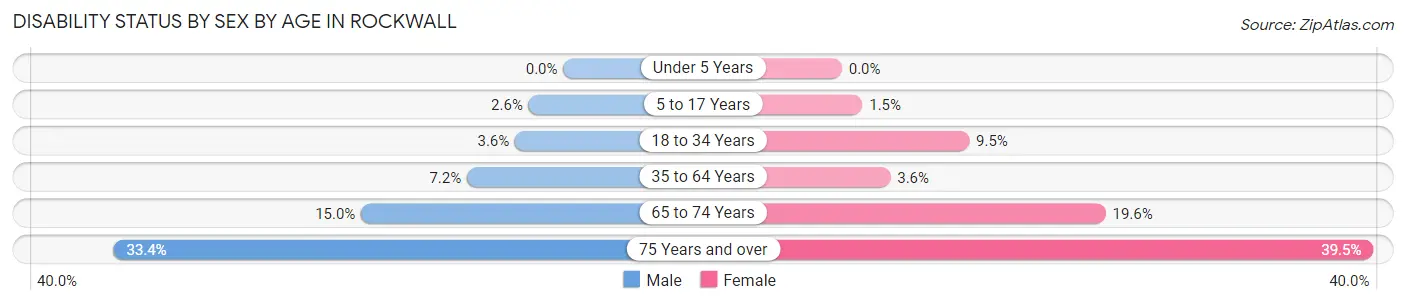
| Age Bracket | Male | Female |
| Under 5 Years | 0 (0.0%) | 0 (0.0%) |
| 5 to 17 Years | 128 (2.6%) | 65 (1.5%) |
| 18 to 34 Years | 164 (3.6%) | 445 (9.5%) |
| 35 to 64 Years | 693 (7.1%) | 361 (3.6%) |
| 65 to 74 Years | 257 (15.0%) | 377 (19.6%) |
| 75 Years and over | 333 (33.4%) | 668 (39.5%) |
Disability Class by Sex by Age in Rockwall
Disability Class: Hearing Difficulty
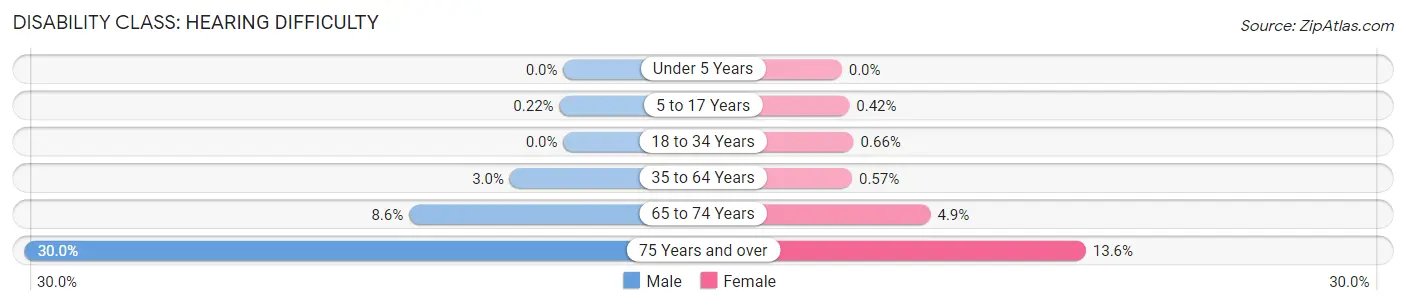
| Age Bracket | Male | Female |
| Under 5 Years | 0 (0.0%) | 0 (0.0%) |
| 5 to 17 Years | 11 (0.2%) | 18 (0.4%) |
| 18 to 34 Years | 0 (0.0%) | 31 (0.7%) |
| 35 to 64 Years | 289 (3.0%) | 57 (0.6%) |
| 65 to 74 Years | 147 (8.6%) | 95 (4.9%) |
| 75 Years and over | 299 (30.0%) | 230 (13.6%) |
Disability Class: Vision Difficulty
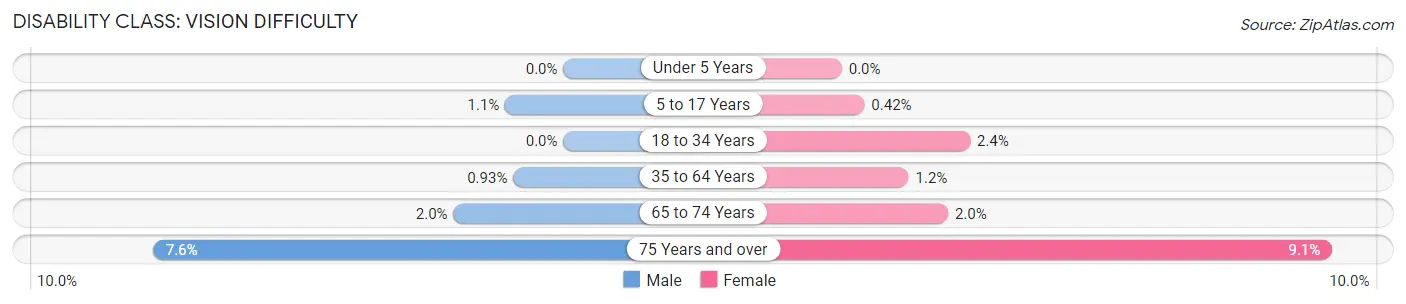
| Age Bracket | Male | Female |
| Under 5 Years | 0 (0.0%) | 0 (0.0%) |
| 5 to 17 Years | 54 (1.1%) | 18 (0.4%) |
| 18 to 34 Years | 0 (0.0%) | 112 (2.4%) |
| 35 to 64 Years | 90 (0.9%) | 124 (1.2%) |
| 65 to 74 Years | 35 (2.0%) | 38 (2.0%) |
| 75 Years and over | 76 (7.6%) | 154 (9.1%) |
Disability Class: Cognitive Difficulty
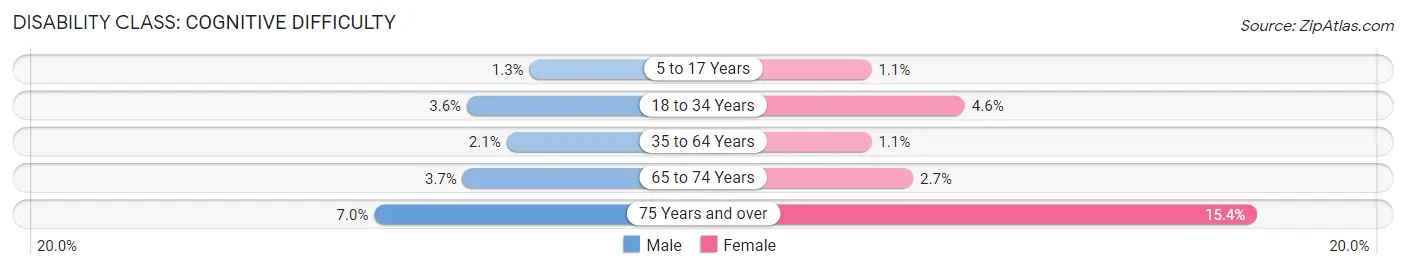
| Age Bracket | Male | Female |
| 5 to 17 Years | 63 (1.3%) | 47 (1.1%) |
| 18 to 34 Years | 164 (3.6%) | 215 (4.6%) |
| 35 to 64 Years | 205 (2.1%) | 110 (1.1%) |
| 65 to 74 Years | 64 (3.7%) | 51 (2.6%) |
| 75 Years and over | 70 (7.0%) | 261 (15.4%) |
Disability Class: Ambulatory Difficulty
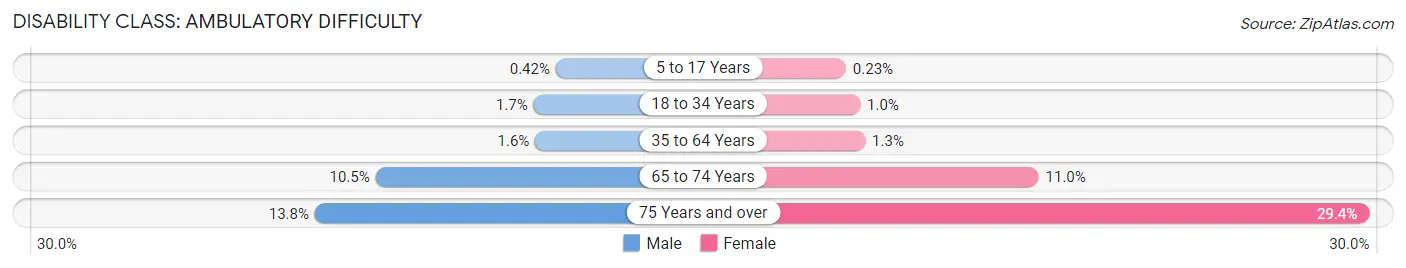
| Age Bracket | Male | Female |
| 5 to 17 Years | 21 (0.4%) | 10 (0.2%) |
| 18 to 34 Years | 76 (1.7%) | 48 (1.0%) |
| 35 to 64 Years | 152 (1.6%) | 130 (1.3%) |
| 65 to 74 Years | 179 (10.5%) | 211 (11.0%) |
| 75 Years and over | 138 (13.8%) | 497 (29.4%) |
Disability Class: Self-Care Difficulty
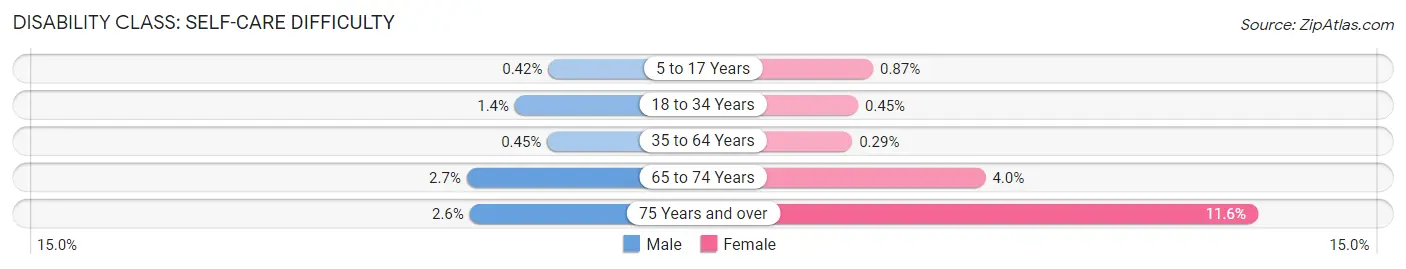
| Age Bracket | Male | Female |
| 5 to 17 Years | 21 (0.4%) | 37 (0.9%) |
| 18 to 34 Years | 62 (1.3%) | 21 (0.4%) |
| 35 to 64 Years | 44 (0.4%) | 29 (0.3%) |
| 65 to 74 Years | 46 (2.7%) | 77 (4.0%) |
| 75 Years and over | 26 (2.6%) | 196 (11.6%) |
Technology Access in Rockwall
Computing Device Access in Rockwall
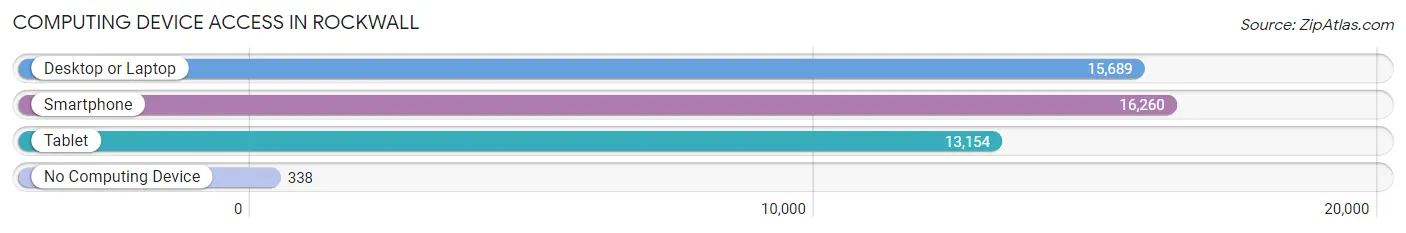
| Device Type | # Households | % Households |
| Desktop or Laptop | 15,689 | 91.8% |
| Smartphone | 16,260 | 95.1% |
| Tablet | 13,154 | 77.0% |
| No Computing Device | 338 | 2.0% |
| Total | 17,092 | 100.0% |
Internet Access in Rockwall
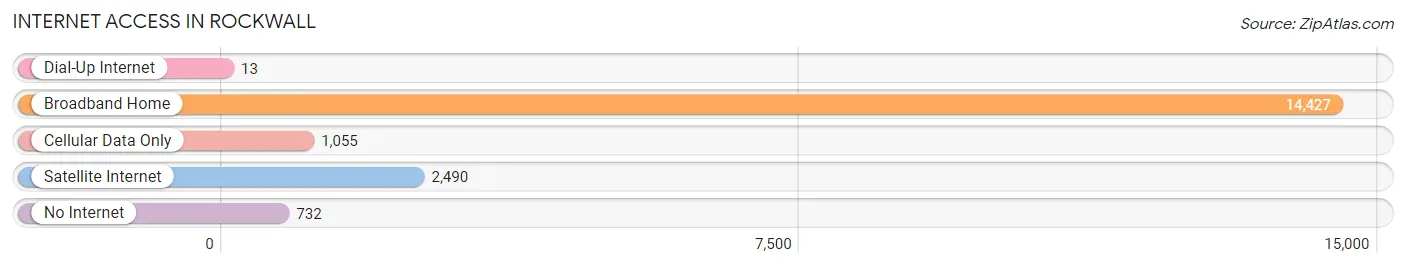
| Internet Type | # Households | % Households |
| Dial-Up Internet | 13 | 0.1% |
| Broadband Home | 14,427 | 84.4% |
| Cellular Data Only | 1,055 | 6.2% |
| Satellite Internet | 2,490 | 14.6% |
| No Internet | 732 | 4.3% |
| Total | 17,092 | 100.0% |
Rockwall Summary
Rockwall, Texas is a city located in the northeastern part of the state, in Rockwall County. It is part of the Dallas-Fort Worth-Arlington metropolitan area and is located about 25 miles east of Dallas. The city has a population of approximately 40,000 people and is the county seat of Rockwall County.
History
The area that is now Rockwall was first settled in the 1840s by a group of settlers from Kentucky. The settlers named the area after a natural rock wall that was located in the area. The wall was created by a large earthquake that occurred in the area in 1852. The town was officially founded in 1854 and was named Rockwall.
In 1873, the Texas and Pacific Railway was built through the area, connecting Rockwall to Dallas and other cities in the region. This allowed for the growth of the city and the development of the local economy.
In the early 1900s, Rockwall was a thriving agricultural community. Cotton, corn, and other crops were grown in the area and the town was home to several cotton gins. The town also had a number of businesses, including a bank, a hotel, and a newspaper.
In the 1950s, Rockwall began to experience a population boom as people moved to the area from other parts of the state. This growth continued into the 1960s and 1970s, and the city was officially incorporated in 1969.
Geography
Rockwall is located in the northeastern part of Texas, in Rockwall County. It is part of the Dallas-Fort Worth-Arlington metropolitan area and is located about 25 miles east of Dallas. The city has a total area of 22.3 square miles, of which 22.2 square miles is land and 0.1 square miles is water.
The city is located on the shores of Lake Ray Hubbard, a large reservoir created by the damming of the East Fork of the Trinity River. The lake is a popular destination for fishing, boating, and other recreational activities.
Economy
The economy of Rockwall is largely based on the service industry. The city is home to a number of retail stores, restaurants, and other businesses. The city is also home to a number of manufacturing companies, including a large paper mill.
The city is also home to a number of corporate headquarters, including the headquarters of the Rockwall Independent School District.
Demographics
As of the 2010 census, the population of Rockwall was 37,490. The racial makeup of the city was 79.3% White, 8.2% African American, 0.5% Native American, 2.2% Asian, 0.1% Pacific Islander, 6.7% from other races, and 2.9% from two or more races. Hispanic or Latino of any race were 15.3% of the population.
The median household income in Rockwall was $63,945, and the median family income was $76,945. The per capita income for the city was $30,945. About 8.2% of families and 10.3% of the population were below the poverty line, including 14.2% of those under age 18 and 6.2% of those age 65 or over.
Common Questions
What is Per Capita Income in Rockwall?
Per Capita income in Rockwall is $50,916.
What is the Median Family Income in Rockwall?
Median Family Income in Rockwall is $129,992.
What is the Median Household income in Rockwall?
Median Household Income in Rockwall is $114,799.
What is Income or Wage Gap in Rockwall?
Income or Wage Gap in Rockwall is 33.8%.
Women in Rockwall earn 66.2 cents for every dollar earned by a man.
What is Inequality or Gini Index in Rockwall?
Inequality or Gini Index in Rockwall is 0.40.
What is the Total Population of Rockwall?
Total Population of Rockwall is 47,859.
What is the Total Male Population of Rockwall?
Total Male Population of Rockwall is 23,597.
What is the Total Female Population of Rockwall?
Total Female Population of Rockwall is 24,262.
What is the Ratio of Males per 100 Females in Rockwall?
There are 97.26 Males per 100 Females in Rockwall.
What is the Ratio of Females per 100 Males in Rockwall?
There are 102.82 Females per 100 Males in Rockwall.
What is the Median Population Age in Rockwall?
Median Population Age in Rockwall is 38.6 Years.
What is the Average Family Size in Rockwall
Average Family Size in Rockwall is 3.1 People.
What is the Average Household Size in Rockwall
Average Household Size in Rockwall is 2.8 People.
How Large is the Labor Force in Rockwall?
There are 26,477 People in the Labor Forcein in Rockwall.
What is the Percentage of People in the Labor Force in Rockwall?
70.6% of People are in the Labor Force in Rockwall.
What is the Unemployment Rate in Rockwall?
Unemployment Rate in Rockwall is 3.1%.