Asbury Park, NJ Map & Demographics
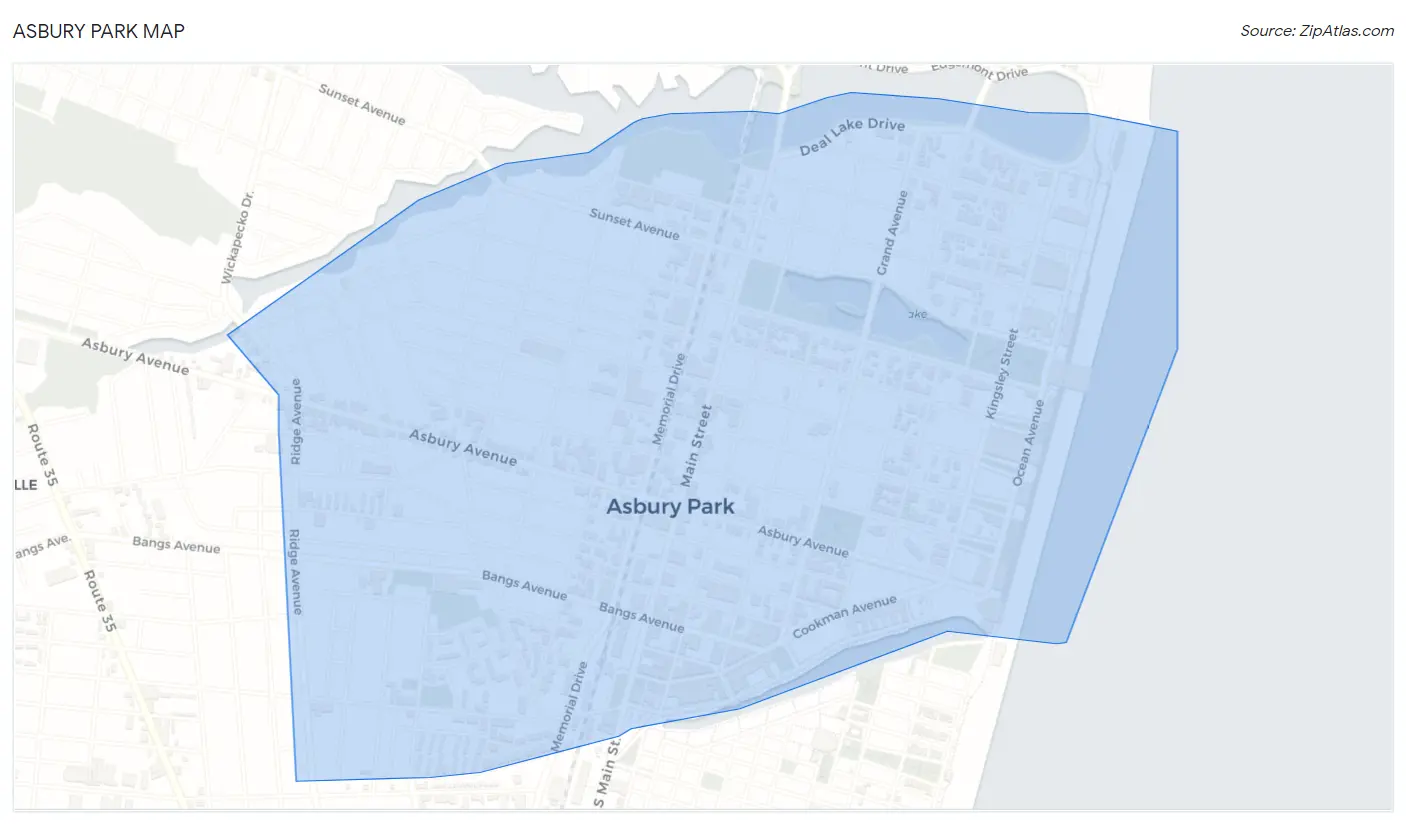
Asbury Park Map
Asbury Park Overview
$53,385
PER CAPITA INCOME
$85,755
AVG FAMILY INCOME
$63,461
AVG HOUSEHOLD INCOME
44.8%
WAGE / INCOME GAP [ % ]
55.2¢/ $1
WAGE / INCOME GAP [ $ ]
$10,888
FAMILY INCOME DEFICIT
0.57
INEQUALITY / GINI INDEX
15,245
TOTAL POPULATION
7,294
MALE POPULATION
7,951
FEMALE POPULATION
91.74
MALES / 100 FEMALES
109.01
FEMALES / 100 MALES
37.9
MEDIAN AGE
3.0
AVG FAMILY SIZE
2.0
AVG HOUSEHOLD SIZE
9,510
LABOR FORCE [ PEOPLE ]
72.1%
PERCENT IN LABOR FORCE
8.3%
UNEMPLOYMENT RATE
Asbury Park Zip Codes
Income in Asbury Park
Income Overview in Asbury Park
Per Capita Income in Asbury Park is $53,385, while median incomes of families and households are $85,755 and $63,461 respectively.
| Characteristic | Number | Measure |
| Per Capita Income | 15,245 | $53,385 |
| Median Family Income | 3,017 | $85,755 |
| Mean Family Income | 3,017 | $134,257 |
| Median Household Income | 7,477 | $63,461 |
| Mean Household Income | 7,477 | $107,984 |
| Income Deficit | 3,017 | $10,888 |
| Wage / Income Gap (%) | 15,245 | 44.84% |
| Wage / Income Gap ($) | 15,245 | 55.16¢ per $1 |
| Gini / Inequality Index | 15,245 | 0.57 |
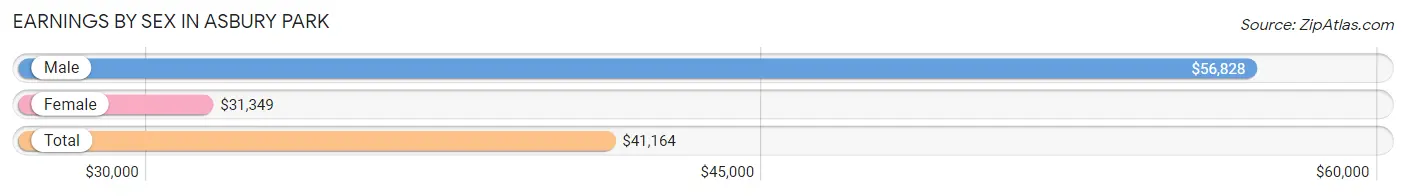
Earnings by Sex in Asbury Park
Average Earnings in Asbury Park are $41,164, $56,828 for men and $31,349 for women, a difference of 44.8%.
| Sex | Number | Average Earnings |
| Male | 4,880 (51.4%) | $56,828 |
| Female | 4,620 (48.6%) | $31,349 |
| Total | 9,500 (100.0%) | $41,164 |
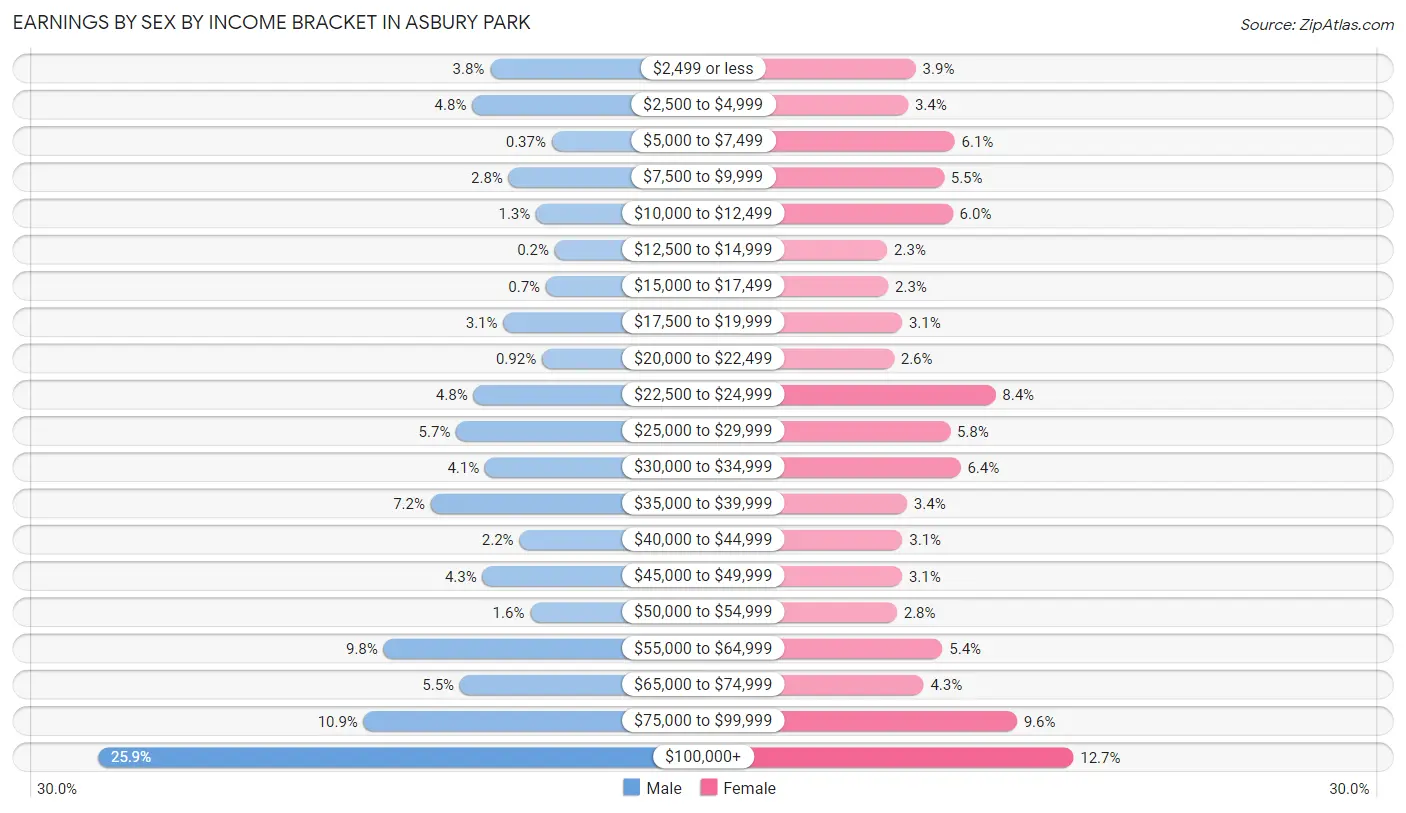
Earnings by Sex by Income Bracket in Asbury Park
The most common earnings brackets in Asbury Park are $100,000+ for men (1,263 | 25.9%) and $100,000+ for women (588 | 12.7%).
| Income | Male | Female |
| $2,499 or less | 187 (3.8%) | 179 (3.9%) |
| $2,500 to $4,999 | 236 (4.8%) | 159 (3.4%) |
| $5,000 to $7,499 | 18 (0.4%) | 280 (6.1%) |
| $7,500 to $9,999 | 136 (2.8%) | 252 (5.4%) |
| $10,000 to $12,499 | 61 (1.3%) | 275 (5.9%) |
| $12,500 to $14,999 | 10 (0.2%) | 105 (2.3%) |
| $15,000 to $17,499 | 34 (0.7%) | 107 (2.3%) |
| $17,500 to $19,999 | 151 (3.1%) | 143 (3.1%) |
| $20,000 to $22,499 | 45 (0.9%) | 122 (2.6%) |
| $22,500 to $24,999 | 233 (4.8%) | 386 (8.4%) |
| $25,000 to $29,999 | 280 (5.7%) | 268 (5.8%) |
| $30,000 to $34,999 | 201 (4.1%) | 295 (6.4%) |
| $35,000 to $39,999 | 350 (7.2%) | 156 (3.4%) |
| $40,000 to $44,999 | 107 (2.2%) | 144 (3.1%) |
| $45,000 to $49,999 | 208 (4.3%) | 143 (3.1%) |
| $50,000 to $54,999 | 77 (1.6%) | 130 (2.8%) |
| $55,000 to $64,999 | 479 (9.8%) | 248 (5.4%) |
| $65,000 to $74,999 | 270 (5.5%) | 199 (4.3%) |
| $75,000 to $99,999 | 534 (10.9%) | 441 (9.6%) |
| $100,000+ | 1,263 (25.9%) | 588 (12.7%) |
| Total | 4,880 (100.0%) | 4,620 (100.0%) |
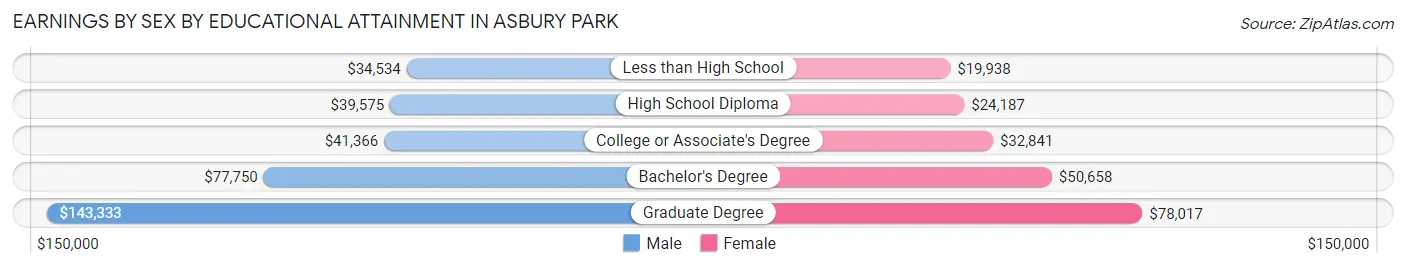
Earnings by Sex by Educational Attainment in Asbury Park
Average earnings in Asbury Park are $62,404 for men and $34,383 for women, a difference of 44.9%. Men with an educational attainment of graduate degree enjoy the highest average annual earnings of $143,333, while those with less than high school education earn the least with $34,534. Women with an educational attainment of graduate degree earn the most with the average annual earnings of $78,017, while those with less than high school education have the smallest earnings of $19,938.
| Educational Attainment | Male Income | Female Income |
| Less than High School | $34,534 | $19,938 |
| High School Diploma | $39,575 | $24,187 |
| College or Associate's Degree | $41,366 | $32,841 |
| Bachelor's Degree | $77,750 | $50,658 |
| Graduate Degree | $143,333 | $78,017 |
| Total | $62,404 | $34,383 |
Family Income in Asbury Park
Family Income Brackets in Asbury Park
According to the Asbury Park family income data, there are 582 families falling into the $100,000 to $149,999 income range, which is the most common income bracket and makes up 19.3% of all families. Conversely, the $10,000 to $14,999 income bracket is the least frequent group with only 30 families (1.0%) belonging to this category.
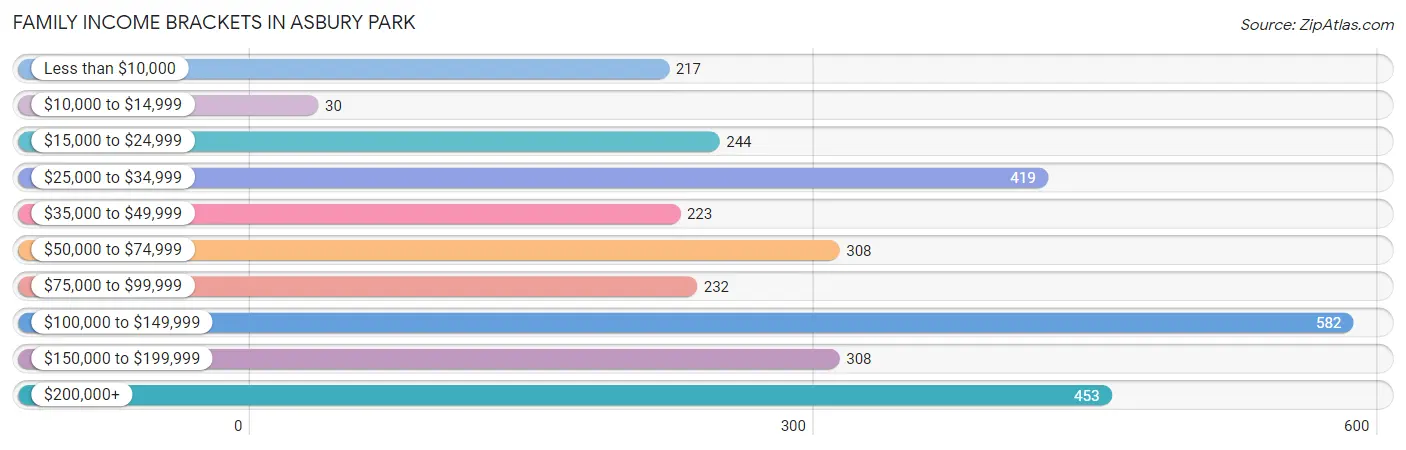
| Income Bracket | # Families | % Families |
| Less than $10,000 | 217 | 7.2% |
| $10,000 to $14,999 | 30 | 1.0% |
| $15,000 to $24,999 | 244 | 8.1% |
| $25,000 to $34,999 | 419 | 13.9% |
| $35,000 to $49,999 | 223 | 7.4% |
| $50,000 to $74,999 | 308 | 10.2% |
| $75,000 to $99,999 | 232 | 7.7% |
| $100,000 to $149,999 | 582 | 19.3% |
| $150,000 to $199,999 | 308 | 10.2% |
| $200,000+ | 453 | 15.0% |
Family Income by Famaliy Size in Asbury Park
7+ person families (40 | 1.3%) account for the highest median family income in Asbury Park with $190,227 per family, while 2-person families (1,706 | 56.6%) have the highest median income of $32,024 per family member.
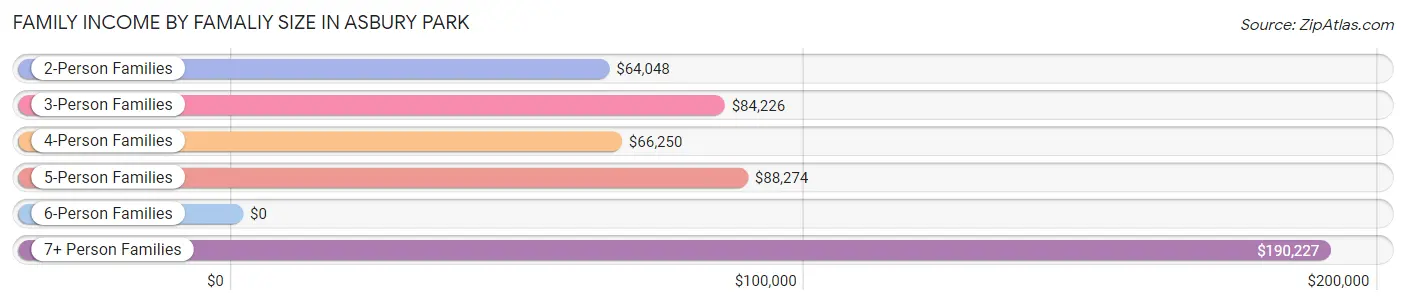
| Income Bracket | # Families | Median Income |
| 2-Person Families | 1,706 (56.6%) | $64,048 |
| 3-Person Families | 593 (19.7%) | $84,226 |
| 4-Person Families | 332 (11.0%) | $66,250 |
| 5-Person Families | 263 (8.7%) | $88,274 |
| 6-Person Families | 83 (2.8%) | $0 |
| 7+ Person Families | 40 (1.3%) | $190,227 |
| Total | 3,017 (100.0%) | $85,755 |
Family Income by Number of Earners in Asbury Park
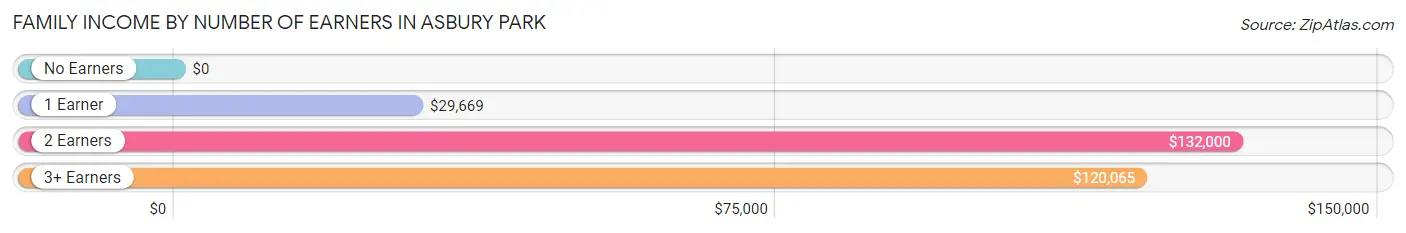
| Number of Earners | # Families | Median Income |
| No Earners | 319 (10.6%) | $0 |
| 1 Earner | 1,040 (34.5%) | $29,669 |
| 2 Earners | 1,182 (39.2%) | $132,000 |
| 3+ Earners | 476 (15.8%) | $120,065 |
| Total | 3,017 (100.0%) | $85,755 |
Household Income in Asbury Park
Household Income Brackets in Asbury Park
With 1,084 households falling in the category, the $100,000 to $149,999 income range is the most frequent in Asbury Park, accounting for 14.5% of all households. In contrast, only 336 households (4.5%) fall into the $10,000 to $14,999 income bracket, making it the least populous group.
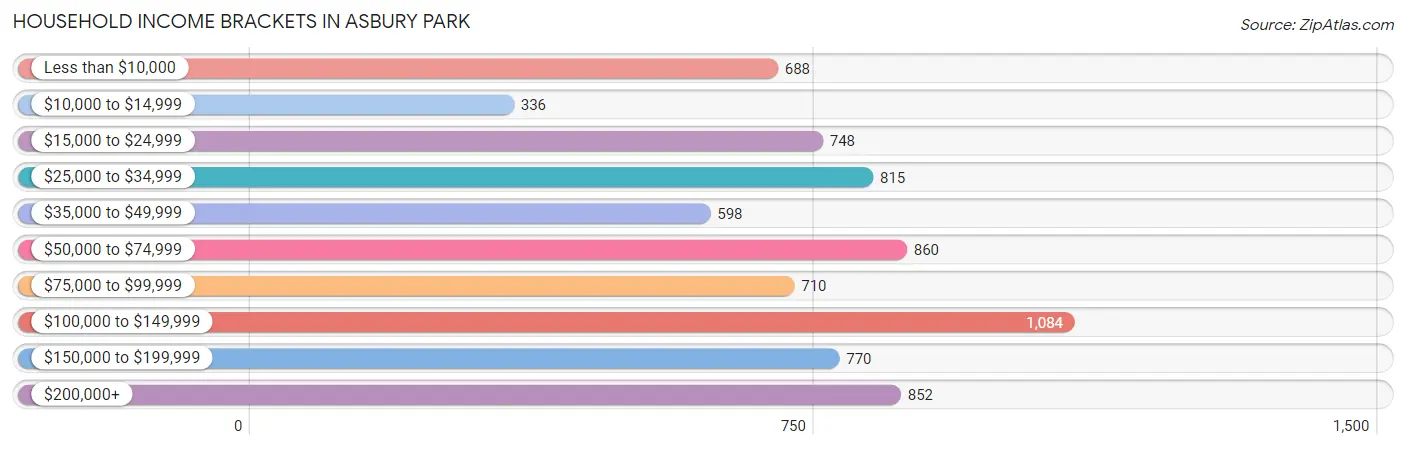
| Income Bracket | # Households | % Households |
| Less than $10,000 | 688 | 9.2% |
| $10,000 to $14,999 | 336 | 4.5% |
| $15,000 to $24,999 | 748 | 10.0% |
| $25,000 to $34,999 | 815 | 10.9% |
| $35,000 to $49,999 | 598 | 8.0% |
| $50,000 to $74,999 | 860 | 11.5% |
| $75,000 to $99,999 | 710 | 9.5% |
| $100,000 to $149,999 | 1,084 | 14.5% |
| $150,000 to $199,999 | 770 | 10.3% |
| $200,000+ | 852 | 11.4% |
Household Income by Householder Age in Asbury Park
The median household income in Asbury Park is $63,461, with the highest median household income of $83,597 found in the 15 to 24 years age bracket for the primary householder. A total of 175 households (2.3%) fall into this category. Meanwhile, the 65+ years age bracket for the primary householder has the lowest median household income of $33,006, with 1,445 households (19.3%) in this group.
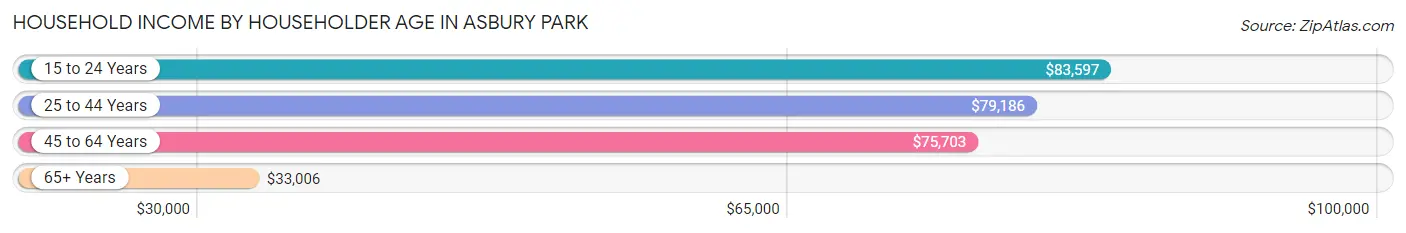
| Income Bracket | # Households | Median Income |
| 15 to 24 Years | 175 (2.3%) | $83,597 |
| 25 to 44 Years | 3,086 (41.3%) | $79,186 |
| 45 to 64 Years | 2,771 (37.1%) | $75,703 |
| 65+ Years | 1,445 (19.3%) | $33,006 |
| Total | 7,477 (100.0%) | $63,461 |
Poverty in Asbury Park
Income Below Poverty by Sex and Age in Asbury Park
With 15.0% poverty level for males and 24.0% for females among the residents of Asbury Park, 5 year old males and 5 year old females are the most vulnerable to poverty, with 55 males (100.0%) and 21 females (60.0%) in their respective age groups living below the poverty level.
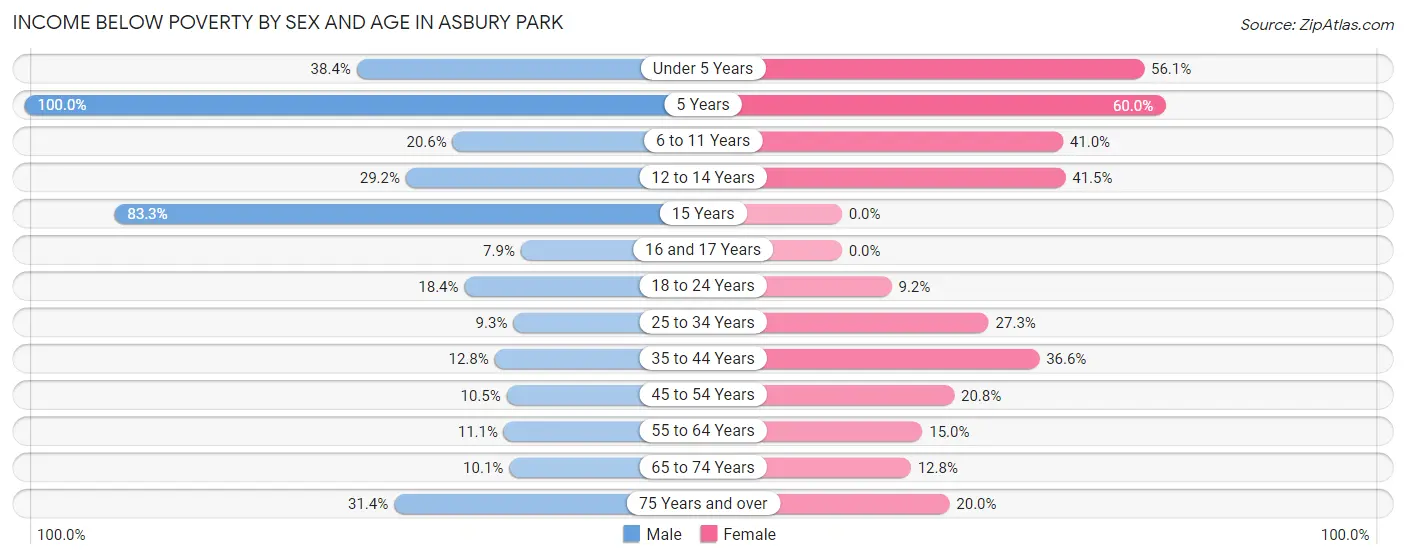
| Age Bracket | Male | Female |
| Under 5 Years | 99 (38.4%) | 138 (56.1%) |
| 5 Years | 55 (100.0%) | 21 (60.0%) |
| 6 to 11 Years | 80 (20.6%) | 190 (41.0%) |
| 12 to 14 Years | 69 (29.2%) | 73 (41.5%) |
| 15 Years | 55 (83.3%) | 0 (0.0%) |
| 16 and 17 Years | 14 (7.9%) | 0 (0.0%) |
| 18 to 24 Years | 107 (18.4%) | 65 (9.2%) |
| 25 to 34 Years | 171 (9.3%) | 389 (27.3%) |
| 35 to 44 Years | 140 (12.8%) | 410 (36.6%) |
| 45 to 54 Years | 94 (10.5%) | 232 (20.8%) |
| 55 to 64 Years | 118 (11.1%) | 177 (14.9%) |
| 65 to 74 Years | 50 (10.1%) | 86 (12.8%) |
| 75 Years and over | 44 (31.4%) | 122 (20.0%) |
| Total | 1,096 (15.0%) | 1,903 (24.0%) |
Income Above Poverty by Sex and Age in Asbury Park
According to the poverty statistics in Asbury Park, males aged 16 and 17 years and females aged 15 years are the age groups that are most secure financially, with 92.1% of males and 100.0% of females in these age groups living above the poverty line.
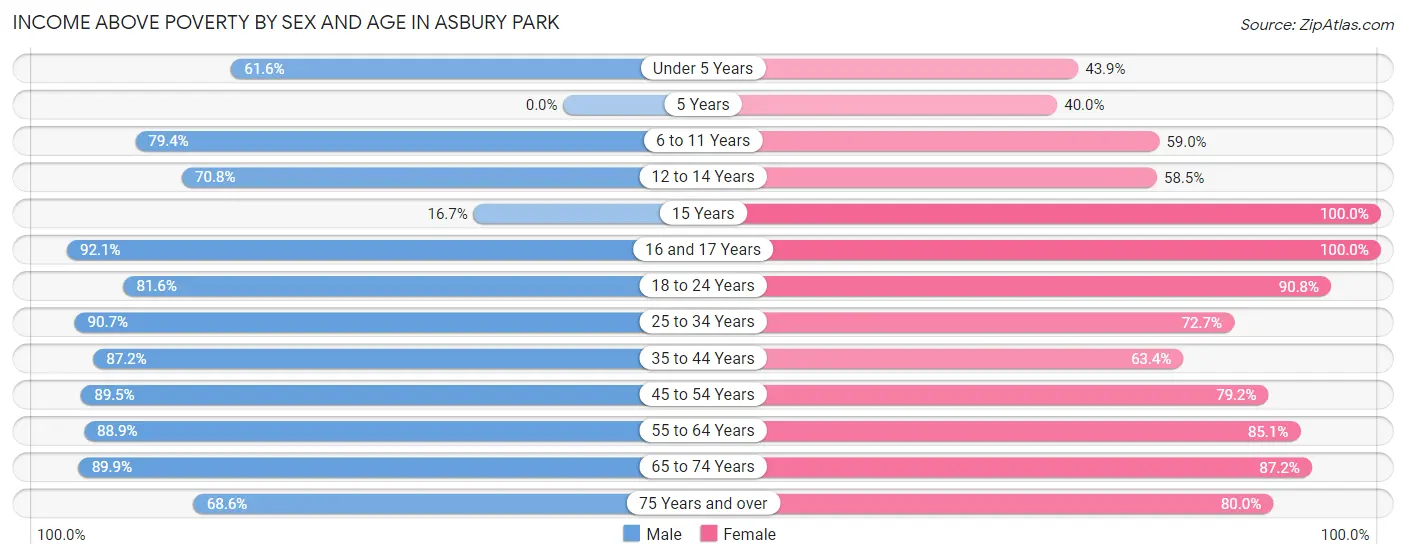
| Age Bracket | Male | Female |
| Under 5 Years | 159 (61.6%) | 108 (43.9%) |
| 5 Years | 0 (0.0%) | 14 (40.0%) |
| 6 to 11 Years | 309 (79.4%) | 273 (59.0%) |
| 12 to 14 Years | 167 (70.8%) | 103 (58.5%) |
| 15 Years | 11 (16.7%) | 115 (100.0%) |
| 16 and 17 Years | 163 (92.1%) | 70 (100.0%) |
| 18 to 24 Years | 475 (81.6%) | 639 (90.8%) |
| 25 to 34 Years | 1,668 (90.7%) | 1,038 (72.7%) |
| 35 to 44 Years | 956 (87.2%) | 709 (63.4%) |
| 45 to 54 Years | 798 (89.5%) | 881 (79.2%) |
| 55 to 64 Years | 949 (88.9%) | 1,007 (85.1%) |
| 65 to 74 Years | 447 (89.9%) | 586 (87.2%) |
| 75 Years and over | 96 (68.6%) | 489 (80.0%) |
| Total | 6,198 (85.0%) | 6,032 (76.0%) |
Income Below Poverty Among Married-Couple Families in Asbury Park
The poverty statistics for married-couple families in Asbury Park show that 3.5% or 49 of the total 1,404 families live below the poverty line. Families with 3 or 4 children have the highest poverty rate of 39.5%, comprising of 15 families. On the other hand, families with no children have the lowest poverty rate of 1.0%, which includes 10 families.
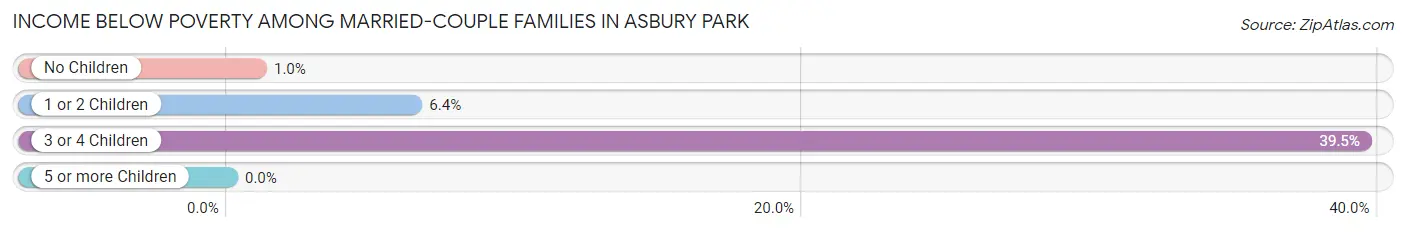
| Children | Above Poverty | Below Poverty |
| No Children | 982 (99.0%) | 10 (1.0%) |
| 1 or 2 Children | 350 (93.6%) | 24 (6.4%) |
| 3 or 4 Children | 23 (60.5%) | 15 (39.5%) |
| 5 or more Children | 0 (0.0%) | 0 (0.0%) |
| Total | 1,355 (96.5%) | 49 (3.5%) |
Income Below Poverty Among Single-Parent Households in Asbury Park
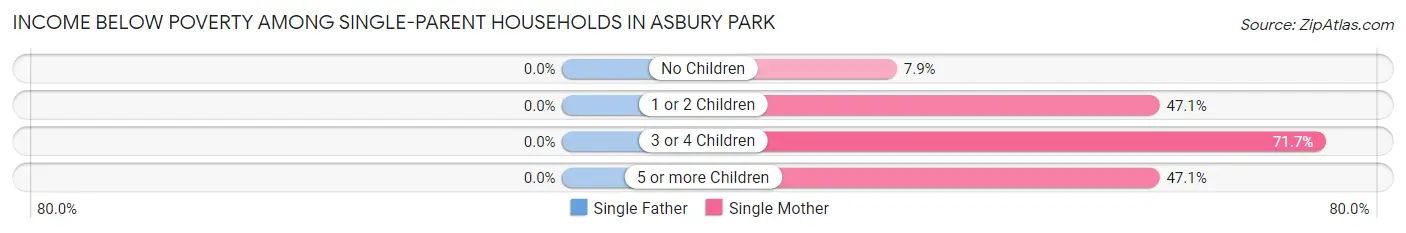
| Children | Single Father | Single Mother |
| No Children | 0 (0.0%) | 53 (7.9%) |
| 1 or 2 Children | 0 (0.0%) | 265 (47.1%) |
| 3 or 4 Children | 0 (0.0%) | 99 (71.7%) |
| 5 or more Children | 0 (0.0%) | 8 (47.1%) |
| Total | 0 (0.0%) | 425 (30.6%) |
Income Below Poverty Among Married-Couple vs Single-Parent Households in Asbury Park
The poverty data for Asbury Park shows that 49 of the married-couple family households (3.5%) and 425 of the single-parent households (26.4%) are living below the poverty level. Within the married-couple family households, those with 3 or 4 children have the highest poverty rate, with 15 households (39.5%) falling below the poverty line. Among the single-parent households, those with 3 or 4 children have the highest poverty rate, with 99 household (71.7%) living below poverty.
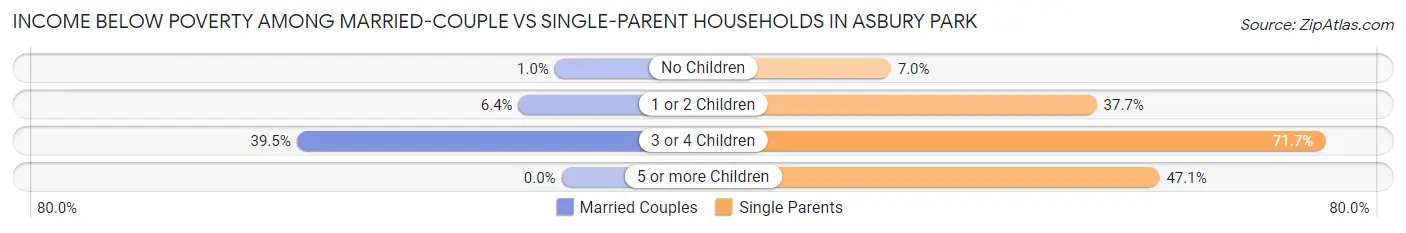
| Children | Married-Couple Families | Single-Parent Households |
| No Children | 10 (1.0%) | 53 (7.0%) |
| 1 or 2 Children | 24 (6.4%) | 265 (37.7%) |
| 3 or 4 Children | 15 (39.5%) | 99 (71.7%) |
| 5 or more Children | 0 (0.0%) | 8 (47.1%) |
| Total | 49 (3.5%) | 425 (26.4%) |
Race in Asbury Park
The most populous races in Asbury Park are White / Caucasian (6,737 | 44.2%), Black / African American (5,462 | 35.8%), and Hispanic or Latino (3,140 | 20.6%).
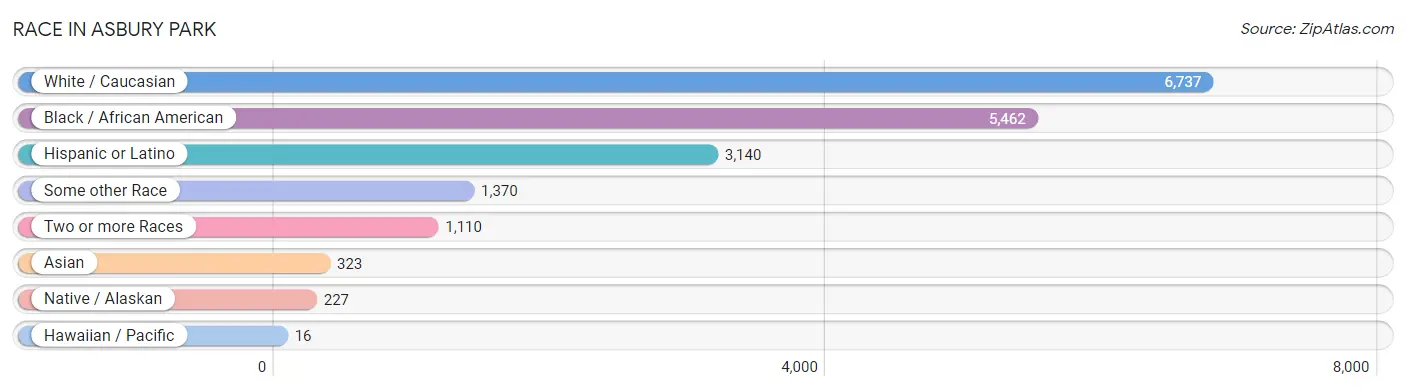
| Race | # Population | % Population |
| Asian | 323 | 2.1% |
| Black / African American | 5,462 | 35.8% |
| Hawaiian / Pacific | 16 | 0.1% |
| Hispanic or Latino | 3,140 | 20.6% |
| Native / Alaskan | 227 | 1.5% |
| White / Caucasian | 6,737 | 44.2% |
| Two or more Races | 1,110 | 7.3% |
| Some other Race | 1,370 | 9.0% |
| Total | 15,245 | 100.0% |
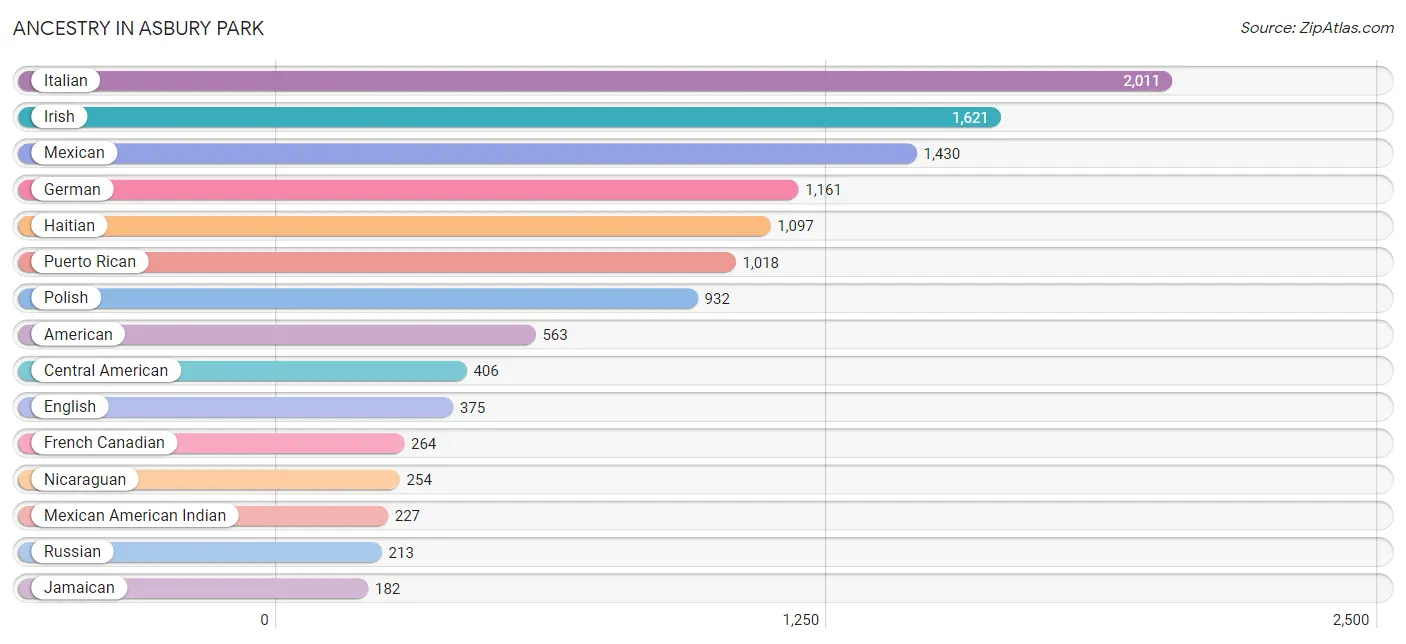
Ancestry in Asbury Park
The most populous ancestries reported in Asbury Park are Italian (2,011 | 13.2%), Irish (1,621 | 10.6%), Mexican (1,430 | 9.4%), German (1,161 | 7.6%), and Haitian (1,097 | 7.2%), together accounting for 48.0% of all Asbury Park residents.
| Ancestry | # Population | % Population |
| African | 171 | 1.1% |
| Albanian | 11 | 0.1% |
| American | 563 | 3.7% |
| Arab | 55 | 0.4% |
| Argentinean | 24 | 0.2% |
| Austrian | 13 | 0.1% |
| Barbadian | 80 | 0.5% |
| Bhutanese | 20 | 0.1% |
| Blackfeet | 2 | 0.0% |
| Brazilian | 25 | 0.2% |
| British | 65 | 0.4% |
| British West Indian | 91 | 0.6% |
| Burmese | 106 | 0.7% |
| Canadian | 20 | 0.1% |
| Central American | 406 | 2.7% |
| Central American Indian | 14 | 0.1% |
| Cherokee | 58 | 0.4% |
| Cheyenne | 8 | 0.1% |
| Chilean | 12 | 0.1% |
| Colombian | 12 | 0.1% |
| Costa Rican | 16 | 0.1% |
| Croatian | 33 | 0.2% |
| Cuban | 9 | 0.1% |
| Czech | 119 | 0.8% |
| Dominican | 10 | 0.1% |
| Dutch | 71 | 0.5% |
| Eastern European | 78 | 0.5% |
| English | 375 | 2.5% |
| European | 34 | 0.2% |
| French | 179 | 1.2% |
| French Canadian | 264 | 1.7% |
| German | 1,161 | 7.6% |
| Greek | 22 | 0.1% |
| Guatemalan | 111 | 0.7% |
| Guyanese | 11 | 0.1% |
| Haitian | 1,097 | 7.2% |
| Hungarian | 59 | 0.4% |
| Indian (Asian) | 42 | 0.3% |
| Iranian | 71 | 0.5% |
| Irish | 1,621 | 10.6% |
| Italian | 2,011 | 13.2% |
| Jamaican | 182 | 1.2% |
| Korean | 45 | 0.3% |
| Lebanese | 17 | 0.1% |
| Lithuanian | 11 | 0.1% |
| Mexican | 1,430 | 9.4% |
| Mexican American Indian | 227 | 1.5% |
| Native Hawaiian | 4 | 0.0% |
| Nicaraguan | 254 | 1.7% |
| Northern European | 11 | 0.1% |
| Norwegian | 47 | 0.3% |
| Pakistani | 8 | 0.1% |
| Panamanian | 25 | 0.2% |
| Peruvian | 29 | 0.2% |
| Polish | 932 | 6.1% |
| Portuguese | 86 | 0.6% |
| Puerto Rican | 1,018 | 6.7% |
| Romanian | 23 | 0.2% |
| Russian | 213 | 1.4% |
| Samoan | 16 | 0.1% |
| Scotch-Irish | 90 | 0.6% |
| Scottish | 92 | 0.6% |
| Slavic | 27 | 0.2% |
| Slovak | 53 | 0.4% |
| Slovene | 58 | 0.4% |
| South American | 90 | 0.6% |
| Spaniard | 11 | 0.1% |
| Subsaharan African | 171 | 1.1% |
| Swedish | 85 | 0.6% |
| Swiss | 12 | 0.1% |
| Syrian | 20 | 0.1% |
| Thai | 83 | 0.5% |
| Ukrainian | 179 | 1.2% |
| Uruguayan | 13 | 0.1% |
| Welsh | 31 | 0.2% |
| West Indian | 32 | 0.2% |
| Yugoslavian | 49 | 0.3% | View All 77 Rows |
Immigrants in Asbury Park
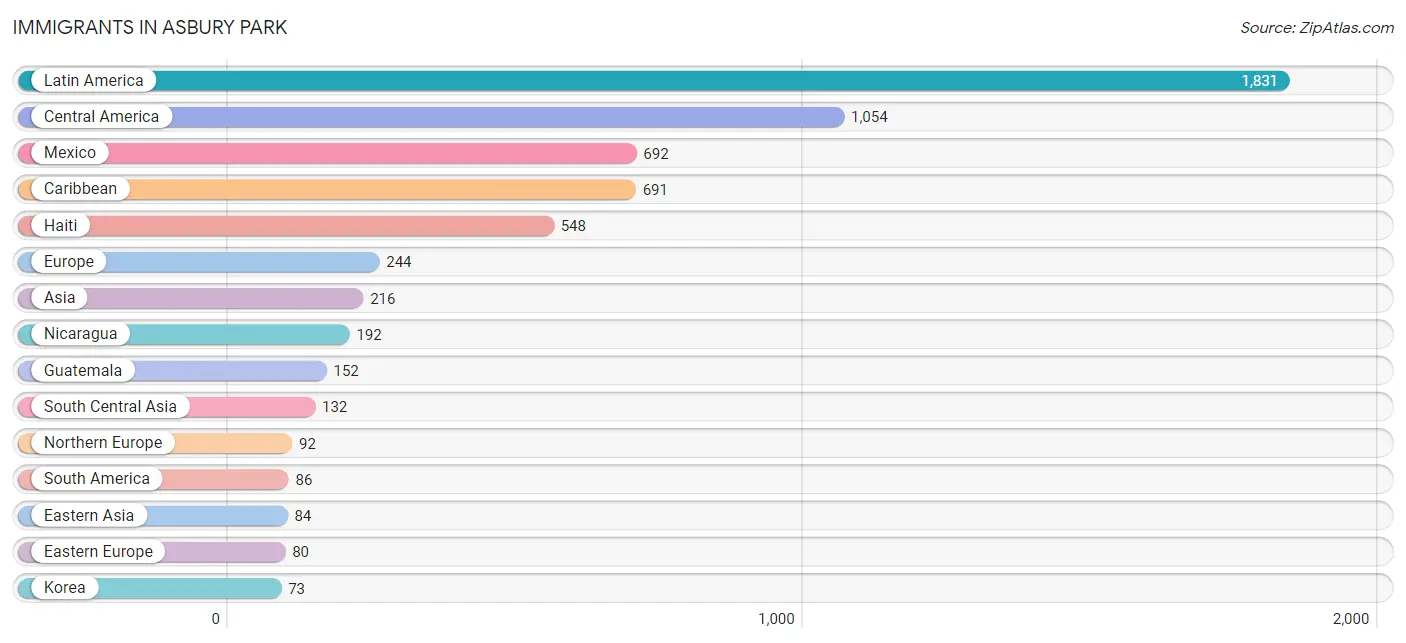
The most numerous immigrant groups reported in Asbury Park came from Latin America (1,831 | 12.0%), Central America (1,054 | 6.9%), Mexico (692 | 4.5%), Caribbean (691 | 4.5%), and Haiti (548 | 3.6%), together accounting for 31.6% of all Asbury Park residents.
| Immigration Origin | # Population | % Population |
| Africa | 10 | 0.1% |
| Asia | 216 | 1.4% |
| Barbados | 36 | 0.2% |
| Brazil | 39 | 0.3% |
| Canada | 33 | 0.2% |
| Caribbean | 691 | 4.5% |
| Central America | 1,054 | 6.9% |
| Chile | 12 | 0.1% |
| China | 11 | 0.1% |
| Colombia | 2 | 0.0% |
| Costa Rica | 6 | 0.0% |
| Eastern Africa | 10 | 0.1% |
| Eastern Asia | 84 | 0.5% |
| Eastern Europe | 80 | 0.5% |
| England | 13 | 0.1% |
| Europe | 244 | 1.6% |
| Germany | 61 | 0.4% |
| Grenada | 47 | 0.3% |
| Guatemala | 152 | 1.0% |
| Guyana | 7 | 0.1% |
| Haiti | 548 | 3.6% |
| India | 61 | 0.4% |
| Iran | 71 | 0.5% |
| Ireland | 10 | 0.1% |
| Jamaica | 60 | 0.4% |
| Korea | 73 | 0.5% |
| Latin America | 1,831 | 12.0% |
| Mexico | 692 | 4.5% |
| Nicaragua | 192 | 1.3% |
| Northern Europe | 92 | 0.6% |
| Panama | 12 | 0.1% |
| Peru | 13 | 0.1% |
| Romania | 13 | 0.1% |
| Russia | 47 | 0.3% |
| South America | 86 | 0.6% |
| South Central Asia | 132 | 0.9% |
| Southern Europe | 11 | 0.1% |
| Spain | 11 | 0.1% |
| Sweden | 10 | 0.1% |
| Ukraine | 20 | 0.1% |
| Uruguay | 13 | 0.1% |
| Western Europe | 61 | 0.4% | View All 42 Rows |
Sex and Age in Asbury Park
Sex and Age in Asbury Park
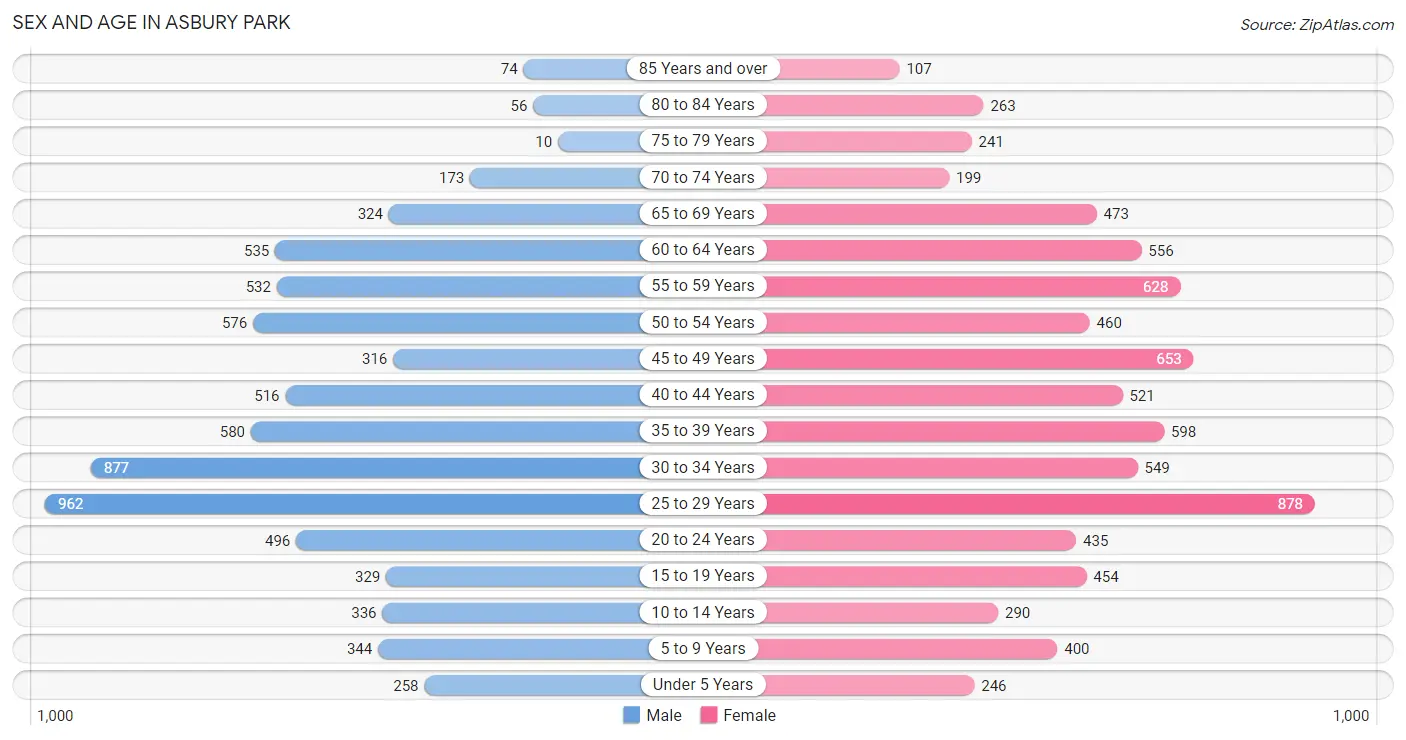
The most populous age groups in Asbury Park are 25 to 29 Years (962 | 13.2%) for men and 25 to 29 Years (878 | 11.0%) for women.
| Age Bracket | Male | Female |
| Under 5 Years | 258 (3.5%) | 246 (3.1%) |
| 5 to 9 Years | 344 (4.7%) | 400 (5.0%) |
| 10 to 14 Years | 336 (4.6%) | 290 (3.6%) |
| 15 to 19 Years | 329 (4.5%) | 454 (5.7%) |
| 20 to 24 Years | 496 (6.8%) | 435 (5.5%) |
| 25 to 29 Years | 962 (13.2%) | 878 (11.0%) |
| 30 to 34 Years | 877 (12.0%) | 549 (6.9%) |
| 35 to 39 Years | 580 (8.0%) | 598 (7.5%) |
| 40 to 44 Years | 516 (7.1%) | 521 (6.6%) |
| 45 to 49 Years | 316 (4.3%) | 653 (8.2%) |
| 50 to 54 Years | 576 (7.9%) | 460 (5.8%) |
| 55 to 59 Years | 532 (7.3%) | 628 (7.9%) |
| 60 to 64 Years | 535 (7.3%) | 556 (7.0%) |
| 65 to 69 Years | 324 (4.4%) | 473 (5.9%) |
| 70 to 74 Years | 173 (2.4%) | 199 (2.5%) |
| 75 to 79 Years | 10 (0.1%) | 241 (3.0%) |
| 80 to 84 Years | 56 (0.8%) | 263 (3.3%) |
| 85 Years and over | 74 (1.0%) | 107 (1.3%) |
| Total | 7,294 (100.0%) | 7,951 (100.0%) |
Families and Households in Asbury Park
Median Family Size in Asbury Park
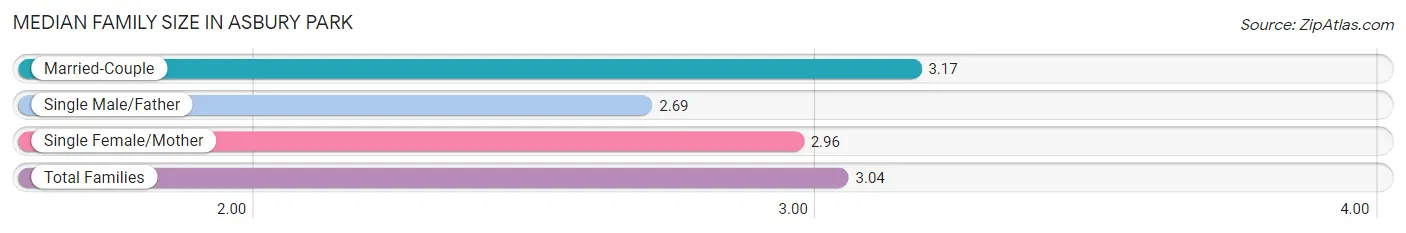
The median family size in Asbury Park is 3.04 persons per family, with married-couple families (1,404 | 46.5%) accounting for the largest median family size of 3.17 persons per family. On the other hand, single male/father families (226 | 7.5%) represent the smallest median family size with 2.69 persons per family.
| Family Type | # Families | Family Size |
| Married-Couple | 1,404 (46.5%) | 3.17 |
| Single Male/Father | 226 (7.5%) | 2.69 |
| Single Female/Mother | 1,387 (46.0%) | 2.96 |
| Total Families | 3,017 (100.0%) | 3.04 |
Median Household Size in Asbury Park
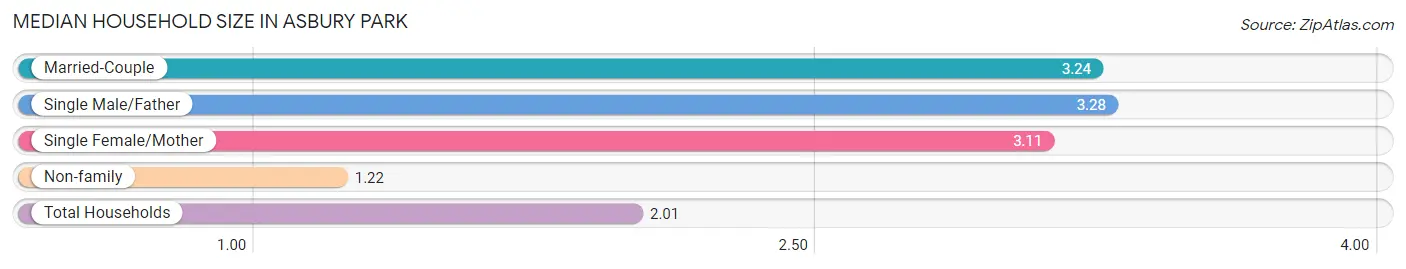
The median household size in Asbury Park is 2.01 persons per household, with single male/father households (226 | 3.0%) accounting for the largest median household size of 3.28 persons per household. non-family households (4,460 | 59.7%) represent the smallest median household size with 1.22 persons per household.
| Household Type | # Households | Household Size |
| Married-Couple | 1,404 (18.8%) | 3.24 |
| Single Male/Father | 226 (3.0%) | 3.28 |
| Single Female/Mother | 1,387 (18.5%) | 3.11 |
| Non-family | 4,460 (59.7%) | 1.22 |
| Total Households | 7,477 (100.0%) | 2.01 |
Household Size by Marriage Status in Asbury Park
Out of a total of 7,477 households in Asbury Park, 3,017 (40.4%) are family households, while 4,460 (59.7%) are nonfamily households. The most numerous type of family households are 2-person households, comprising 1,561, and the most common type of nonfamily households are 1-person households, comprising 3,542.
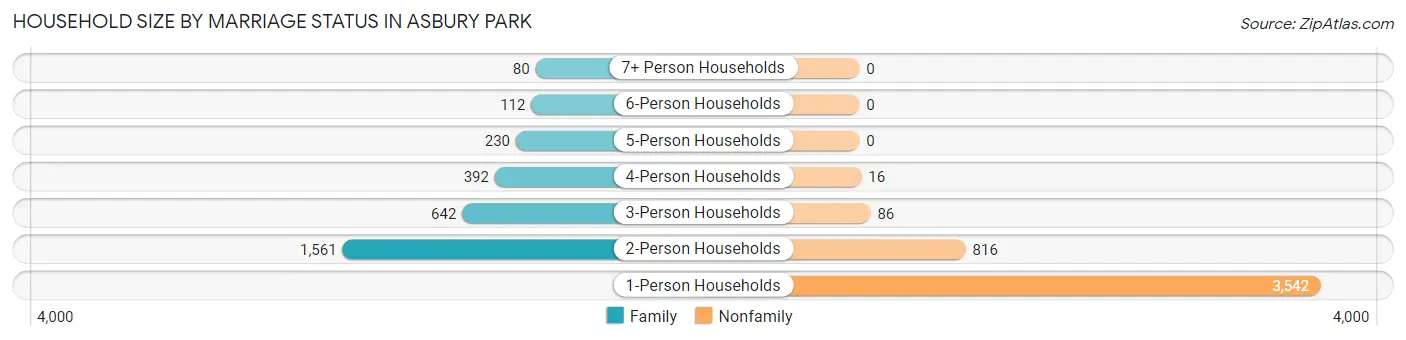
| Household Size | Family Households | Nonfamily Households |
| 1-Person Households | - | 3,542 (47.4%) |
| 2-Person Households | 1,561 (20.9%) | 816 (10.9%) |
| 3-Person Households | 642 (8.6%) | 86 (1.1%) |
| 4-Person Households | 392 (5.2%) | 16 (0.2%) |
| 5-Person Households | 230 (3.1%) | 0 (0.0%) |
| 6-Person Households | 112 (1.5%) | 0 (0.0%) |
| 7+ Person Households | 80 (1.1%) | 0 (0.0%) |
| Total | 3,017 (40.4%) | 4,460 (59.7%) |
Female Fertility in Asbury Park
Fertility by Age in Asbury Park
Average fertility rate in Asbury Park is 51.0 births per 1,000 women. Women in the age bracket of 35 to 50 years have the highest fertility rate with 64.0 births per 1,000 women. Women in the age bracket of 35 to 50 years acount for 56.0% of all women with births.
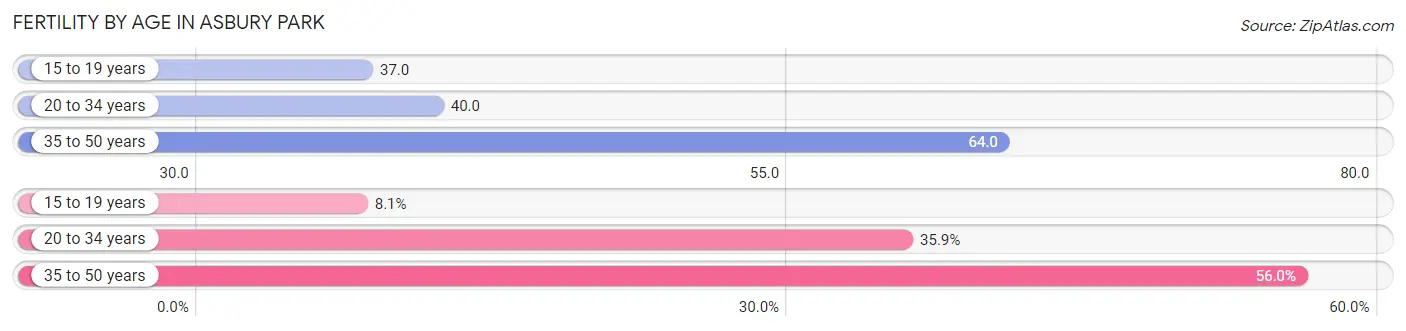
| Age Bracket | Women with Births | Births / 1,000 Women |
| 15 to 19 years | 17 (8.1%) | 37.0 |
| 20 to 34 years | 75 (35.9%) | 40.0 |
| 35 to 50 years | 117 (56.0%) | 64.0 |
| Total | 209 (100.0%) | 51.0 |
Fertility by Age by Marriage Status in Asbury Park
34.4% of women with births (209) in Asbury Park are married. The highest percentage of unmarried women with births falls into 15 to 19 years age bracket with 100.0% of them unmarried at the time of birth, while the lowest percentage of unmarried women with births belong to 35 to 50 years age bracket with 46.2% of them unmarried.
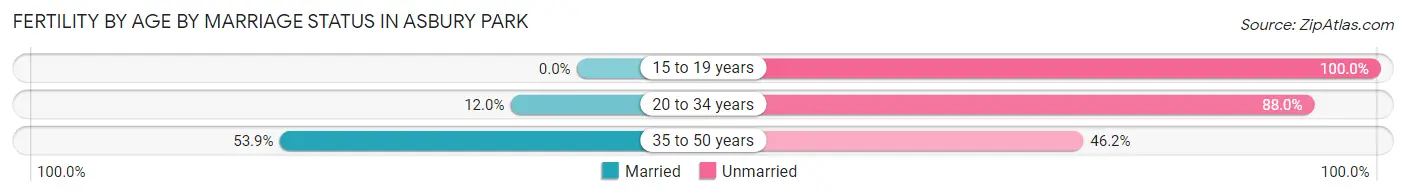
| Age Bracket | Married | Unmarried |
| 15 to 19 years | 0 (0.0%) | 17 (100.0%) |
| 20 to 34 years | 9 (12.0%) | 66 (88.0%) |
| 35 to 50 years | 63 (53.8%) | 54 (46.2%) |
| Total | 72 (34.4%) | 137 (65.5%) |
Fertility by Education in Asbury Park
Average fertility rate in Asbury Park is 51.0 births per 1,000 women. Women with the education attainment of graduate degree have the highest fertility rate of 146.0 births per 1,000 women, while women with the education attainment of bachelor's degree have the lowest fertility at 16.0 births per 1,000 women. Women with the education attainment of graduate degree represent 36.4% of all women with births.
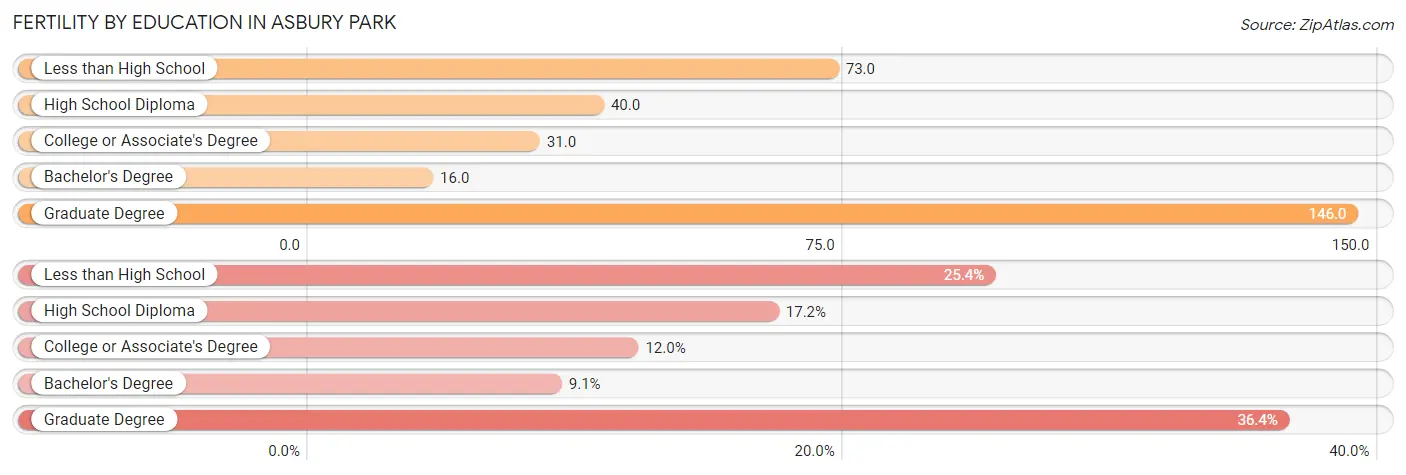
| Educational Attainment | Women with Births | Births / 1,000 Women |
| Less than High School | 53 (25.4%) | 73.0 |
| High School Diploma | 36 (17.2%) | 40.0 |
| College or Associate's Degree | 25 (12.0%) | 31.0 |
| Bachelor's Degree | 19 (9.1%) | 16.0 |
| Graduate Degree | 76 (36.4%) | 146.0 |
| Total | 209 (100.0%) | 51.0 |
Fertility by Education by Marriage Status in Asbury Park
65.5% of women with births in Asbury Park are unmarried. Women with the educational attainment of bachelor's degree are most likely to be married with 100.0% of them married at childbirth, while women with the educational attainment of high school diploma are least likely to be married with 100.0% of them unmarried at childbirth.
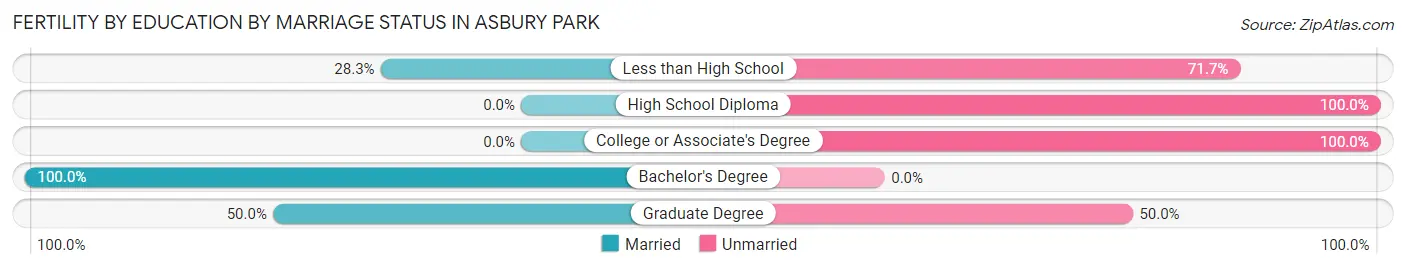
| Educational Attainment | Married | Unmarried |
| Less than High School | 15 (28.3%) | 38 (71.7%) |
| High School Diploma | 0 (0.0%) | 36 (100.0%) |
| College or Associate's Degree | 0 (0.0%) | 25 (100.0%) |
| Bachelor's Degree | 19 (100.0%) | 0 (0.0%) |
| Graduate Degree | 38 (50.0%) | 38 (50.0%) |
| Total | 72 (34.4%) | 137 (65.5%) |
Employment Characteristics in Asbury Park
Employment by Class of Employer in Asbury Park
Among the 8,634 employed individuals in Asbury Park, private company employees (6,223 | 72.1%), not-for-profit organizations (581 | 6.7%), and self-employed (not incorporated) (507 | 5.9%) make up the most common classes of employment.
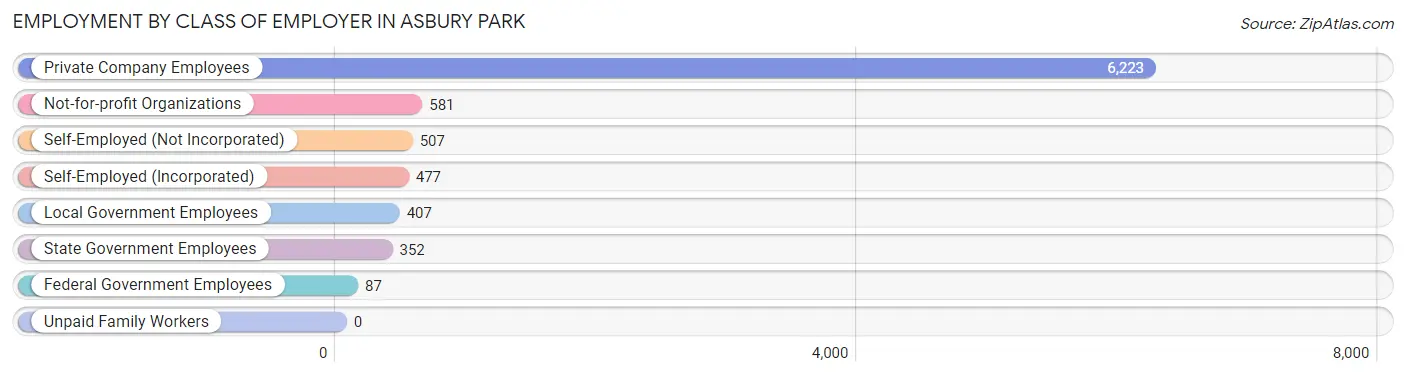
| Employer Class | # Employees | % Employees |
| Private Company Employees | 6,223 | 72.1% |
| Self-Employed (Incorporated) | 477 | 5.5% |
| Self-Employed (Not Incorporated) | 507 | 5.9% |
| Not-for-profit Organizations | 581 | 6.7% |
| Local Government Employees | 407 | 4.7% |
| State Government Employees | 352 | 4.1% |
| Federal Government Employees | 87 | 1.0% |
| Unpaid Family Workers | 0 | 0.0% |
| Total | 8,634 | 100.0% |
Employment Status by Age in Asbury Park
According to the labor force statistics for Asbury Park, out of the total population over 16 years of age (13,190), 72.1% or 9,510 individuals are in the labor force, with 8.3% or 789 of them unemployed. The age group with the highest labor force participation rate is 30 to 34 years, with 95.5% or 1,362 individuals in the labor force. Within the labor force, the 16 to 19 years age range has the highest percentage of unemployed individuals, with 16.7% or 49 of them being unemployed.
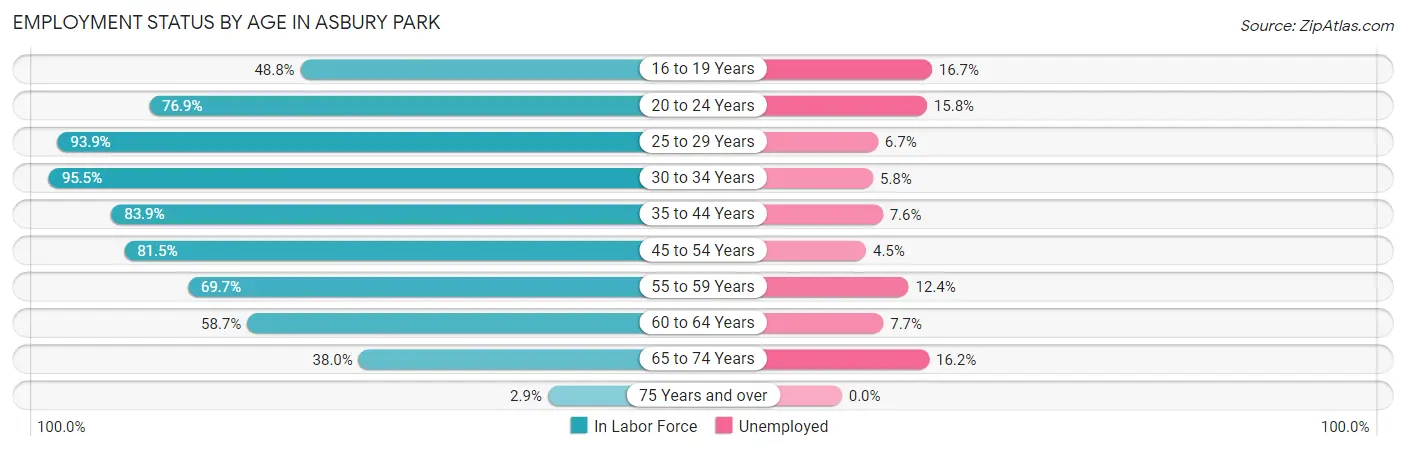
| Age Bracket | In Labor Force | Unemployed |
| 16 to 19 Years | 294 (48.8%) | 49 (16.7%) |
| 20 to 24 Years | 716 (76.9%) | 113 (15.8%) |
| 25 to 29 Years | 1,728 (93.9%) | 116 (6.7%) |
| 30 to 34 Years | 1,362 (95.5%) | 79 (5.8%) |
| 35 to 44 Years | 1,858 (83.9%) | 141 (7.6%) |
| 45 to 54 Years | 1,634 (81.5%) | 74 (4.5%) |
| 55 to 59 Years | 809 (69.7%) | 100 (12.4%) |
| 60 to 64 Years | 640 (58.7%) | 49 (7.7%) |
| 65 to 74 Years | 444 (38.0%) | 72 (16.2%) |
| 75 Years and over | 22 (2.9%) | 0 (0.0%) |
| Total | 9,510 (72.1%) | 789 (8.3%) |
Employment Status by Educational Attainment in Asbury Park
According to labor force statistics for Asbury Park, 82.5% of individuals (8,033) out of the total population between 25 and 64 years of age (9,737) are in the labor force, with 6.9% or 554 of them being unemployed. The group with the highest labor force participation rate are those with the educational attainment of bachelor's degree or higher, with 93.5% or 4,087 individuals in the labor force. Within the labor force, individuals with college / associate degree education have the highest percentage of unemployment, with 14.4% or 220 of them being unemployed.
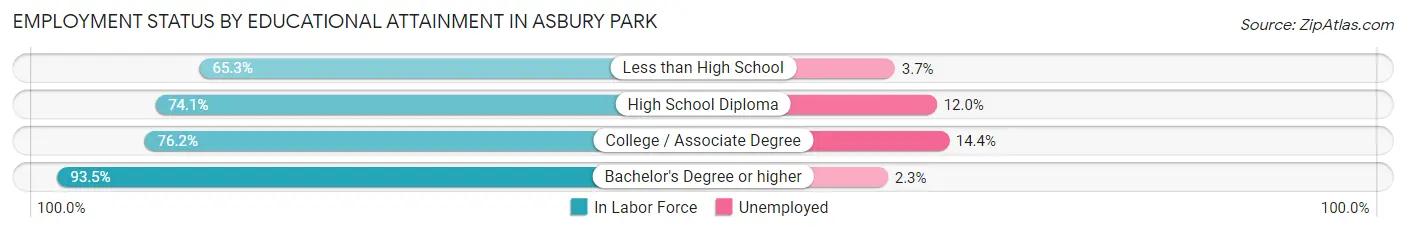
| Educational Attainment | In Labor Force | Unemployed |
| Less than High School | 542 (65.3%) | 31 (3.7%) |
| High School Diploma | 1,873 (74.1%) | 303 (12.0%) |
| College / Associate Degree | 1,531 (76.2%) | 289 (14.4%) |
| Bachelor's Degree or higher | 4,087 (93.5%) | 101 (2.3%) |
| Total | 8,033 (82.5%) | 672 (6.9%) |
Employment Occupations by Sex in Asbury Park
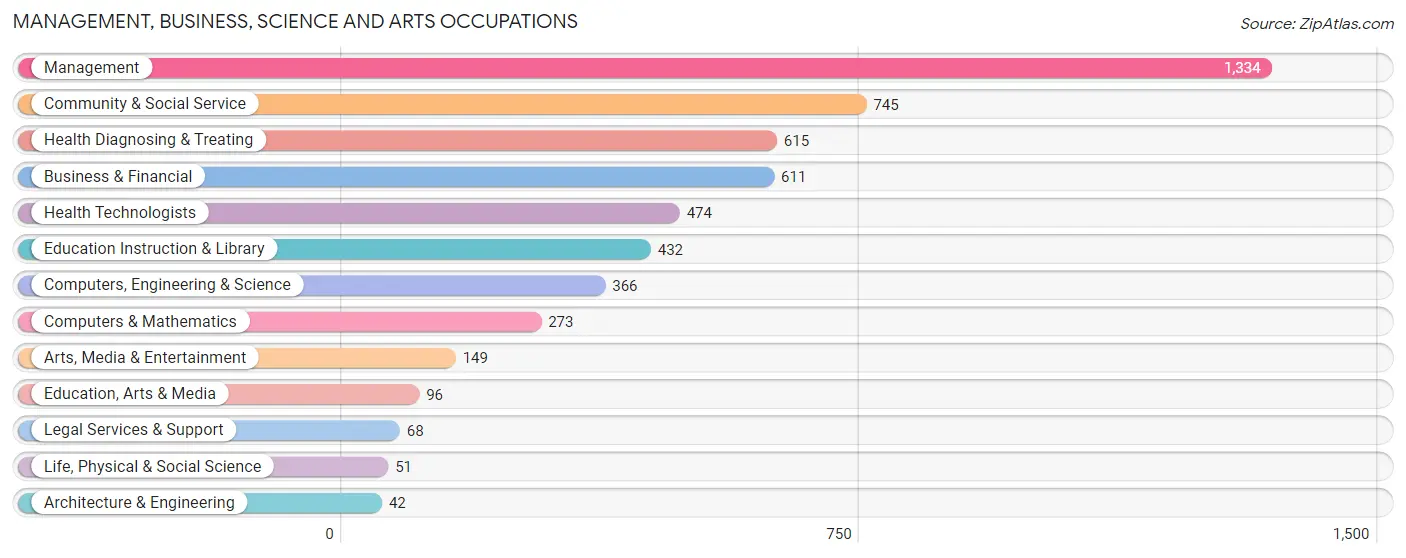
Management, Business, Science and Arts Occupations
The most common Management, Business, Science and Arts occupations in Asbury Park are Management (1,334 | 15.3%), Community & Social Service (745 | 8.6%), Health Diagnosing & Treating (615 | 7.1%), Business & Financial (611 | 7.0%), and Health Technologists (474 | 5.4%).
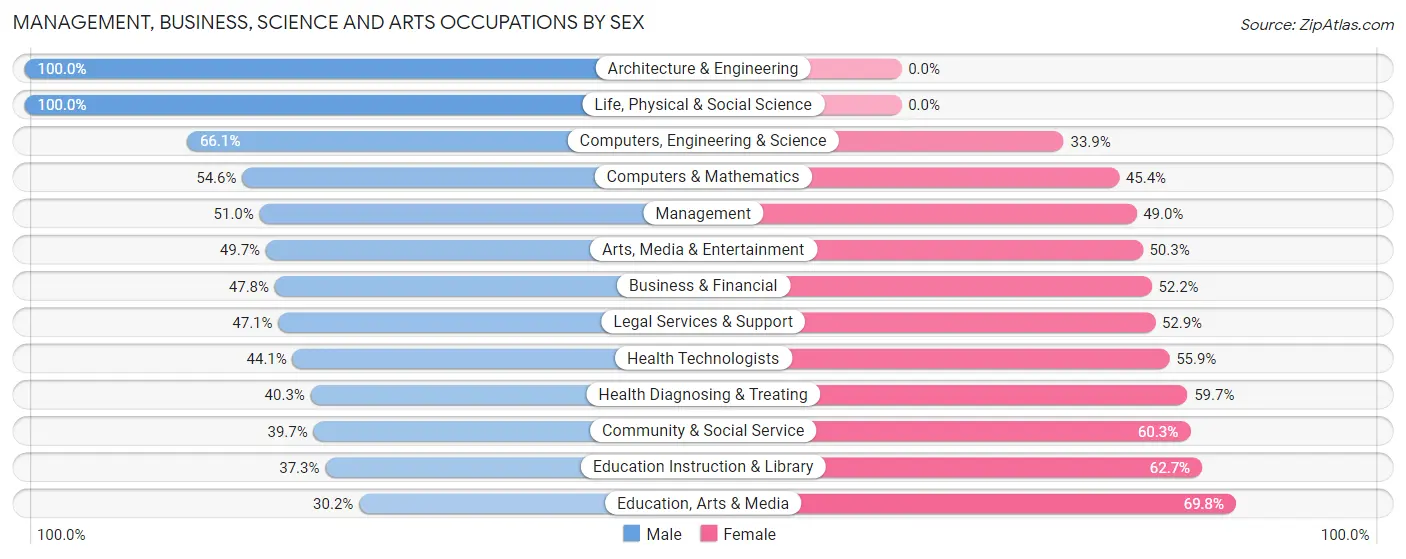
Management, Business, Science and Arts Occupations by Sex
Within the Management, Business, Science and Arts occupations in Asbury Park, the most male-oriented occupations are Architecture & Engineering (100.0%), Life, Physical & Social Science (100.0%), and Computers, Engineering & Science (66.1%), while the most female-oriented occupations are Education, Arts & Media (69.8%), Education Instruction & Library (62.7%), and Community & Social Service (60.3%).
| Occupation | Male | Female |
| Management | 680 (51.0%) | 654 (49.0%) |
| Business & Financial | 292 (47.8%) | 319 (52.2%) |
| Computers, Engineering & Science | 242 (66.1%) | 124 (33.9%) |
| Computers & Mathematics | 149 (54.6%) | 124 (45.4%) |
| Architecture & Engineering | 42 (100.0%) | 0 (0.0%) |
| Life, Physical & Social Science | 51 (100.0%) | 0 (0.0%) |
| Community & Social Service | 296 (39.7%) | 449 (60.3%) |
| Education, Arts & Media | 29 (30.2%) | 67 (69.8%) |
| Legal Services & Support | 32 (47.1%) | 36 (52.9%) |
| Education Instruction & Library | 161 (37.3%) | 271 (62.7%) |
| Arts, Media & Entertainment | 74 (49.7%) | 75 (50.3%) |
| Health Diagnosing & Treating | 248 (40.3%) | 367 (59.7%) |
| Health Technologists | 209 (44.1%) | 265 (55.9%) |
| Total (Category) | 1,758 (47.9%) | 1,913 (52.1%) |
| Total (Overall) | 4,403 (50.5%) | 4,313 (49.5%) |
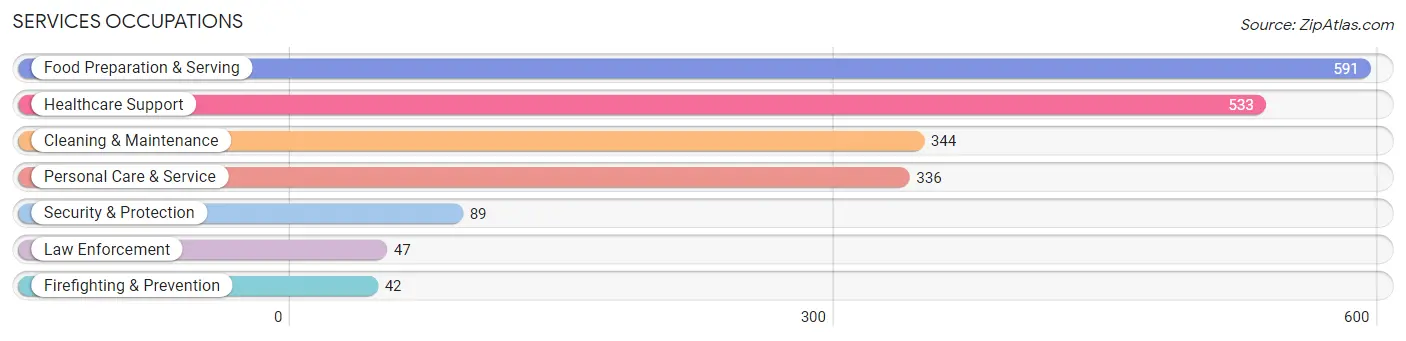
Services Occupations
The most common Services occupations in Asbury Park are Food Preparation & Serving (591 | 6.8%), Healthcare Support (533 | 6.1%), Cleaning & Maintenance (344 | 4.0%), Personal Care & Service (336 | 3.8%), and Security & Protection (89 | 1.0%).
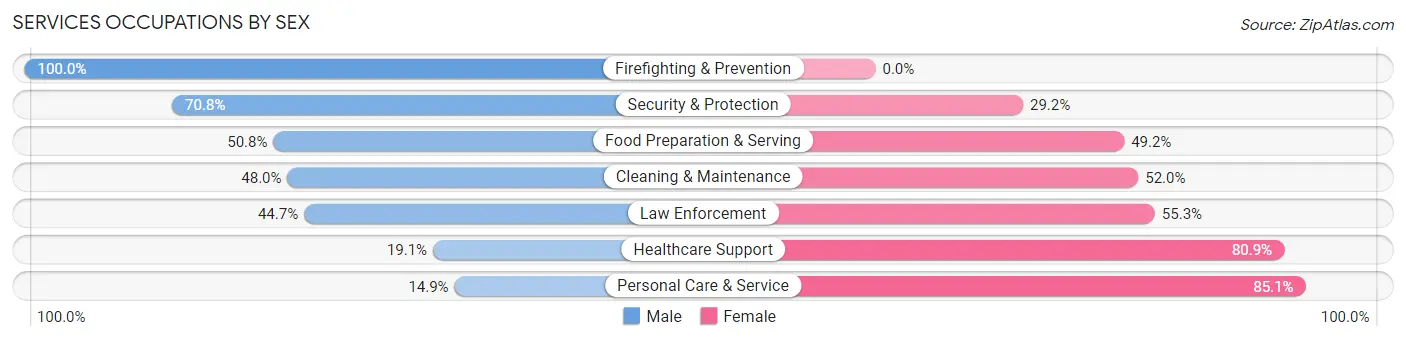
Services Occupations by Sex
Within the Services occupations in Asbury Park, the most male-oriented occupations are Firefighting & Prevention (100.0%), Security & Protection (70.8%), and Food Preparation & Serving (50.8%), while the most female-oriented occupations are Personal Care & Service (85.1%), Healthcare Support (80.9%), and Law Enforcement (55.3%).
| Occupation | Male | Female |
| Healthcare Support | 102 (19.1%) | 431 (80.9%) |
| Security & Protection | 63 (70.8%) | 26 (29.2%) |
| Firefighting & Prevention | 42 (100.0%) | 0 (0.0%) |
| Law Enforcement | 21 (44.7%) | 26 (55.3%) |
| Food Preparation & Serving | 300 (50.8%) | 291 (49.2%) |
| Cleaning & Maintenance | 165 (48.0%) | 179 (52.0%) |
| Personal Care & Service | 50 (14.9%) | 286 (85.1%) |
| Total (Category) | 680 (35.9%) | 1,213 (64.1%) |
| Total (Overall) | 4,403 (50.5%) | 4,313 (49.5%) |
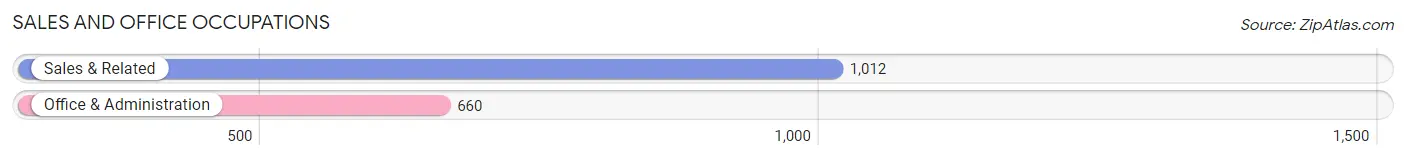
Sales and Office Occupations
The most common Sales and Office occupations in Asbury Park are Sales & Related (1,012 | 11.6%), and Office & Administration (660 | 7.6%).
Sales and Office Occupations by Sex
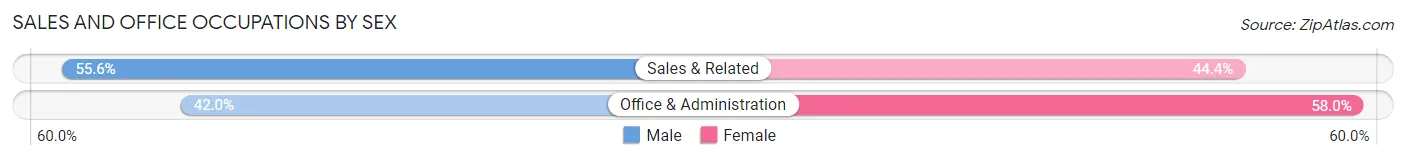
| Occupation | Male | Female |
| Sales & Related | 563 (55.6%) | 449 (44.4%) |
| Office & Administration | 277 (42.0%) | 383 (58.0%) |
| Total (Category) | 840 (50.2%) | 832 (49.8%) |
| Total (Overall) | 4,403 (50.5%) | 4,313 (49.5%) |
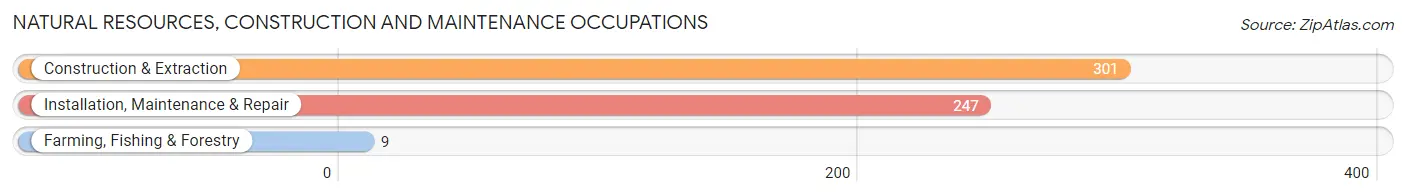
Natural Resources, Construction and Maintenance Occupations
The most common Natural Resources, Construction and Maintenance occupations in Asbury Park are Construction & Extraction (301 | 3.5%), Installation, Maintenance & Repair (247 | 2.8%), and Farming, Fishing & Forestry (9 | 0.1%).
Natural Resources, Construction and Maintenance Occupations by Sex
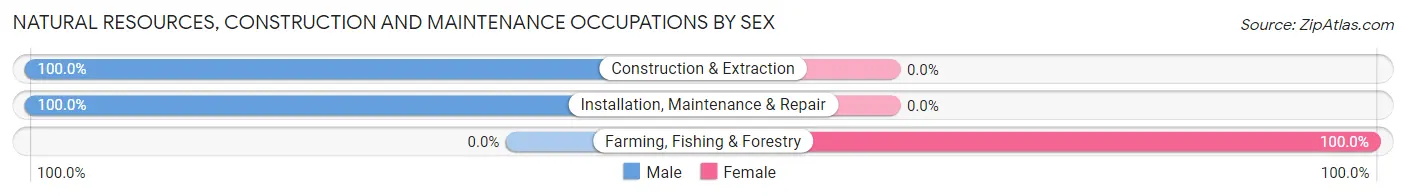
| Occupation | Male | Female |
| Farming, Fishing & Forestry | 0 (0.0%) | 9 (100.0%) |
| Construction & Extraction | 301 (100.0%) | 0 (0.0%) |
| Installation, Maintenance & Repair | 247 (100.0%) | 0 (0.0%) |
| Total (Category) | 548 (98.4%) | 9 (1.6%) |
| Total (Overall) | 4,403 (50.5%) | 4,313 (49.5%) |
Production, Transportation and Moving Occupations
The most common Production, Transportation and Moving occupations in Asbury Park are Production (371 | 4.3%), Transportation (367 | 4.2%), and Material Moving (185 | 2.1%).
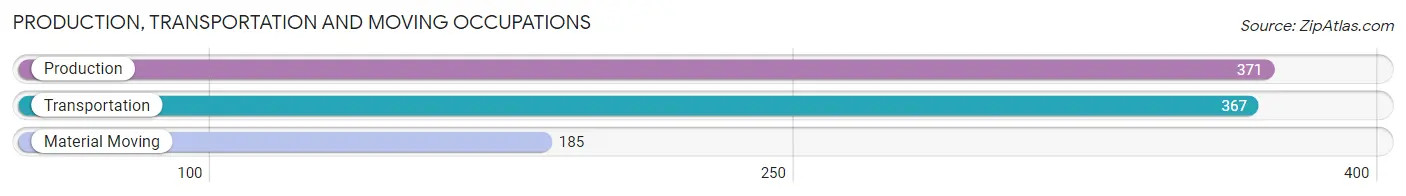
Production, Transportation and Moving Occupations by Sex
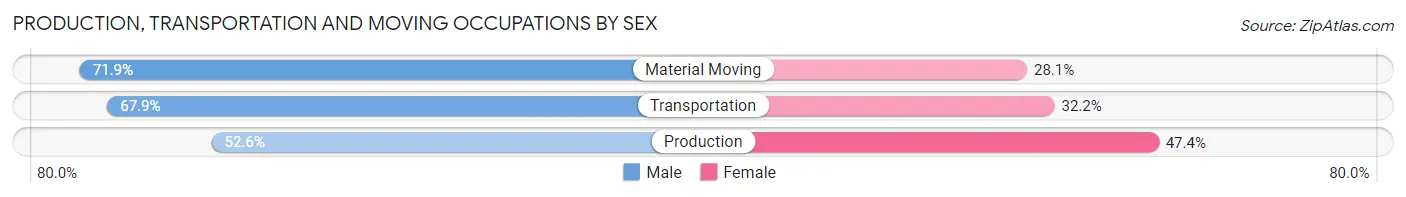
| Occupation | Male | Female |
| Production | 195 (52.6%) | 176 (47.4%) |
| Transportation | 249 (67.8%) | 118 (32.2%) |
| Material Moving | 133 (71.9%) | 52 (28.1%) |
| Total (Category) | 577 (62.5%) | 346 (37.5%) |
| Total (Overall) | 4,403 (50.5%) | 4,313 (49.5%) |
Employment Industries by Sex in Asbury Park
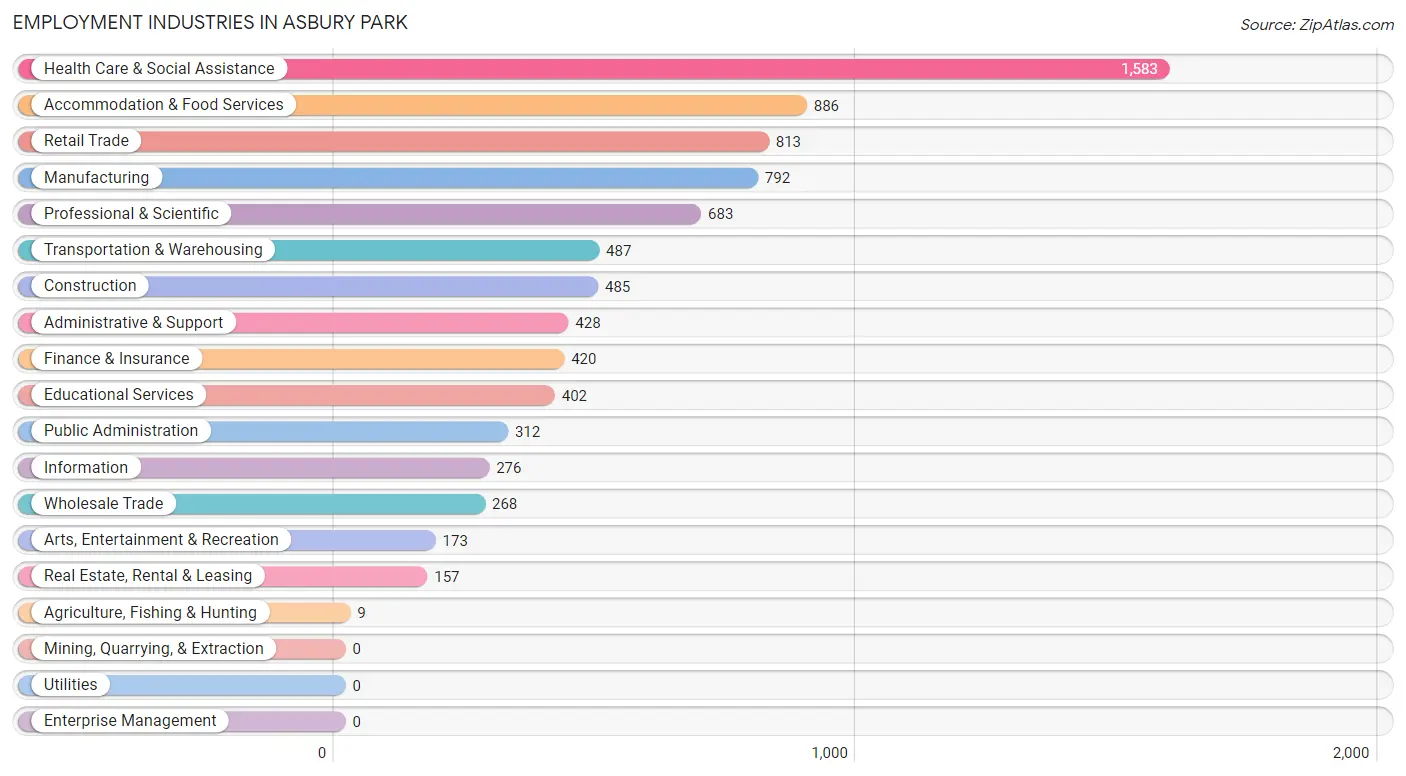
Employment Industries in Asbury Park
The major employment industries in Asbury Park include Health Care & Social Assistance (1,583 | 18.2%), Accommodation & Food Services (886 | 10.2%), Retail Trade (813 | 9.3%), Manufacturing (792 | 9.1%), and Professional & Scientific (683 | 7.8%).
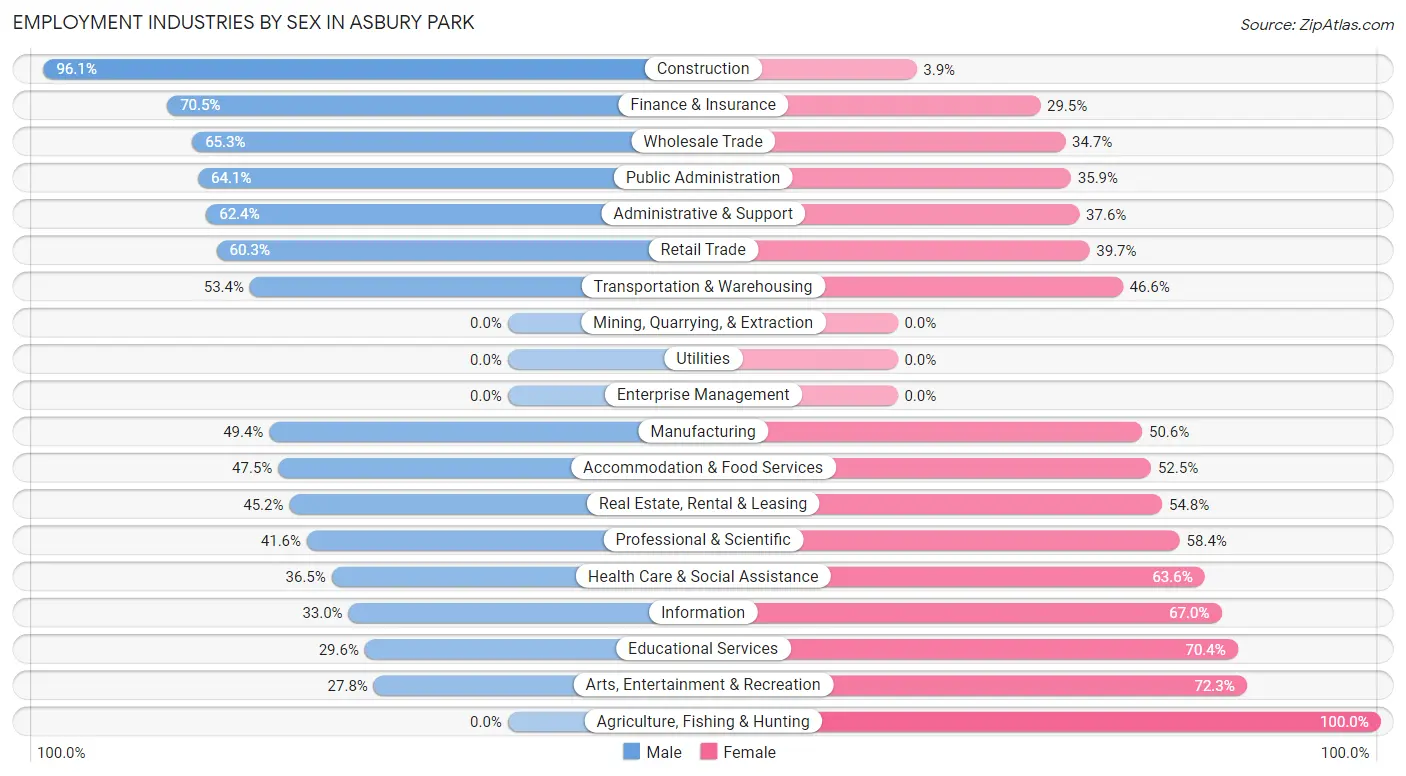
Employment Industries by Sex in Asbury Park
The Asbury Park industries that see more men than women are Construction (96.1%), Finance & Insurance (70.5%), and Wholesale Trade (65.3%), whereas the industries that tend to have a higher number of women are Agriculture, Fishing & Hunting (100.0%), Arts, Entertainment & Recreation (72.3%), and Educational Services (70.4%).
| Industry | Male | Female |
| Agriculture, Fishing & Hunting | 0 (0.0%) | 9 (100.0%) |
| Mining, Quarrying, & Extraction | 0 (0.0%) | 0 (0.0%) |
| Construction | 466 (96.1%) | 19 (3.9%) |
| Manufacturing | 391 (49.4%) | 401 (50.6%) |
| Wholesale Trade | 175 (65.3%) | 93 (34.7%) |
| Retail Trade | 490 (60.3%) | 323 (39.7%) |
| Transportation & Warehousing | 260 (53.4%) | 227 (46.6%) |
| Utilities | 0 (0.0%) | 0 (0.0%) |
| Information | 91 (33.0%) | 185 (67.0%) |
| Finance & Insurance | 296 (70.5%) | 124 (29.5%) |
| Real Estate, Rental & Leasing | 71 (45.2%) | 86 (54.8%) |
| Professional & Scientific | 284 (41.6%) | 399 (58.4%) |
| Enterprise Management | 0 (0.0%) | 0 (0.0%) |
| Administrative & Support | 267 (62.4%) | 161 (37.6%) |
| Educational Services | 119 (29.6%) | 283 (70.4%) |
| Health Care & Social Assistance | 577 (36.4%) | 1,006 (63.5%) |
| Arts, Entertainment & Recreation | 48 (27.8%) | 125 (72.3%) |
| Accommodation & Food Services | 421 (47.5%) | 465 (52.5%) |
| Public Administration | 200 (64.1%) | 112 (35.9%) |
| Total | 4,403 (50.5%) | 4,313 (49.5%) |
Education in Asbury Park
School Enrollment in Asbury Park
The most common levels of schooling among the 2,753 students in Asbury Park are high school (737 | 26.8%), elementary school (664 | 24.1%), and college / undergraduate (496 | 18.0%).
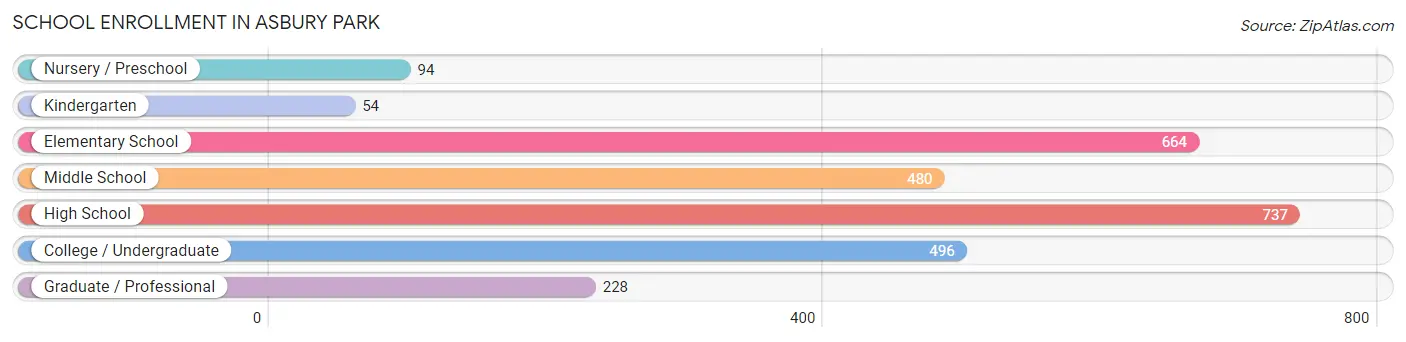
| School Level | # Students | % Students |
| Nursery / Preschool | 94 | 3.4% |
| Kindergarten | 54 | 2.0% |
| Elementary School | 664 | 24.1% |
| Middle School | 480 | 17.4% |
| High School | 737 | 26.8% |
| College / Undergraduate | 496 | 18.0% |
| Graduate / Professional | 228 | 8.3% |
| Total | 2,753 | 100.0% |
School Enrollment by Age by Funding Source in Asbury Park
Out of a total of 2,753 students who are enrolled in schools in Asbury Park, 435 (15.8%) attend a private institution, while the remaining 2,318 (84.2%) are enrolled in public schools. The age group of 3 to 4 year olds has the highest likelihood of being enrolled in private schools, with 25 (43.1% in the age bracket) enrolled. Conversely, the age group of 18 to 19 year olds has the lowest likelihood of being enrolled in a private school, with 313 (96.6% in the age bracket) attending a public institution.
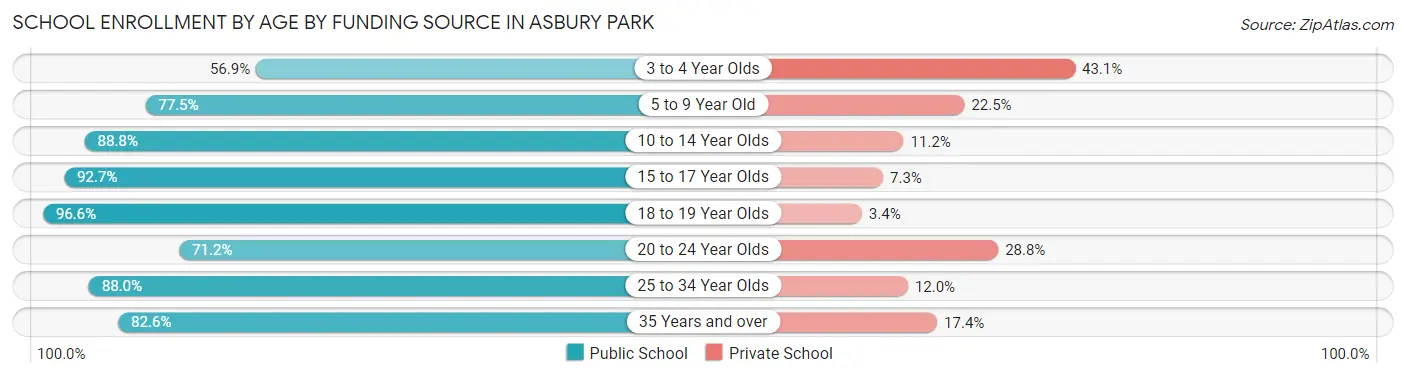
| Age Bracket | Public School | Private School |
| 3 to 4 Year Olds | 33 (56.9%) | 25 (43.1%) |
| 5 to 9 Year Old | 558 (77.5%) | 162 (22.5%) |
| 10 to 14 Year Olds | 525 (88.8%) | 66 (11.2%) |
| 15 to 17 Year Olds | 366 (92.7%) | 29 (7.3%) |
| 18 to 19 Year Olds | 313 (96.6%) | 11 (3.4%) |
| 20 to 24 Year Olds | 198 (71.2%) | 80 (28.8%) |
| 25 to 34 Year Olds | 103 (88.0%) | 14 (12.0%) |
| 35 Years and over | 223 (82.6%) | 47 (17.4%) |
| Total | 2,318 (84.2%) | 435 (15.8%) |
Educational Attainment by Field of Study in Asbury Park
Business (1,145 | 21.3%), social sciences (927 | 17.3%), psychology (491 | 9.1%), arts & humanities (445 | 8.3%), and education (345 | 6.4%) are the most common fields of study among 5,366 individuals in Asbury Park who have obtained a bachelor's degree or higher.
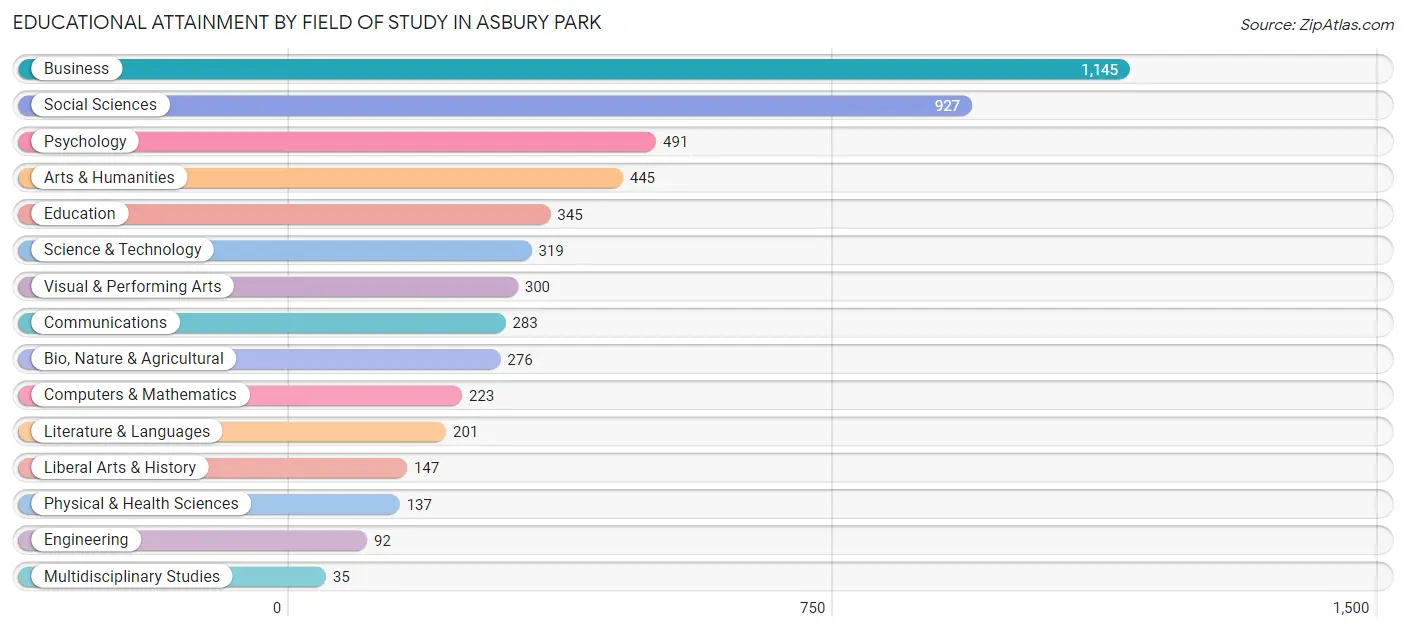
| Field of Study | # Graduates | % Graduates |
| Computers & Mathematics | 223 | 4.2% |
| Bio, Nature & Agricultural | 276 | 5.1% |
| Physical & Health Sciences | 137 | 2.5% |
| Psychology | 491 | 9.1% |
| Social Sciences | 927 | 17.3% |
| Engineering | 92 | 1.7% |
| Multidisciplinary Studies | 35 | 0.6% |
| Science & Technology | 319 | 5.9% |
| Business | 1,145 | 21.3% |
| Education | 345 | 6.4% |
| Literature & Languages | 201 | 3.7% |
| Liberal Arts & History | 147 | 2.7% |
| Visual & Performing Arts | 300 | 5.6% |
| Communications | 283 | 5.3% |
| Arts & Humanities | 445 | 8.3% |
| Total | 5,366 | 100.0% |
Transportation & Commute in Asbury Park
Vehicle Availability by Sex in Asbury Park
The most prevalent vehicle ownership categories in Asbury Park are males with 2 vehicles (1,918, accounting for 44.4%) and females with 2 vehicles (1,589, making up 44.9%).
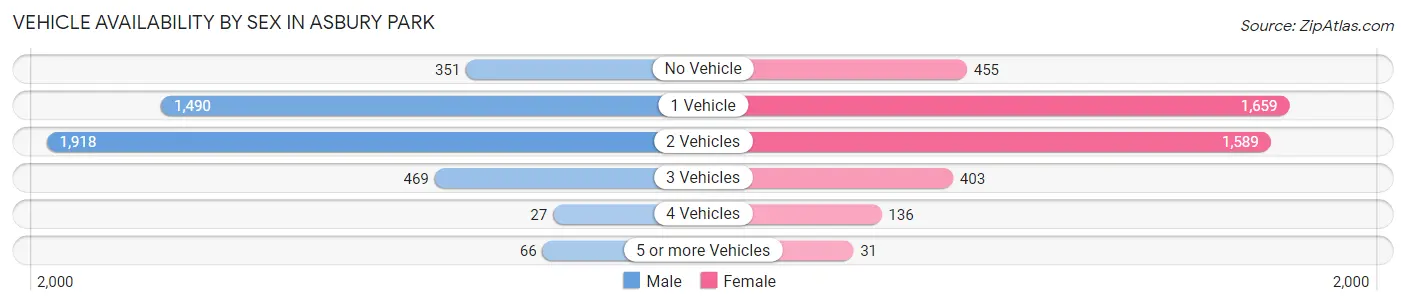
| Vehicles Available | Male | Female |
| No Vehicle | 351 (8.1%) | 455 (10.6%) |
| 1 Vehicle | 1,490 (34.5%) | 1,659 (38.8%) |
| 2 Vehicles | 1,918 (44.4%) | 1,589 (37.2%) |
| 3 Vehicles | 469 (10.8%) | 403 (9.4%) |
| 4 Vehicles | 27 (0.6%) | 136 (3.2%) |
| 5 or more Vehicles | 66 (1.5%) | 31 (0.7%) |
| Total | 4,321 (100.0%) | 4,273 (100.0%) |
Commute Time in Asbury Park
The most frequently occuring commute durations in Asbury Park are 15 to 19 minutes (1,414 commuters, 19.2%), 10 to 14 minutes (932 commuters, 12.7%), and 30 to 34 minutes (779 commuters, 10.6%).
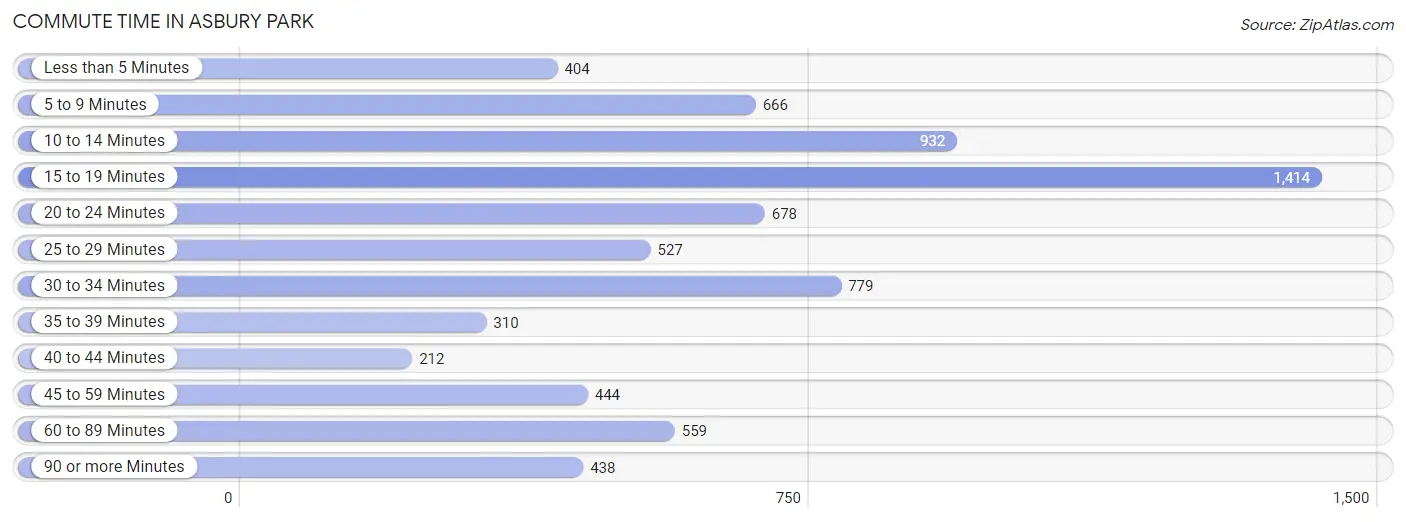
| Commute Time | # Commuters | % Commuters |
| Less than 5 Minutes | 404 | 5.5% |
| 5 to 9 Minutes | 666 | 9.0% |
| 10 to 14 Minutes | 932 | 12.7% |
| 15 to 19 Minutes | 1,414 | 19.2% |
| 20 to 24 Minutes | 678 | 9.2% |
| 25 to 29 Minutes | 527 | 7.2% |
| 30 to 34 Minutes | 779 | 10.6% |
| 35 to 39 Minutes | 310 | 4.2% |
| 40 to 44 Minutes | 212 | 2.9% |
| 45 to 59 Minutes | 444 | 6.0% |
| 60 to 89 Minutes | 559 | 7.6% |
| 90 or more Minutes | 438 | 5.9% |
Commute Time by Sex in Asbury Park
The most common commute times in Asbury Park are 15 to 19 minutes (825 commuters, 22.2%) for males and 15 to 19 minutes (589 commuters, 16.2%) for females.
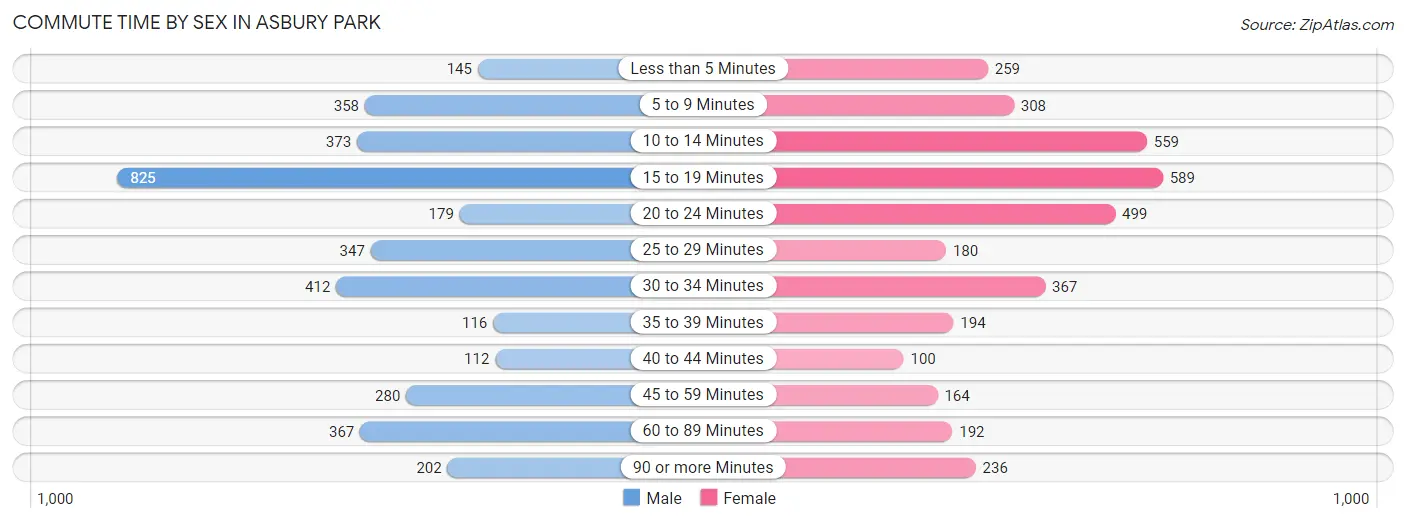
| Commute Time | Male | Female |
| Less than 5 Minutes | 145 (3.9%) | 259 (7.1%) |
| 5 to 9 Minutes | 358 (9.6%) | 308 (8.5%) |
| 10 to 14 Minutes | 373 (10.0%) | 559 (15.3%) |
| 15 to 19 Minutes | 825 (22.2%) | 589 (16.2%) |
| 20 to 24 Minutes | 179 (4.8%) | 499 (13.7%) |
| 25 to 29 Minutes | 347 (9.3%) | 180 (4.9%) |
| 30 to 34 Minutes | 412 (11.1%) | 367 (10.1%) |
| 35 to 39 Minutes | 116 (3.1%) | 194 (5.3%) |
| 40 to 44 Minutes | 112 (3.0%) | 100 (2.7%) |
| 45 to 59 Minutes | 280 (7.5%) | 164 (4.5%) |
| 60 to 89 Minutes | 367 (9.9%) | 192 (5.3%) |
| 90 or more Minutes | 202 (5.4%) | 236 (6.5%) |
Time of Departure to Work by Sex in Asbury Park
The most frequent times of departure to work in Asbury Park are 7:00 AM to 7:29 AM (655, 17.6%) for males and 9:00 AM to 9:59 AM (493, 13.5%) for females.
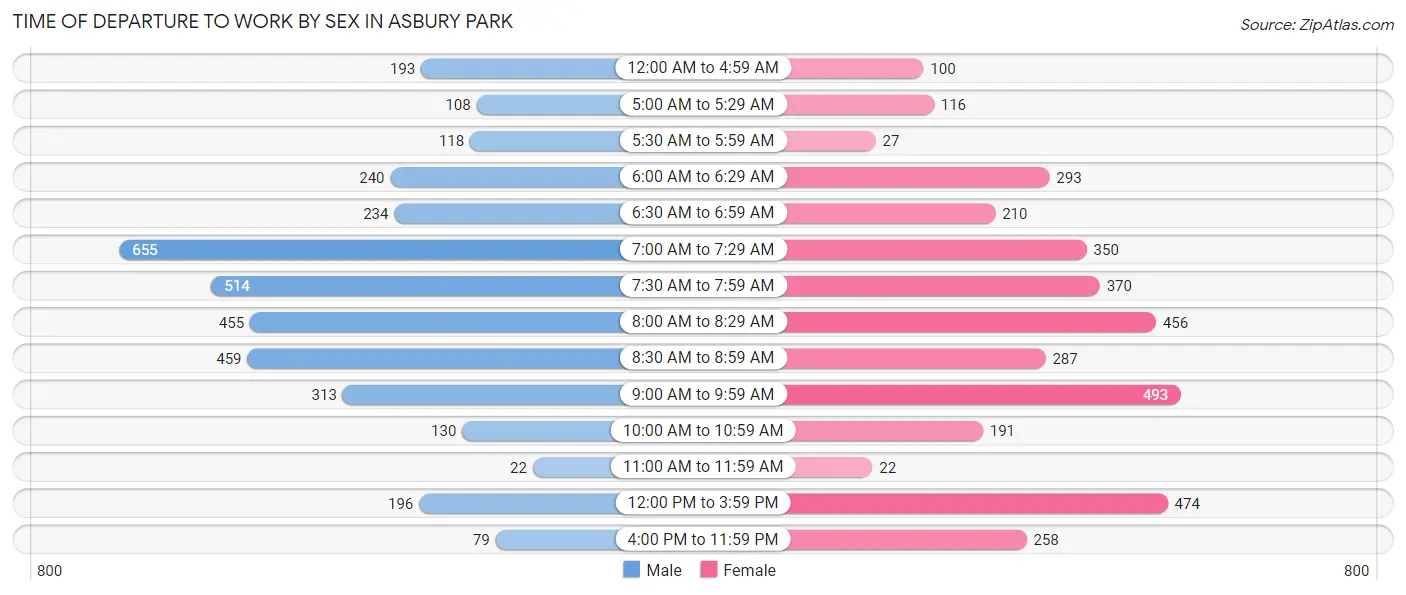
| Time of Departure | Male | Female |
| 12:00 AM to 4:59 AM | 193 (5.2%) | 100 (2.7%) |
| 5:00 AM to 5:29 AM | 108 (2.9%) | 116 (3.2%) |
| 5:30 AM to 5:59 AM | 118 (3.2%) | 27 (0.7%) |
| 6:00 AM to 6:29 AM | 240 (6.5%) | 293 (8.0%) |
| 6:30 AM to 6:59 AM | 234 (6.3%) | 210 (5.8%) |
| 7:00 AM to 7:29 AM | 655 (17.6%) | 350 (9.6%) |
| 7:30 AM to 7:59 AM | 514 (13.8%) | 370 (10.2%) |
| 8:00 AM to 8:29 AM | 455 (12.2%) | 456 (12.5%) |
| 8:30 AM to 8:59 AM | 459 (12.3%) | 287 (7.9%) |
| 9:00 AM to 9:59 AM | 313 (8.4%) | 493 (13.5%) |
| 10:00 AM to 10:59 AM | 130 (3.5%) | 191 (5.2%) |
| 11:00 AM to 11:59 AM | 22 (0.6%) | 22 (0.6%) |
| 12:00 PM to 3:59 PM | 196 (5.3%) | 474 (13.0%) |
| 4:00 PM to 11:59 PM | 79 (2.1%) | 258 (7.1%) |
| Total | 3,716 (100.0%) | 3,647 (100.0%) |
Housing Occupancy in Asbury Park
Occupancy by Ownership in Asbury Park
Of the total 7,477 dwellings in Asbury Park, owner-occupied units account for 2,301 (30.8%), while renter-occupied units make up 5,176 (69.2%).
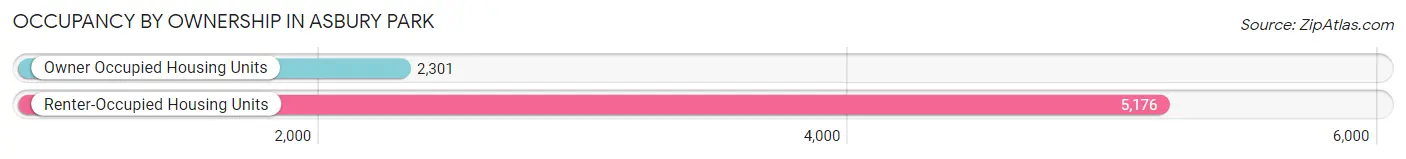
| Occupancy | # Housing Units | % Housing Units |
| Owner Occupied Housing Units | 2,301 | 30.8% |
| Renter-Occupied Housing Units | 5,176 | 69.2% |
| Total Occupied Housing Units | 7,477 | 100.0% |
Occupancy by Household Size in Asbury Park
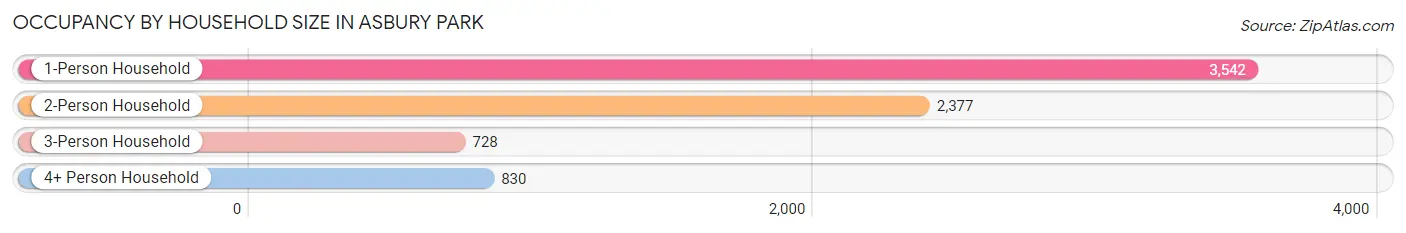
| Household Size | # Housing Units | % Housing Units |
| 1-Person Household | 3,542 | 47.4% |
| 2-Person Household | 2,377 | 31.8% |
| 3-Person Household | 728 | 9.7% |
| 4+ Person Household | 830 | 11.1% |
| Total Housing Units | 7,477 | 100.0% |
Occupancy by Ownership by Household Size in Asbury Park
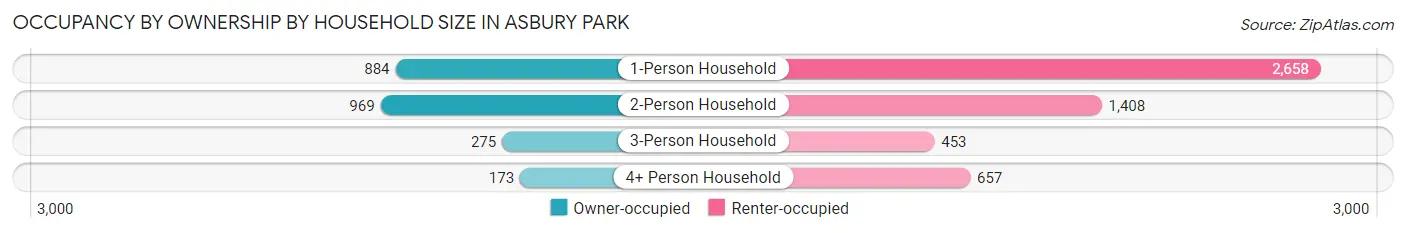
| Household Size | Owner-occupied | Renter-occupied |
| 1-Person Household | 884 (25.0%) | 2,658 (75.0%) |
| 2-Person Household | 969 (40.8%) | 1,408 (59.2%) |
| 3-Person Household | 275 (37.8%) | 453 (62.2%) |
| 4+ Person Household | 173 (20.8%) | 657 (79.2%) |
| Total Housing Units | 2,301 (30.8%) | 5,176 (69.2%) |
Occupancy by Educational Attainment in Asbury Park
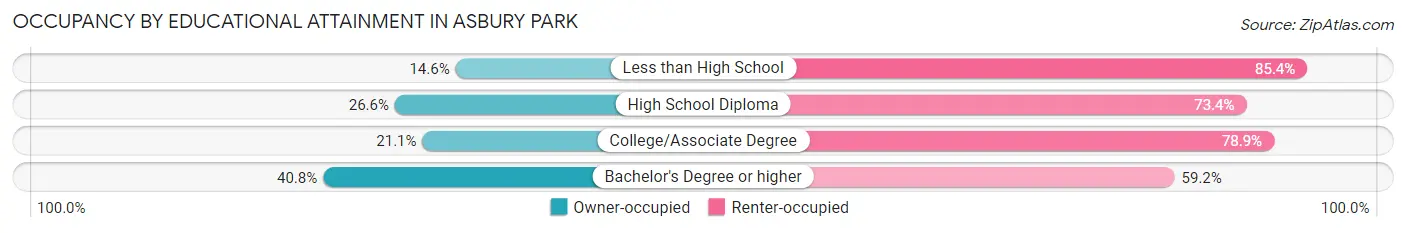
| Household Size | Owner-occupied | Renter-occupied |
| Less than High School | 119 (14.6%) | 698 (85.4%) |
| High School Diploma | 413 (26.6%) | 1,139 (73.4%) |
| College/Associate Degree | 340 (21.1%) | 1,268 (78.9%) |
| Bachelor's Degree or higher | 1,429 (40.8%) | 2,071 (59.2%) |
Occupancy by Age of Householder in Asbury Park
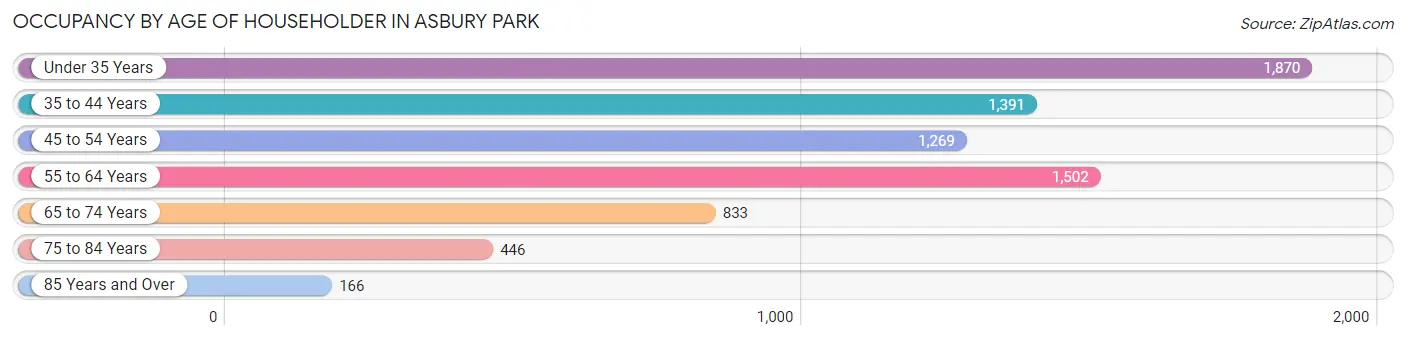
| Age Bracket | # Households | % Households |
| Under 35 Years | 1,870 | 25.0% |
| 35 to 44 Years | 1,391 | 18.6% |
| 45 to 54 Years | 1,269 | 17.0% |
| 55 to 64 Years | 1,502 | 20.1% |
| 65 to 74 Years | 833 | 11.1% |
| 75 to 84 Years | 446 | 6.0% |
| 85 Years and Over | 166 | 2.2% |
| Total | 7,477 | 100.0% |
Housing Finances in Asbury Park
Median Income by Occupancy in Asbury Park
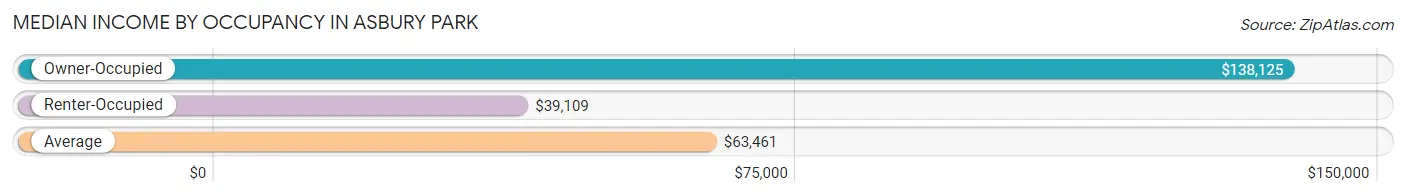
| Occupancy Type | # Households | Median Income |
| Owner-Occupied | 2,301 (30.8%) | $138,125 |
| Renter-Occupied | 5,176 (69.2%) | $39,109 |
| Average | 7,477 (100.0%) | $63,461 |
Occupancy by Householder Income Bracket in Asbury Park
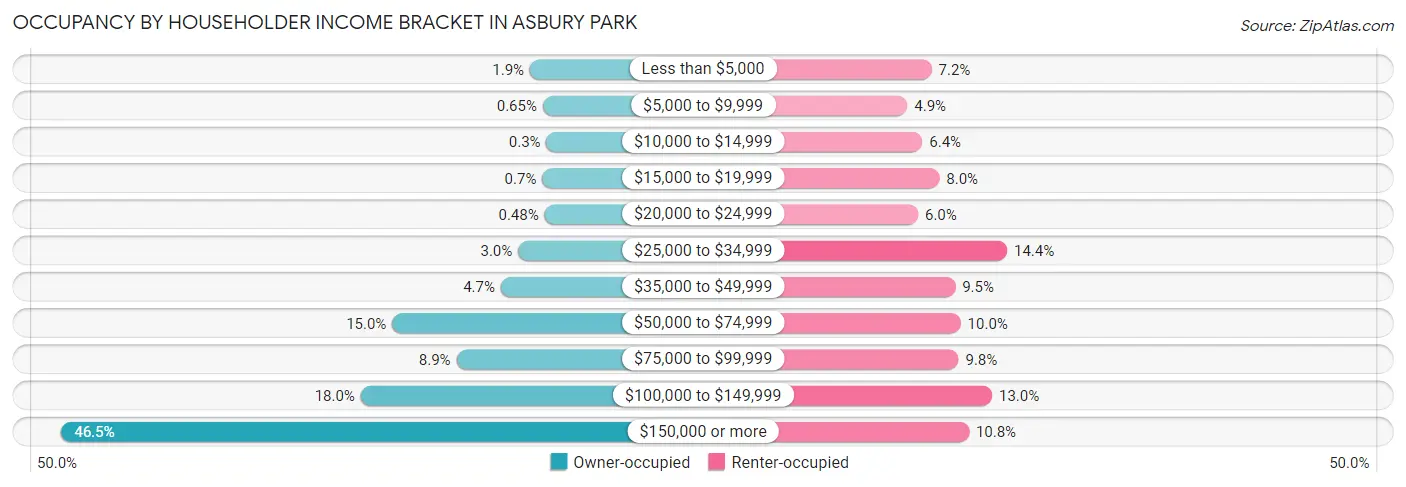
| Income Bracket | Owner-occupied | Renter-occupied |
| Less than $5,000 | 43 (1.9%) | 375 (7.2%) |
| $5,000 to $9,999 | 15 (0.6%) | 255 (4.9%) |
| $10,000 to $14,999 | 7 (0.3%) | 329 (6.4%) |
| $15,000 to $19,999 | 16 (0.7%) | 413 (8.0%) |
| $20,000 to $24,999 | 11 (0.5%) | 308 (5.9%) |
| $25,000 to $34,999 | 69 (3.0%) | 747 (14.4%) |
| $35,000 to $49,999 | 107 (4.6%) | 491 (9.5%) |
| $50,000 to $74,999 | 345 (15.0%) | 518 (10.0%) |
| $75,000 to $99,999 | 204 (8.9%) | 508 (9.8%) |
| $100,000 to $149,999 | 414 (18.0%) | 673 (13.0%) |
| $150,000 or more | 1,070 (46.5%) | 559 (10.8%) |
| Total | 2,301 (100.0%) | 5,176 (100.0%) |
Monthly Housing Cost Tiers in Asbury Park
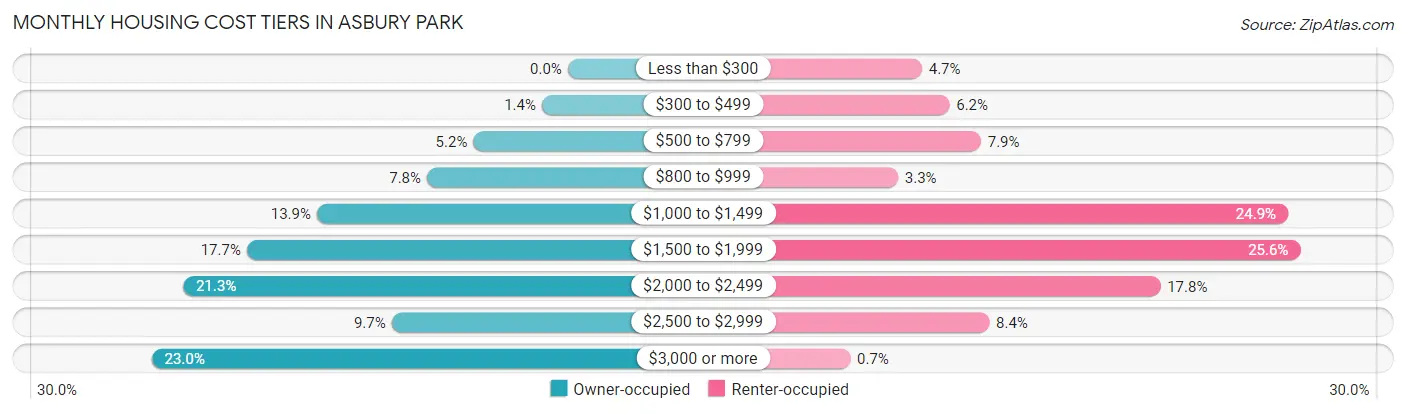
| Monthly Cost | Owner-occupied | Renter-occupied |
| Less than $300 | 0 (0.0%) | 241 (4.7%) |
| $300 to $499 | 33 (1.4%) | 320 (6.2%) |
| $500 to $799 | 120 (5.2%) | 410 (7.9%) |
| $800 to $999 | 179 (7.8%) | 173 (3.3%) |
| $1,000 to $1,499 | 319 (13.9%) | 1,288 (24.9%) |
| $1,500 to $1,999 | 408 (17.7%) | 1,323 (25.6%) |
| $2,000 to $2,499 | 489 (21.2%) | 923 (17.8%) |
| $2,500 to $2,999 | 224 (9.7%) | 434 (8.4%) |
| $3,000 or more | 529 (23.0%) | 36 (0.7%) |
| Total | 2,301 (100.0%) | 5,176 (100.0%) |
Physical Housing Characteristics in Asbury Park
Housing Structures in Asbury Park
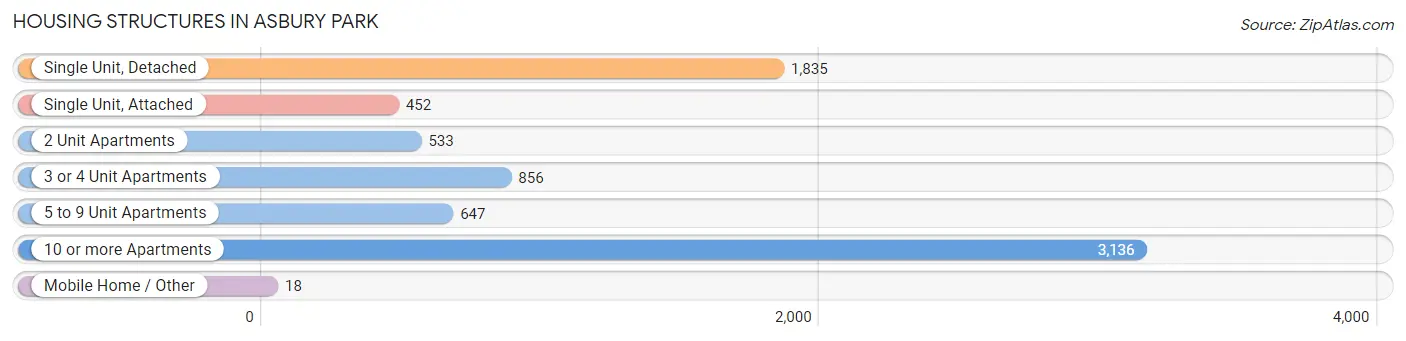
| Structure Type | # Housing Units | % Housing Units |
| Single Unit, Detached | 1,835 | 24.5% |
| Single Unit, Attached | 452 | 6.0% |
| 2 Unit Apartments | 533 | 7.1% |
| 3 or 4 Unit Apartments | 856 | 11.5% |
| 5 to 9 Unit Apartments | 647 | 8.6% |
| 10 or more Apartments | 3,136 | 41.9% |
| Mobile Home / Other | 18 | 0.2% |
| Total | 7,477 | 100.0% |
Housing Structures by Occupancy in Asbury Park
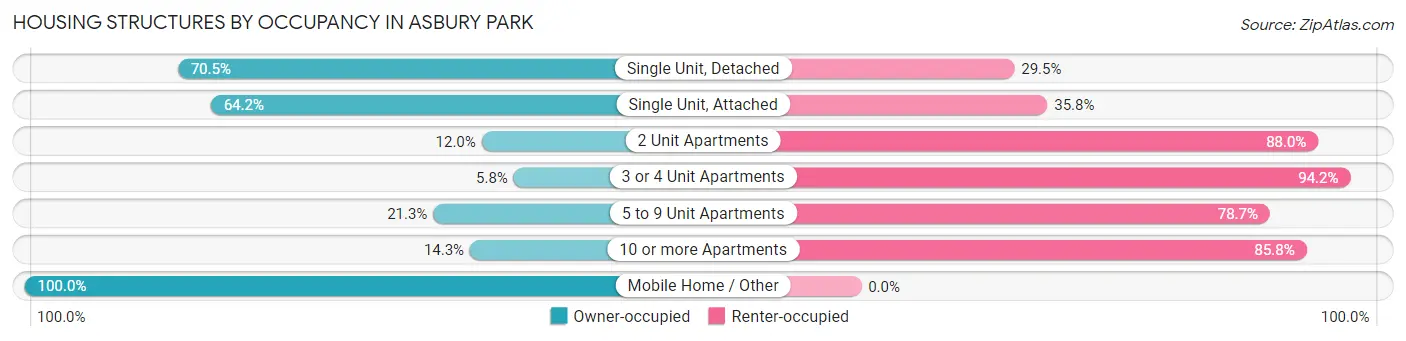
| Structure Type | Owner-occupied | Renter-occupied |
| Single Unit, Detached | 1,294 (70.5%) | 541 (29.5%) |
| Single Unit, Attached | 290 (64.2%) | 162 (35.8%) |
| 2 Unit Apartments | 64 (12.0%) | 469 (88.0%) |
| 3 or 4 Unit Apartments | 50 (5.8%) | 806 (94.2%) |
| 5 to 9 Unit Apartments | 138 (21.3%) | 509 (78.7%) |
| 10 or more Apartments | 447 (14.2%) | 2,689 (85.8%) |
| Mobile Home / Other | 18 (100.0%) | 0 (0.0%) |
| Total | 2,301 (30.8%) | 5,176 (69.2%) |
Housing Structures by Number of Rooms in Asbury Park
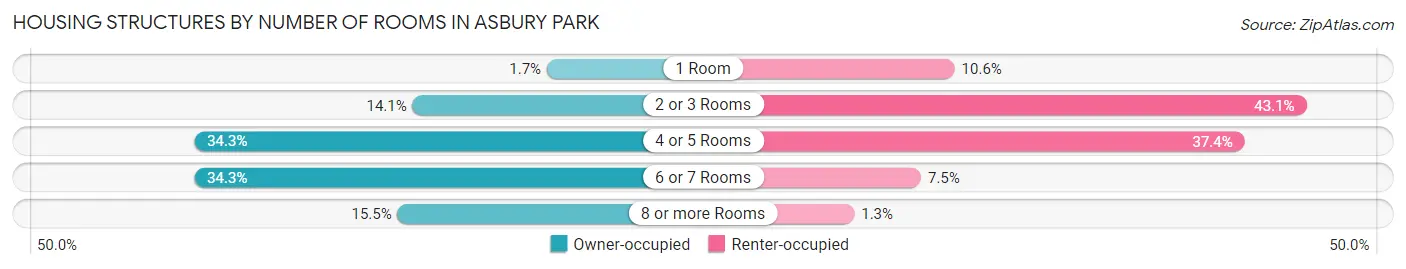
| Number of Rooms | Owner-occupied | Renter-occupied |
| 1 Room | 39 (1.7%) | 549 (10.6%) |
| 2 or 3 Rooms | 325 (14.1%) | 2,233 (43.1%) |
| 4 or 5 Rooms | 790 (34.3%) | 1,937 (37.4%) |
| 6 or 7 Rooms | 790 (34.3%) | 388 (7.5%) |
| 8 or more Rooms | 357 (15.5%) | 69 (1.3%) |
| Total | 2,301 (100.0%) | 5,176 (100.0%) |
Housing Structure by Heating Type in Asbury Park
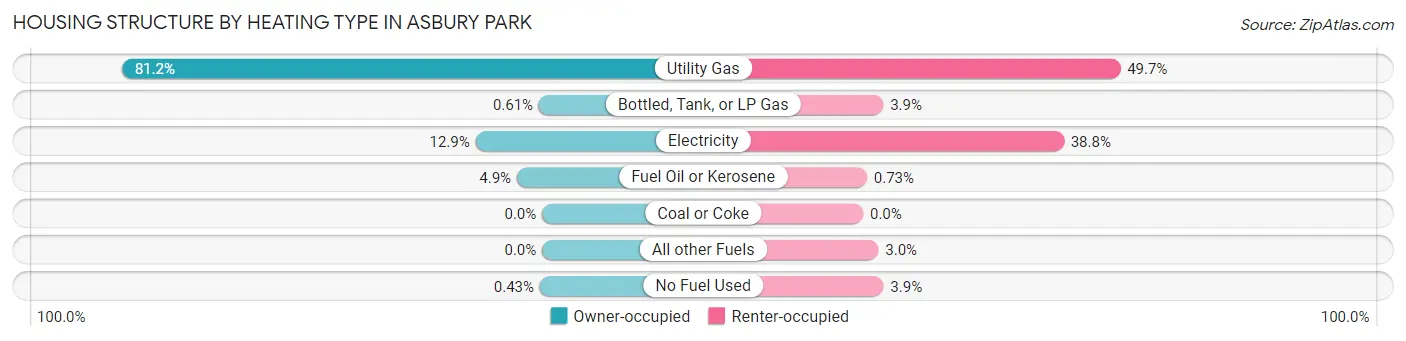
| Heating Type | Owner-occupied | Renter-occupied |
| Utility Gas | 1,869 (81.2%) | 2,572 (49.7%) |
| Bottled, Tank, or LP Gas | 14 (0.6%) | 202 (3.9%) |
| Electricity | 296 (12.9%) | 2,007 (38.8%) |
| Fuel Oil or Kerosene | 112 (4.9%) | 38 (0.7%) |
| Coal or Coke | 0 (0.0%) | 0 (0.0%) |
| All other Fuels | 0 (0.0%) | 153 (3.0%) |
| No Fuel Used | 10 (0.4%) | 204 (3.9%) |
| Total | 2,301 (100.0%) | 5,176 (100.0%) |
Household Vehicle Usage in Asbury Park
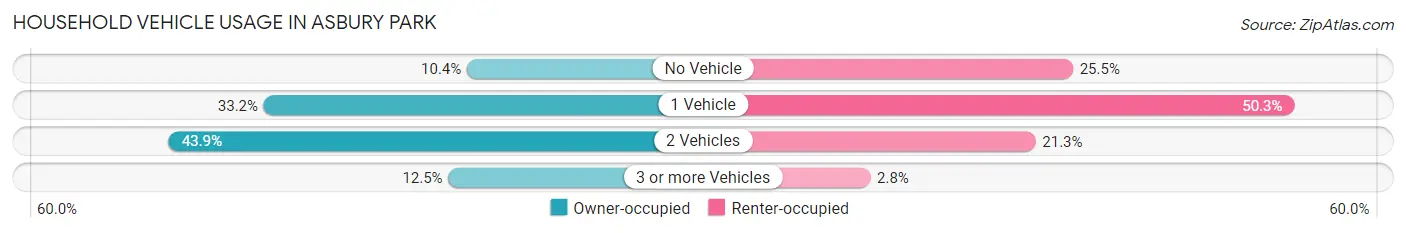
| Vehicles per Household | Owner-occupied | Renter-occupied |
| No Vehicle | 240 (10.4%) | 1,321 (25.5%) |
| 1 Vehicle | 764 (33.2%) | 2,605 (50.3%) |
| 2 Vehicles | 1,009 (43.9%) | 1,104 (21.3%) |
| 3 or more Vehicles | 288 (12.5%) | 146 (2.8%) |
| Total | 2,301 (100.0%) | 5,176 (100.0%) |
Real Estate & Mortgages in Asbury Park
Real Estate and Mortgage Overview in Asbury Park
| Characteristic | Without Mortgage | With Mortgage |
| Housing Units | 622 | 1,679 |
| Median Property Value | $344,100 | $490,400 |
| Median Household Income | $90,833 | $901 |
| Monthly Housing Costs | $1,009 | $520 |
| Real Estate Taxes | $7,238 | $0 |
Property Value by Mortgage Status in Asbury Park
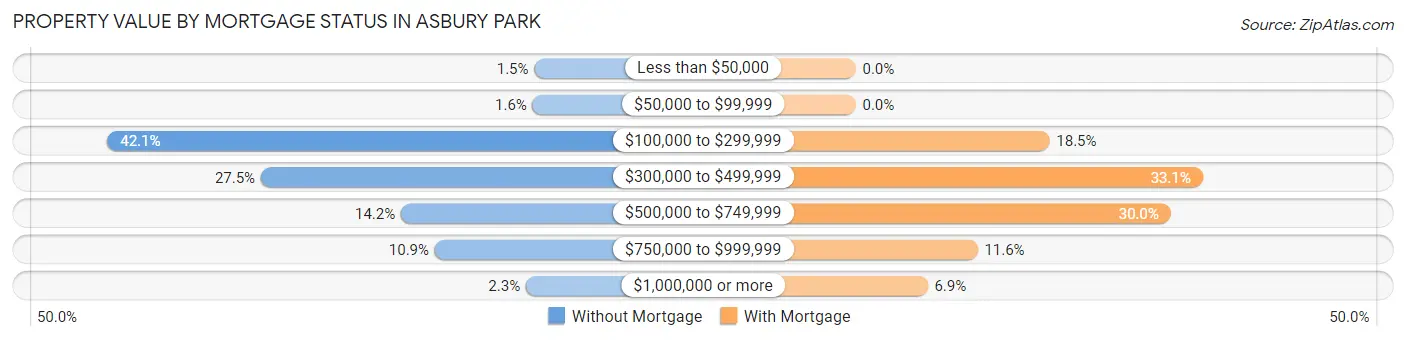
| Property Value | Without Mortgage | With Mortgage |
| Less than $50,000 | 9 (1.5%) | 0 (0.0%) |
| $50,000 to $99,999 | 10 (1.6%) | 0 (0.0%) |
| $100,000 to $299,999 | 262 (42.1%) | 310 (18.5%) |
| $300,000 to $499,999 | 171 (27.5%) | 555 (33.1%) |
| $500,000 to $749,999 | 88 (14.1%) | 504 (30.0%) |
| $750,000 to $999,999 | 68 (10.9%) | 195 (11.6%) |
| $1,000,000 or more | 14 (2.2%) | 115 (6.9%) |
| Total | 622 (100.0%) | 1,679 (100.0%) |
Household Income by Mortgage Status in Asbury Park
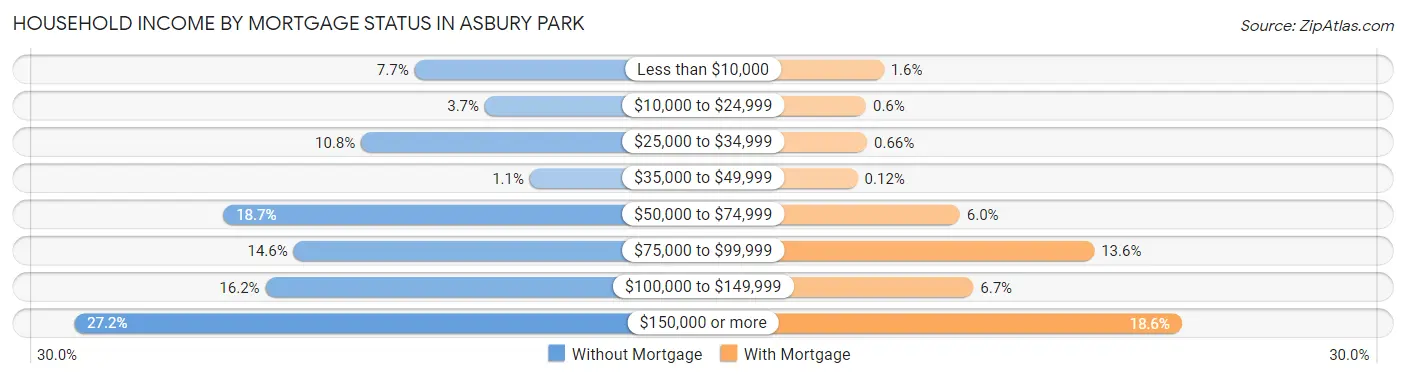
| Household Income | Without Mortgage | With Mortgage |
| Less than $10,000 | 48 (7.7%) | 27 (1.6%) |
| $10,000 to $24,999 | 23 (3.7%) | 10 (0.6%) |
| $25,000 to $34,999 | 67 (10.8%) | 11 (0.7%) |
| $35,000 to $49,999 | 7 (1.1%) | 2 (0.1%) |
| $50,000 to $74,999 | 116 (18.6%) | 100 (6.0%) |
| $75,000 to $99,999 | 91 (14.6%) | 229 (13.6%) |
| $100,000 to $149,999 | 101 (16.2%) | 113 (6.7%) |
| $150,000 or more | 169 (27.2%) | 313 (18.6%) |
| Total | 622 (100.0%) | 1,679 (100.0%) |
Property Value to Household Income Ratio in Asbury Park
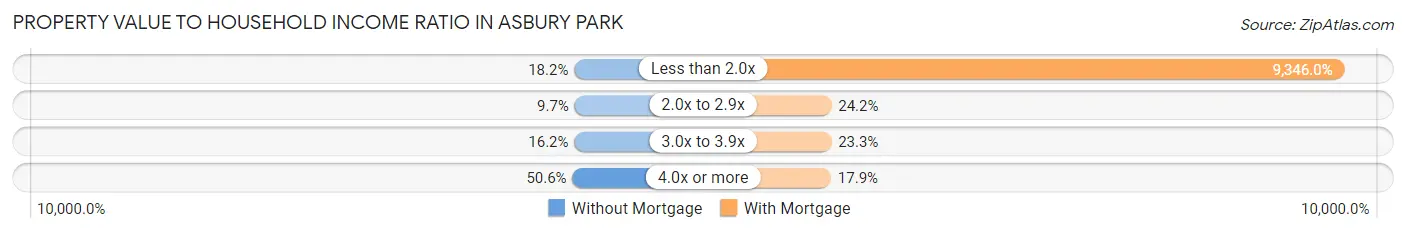
| Value-to-Income Ratio | Without Mortgage | With Mortgage |
| Less than 2.0x | 113 (18.2%) | 156,920 (9,346.0%) |
| 2.0x to 2.9x | 60 (9.7%) | 406 (24.2%) |
| 3.0x to 3.9x | 101 (16.2%) | 391 (23.3%) |
| 4.0x or more | 315 (50.6%) | 301 (17.9%) |
| Total | 622 (100.0%) | 1,679 (100.0%) |
Real Estate Taxes by Mortgage Status in Asbury Park
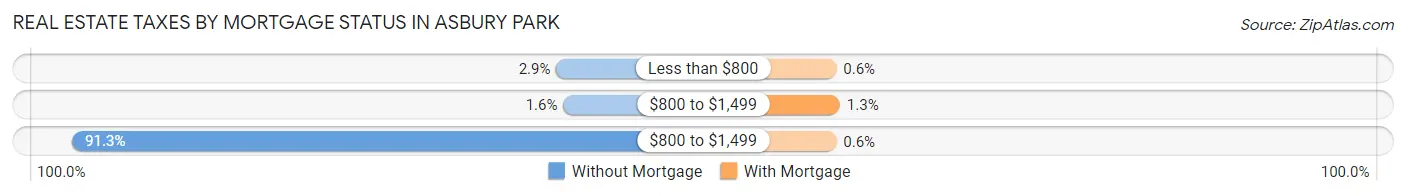
| Property Taxes | Without Mortgage | With Mortgage |
| Less than $800 | 18 (2.9%) | 10 (0.6%) |
| $800 to $1,499 | 10 (1.6%) | 21 (1.3%) |
| $800 to $1,499 | 568 (91.3%) | 10 (0.6%) |
| Total | 622 (100.0%) | 1,679 (100.0%) |
Health & Disability in Asbury Park
Health Insurance Coverage by Age in Asbury Park
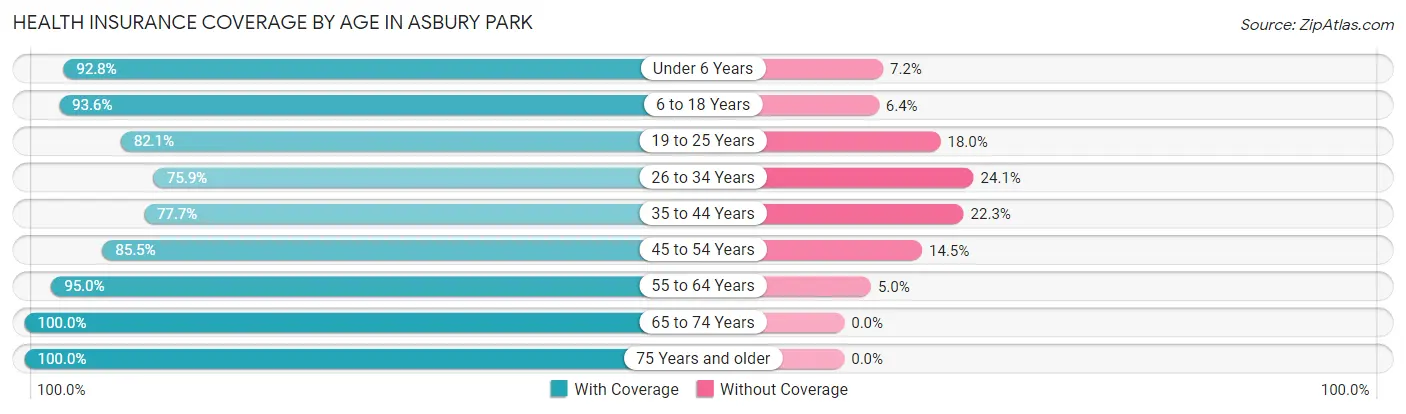
| Age Bracket | With Coverage | Without Coverage |
| Under 6 Years | 551 (92.8%) | 43 (7.2%) |
| 6 to 18 Years | 1,844 (93.6%) | 127 (6.4%) |
| 19 to 25 Years | 1,097 (82.1%) | 240 (17.9%) |
| 26 to 34 Years | 2,240 (75.9%) | 712 (24.1%) |
| 35 to 44 Years | 1,722 (77.7%) | 493 (22.3%) |
| 45 to 54 Years | 1,714 (85.5%) | 291 (14.5%) |
| 55 to 64 Years | 2,139 (95.0%) | 112 (5.0%) |
| 65 to 74 Years | 1,169 (100.0%) | 0 (0.0%) |
| 75 Years and older | 751 (100.0%) | 0 (0.0%) |
| Total | 13,227 (86.8%) | 2,018 (13.2%) |
Health Insurance Coverage by Citizenship Status in Asbury Park
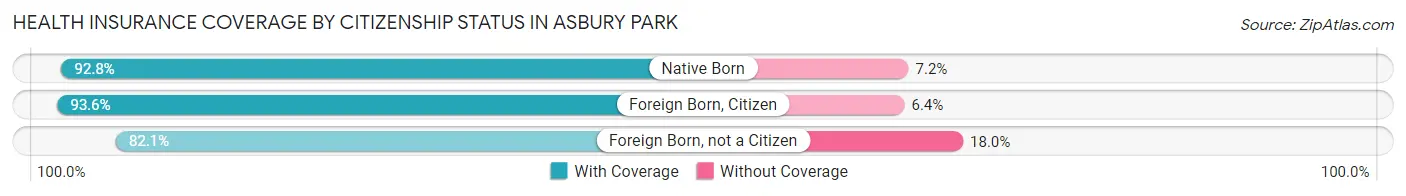
| Citizenship Status | With Coverage | Without Coverage |
| Native Born | 551 (92.8%) | 43 (7.2%) |
| Foreign Born, Citizen | 1,844 (93.6%) | 127 (6.4%) |
| Foreign Born, not a Citizen | 1,097 (82.1%) | 240 (17.9%) |
Health Insurance Coverage by Household Income in Asbury Park
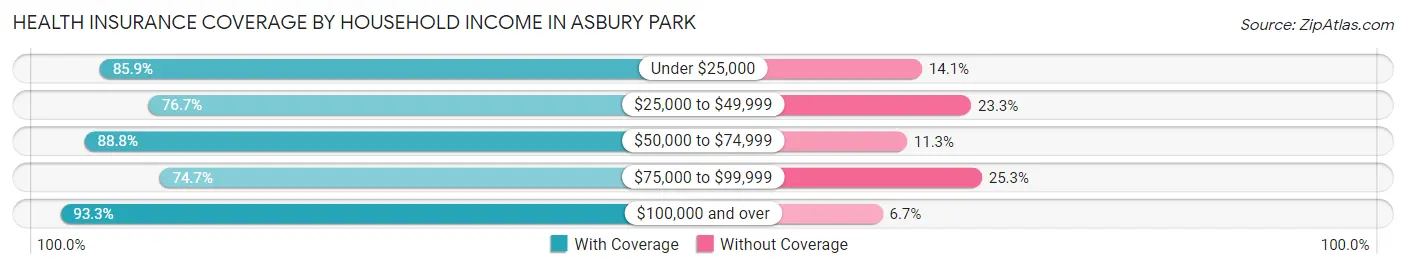
| Household Income | With Coverage | Without Coverage |
| Under $25,000 | 2,222 (85.9%) | 364 (14.1%) |
| $25,000 to $49,999 | 2,049 (76.7%) | 622 (23.3%) |
| $50,000 to $74,999 | 1,610 (88.7%) | 204 (11.3%) |
| $75,000 to $99,999 | 1,170 (74.7%) | 396 (25.3%) |
| $100,000 and over | 5,970 (93.3%) | 428 (6.7%) |
Public vs Private Health Insurance Coverage by Age in Asbury Park
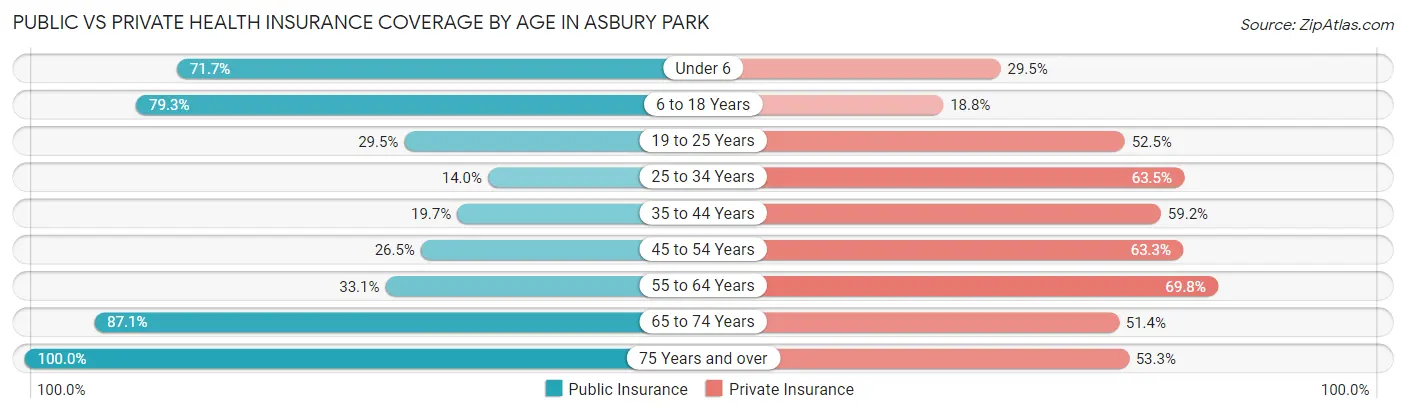
| Age Bracket | Public Insurance | Private Insurance |
| Under 6 | 426 (71.7%) | 175 (29.5%) |
| 6 to 18 Years | 1,563 (79.3%) | 371 (18.8%) |
| 19 to 25 Years | 395 (29.5%) | 702 (52.5%) |
| 25 to 34 Years | 414 (14.0%) | 1,874 (63.5%) |
| 35 to 44 Years | 437 (19.7%) | 1,312 (59.2%) |
| 45 to 54 Years | 531 (26.5%) | 1,269 (63.3%) |
| 55 to 64 Years | 744 (33.1%) | 1,570 (69.8%) |
| 65 to 74 Years | 1,018 (87.1%) | 601 (51.4%) |
| 75 Years and over | 751 (100.0%) | 400 (53.3%) |
| Total | 6,279 (41.2%) | 8,274 (54.3%) |
Disability Status by Sex by Age in Asbury Park
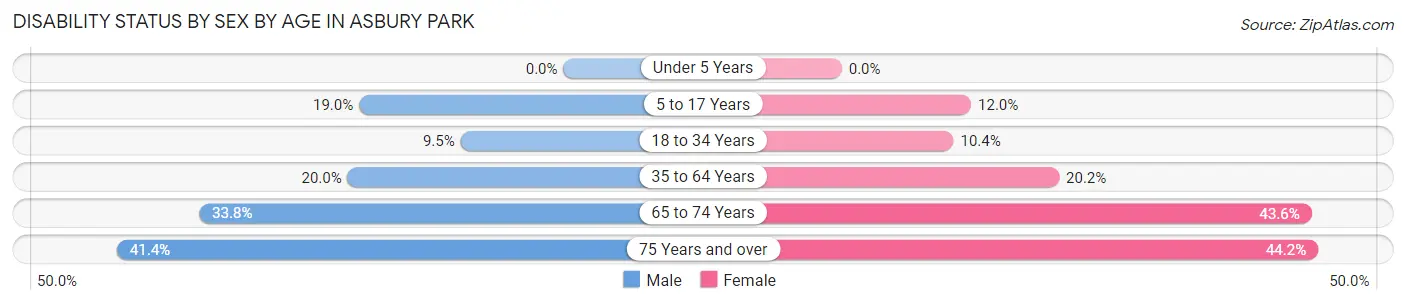
| Age Bracket | Male | Female |
| Under 5 Years | 0 (0.0%) | 0 (0.0%) |
| 5 to 17 Years | 175 (19.0%) | 105 (12.0%) |
| 18 to 34 Years | 231 (9.5%) | 221 (10.4%) |
| 35 to 64 Years | 612 (20.0%) | 689 (20.2%) |
| 65 to 74 Years | 168 (33.8%) | 293 (43.6%) |
| 75 Years and over | 58 (41.4%) | 270 (44.2%) |
Disability Class by Sex by Age in Asbury Park
Disability Class: Hearing Difficulty
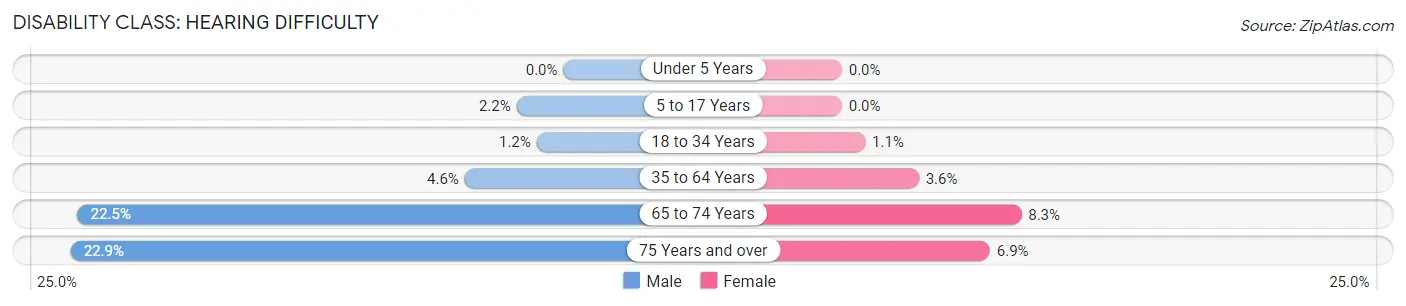
| Age Bracket | Male | Female |
| Under 5 Years | 0 (0.0%) | 0 (0.0%) |
| 5 to 17 Years | 20 (2.2%) | 0 (0.0%) |
| 18 to 34 Years | 30 (1.2%) | 23 (1.1%) |
| 35 to 64 Years | 140 (4.6%) | 122 (3.6%) |
| 65 to 74 Years | 112 (22.5%) | 56 (8.3%) |
| 75 Years and over | 32 (22.9%) | 42 (6.9%) |
Disability Class: Vision Difficulty
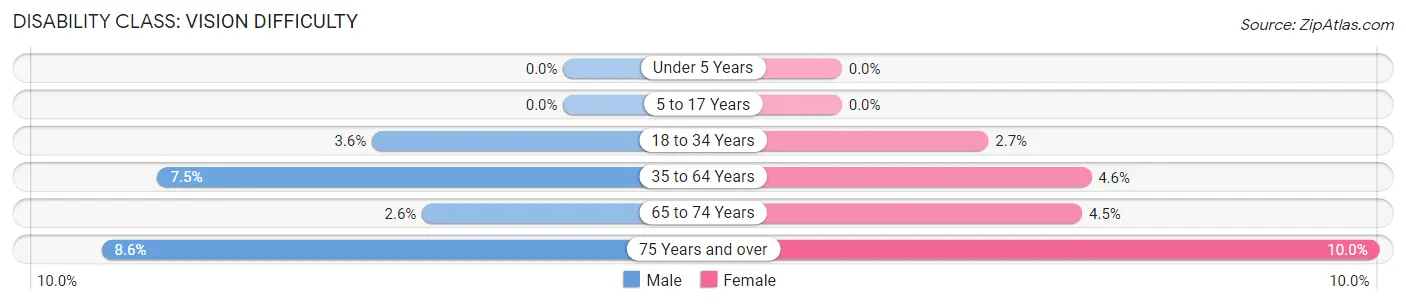
| Age Bracket | Male | Female |
| Under 5 Years | 0 (0.0%) | 0 (0.0%) |
| 5 to 17 Years | 0 (0.0%) | 0 (0.0%) |
| 18 to 34 Years | 86 (3.5%) | 58 (2.7%) |
| 35 to 64 Years | 230 (7.5%) | 158 (4.6%) |
| 65 to 74 Years | 13 (2.6%) | 30 (4.5%) |
| 75 Years and over | 12 (8.6%) | 61 (10.0%) |
Disability Class: Cognitive Difficulty
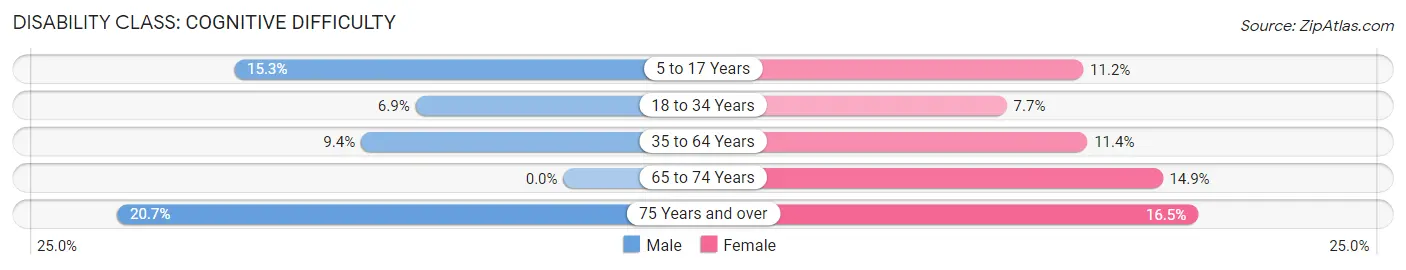
| Age Bracket | Male | Female |
| 5 to 17 Years | 141 (15.3%) | 98 (11.2%) |
| 18 to 34 Years | 166 (6.9%) | 163 (7.6%) |
| 35 to 64 Years | 287 (9.4%) | 389 (11.4%) |
| 65 to 74 Years | 0 (0.0%) | 100 (14.9%) |
| 75 Years and over | 29 (20.7%) | 101 (16.5%) |
Disability Class: Ambulatory Difficulty
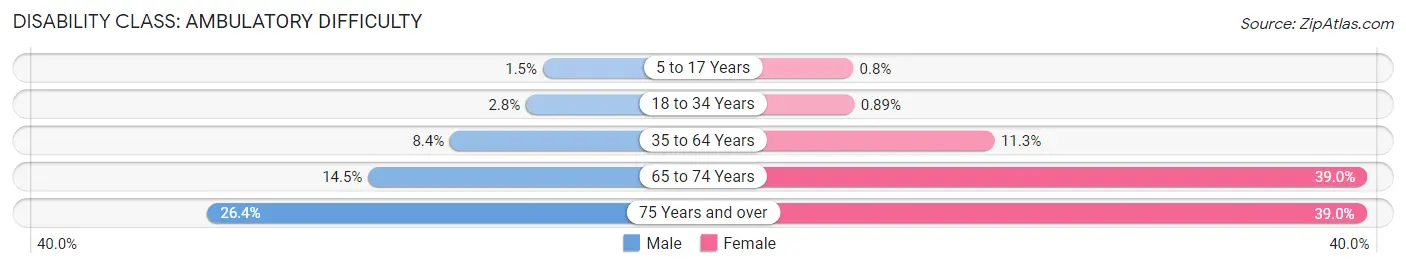
| Age Bracket | Male | Female |
| 5 to 17 Years | 14 (1.5%) | 7 (0.8%) |
| 18 to 34 Years | 67 (2.8%) | 19 (0.9%) |
| 35 to 64 Years | 257 (8.4%) | 386 (11.3%) |
| 65 to 74 Years | 72 (14.5%) | 262 (39.0%) |
| 75 Years and over | 37 (26.4%) | 238 (39.0%) |
Disability Class: Self-Care Difficulty
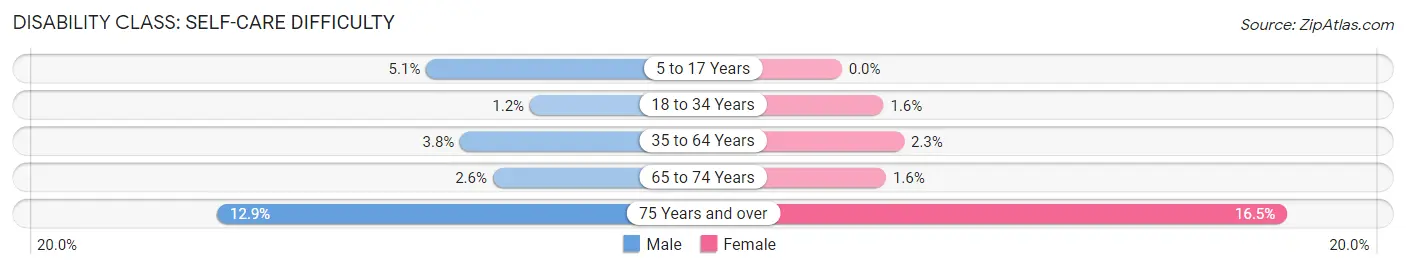
| Age Bracket | Male | Female |
| 5 to 17 Years | 47 (5.1%) | 0 (0.0%) |
| 18 to 34 Years | 30 (1.2%) | 33 (1.5%) |
| 35 to 64 Years | 117 (3.8%) | 79 (2.3%) |
| 65 to 74 Years | 13 (2.6%) | 11 (1.6%) |
| 75 Years and over | 18 (12.9%) | 101 (16.5%) |
Technology Access in Asbury Park
Computing Device Access in Asbury Park
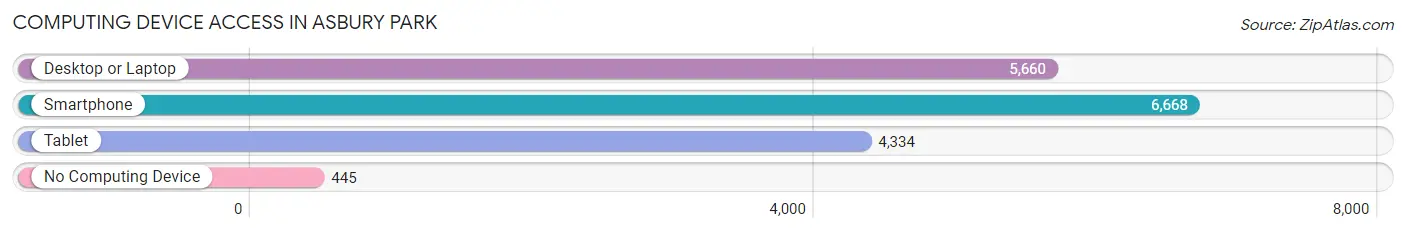
| Device Type | # Households | % Households |
| Desktop or Laptop | 5,660 | 75.7% |
| Smartphone | 6,668 | 89.2% |
| Tablet | 4,334 | 58.0% |
| No Computing Device | 445 | 5.9% |
| Total | 7,477 | 100.0% |
Internet Access in Asbury Park
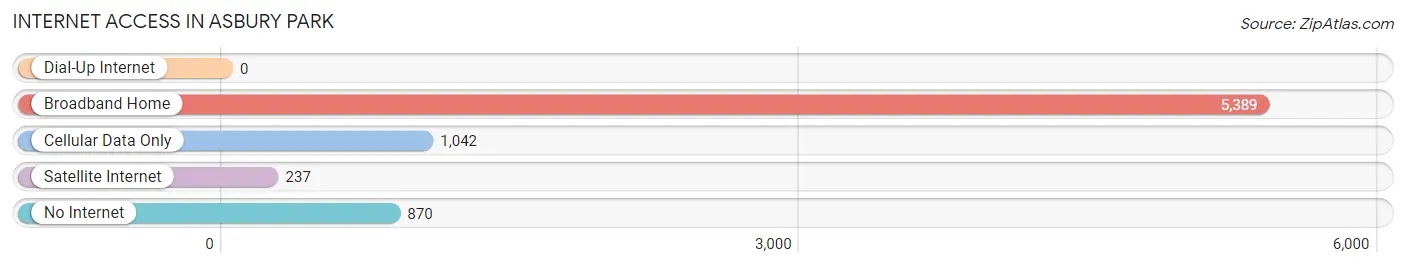
| Internet Type | # Households | % Households |
| Dial-Up Internet | 0 | 0.0% |
| Broadband Home | 5,389 | 72.1% |
| Cellular Data Only | 1,042 | 13.9% |
| Satellite Internet | 237 | 3.2% |
| No Internet | 870 | 11.6% |
| Total | 7,477 | 100.0% |
Asbury Park Summary
Asbury Park is a city located in Monmouth County, New Jersey, United States. It is situated along the Jersey Shore, between the Atlantic Ocean and the Navesink River. Asbury Park is known for its vibrant music and arts scene, and its boardwalk and beach. The city has a population of approximately 16,000 people, and is a popular tourist destination.
Geography
Asbury Park is located on the Atlantic Coast of New Jersey, between the Navesink River and the Atlantic Ocean. The city is situated on a barrier island, and is bordered by the towns of Neptune Township and Ocean Township. The city covers an area of 2.7 square miles, and has a population density of 5,945 people per square mile.
The city is divided into two distinct sections: the North End and the South End. The North End is the more affluent area of the city, and is home to many of the city’s historic buildings and attractions. The South End is the more residential area of the city, and is home to many of the city’s businesses and restaurants.
Climate
Asbury Park has a humid subtropical climate, with hot and humid summers and mild winters. The average temperature in the summer is around 75°F, and in the winter it is around 40°F. The city receives an average of 45 inches of precipitation per year, with the majority of it falling in the summer months.
Demographics
As of the 2010 census, the population of Asbury Park was 16,116. The racial makeup of the city was 54.3% White, 33.2% African American, 0.3% Native American, 2.2% Asian, 0.1% Pacific Islander, 7.2% from other races, and 2.7% from two or more races. Hispanic or Latino of any race were 15.2% of the population.
The median household income in Asbury Park was $37,945, and the median family income was $45,813. The per capita income for the city was $20,945. About 18.3% of the population was below the poverty line.
Economy
Asbury Park’s economy is largely based on tourism and the service industry. The city is home to many restaurants, bars, and shops, as well as a number of hotels and motels. The city also has a thriving music and arts scene, and is home to many music venues and art galleries.
The city is also home to a number of corporate headquarters, including the headquarters of the Monmouth County Board of Realtors, the Monmouth County Chamber of Commerce, and the Monmouth County Tourism Bureau.
History
Asbury Park was founded in 1871 by James A. Bradley, a real estate developer from New York City. The city was named after Francis Asbury, the first American bishop of the Methodist Episcopal Church.
The city quickly became a popular destination for vacationers, and by the early 1900s, it had become a major resort town. The city was home to many grand hotels, including the Berkeley-Carteret Hotel, the Asbury Park Casino, and the Asbury Park Pavilion.
In the 1950s, the city began to decline, as many of the grand hotels and resorts closed. The city’s economy was further hurt by the construction of the Garden State Parkway, which bypassed the city.
In the 1970s, the city began to experience a resurgence, as the city’s music and arts scene began to grow. The city is now home to many music venues, art galleries, and restaurants, and is a popular tourist destination.
Common Questions
What is Per Capita Income in Asbury Park?
Per Capita income in Asbury Park is $53,385.
What is the Median Family Income in Asbury Park?
Median Family Income in Asbury Park is $85,755.
What is the Median Household income in Asbury Park?
Median Household Income in Asbury Park is $63,461.
What is Income or Wage Gap in Asbury Park?
Income or Wage Gap in Asbury Park is 44.8%.
Women in Asbury Park earn 55.2 cents for every dollar earned by a man.
What is Family Income Deficit in Asbury Park?
Family Income Deficit in Asbury Park is $10,888.
Families that are below poverty line in Asbury Park earn $10,888 less on average than the poverty threshold level.
What is Inequality or Gini Index in Asbury Park?
Inequality or Gini Index in Asbury Park is 0.57.
What is the Total Population of Asbury Park?
Total Population of Asbury Park is 15,245.
What is the Total Male Population of Asbury Park?
Total Male Population of Asbury Park is 7,294.
What is the Total Female Population of Asbury Park?
Total Female Population of Asbury Park is 7,951.
What is the Ratio of Males per 100 Females in Asbury Park?
There are 91.74 Males per 100 Females in Asbury Park.
What is the Ratio of Females per 100 Males in Asbury Park?
There are 109.01 Females per 100 Males in Asbury Park.
What is the Median Population Age in Asbury Park?
Median Population Age in Asbury Park is 37.9 Years.
What is the Average Family Size in Asbury Park
Average Family Size in Asbury Park is 3.0 People.
What is the Average Household Size in Asbury Park
Average Household Size in Asbury Park is 2.0 People.
How Large is the Labor Force in Asbury Park?
There are 9,510 People in the Labor Forcein in Asbury Park.
What is the Percentage of People in the Labor Force in Asbury Park?
72.1% of People are in the Labor Force in Asbury Park.
What is the Unemployment Rate in Asbury Park?
Unemployment Rate in Asbury Park is 8.3%.