Mount Rainier, MD Map & Demographics
Mount Rainier Map
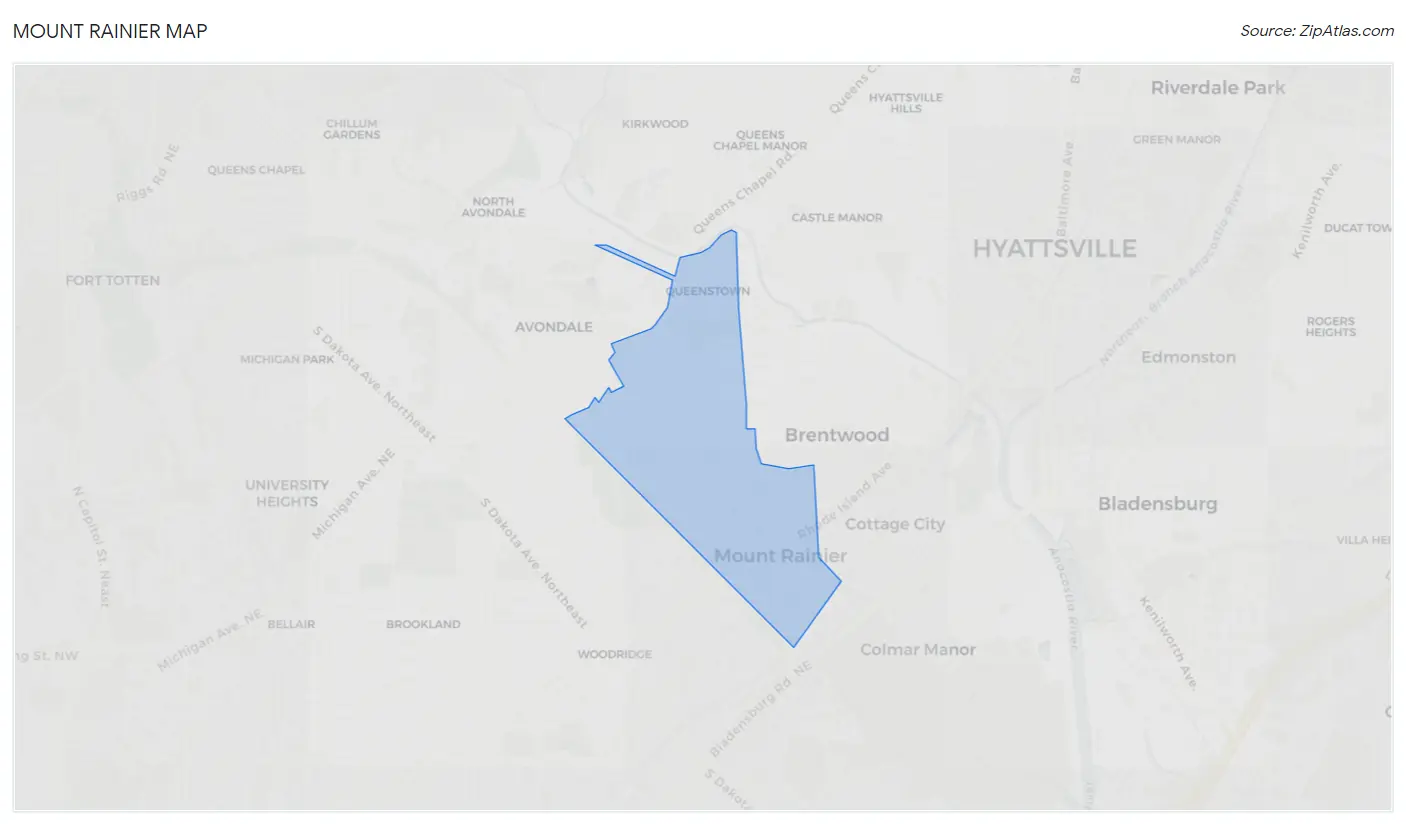
Mount Rainier Overview
$39,471
PER CAPITA INCOME
$83,688
AVG FAMILY INCOME
$64,170
AVG HOUSEHOLD INCOME
11.1%
WAGE / INCOME GAP [ % ]
88.9¢/ $1
WAGE / INCOME GAP [ $ ]
0.40
INEQUALITY / GINI INDEX
8,262
TOTAL POPULATION
4,034
MALE POPULATION
4,228
FEMALE POPULATION
95.41
MALES / 100 FEMALES
104.81
FEMALES / 100 MALES
40.5
MEDIAN AGE
3.0
AVG FAMILY SIZE
2.0
AVG HOUSEHOLD SIZE
5,253
LABOR FORCE [ PEOPLE ]
76.2%
PERCENT IN LABOR FORCE
4.4%
UNEMPLOYMENT RATE
Mount Rainier Zip Codes
Income in Mount Rainier
Income Overview in Mount Rainier
Per Capita Income in Mount Rainier is $39,471, while median incomes of families and households are $83,688 and $64,170 respectively.
| Characteristic | Number | Measure |
| Per Capita Income | 8,262 | $39,471 |
| Median Family Income | 1,894 | $83,688 |
| Mean Family Income | 1,894 | $105,024 |
| Median Household Income | 4,153 | $64,170 |
| Mean Household Income | 4,153 | $79,364 |
| Income Deficit | 1,894 | $0 |
| Wage / Income Gap (%) | 8,262 | 11.12% |
| Wage / Income Gap ($) | 8,262 | 88.88¢ per $1 |
| Gini / Inequality Index | 8,262 | 0.40 |
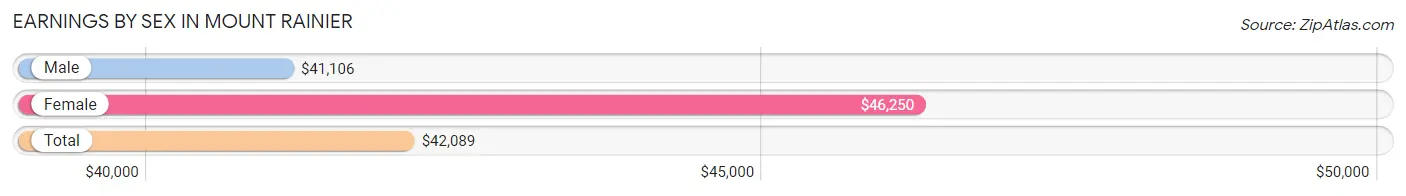
Earnings by Sex in Mount Rainier
Average Earnings in Mount Rainier are $42,089, $41,106 for men and $46,250 for women, a difference of 11.1%.
| Sex | Number | Average Earnings |
| Male | 2,697 (49.9%) | $41,106 |
| Female | 2,703 (50.1%) | $46,250 |
| Total | 5,400 (100.0%) | $42,089 |
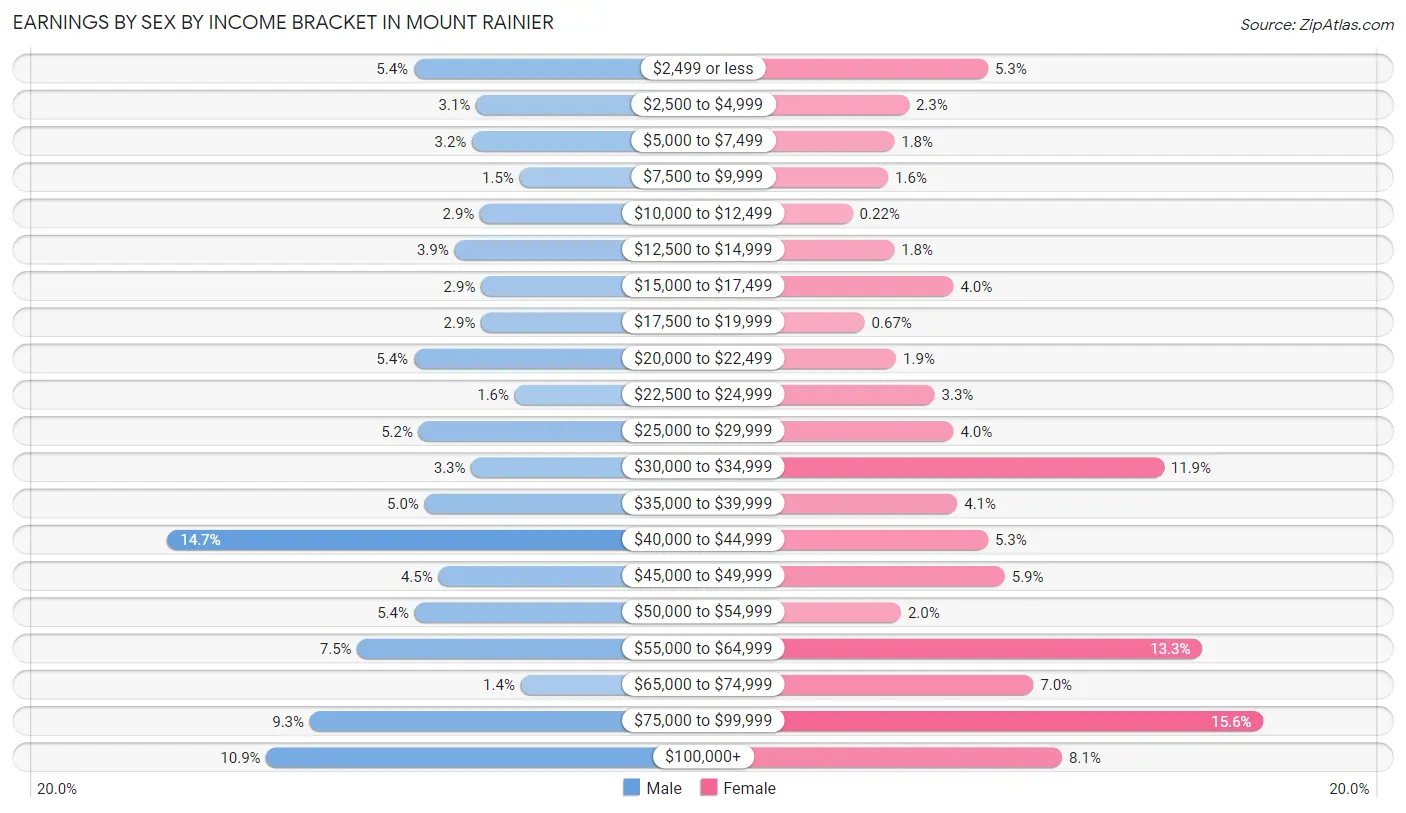
Earnings by Sex by Income Bracket in Mount Rainier
The most common earnings brackets in Mount Rainier are $40,000 to $44,999 for men (395 | 14.6%) and $75,000 to $99,999 for women (422 | 15.6%).
| Income | Male | Female |
| $2,499 or less | 146 (5.4%) | 143 (5.3%) |
| $2,500 to $4,999 | 83 (3.1%) | 63 (2.3%) |
| $5,000 to $7,499 | 87 (3.2%) | 48 (1.8%) |
| $7,500 to $9,999 | 39 (1.5%) | 42 (1.5%) |
| $10,000 to $12,499 | 79 (2.9%) | 6 (0.2%) |
| $12,500 to $14,999 | 105 (3.9%) | 48 (1.8%) |
| $15,000 to $17,499 | 78 (2.9%) | 108 (4.0%) |
| $17,500 to $19,999 | 78 (2.9%) | 18 (0.7%) |
| $20,000 to $22,499 | 146 (5.4%) | 50 (1.8%) |
| $22,500 to $24,999 | 44 (1.6%) | 89 (3.3%) |
| $25,000 to $29,999 | 141 (5.2%) | 108 (4.0%) |
| $30,000 to $34,999 | 88 (3.3%) | 321 (11.9%) |
| $35,000 to $39,999 | 135 (5.0%) | 112 (4.1%) |
| $40,000 to $44,999 | 395 (14.6%) | 143 (5.3%) |
| $45,000 to $49,999 | 121 (4.5%) | 160 (5.9%) |
| $50,000 to $54,999 | 145 (5.4%) | 55 (2.0%) |
| $55,000 to $64,999 | 203 (7.5%) | 360 (13.3%) |
| $65,000 to $74,999 | 38 (1.4%) | 189 (7.0%) |
| $75,000 to $99,999 | 251 (9.3%) | 422 (15.6%) |
| $100,000+ | 295 (10.9%) | 218 (8.1%) |
| Total | 2,697 (100.0%) | 2,703 (100.0%) |
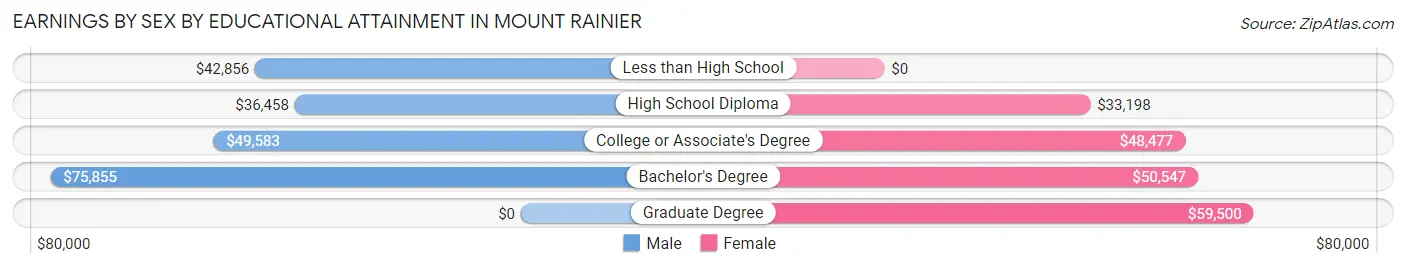
Earnings by Sex by Educational Attainment in Mount Rainier
Average earnings in Mount Rainier are $42,406 for men and $49,318 for women, a difference of 14.0%. Men with an educational attainment of bachelor's degree enjoy the highest average annual earnings of $75,855, while those with high school diploma education earn the least with $36,458. Women with an educational attainment of graduate degree earn the most with the average annual earnings of $59,500, while those with high school diploma education have the smallest earnings of $33,198.
| Educational Attainment | Male Income | Female Income |
| Less than High School | $42,856 | $0 |
| High School Diploma | $36,458 | $33,198 |
| College or Associate's Degree | $49,583 | $48,477 |
| Bachelor's Degree | $75,855 | $50,547 |
| Graduate Degree | - | - |
| Total | $42,406 | $49,318 |
Family Income in Mount Rainier
Family Income Brackets in Mount Rainier
According to the Mount Rainier family income data, there are 456 families falling into the $50,000 to $74,999 income range, which is the most common income bracket and makes up 24.1% of all families. Conversely, the $10,000 to $14,999 income bracket is the least frequent group with only 13 families (0.7%) belonging to this category.
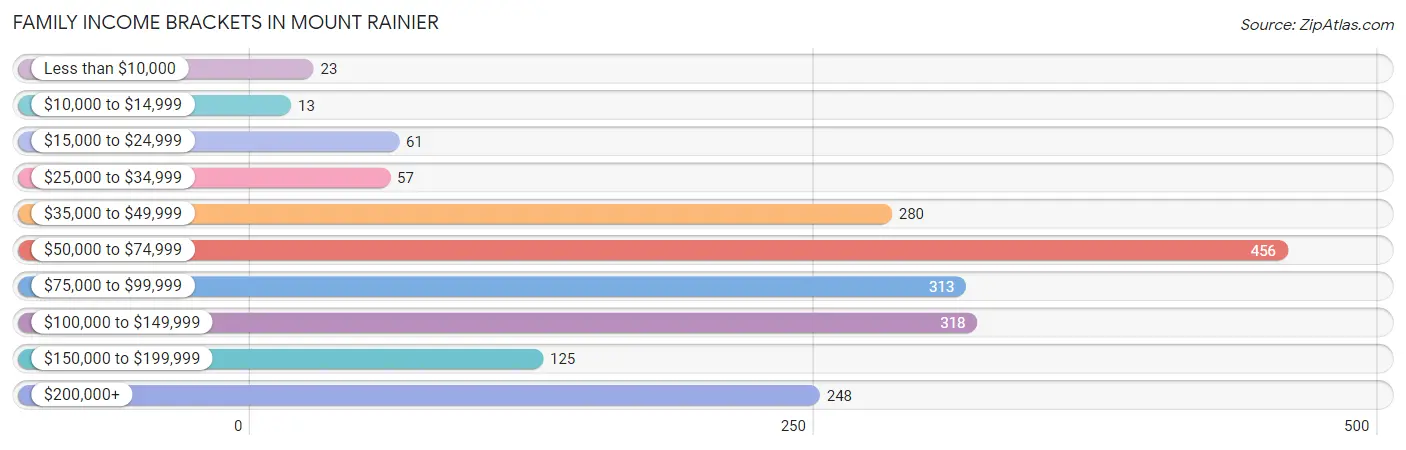
| Income Bracket | # Families | % Families |
| Less than $10,000 | 23 | 1.2% |
| $10,000 to $14,999 | 13 | 0.7% |
| $15,000 to $24,999 | 61 | 3.2% |
| $25,000 to $34,999 | 57 | 3.0% |
| $35,000 to $49,999 | 280 | 14.8% |
| $50,000 to $74,999 | 456 | 24.1% |
| $75,000 to $99,999 | 313 | 16.5% |
| $100,000 to $149,999 | 318 | 16.8% |
| $150,000 to $199,999 | 125 | 6.6% |
| $200,000+ | 248 | 13.1% |
Family Income by Famaliy Size in Mount Rainier
3-person families (623 | 32.9%) account for the highest median family income in Mount Rainier with $98,798 per family, while 2-person families (808 | 42.7%) have the highest median income of $38,334 per family member.
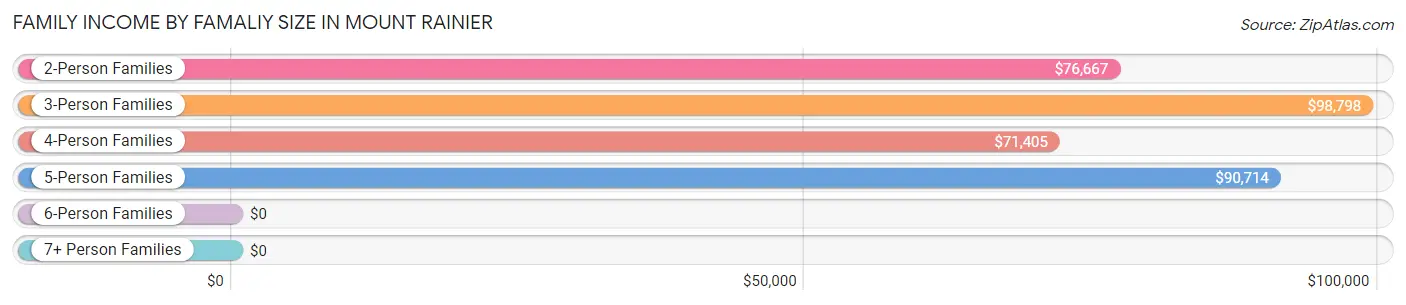
| Income Bracket | # Families | Median Income |
| 2-Person Families | 808 (42.7%) | $76,667 |
| 3-Person Families | 623 (32.9%) | $98,798 |
| 4-Person Families | 233 (12.3%) | $71,405 |
| 5-Person Families | 194 (10.2%) | $90,714 |
| 6-Person Families | 0 (0.0%) | $0 |
| 7+ Person Families | 36 (1.9%) | $0 |
| Total | 1,894 (100.0%) | $83,688 |
Family Income by Number of Earners in Mount Rainier
The median family income in Mount Rainier is $83,688, with families comprising 2 earners (951) having the highest median family income of $91,929, while families with no earners (146) have the lowest median family income of $48,019, accounting for 50.2% and 7.7% of families, respectively.
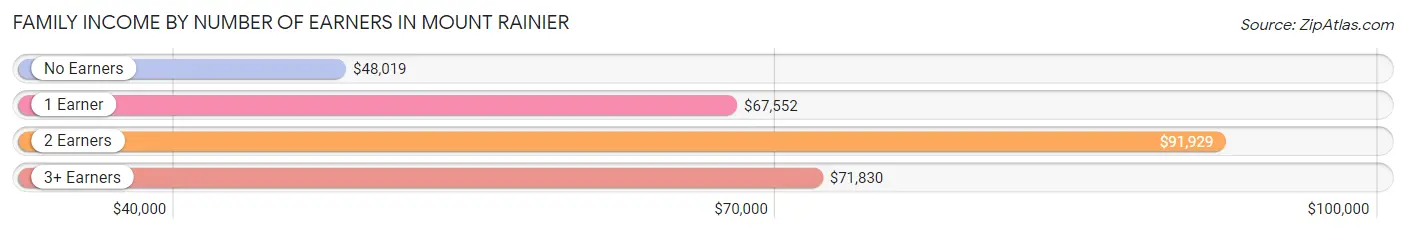
| Number of Earners | # Families | Median Income |
| No Earners | 146 (7.7%) | $48,019 |
| 1 Earner | 525 (27.7%) | $67,552 |
| 2 Earners | 951 (50.2%) | $91,929 |
| 3+ Earners | 272 (14.4%) | $71,830 |
| Total | 1,894 (100.0%) | $83,688 |
Household Income in Mount Rainier
Household Income Brackets in Mount Rainier
With 1,250 households falling in the category, the $50,000 to $74,999 income range is the most frequent in Mount Rainier, accounting for 30.1% of all households. In contrast, only 79 households (1.9%) fall into the $10,000 to $14,999 income bracket, making it the least populous group.
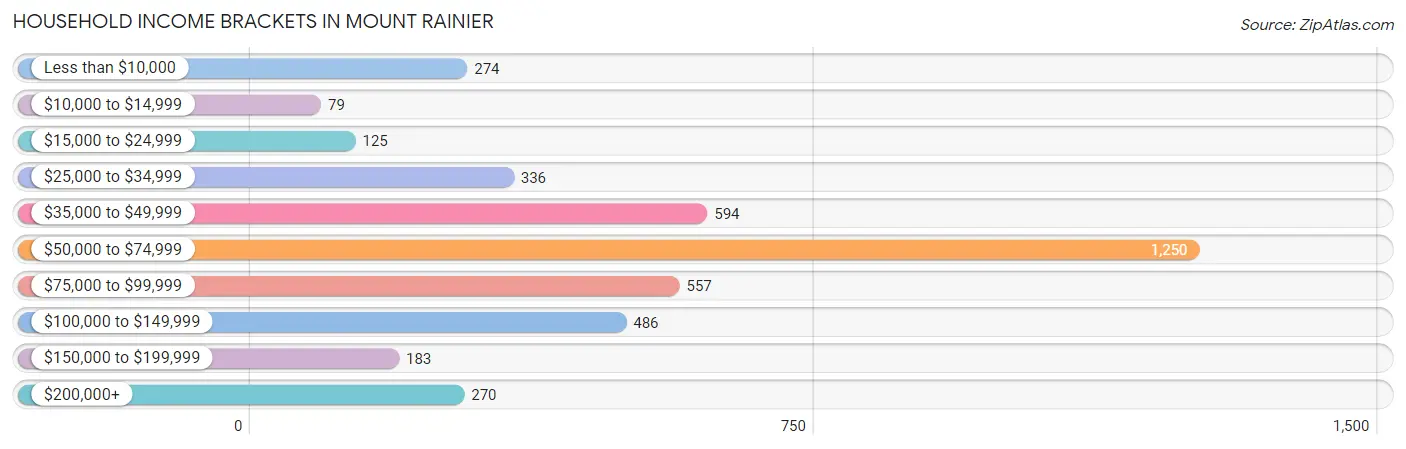
| Income Bracket | # Households | % Households |
| Less than $10,000 | 274 | 6.6% |
| $10,000 to $14,999 | 79 | 1.9% |
| $15,000 to $24,999 | 125 | 3.0% |
| $25,000 to $34,999 | 336 | 8.1% |
| $35,000 to $49,999 | 594 | 14.3% |
| $50,000 to $74,999 | 1,250 | 30.1% |
| $75,000 to $99,999 | 557 | 13.4% |
| $100,000 to $149,999 | 486 | 11.7% |
| $150,000 to $199,999 | 183 | 4.4% |
| $200,000+ | 270 | 6.5% |
Household Income by Householder Age in Mount Rainier
The median household income in Mount Rainier is $64,170, with the highest median household income of $68,160 found in the 25 to 44 years age bracket for the primary householder. A total of 1,622 households (39.1%) fall into this category. Meanwhile, the 15 to 24 years age bracket for the primary householder has the lowest median household income of $57,861, with 149 households (3.6%) in this group.
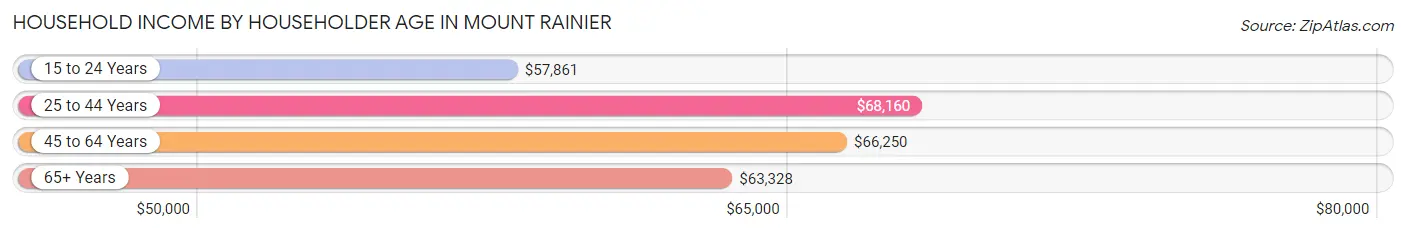
| Income Bracket | # Households | Median Income |
| 15 to 24 Years | 149 (3.6%) | $57,861 |
| 25 to 44 Years | 1,622 (39.1%) | $68,160 |
| 45 to 64 Years | 1,527 (36.8%) | $66,250 |
| 65+ Years | 855 (20.6%) | $63,328 |
| Total | 4,153 (100.0%) | $64,170 |
Poverty in Mount Rainier
Income Below Poverty by Sex and Age in Mount Rainier
With 5.8% poverty level for males and 8.5% for females among the residents of Mount Rainier, 35 to 44 year old males and 75 year old and over females are the most vulnerable to poverty, with 102 males (12.6%) and 32 females (19.2%) in their respective age groups living below the poverty level.
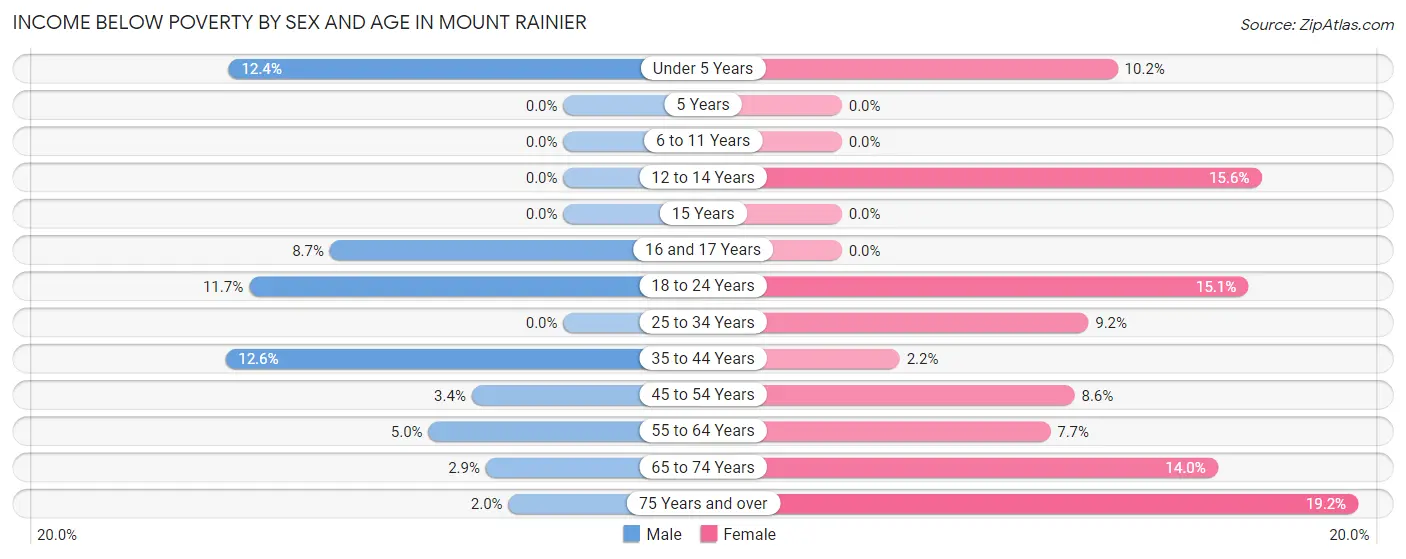
| Age Bracket | Male | Female |
| Under 5 Years | 23 (12.4%) | 30 (10.2%) |
| 5 Years | 0 (0.0%) | 0 (0.0%) |
| 6 to 11 Years | 0 (0.0%) | 0 (0.0%) |
| 12 to 14 Years | 0 (0.0%) | 26 (15.6%) |
| 15 Years | 0 (0.0%) | 0 (0.0%) |
| 16 and 17 Years | 13 (8.7%) | 0 (0.0%) |
| 18 to 24 Years | 28 (11.7%) | 49 (15.1%) |
| 25 to 34 Years | 0 (0.0%) | 58 (9.1%) |
| 35 to 44 Years | 102 (12.6%) | 16 (2.1%) |
| 45 to 54 Years | 14 (3.4%) | 47 (8.6%) |
| 55 to 64 Years | 37 (5.0%) | 51 (7.7%) |
| 65 to 74 Years | 15 (2.9%) | 47 (14.0%) |
| 75 Years and over | 1 (2.0%) | 32 (19.2%) |
| Total | 233 (5.8%) | 356 (8.5%) |
Income Above Poverty by Sex and Age in Mount Rainier
According to the poverty statistics in Mount Rainier, males aged 5 years and females aged 5 years are the age groups that are most secure financially, with 100.0% of males and 100.0% of females in these age groups living above the poverty line.
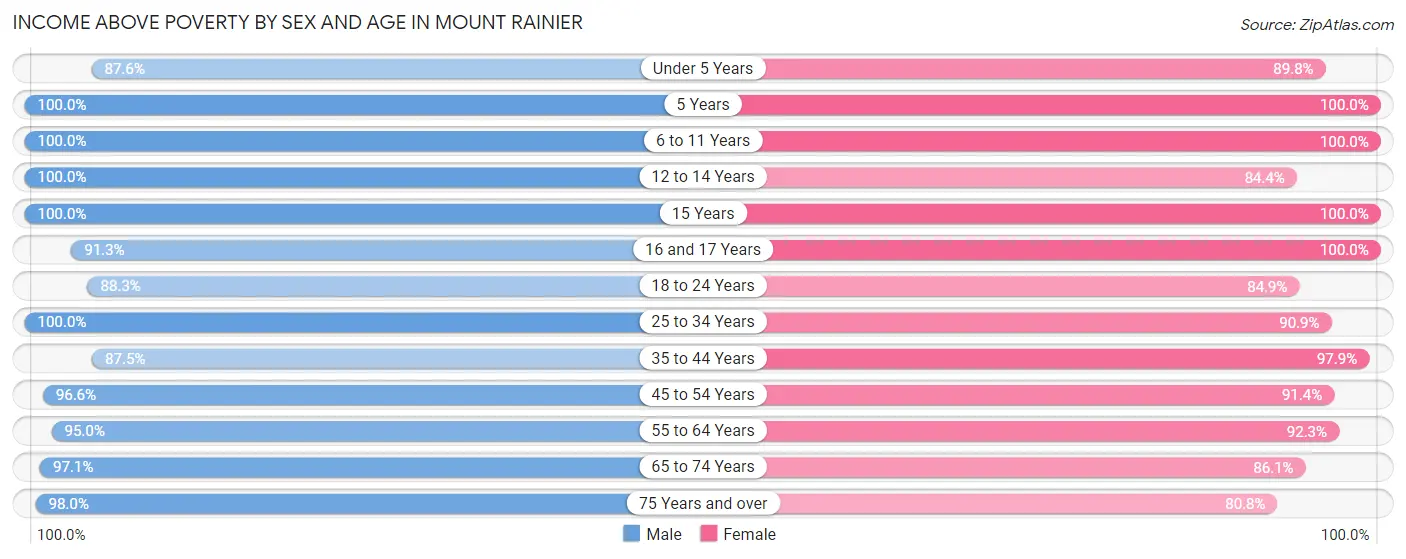
| Age Bracket | Male | Female |
| Under 5 Years | 162 (87.6%) | 263 (89.8%) |
| 5 Years | 17 (100.0%) | 25 (100.0%) |
| 6 to 11 Years | 318 (100.0%) | 149 (100.0%) |
| 12 to 14 Years | 91 (100.0%) | 141 (84.4%) |
| 15 Years | 29 (100.0%) | 56 (100.0%) |
| 16 and 17 Years | 137 (91.3%) | 90 (100.0%) |
| 18 to 24 Years | 212 (88.3%) | 276 (84.9%) |
| 25 to 34 Years | 471 (100.0%) | 576 (90.8%) |
| 35 to 44 Years | 711 (87.5%) | 728 (97.9%) |
| 45 to 54 Years | 398 (96.6%) | 497 (91.4%) |
| 55 to 64 Years | 701 (95.0%) | 608 (92.3%) |
| 65 to 74 Years | 506 (97.1%) | 290 (86.1%) |
| 75 Years and over | 48 (98.0%) | 135 (80.8%) |
| Total | 3,801 (94.2%) | 3,834 (91.5%) |
Income Below Poverty Among Married-Couple Families in Mount Rainier
The poverty statistics for married-couple families in Mount Rainier show that 0.9% or 13 of the total 1,430 families live below the poverty line. Families with 1 or 2 children have the highest poverty rate of 2.4%, comprising of 13 families. On the other hand, families with no children have the lowest poverty rate of 0.0%, which includes 0 families.
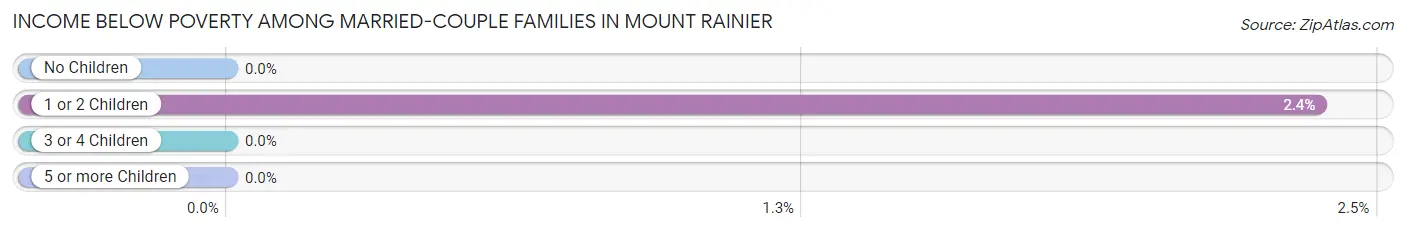
| Children | Above Poverty | Below Poverty |
| No Children | 794 (100.0%) | 0 (0.0%) |
| 1 or 2 Children | 536 (97.6%) | 13 (2.4%) |
| 3 or 4 Children | 87 (100.0%) | 0 (0.0%) |
| 5 or more Children | 0 (0.0%) | 0 (0.0%) |
| Total | 1,417 (99.1%) | 13 (0.9%) |
Income Below Poverty Among Single-Parent Households in Mount Rainier
According to the poverty data in Mount Rainier, 18.4% or 16 single-father households and 12.2% or 46 single-mother households are living below the poverty line. Among single-father households, those with 1 or 2 children have the highest poverty rate, with 16 households (25.0%) experiencing poverty. Likewise, among single-mother households, those with 1 or 2 children have the highest poverty rate, with 28 households (15.5%) falling below the poverty line.
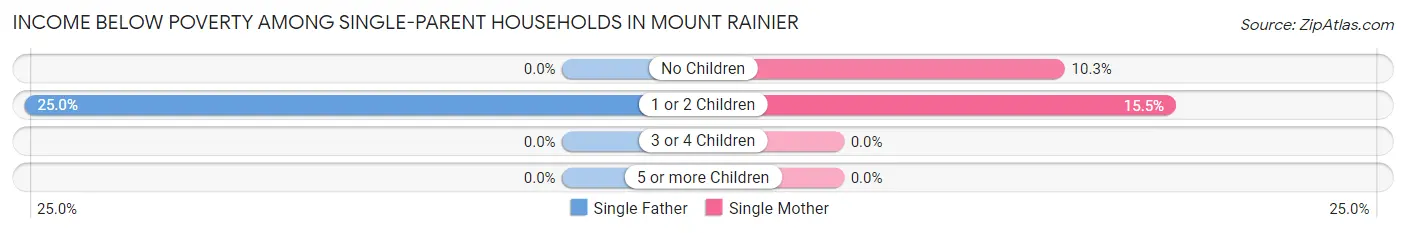
| Children | Single Father | Single Mother |
| No Children | 0 (0.0%) | 18 (10.3%) |
| 1 or 2 Children | 16 (25.0%) | 28 (15.5%) |
| 3 or 4 Children | 0 (0.0%) | 0 (0.0%) |
| 5 or more Children | 0 (0.0%) | 0 (0.0%) |
| Total | 16 (18.4%) | 46 (12.2%) |
Income Below Poverty Among Married-Couple vs Single-Parent Households in Mount Rainier
The poverty data for Mount Rainier shows that 13 of the married-couple family households (0.9%) and 62 of the single-parent households (13.4%) are living below the poverty level. Within the married-couple family households, those with 1 or 2 children have the highest poverty rate, with 13 households (2.4%) falling below the poverty line. Among the single-parent households, those with 1 or 2 children have the highest poverty rate, with 44 household (18.0%) living below poverty.
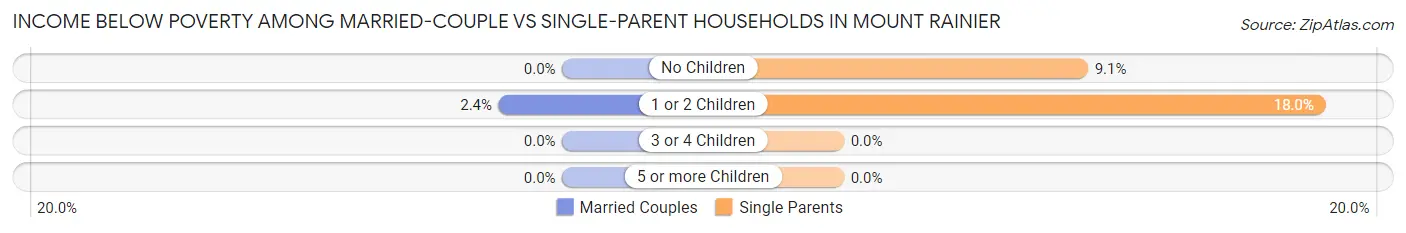
| Children | Married-Couple Families | Single-Parent Households |
| No Children | 0 (0.0%) | 18 (9.1%) |
| 1 or 2 Children | 13 (2.4%) | 44 (18.0%) |
| 3 or 4 Children | 0 (0.0%) | 0 (0.0%) |
| 5 or more Children | 0 (0.0%) | 0 (0.0%) |
| Total | 13 (0.9%) | 62 (13.4%) |
Race in Mount Rainier
The most populous races in Mount Rainier are Black / African American (3,517 | 42.6%), Hispanic or Latino (2,751 | 33.3%), and Some other Race (2,151 | 26.0%).
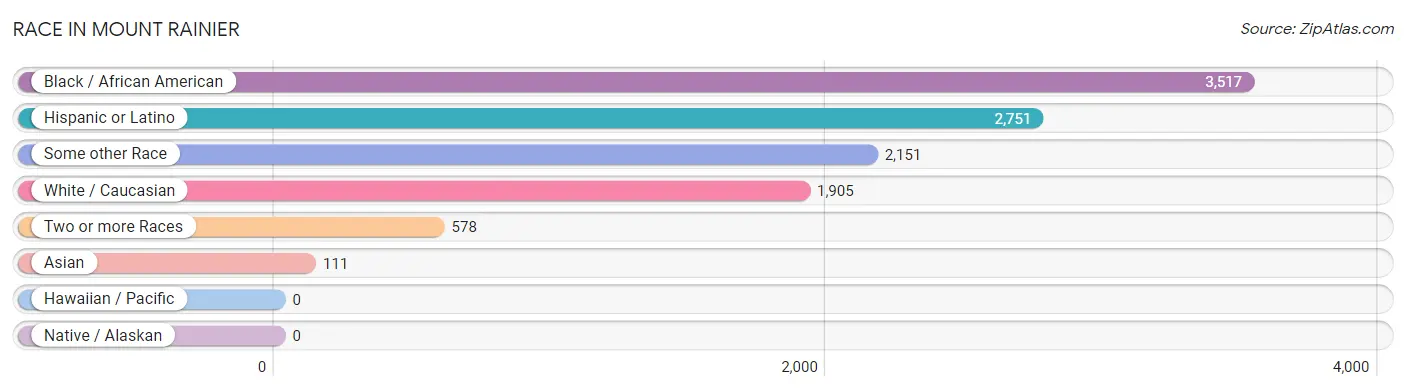
| Race | # Population | % Population |
| Asian | 111 | 1.3% |
| Black / African American | 3,517 | 42.6% |
| Hawaiian / Pacific | 0 | 0.0% |
| Hispanic or Latino | 2,751 | 33.3% |
| Native / Alaskan | 0 | 0.0% |
| White / Caucasian | 1,905 | 23.1% |
| Two or more Races | 578 | 7.0% |
| Some other Race | 2,151 | 26.0% |
| Total | 8,262 | 100.0% |
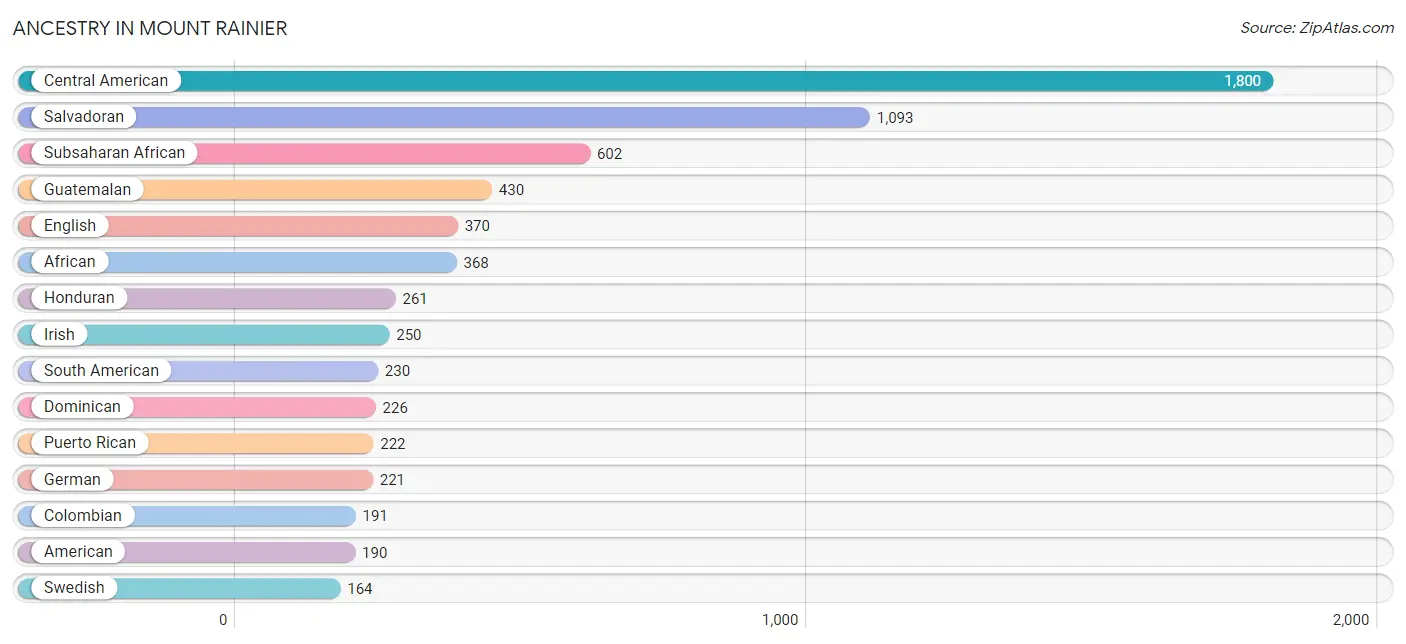
Ancestry in Mount Rainier
The most populous ancestries reported in Mount Rainier are Central American (1,800 | 21.8%), Salvadoran (1,093 | 13.2%), Subsaharan African (602 | 7.3%), Guatemalan (430 | 5.2%), and English (370 | 4.5%), together accounting for 52.0% of all Mount Rainier residents.
| Ancestry | # Population | % Population |
| African | 368 | 4.4% |
| American | 190 | 2.3% |
| Belgian | 50 | 0.6% |
| Bhutanese | 12 | 0.2% |
| Central American | 1,800 | 21.8% |
| Colombian | 191 | 2.3% |
| Costa Rican | 16 | 0.2% |
| Croatian | 14 | 0.2% |
| Danish | 6 | 0.1% |
| Dominican | 226 | 2.7% |
| Dutch | 55 | 0.7% |
| Dutch West Indian | 10 | 0.1% |
| Eastern European | 46 | 0.6% |
| Ecuadorian | 13 | 0.2% |
| English | 370 | 4.5% |
| Ethiopian | 35 | 0.4% |
| European | 26 | 0.3% |
| Filipino | 3 | 0.0% |
| Finnish | 12 | 0.2% |
| French | 37 | 0.4% |
| German | 221 | 2.7% |
| Greek | 46 | 0.6% |
| Guatemalan | 430 | 5.2% |
| Haitian | 16 | 0.2% |
| Honduran | 261 | 3.2% |
| Irish | 250 | 3.0% |
| Italian | 30 | 0.4% |
| Jamaican | 60 | 0.7% |
| Kenyan | 16 | 0.2% |
| Korean | 92 | 1.1% |
| Liberian | 54 | 0.6% |
| Lithuanian | 139 | 1.7% |
| Mexican | 102 | 1.2% |
| Nigerian | 41 | 0.5% |
| Norwegian | 76 | 0.9% |
| Peruvian | 26 | 0.3% |
| Polish | 137 | 1.7% |
| Puerto Rican | 222 | 2.7% |
| Russian | 53 | 0.6% |
| Salvadoran | 1,093 | 13.2% |
| Scotch-Irish | 18 | 0.2% |
| Scottish | 70 | 0.9% |
| Sierra Leonean | 18 | 0.2% |
| Slavic | 18 | 0.2% |
| South American | 230 | 2.8% |
| Spaniard | 43 | 0.5% |
| Sri Lankan | 28 | 0.3% |
| Subsaharan African | 602 | 7.3% |
| Swedish | 164 | 2.0% |
| Thai | 74 | 0.9% |
| Trinidadian and Tobagonian | 109 | 1.3% |
| Ukrainian | 38 | 0.5% |
| Welsh | 15 | 0.2% |
| West Indian | 40 | 0.5% | View All 54 Rows |
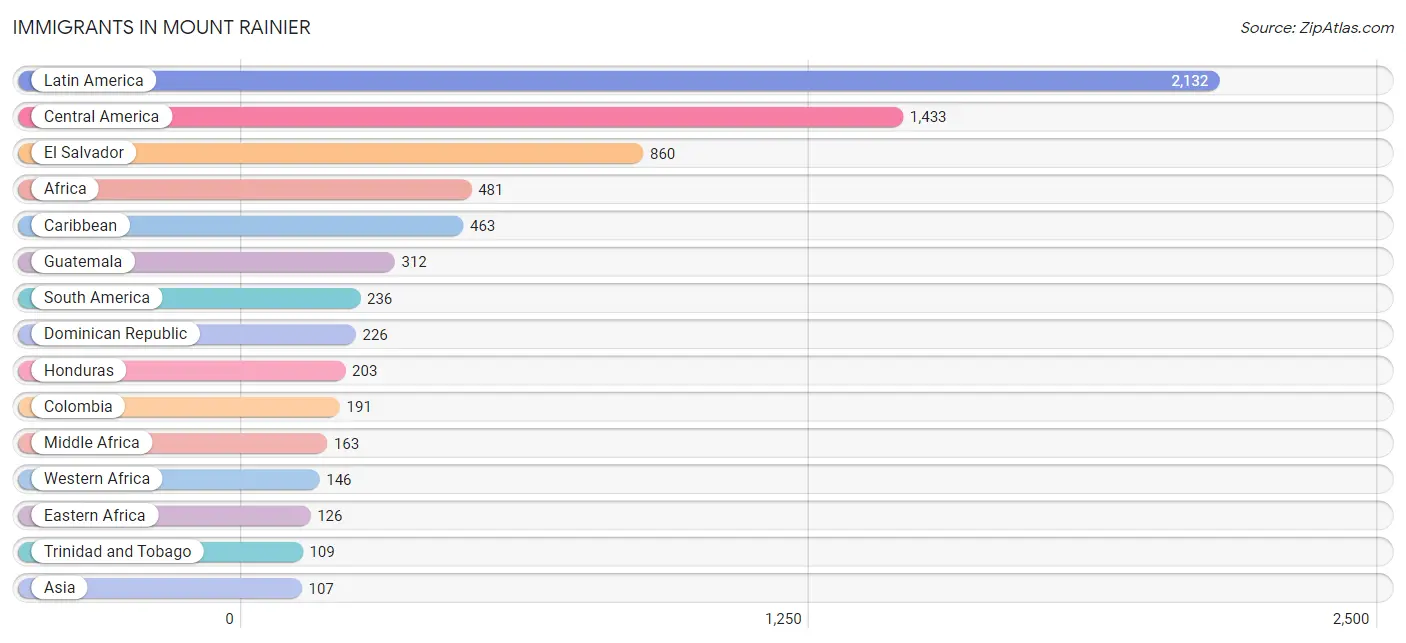
Immigrants in Mount Rainier
The most numerous immigrant groups reported in Mount Rainier came from Latin America (2,132 | 25.8%), Central America (1,433 | 17.3%), El Salvador (860 | 10.4%), Africa (481 | 5.8%), and Caribbean (463 | 5.6%), together accounting for 65.0% of all Mount Rainier residents.
| Immigration Origin | # Population | % Population |
| Africa | 481 | 5.8% |
| Asia | 107 | 1.3% |
| Barbados | 15 | 0.2% |
| Belgium | 12 | 0.2% |
| Brazil | 16 | 0.2% |
| Cameroon | 80 | 1.0% |
| Canada | 11 | 0.1% |
| Caribbean | 463 | 5.6% |
| Central America | 1,433 | 17.3% |
| Colombia | 191 | 2.3% |
| Costa Rica | 8 | 0.1% |
| Dominican Republic | 226 | 2.7% |
| Eastern Africa | 126 | 1.5% |
| Eastern Asia | 15 | 0.2% |
| Ecuador | 13 | 0.2% |
| El Salvador | 860 | 10.4% |
| Eritrea | 50 | 0.6% |
| Ethiopia | 31 | 0.4% |
| Europe | 65 | 0.8% |
| Germany | 10 | 0.1% |
| Ghana | 17 | 0.2% |
| Grenada | 59 | 0.7% |
| Guatemala | 312 | 3.8% |
| Haiti | 16 | 0.2% |
| Honduras | 203 | 2.5% |
| India | 13 | 0.2% |
| Jamaica | 38 | 0.5% |
| Japan | 15 | 0.2% |
| Kenya | 45 | 0.5% |
| Latin America | 2,132 | 25.8% |
| Liberia | 37 | 0.4% |
| Mexico | 50 | 0.6% |
| Middle Africa | 163 | 2.0% |
| Nigeria | 13 | 0.2% |
| Pakistan | 12 | 0.2% |
| Peru | 16 | 0.2% |
| Philippines | 36 | 0.4% |
| Sierra Leone | 79 | 1.0% |
| South America | 236 | 2.9% |
| South Central Asia | 25 | 0.3% |
| South Eastern Asia | 56 | 0.7% |
| Southern Europe | 43 | 0.5% |
| Spain | 43 | 0.5% |
| Trinidad and Tobago | 109 | 1.3% |
| Vietnam | 20 | 0.2% |
| Western Africa | 146 | 1.8% |
| Western Asia | 11 | 0.1% |
| Western Europe | 22 | 0.3% | View All 48 Rows |
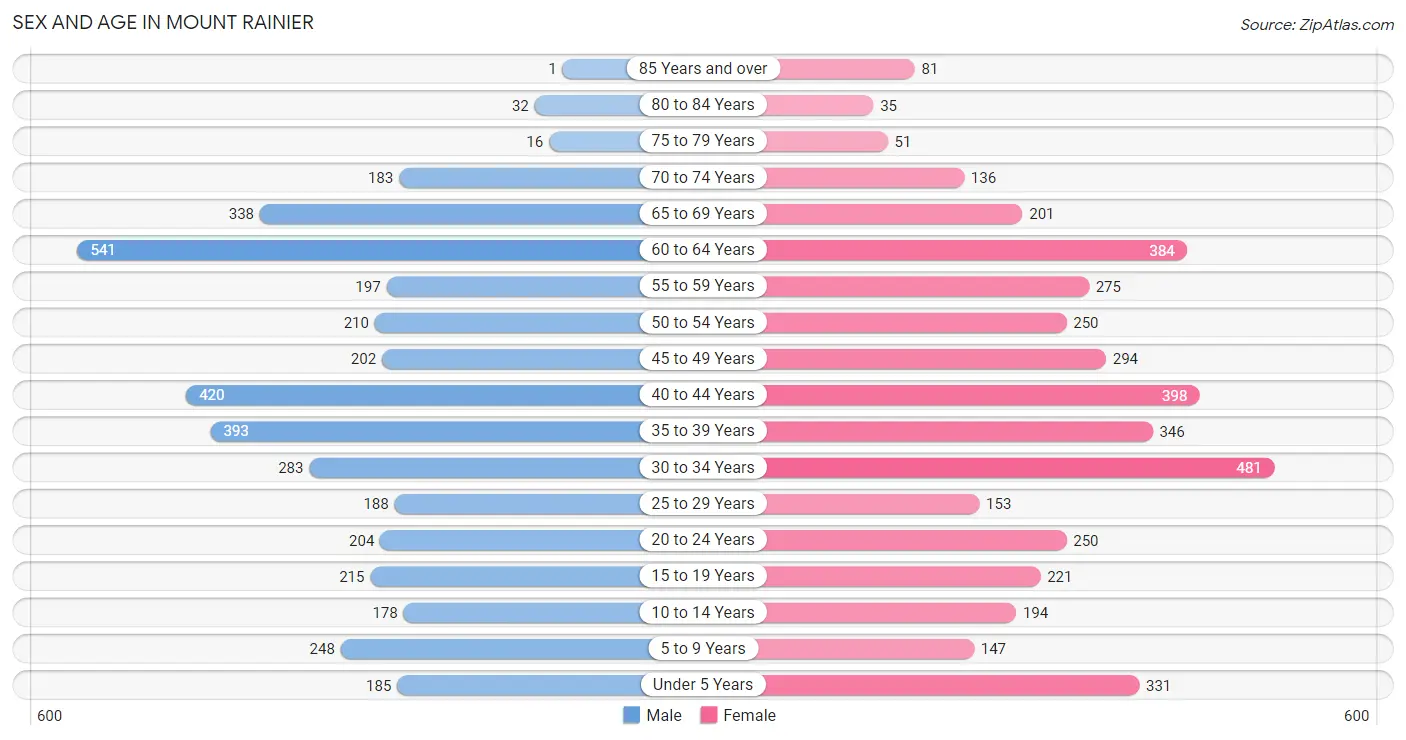
Sex and Age in Mount Rainier
Sex and Age in Mount Rainier
The most populous age groups in Mount Rainier are 60 to 64 Years (541 | 13.4%) for men and 30 to 34 Years (481 | 11.4%) for women.
| Age Bracket | Male | Female |
| Under 5 Years | 185 (4.6%) | 331 (7.8%) |
| 5 to 9 Years | 248 (6.1%) | 147 (3.5%) |
| 10 to 14 Years | 178 (4.4%) | 194 (4.6%) |
| 15 to 19 Years | 215 (5.3%) | 221 (5.2%) |
| 20 to 24 Years | 204 (5.1%) | 250 (5.9%) |
| 25 to 29 Years | 188 (4.7%) | 153 (3.6%) |
| 30 to 34 Years | 283 (7.0%) | 481 (11.4%) |
| 35 to 39 Years | 393 (9.7%) | 346 (8.2%) |
| 40 to 44 Years | 420 (10.4%) | 398 (9.4%) |
| 45 to 49 Years | 202 (5.0%) | 294 (7.0%) |
| 50 to 54 Years | 210 (5.2%) | 250 (5.9%) |
| 55 to 59 Years | 197 (4.9%) | 275 (6.5%) |
| 60 to 64 Years | 541 (13.4%) | 384 (9.1%) |
| 65 to 69 Years | 338 (8.4%) | 201 (4.8%) |
| 70 to 74 Years | 183 (4.5%) | 136 (3.2%) |
| 75 to 79 Years | 16 (0.4%) | 51 (1.2%) |
| 80 to 84 Years | 32 (0.8%) | 35 (0.8%) |
| 85 Years and over | 1 (0.0%) | 81 (1.9%) |
| Total | 4,034 (100.0%) | 4,228 (100.0%) |
Families and Households in Mount Rainier
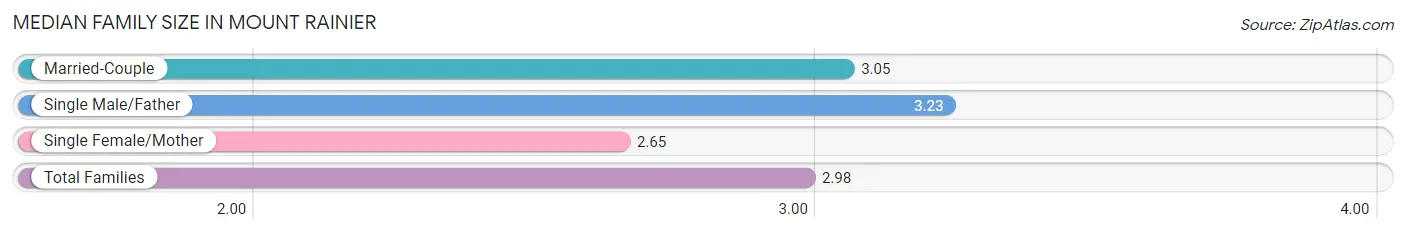
Median Family Size in Mount Rainier
The median family size in Mount Rainier is 2.98 persons per family, with single male/father families (87 | 4.6%) accounting for the largest median family size of 3.23 persons per family. On the other hand, single female/mother families (377 | 19.9%) represent the smallest median family size with 2.65 persons per family.
| Family Type | # Families | Family Size |
| Married-Couple | 1,430 (75.5%) | 3.05 |
| Single Male/Father | 87 (4.6%) | 3.23 |
| Single Female/Mother | 377 (19.9%) | 2.65 |
| Total Families | 1,894 (100.0%) | 2.98 |
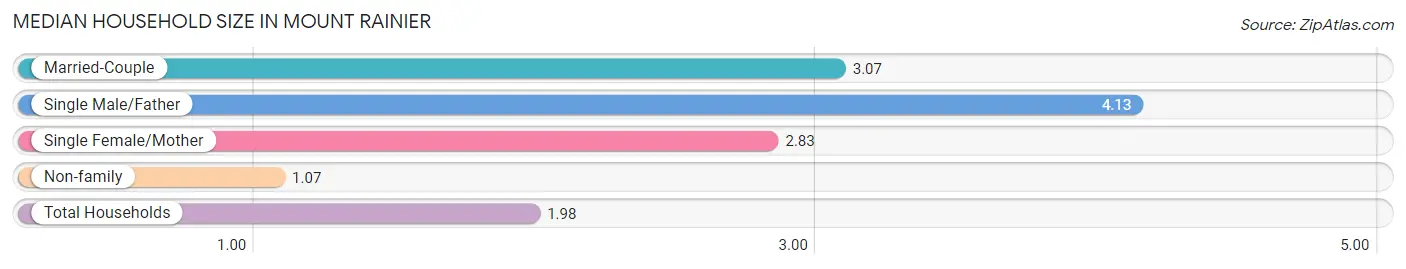
Median Household Size in Mount Rainier
The median household size in Mount Rainier is 1.98 persons per household, with single male/father households (87 | 2.1%) accounting for the largest median household size of 4.13 persons per household. non-family households (2,259 | 54.4%) represent the smallest median household size with 1.07 persons per household.
| Household Type | # Households | Household Size |
| Married-Couple | 1,430 (34.4%) | 3.07 |
| Single Male/Father | 87 (2.1%) | 4.13 |
| Single Female/Mother | 377 (9.1%) | 2.83 |
| Non-family | 2,259 (54.4%) | 1.07 |
| Total Households | 4,153 (100.0%) | 1.98 |
Household Size by Marriage Status in Mount Rainier
Out of a total of 4,153 households in Mount Rainier, 1,894 (45.6%) are family households, while 2,259 (54.4%) are nonfamily households. The most numerous type of family households are 2-person households, comprising 797, and the most common type of nonfamily households are 1-person households, comprising 2,114.
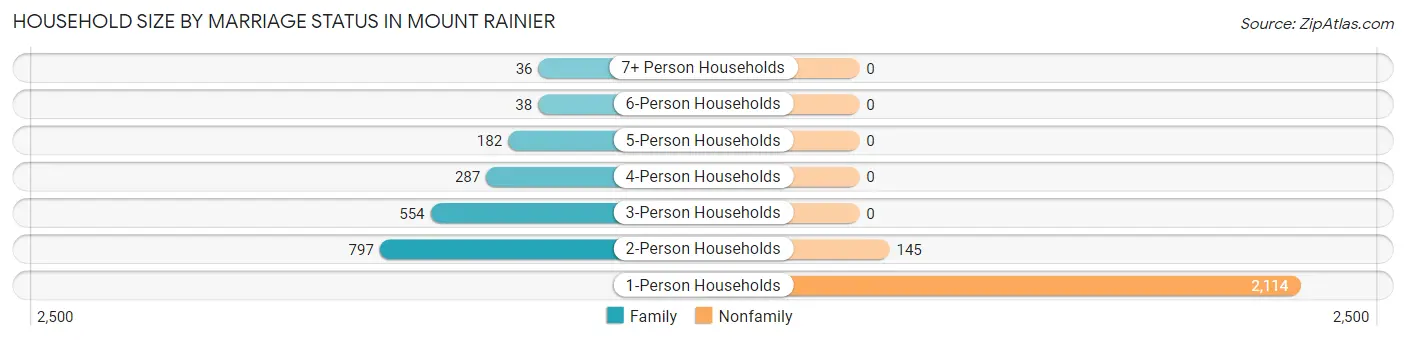
| Household Size | Family Households | Nonfamily Households |
| 1-Person Households | - | 2,114 (50.9%) |
| 2-Person Households | 797 (19.2%) | 145 (3.5%) |
| 3-Person Households | 554 (13.3%) | 0 (0.0%) |
| 4-Person Households | 287 (6.9%) | 0 (0.0%) |
| 5-Person Households | 182 (4.4%) | 0 (0.0%) |
| 6-Person Households | 38 (0.9%) | 0 (0.0%) |
| 7+ Person Households | 36 (0.9%) | 0 (0.0%) |
| Total | 1,894 (45.6%) | 2,259 (54.4%) |
Female Fertility in Mount Rainier
Fertility by Age in Mount Rainier
Average fertility rate in Mount Rainier is 70.0 births per 1,000 women. Women in the age bracket of 20 to 34 years have the highest fertility rate with 113.0 births per 1,000 women. Women in the age bracket of 20 to 34 years acount for 64.9% of all women with births.
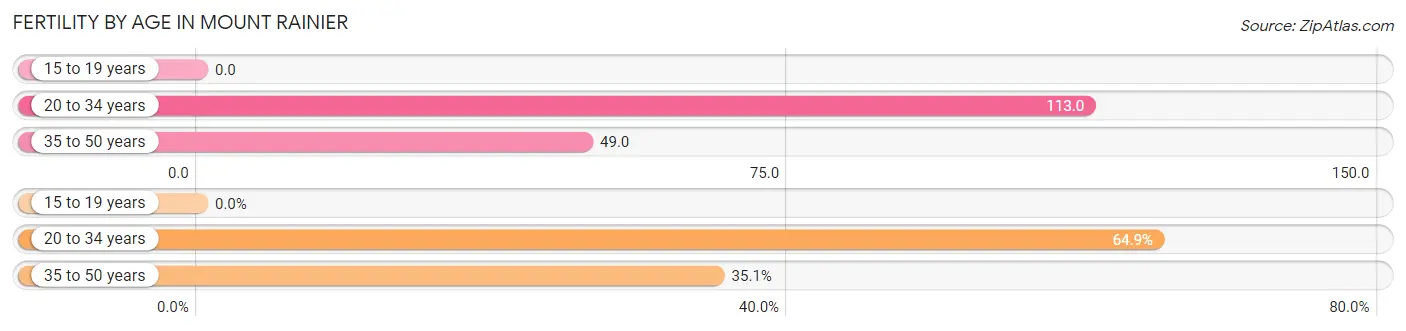
| Age Bracket | Women with Births | Births / 1,000 Women |
| 15 to 19 years | 0 (0.0%) | 0.0 |
| 20 to 34 years | 100 (64.9%) | 113.0 |
| 35 to 50 years | 54 (35.1%) | 49.0 |
| Total | 154 (100.0%) | 70.0 |
Fertility by Age by Marriage Status in Mount Rainier
67.5% of women with births (154) in Mount Rainier are married. The highest percentage of unmarried women with births falls into 35 to 50 years age bracket with 50.0% of them unmarried at the time of birth, while the lowest percentage of unmarried women with births belong to 20 to 34 years age bracket with 23.0% of them unmarried.
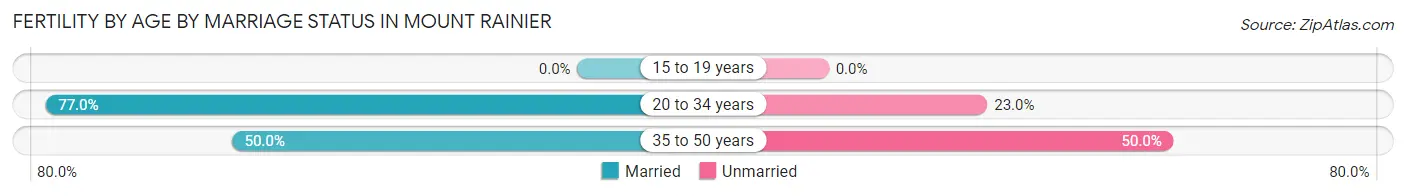
| Age Bracket | Married | Unmarried |
| 15 to 19 years | 0 (0.0%) | 0 (0.0%) |
| 20 to 34 years | 77 (77.0%) | 23 (23.0%) |
| 35 to 50 years | 27 (50.0%) | 27 (50.0%) |
| Total | 104 (67.5%) | 50 (32.5%) |
Fertility by Education in Mount Rainier
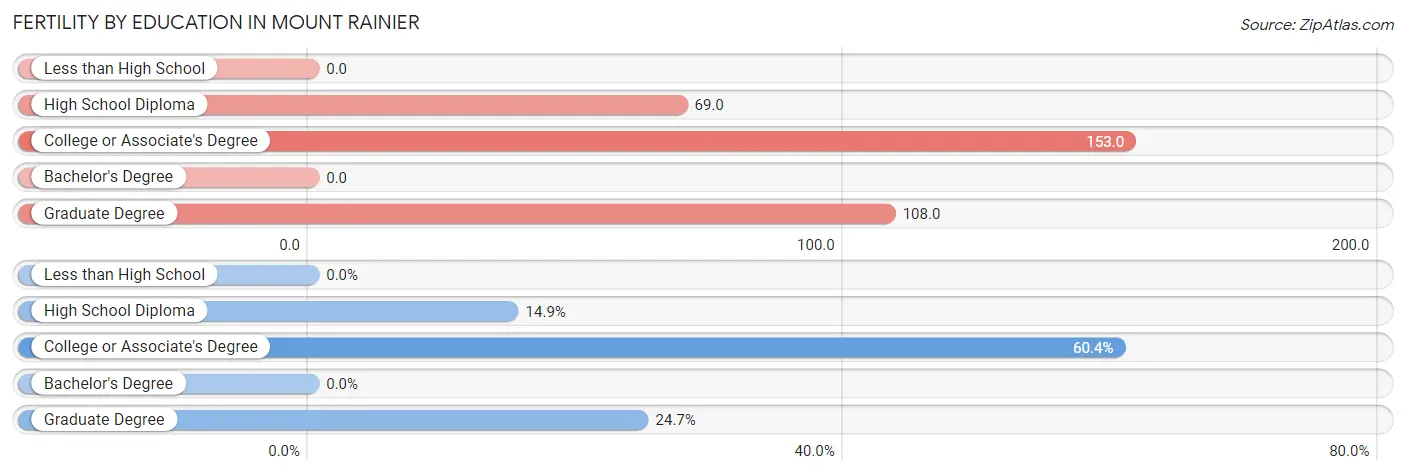
| Educational Attainment | Women with Births | Births / 1,000 Women |
| Less than High School | 0 (0.0%) | 0.0 |
| High School Diploma | 23 (14.9%) | 69.0 |
| College or Associate's Degree | 93 (60.4%) | 153.0 |
| Bachelor's Degree | 0 (0.0%) | 0.0 |
| Graduate Degree | 38 (24.7%) | 108.0 |
| Total | 154 (100.0%) | 70.0 |
Fertility by Education by Marriage Status in Mount Rainier
32.5% of women with births in Mount Rainier are unmarried. Women with the educational attainment of graduate degree are most likely to be married with 100.0% of them married at childbirth, while women with the educational attainment of high school diploma are least likely to be married with 100.0% of them unmarried at childbirth.
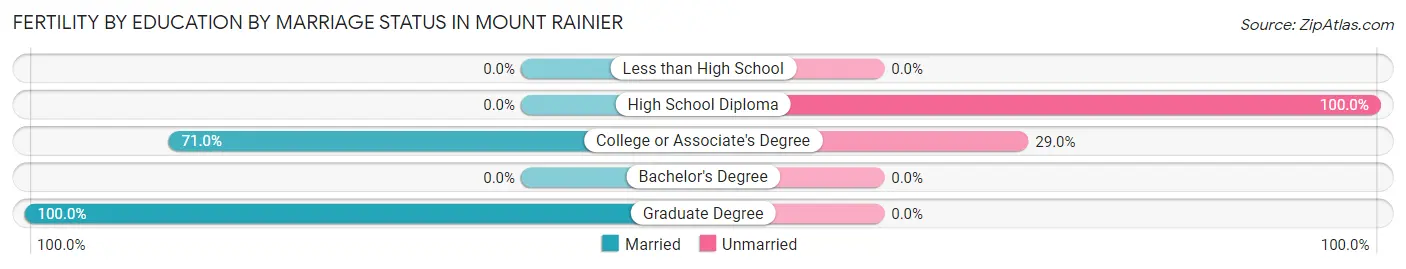
| Educational Attainment | Married | Unmarried |
| Less than High School | 0 (0.0%) | 0 (0.0%) |
| High School Diploma | 0 (0.0%) | 23 (100.0%) |
| College or Associate's Degree | 66 (71.0%) | 27 (29.0%) |
| Bachelor's Degree | 0 (0.0%) | 0 (0.0%) |
| Graduate Degree | 38 (100.0%) | 0 (0.0%) |
| Total | 104 (67.5%) | 50 (32.5%) |
Employment Characteristics in Mount Rainier
Employment by Class of Employer in Mount Rainier
Among the 4,801 employed individuals in Mount Rainier, private company employees (2,655 | 55.3%), not-for-profit organizations (606 | 12.6%), and federal government employees (533 | 11.1%) make up the most common classes of employment.
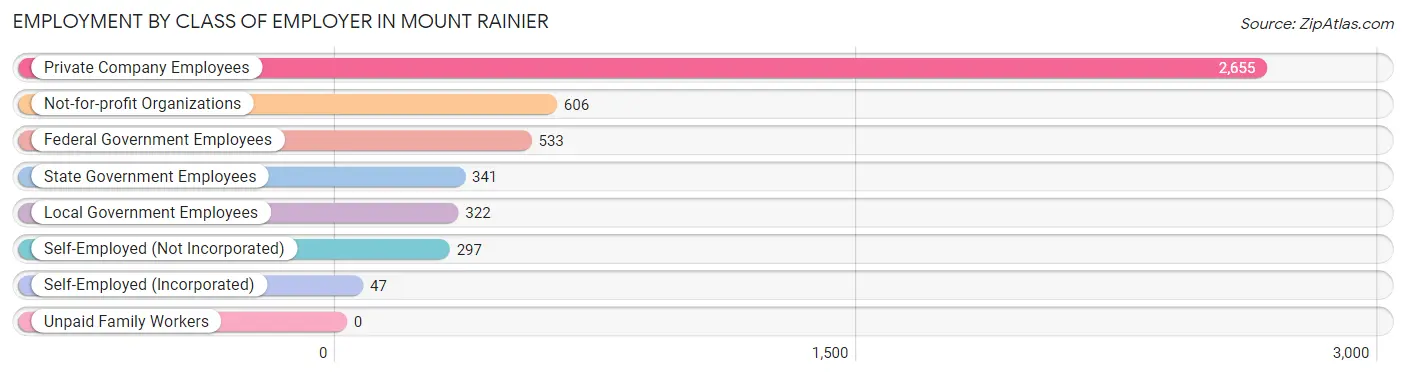
| Employer Class | # Employees | % Employees |
| Private Company Employees | 2,655 | 55.3% |
| Self-Employed (Incorporated) | 47 | 1.0% |
| Self-Employed (Not Incorporated) | 297 | 6.2% |
| Not-for-profit Organizations | 606 | 12.6% |
| Local Government Employees | 322 | 6.7% |
| State Government Employees | 341 | 7.1% |
| Federal Government Employees | 533 | 11.1% |
| Unpaid Family Workers | 0 | 0.0% |
| Total | 4,801 | 100.0% |
Employment Status by Age in Mount Rainier
According to the labor force statistics for Mount Rainier, out of the total population over 16 years of age (6,894), 76.2% or 5,253 individuals are in the labor force, with 4.4% or 231 of them unemployed. The age group with the highest labor force participation rate is 20 to 24 years, with 92.7% or 421 individuals in the labor force. Within the labor force, the 16 to 19 years age range has the highest percentage of unemployed individuals, with 25.7% or 29 of them being unemployed.
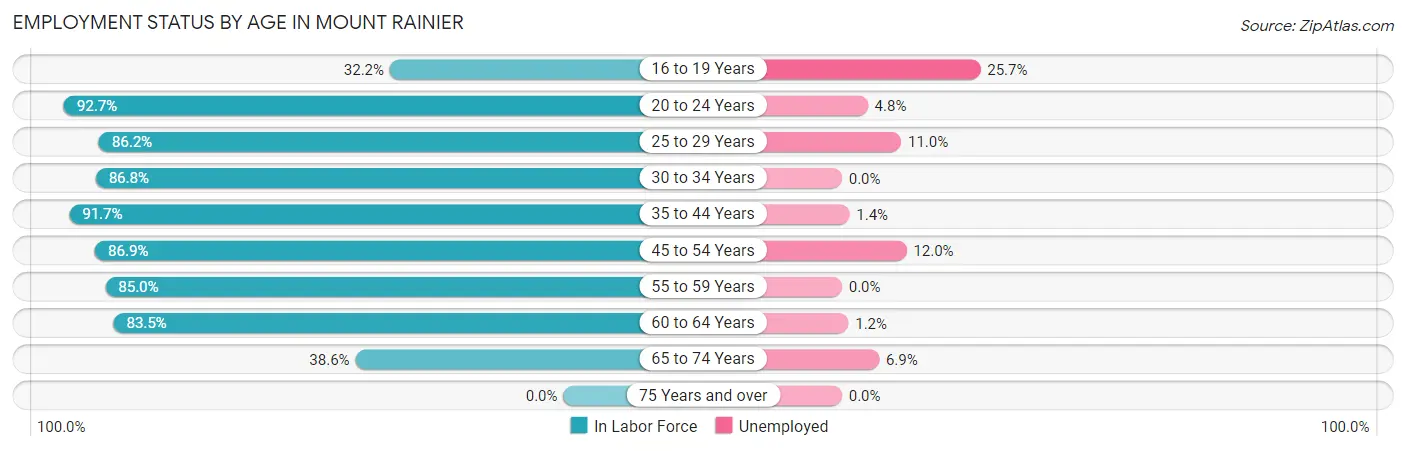
| Age Bracket | In Labor Force | Unemployed |
| 16 to 19 Years | 113 (32.2%) | 29 (25.7%) |
| 20 to 24 Years | 421 (92.7%) | 20 (4.8%) |
| 25 to 29 Years | 294 (86.2%) | 32 (11.0%) |
| 30 to 34 Years | 663 (86.8%) | 0 (0.0%) |
| 35 to 44 Years | 1,428 (91.7%) | 20 (1.4%) |
| 45 to 54 Years | 831 (86.9%) | 100 (12.0%) |
| 55 to 59 Years | 401 (85.0%) | 0 (0.0%) |
| 60 to 64 Years | 772 (83.5%) | 9 (1.2%) |
| 65 to 74 Years | 331 (38.6%) | 23 (6.9%) |
| 75 Years and over | 0 (0.0%) | 0 (0.0%) |
| Total | 5,253 (76.2%) | 231 (4.4%) |
Employment Status by Educational Attainment in Mount Rainier
According to labor force statistics for Mount Rainier, 87.5% of individuals (4,388) out of the total population between 25 and 64 years of age (5,015) are in the labor force, with 3.6% or 158 of them being unemployed. The group with the highest labor force participation rate are those with the educational attainment of bachelor's degree or higher, with 93.0% or 1,884 individuals in the labor force. Within the labor force, individuals with high school diploma education have the highest percentage of unemployment, with 5.6% or 50 of them being unemployed.
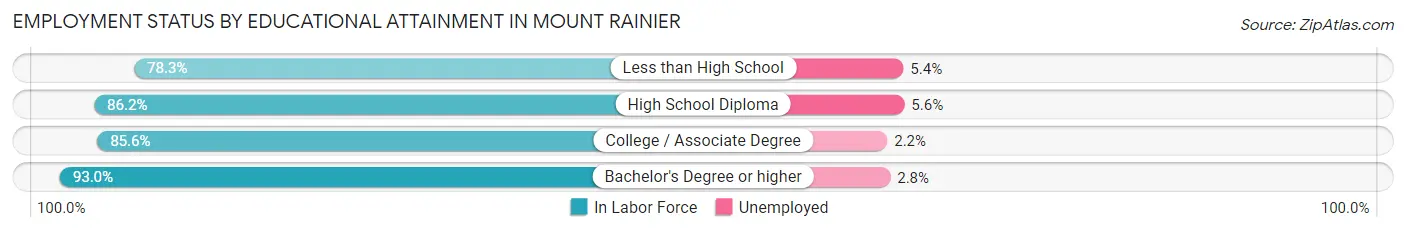
| Educational Attainment | In Labor Force | Unemployed |
| Less than High School | 663 (78.3%) | 46 (5.4%) |
| High School Diploma | 899 (86.2%) | 58 (5.6%) |
| College / Associate Degree | 941 (85.6%) | 24 (2.2%) |
| Bachelor's Degree or higher | 1,884 (93.0%) | 57 (2.8%) |
| Total | 4,388 (87.5%) | 181 (3.6%) |
Employment Occupations by Sex in Mount Rainier
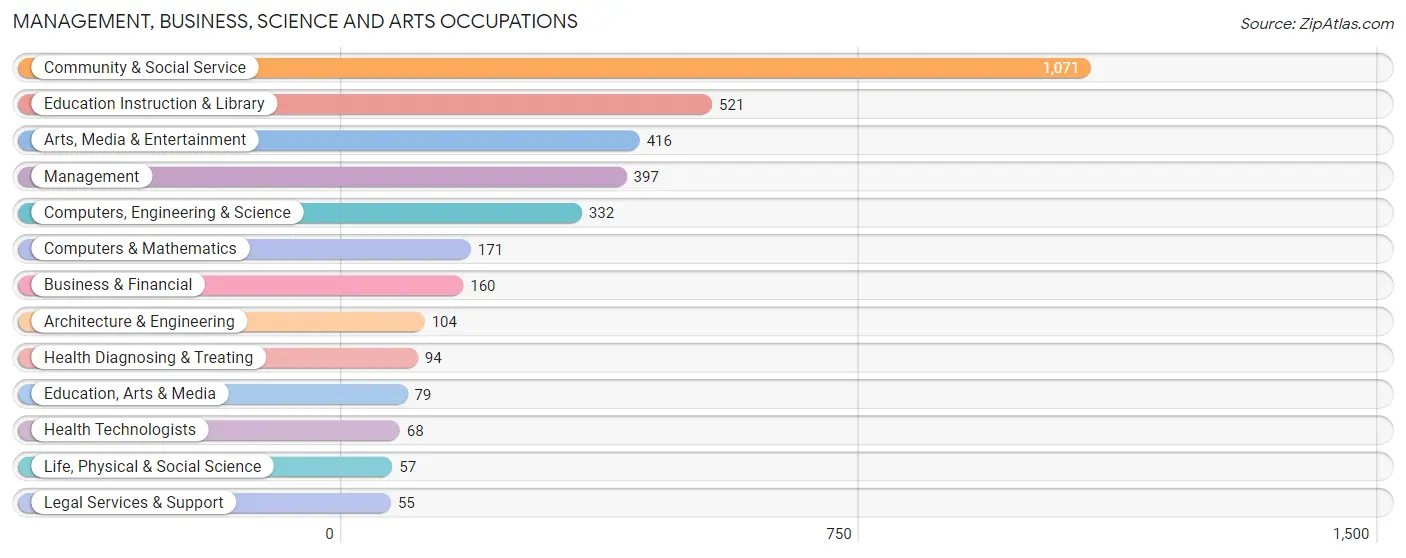
Management, Business, Science and Arts Occupations
The most common Management, Business, Science and Arts occupations in Mount Rainier are Community & Social Service (1,071 | 21.5%), Education Instruction & Library (521 | 10.5%), Arts, Media & Entertainment (416 | 8.4%), Management (397 | 8.0%), and Computers, Engineering & Science (332 | 6.7%).
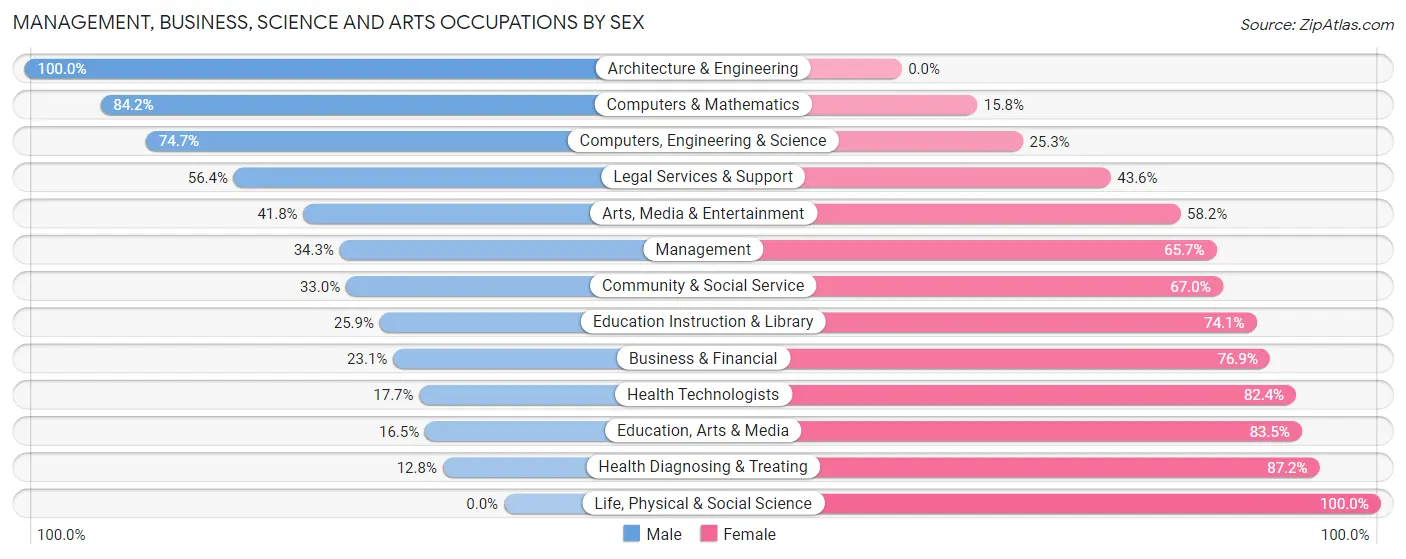
Management, Business, Science and Arts Occupations by Sex
Within the Management, Business, Science and Arts occupations in Mount Rainier, the most male-oriented occupations are Architecture & Engineering (100.0%), Computers & Mathematics (84.2%), and Computers, Engineering & Science (74.7%), while the most female-oriented occupations are Life, Physical & Social Science (100.0%), Health Diagnosing & Treating (87.2%), and Education, Arts & Media (83.5%).
| Occupation | Male | Female |
| Management | 136 (34.3%) | 261 (65.7%) |
| Business & Financial | 37 (23.1%) | 123 (76.9%) |
| Computers, Engineering & Science | 248 (74.7%) | 84 (25.3%) |
| Computers & Mathematics | 144 (84.2%) | 27 (15.8%) |
| Architecture & Engineering | 104 (100.0%) | 0 (0.0%) |
| Life, Physical & Social Science | 0 (0.0%) | 57 (100.0%) |
| Community & Social Service | 353 (33.0%) | 718 (67.0%) |
| Education, Arts & Media | 13 (16.5%) | 66 (83.5%) |
| Legal Services & Support | 31 (56.4%) | 24 (43.6%) |
| Education Instruction & Library | 135 (25.9%) | 386 (74.1%) |
| Arts, Media & Entertainment | 174 (41.8%) | 242 (58.2%) |
| Health Diagnosing & Treating | 12 (12.8%) | 82 (87.2%) |
| Health Technologists | 12 (17.6%) | 56 (82.4%) |
| Total (Category) | 786 (38.3%) | 1,268 (61.7%) |
| Total (Overall) | 2,456 (49.4%) | 2,520 (50.6%) |
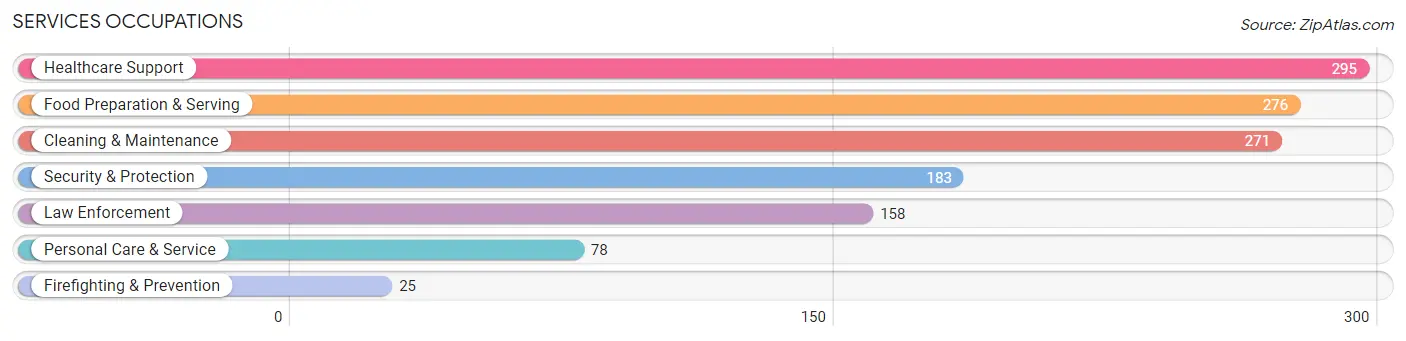
Services Occupations
The most common Services occupations in Mount Rainier are Healthcare Support (295 | 5.9%), Food Preparation & Serving (276 | 5.6%), Cleaning & Maintenance (271 | 5.4%), Security & Protection (183 | 3.7%), and Law Enforcement (158 | 3.2%).
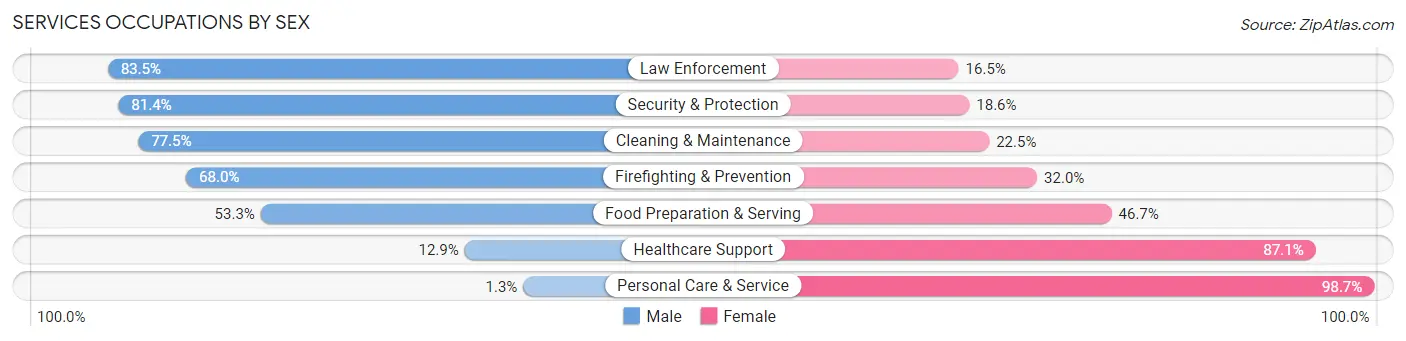
Services Occupations by Sex
Within the Services occupations in Mount Rainier, the most male-oriented occupations are Law Enforcement (83.5%), Security & Protection (81.4%), and Cleaning & Maintenance (77.5%), while the most female-oriented occupations are Personal Care & Service (98.7%), Healthcare Support (87.1%), and Food Preparation & Serving (46.7%).
| Occupation | Male | Female |
| Healthcare Support | 38 (12.9%) | 257 (87.1%) |
| Security & Protection | 149 (81.4%) | 34 (18.6%) |
| Firefighting & Prevention | 17 (68.0%) | 8 (32.0%) |
| Law Enforcement | 132 (83.5%) | 26 (16.5%) |
| Food Preparation & Serving | 147 (53.3%) | 129 (46.7%) |
| Cleaning & Maintenance | 210 (77.5%) | 61 (22.5%) |
| Personal Care & Service | 1 (1.3%) | 77 (98.7%) |
| Total (Category) | 545 (49.4%) | 558 (50.6%) |
| Total (Overall) | 2,456 (49.4%) | 2,520 (50.6%) |
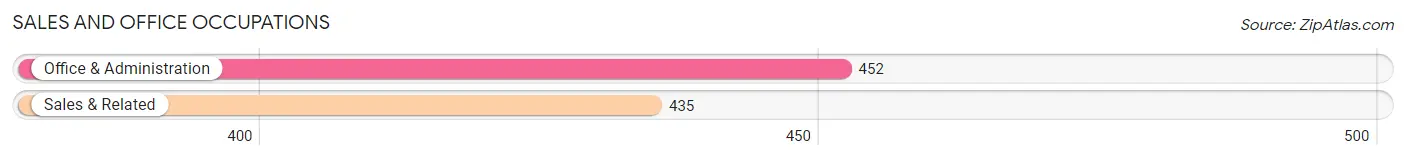
Sales and Office Occupations
The most common Sales and Office occupations in Mount Rainier are Office & Administration (452 | 9.1%), and Sales & Related (435 | 8.7%).
Sales and Office Occupations by Sex
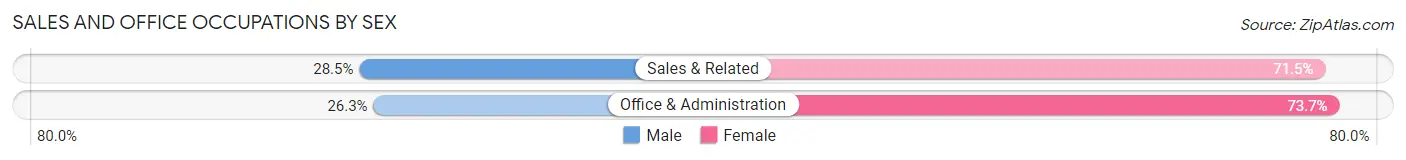
| Occupation | Male | Female |
| Sales & Related | 124 (28.5%) | 311 (71.5%) |
| Office & Administration | 119 (26.3%) | 333 (73.7%) |
| Total (Category) | 243 (27.4%) | 644 (72.6%) |
| Total (Overall) | 2,456 (49.4%) | 2,520 (50.6%) |
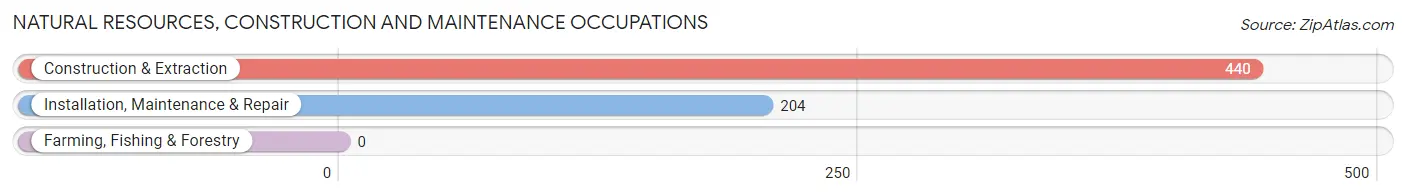
Natural Resources, Construction and Maintenance Occupations
The most common Natural Resources, Construction and Maintenance occupations in Mount Rainier are Construction & Extraction (440 | 8.8%), and Installation, Maintenance & Repair (204 | 4.1%).
Natural Resources, Construction and Maintenance Occupations by Sex
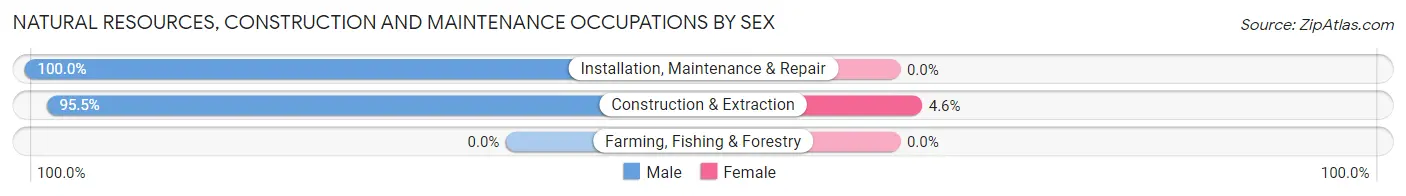
| Occupation | Male | Female |
| Farming, Fishing & Forestry | 0 (0.0%) | 0 (0.0%) |
| Construction & Extraction | 420 (95.5%) | 20 (4.5%) |
| Installation, Maintenance & Repair | 204 (100.0%) | 0 (0.0%) |
| Total (Category) | 624 (96.9%) | 20 (3.1%) |
| Total (Overall) | 2,456 (49.4%) | 2,520 (50.6%) |
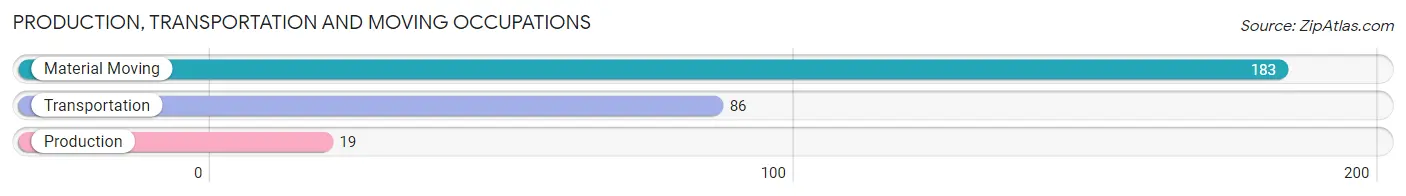
Production, Transportation and Moving Occupations
The most common Production, Transportation and Moving occupations in Mount Rainier are Material Moving (183 | 3.7%), Transportation (86 | 1.7%), and Production (19 | 0.4%).
Production, Transportation and Moving Occupations by Sex
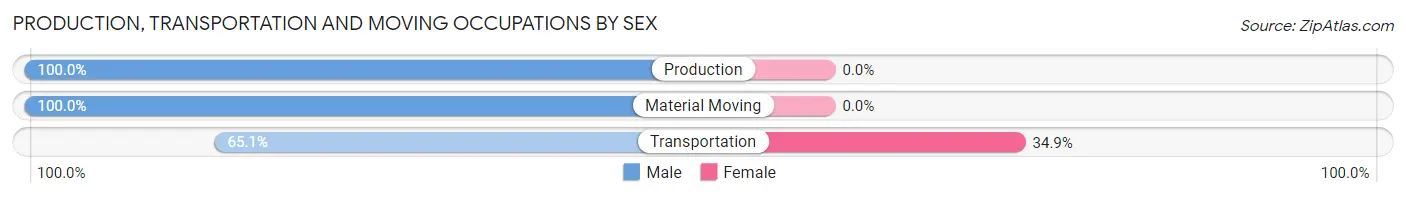
| Occupation | Male | Female |
| Production | 19 (100.0%) | 0 (0.0%) |
| Transportation | 56 (65.1%) | 30 (34.9%) |
| Material Moving | 183 (100.0%) | 0 (0.0%) |
| Total (Category) | 258 (89.6%) | 30 (10.4%) |
| Total (Overall) | 2,456 (49.4%) | 2,520 (50.6%) |
Employment Industries by Sex in Mount Rainier
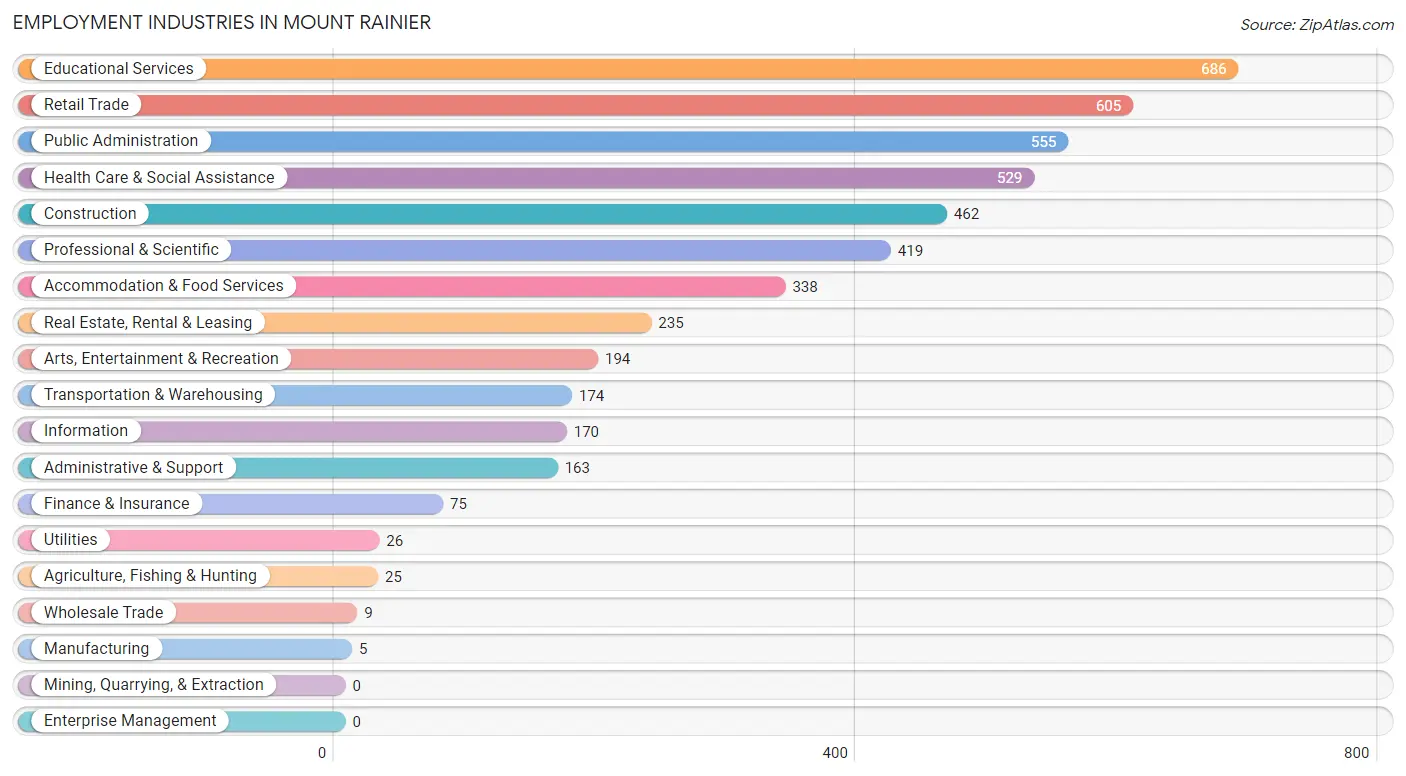
Employment Industries in Mount Rainier
The major employment industries in Mount Rainier include Educational Services (686 | 13.8%), Retail Trade (605 | 12.2%), Public Administration (555 | 11.2%), Health Care & Social Assistance (529 | 10.6%), and Construction (462 | 9.3%).
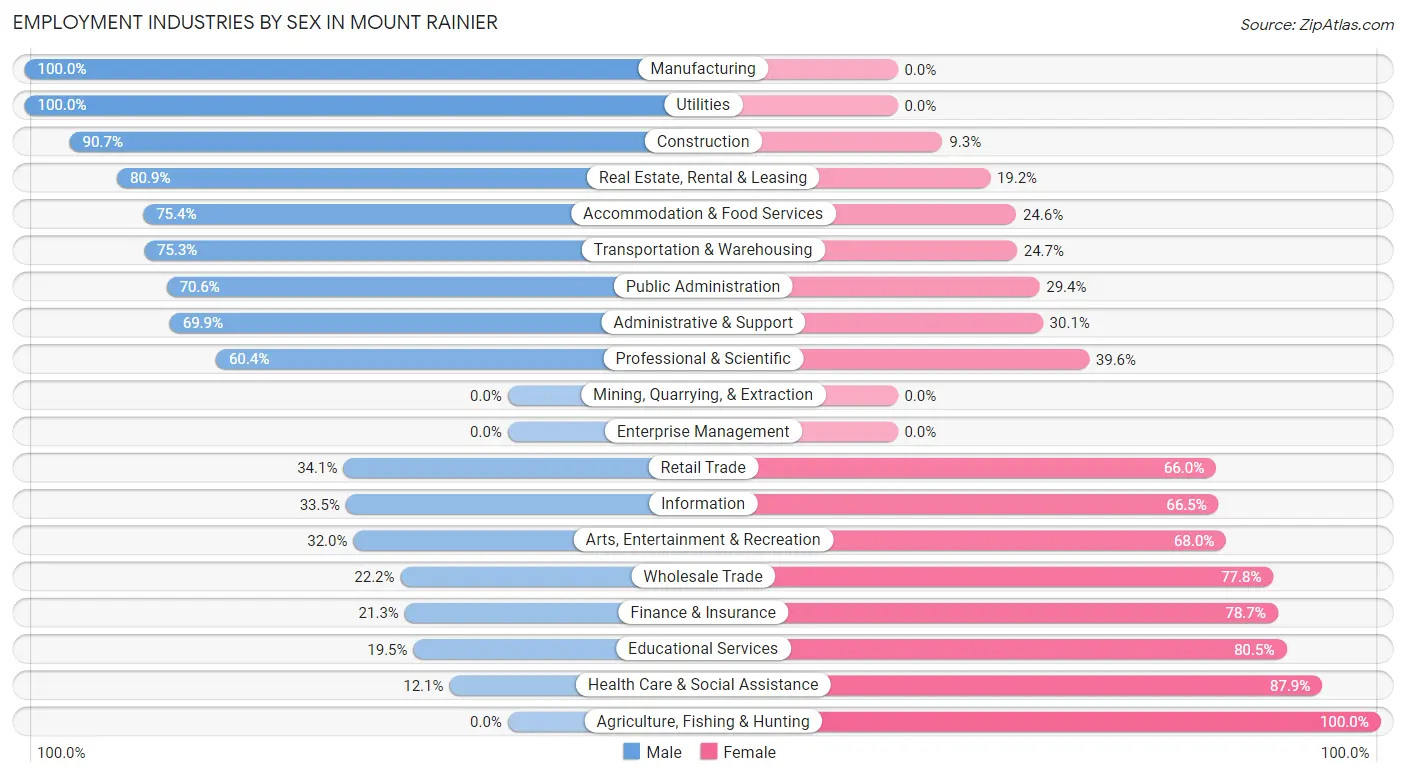
Employment Industries by Sex in Mount Rainier
The Mount Rainier industries that see more men than women are Manufacturing (100.0%), Utilities (100.0%), and Construction (90.7%), whereas the industries that tend to have a higher number of women are Agriculture, Fishing & Hunting (100.0%), Health Care & Social Assistance (87.9%), and Educational Services (80.5%).
| Industry | Male | Female |
| Agriculture, Fishing & Hunting | 0 (0.0%) | 25 (100.0%) |
| Mining, Quarrying, & Extraction | 0 (0.0%) | 0 (0.0%) |
| Construction | 419 (90.7%) | 43 (9.3%) |
| Manufacturing | 5 (100.0%) | 0 (0.0%) |
| Wholesale Trade | 2 (22.2%) | 7 (77.8%) |
| Retail Trade | 206 (34.1%) | 399 (65.9%) |
| Transportation & Warehousing | 131 (75.3%) | 43 (24.7%) |
| Utilities | 26 (100.0%) | 0 (0.0%) |
| Information | 57 (33.5%) | 113 (66.5%) |
| Finance & Insurance | 16 (21.3%) | 59 (78.7%) |
| Real Estate, Rental & Leasing | 190 (80.8%) | 45 (19.2%) |
| Professional & Scientific | 253 (60.4%) | 166 (39.6%) |
| Enterprise Management | 0 (0.0%) | 0 (0.0%) |
| Administrative & Support | 114 (69.9%) | 49 (30.1%) |
| Educational Services | 134 (19.5%) | 552 (80.5%) |
| Health Care & Social Assistance | 64 (12.1%) | 465 (87.9%) |
| Arts, Entertainment & Recreation | 62 (32.0%) | 132 (68.0%) |
| Accommodation & Food Services | 255 (75.4%) | 83 (24.6%) |
| Public Administration | 392 (70.6%) | 163 (29.4%) |
| Total | 2,456 (49.4%) | 2,520 (50.6%) |
Education in Mount Rainier
School Enrollment in Mount Rainier
The most common levels of schooling among the 1,749 students in Mount Rainier are high school (443 | 25.3%), middle school (311 | 17.8%), and elementary school (309 | 17.7%).
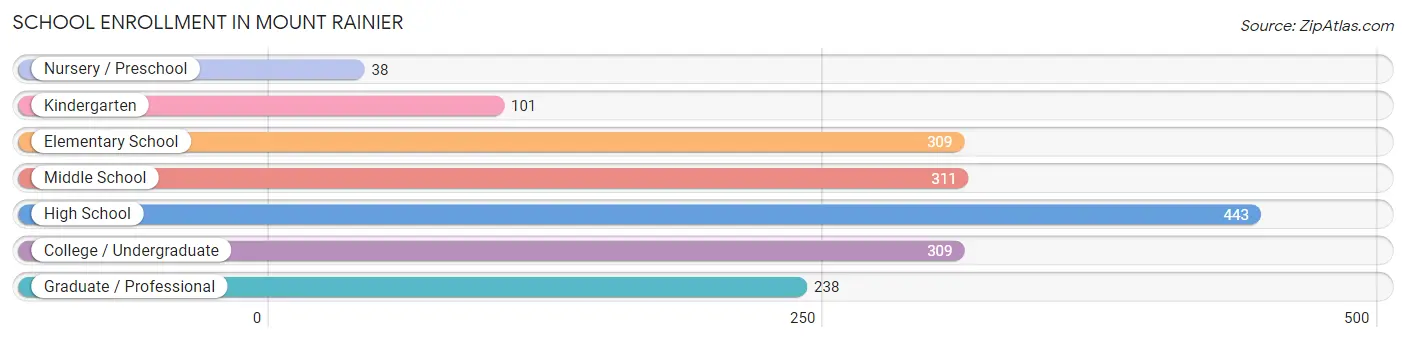
| School Level | # Students | % Students |
| Nursery / Preschool | 38 | 2.2% |
| Kindergarten | 101 | 5.8% |
| Elementary School | 309 | 17.7% |
| Middle School | 311 | 17.8% |
| High School | 443 | 25.3% |
| College / Undergraduate | 309 | 17.7% |
| Graduate / Professional | 238 | 13.6% |
| Total | 1,749 | 100.0% |
School Enrollment by Age by Funding Source in Mount Rainier
Out of a total of 1,749 students who are enrolled in schools in Mount Rainier, 380 (21.7%) attend a private institution, while the remaining 1,369 (78.3%) are enrolled in public schools. The age group of 3 to 4 year olds has the highest likelihood of being enrolled in private schools, with 38 (100.0% in the age bracket) enrolled. Conversely, the age group of 10 to 14 year olds has the lowest likelihood of being enrolled in a private school, with 362 (97.3% in the age bracket) attending a public institution.
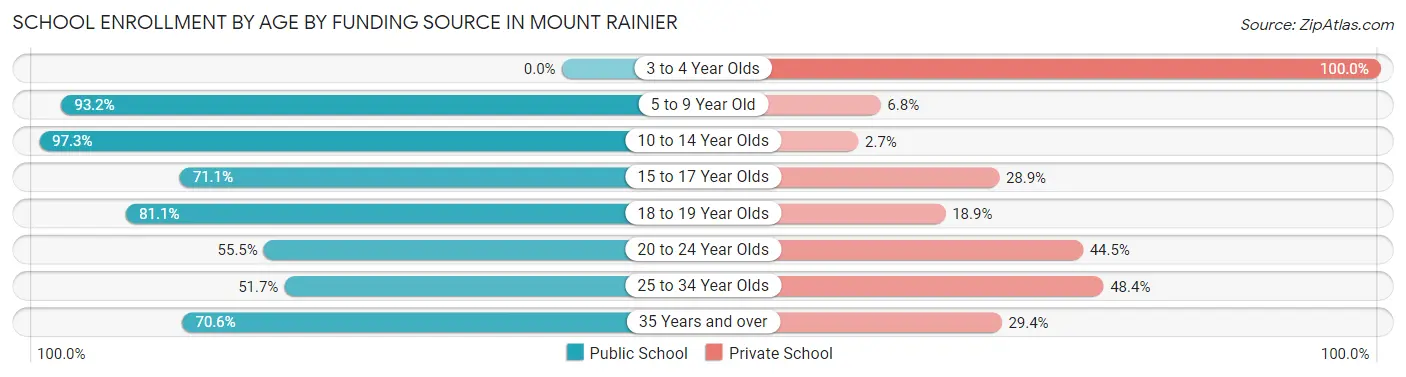
| Age Bracket | Public School | Private School |
| 3 to 4 Year Olds | 0 (0.0%) | 38 (100.0%) |
| 5 to 9 Year Old | 368 (93.2%) | 27 (6.8%) |
| 10 to 14 Year Olds | 362 (97.3%) | 10 (2.7%) |
| 15 to 17 Year Olds | 231 (71.1%) | 94 (28.9%) |
| 18 to 19 Year Olds | 90 (81.1%) | 21 (18.9%) |
| 20 to 24 Year Olds | 86 (55.5%) | 69 (44.5%) |
| 25 to 34 Year Olds | 47 (51.6%) | 44 (48.3%) |
| 35 Years and over | 185 (70.6%) | 77 (29.4%) |
| Total | 1,369 (78.3%) | 380 (21.7%) |
Educational Attainment by Field of Study in Mount Rainier
Education (377 | 15.9%), business (327 | 13.8%), visual & performing arts (276 | 11.6%), bio, nature & agricultural (216 | 9.1%), and liberal arts & history (203 | 8.5%) are the most common fields of study among 2,378 individuals in Mount Rainier who have obtained a bachelor's degree or higher.
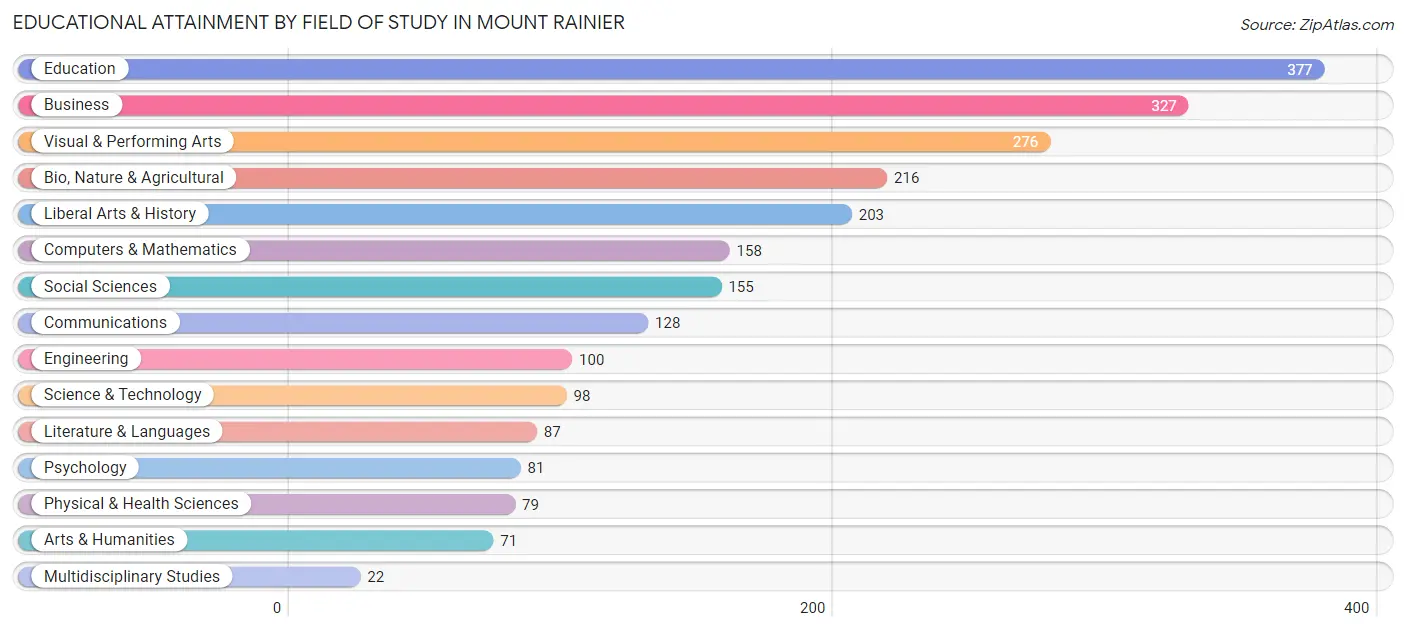
| Field of Study | # Graduates | % Graduates |
| Computers & Mathematics | 158 | 6.6% |
| Bio, Nature & Agricultural | 216 | 9.1% |
| Physical & Health Sciences | 79 | 3.3% |
| Psychology | 81 | 3.4% |
| Social Sciences | 155 | 6.5% |
| Engineering | 100 | 4.2% |
| Multidisciplinary Studies | 22 | 0.9% |
| Science & Technology | 98 | 4.1% |
| Business | 327 | 13.8% |
| Education | 377 | 15.9% |
| Literature & Languages | 87 | 3.7% |
| Liberal Arts & History | 203 | 8.5% |
| Visual & Performing Arts | 276 | 11.6% |
| Communications | 128 | 5.4% |
| Arts & Humanities | 71 | 3.0% |
| Total | 2,378 | 100.0% |
Transportation & Commute in Mount Rainier
Vehicle Availability by Sex in Mount Rainier
The most prevalent vehicle ownership categories in Mount Rainier are males with 1 vehicle (1,227, accounting for 50.8%) and females with 1 vehicle (1,152, making up 51.8%).
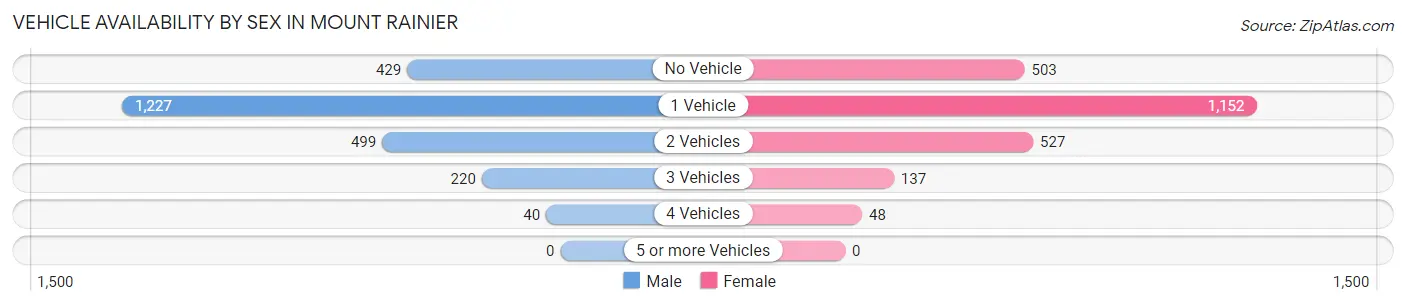
| Vehicles Available | Male | Female |
| No Vehicle | 429 (17.8%) | 503 (21.2%) |
| 1 Vehicle | 1,227 (50.8%) | 1,152 (48.7%) |
| 2 Vehicles | 499 (20.7%) | 527 (22.3%) |
| 3 Vehicles | 220 (9.1%) | 137 (5.8%) |
| 4 Vehicles | 40 (1.7%) | 48 (2.0%) |
| 5 or more Vehicles | 0 (0.0%) | 0 (0.0%) |
| Total | 2,415 (100.0%) | 2,367 (100.0%) |
Commute Time in Mount Rainier
The most frequently occuring commute durations in Mount Rainier are 30 to 34 minutes (768 commuters, 18.5%), 15 to 19 minutes (621 commuters, 15.0%), and 25 to 29 minutes (496 commuters, 11.9%).
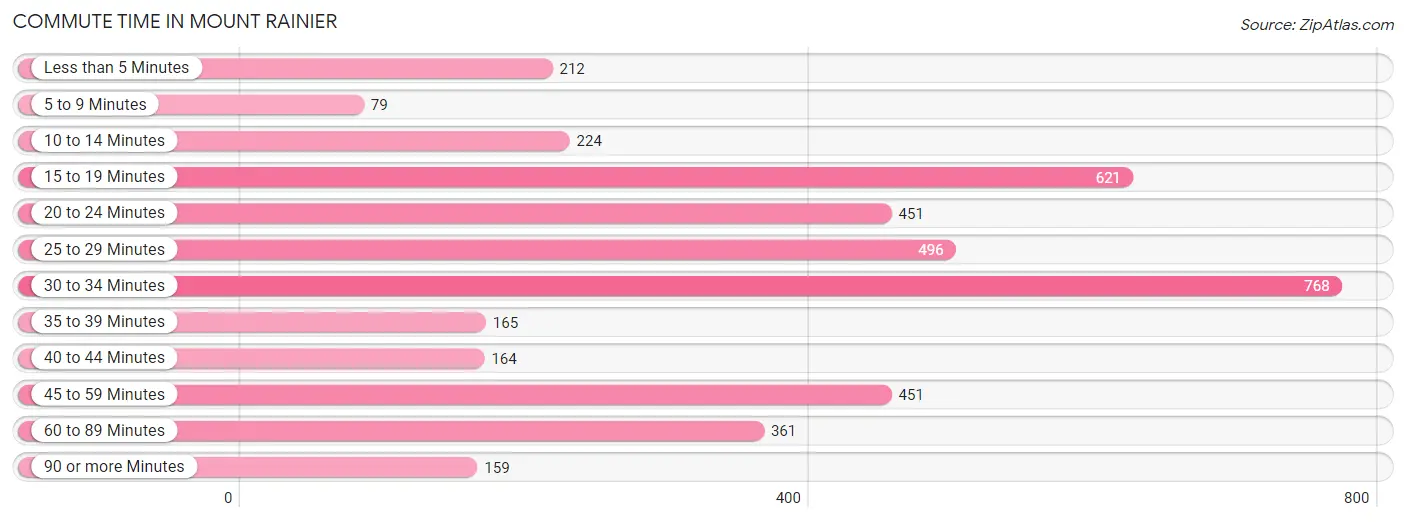
| Commute Time | # Commuters | % Commuters |
| Less than 5 Minutes | 212 | 5.1% |
| 5 to 9 Minutes | 79 | 1.9% |
| 10 to 14 Minutes | 224 | 5.4% |
| 15 to 19 Minutes | 621 | 15.0% |
| 20 to 24 Minutes | 451 | 10.9% |
| 25 to 29 Minutes | 496 | 11.9% |
| 30 to 34 Minutes | 768 | 18.5% |
| 35 to 39 Minutes | 165 | 4.0% |
| 40 to 44 Minutes | 164 | 4.0% |
| 45 to 59 Minutes | 451 | 10.9% |
| 60 to 89 Minutes | 361 | 8.7% |
| 90 or more Minutes | 159 | 3.8% |
Commute Time by Sex in Mount Rainier
The most common commute times in Mount Rainier are 30 to 34 minutes (504 commuters, 23.2%) for males and 15 to 19 minutes (369 commuters, 18.7%) for females.
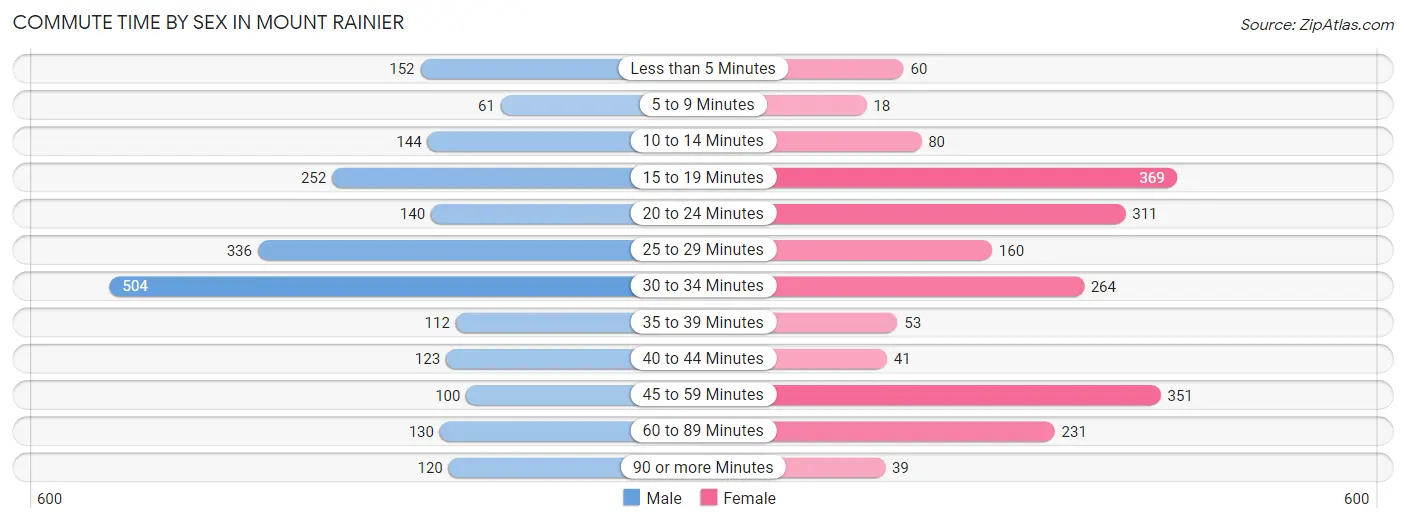
| Commute Time | Male | Female |
| Less than 5 Minutes | 152 (7.0%) | 60 (3.0%) |
| 5 to 9 Minutes | 61 (2.8%) | 18 (0.9%) |
| 10 to 14 Minutes | 144 (6.6%) | 80 (4.1%) |
| 15 to 19 Minutes | 252 (11.6%) | 369 (18.7%) |
| 20 to 24 Minutes | 140 (6.4%) | 311 (15.7%) |
| 25 to 29 Minutes | 336 (15.5%) | 160 (8.1%) |
| 30 to 34 Minutes | 504 (23.2%) | 264 (13.4%) |
| 35 to 39 Minutes | 112 (5.1%) | 53 (2.7%) |
| 40 to 44 Minutes | 123 (5.7%) | 41 (2.1%) |
| 45 to 59 Minutes | 100 (4.6%) | 351 (17.7%) |
| 60 to 89 Minutes | 130 (6.0%) | 231 (11.7%) |
| 90 or more Minutes | 120 (5.5%) | 39 (2.0%) |
Time of Departure to Work by Sex in Mount Rainier
The most frequent times of departure to work in Mount Rainier are 7:30 AM to 7:59 AM (279, 12.8%) for males and 9:00 AM to 9:59 AM (376, 19.0%) for females.
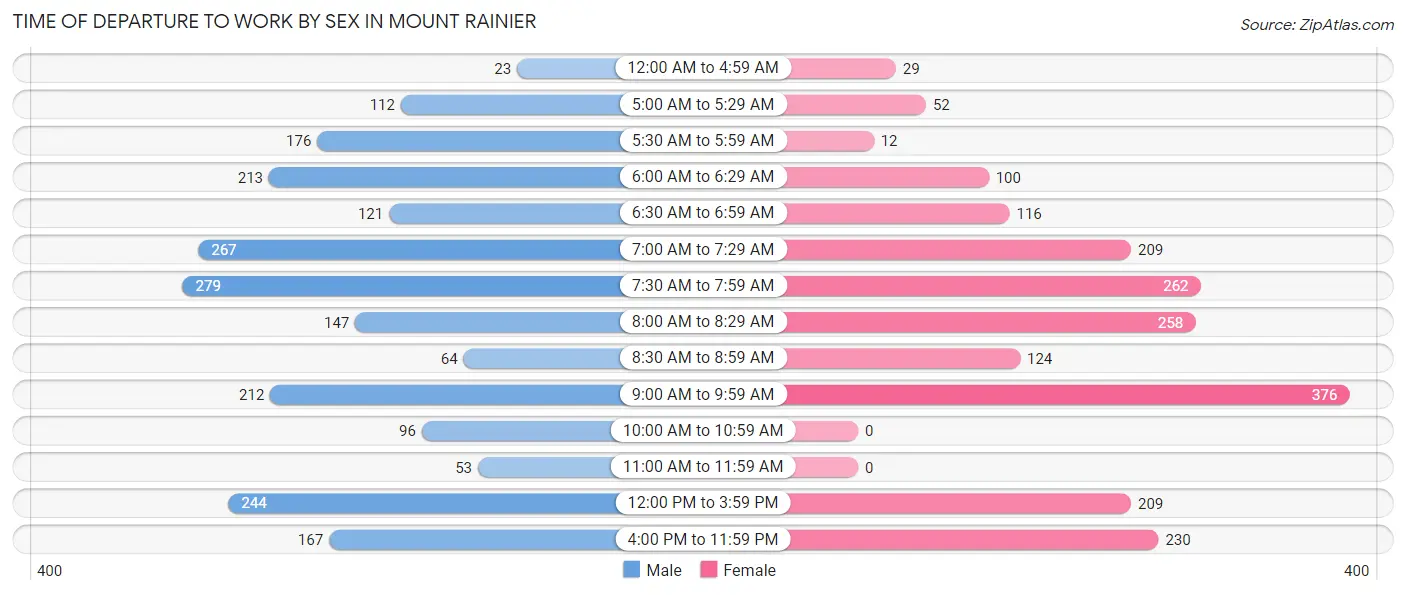
| Time of Departure | Male | Female |
| 12:00 AM to 4:59 AM | 23 (1.1%) | 29 (1.5%) |
| 5:00 AM to 5:29 AM | 112 (5.1%) | 52 (2.6%) |
| 5:30 AM to 5:59 AM | 176 (8.1%) | 12 (0.6%) |
| 6:00 AM to 6:29 AM | 213 (9.8%) | 100 (5.1%) |
| 6:30 AM to 6:59 AM | 121 (5.6%) | 116 (5.9%) |
| 7:00 AM to 7:29 AM | 267 (12.3%) | 209 (10.6%) |
| 7:30 AM to 7:59 AM | 279 (12.8%) | 262 (13.3%) |
| 8:00 AM to 8:29 AM | 147 (6.8%) | 258 (13.1%) |
| 8:30 AM to 8:59 AM | 64 (2.9%) | 124 (6.3%) |
| 9:00 AM to 9:59 AM | 212 (9.8%) | 376 (19.0%) |
| 10:00 AM to 10:59 AM | 96 (4.4%) | 0 (0.0%) |
| 11:00 AM to 11:59 AM | 53 (2.4%) | 0 (0.0%) |
| 12:00 PM to 3:59 PM | 244 (11.2%) | 209 (10.6%) |
| 4:00 PM to 11:59 PM | 167 (7.7%) | 230 (11.6%) |
| Total | 2,174 (100.0%) | 1,977 (100.0%) |
Housing Occupancy in Mount Rainier
Occupancy by Ownership in Mount Rainier
Of the total 4,153 dwellings in Mount Rainier, owner-occupied units account for 1,057 (25.5%), while renter-occupied units make up 3,096 (74.6%).
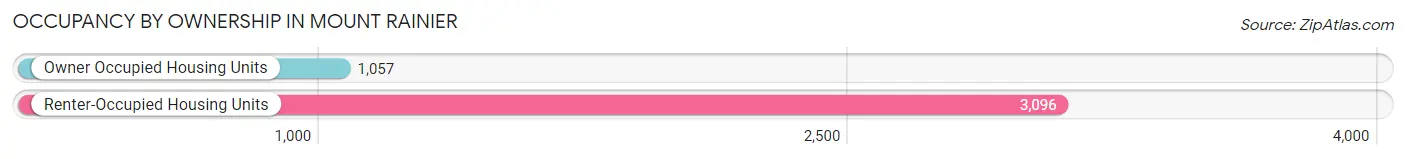
| Occupancy | # Housing Units | % Housing Units |
| Owner Occupied Housing Units | 1,057 | 25.5% |
| Renter-Occupied Housing Units | 3,096 | 74.6% |
| Total Occupied Housing Units | 4,153 | 100.0% |
Occupancy by Household Size in Mount Rainier
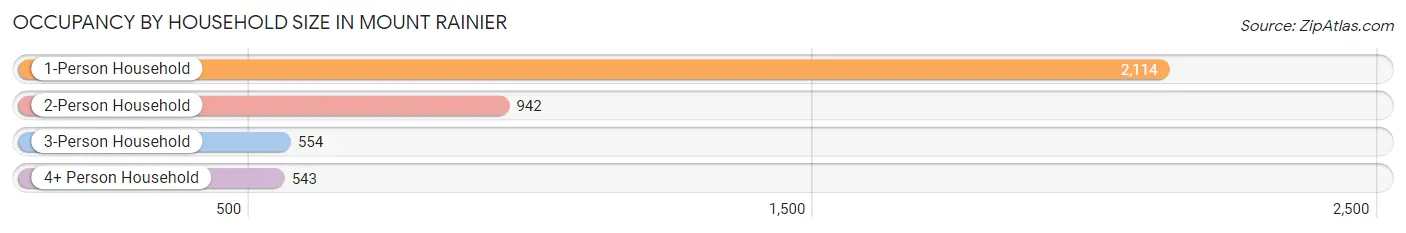
| Household Size | # Housing Units | % Housing Units |
| 1-Person Household | 2,114 | 50.9% |
| 2-Person Household | 942 | 22.7% |
| 3-Person Household | 554 | 13.3% |
| 4+ Person Household | 543 | 13.1% |
| Total Housing Units | 4,153 | 100.0% |
Occupancy by Ownership by Household Size in Mount Rainier
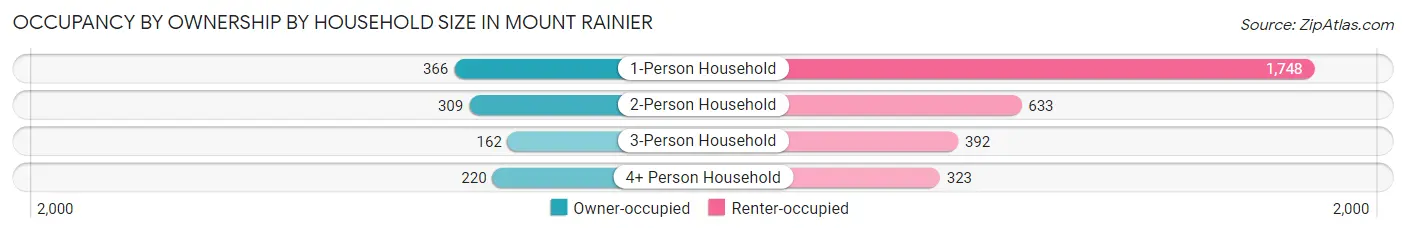
| Household Size | Owner-occupied | Renter-occupied |
| 1-Person Household | 366 (17.3%) | 1,748 (82.7%) |
| 2-Person Household | 309 (32.8%) | 633 (67.2%) |
| 3-Person Household | 162 (29.2%) | 392 (70.8%) |
| 4+ Person Household | 220 (40.5%) | 323 (59.5%) |
| Total Housing Units | 1,057 (25.5%) | 3,096 (74.6%) |
Occupancy by Educational Attainment in Mount Rainier
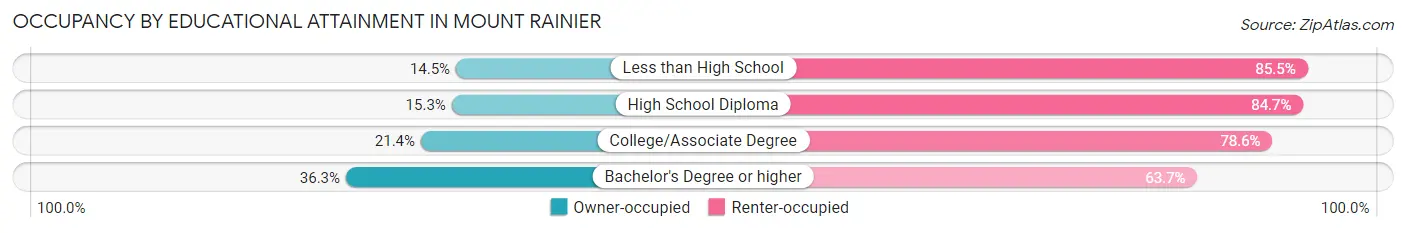
| Household Size | Owner-occupied | Renter-occupied |
| Less than High School | 73 (14.5%) | 431 (85.5%) |
| High School Diploma | 134 (15.3%) | 740 (84.7%) |
| College/Associate Degree | 227 (21.4%) | 832 (78.6%) |
| Bachelor's Degree or higher | 623 (36.3%) | 1,093 (63.7%) |
Occupancy by Age of Householder in Mount Rainier
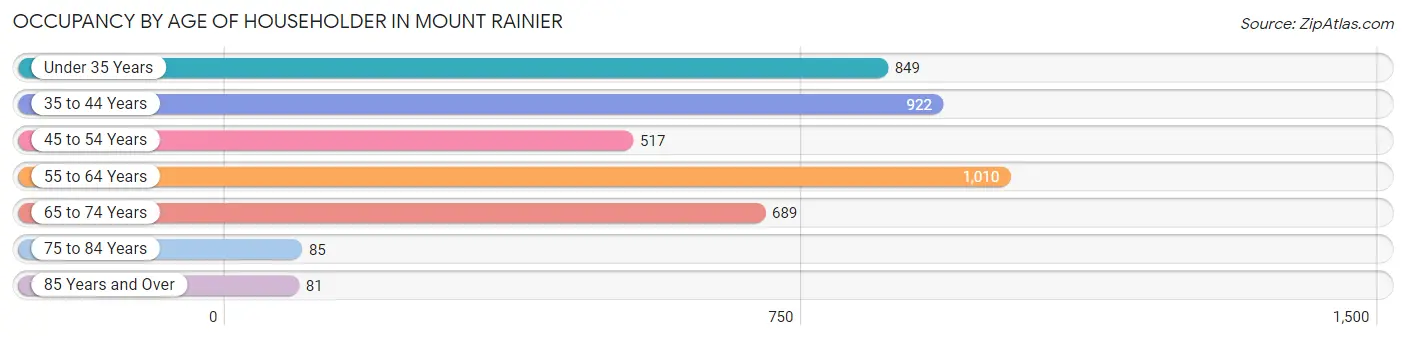
| Age Bracket | # Households | % Households |
| Under 35 Years | 849 | 20.4% |
| 35 to 44 Years | 922 | 22.2% |
| 45 to 54 Years | 517 | 12.4% |
| 55 to 64 Years | 1,010 | 24.3% |
| 65 to 74 Years | 689 | 16.6% |
| 75 to 84 Years | 85 | 2.1% |
| 85 Years and Over | 81 | 1.9% |
| Total | 4,153 | 100.0% |
Housing Finances in Mount Rainier
Median Income by Occupancy in Mount Rainier
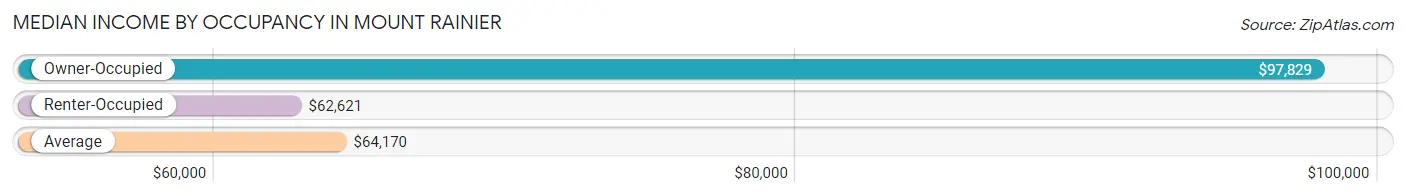
| Occupancy Type | # Households | Median Income |
| Owner-Occupied | 1,057 (25.5%) | $97,829 |
| Renter-Occupied | 3,096 (74.6%) | $62,621 |
| Average | 4,153 (100.0%) | $64,170 |
Occupancy by Householder Income Bracket in Mount Rainier
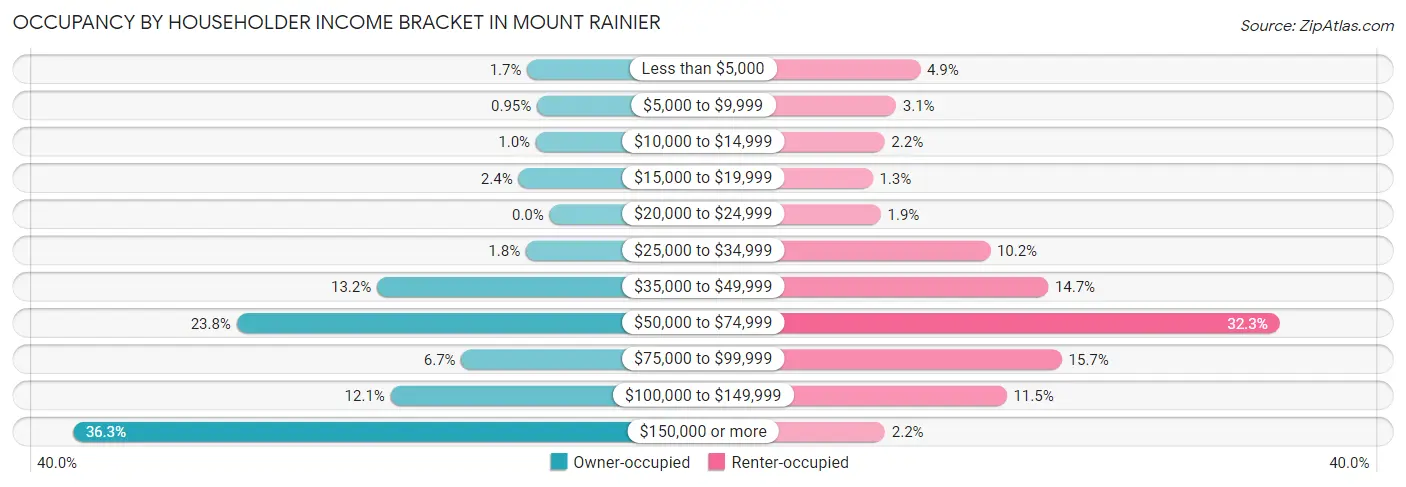
| Income Bracket | Owner-occupied | Renter-occupied |
| Less than $5,000 | 18 (1.7%) | 152 (4.9%) |
| $5,000 to $9,999 | 10 (0.9%) | 95 (3.1%) |
| $10,000 to $14,999 | 11 (1.0%) | 68 (2.2%) |
| $15,000 to $19,999 | 25 (2.4%) | 40 (1.3%) |
| $20,000 to $24,999 | 0 (0.0%) | 59 (1.9%) |
| $25,000 to $34,999 | 19 (1.8%) | 317 (10.2%) |
| $35,000 to $49,999 | 139 (13.2%) | 454 (14.7%) |
| $50,000 to $74,999 | 252 (23.8%) | 1,000 (32.3%) |
| $75,000 to $99,999 | 71 (6.7%) | 486 (15.7%) |
| $100,000 to $149,999 | 128 (12.1%) | 356 (11.5%) |
| $150,000 or more | 384 (36.3%) | 69 (2.2%) |
| Total | 1,057 (100.0%) | 3,096 (100.0%) |
Monthly Housing Cost Tiers in Mount Rainier
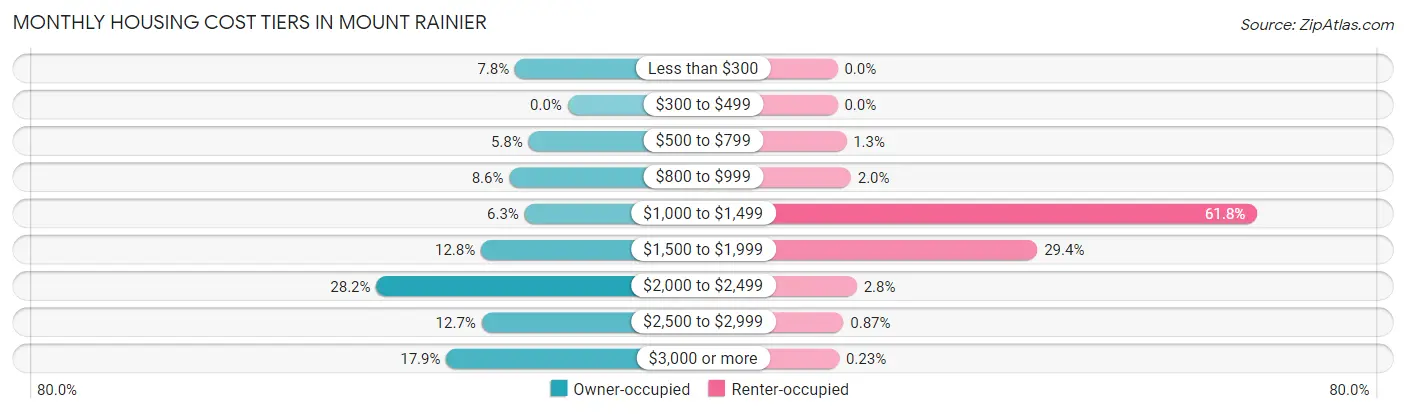
| Monthly Cost | Owner-occupied | Renter-occupied |
| Less than $300 | 82 (7.8%) | 0 (0.0%) |
| $300 to $499 | 0 (0.0%) | 0 (0.0%) |
| $500 to $799 | 61 (5.8%) | 40 (1.3%) |
| $800 to $999 | 91 (8.6%) | 61 (2.0%) |
| $1,000 to $1,499 | 67 (6.3%) | 1,914 (61.8%) |
| $1,500 to $1,999 | 135 (12.8%) | 911 (29.4%) |
| $2,000 to $2,499 | 298 (28.2%) | 88 (2.8%) |
| $2,500 to $2,999 | 134 (12.7%) | 27 (0.9%) |
| $3,000 or more | 189 (17.9%) | 7 (0.2%) |
| Total | 1,057 (100.0%) | 3,096 (100.0%) |
Physical Housing Characteristics in Mount Rainier
Housing Structures in Mount Rainier
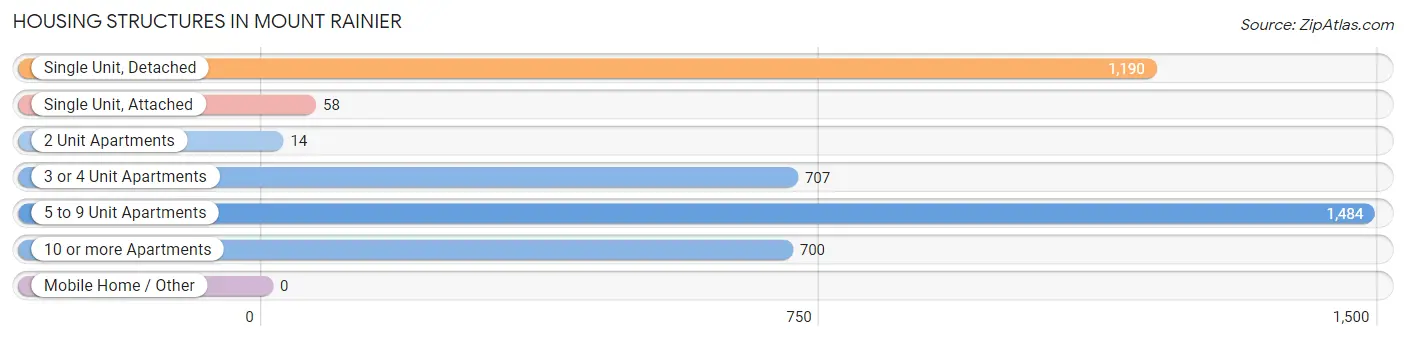
| Structure Type | # Housing Units | % Housing Units |
| Single Unit, Detached | 1,190 | 28.6% |
| Single Unit, Attached | 58 | 1.4% |
| 2 Unit Apartments | 14 | 0.3% |
| 3 or 4 Unit Apartments | 707 | 17.0% |
| 5 to 9 Unit Apartments | 1,484 | 35.7% |
| 10 or more Apartments | 700 | 16.9% |
| Mobile Home / Other | 0 | 0.0% |
| Total | 4,153 | 100.0% |
Housing Structures by Occupancy in Mount Rainier
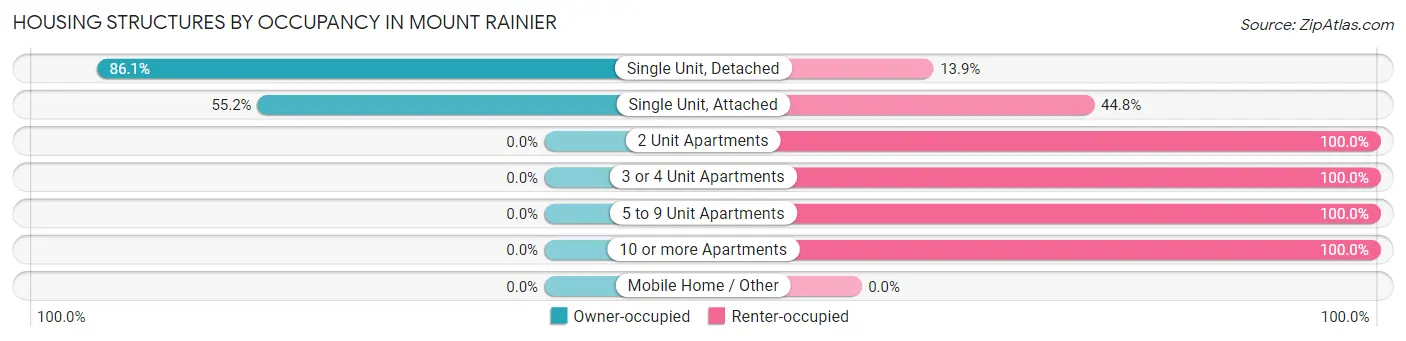
| Structure Type | Owner-occupied | Renter-occupied |
| Single Unit, Detached | 1,025 (86.1%) | 165 (13.9%) |
| Single Unit, Attached | 32 (55.2%) | 26 (44.8%) |
| 2 Unit Apartments | 0 (0.0%) | 14 (100.0%) |
| 3 or 4 Unit Apartments | 0 (0.0%) | 707 (100.0%) |
| 5 to 9 Unit Apartments | 0 (0.0%) | 1,484 (100.0%) |
| 10 or more Apartments | 0 (0.0%) | 700 (100.0%) |
| Mobile Home / Other | 0 (0.0%) | 0 (0.0%) |
| Total | 1,057 (25.5%) | 3,096 (74.6%) |
Housing Structures by Number of Rooms in Mount Rainier
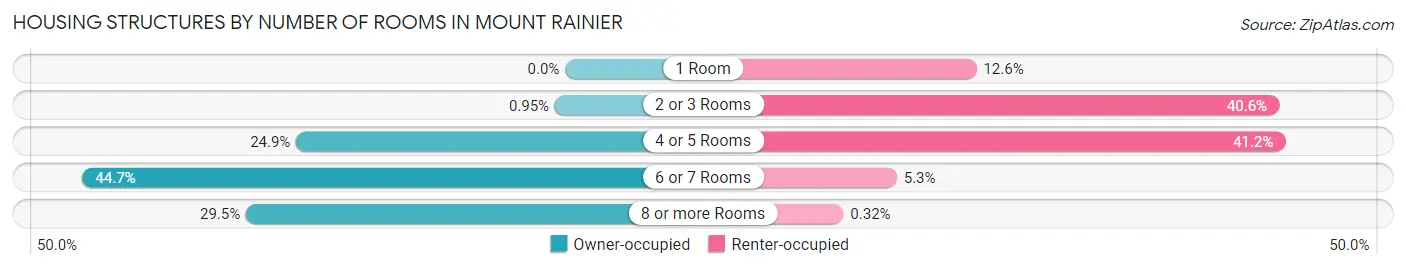
| Number of Rooms | Owner-occupied | Renter-occupied |
| 1 Room | 0 (0.0%) | 391 (12.6%) |
| 2 or 3 Rooms | 10 (0.9%) | 1,257 (40.6%) |
| 4 or 5 Rooms | 263 (24.9%) | 1,275 (41.2%) |
| 6 or 7 Rooms | 472 (44.7%) | 163 (5.3%) |
| 8 or more Rooms | 312 (29.5%) | 10 (0.3%) |
| Total | 1,057 (100.0%) | 3,096 (100.0%) |
Housing Structure by Heating Type in Mount Rainier
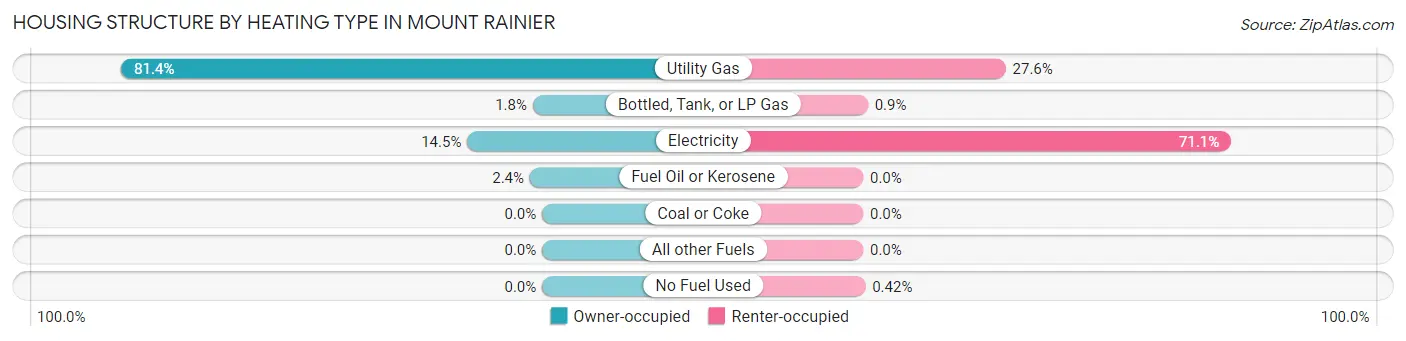
| Heating Type | Owner-occupied | Renter-occupied |
| Utility Gas | 860 (81.4%) | 853 (27.6%) |
| Bottled, Tank, or LP Gas | 19 (1.8%) | 28 (0.9%) |
| Electricity | 153 (14.5%) | 2,202 (71.1%) |
| Fuel Oil or Kerosene | 25 (2.4%) | 0 (0.0%) |
| Coal or Coke | 0 (0.0%) | 0 (0.0%) |
| All other Fuels | 0 (0.0%) | 0 (0.0%) |
| No Fuel Used | 0 (0.0%) | 13 (0.4%) |
| Total | 1,057 (100.0%) | 3,096 (100.0%) |
Household Vehicle Usage in Mount Rainier
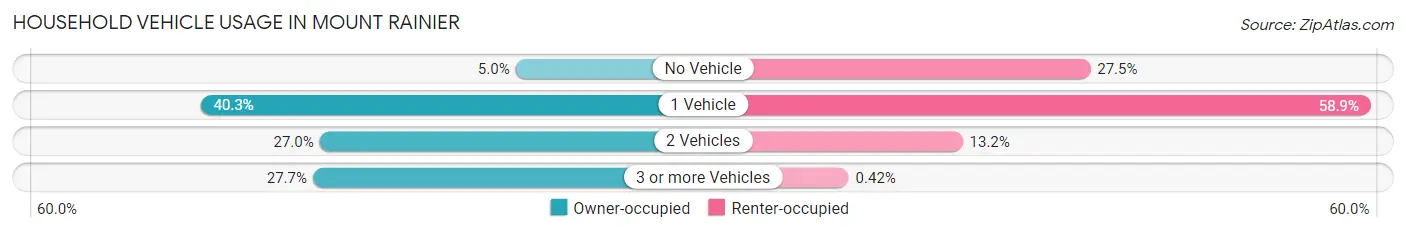
| Vehicles per Household | Owner-occupied | Renter-occupied |
| No Vehicle | 53 (5.0%) | 851 (27.5%) |
| 1 Vehicle | 426 (40.3%) | 1,824 (58.9%) |
| 2 Vehicles | 285 (27.0%) | 408 (13.2%) |
| 3 or more Vehicles | 293 (27.7%) | 13 (0.4%) |
| Total | 1,057 (100.0%) | 3,096 (100.0%) |
Real Estate & Mortgages in Mount Rainier
Real Estate and Mortgage Overview in Mount Rainier
| Characteristic | Without Mortgage | With Mortgage |
| Housing Units | 243 | 814 |
| Median Property Value | $479,100 | $507,700 |
| Median Household Income | $64,035 | $348 |
| Monthly Housing Costs | $720 | $189 |
| Real Estate Taxes | $5,119 | $0 |
Property Value by Mortgage Status in Mount Rainier
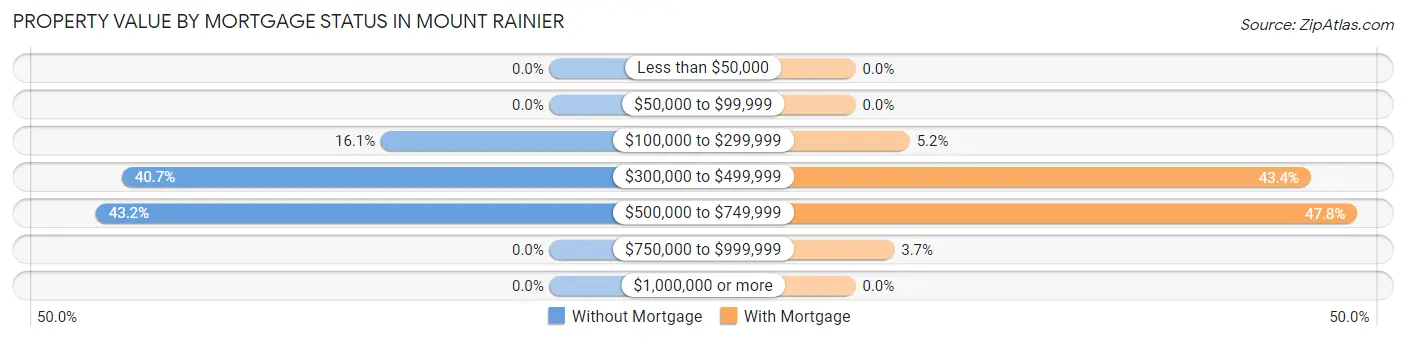
| Property Value | Without Mortgage | With Mortgage |
| Less than $50,000 | 0 (0.0%) | 0 (0.0%) |
| $50,000 to $99,999 | 0 (0.0%) | 0 (0.0%) |
| $100,000 to $299,999 | 39 (16.1%) | 42 (5.2%) |
| $300,000 to $499,999 | 99 (40.7%) | 353 (43.4%) |
| $500,000 to $749,999 | 105 (43.2%) | 389 (47.8%) |
| $750,000 to $999,999 | 0 (0.0%) | 30 (3.7%) |
| $1,000,000 or more | 0 (0.0%) | 0 (0.0%) |
| Total | 243 (100.0%) | 814 (100.0%) |
Household Income by Mortgage Status in Mount Rainier
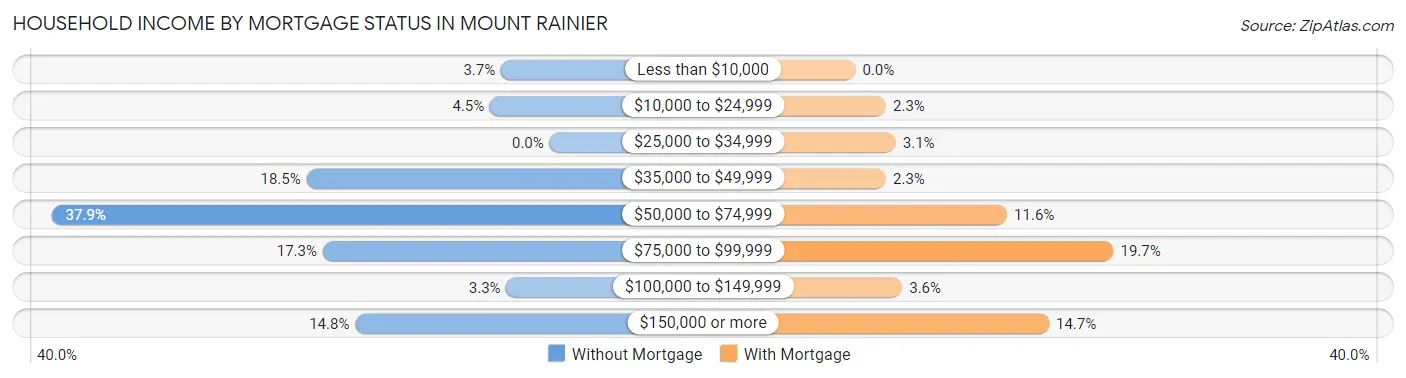
| Household Income | Without Mortgage | With Mortgage |
| Less than $10,000 | 9 (3.7%) | 0 (0.0%) |
| $10,000 to $24,999 | 11 (4.5%) | 19 (2.3%) |
| $25,000 to $34,999 | 0 (0.0%) | 25 (3.1%) |
| $35,000 to $49,999 | 45 (18.5%) | 19 (2.3%) |
| $50,000 to $74,999 | 92 (37.9%) | 94 (11.6%) |
| $75,000 to $99,999 | 42 (17.3%) | 160 (19.7%) |
| $100,000 to $149,999 | 8 (3.3%) | 29 (3.6%) |
| $150,000 or more | 36 (14.8%) | 120 (14.7%) |
| Total | 243 (100.0%) | 814 (100.0%) |
Property Value to Household Income Ratio in Mount Rainier
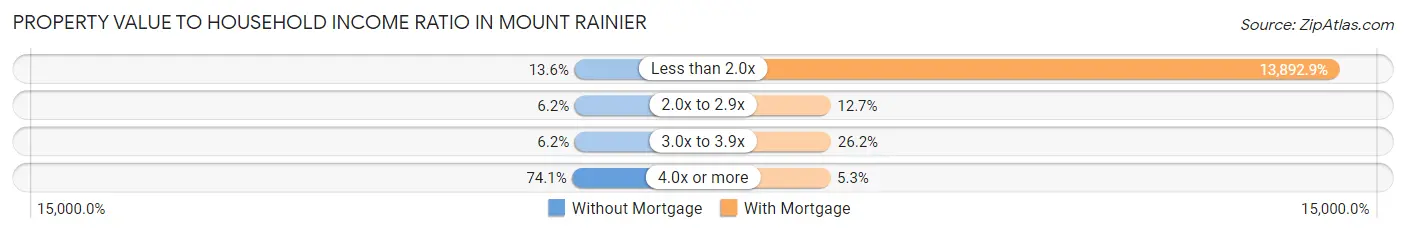
| Value-to-Income Ratio | Without Mortgage | With Mortgage |
| Less than 2.0x | 33 (13.6%) | 113,088 (13,892.9%) |
| 2.0x to 2.9x | 15 (6.2%) | 103 (12.7%) |
| 3.0x to 3.9x | 15 (6.2%) | 213 (26.2%) |
| 4.0x or more | 180 (74.1%) | 43 (5.3%) |
| Total | 243 (100.0%) | 814 (100.0%) |
Real Estate Taxes by Mortgage Status in Mount Rainier
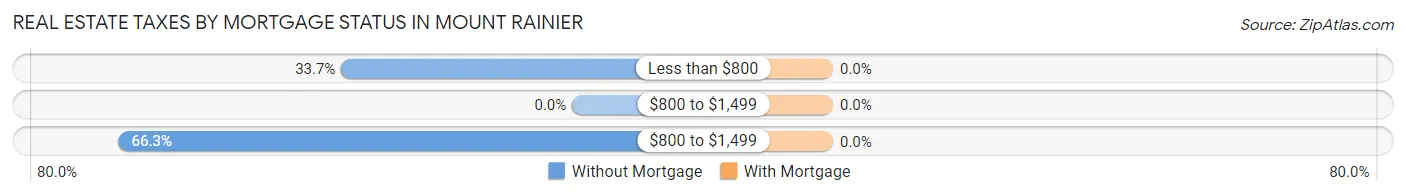
| Property Taxes | Without Mortgage | With Mortgage |
| Less than $800 | 82 (33.7%) | 0 (0.0%) |
| $800 to $1,499 | 0 (0.0%) | 0 (0.0%) |
| $800 to $1,499 | 161 (66.3%) | 0 (0.0%) |
| Total | 243 (100.0%) | 814 (100.0%) |
Health & Disability in Mount Rainier
Health Insurance Coverage by Age in Mount Rainier
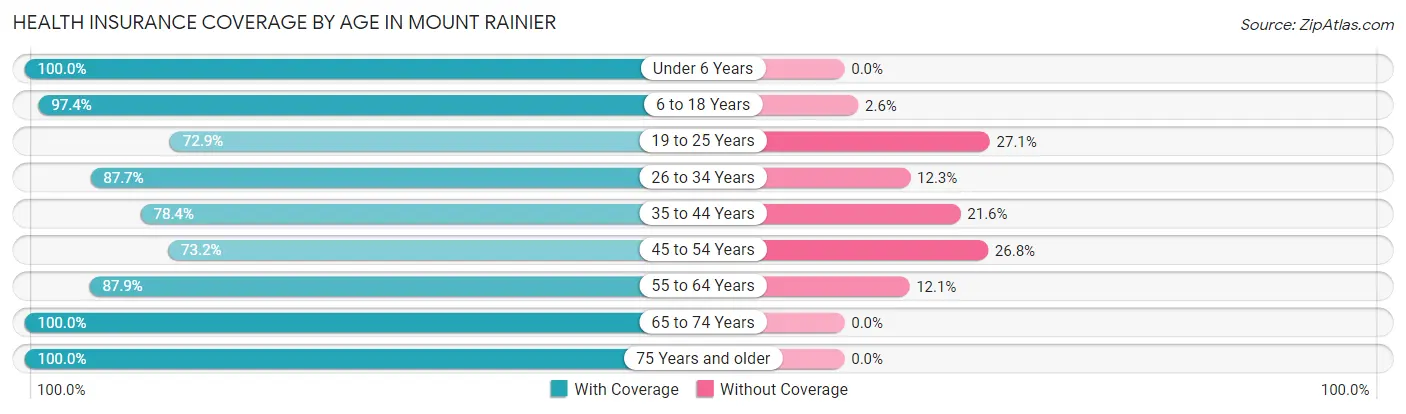
| Age Bracket | With Coverage | Without Coverage |
| Under 6 Years | 558 (100.0%) | 0 (0.0%) |
| 6 to 18 Years | 1,059 (97.4%) | 28 (2.6%) |
| 19 to 25 Years | 390 (72.9%) | 145 (27.1%) |
| 26 to 34 Years | 922 (87.7%) | 129 (12.3%) |
| 35 to 44 Years | 1,220 (78.4%) | 337 (21.6%) |
| 45 to 54 Years | 700 (73.2%) | 256 (26.8%) |
| 55 to 64 Years | 1,228 (87.9%) | 169 (12.1%) |
| 65 to 74 Years | 858 (100.0%) | 0 (0.0%) |
| 75 Years and older | 216 (100.0%) | 0 (0.0%) |
| Total | 7,151 (87.1%) | 1,064 (13.0%) |
Health Insurance Coverage by Citizenship Status in Mount Rainier
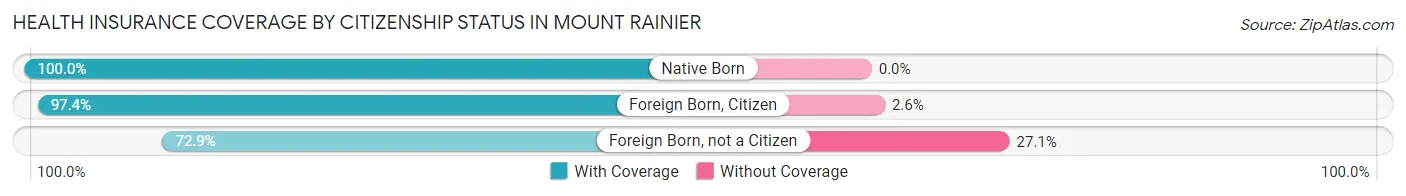
| Citizenship Status | With Coverage | Without Coverage |
| Native Born | 558 (100.0%) | 0 (0.0%) |
| Foreign Born, Citizen | 1,059 (97.4%) | 28 (2.6%) |
| Foreign Born, not a Citizen | 390 (72.9%) | 145 (27.1%) |
Health Insurance Coverage by Household Income in Mount Rainier
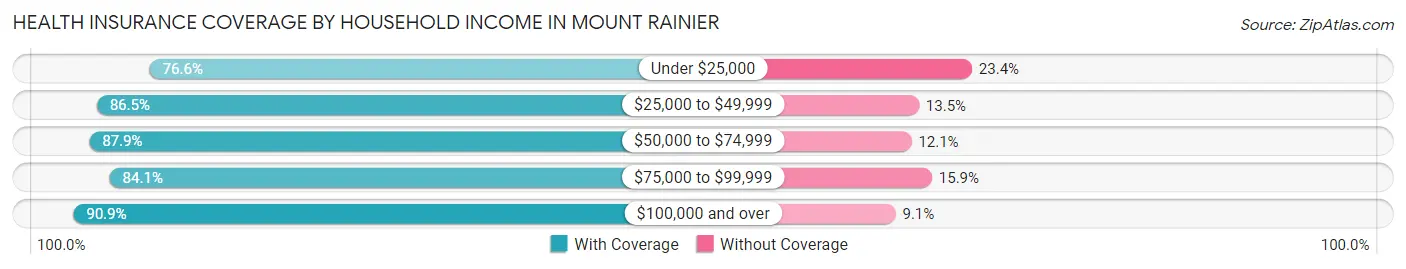
| Household Income | With Coverage | Without Coverage |
| Under $25,000 | 480 (76.6%) | 147 (23.4%) |
| $25,000 to $49,999 | 1,319 (86.5%) | 206 (13.5%) |
| $50,000 to $74,999 | 2,047 (87.9%) | 282 (12.1%) |
| $75,000 to $99,999 | 891 (84.1%) | 169 (15.9%) |
| $100,000 and over | 2,410 (90.9%) | 242 (9.1%) |
Public vs Private Health Insurance Coverage by Age in Mount Rainier
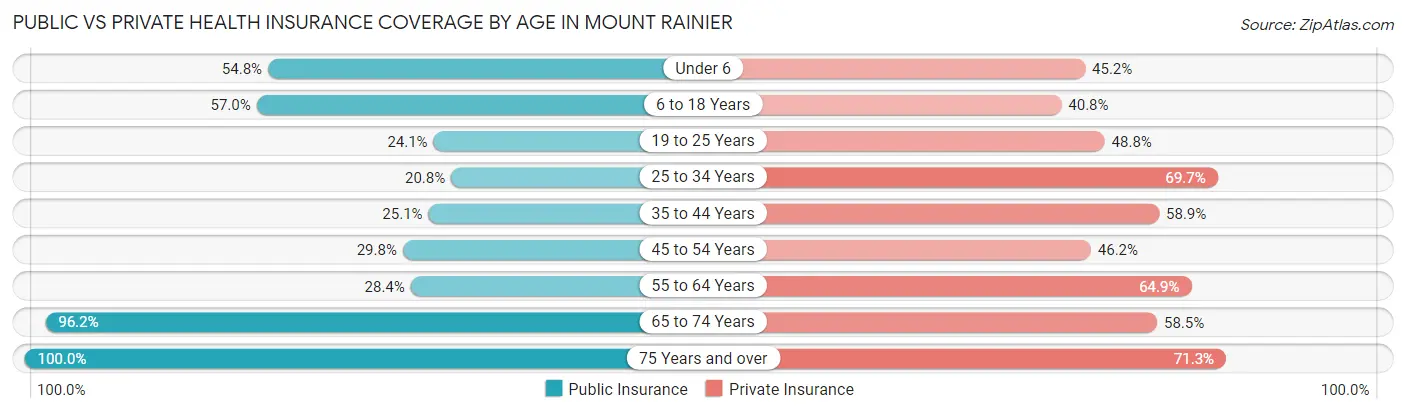
| Age Bracket | Public Insurance | Private Insurance |
| Under 6 | 306 (54.8%) | 252 (45.2%) |
| 6 to 18 Years | 619 (57.0%) | 443 (40.7%) |
| 19 to 25 Years | 129 (24.1%) | 261 (48.8%) |
| 25 to 34 Years | 219 (20.8%) | 733 (69.7%) |
| 35 to 44 Years | 390 (25.1%) | 917 (58.9%) |
| 45 to 54 Years | 285 (29.8%) | 442 (46.2%) |
| 55 to 64 Years | 396 (28.3%) | 906 (64.8%) |
| 65 to 74 Years | 825 (96.2%) | 502 (58.5%) |
| 75 Years and over | 216 (100.0%) | 154 (71.3%) |
| Total | 3,385 (41.2%) | 4,610 (56.1%) |
Disability Status by Sex by Age in Mount Rainier
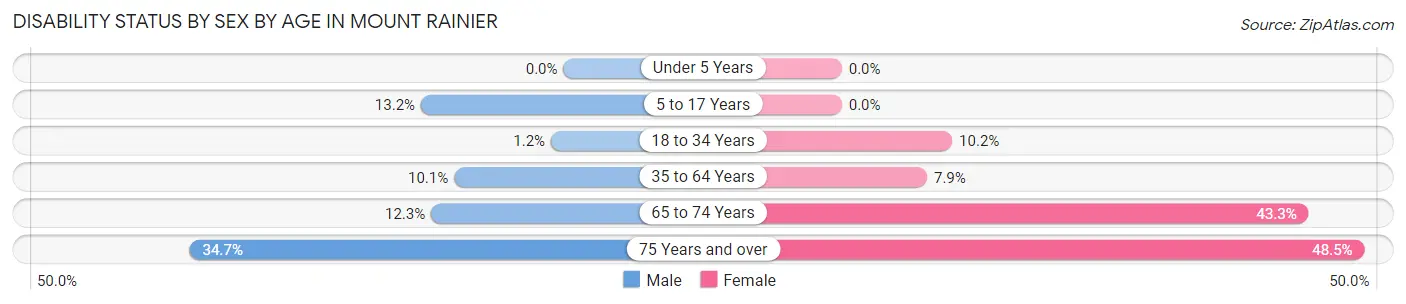
| Age Bracket | Male | Female |
| Under 5 Years | 0 (0.0%) | 0 (0.0%) |
| 5 to 17 Years | 80 (13.2%) | 0 (0.0%) |
| 18 to 34 Years | 8 (1.1%) | 95 (10.2%) |
| 35 to 64 Years | 199 (10.1%) | 154 (7.9%) |
| 65 to 74 Years | 64 (12.3%) | 146 (43.3%) |
| 75 Years and over | 17 (34.7%) | 81 (48.5%) |
Disability Class by Sex by Age in Mount Rainier
Disability Class: Hearing Difficulty
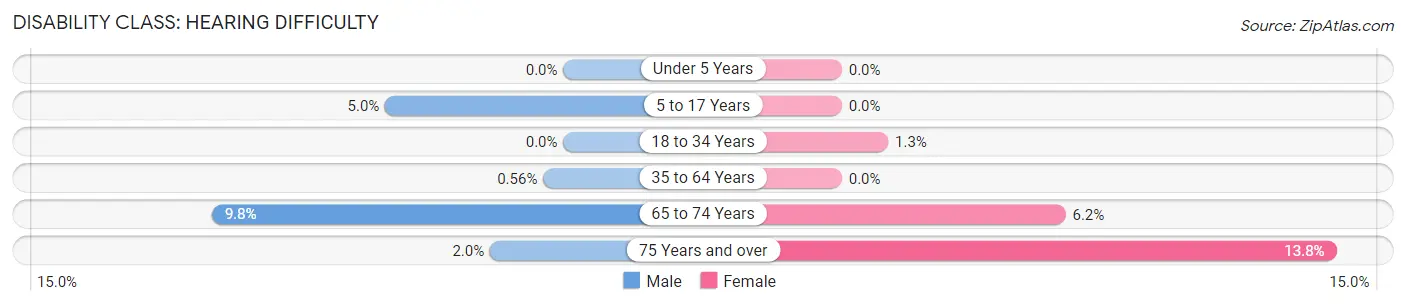
| Age Bracket | Male | Female |
| Under 5 Years | 0 (0.0%) | 0 (0.0%) |
| 5 to 17 Years | 30 (5.0%) | 0 (0.0%) |
| 18 to 34 Years | 0 (0.0%) | 12 (1.3%) |
| 35 to 64 Years | 11 (0.6%) | 0 (0.0%) |
| 65 to 74 Years | 51 (9.8%) | 21 (6.2%) |
| 75 Years and over | 1 (2.0%) | 23 (13.8%) |
Disability Class: Vision Difficulty
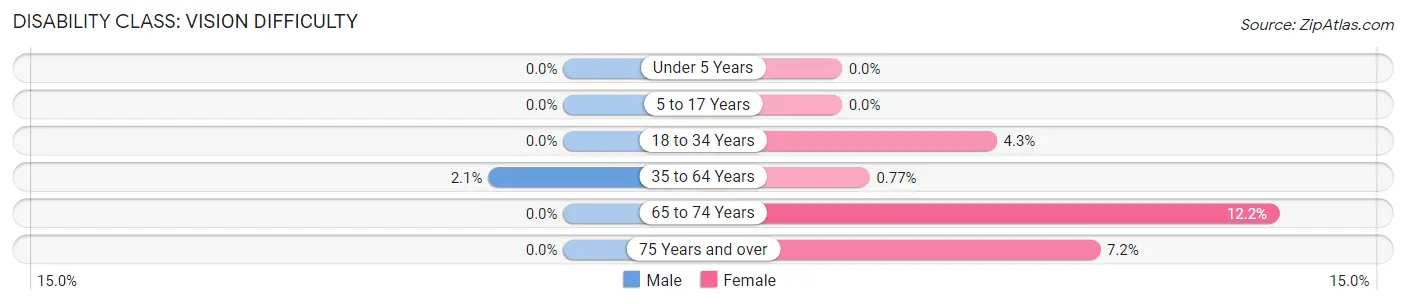
| Age Bracket | Male | Female |
| Under 5 Years | 0 (0.0%) | 0 (0.0%) |
| 5 to 17 Years | 0 (0.0%) | 0 (0.0%) |
| 18 to 34 Years | 0 (0.0%) | 40 (4.3%) |
| 35 to 64 Years | 41 (2.1%) | 15 (0.8%) |
| 65 to 74 Years | 0 (0.0%) | 41 (12.2%) |
| 75 Years and over | 0 (0.0%) | 12 (7.2%) |
Disability Class: Cognitive Difficulty
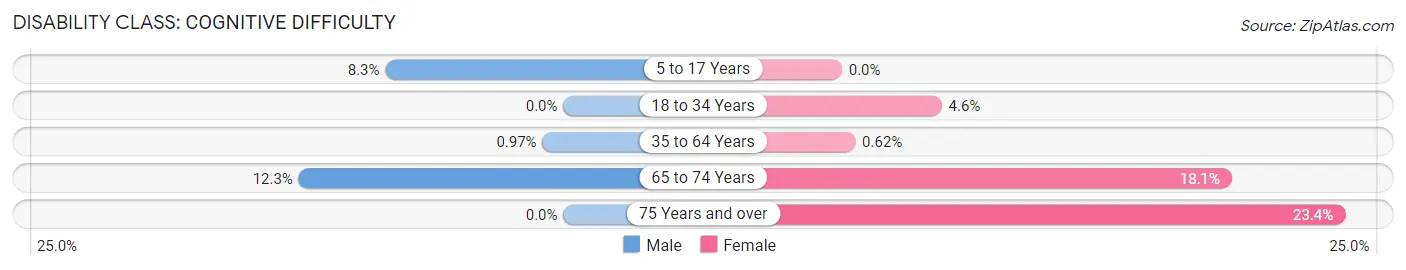
| Age Bracket | Male | Female |
| 5 to 17 Years | 50 (8.3%) | 0 (0.0%) |
| 18 to 34 Years | 0 (0.0%) | 43 (4.6%) |
| 35 to 64 Years | 19 (1.0%) | 12 (0.6%) |
| 65 to 74 Years | 64 (12.3%) | 61 (18.1%) |
| 75 Years and over | 0 (0.0%) | 39 (23.4%) |
Disability Class: Ambulatory Difficulty
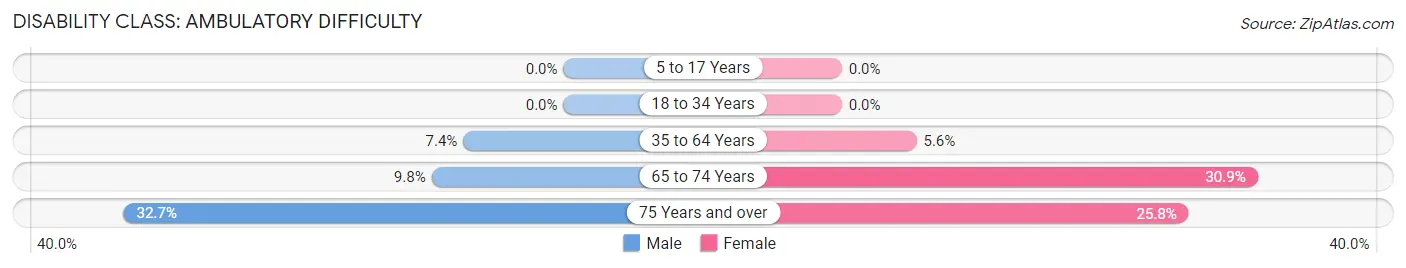
| Age Bracket | Male | Female |
| 5 to 17 Years | 0 (0.0%) | 0 (0.0%) |
| 18 to 34 Years | 0 (0.0%) | 0 (0.0%) |
| 35 to 64 Years | 146 (7.4%) | 108 (5.6%) |
| 65 to 74 Years | 51 (9.8%) | 104 (30.9%) |
| 75 Years and over | 16 (32.7%) | 43 (25.8%) |
Disability Class: Self-Care Difficulty
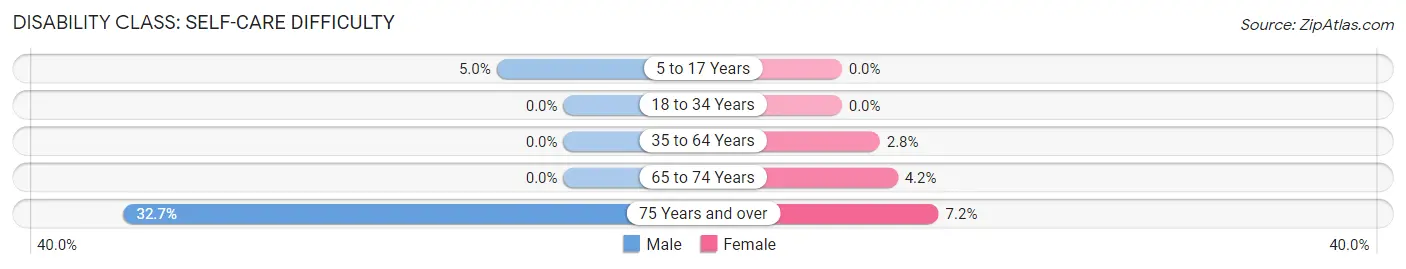
| Age Bracket | Male | Female |
| 5 to 17 Years | 30 (5.0%) | 0 (0.0%) |
| 18 to 34 Years | 0 (0.0%) | 0 (0.0%) |
| 35 to 64 Years | 0 (0.0%) | 55 (2.8%) |
| 65 to 74 Years | 0 (0.0%) | 14 (4.2%) |
| 75 Years and over | 16 (32.7%) | 12 (7.2%) |
Technology Access in Mount Rainier
Computing Device Access in Mount Rainier
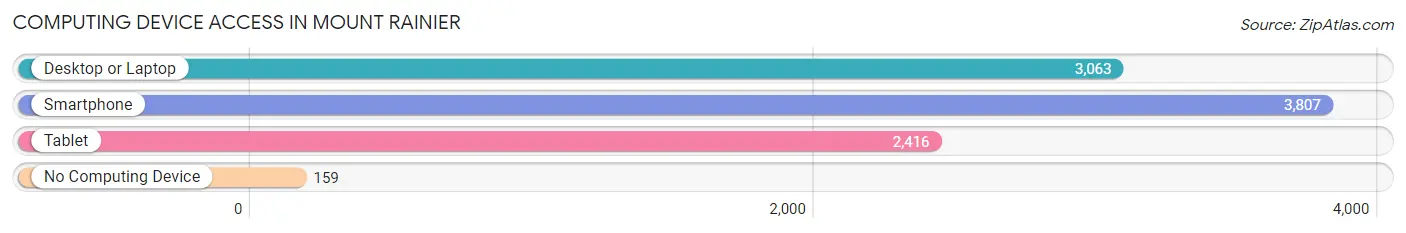
| Device Type | # Households | % Households |
| Desktop or Laptop | 3,063 | 73.8% |
| Smartphone | 3,807 | 91.7% |
| Tablet | 2,416 | 58.2% |
| No Computing Device | 159 | 3.8% |
| Total | 4,153 | 100.0% |
Internet Access in Mount Rainier
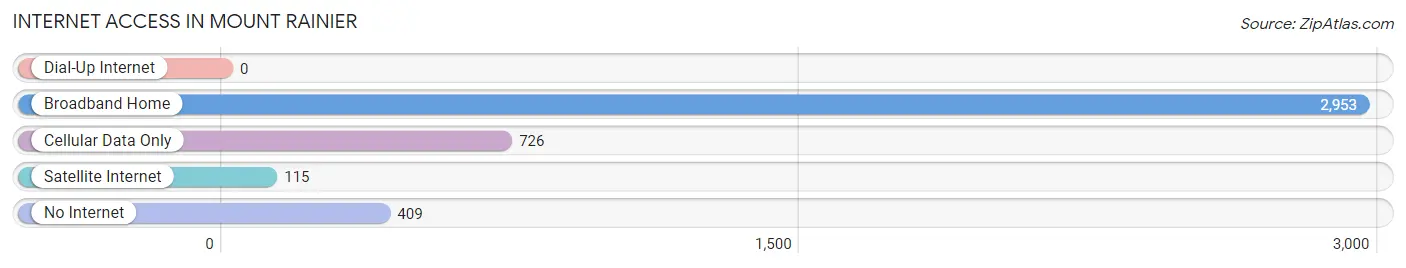
| Internet Type | # Households | % Households |
| Dial-Up Internet | 0 | 0.0% |
| Broadband Home | 2,953 | 71.1% |
| Cellular Data Only | 726 | 17.5% |
| Satellite Internet | 115 | 2.8% |
| No Internet | 409 | 9.9% |
| Total | 4,153 | 100.0% |
Mount Rainier Summary
Rainier, Maryland is a small town located in Prince George’s County, Maryland, United States. It is situated on the east side of the Anacostia River, about 10 miles south of Washington, D.C. The town was founded in 1854 and is named after the nearby Mount Rainier, a dormant volcano located in the Cascade Range of the Pacific Northwest.
History
The area that is now Rainier was originally inhabited by the Piscataway Indians, who were part of the Algonquian-speaking peoples. The first European settlers arrived in the area in the late 17th century, and the town was officially founded in 1854. The town was named after the nearby Mount Rainier, a dormant volcano located in the Cascade Range of the Pacific Northwest.
In the late 19th century, the town was a popular destination for wealthy Washingtonians looking to escape the hustle and bustle of the city. The town was also home to a number of large estates, including the historic Rainier Mansion, which was built in 1891 and is now listed on the National Register of Historic Places.
In the early 20th century, the town began to decline as the wealthy residents moved away and the town’s economy shifted to a more industrial base. The town was incorporated in 1945 and has since seen a resurgence in population and economic activity.
Geography
Rainier is located in Prince George’s County, Maryland, about 10 miles south of Washington, D.C. The town is situated on the east side of the Anacostia River, and is bordered by the towns of Bladensburg, Colmar Manor, and Cottage City. The town covers an area of 1.2 square miles, and has a population of approximately 1,500 people.
The town is located in a hilly area, with the highest point being the summit of Mount Rainier, which is located just outside of town. The town is also home to several parks, including the Rainier Nature Park, which features a variety of outdoor activities, including hiking, biking, and fishing.
Economy
Rainier’s economy is largely based on the service industry, with many residents employed in retail, hospitality, and healthcare. The town is also home to a number of small businesses, including restaurants, shops, and professional services.
The town is also home to a number of government agencies, including the National Park Service, the U.S. Fish and Wildlife Service, and the U.S. Department of Agriculture.
Demographics
As of the 2010 census, Rainier had a population of 1,500 people. The racial makeup of the town was 79.3% White, 11.3% African American, 0.7% Native American, 0.7% Asian, 0.3% Pacific Islander, and 6.7% from other races. The median household income was $50,000, and the median family income was $54,000.
Rainier is a small, close-knit community, and the town is known for its strong sense of community and neighborly spirit. The town is also home to a number of churches, including the Rainier United Methodist Church, the Rainier Baptist Church, and the Rainier Presbyterian Church.
Common Questions
What is Per Capita Income in Mount Rainier?
Per Capita income in Mount Rainier is $39,471.
What is the Median Family Income in Mount Rainier?
Median Family Income in Mount Rainier is $83,688.
What is the Median Household income in Mount Rainier?
Median Household Income in Mount Rainier is $64,170.
What is Income or Wage Gap in Mount Rainier?
Income or Wage Gap in Mount Rainier is 11.1%.
Women in Mount Rainier earn 88.9 cents for every dollar earned by a man.
What is Inequality or Gini Index in Mount Rainier?
Inequality or Gini Index in Mount Rainier is 0.40.
What is the Total Population of Mount Rainier?
Total Population of Mount Rainier is 8,262.
What is the Total Male Population of Mount Rainier?
Total Male Population of Mount Rainier is 4,034.
What is the Total Female Population of Mount Rainier?
Total Female Population of Mount Rainier is 4,228.
What is the Ratio of Males per 100 Females in Mount Rainier?
There are 95.41 Males per 100 Females in Mount Rainier.
What is the Ratio of Females per 100 Males in Mount Rainier?
There are 104.81 Females per 100 Males in Mount Rainier.
What is the Median Population Age in Mount Rainier?
Median Population Age in Mount Rainier is 40.5 Years.
What is the Average Family Size in Mount Rainier
Average Family Size in Mount Rainier is 3.0 People.
What is the Average Household Size in Mount Rainier
Average Household Size in Mount Rainier is 2.0 People.
How Large is the Labor Force in Mount Rainier?
There are 5,253 People in the Labor Forcein in Mount Rainier.
What is the Percentage of People in the Labor Force in Mount Rainier?
76.2% of People are in the Labor Force in Mount Rainier.
What is the Unemployment Rate in Mount Rainier?
Unemployment Rate in Mount Rainier is 4.4%.