Framingham, MA Map & Demographics
Framingham Map
Framingham Overview
$52,370
PER CAPITA INCOME
$116,954
AVG FAMILY INCOME
$94,909
AVG HOUSEHOLD INCOME
25.2%
WAGE / INCOME GAP [ % ]
74.8¢/ $1
WAGE / INCOME GAP [ $ ]
$11,070
FAMILY INCOME DEFICIT
0.47
INEQUALITY / GINI INDEX
71,805
TOTAL POPULATION
36,005
MALE POPULATION
35,800
FEMALE POPULATION
100.57
MALES / 100 FEMALES
99.43
FEMALES / 100 MALES
38.8
MEDIAN AGE
3.0
AVG FAMILY SIZE
2.5
AVG HOUSEHOLD SIZE
41,172
LABOR FORCE [ PEOPLE ]
71.0%
PERCENT IN LABOR FORCE
5.0%
UNEMPLOYMENT RATE
Income in Framingham
Income Overview in Framingham
Per Capita Income in Framingham is $52,370, while median incomes of families and households are $116,954 and $94,909 respectively.
| Characteristic | Number | Measure |
| Per Capita Income | 71,805 | $52,370 |
| Median Family Income | 18,319 | $116,954 |
| Mean Family Income | 18,319 | $158,497 |
| Median Household Income | 27,810 | $94,909 |
| Mean Household Income | 27,810 | $134,334 |
| Income Deficit | 18,319 | $11,070 |
| Wage / Income Gap (%) | 71,805 | 25.16% |
| Wage / Income Gap ($) | 71,805 | 74.84¢ per $1 |
| Gini / Inequality Index | 71,805 | 0.47 |
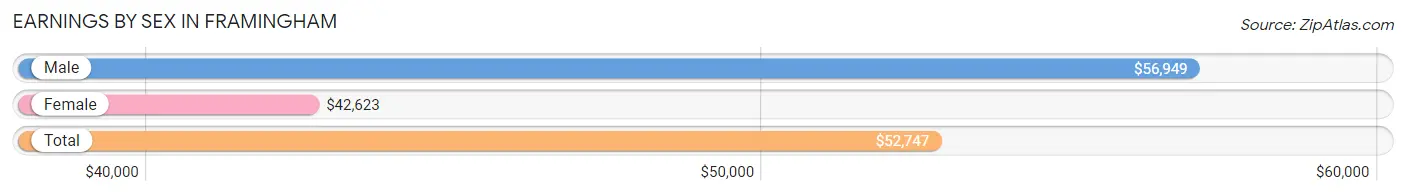
Earnings by Sex in Framingham
Average Earnings in Framingham are $52,747, $56,949 for men and $42,623 for women, a difference of 25.2%.
| Sex | Number | Average Earnings |
| Male | 22,739 (53.8%) | $56,949 |
| Female | 19,525 (46.2%) | $42,623 |
| Total | 42,264 (100.0%) | $52,747 |
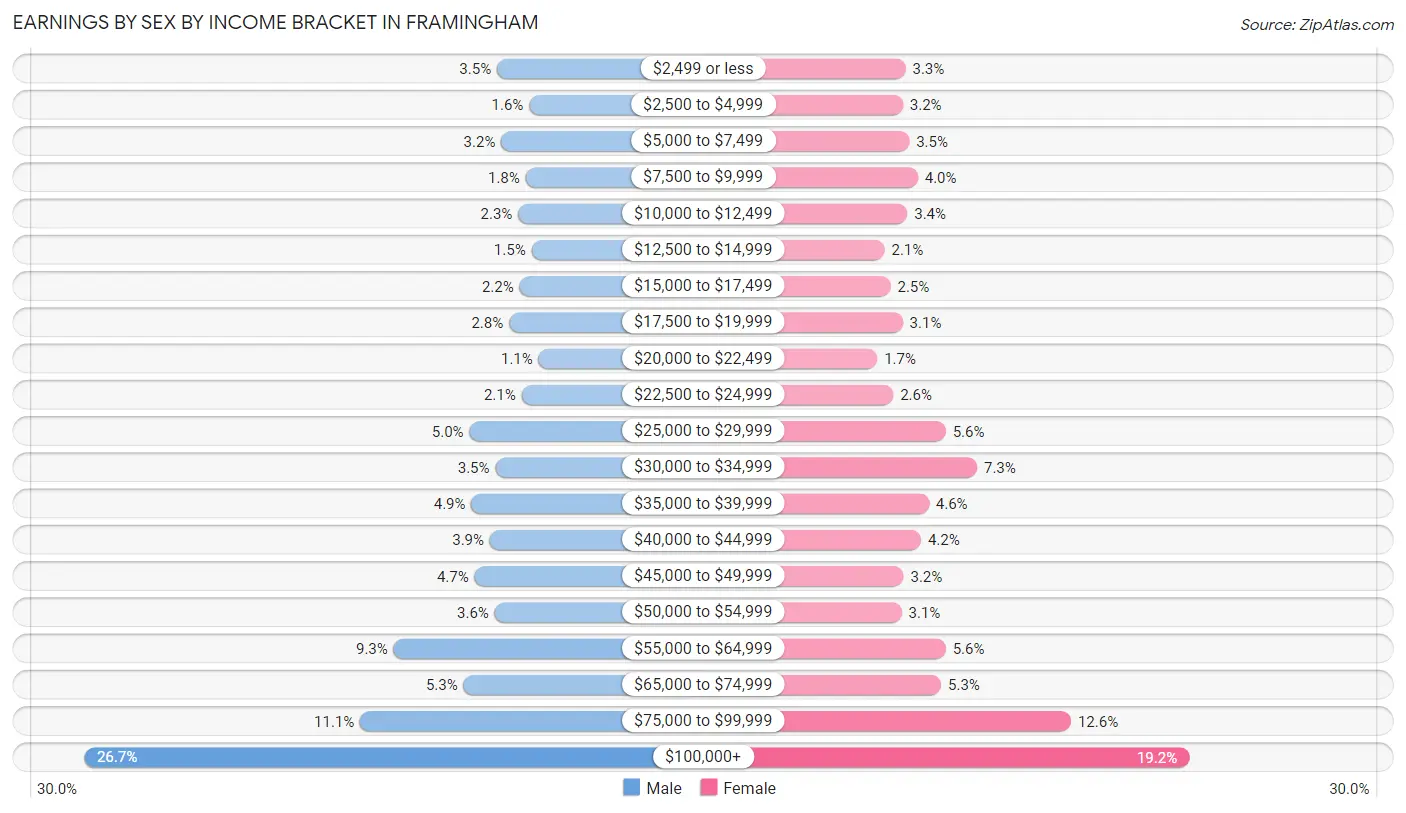
Earnings by Sex by Income Bracket in Framingham
The most common earnings brackets in Framingham are $100,000+ for men (6,062 | 26.7%) and $100,000+ for women (3,754 | 19.2%).
| Income | Male | Female |
| $2,499 or less | 785 (3.5%) | 645 (3.3%) |
| $2,500 to $4,999 | 374 (1.6%) | 615 (3.2%) |
| $5,000 to $7,499 | 730 (3.2%) | 685 (3.5%) |
| $7,500 to $9,999 | 418 (1.8%) | 779 (4.0%) |
| $10,000 to $12,499 | 513 (2.3%) | 664 (3.4%) |
| $12,500 to $14,999 | 344 (1.5%) | 413 (2.1%) |
| $15,000 to $17,499 | 496 (2.2%) | 480 (2.5%) |
| $17,500 to $19,999 | 631 (2.8%) | 613 (3.1%) |
| $20,000 to $22,499 | 252 (1.1%) | 333 (1.7%) |
| $22,500 to $24,999 | 470 (2.1%) | 510 (2.6%) |
| $25,000 to $29,999 | 1,138 (5.0%) | 1,085 (5.6%) |
| $30,000 to $34,999 | 806 (3.5%) | 1,430 (7.3%) |
| $35,000 to $39,999 | 1,111 (4.9%) | 900 (4.6%) |
| $40,000 to $44,999 | 875 (3.8%) | 814 (4.2%) |
| $45,000 to $49,999 | 1,070 (4.7%) | 623 (3.2%) |
| $50,000 to $54,999 | 813 (3.6%) | 601 (3.1%) |
| $55,000 to $64,999 | 2,106 (9.3%) | 1,085 (5.6%) |
| $65,000 to $74,999 | 1,211 (5.3%) | 1,035 (5.3%) |
| $75,000 to $99,999 | 2,534 (11.1%) | 2,461 (12.6%) |
| $100,000+ | 6,062 (26.7%) | 3,754 (19.2%) |
| Total | 22,739 (100.0%) | 19,525 (100.0%) |
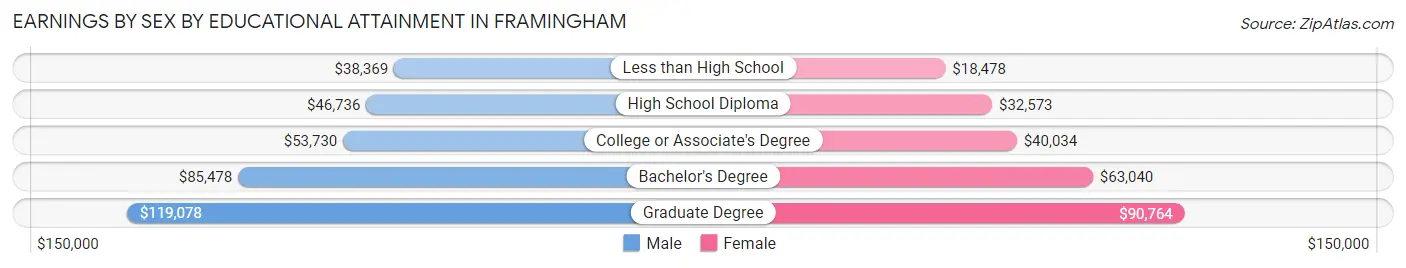
Earnings by Sex by Educational Attainment in Framingham
Average earnings in Framingham are $64,124 for men and $51,983 for women, a difference of 18.9%. Men with an educational attainment of graduate degree enjoy the highest average annual earnings of $119,078, while those with less than high school education earn the least with $38,369. Women with an educational attainment of graduate degree earn the most with the average annual earnings of $90,764, while those with less than high school education have the smallest earnings of $18,478.
| Educational Attainment | Male Income | Female Income |
| Less than High School | $38,369 | $18,478 |
| High School Diploma | $46,736 | $32,573 |
| College or Associate's Degree | $53,730 | $40,034 |
| Bachelor's Degree | $85,478 | $63,040 |
| Graduate Degree | $119,078 | $90,764 |
| Total | $64,124 | $51,983 |
Family Income in Framingham
Family Income Brackets in Framingham
According to the Framingham family income data, there are 5,129 families falling into the $200,000+ income range, which is the most common income bracket and makes up 28.0% of all families. Conversely, the $10,000 to $14,999 income bracket is the least frequent group with only 421 families (2.3%) belonging to this category.
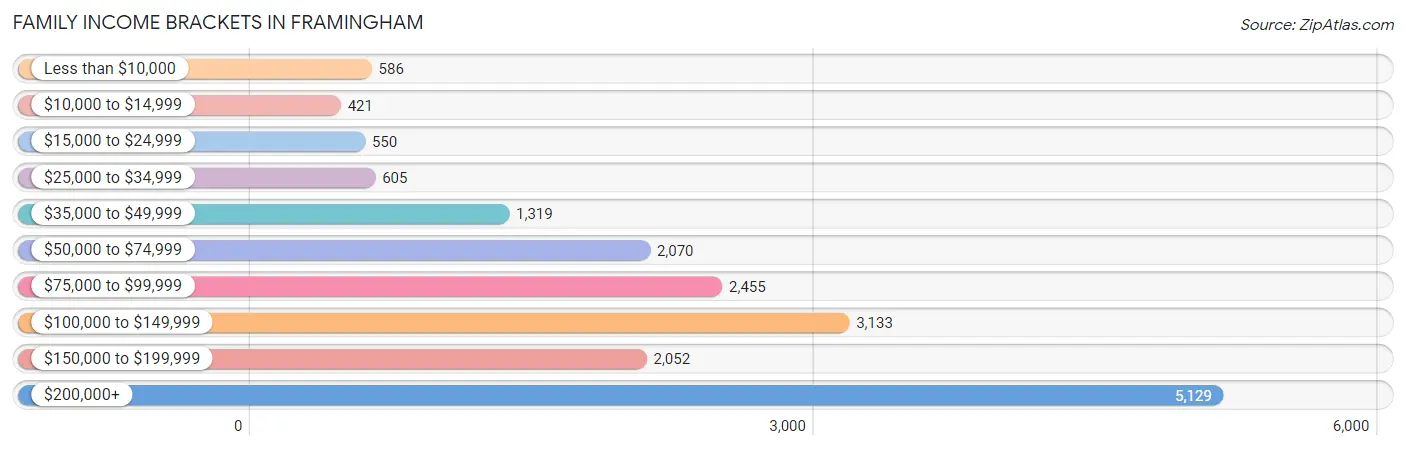
| Income Bracket | # Families | % Families |
| Less than $10,000 | 586 | 3.2% |
| $10,000 to $14,999 | 421 | 2.3% |
| $15,000 to $24,999 | 550 | 3.0% |
| $25,000 to $34,999 | 605 | 3.3% |
| $35,000 to $49,999 | 1,319 | 7.2% |
| $50,000 to $74,999 | 2,070 | 11.3% |
| $75,000 to $99,999 | 2,455 | 13.4% |
| $100,000 to $149,999 | 3,133 | 17.1% |
| $150,000 to $199,999 | 2,052 | 11.2% |
| $200,000+ | 5,129 | 28.0% |
Family Income by Famaliy Size in Framingham
6-person families (158 | 0.9%) account for the highest median family income in Framingham with $198,571 per family, while 2-person families (8,293 | 45.3%) have the highest median income of $48,895 per family member.
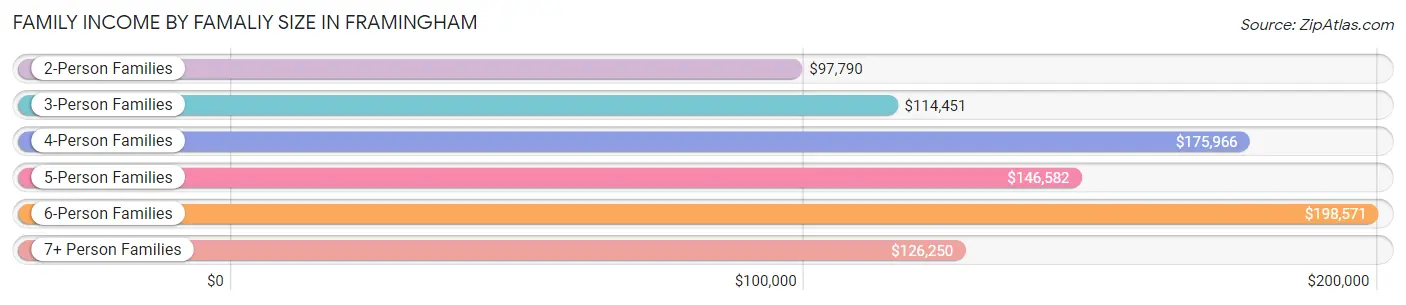
| Income Bracket | # Families | Median Income |
| 2-Person Families | 8,293 (45.3%) | $97,790 |
| 3-Person Families | 4,566 (24.9%) | $114,451 |
| 4-Person Families | 3,734 (20.4%) | $175,966 |
| 5-Person Families | 1,350 (7.4%) | $146,582 |
| 6-Person Families | 158 (0.9%) | $198,571 |
| 7+ Person Families | 218 (1.2%) | $126,250 |
| Total | 18,319 (100.0%) | $116,954 |
Family Income by Number of Earners in Framingham
The median family income in Framingham is $116,954, with families comprising 3+ earners (2,685) having the highest median family income of $190,525, while families with no earners (2,258) have the lowest median family income of $48,125, accounting for 14.7% and 12.3% of families, respectively.
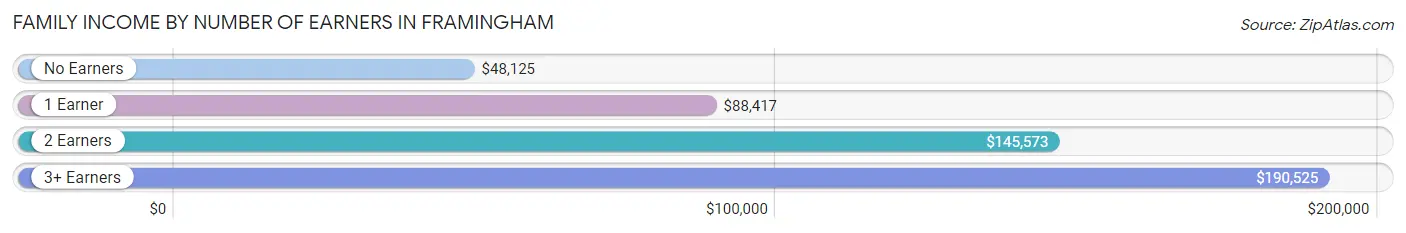
| Number of Earners | # Families | Median Income |
| No Earners | 2,258 (12.3%) | $48,125 |
| 1 Earner | 4,831 (26.4%) | $88,417 |
| 2 Earners | 8,545 (46.7%) | $145,573 |
| 3+ Earners | 2,685 (14.7%) | $190,525 |
| Total | 18,319 (100.0%) | $116,954 |
Household Income in Framingham
Household Income Brackets in Framingham
With 6,007 households falling in the category, the $200,000+ income range is the most frequent in Framingham, accounting for 21.6% of all households. In contrast, only 918 households (3.3%) fall into the $25,000 to $34,999 income bracket, making it the least populous group.
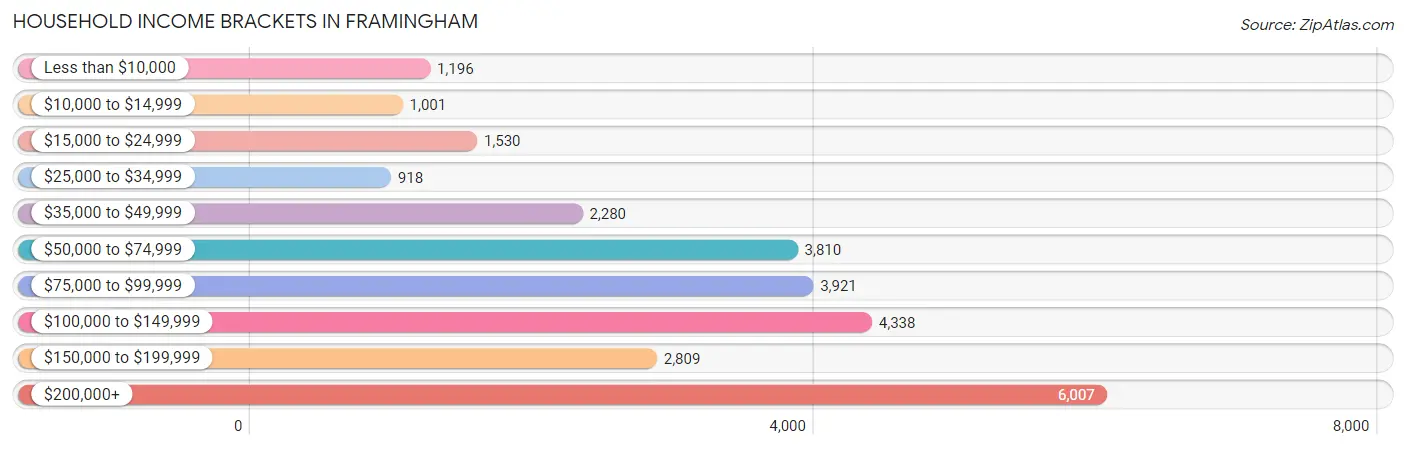
| Income Bracket | # Households | % Households |
| Less than $10,000 | 1,196 | 4.3% |
| $10,000 to $14,999 | 1,001 | 3.6% |
| $15,000 to $24,999 | 1,530 | 5.5% |
| $25,000 to $34,999 | 918 | 3.3% |
| $35,000 to $49,999 | 2,280 | 8.2% |
| $50,000 to $74,999 | 3,810 | 13.7% |
| $75,000 to $99,999 | 3,921 | 14.1% |
| $100,000 to $149,999 | 4,338 | 15.6% |
| $150,000 to $199,999 | 2,809 | 10.1% |
| $200,000+ | 6,007 | 21.6% |
Household Income by Householder Age in Framingham
The median household income in Framingham is $94,909, with the highest median household income of $116,949 found in the 45 to 64 years age bracket for the primary householder. A total of 10,507 households (37.8%) fall into this category. Meanwhile, the 65+ years age bracket for the primary householder has the lowest median household income of $71,250, with 6,838 households (24.6%) in this group.
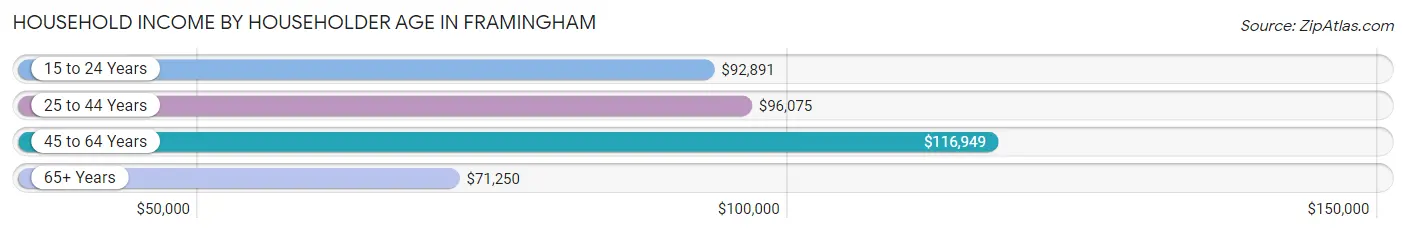
| Income Bracket | # Households | Median Income |
| 15 to 24 Years | 669 (2.4%) | $92,891 |
| 25 to 44 Years | 9,796 (35.2%) | $96,075 |
| 45 to 64 Years | 10,507 (37.8%) | $116,949 |
| 65+ Years | 6,838 (24.6%) | $71,250 |
| Total | 27,810 (100.0%) | $94,909 |
Poverty in Framingham
Income Below Poverty by Sex and Age in Framingham
With 9.0% poverty level for males and 11.7% for females among the residents of Framingham, 15 year old males and 12 to 14 year old females are the most vulnerable to poverty, with 110 males (28.0%) and 246 females (24.7%) in their respective age groups living below the poverty level.
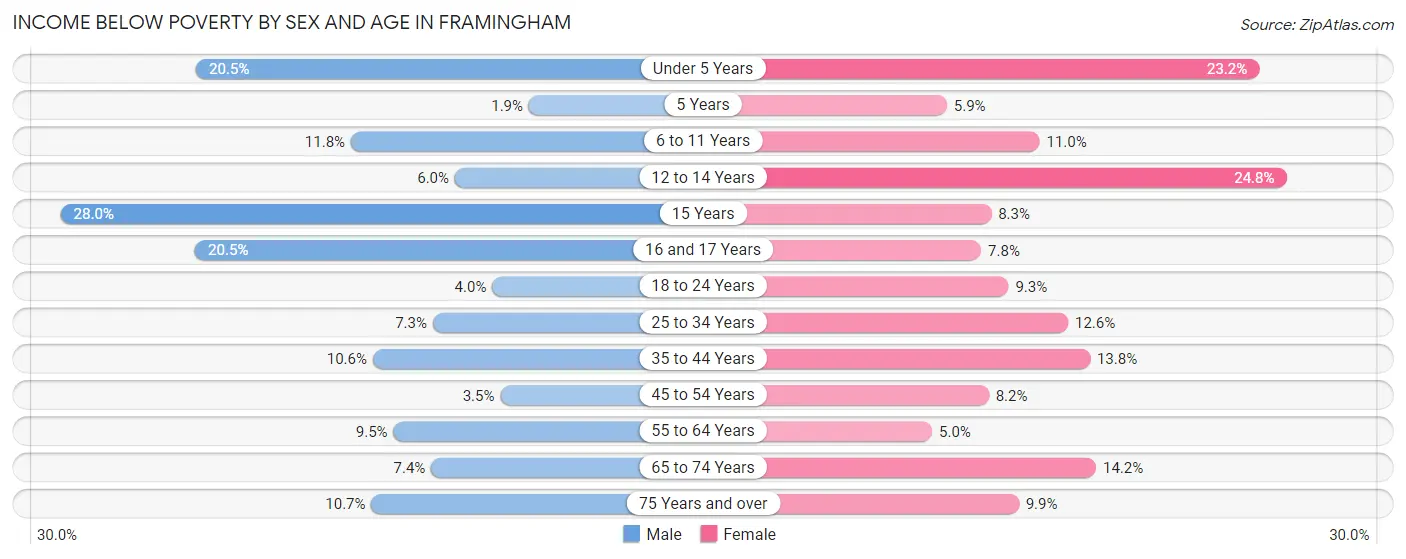
| Age Bracket | Male | Female |
| Under 5 Years | 402 (20.4%) | 509 (23.2%) |
| 5 Years | 12 (1.9%) | 25 (5.9%) |
| 6 to 11 Years | 349 (11.8%) | 254 (11.0%) |
| 12 to 14 Years | 64 (6.0%) | 246 (24.7%) |
| 15 Years | 110 (28.0%) | 44 (8.3%) |
| 16 and 17 Years | 163 (20.5%) | 43 (7.8%) |
| 18 to 24 Years | 130 (4.0%) | 197 (9.3%) |
| 25 to 34 Years | 326 (7.3%) | 647 (12.6%) |
| 35 to 44 Years | 591 (10.6%) | 726 (13.8%) |
| 45 to 54 Years | 155 (3.5%) | 357 (8.2%) |
| 55 to 64 Years | 416 (9.5%) | 205 (5.0%) |
| 65 to 74 Years | 244 (7.4%) | 490 (14.2%) |
| 75 Years and over | 174 (10.7%) | 275 (9.9%) |
| Total | 3,136 (9.0%) | 4,018 (11.7%) |
Income Above Poverty by Sex and Age in Framingham
According to the poverty statistics in Framingham, males aged 5 years and females aged 55 to 64 years are the age groups that are most secure financially, with 98.1% of males and 95.0% of females in these age groups living above the poverty line.
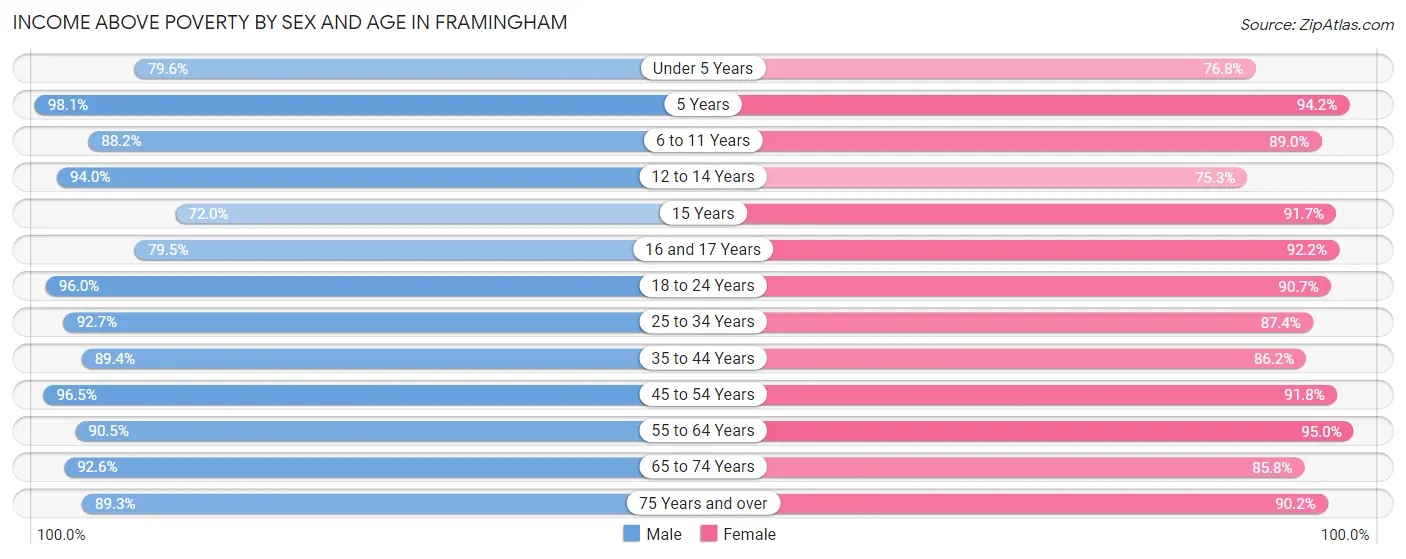
| Age Bracket | Male | Female |
| Under 5 Years | 1,564 (79.5%) | 1,682 (76.8%) |
| 5 Years | 612 (98.1%) | 402 (94.2%) |
| 6 to 11 Years | 2,601 (88.2%) | 2,052 (89.0%) |
| 12 to 14 Years | 996 (94.0%) | 748 (75.2%) |
| 15 Years | 283 (72.0%) | 485 (91.7%) |
| 16 and 17 Years | 632 (79.5%) | 511 (92.2%) |
| 18 to 24 Years | 3,154 (96.0%) | 1,925 (90.7%) |
| 25 to 34 Years | 4,157 (92.7%) | 4,488 (87.4%) |
| 35 to 44 Years | 4,981 (89.4%) | 4,528 (86.2%) |
| 45 to 54 Years | 4,266 (96.5%) | 4,009 (91.8%) |
| 55 to 64 Years | 3,982 (90.5%) | 3,872 (95.0%) |
| 65 to 74 Years | 3,073 (92.6%) | 2,970 (85.8%) |
| 75 Years and over | 1,453 (89.3%) | 2,518 (90.1%) |
| Total | 31,754 (91.0%) | 30,190 (88.2%) |
Income Below Poverty Among Married-Couple Families in Framingham
The poverty statistics for married-couple families in Framingham show that 4.1% or 581 of the total 14,080 families live below the poverty line. Families with 3 or 4 children have the highest poverty rate of 14.3%, comprising of 103 families. On the other hand, families with 5 or more children have the lowest poverty rate of 0.0%, which includes 0 families.
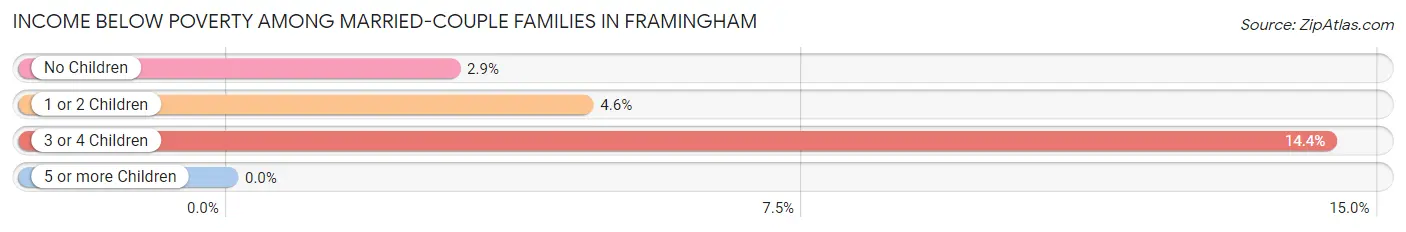
| Children | Above Poverty | Below Poverty |
| No Children | 7,882 (97.1%) | 235 (2.9%) |
| 1 or 2 Children | 4,995 (95.4%) | 243 (4.6%) |
| 3 or 4 Children | 615 (85.7%) | 103 (14.3%) |
| 5 or more Children | 7 (100.0%) | 0 (0.0%) |
| Total | 13,499 (95.9%) | 581 (4.1%) |
Income Below Poverty Among Single-Parent Households in Framingham
According to the poverty data in Framingham, 10.4% or 123 single-father households and 24.6% or 751 single-mother households are living below the poverty line. Among single-father households, those with 1 or 2 children have the highest poverty rate, with 103 households (16.7%) experiencing poverty. Likewise, among single-mother households, those with 1 or 2 children have the highest poverty rate, with 540 households (35.2%) falling below the poverty line.
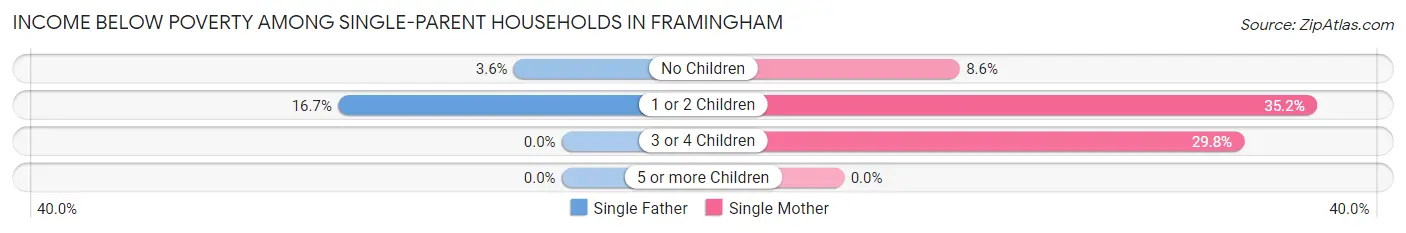
| Children | Single Father | Single Mother |
| No Children | 20 (3.6%) | 95 (8.6%) |
| 1 or 2 Children | 103 (16.7%) | 540 (35.2%) |
| 3 or 4 Children | 0 (0.0%) | 116 (29.8%) |
| 5 or more Children | 0 (0.0%) | 0 (0.0%) |
| Total | 123 (10.4%) | 751 (24.6%) |
Income Below Poverty Among Married-Couple vs Single-Parent Households in Framingham
The poverty data for Framingham shows that 581 of the married-couple family households (4.1%) and 874 of the single-parent households (20.6%) are living below the poverty level. Within the married-couple family households, those with 3 or 4 children have the highest poverty rate, with 103 households (14.3%) falling below the poverty line. Among the single-parent households, those with 1 or 2 children have the highest poverty rate, with 643 household (29.9%) living below poverty.
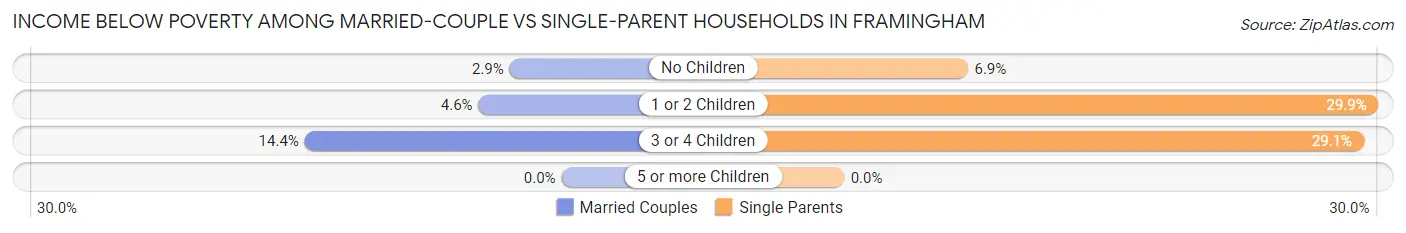
| Children | Married-Couple Families | Single-Parent Households |
| No Children | 235 (2.9%) | 115 (6.9%) |
| 1 or 2 Children | 243 (4.6%) | 643 (29.9%) |
| 3 or 4 Children | 103 (14.3%) | 116 (29.1%) |
| 5 or more Children | 0 (0.0%) | 0 (0.0%) |
| Total | 581 (4.1%) | 874 (20.6%) |
Race in Framingham
The most populous races in Framingham are White / Caucasian (43,158 | 60.1%), Hispanic or Latino (12,576 | 17.5%), and Some other Race (10,240 | 14.3%).
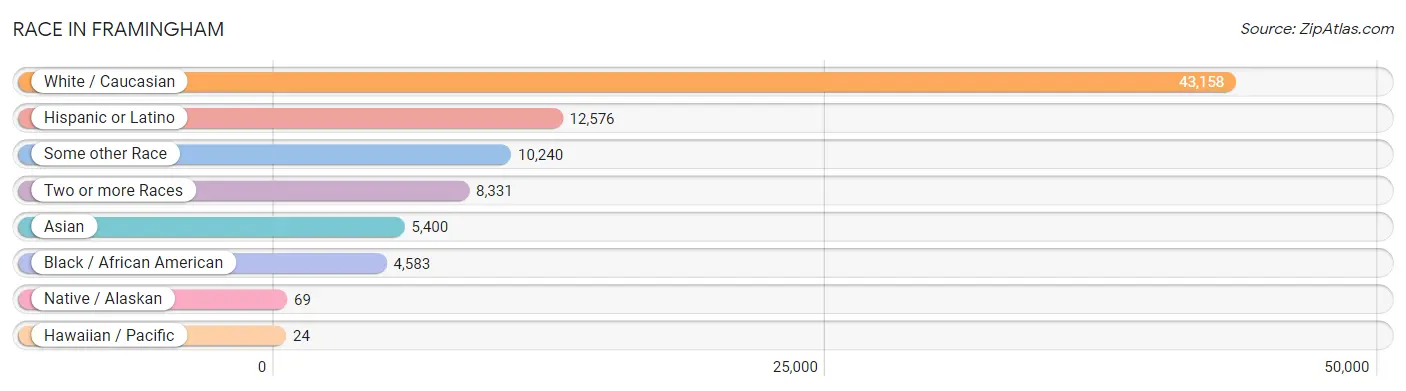
| Race | # Population | % Population |
| Asian | 5,400 | 7.5% |
| Black / African American | 4,583 | 6.4% |
| Hawaiian / Pacific | 24 | 0.0% |
| Hispanic or Latino | 12,576 | 17.5% |
| Native / Alaskan | 69 | 0.1% |
| White / Caucasian | 43,158 | 60.1% |
| Two or more Races | 8,331 | 11.6% |
| Some other Race | 10,240 | 14.3% |
| Total | 71,805 | 100.0% |
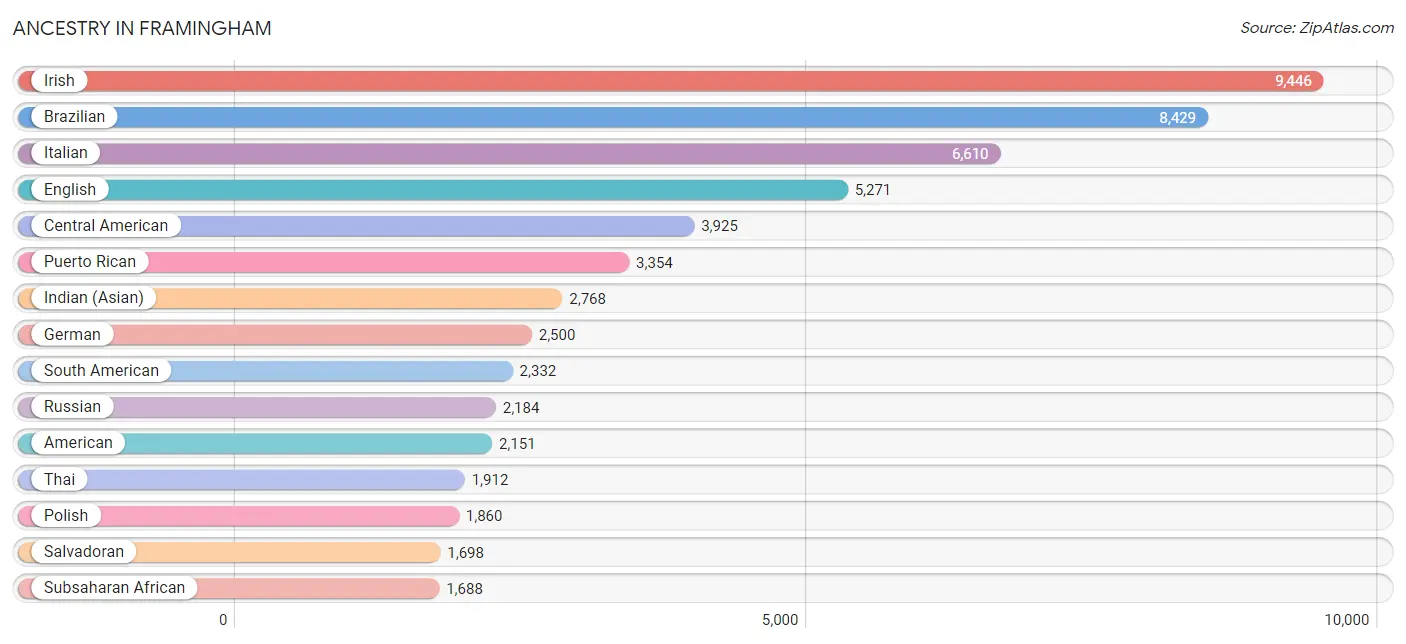
Ancestry in Framingham
The most populous ancestries reported in Framingham are Irish (9,446 | 13.2%), Brazilian (8,429 | 11.7%), Italian (6,610 | 9.2%), English (5,271 | 7.3%), and Central American (3,925 | 5.5%), together accounting for 46.9% of all Framingham residents.
| Ancestry | # Population | % Population |
| African | 549 | 0.8% |
| Albanian | 103 | 0.1% |
| American | 2,151 | 3.0% |
| Apache | 6 | 0.0% |
| Arab | 475 | 0.7% |
| Argentinean | 146 | 0.2% |
| Armenian | 185 | 0.3% |
| Austrian | 269 | 0.4% |
| Bahamian | 66 | 0.1% |
| Belgian | 30 | 0.0% |
| Bhutanese | 263 | 0.4% |
| Blackfeet | 26 | 0.0% |
| Bolivian | 53 | 0.1% |
| Brazilian | 8,429 | 11.7% |
| British | 371 | 0.5% |
| Burmese | 94 | 0.1% |
| Canadian | 497 | 0.7% |
| Cape Verdean | 168 | 0.2% |
| Celtic | 23 | 0.0% |
| Central American | 3,925 | 5.5% |
| Central American Indian | 33 | 0.1% |
| Cherokee | 108 | 0.2% |
| Chilean | 32 | 0.0% |
| Chippewa | 7 | 0.0% |
| Colombian | 240 | 0.3% |
| Croatian | 80 | 0.1% |
| Cuban | 96 | 0.1% |
| Czech | 131 | 0.2% |
| Czechoslovakian | 69 | 0.1% |
| Danish | 153 | 0.2% |
| Dominican | 1,509 | 2.1% |
| Dutch | 236 | 0.3% |
| Eastern European | 698 | 1.0% |
| Ecuadorian | 938 | 1.3% |
| Egyptian | 162 | 0.2% |
| English | 5,271 | 7.3% |
| Ethiopian | 28 | 0.0% |
| European | 873 | 1.2% |
| Filipino | 143 | 0.2% |
| Finnish | 170 | 0.2% |
| French | 1,453 | 2.0% |
| French Canadian | 1,214 | 1.7% |
| German | 2,500 | 3.5% |
| Ghanaian | 104 | 0.1% |
| Greek | 528 | 0.7% |
| Guatemalan | 1,324 | 1.8% |
| Haitian | 287 | 0.4% |
| Honduran | 550 | 0.8% |
| Hungarian | 193 | 0.3% |
| Indian (Asian) | 2,768 | 3.8% |
| Iranian | 325 | 0.4% |
| Irish | 9,446 | 13.2% |
| Israeli | 143 | 0.2% |
| Italian | 6,610 | 9.2% |
| Jamaican | 272 | 0.4% |
| Japanese | 58 | 0.1% |
| Jordanian | 10 | 0.0% |
| Kenyan | 99 | 0.1% |
| Korean | 238 | 0.3% |
| Latvian | 51 | 0.1% |
| Lebanese | 45 | 0.1% |
| Lithuanian | 313 | 0.4% |
| Malaysian | 16 | 0.0% |
| Mexican | 550 | 0.8% |
| Moroccan | 30 | 0.0% |
| Navajo | 9 | 0.0% |
| Nicaraguan | 139 | 0.2% |
| Nigerian | 112 | 0.2% |
| Northern European | 116 | 0.2% |
| Norwegian | 319 | 0.4% |
| Ottawa | 7 | 0.0% |
| Pakistani | 42 | 0.1% |
| Panamanian | 205 | 0.3% |
| Paraguayan | 10 | 0.0% |
| Peruvian | 312 | 0.4% |
| Polish | 1,860 | 2.6% |
| Portuguese | 1,210 | 1.7% |
| Puerto Rican | 3,354 | 4.7% |
| Romanian | 213 | 0.3% |
| Russian | 2,184 | 3.0% |
| Salvadoran | 1,698 | 2.4% |
| Samoan | 34 | 0.1% |
| Scandinavian | 221 | 0.3% |
| Scotch-Irish | 204 | 0.3% |
| Scottish | 1,304 | 1.8% |
| Slovak | 40 | 0.1% |
| South African | 37 | 0.1% |
| South American | 2,332 | 3.3% |
| Spaniard | 16 | 0.0% |
| Spanish | 183 | 0.3% |
| Spanish American | 9 | 0.0% |
| Sri Lankan | 333 | 0.5% |
| Subsaharan African | 1,688 | 2.4% |
| Swedish | 772 | 1.1% |
| Swiss | 66 | 0.1% |
| Syrian | 128 | 0.2% |
| Thai | 1,912 | 2.7% |
| Trinidadian and Tobagonian | 137 | 0.2% |
| Turkish | 87 | 0.1% |
| U.S. Virgin Islander | 7 | 0.0% |
| Ugandan | 203 | 0.3% |
| Ukrainian | 228 | 0.3% |
| Venezuelan | 553 | 0.8% |
| Vietnamese | 10 | 0.0% |
| Welsh | 155 | 0.2% |
| West Indian | 84 | 0.1% | View All 106 Rows |
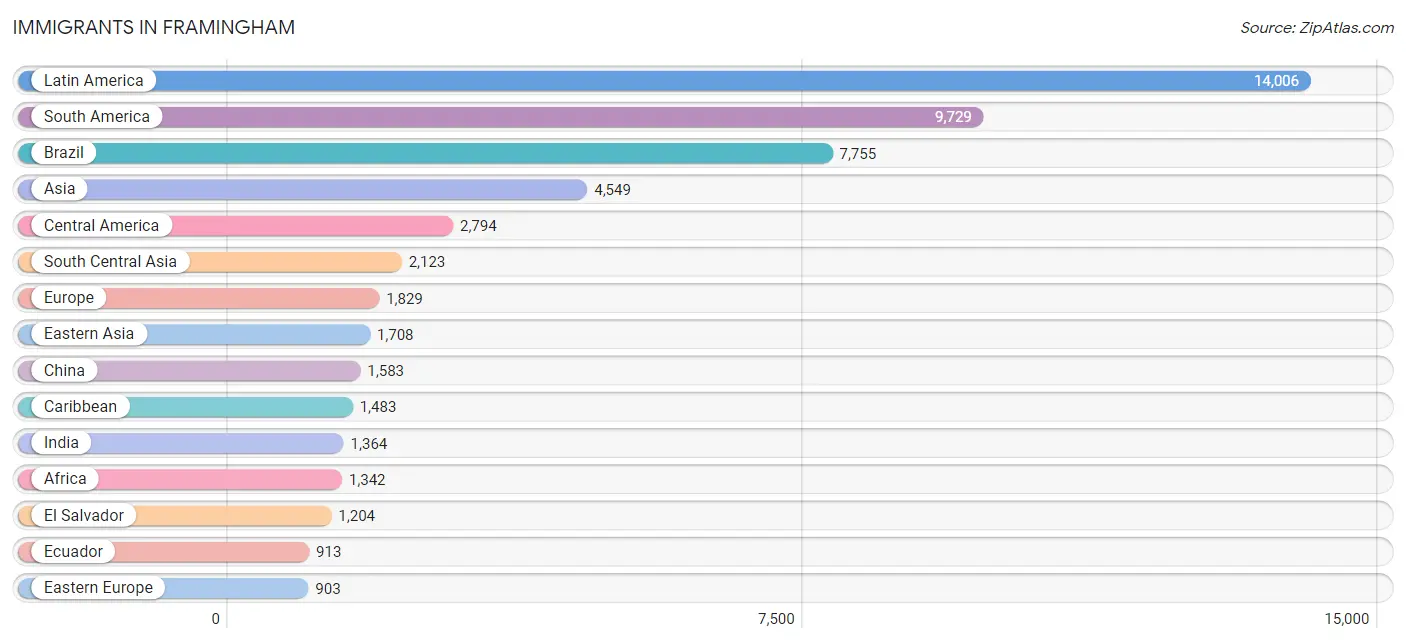
Immigrants in Framingham
The most numerous immigrant groups reported in Framingham came from Latin America (14,006 | 19.5%), South America (9,729 | 13.6%), Brazil (7,755 | 10.8%), Asia (4,549 | 6.3%), and Central America (2,794 | 3.9%), together accounting for 54.1% of all Framingham residents.
| Immigration Origin | # Population | % Population |
| Africa | 1,342 | 1.9% |
| Argentina | 125 | 0.2% |
| Asia | 4,549 | 6.3% |
| Azores | 17 | 0.0% |
| Bahamas | 66 | 0.1% |
| Belarus | 43 | 0.1% |
| Belgium | 12 | 0.0% |
| Bolivia | 53 | 0.1% |
| Bosnia and Herzegovina | 4 | 0.0% |
| Brazil | 7,755 | 10.8% |
| Cabo Verde | 87 | 0.1% |
| Cambodia | 48 | 0.1% |
| Cameroon | 111 | 0.2% |
| Canada | 361 | 0.5% |
| Caribbean | 1,483 | 2.1% |
| Central America | 2,794 | 3.9% |
| Chile | 20 | 0.0% |
| China | 1,583 | 2.2% |
| Colombia | 202 | 0.3% |
| Congo | 18 | 0.0% |
| Cuba | 10 | 0.0% |
| Czechoslovakia | 41 | 0.1% |
| Dominican Republic | 862 | 1.2% |
| Eastern Africa | 380 | 0.5% |
| Eastern Asia | 1,708 | 2.4% |
| Eastern Europe | 903 | 1.3% |
| Ecuador | 913 | 1.3% |
| Egypt | 173 | 0.2% |
| El Salvador | 1,204 | 1.7% |
| England | 75 | 0.1% |
| Ethiopia | 28 | 0.0% |
| Europe | 1,829 | 2.5% |
| France | 31 | 0.0% |
| Germany | 21 | 0.0% |
| Ghana | 145 | 0.2% |
| Greece | 78 | 0.1% |
| Guatemala | 869 | 1.2% |
| Guyana | 27 | 0.0% |
| Haiti | 300 | 0.4% |
| Honduras | 234 | 0.3% |
| Hong Kong | 207 | 0.3% |
| Hungary | 22 | 0.0% |
| India | 1,364 | 1.9% |
| Iran | 288 | 0.4% |
| Iraq | 76 | 0.1% |
| Ireland | 35 | 0.1% |
| Israel | 69 | 0.1% |
| Italy | 241 | 0.3% |
| Jamaica | 98 | 0.1% |
| Japan | 60 | 0.1% |
| Jordan | 10 | 0.0% |
| Kenya | 116 | 0.2% |
| Korea | 65 | 0.1% |
| Kuwait | 10 | 0.0% |
| Latin America | 14,006 | 19.5% |
| Lithuania | 12 | 0.0% |
| Mexico | 334 | 0.5% |
| Middle Africa | 129 | 0.2% |
| Moldova | 30 | 0.0% |
| Morocco | 56 | 0.1% |
| Nepal | 41 | 0.1% |
| Netherlands | 4 | 0.0% |
| Nicaragua | 50 | 0.1% |
| Nigeria | 123 | 0.2% |
| Northern Africa | 229 | 0.3% |
| Northern Europe | 203 | 0.3% |
| Norway | 16 | 0.0% |
| Oceania | 14 | 0.0% |
| Pakistan | 325 | 0.4% |
| Panama | 103 | 0.1% |
| Peru | 123 | 0.2% |
| Philippines | 52 | 0.1% |
| Poland | 90 | 0.1% |
| Portugal | 281 | 0.4% |
| Russia | 394 | 0.5% |
| Saudi Arabia | 93 | 0.1% |
| Scotland | 19 | 0.0% |
| Singapore | 24 | 0.0% |
| South Africa | 114 | 0.2% |
| South America | 9,729 | 13.6% |
| South Central Asia | 2,123 | 3.0% |
| South Eastern Asia | 325 | 0.4% |
| Southern Europe | 612 | 0.9% |
| Spain | 12 | 0.0% |
| Sri Lanka | 89 | 0.1% |
| Sweden | 13 | 0.0% |
| Switzerland | 17 | 0.0% |
| Syria | 14 | 0.0% |
| Taiwan | 144 | 0.2% |
| Thailand | 14 | 0.0% |
| Trinidad and Tobago | 85 | 0.1% |
| Turkey | 96 | 0.1% |
| Uganda | 236 | 0.3% |
| Ukraine | 204 | 0.3% |
| Uzbekistan | 16 | 0.0% |
| Venezuela | 455 | 0.6% |
| Vietnam | 187 | 0.3% |
| Western Africa | 374 | 0.5% |
| Western Asia | 393 | 0.5% |
| Western Europe | 85 | 0.1% | View All 100 Rows |
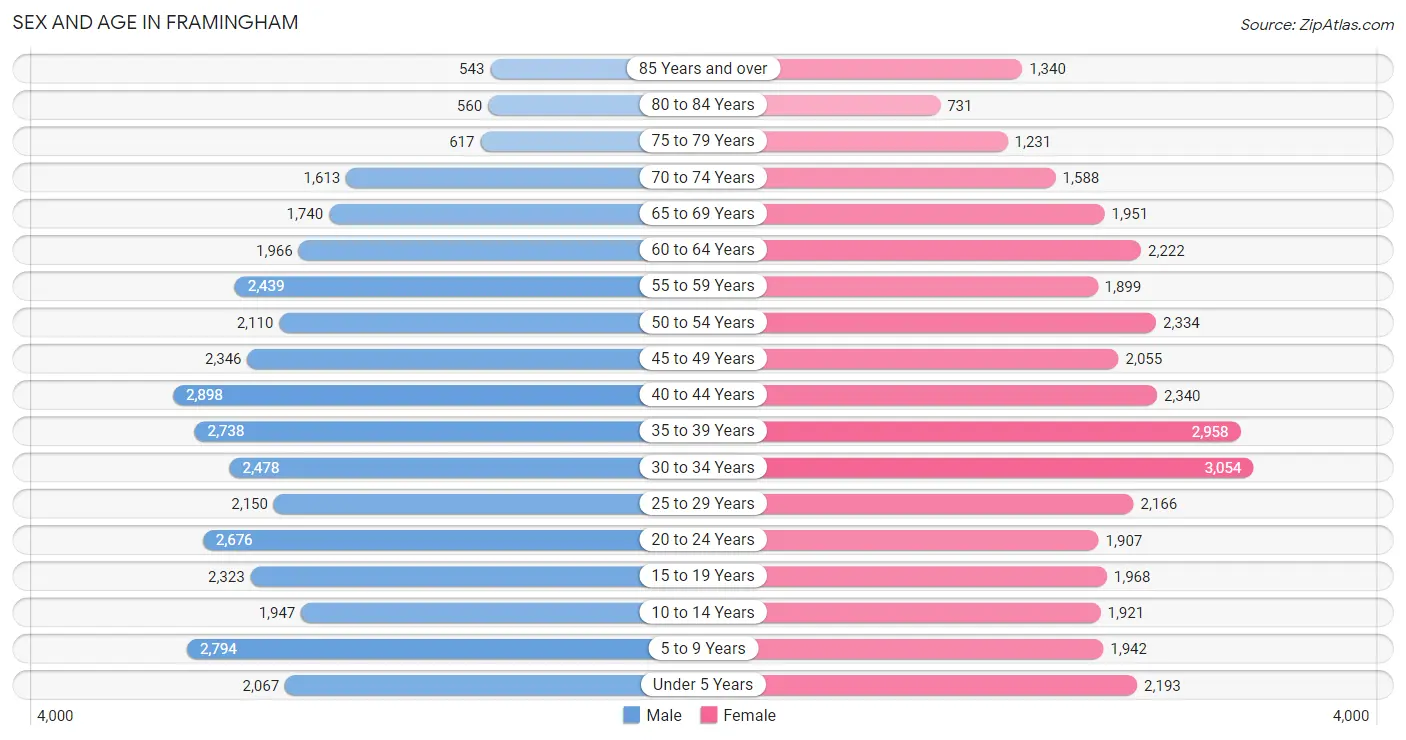
Sex and Age in Framingham
Sex and Age in Framingham
The most populous age groups in Framingham are 40 to 44 Years (2,898 | 8.1%) for men and 30 to 34 Years (3,054 | 8.5%) for women.
| Age Bracket | Male | Female |
| Under 5 Years | 2,067 (5.7%) | 2,193 (6.1%) |
| 5 to 9 Years | 2,794 (7.8%) | 1,942 (5.4%) |
| 10 to 14 Years | 1,947 (5.4%) | 1,921 (5.4%) |
| 15 to 19 Years | 2,323 (6.5%) | 1,968 (5.5%) |
| 20 to 24 Years | 2,676 (7.4%) | 1,907 (5.3%) |
| 25 to 29 Years | 2,150 (6.0%) | 2,166 (6.0%) |
| 30 to 34 Years | 2,478 (6.9%) | 3,054 (8.5%) |
| 35 to 39 Years | 2,738 (7.6%) | 2,958 (8.3%) |
| 40 to 44 Years | 2,898 (8.1%) | 2,340 (6.5%) |
| 45 to 49 Years | 2,346 (6.5%) | 2,055 (5.7%) |
| 50 to 54 Years | 2,110 (5.9%) | 2,334 (6.5%) |
| 55 to 59 Years | 2,439 (6.8%) | 1,899 (5.3%) |
| 60 to 64 Years | 1,966 (5.5%) | 2,222 (6.2%) |
| 65 to 69 Years | 1,740 (4.8%) | 1,951 (5.4%) |
| 70 to 74 Years | 1,613 (4.5%) | 1,588 (4.4%) |
| 75 to 79 Years | 617 (1.7%) | 1,231 (3.4%) |
| 80 to 84 Years | 560 (1.6%) | 731 (2.0%) |
| 85 Years and over | 543 (1.5%) | 1,340 (3.7%) |
| Total | 36,005 (100.0%) | 35,800 (100.0%) |
Families and Households in Framingham
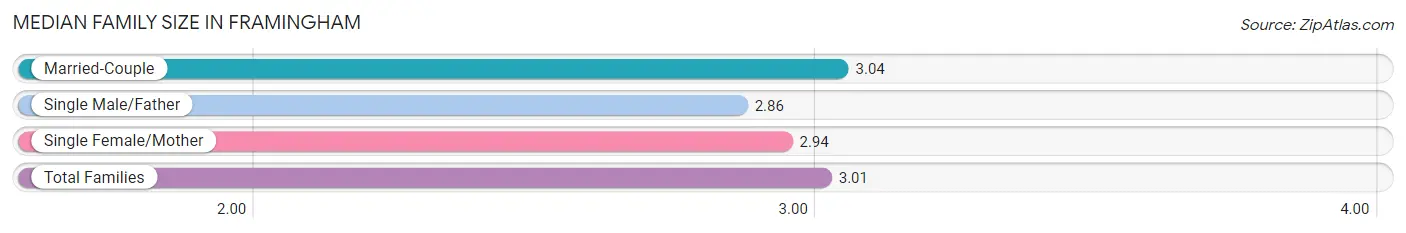
Median Family Size in Framingham
The median family size in Framingham is 3.01 persons per family, with married-couple families (14,080 | 76.9%) accounting for the largest median family size of 3.04 persons per family. On the other hand, single male/father families (1,187 | 6.5%) represent the smallest median family size with 2.86 persons per family.
| Family Type | # Families | Family Size |
| Married-Couple | 14,080 (76.9%) | 3.04 |
| Single Male/Father | 1,187 (6.5%) | 2.86 |
| Single Female/Mother | 3,052 (16.7%) | 2.94 |
| Total Families | 18,319 (100.0%) | 3.01 |
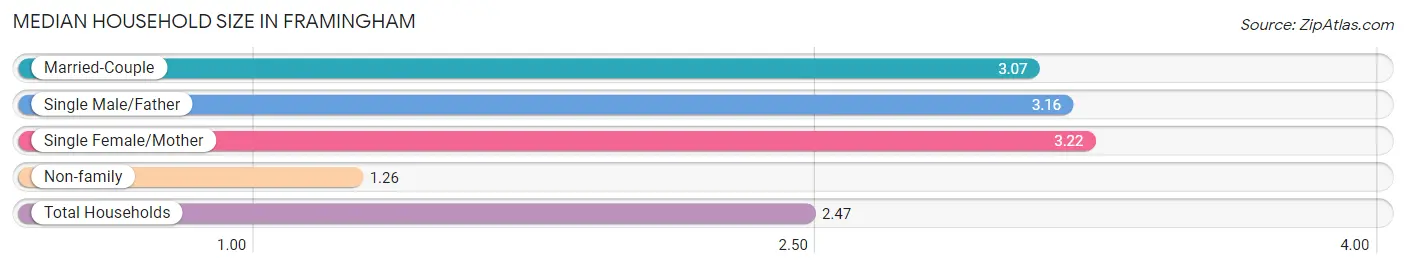
Median Household Size in Framingham
The median household size in Framingham is 2.47 persons per household, with single female/mother households (3,052 | 11.0%) accounting for the largest median household size of 3.22 persons per household. non-family households (9,491 | 34.1%) represent the smallest median household size with 1.26 persons per household.
| Household Type | # Households | Household Size |
| Married-Couple | 14,080 (50.6%) | 3.07 |
| Single Male/Father | 1,187 (4.3%) | 3.16 |
| Single Female/Mother | 3,052 (11.0%) | 3.22 |
| Non-family | 9,491 (34.1%) | 1.26 |
| Total Households | 27,810 (100.0%) | 2.47 |
Household Size by Marriage Status in Framingham
Out of a total of 27,810 households in Framingham, 18,319 (65.9%) are family households, while 9,491 (34.1%) are nonfamily households. The most numerous type of family households are 2-person households, comprising 7,608, and the most common type of nonfamily households are 1-person households, comprising 7,498.
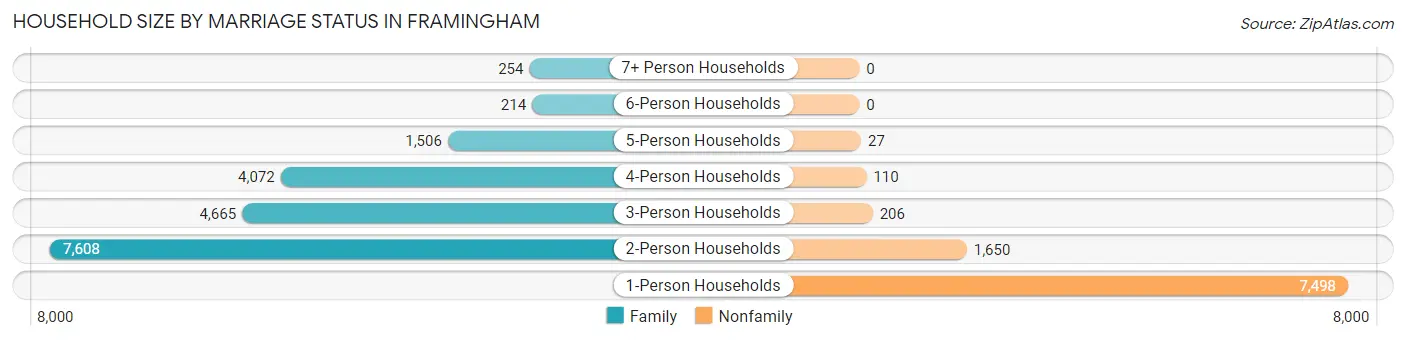
| Household Size | Family Households | Nonfamily Households |
| 1-Person Households | - | 7,498 (27.0%) |
| 2-Person Households | 7,608 (27.4%) | 1,650 (5.9%) |
| 3-Person Households | 4,665 (16.8%) | 206 (0.7%) |
| 4-Person Households | 4,072 (14.6%) | 110 (0.4%) |
| 5-Person Households | 1,506 (5.4%) | 27 (0.1%) |
| 6-Person Households | 214 (0.8%) | 0 (0.0%) |
| 7+ Person Households | 254 (0.9%) | 0 (0.0%) |
| Total | 18,319 (65.9%) | 9,491 (34.1%) |
Female Fertility in Framingham
Fertility by Age in Framingham
Average fertility rate in Framingham is 48.0 births per 1,000 women. Women in the age bracket of 20 to 34 years have the highest fertility rate with 54.0 births per 1,000 women. Women in the age bracket of 35 to 50 years acount for 50.4% of all women with births.
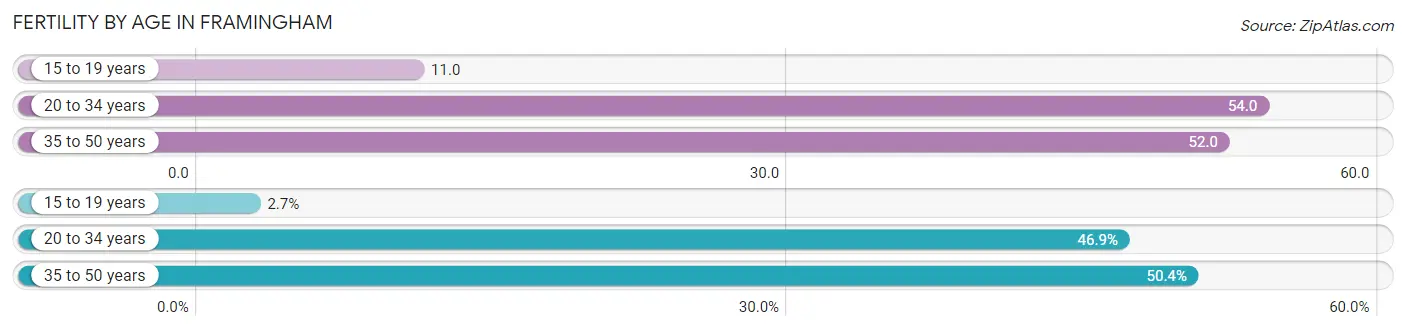
| Age Bracket | Women with Births | Births / 1,000 Women |
| 15 to 19 years | 22 (2.7%) | 11.0 |
| 20 to 34 years | 387 (46.9%) | 54.0 |
| 35 to 50 years | 416 (50.4%) | 52.0 |
| Total | 825 (100.0%) | 48.0 |
Fertility by Age by Marriage Status in Framingham
77.1% of women with births (825) in Framingham are married. The highest percentage of unmarried women with births falls into 15 to 19 years age bracket with 100.0% of them unmarried at the time of birth, while the lowest percentage of unmarried women with births belong to 20 to 34 years age bracket with 10.9% of them unmarried.
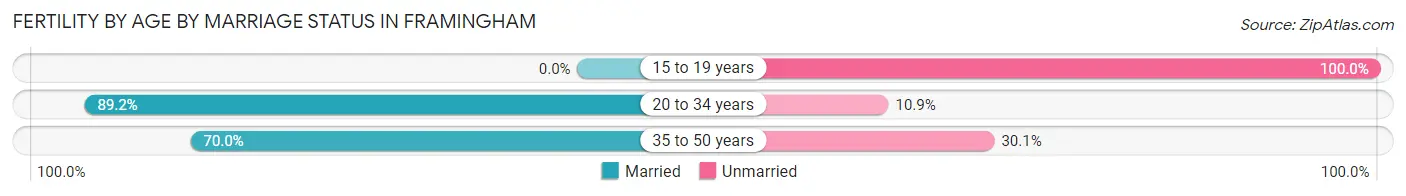
| Age Bracket | Married | Unmarried |
| 15 to 19 years | 0 (0.0%) | 22 (100.0%) |
| 20 to 34 years | 345 (89.1%) | 42 (10.8%) |
| 35 to 50 years | 291 (70.0%) | 125 (30.0%) |
| Total | 636 (77.1%) | 189 (22.9%) |
Fertility by Education in Framingham
Average fertility rate in Framingham is 48.0 births per 1,000 women. Women with the education attainment of graduate degree have the highest fertility rate of 62.0 births per 1,000 women, while women with the education attainment of high school diploma have the lowest fertility at 19.0 births per 1,000 women. Women with the education attainment of bachelor's degree represent 29.1% of all women with births.
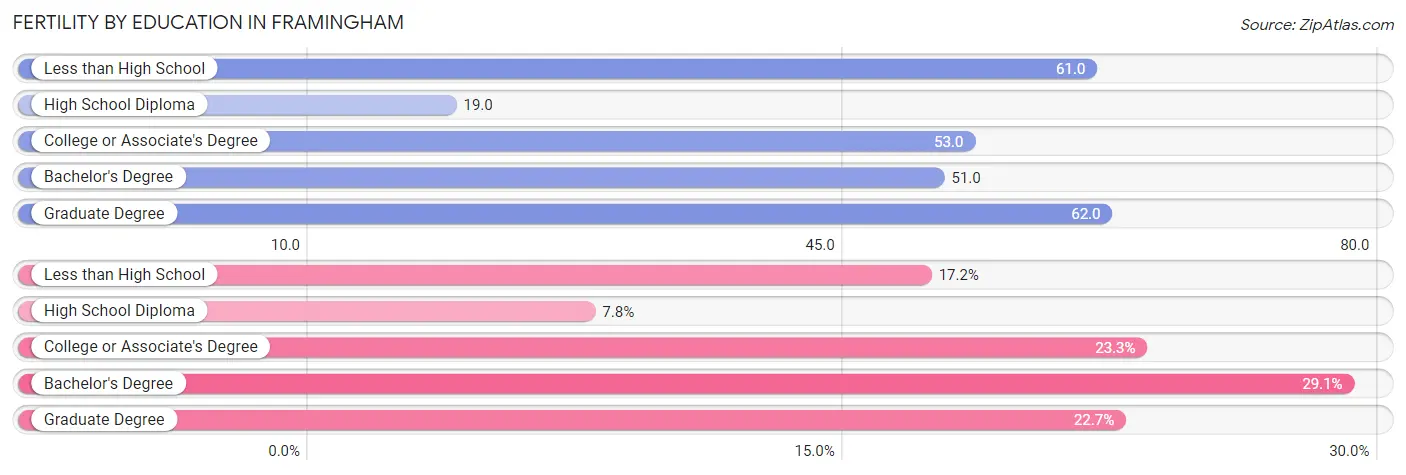
| Educational Attainment | Women with Births | Births / 1,000 Women |
| Less than High School | 142 (17.2%) | 61.0 |
| High School Diploma | 64 (7.8%) | 19.0 |
| College or Associate's Degree | 192 (23.3%) | 53.0 |
| Bachelor's Degree | 240 (29.1%) | 51.0 |
| Graduate Degree | 187 (22.7%) | 62.0 |
| Total | 825 (100.0%) | 48.0 |
Fertility by Education by Marriage Status in Framingham
22.9% of women with births in Framingham are unmarried. Women with the educational attainment of high school diploma are most likely to be married with 100.0% of them married at childbirth, while women with the educational attainment of less than high school are least likely to be married with 76.8% of them unmarried at childbirth.
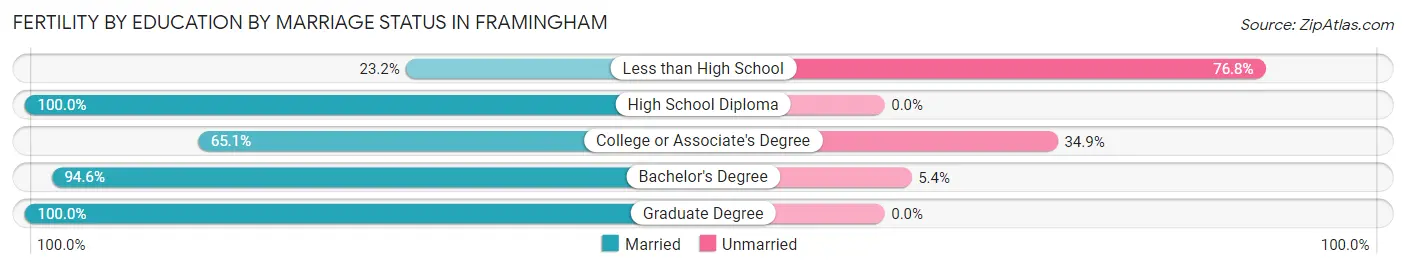
| Educational Attainment | Married | Unmarried |
| Less than High School | 33 (23.2%) | 109 (76.8%) |
| High School Diploma | 64 (100.0%) | 0 (0.0%) |
| College or Associate's Degree | 125 (65.1%) | 67 (34.9%) |
| Bachelor's Degree | 227 (94.6%) | 13 (5.4%) |
| Graduate Degree | 187 (100.0%) | 0 (0.0%) |
| Total | 636 (77.1%) | 189 (22.9%) |
Employment Characteristics in Framingham
Employment by Class of Employer in Framingham
Among the 38,026 employed individuals in Framingham, private company employees (25,372 | 66.7%), not-for-profit organizations (3,753 | 9.9%), and self-employed (not incorporated) (2,742 | 7.2%) make up the most common classes of employment.
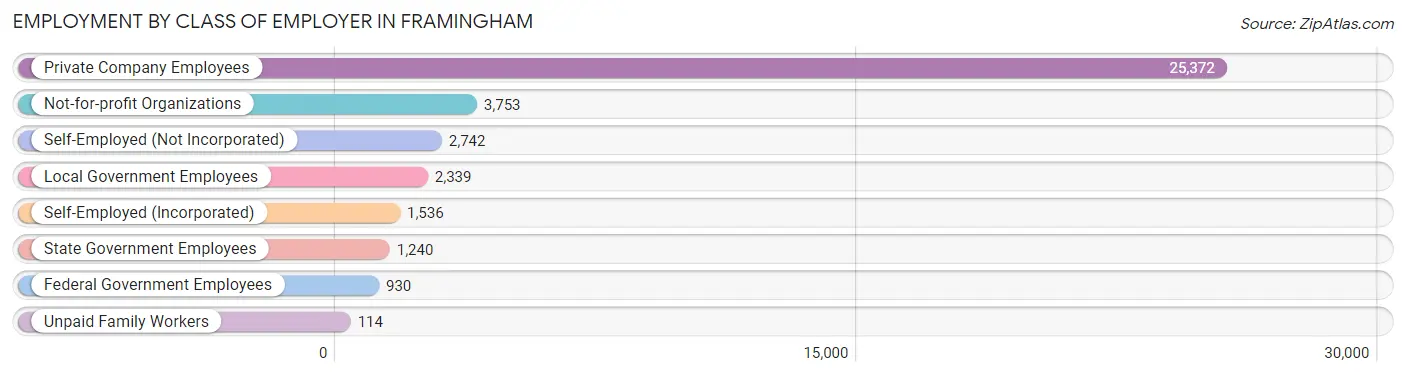
| Employer Class | # Employees | % Employees |
| Private Company Employees | 25,372 | 66.7% |
| Self-Employed (Incorporated) | 1,536 | 4.0% |
| Self-Employed (Not Incorporated) | 2,742 | 7.2% |
| Not-for-profit Organizations | 3,753 | 9.9% |
| Local Government Employees | 2,339 | 6.1% |
| State Government Employees | 1,240 | 3.3% |
| Federal Government Employees | 930 | 2.5% |
| Unpaid Family Workers | 114 | 0.3% |
| Total | 38,026 | 100.0% |
Employment Status by Age in Framingham
According to the labor force statistics for Framingham, out of the total population over 16 years of age (57,989), 71.0% or 41,172 individuals are in the labor force, with 5.0% or 2,059 of them unemployed. The age group with the highest labor force participation rate is 25 to 29 years, with 89.1% or 3,846 individuals in the labor force. Within the labor force, the 75 years and over age range has the highest percentage of unemployed individuals, with 21.3% or 125 of them being unemployed.
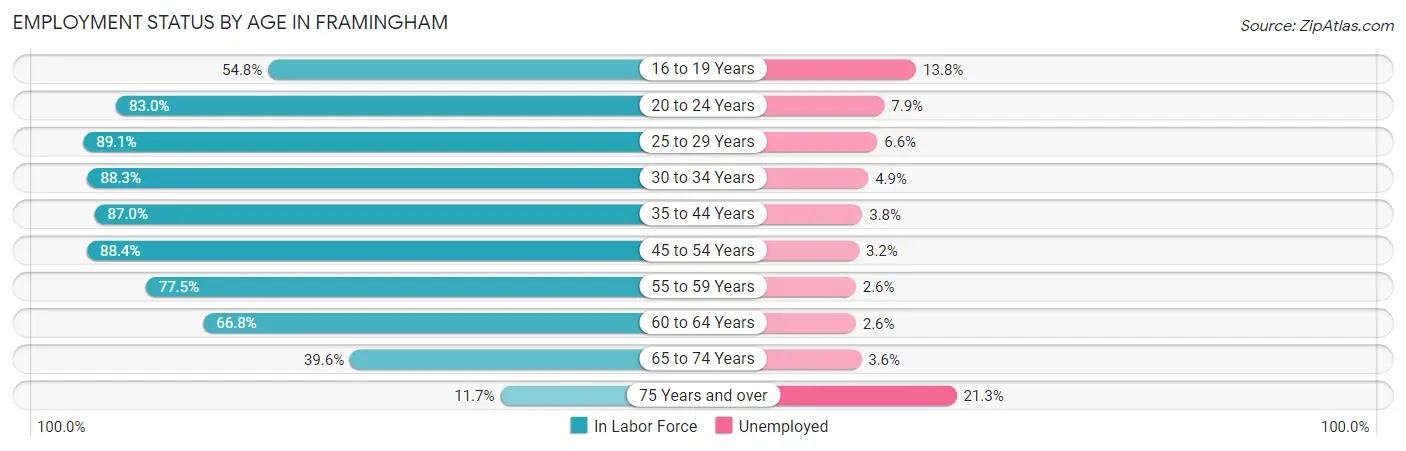
| Age Bracket | In Labor Force | Unemployed |
| 16 to 19 Years | 1,830 (54.8%) | 253 (13.8%) |
| 20 to 24 Years | 3,804 (83.0%) | 301 (7.9%) |
| 25 to 29 Years | 3,846 (89.1%) | 254 (6.6%) |
| 30 to 34 Years | 4,885 (88.3%) | 239 (4.9%) |
| 35 to 44 Years | 9,513 (87.0%) | 361 (3.8%) |
| 45 to 54 Years | 7,819 (88.4%) | 250 (3.2%) |
| 55 to 59 Years | 3,362 (77.5%) | 87 (2.6%) |
| 60 to 64 Years | 2,798 (66.8%) | 73 (2.6%) |
| 65 to 74 Years | 2,729 (39.6%) | 98 (3.6%) |
| 75 Years and over | 588 (11.7%) | 125 (21.3%) |
| Total | 41,172 (71.0%) | 2,059 (5.0%) |
Employment Status by Educational Attainment in Framingham
According to labor force statistics for Framingham, 84.5% of individuals (32,239) out of the total population between 25 and 64 years of age (38,153) are in the labor force, with 3.9% or 1,257 of them being unemployed. The group with the highest labor force participation rate are those with the educational attainment of bachelor's degree or higher, with 89.9% or 17,671 individuals in the labor force. Within the labor force, individuals with college / associate degree education have the highest percentage of unemployment, with 7.8% or 415 of them being unemployed.
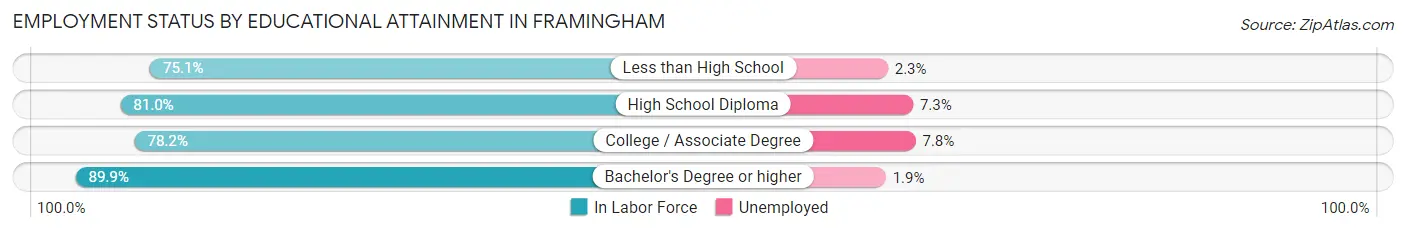
| Educational Attainment | In Labor Force | Unemployed |
| Less than High School | 3,108 (75.1%) | 95 (2.3%) |
| High School Diploma | 6,116 (81.0%) | 551 (7.3%) |
| College / Associate Degree | 5,324 (78.2%) | 531 (7.8%) |
| Bachelor's Degree or higher | 17,671 (89.9%) | 373 (1.9%) |
| Total | 32,239 (84.5%) | 1,488 (3.9%) |
Employment Occupations by Sex in Framingham
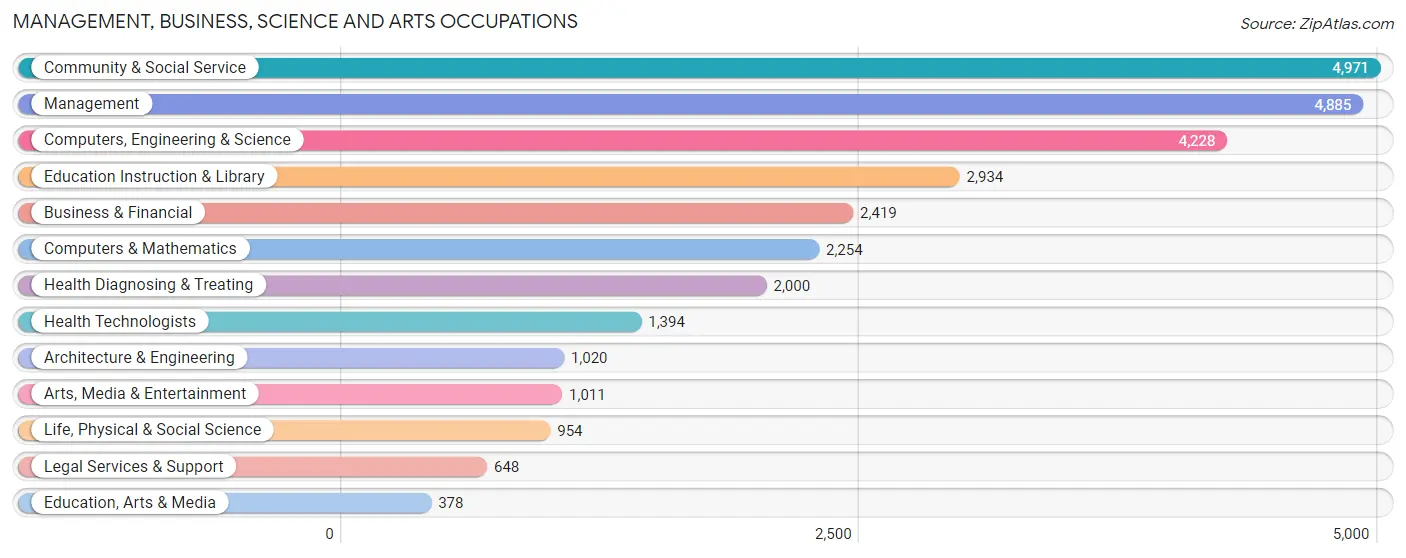
Management, Business, Science and Arts Occupations
The most common Management, Business, Science and Arts occupations in Framingham are Community & Social Service (4,971 | 12.7%), Management (4,885 | 12.5%), Computers, Engineering & Science (4,228 | 10.8%), Education Instruction & Library (2,934 | 7.5%), and Business & Financial (2,419 | 6.2%).
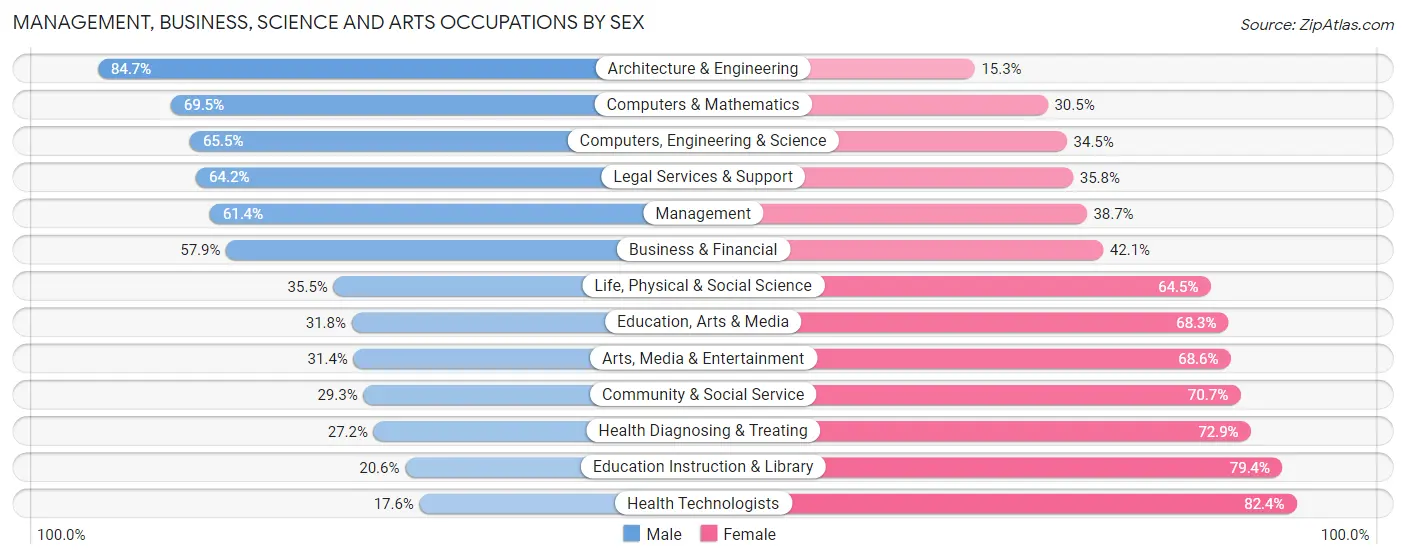
Management, Business, Science and Arts Occupations by Sex
Within the Management, Business, Science and Arts occupations in Framingham, the most male-oriented occupations are Architecture & Engineering (84.7%), Computers & Mathematics (69.5%), and Computers, Engineering & Science (65.5%), while the most female-oriented occupations are Health Technologists (82.4%), Education Instruction & Library (79.4%), and Health Diagnosing & Treating (72.9%).
| Occupation | Male | Female |
| Management | 2,997 (61.4%) | 1,888 (38.7%) |
| Business & Financial | 1,401 (57.9%) | 1,018 (42.1%) |
| Computers, Engineering & Science | 2,769 (65.5%) | 1,459 (34.5%) |
| Computers & Mathematics | 1,566 (69.5%) | 688 (30.5%) |
| Architecture & Engineering | 864 (84.7%) | 156 (15.3%) |
| Life, Physical & Social Science | 339 (35.5%) | 615 (64.5%) |
| Community & Social Service | 1,457 (29.3%) | 3,514 (70.7%) |
| Education, Arts & Media | 120 (31.8%) | 258 (68.2%) |
| Legal Services & Support | 416 (64.2%) | 232 (35.8%) |
| Education Instruction & Library | 604 (20.6%) | 2,330 (79.4%) |
| Arts, Media & Entertainment | 317 (31.4%) | 694 (68.6%) |
| Health Diagnosing & Treating | 543 (27.2%) | 1,457 (72.9%) |
| Health Technologists | 245 (17.6%) | 1,149 (82.4%) |
| Total (Category) | 9,167 (49.5%) | 9,336 (50.5%) |
| Total (Overall) | 20,997 (53.8%) | 18,036 (46.2%) |
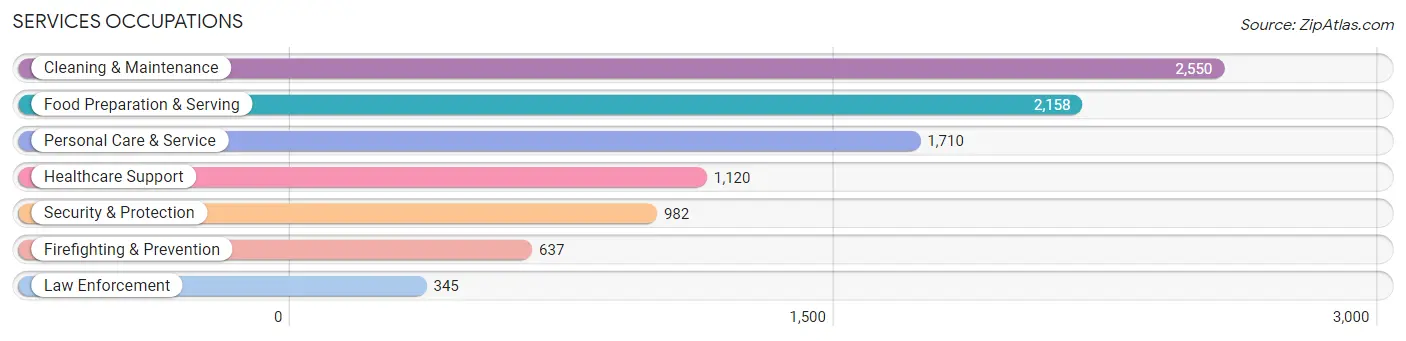
Services Occupations
The most common Services occupations in Framingham are Cleaning & Maintenance (2,550 | 6.5%), Food Preparation & Serving (2,158 | 5.5%), Personal Care & Service (1,710 | 4.4%), Healthcare Support (1,120 | 2.9%), and Security & Protection (982 | 2.5%).
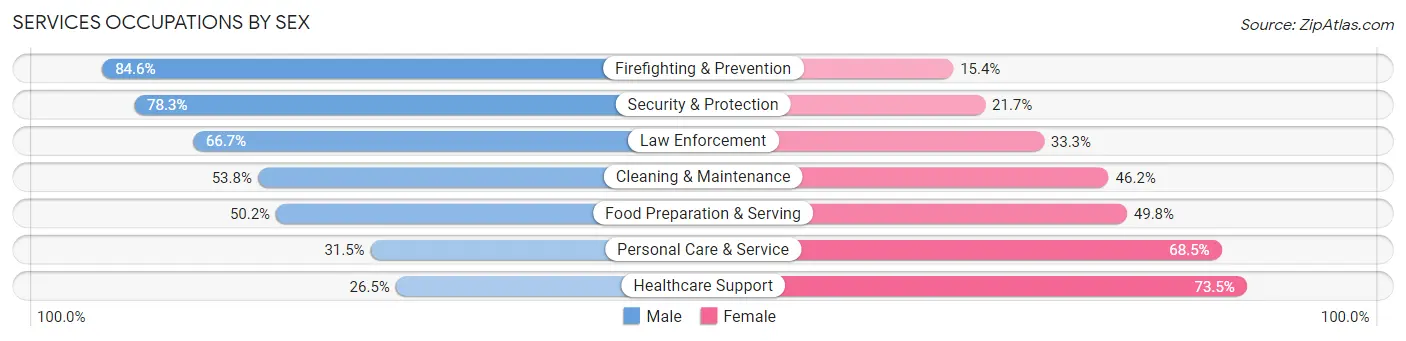
Services Occupations by Sex
Within the Services occupations in Framingham, the most male-oriented occupations are Firefighting & Prevention (84.6%), Security & Protection (78.3%), and Law Enforcement (66.7%), while the most female-oriented occupations are Healthcare Support (73.5%), Personal Care & Service (68.5%), and Food Preparation & Serving (49.8%).
| Occupation | Male | Female |
| Healthcare Support | 297 (26.5%) | 823 (73.5%) |
| Security & Protection | 769 (78.3%) | 213 (21.7%) |
| Firefighting & Prevention | 539 (84.6%) | 98 (15.4%) |
| Law Enforcement | 230 (66.7%) | 115 (33.3%) |
| Food Preparation & Serving | 1,084 (50.2%) | 1,074 (49.8%) |
| Cleaning & Maintenance | 1,373 (53.8%) | 1,177 (46.2%) |
| Personal Care & Service | 539 (31.5%) | 1,171 (68.5%) |
| Total (Category) | 4,062 (47.7%) | 4,458 (52.3%) |
| Total (Overall) | 20,997 (53.8%) | 18,036 (46.2%) |
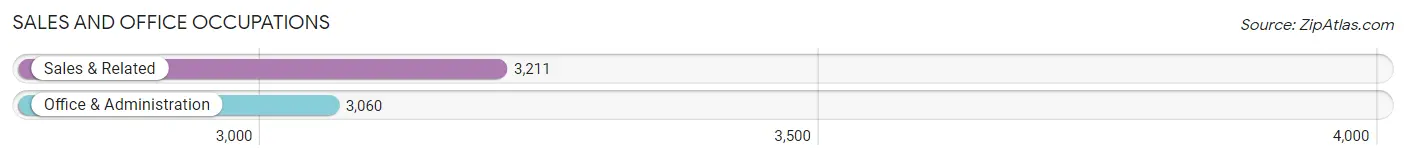
Sales and Office Occupations
The most common Sales and Office occupations in Framingham are Sales & Related (3,211 | 8.2%), and Office & Administration (3,060 | 7.8%).
Sales and Office Occupations by Sex
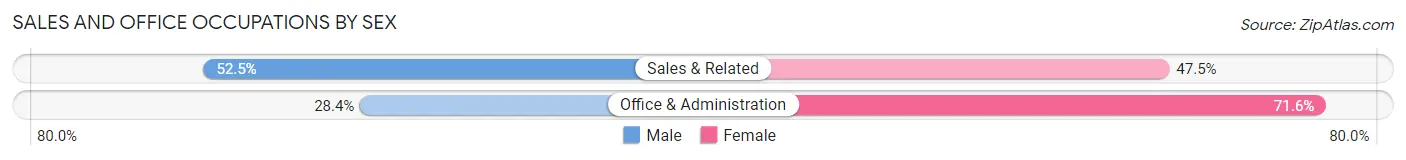
| Occupation | Male | Female |
| Sales & Related | 1,685 (52.5%) | 1,526 (47.5%) |
| Office & Administration | 868 (28.4%) | 2,192 (71.6%) |
| Total (Category) | 2,553 (40.7%) | 3,718 (59.3%) |
| Total (Overall) | 20,997 (53.8%) | 18,036 (46.2%) |
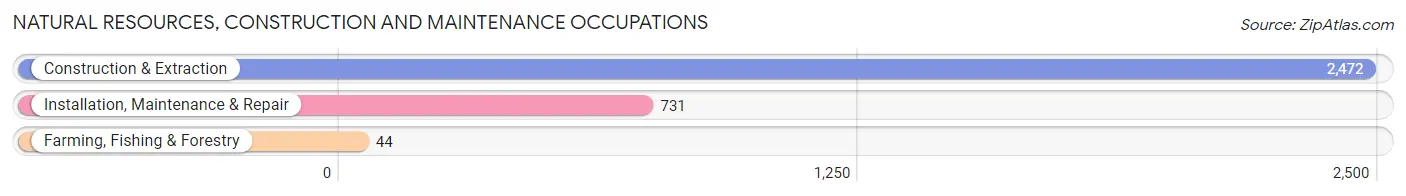
Natural Resources, Construction and Maintenance Occupations
The most common Natural Resources, Construction and Maintenance occupations in Framingham are Construction & Extraction (2,472 | 6.3%), Installation, Maintenance & Repair (731 | 1.9%), and Farming, Fishing & Forestry (44 | 0.1%).
Natural Resources, Construction and Maintenance Occupations by Sex
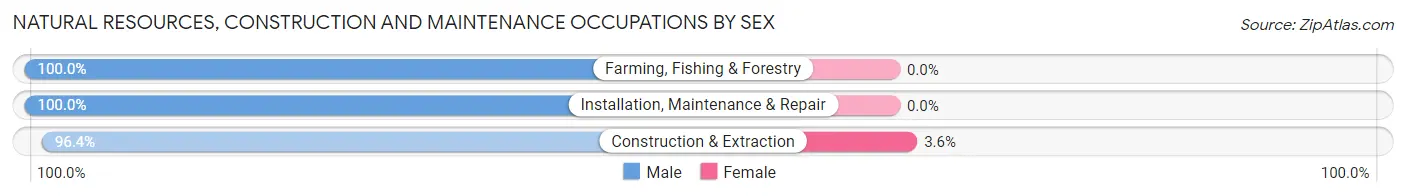
| Occupation | Male | Female |
| Farming, Fishing & Forestry | 44 (100.0%) | 0 (0.0%) |
| Construction & Extraction | 2,383 (96.4%) | 89 (3.6%) |
| Installation, Maintenance & Repair | 731 (100.0%) | 0 (0.0%) |
| Total (Category) | 3,158 (97.3%) | 89 (2.7%) |
| Total (Overall) | 20,997 (53.8%) | 18,036 (46.2%) |
Production, Transportation and Moving Occupations
The most common Production, Transportation and Moving occupations in Framingham are Transportation (1,137 | 2.9%), Production (814 | 2.1%), and Material Moving (541 | 1.4%).
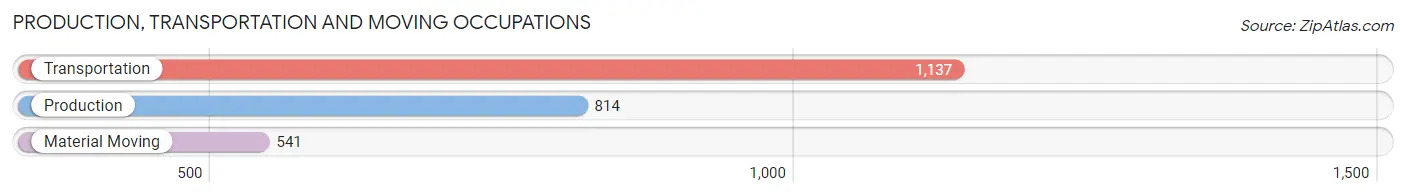
Production, Transportation and Moving Occupations by Sex
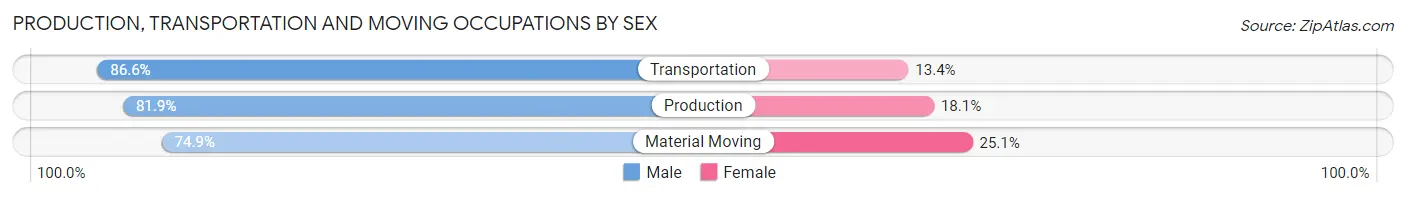
| Occupation | Male | Female |
| Production | 667 (81.9%) | 147 (18.1%) |
| Transportation | 985 (86.6%) | 152 (13.4%) |
| Material Moving | 405 (74.9%) | 136 (25.1%) |
| Total (Category) | 2,057 (82.5%) | 435 (17.5%) |
| Total (Overall) | 20,997 (53.8%) | 18,036 (46.2%) |
Employment Industries by Sex in Framingham
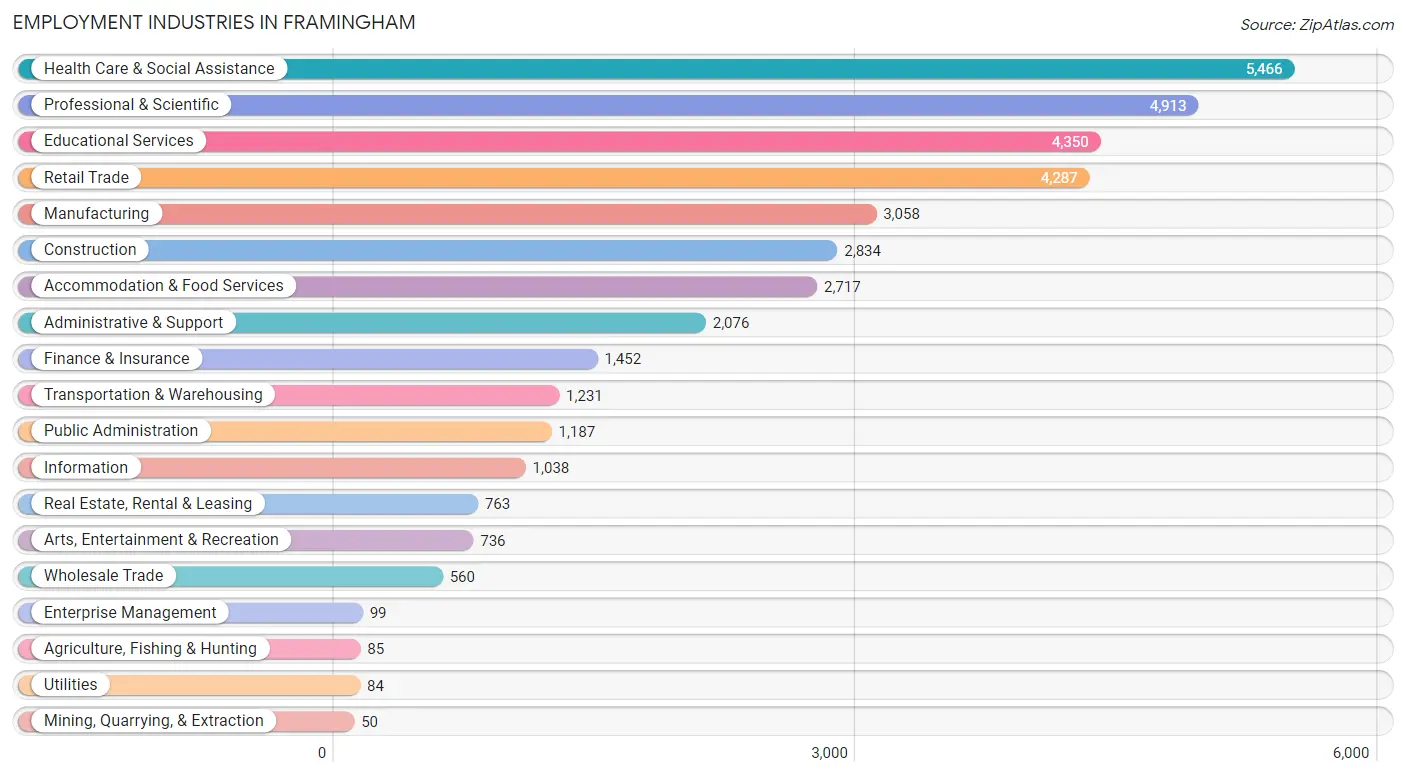
Employment Industries in Framingham
The major employment industries in Framingham include Health Care & Social Assistance (5,466 | 14.0%), Professional & Scientific (4,913 | 12.6%), Educational Services (4,350 | 11.1%), Retail Trade (4,287 | 11.0%), and Manufacturing (3,058 | 7.8%).
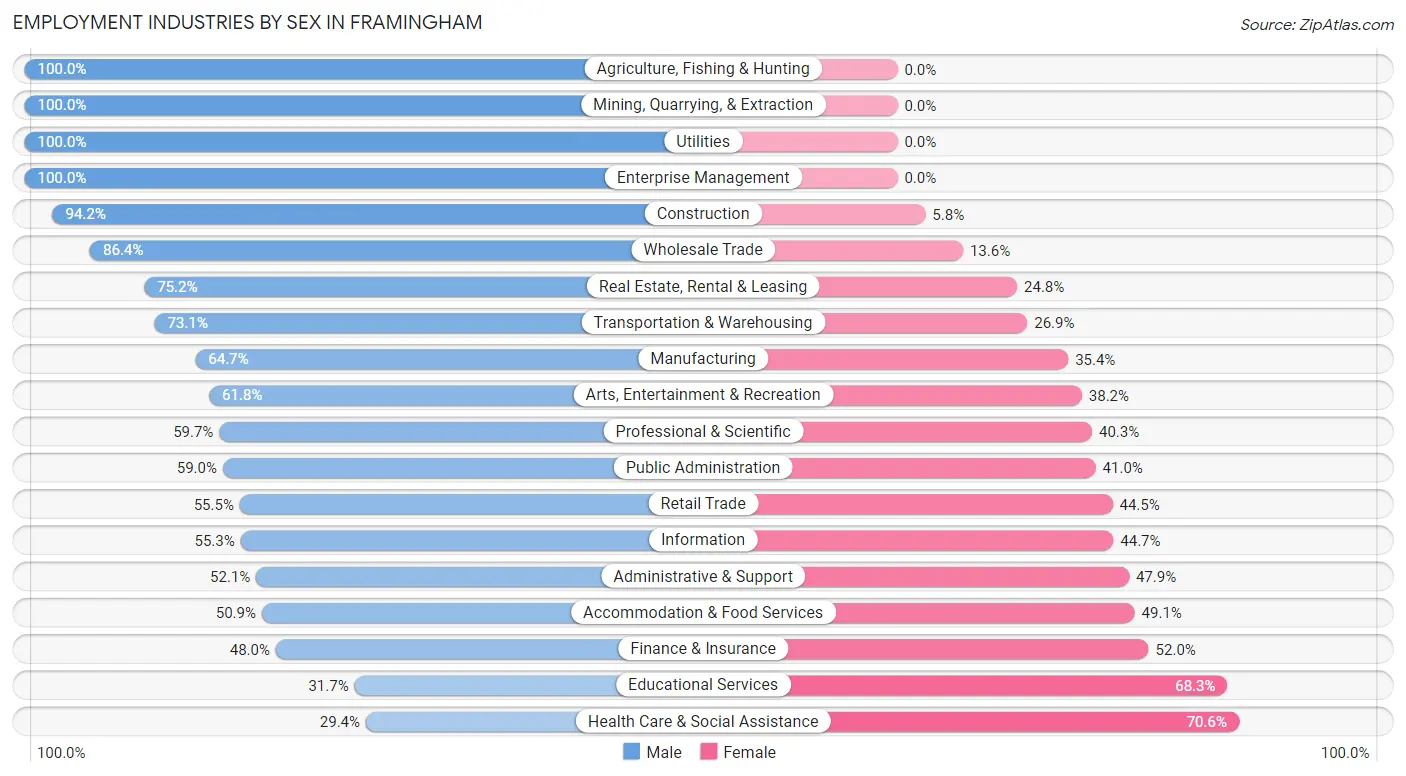
Employment Industries by Sex in Framingham
The Framingham industries that see more men than women are Agriculture, Fishing & Hunting (100.0%), Mining, Quarrying, & Extraction (100.0%), and Utilities (100.0%), whereas the industries that tend to have a higher number of women are Health Care & Social Assistance (70.6%), Educational Services (68.3%), and Finance & Insurance (52.0%).
| Industry | Male | Female |
| Agriculture, Fishing & Hunting | 85 (100.0%) | 0 (0.0%) |
| Mining, Quarrying, & Extraction | 50 (100.0%) | 0 (0.0%) |
| Construction | 2,670 (94.2%) | 164 (5.8%) |
| Manufacturing | 1,977 (64.6%) | 1,081 (35.3%) |
| Wholesale Trade | 484 (86.4%) | 76 (13.6%) |
| Retail Trade | 2,378 (55.5%) | 1,909 (44.5%) |
| Transportation & Warehousing | 900 (73.1%) | 331 (26.9%) |
| Utilities | 84 (100.0%) | 0 (0.0%) |
| Information | 574 (55.3%) | 464 (44.7%) |
| Finance & Insurance | 697 (48.0%) | 755 (52.0%) |
| Real Estate, Rental & Leasing | 574 (75.2%) | 189 (24.8%) |
| Professional & Scientific | 2,934 (59.7%) | 1,979 (40.3%) |
| Enterprise Management | 99 (100.0%) | 0 (0.0%) |
| Administrative & Support | 1,081 (52.1%) | 995 (47.9%) |
| Educational Services | 1,380 (31.7%) | 2,970 (68.3%) |
| Health Care & Social Assistance | 1,605 (29.4%) | 3,861 (70.6%) |
| Arts, Entertainment & Recreation | 455 (61.8%) | 281 (38.2%) |
| Accommodation & Food Services | 1,383 (50.9%) | 1,334 (49.1%) |
| Public Administration | 700 (59.0%) | 487 (41.0%) |
| Total | 20,997 (53.8%) | 18,036 (46.2%) |
Education in Framingham
School Enrollment in Framingham
The most common levels of schooling among the 16,865 students in Framingham are college / undergraduate (3,769 | 22.4%), elementary school (3,542 | 21.0%), and high school (3,297 | 19.6%).
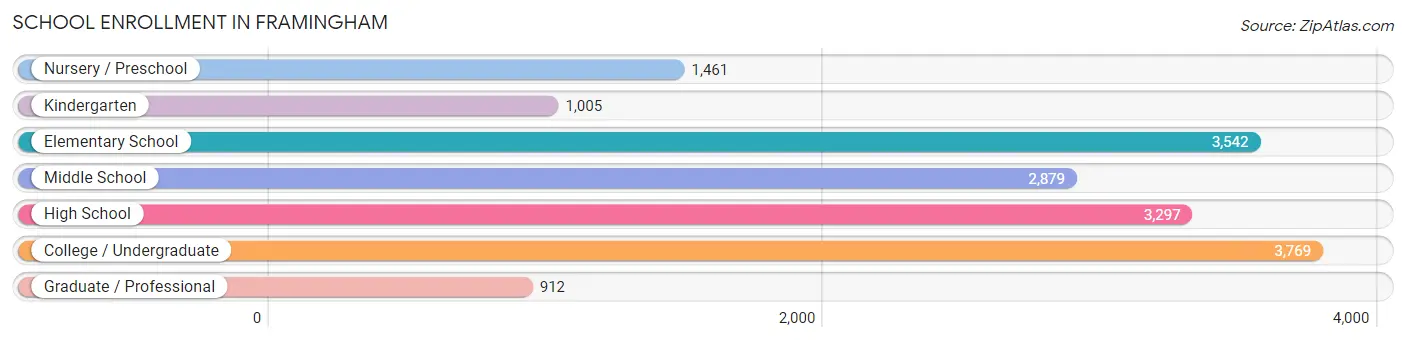
| School Level | # Students | % Students |
| Nursery / Preschool | 1,461 | 8.7% |
| Kindergarten | 1,005 | 6.0% |
| Elementary School | 3,542 | 21.0% |
| Middle School | 2,879 | 17.1% |
| High School | 3,297 | 19.6% |
| College / Undergraduate | 3,769 | 22.4% |
| Graduate / Professional | 912 | 5.4% |
| Total | 16,865 | 100.0% |
School Enrollment by Age by Funding Source in Framingham
Out of a total of 16,865 students who are enrolled in schools in Framingham, 3,575 (21.2%) attend a private institution, while the remaining 13,290 (78.8%) are enrolled in public schools. The age group of 3 to 4 year olds has the highest likelihood of being enrolled in private schools, with 705 (68.8% in the age bracket) enrolled. Conversely, the age group of 15 to 17 year olds has the lowest likelihood of being enrolled in a private school, with 2,223 (94.7% in the age bracket) attending a public institution.
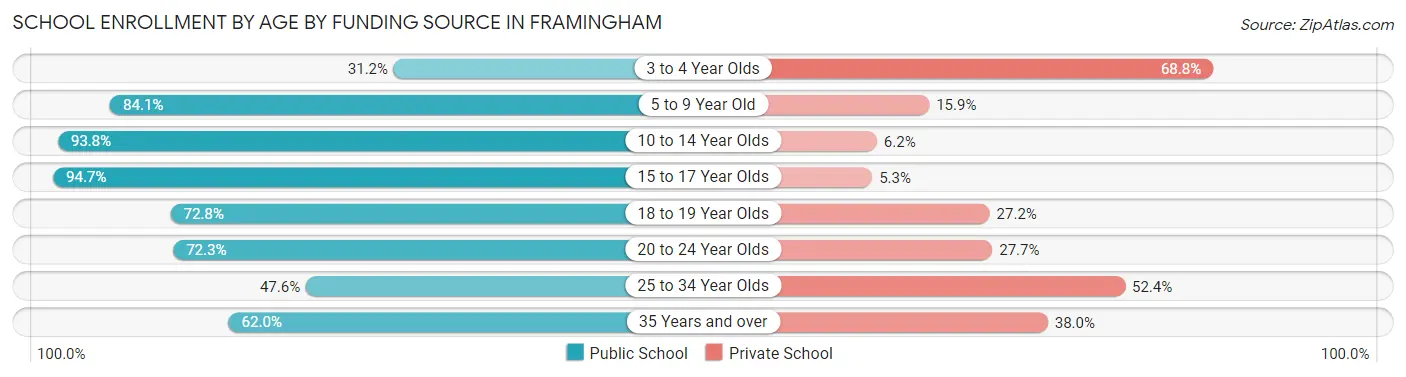
| Age Bracket | Public School | Private School |
| 3 to 4 Year Olds | 320 (31.2%) | 705 (68.8%) |
| 5 to 9 Year Old | 3,719 (84.1%) | 705 (15.9%) |
| 10 to 14 Year Olds | 3,577 (93.8%) | 236 (6.2%) |
| 15 to 17 Year Olds | 2,223 (94.7%) | 125 (5.3%) |
| 18 to 19 Year Olds | 1,015 (72.8%) | 379 (27.2%) |
| 20 to 24 Year Olds | 1,410 (72.3%) | 540 (27.7%) |
| 25 to 34 Year Olds | 544 (47.6%) | 599 (52.4%) |
| 35 Years and over | 476 (62.0%) | 292 (38.0%) |
| Total | 13,290 (78.8%) | 3,575 (21.2%) |
Educational Attainment by Field of Study in Framingham
Business (4,514 | 16.7%), engineering (3,035 | 11.2%), social sciences (2,867 | 10.6%), education (2,239 | 8.3%), and science & technology (1,944 | 7.2%) are the most common fields of study among 27,044 individuals in Framingham who have obtained a bachelor's degree or higher.
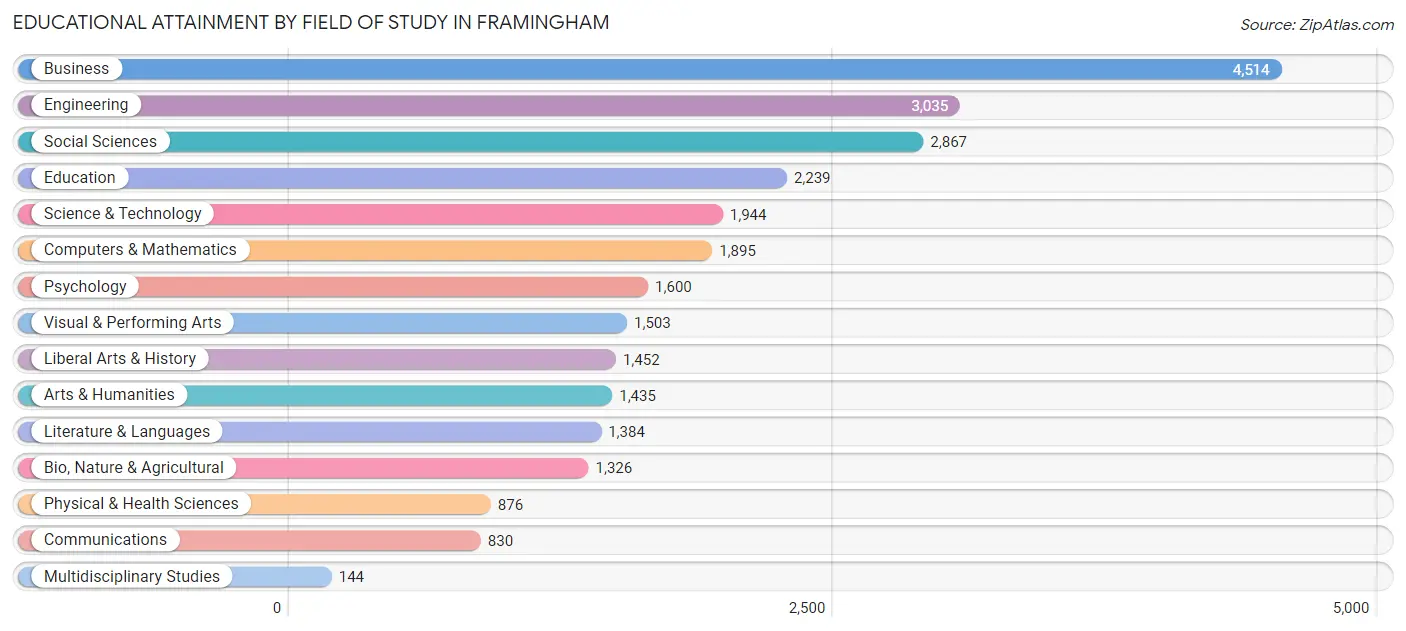
| Field of Study | # Graduates | % Graduates |
| Computers & Mathematics | 1,895 | 7.0% |
| Bio, Nature & Agricultural | 1,326 | 4.9% |
| Physical & Health Sciences | 876 | 3.2% |
| Psychology | 1,600 | 5.9% |
| Social Sciences | 2,867 | 10.6% |
| Engineering | 3,035 | 11.2% |
| Multidisciplinary Studies | 144 | 0.5% |
| Science & Technology | 1,944 | 7.2% |
| Business | 4,514 | 16.7% |
| Education | 2,239 | 8.3% |
| Literature & Languages | 1,384 | 5.1% |
| Liberal Arts & History | 1,452 | 5.4% |
| Visual & Performing Arts | 1,503 | 5.6% |
| Communications | 830 | 3.1% |
| Arts & Humanities | 1,435 | 5.3% |
| Total | 27,044 | 100.0% |
Transportation & Commute in Framingham
Vehicle Availability by Sex in Framingham
The most prevalent vehicle ownership categories in Framingham are males with 2 vehicles (8,898, accounting for 43.6%) and females with 2 vehicles (7,858, making up 53.1%).
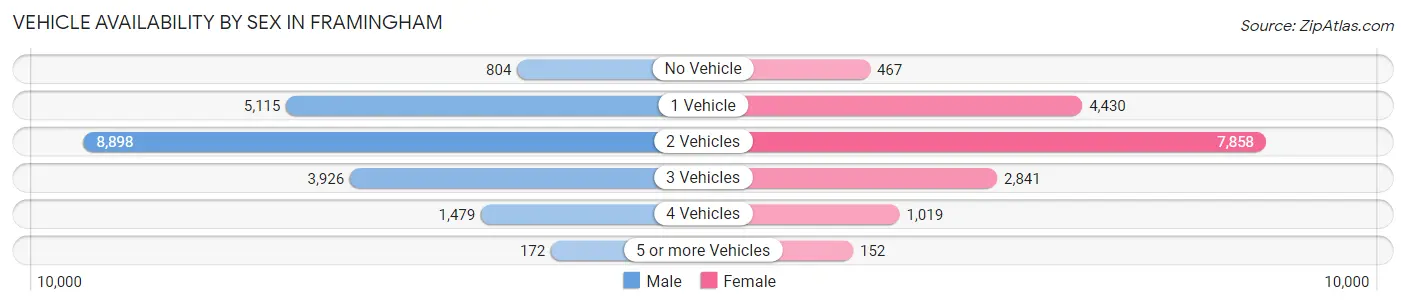
| Vehicles Available | Male | Female |
| No Vehicle | 804 (3.9%) | 467 (2.8%) |
| 1 Vehicle | 5,115 (25.1%) | 4,430 (26.4%) |
| 2 Vehicles | 8,898 (43.6%) | 7,858 (46.9%) |
| 3 Vehicles | 3,926 (19.3%) | 2,841 (16.9%) |
| 4 Vehicles | 1,479 (7.2%) | 1,019 (6.1%) |
| 5 or more Vehicles | 172 (0.8%) | 152 (0.9%) |
| Total | 20,394 (100.0%) | 16,767 (100.0%) |
Commute Time in Framingham
The most frequently occuring commute durations in Framingham are 15 to 19 minutes (4,643 commuters, 14.4%), 30 to 34 minutes (4,638 commuters, 14.4%), and 10 to 14 minutes (3,842 commuters, 11.9%).
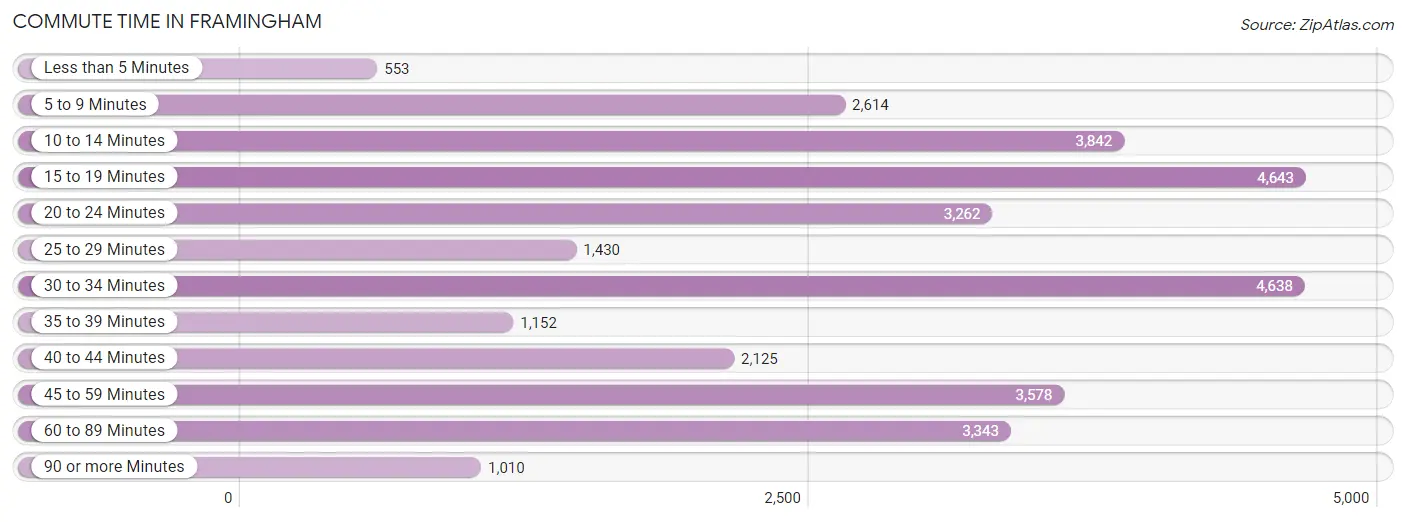
| Commute Time | # Commuters | % Commuters |
| Less than 5 Minutes | 553 | 1.7% |
| 5 to 9 Minutes | 2,614 | 8.1% |
| 10 to 14 Minutes | 3,842 | 11.9% |
| 15 to 19 Minutes | 4,643 | 14.4% |
| 20 to 24 Minutes | 3,262 | 10.1% |
| 25 to 29 Minutes | 1,430 | 4.4% |
| 30 to 34 Minutes | 4,638 | 14.4% |
| 35 to 39 Minutes | 1,152 | 3.6% |
| 40 to 44 Minutes | 2,125 | 6.6% |
| 45 to 59 Minutes | 3,578 | 11.1% |
| 60 to 89 Minutes | 3,343 | 10.4% |
| 90 or more Minutes | 1,010 | 3.1% |
Commute Time by Sex in Framingham
The most common commute times in Framingham are 30 to 34 minutes (2,792 commuters, 15.9%) for males and 15 to 19 minutes (2,504 commuters, 17.1%) for females.
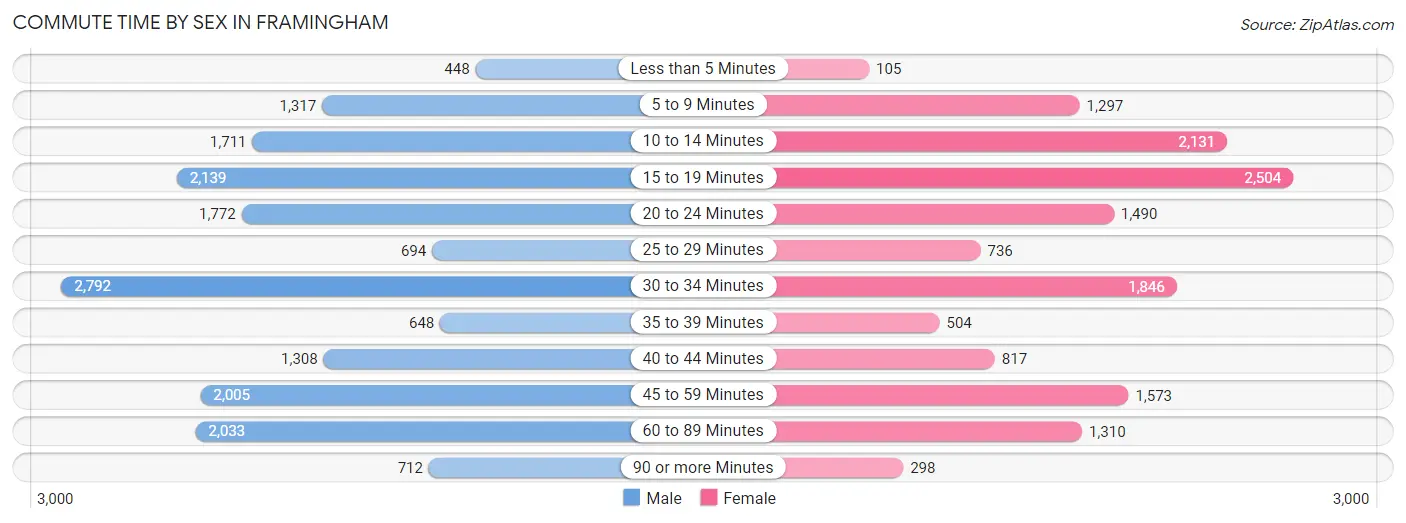
| Commute Time | Male | Female |
| Less than 5 Minutes | 448 (2.5%) | 105 (0.7%) |
| 5 to 9 Minutes | 1,317 (7.5%) | 1,297 (8.9%) |
| 10 to 14 Minutes | 1,711 (9.7%) | 2,131 (14.6%) |
| 15 to 19 Minutes | 2,139 (12.2%) | 2,504 (17.1%) |
| 20 to 24 Minutes | 1,772 (10.1%) | 1,490 (10.2%) |
| 25 to 29 Minutes | 694 (4.0%) | 736 (5.0%) |
| 30 to 34 Minutes | 2,792 (15.9%) | 1,846 (12.6%) |
| 35 to 39 Minutes | 648 (3.7%) | 504 (3.5%) |
| 40 to 44 Minutes | 1,308 (7.4%) | 817 (5.6%) |
| 45 to 59 Minutes | 2,005 (11.4%) | 1,573 (10.8%) |
| 60 to 89 Minutes | 2,033 (11.6%) | 1,310 (9.0%) |
| 90 or more Minutes | 712 (4.1%) | 298 (2.0%) |
Time of Departure to Work by Sex in Framingham
The most frequent times of departure to work in Framingham are 6:00 AM to 6:29 AM (2,366, 13.5%) for males and 7:00 AM to 7:29 AM (2,292, 15.7%) for females.
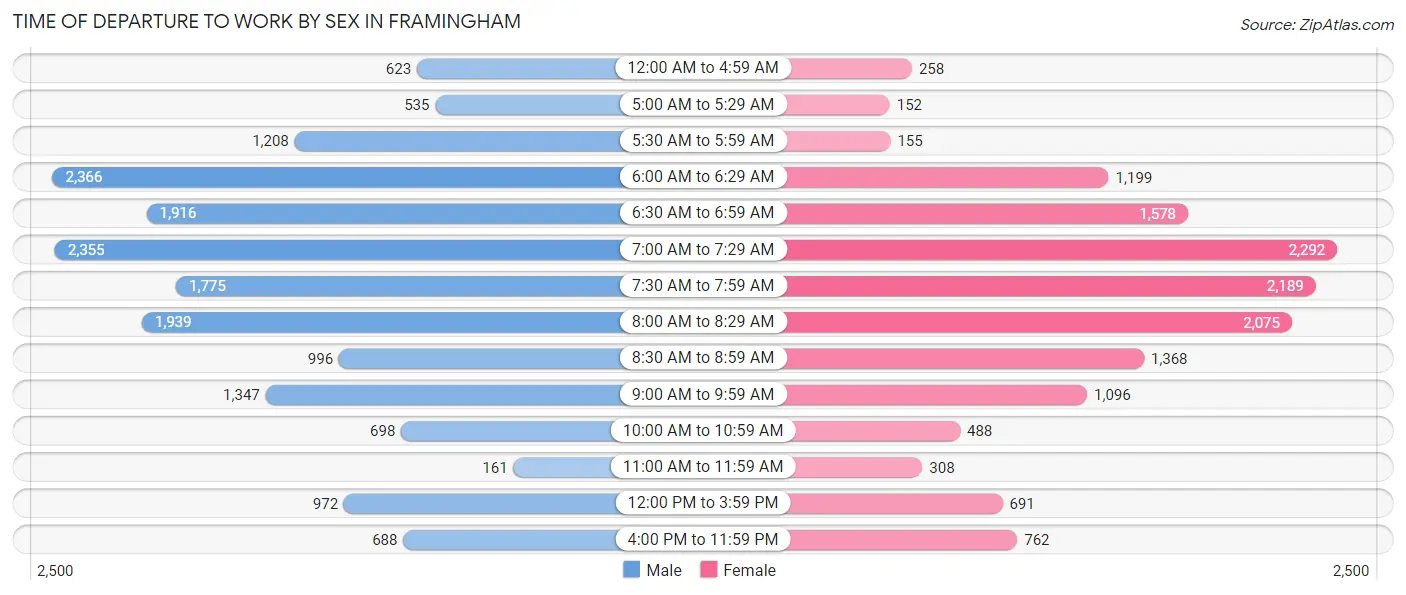
| Time of Departure | Male | Female |
| 12:00 AM to 4:59 AM | 623 (3.5%) | 258 (1.8%) |
| 5:00 AM to 5:29 AM | 535 (3.0%) | 152 (1.0%) |
| 5:30 AM to 5:59 AM | 1,208 (6.9%) | 155 (1.1%) |
| 6:00 AM to 6:29 AM | 2,366 (13.5%) | 1,199 (8.2%) |
| 6:30 AM to 6:59 AM | 1,916 (10.9%) | 1,578 (10.8%) |
| 7:00 AM to 7:29 AM | 2,355 (13.4%) | 2,292 (15.7%) |
| 7:30 AM to 7:59 AM | 1,775 (10.1%) | 2,189 (15.0%) |
| 8:00 AM to 8:29 AM | 1,939 (11.0%) | 2,075 (14.2%) |
| 8:30 AM to 8:59 AM | 996 (5.7%) | 1,368 (9.4%) |
| 9:00 AM to 9:59 AM | 1,347 (7.7%) | 1,096 (7.5%) |
| 10:00 AM to 10:59 AM | 698 (4.0%) | 488 (3.3%) |
| 11:00 AM to 11:59 AM | 161 (0.9%) | 308 (2.1%) |
| 12:00 PM to 3:59 PM | 972 (5.5%) | 691 (4.7%) |
| 4:00 PM to 11:59 PM | 688 (3.9%) | 762 (5.2%) |
| Total | 17,579 (100.0%) | 14,611 (100.0%) |
Housing Occupancy in Framingham
Occupancy by Ownership in Framingham
Of the total 27,810 dwellings in Framingham, owner-occupied units account for 15,318 (55.1%), while renter-occupied units make up 12,492 (44.9%).
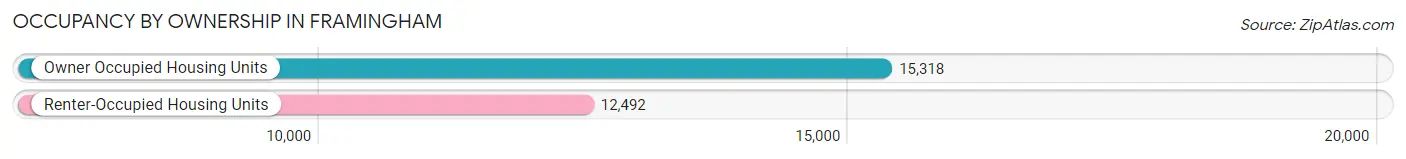
| Occupancy | # Housing Units | % Housing Units |
| Owner Occupied Housing Units | 15,318 | 55.1% |
| Renter-Occupied Housing Units | 12,492 | 44.9% |
| Total Occupied Housing Units | 27,810 | 100.0% |
Occupancy by Household Size in Framingham
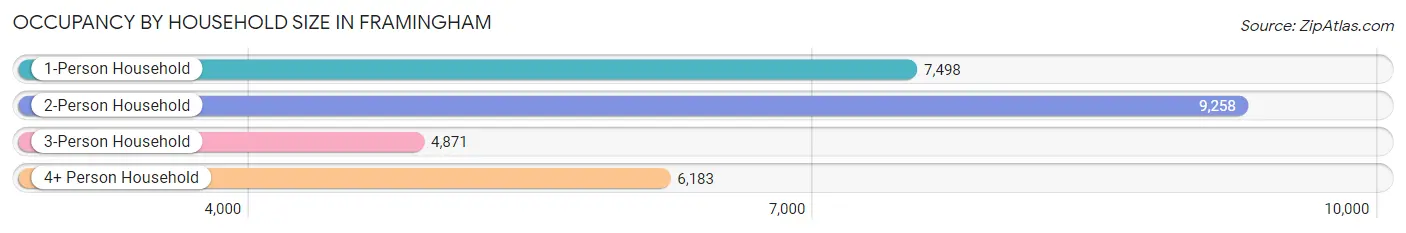
| Household Size | # Housing Units | % Housing Units |
| 1-Person Household | 7,498 | 27.0% |
| 2-Person Household | 9,258 | 33.3% |
| 3-Person Household | 4,871 | 17.5% |
| 4+ Person Household | 6,183 | 22.2% |
| Total Housing Units | 27,810 | 100.0% |
Occupancy by Ownership by Household Size in Framingham
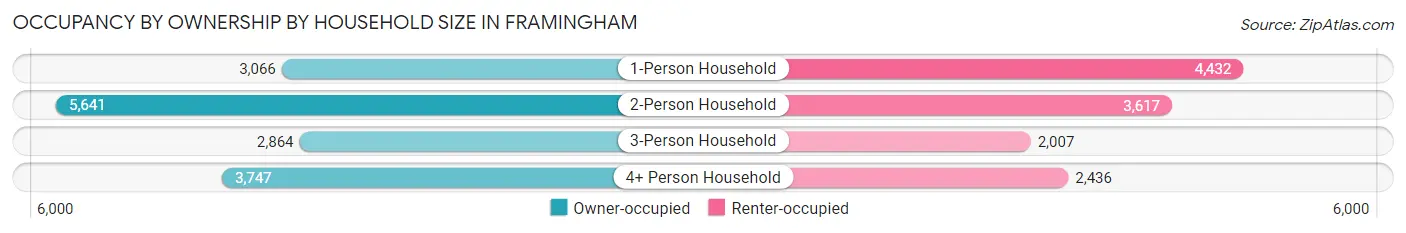
| Household Size | Owner-occupied | Renter-occupied |
| 1-Person Household | 3,066 (40.9%) | 4,432 (59.1%) |
| 2-Person Household | 5,641 (60.9%) | 3,617 (39.1%) |
| 3-Person Household | 2,864 (58.8%) | 2,007 (41.2%) |
| 4+ Person Household | 3,747 (60.6%) | 2,436 (39.4%) |
| Total Housing Units | 15,318 (55.1%) | 12,492 (44.9%) |
Occupancy by Educational Attainment in Framingham
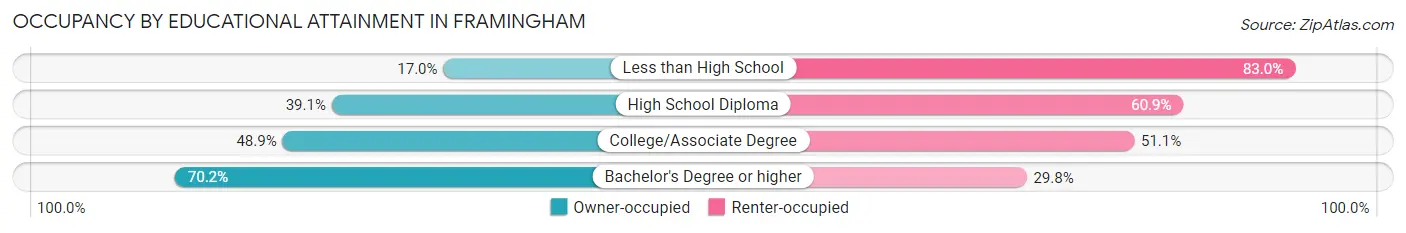
| Household Size | Owner-occupied | Renter-occupied |
| Less than High School | 493 (17.0%) | 2,412 (83.0%) |
| High School Diploma | 1,917 (39.1%) | 2,984 (60.9%) |
| College/Associate Degree | 2,602 (48.9%) | 2,722 (51.1%) |
| Bachelor's Degree or higher | 10,306 (70.2%) | 4,374 (29.8%) |
Occupancy by Age of Householder in Framingham
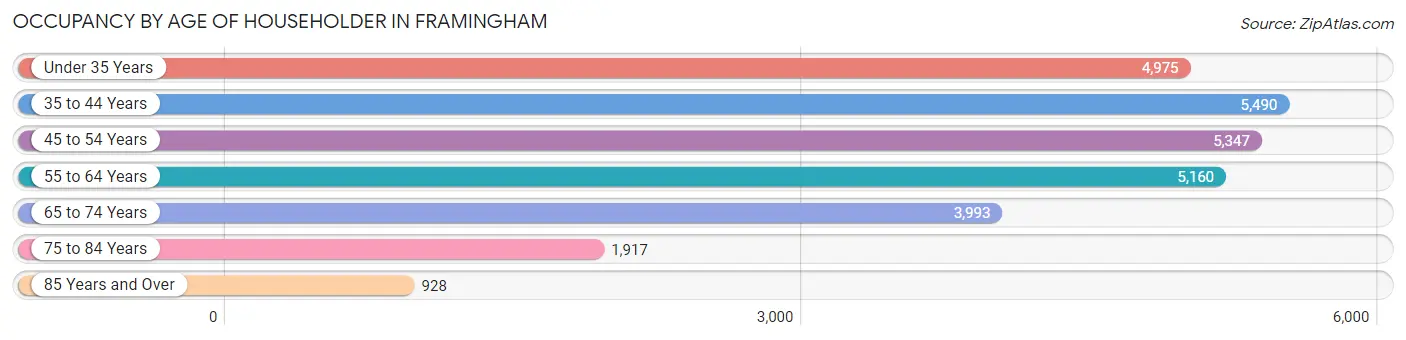
| Age Bracket | # Households | % Households |
| Under 35 Years | 4,975 | 17.9% |
| 35 to 44 Years | 5,490 | 19.7% |
| 45 to 54 Years | 5,347 | 19.2% |
| 55 to 64 Years | 5,160 | 18.5% |
| 65 to 74 Years | 3,993 | 14.4% |
| 75 to 84 Years | 1,917 | 6.9% |
| 85 Years and Over | 928 | 3.3% |
| Total | 27,810 | 100.0% |
Housing Finances in Framingham
Median Income by Occupancy in Framingham
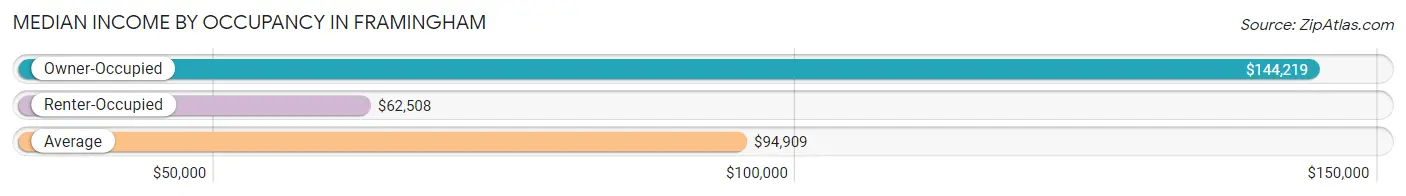
| Occupancy Type | # Households | Median Income |
| Owner-Occupied | 15,318 (55.1%) | $144,219 |
| Renter-Occupied | 12,492 (44.9%) | $62,508 |
| Average | 27,810 (100.0%) | $94,909 |
Occupancy by Householder Income Bracket in Framingham
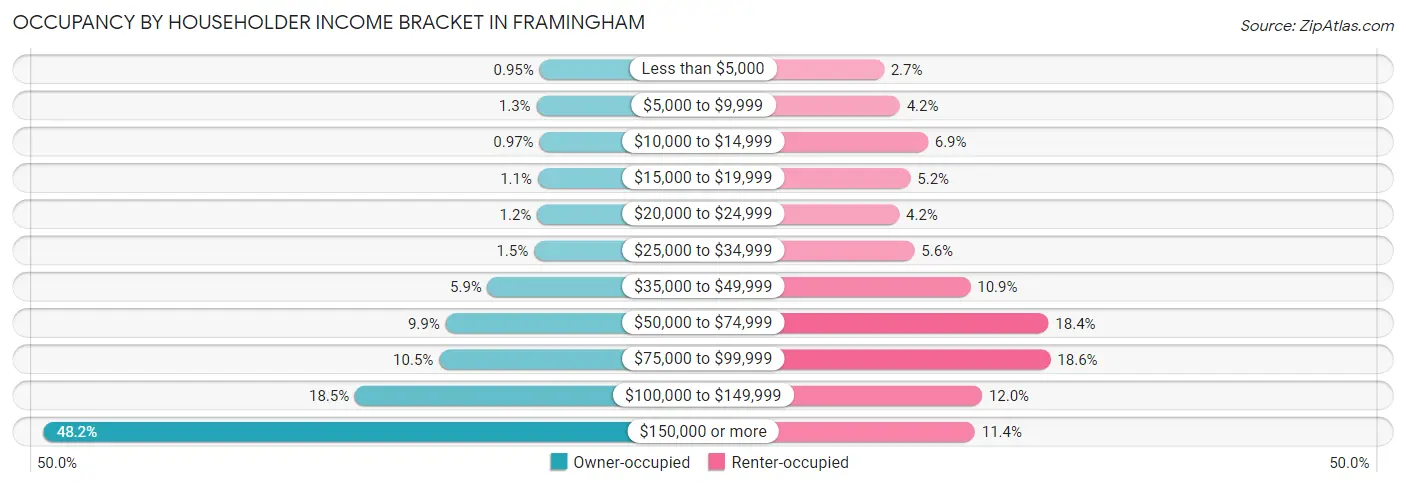
| Income Bracket | Owner-occupied | Renter-occupied |
| Less than $5,000 | 146 (0.9%) | 335 (2.7%) |
| $5,000 to $9,999 | 192 (1.3%) | 526 (4.2%) |
| $10,000 to $14,999 | 149 (1.0%) | 860 (6.9%) |
| $15,000 to $19,999 | 172 (1.1%) | 652 (5.2%) |
| $20,000 to $24,999 | 181 (1.2%) | 519 (4.2%) |
| $25,000 to $34,999 | 227 (1.5%) | 699 (5.6%) |
| $35,000 to $49,999 | 904 (5.9%) | 1,365 (10.9%) |
| $50,000 to $74,999 | 1,518 (9.9%) | 2,295 (18.4%) |
| $75,000 to $99,999 | 1,611 (10.5%) | 2,318 (18.6%) |
| $100,000 to $149,999 | 2,839 (18.5%) | 1,504 (12.0%) |
| $150,000 or more | 7,379 (48.2%) | 1,419 (11.4%) |
| Total | 15,318 (100.0%) | 12,492 (100.0%) |
Monthly Housing Cost Tiers in Framingham
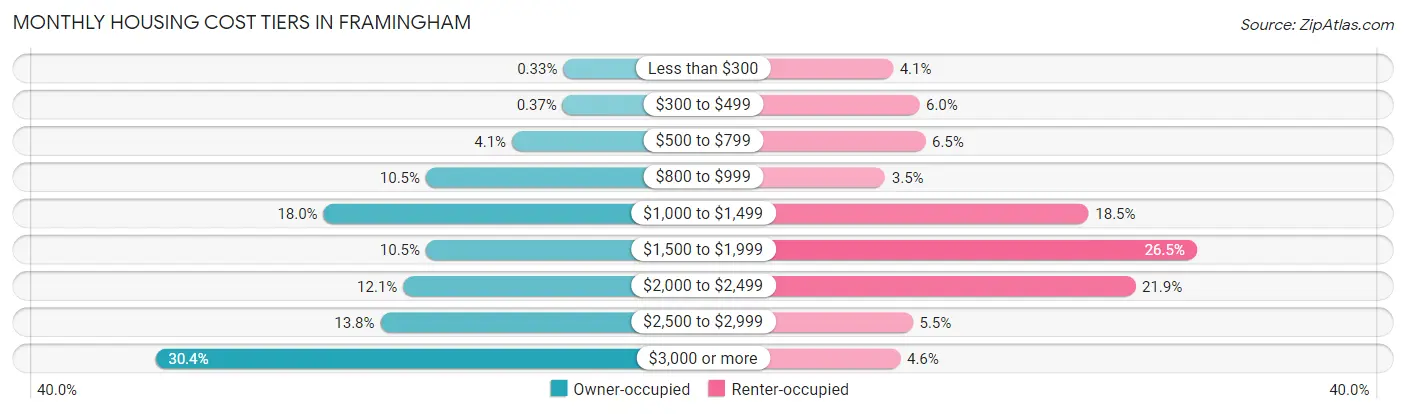
| Monthly Cost | Owner-occupied | Renter-occupied |
| Less than $300 | 50 (0.3%) | 509 (4.1%) |
| $300 to $499 | 57 (0.4%) | 751 (6.0%) |
| $500 to $799 | 630 (4.1%) | 806 (6.5%) |
| $800 to $999 | 1,601 (10.4%) | 436 (3.5%) |
| $1,000 to $1,499 | 2,756 (18.0%) | 2,308 (18.5%) |
| $1,500 to $1,999 | 1,601 (10.4%) | 3,306 (26.5%) |
| $2,000 to $2,499 | 1,857 (12.1%) | 2,738 (21.9%) |
| $2,500 to $2,999 | 2,114 (13.8%) | 691 (5.5%) |
| $3,000 or more | 4,652 (30.4%) | 576 (4.6%) |
| Total | 15,318 (100.0%) | 12,492 (100.0%) |
Physical Housing Characteristics in Framingham
Housing Structures in Framingham
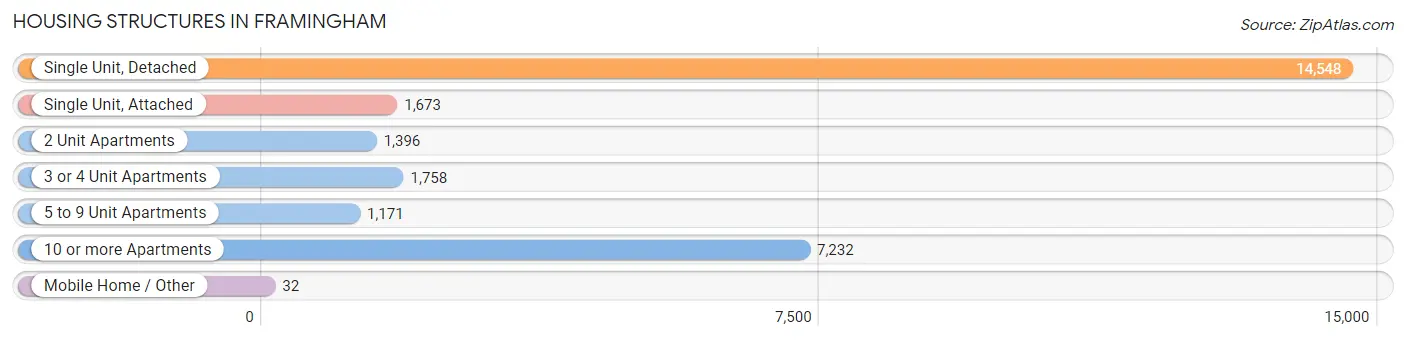
| Structure Type | # Housing Units | % Housing Units |
| Single Unit, Detached | 14,548 | 52.3% |
| Single Unit, Attached | 1,673 | 6.0% |
| 2 Unit Apartments | 1,396 | 5.0% |
| 3 or 4 Unit Apartments | 1,758 | 6.3% |
| 5 to 9 Unit Apartments | 1,171 | 4.2% |
| 10 or more Apartments | 7,232 | 26.0% |
| Mobile Home / Other | 32 | 0.1% |
| Total | 27,810 | 100.0% |
Housing Structures by Occupancy in Framingham
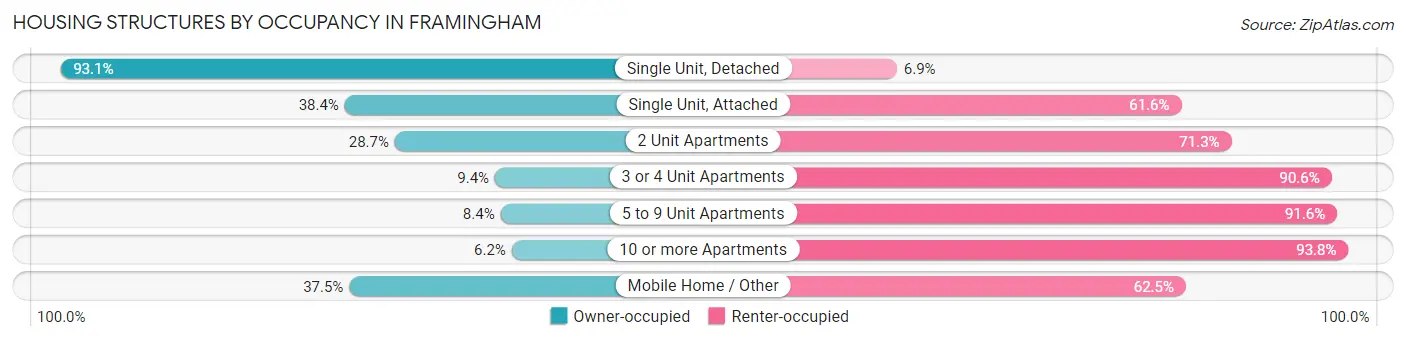
| Structure Type | Owner-occupied | Renter-occupied |
| Single Unit, Detached | 13,549 (93.1%) | 999 (6.9%) |
| Single Unit, Attached | 642 (38.4%) | 1,031 (61.6%) |
| 2 Unit Apartments | 401 (28.7%) | 995 (71.3%) |
| 3 or 4 Unit Apartments | 166 (9.4%) | 1,592 (90.6%) |
| 5 to 9 Unit Apartments | 98 (8.4%) | 1,073 (91.6%) |
| 10 or more Apartments | 450 (6.2%) | 6,782 (93.8%) |
| Mobile Home / Other | 12 (37.5%) | 20 (62.5%) |
| Total | 15,318 (55.1%) | 12,492 (44.9%) |
Housing Structures by Number of Rooms in Framingham
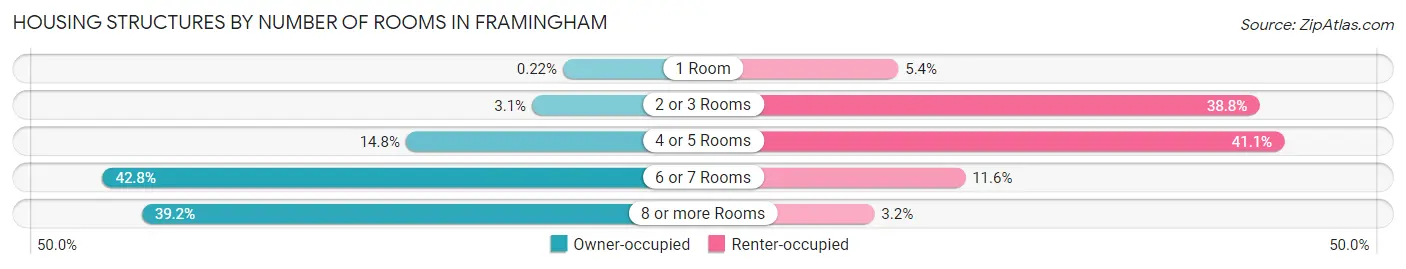
| Number of Rooms | Owner-occupied | Renter-occupied |
| 1 Room | 34 (0.2%) | 674 (5.4%) |
| 2 or 3 Rooms | 472 (3.1%) | 4,842 (38.8%) |
| 4 or 5 Rooms | 2,259 (14.7%) | 5,129 (41.1%) |
| 6 or 7 Rooms | 6,555 (42.8%) | 1,448 (11.6%) |
| 8 or more Rooms | 5,998 (39.2%) | 399 (3.2%) |
| Total | 15,318 (100.0%) | 12,492 (100.0%) |
Housing Structure by Heating Type in Framingham
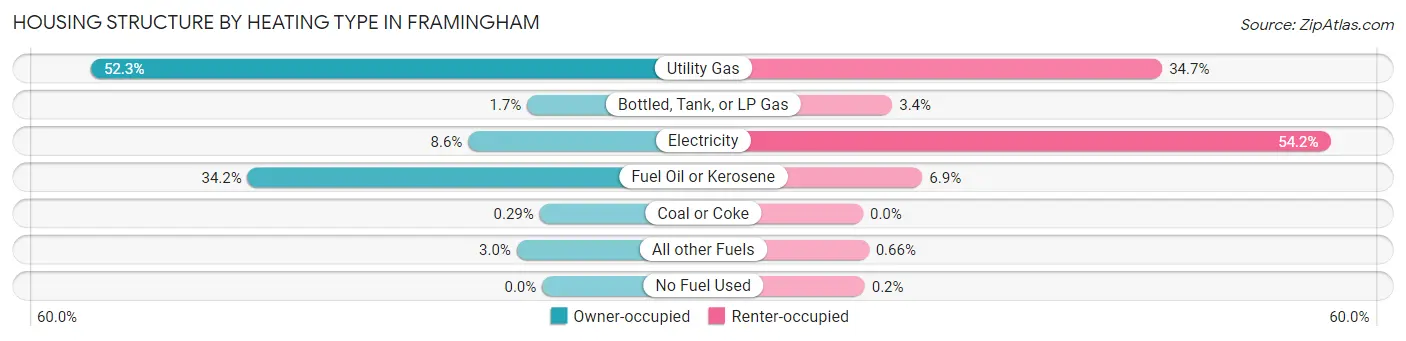
| Heating Type | Owner-occupied | Renter-occupied |
| Utility Gas | 8,011 (52.3%) | 4,334 (34.7%) |
| Bottled, Tank, or LP Gas | 267 (1.7%) | 424 (3.4%) |
| Electricity | 1,313 (8.6%) | 6,767 (54.2%) |
| Fuel Oil or Kerosene | 5,231 (34.2%) | 860 (6.9%) |
| Coal or Coke | 44 (0.3%) | 0 (0.0%) |
| All other Fuels | 452 (2.9%) | 82 (0.7%) |
| No Fuel Used | 0 (0.0%) | 25 (0.2%) |
| Total | 15,318 (100.0%) | 12,492 (100.0%) |
Household Vehicle Usage in Framingham
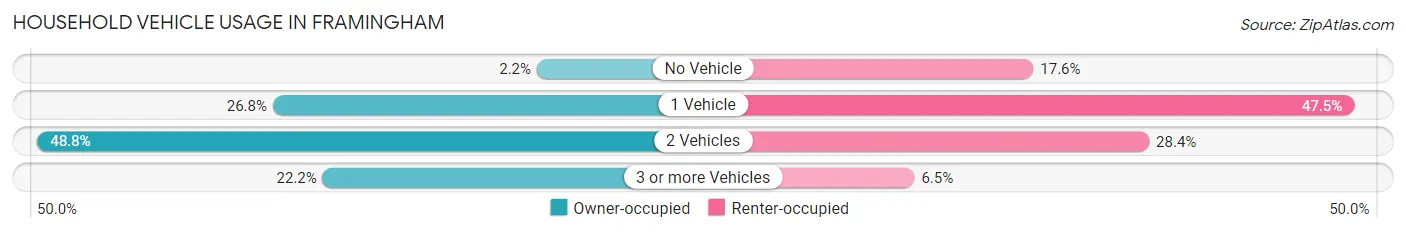
| Vehicles per Household | Owner-occupied | Renter-occupied |
| No Vehicle | 334 (2.2%) | 2,197 (17.6%) |
| 1 Vehicle | 4,110 (26.8%) | 5,936 (47.5%) |
| 2 Vehicles | 7,477 (48.8%) | 3,548 (28.4%) |
| 3 or more Vehicles | 3,397 (22.2%) | 811 (6.5%) |
| Total | 15,318 (100.0%) | 12,492 (100.0%) |
Real Estate & Mortgages in Framingham
Real Estate and Mortgage Overview in Framingham
| Characteristic | Without Mortgage | With Mortgage |
| Housing Units | 4,522 | 10,796 |
| Median Property Value | $535,000 | $560,400 |
| Median Household Income | $98,214 | $5,917 |
| Monthly Housing Costs | $1,016 | $4,630 |
| Real Estate Taxes | $6,615 | $79 |
Property Value by Mortgage Status in Framingham
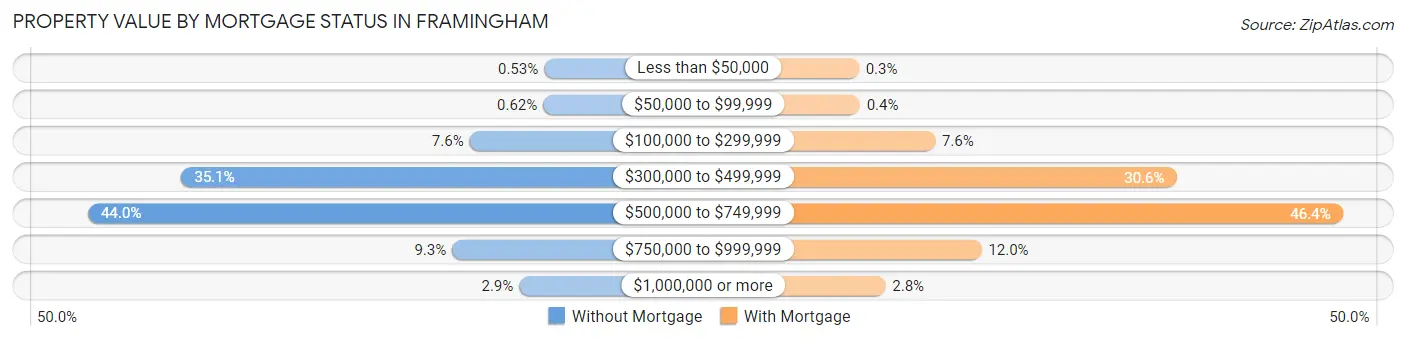
| Property Value | Without Mortgage | With Mortgage |
| Less than $50,000 | 24 (0.5%) | 32 (0.3%) |
| $50,000 to $99,999 | 28 (0.6%) | 43 (0.4%) |
| $100,000 to $299,999 | 345 (7.6%) | 816 (7.6%) |
| $300,000 to $499,999 | 1,586 (35.1%) | 3,298 (30.5%) |
| $500,000 to $749,999 | 1,988 (44.0%) | 5,006 (46.4%) |
| $750,000 to $999,999 | 420 (9.3%) | 1,294 (12.0%) |
| $1,000,000 or more | 131 (2.9%) | 307 (2.8%) |
| Total | 4,522 (100.0%) | 10,796 (100.0%) |
Household Income by Mortgage Status in Framingham
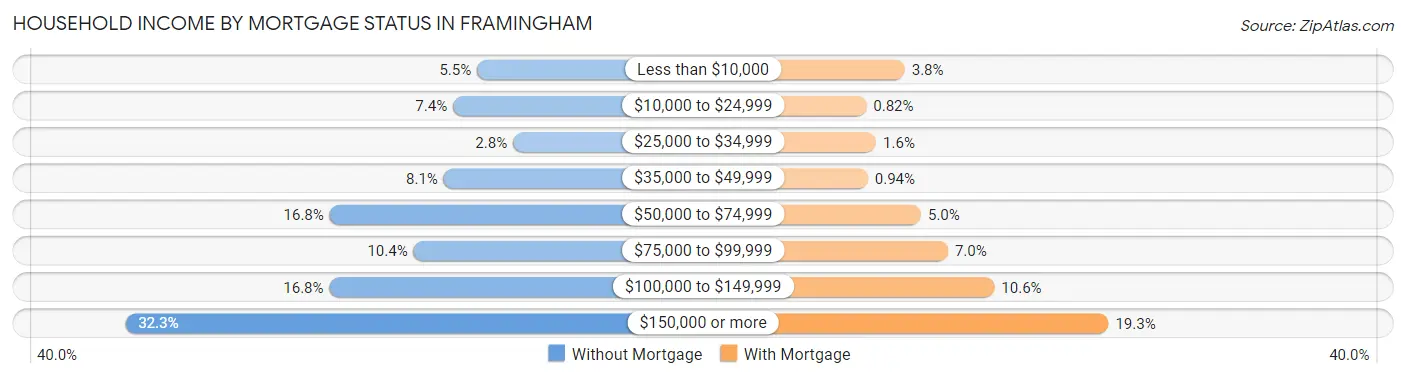
| Household Income | Without Mortgage | With Mortgage |
| Less than $10,000 | 250 (5.5%) | 405 (3.7%) |
| $10,000 to $24,999 | 333 (7.4%) | 88 (0.8%) |
| $25,000 to $34,999 | 126 (2.8%) | 169 (1.6%) |
| $35,000 to $49,999 | 365 (8.1%) | 101 (0.9%) |
| $50,000 to $74,999 | 758 (16.8%) | 539 (5.0%) |
| $75,000 to $99,999 | 469 (10.4%) | 760 (7.0%) |
| $100,000 to $149,999 | 759 (16.8%) | 1,142 (10.6%) |
| $150,000 or more | 1,462 (32.3%) | 2,080 (19.3%) |
| Total | 4,522 (100.0%) | 10,796 (100.0%) |
Property Value to Household Income Ratio in Framingham
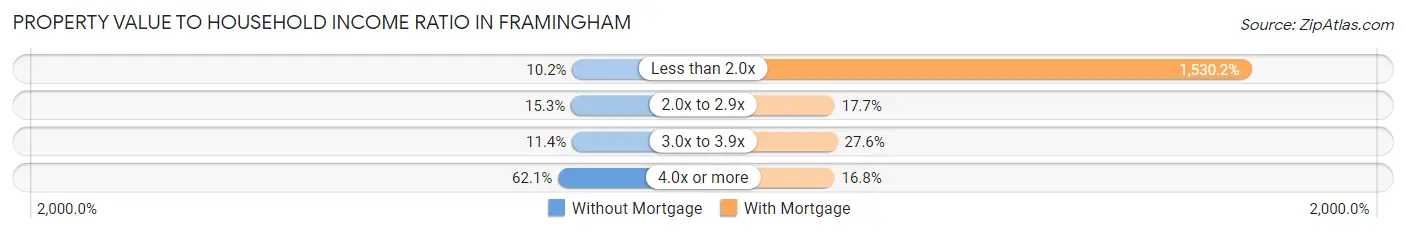
| Value-to-Income Ratio | Without Mortgage | With Mortgage |
| Less than 2.0x | 460 (10.2%) | 165,205 (1,530.2%) |
| 2.0x to 2.9x | 691 (15.3%) | 1,910 (17.7%) |
| 3.0x to 3.9x | 516 (11.4%) | 2,977 (27.6%) |
| 4.0x or more | 2,806 (62.1%) | 1,817 (16.8%) |
| Total | 4,522 (100.0%) | 10,796 (100.0%) |
Real Estate Taxes by Mortgage Status in Framingham
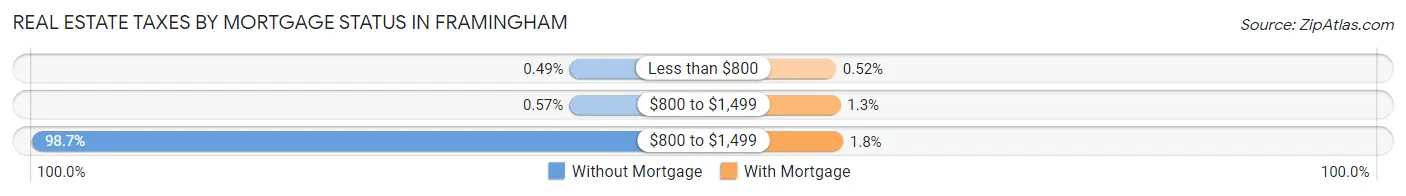
| Property Taxes | Without Mortgage | With Mortgage |
| Less than $800 | 22 (0.5%) | 56 (0.5%) |
| $800 to $1,499 | 26 (0.6%) | 144 (1.3%) |
| $800 to $1,499 | 4,461 (98.7%) | 193 (1.8%) |
| Total | 4,522 (100.0%) | 10,796 (100.0%) |
Health & Disability in Framingham
Health Insurance Coverage by Age in Framingham
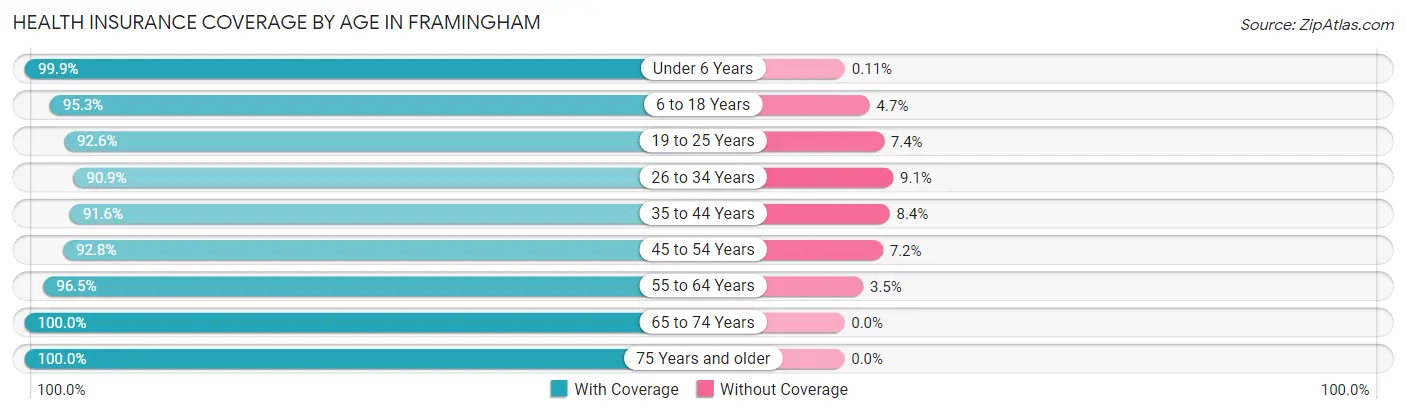
| Age Bracket | With Coverage | Without Coverage |
| Under 6 Years | 5,305 (99.9%) | 6 (0.1%) |
| 6 to 18 Years | 10,281 (95.3%) | 511 (4.7%) |
| 19 to 25 Years | 5,789 (92.6%) | 461 (7.4%) |
| 26 to 34 Years | 8,001 (90.9%) | 801 (9.1%) |
| 35 to 44 Years | 9,889 (91.6%) | 911 (8.4%) |
| 45 to 54 Years | 8,156 (92.8%) | 631 (7.2%) |
| 55 to 64 Years | 8,178 (96.5%) | 297 (3.5%) |
| 65 to 74 Years | 6,777 (100.0%) | 0 (0.0%) |
| 75 Years and older | 4,420 (100.0%) | 0 (0.0%) |
| Total | 66,796 (94.9%) | 3,618 (5.1%) |
Health Insurance Coverage by Citizenship Status in Framingham
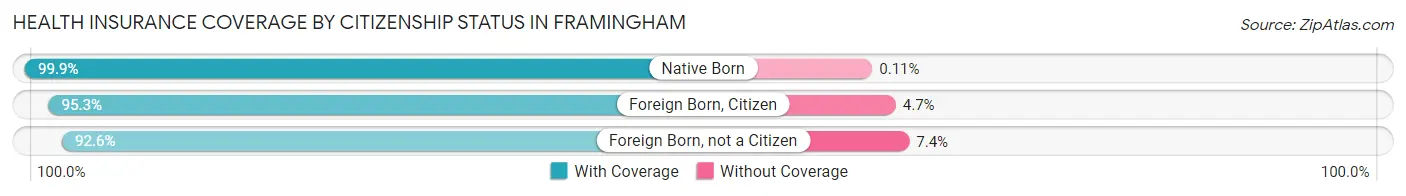
| Citizenship Status | With Coverage | Without Coverage |
| Native Born | 5,305 (99.9%) | 6 (0.1%) |
| Foreign Born, Citizen | 10,281 (95.3%) | 511 (4.7%) |
| Foreign Born, not a Citizen | 5,789 (92.6%) | 461 (7.4%) |
Health Insurance Coverage by Household Income in Framingham
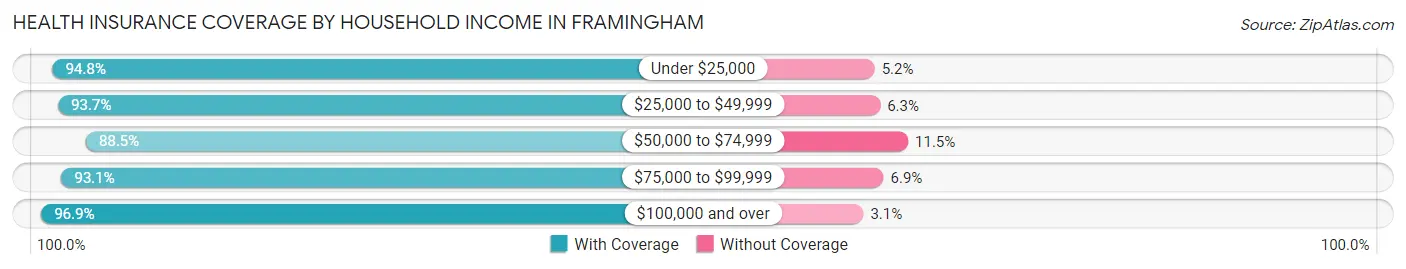
| Household Income | With Coverage | Without Coverage |
| Under $25,000 | 5,911 (94.8%) | 326 (5.2%) |
| $25,000 to $49,999 | 6,171 (93.7%) | 412 (6.3%) |
| $50,000 to $74,999 | 7,758 (88.5%) | 1,007 (11.5%) |
| $75,000 to $99,999 | 9,084 (93.1%) | 672 (6.9%) |
| $100,000 and over | 36,224 (96.9%) | 1,165 (3.1%) |
Public vs Private Health Insurance Coverage by Age in Framingham
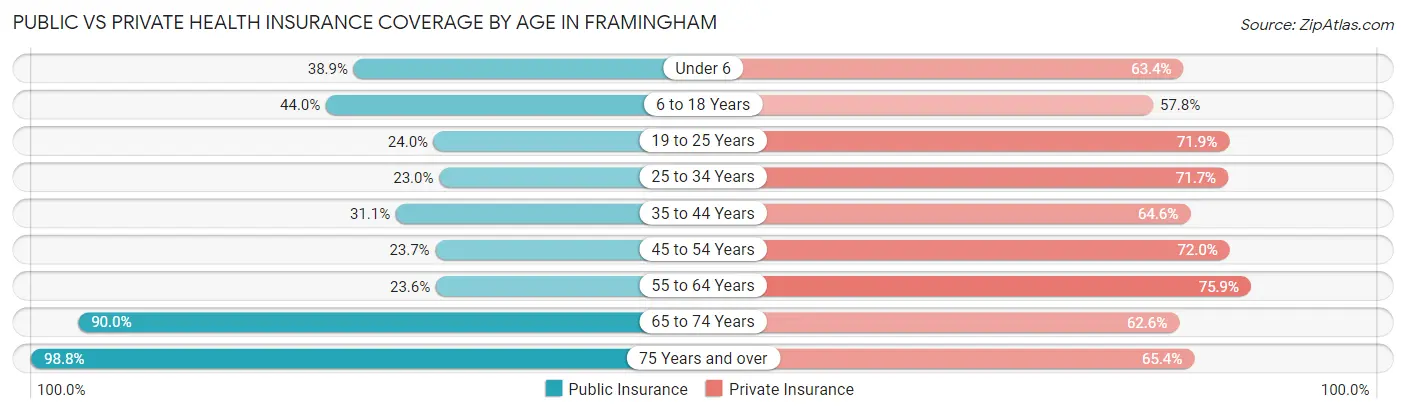
| Age Bracket | Public Insurance | Private Insurance |
| Under 6 | 2,066 (38.9%) | 3,367 (63.4%) |
| 6 to 18 Years | 4,753 (44.0%) | 6,234 (57.8%) |
| 19 to 25 Years | 1,502 (24.0%) | 4,492 (71.9%) |
| 25 to 34 Years | 2,027 (23.0%) | 6,308 (71.7%) |
| 35 to 44 Years | 3,353 (31.0%) | 6,980 (64.6%) |
| 45 to 54 Years | 2,086 (23.7%) | 6,326 (72.0%) |
| 55 to 64 Years | 2,003 (23.6%) | 6,433 (75.9%) |
| 65 to 74 Years | 6,102 (90.0%) | 4,241 (62.6%) |
| 75 Years and over | 4,366 (98.8%) | 2,890 (65.4%) |
| Total | 28,258 (40.1%) | 47,271 (67.1%) |
Disability Status by Sex by Age in Framingham
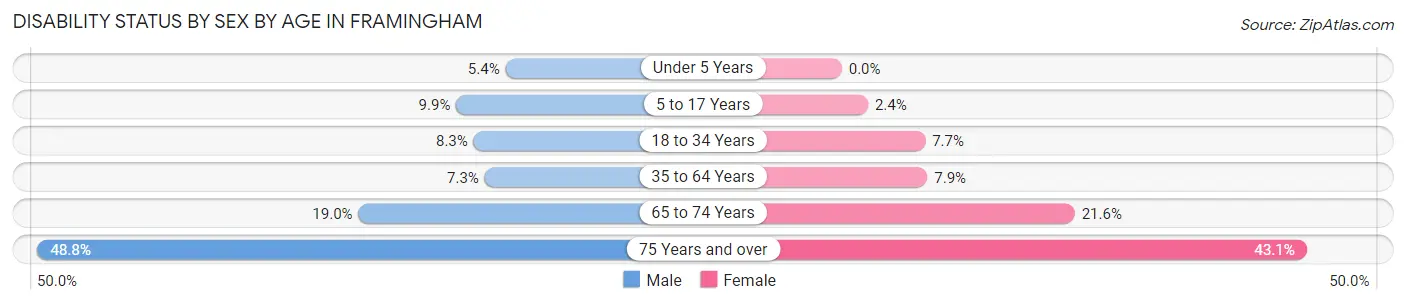
| Age Bracket | Male | Female |
| Under 5 Years | 111 (5.4%) | 0 (0.0%) |
| 5 to 17 Years | 586 (9.9%) | 120 (2.4%) |
| 18 to 34 Years | 678 (8.3%) | 612 (7.7%) |
| 35 to 64 Years | 1,049 (7.3%) | 1,087 (7.9%) |
| 65 to 74 Years | 631 (19.0%) | 748 (21.6%) |
| 75 Years and over | 794 (48.8%) | 1,205 (43.1%) |
Disability Class by Sex by Age in Framingham
Disability Class: Hearing Difficulty
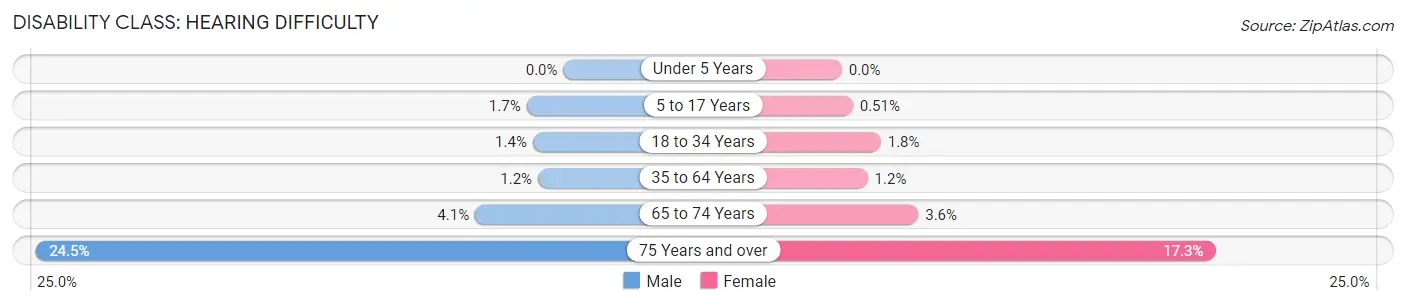
| Age Bracket | Male | Female |
| Under 5 Years | 0 (0.0%) | 0 (0.0%) |
| 5 to 17 Years | 101 (1.7%) | 25 (0.5%) |
| 18 to 34 Years | 116 (1.4%) | 143 (1.8%) |
| 35 to 64 Years | 170 (1.2%) | 164 (1.2%) |
| 65 to 74 Years | 136 (4.1%) | 123 (3.5%) |
| 75 Years and over | 398 (24.5%) | 484 (17.3%) |
Disability Class: Vision Difficulty
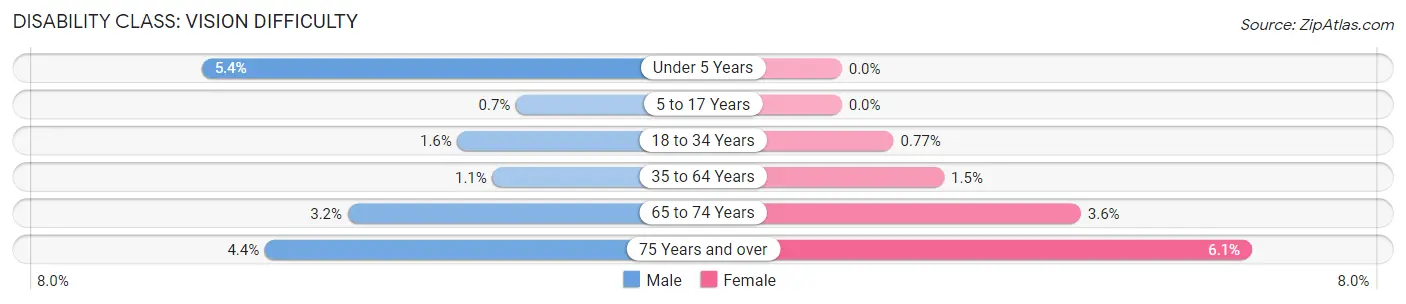
| Age Bracket | Male | Female |
| Under 5 Years | 111 (5.4%) | 0 (0.0%) |
| 5 to 17 Years | 41 (0.7%) | 0 (0.0%) |
| 18 to 34 Years | 128 (1.6%) | 61 (0.8%) |
| 35 to 64 Years | 151 (1.1%) | 208 (1.5%) |
| 65 to 74 Years | 106 (3.2%) | 123 (3.5%) |
| 75 Years and over | 72 (4.4%) | 170 (6.1%) |
Disability Class: Cognitive Difficulty
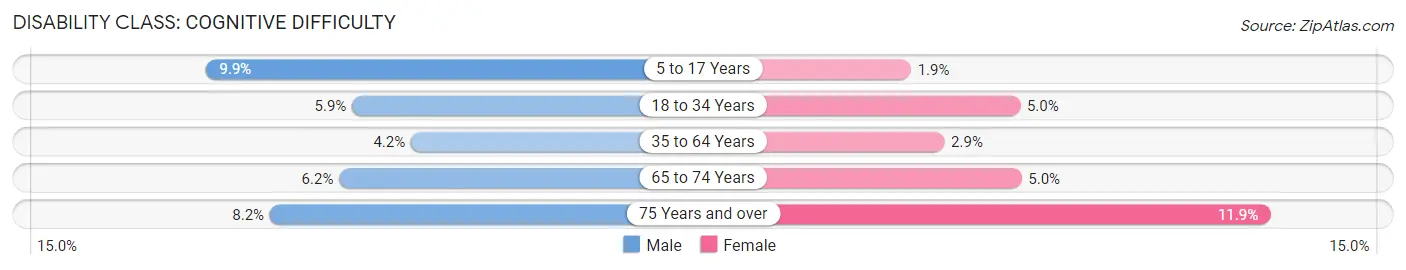
| Age Bracket | Male | Female |
| 5 to 17 Years | 586 (9.9%) | 95 (1.9%) |
| 18 to 34 Years | 479 (5.9%) | 392 (5.0%) |
| 35 to 64 Years | 609 (4.2%) | 390 (2.9%) |
| 65 to 74 Years | 207 (6.2%) | 173 (5.0%) |
| 75 Years and over | 133 (8.2%) | 333 (11.9%) |
Disability Class: Ambulatory Difficulty
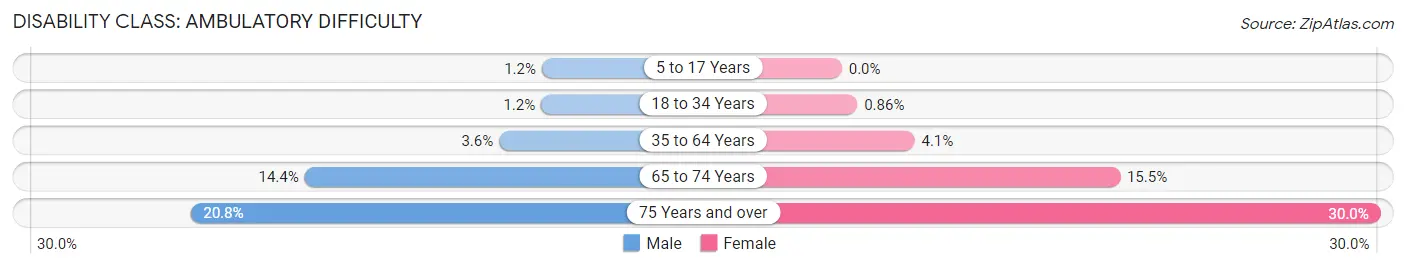
| Age Bracket | Male | Female |
| 5 to 17 Years | 71 (1.2%) | 0 (0.0%) |
| 18 to 34 Years | 101 (1.2%) | 68 (0.9%) |
| 35 to 64 Years | 514 (3.6%) | 555 (4.1%) |
| 65 to 74 Years | 478 (14.4%) | 536 (15.5%) |
| 75 Years and over | 338 (20.8%) | 838 (30.0%) |
Disability Class: Self-Care Difficulty
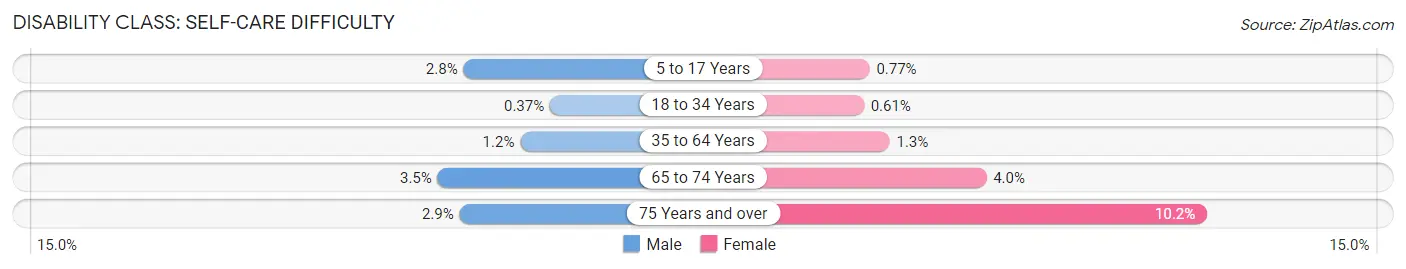
| Age Bracket | Male | Female |
| 5 to 17 Years | 164 (2.8%) | 38 (0.8%) |
| 18 to 34 Years | 30 (0.4%) | 48 (0.6%) |
| 35 to 64 Years | 173 (1.2%) | 182 (1.3%) |
| 65 to 74 Years | 116 (3.5%) | 139 (4.0%) |
| 75 Years and over | 47 (2.9%) | 284 (10.2%) |
Technology Access in Framingham
Computing Device Access in Framingham
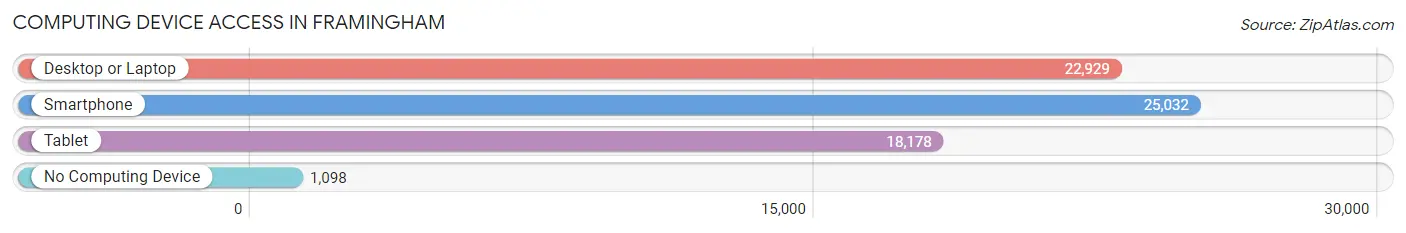
| Device Type | # Households | % Households |
| Desktop or Laptop | 22,929 | 82.5% |
| Smartphone | 25,032 | 90.0% |
| Tablet | 18,178 | 65.4% |
| No Computing Device | 1,098 | 4.0% |
| Total | 27,810 | 100.0% |
Internet Access in Framingham
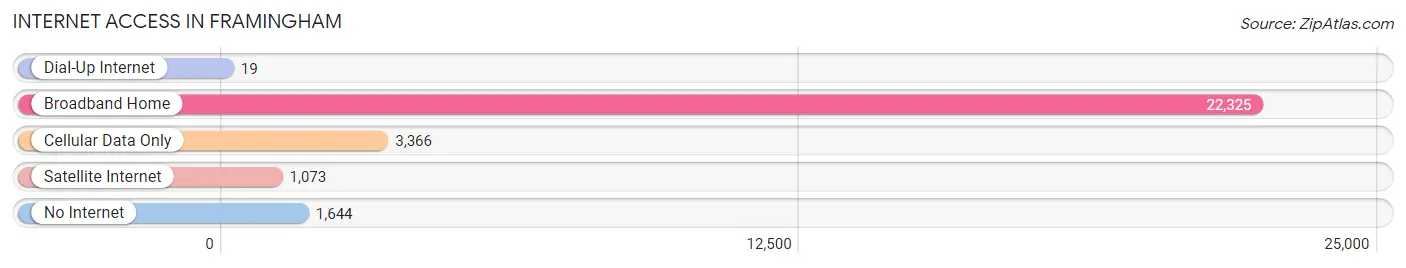
| Internet Type | # Households | % Households |
| Dial-Up Internet | 19 | 0.1% |
| Broadband Home | 22,325 | 80.3% |
| Cellular Data Only | 3,366 | 12.1% |
| Satellite Internet | 1,073 | 3.9% |
| No Internet | 1,644 | 5.9% |
| Total | 27,810 | 100.0% |
Framingham Summary
Framingham, Massachusetts is a city located in the Commonwealth of Massachusetts in the United States. It is located in Middlesex County, approximately 20 miles west of Boston. As of the 2010 census, the city had a population of 68,318, making it the 14th largest city in Massachusetts.
History
The area that is now Framingham was first settled in 1650 by John Stone and his family. The area was originally part of the town of Sudbury, but was incorporated as a separate town in 1700. The town was named after Framlingham, Suffolk, England, the hometown of the first settler.
In the 19th century, Framingham became a major industrial center, with several factories producing textiles, shoes, and other goods. The town was also home to the first public high school in the United States, which opened in 1825.
In the 20th century, Framingham experienced a period of rapid growth, as the population increased from 10,000 in 1900 to over 68,000 in 2010. This growth was largely due to the influx of immigrants from Europe and the Middle East, as well as the expansion of the Boston metropolitan area.
Geography
Framingham is located in eastern Massachusetts, approximately 20 miles west of Boston. It is bordered by the towns of Natick to the north, Sherborn to the west, Ashland to the south, and Wayland to the east.
The city is located in the Charles River watershed, and is bisected by the Sudbury River. The city is also home to several lakes, including Lake Cochituate, Lake Waushakum, and Lake Winthrop.
The city has a total area of 26.4 square miles, of which 25.7 square miles is land and 0.7 square miles is water.
Economy
Framingham is home to a diverse economy, with a mix of manufacturing, retail, and service industries. The city is home to several major employers, including Bose Corporation, Staples, and TJX Companies.
The city is also home to several educational institutions, including Framingham State University, MassBay Community College, and the Framingham campus of the University of Massachusetts Medical School.
Demographics
As of the 2010 census, the city had a population of 68,318. The racial makeup of the city was 79.2% White, 8.3% African American, 0.3% Native American, 6.7% Asian, 0.1% Pacific Islander, 2.3% from other races, and 3.2% from two or more races. Hispanic or Latino of any race were 8.7% of the population.
The median income for a household in the city was $63,817, and the median income for a family was $76,945. The per capita income for the city was $30,890. About 5.2% of families and 7.7% of the population were below the poverty line, including 9.2% of those under age 18 and 6.2% of those age 65 or over.
Common Questions
What is Per Capita Income in Framingham?
Per Capita income in Framingham is $52,370.
What is the Median Family Income in Framingham?
Median Family Income in Framingham is $116,954.
What is the Median Household income in Framingham?
Median Household Income in Framingham is $94,909.
What is Income or Wage Gap in Framingham?
Income or Wage Gap in Framingham is 25.2%.
Women in Framingham earn 74.8 cents for every dollar earned by a man.
What is Family Income Deficit in Framingham?
Family Income Deficit in Framingham is $11,070.
Families that are below poverty line in Framingham earn $11,070 less on average than the poverty threshold level.
What is Inequality or Gini Index in Framingham?
Inequality or Gini Index in Framingham is 0.47.
What is the Total Population of Framingham?
Total Population of Framingham is 71,805.
What is the Total Male Population of Framingham?
Total Male Population of Framingham is 36,005.
What is the Total Female Population of Framingham?
Total Female Population of Framingham is 35,800.
What is the Ratio of Males per 100 Females in Framingham?
There are 100.57 Males per 100 Females in Framingham.
What is the Ratio of Females per 100 Males in Framingham?
There are 99.43 Females per 100 Males in Framingham.
What is the Median Population Age in Framingham?
Median Population Age in Framingham is 38.8 Years.
What is the Average Family Size in Framingham
Average Family Size in Framingham is 3.0 People.
What is the Average Household Size in Framingham
Average Household Size in Framingham is 2.5 People.
How Large is the Labor Force in Framingham?
There are 41,172 People in the Labor Forcein in Framingham.
What is the Percentage of People in the Labor Force in Framingham?
71.0% of People are in the Labor Force in Framingham.
What is the Unemployment Rate in Framingham?
Unemployment Rate in Framingham is 5.0%.