Cities with the Most Immigrants from Ecuador in New Jersey
RELATED REPORTS & OPTIONS
Ecuador
New Jersey
Compare Cities
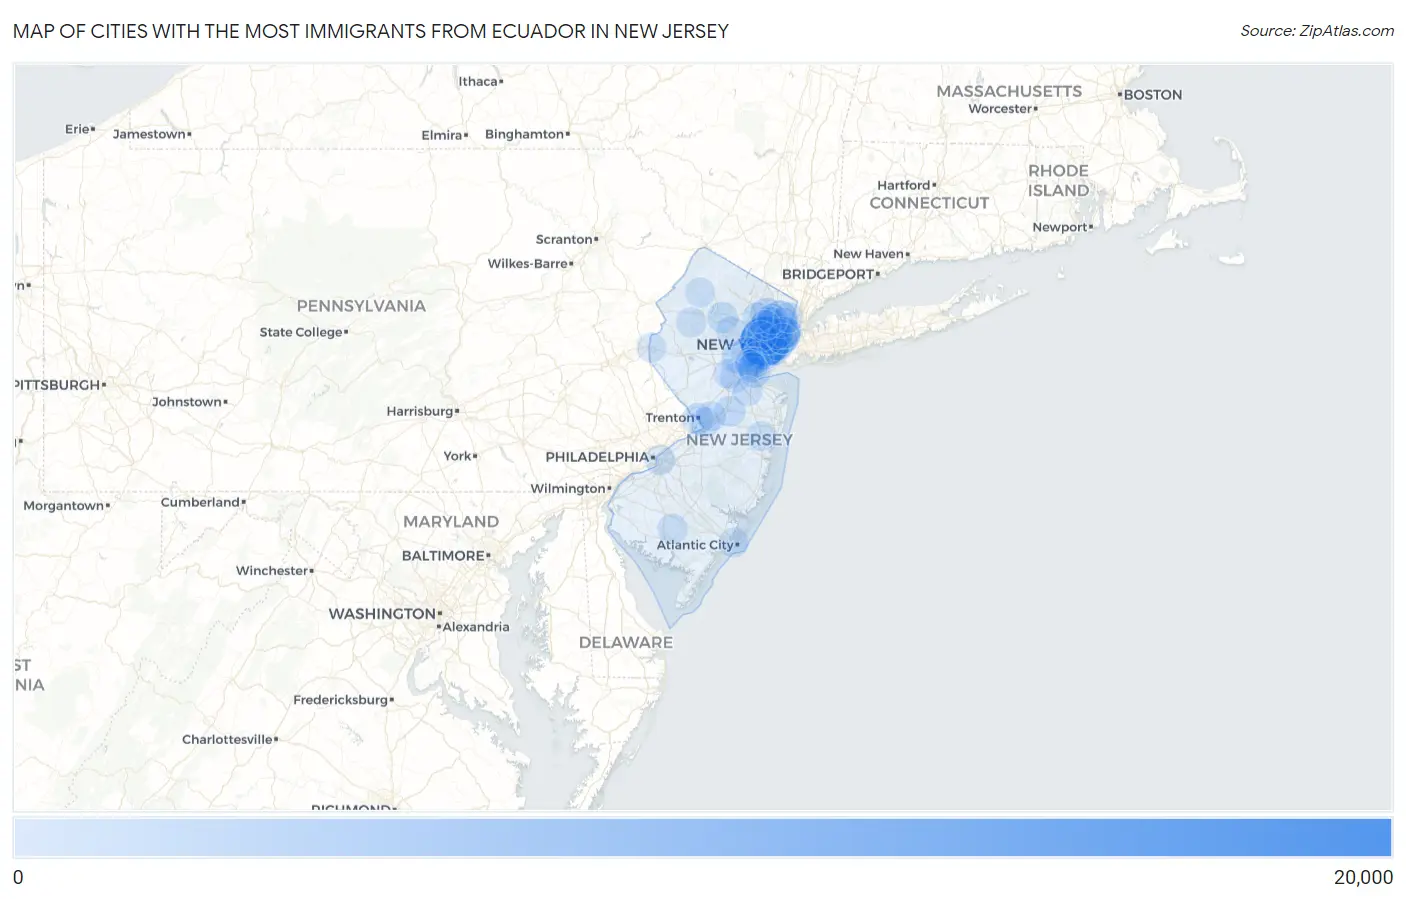
Map of Cities with the Most Immigrants from Ecuador in New Jersey
0
20,000
Cities with the Most Immigrants from Ecuador in New Jersey
| City | Ecuador | vs State | vs National | |
| 1. | Newark | 18,452 | 95,275(19.37%)#1 | 480,873(3.84%)#2 |
| 2. | Elizabeth | 6,572 | 95,275(6.90%)#2 | 480,873(1.37%)#4 |
| 3. | Union City | 4,491 | 95,275(4.71%)#3 | 480,873(0.93%)#7 |
| 4. | Hackensack | 3,613 | 95,275(3.79%)#4 | 480,873(0.75%)#9 |
| 5. | Jersey City | 2,922 | 95,275(3.07%)#5 | 480,873(0.61%)#12 |
| 6. | Kearny | 2,527 | 95,275(2.65%)#6 | 480,873(0.53%)#17 |
| 7. | West New York | 2,500 | 95,275(2.62%)#7 | 480,873(0.52%)#18 |
| 8. | Paterson | 1,775 | 95,275(1.86%)#8 | 480,873(0.37%)#23 |
| 9. | Plainfield | 1,657 | 95,275(1.74%)#9 | 480,873(0.34%)#25 |
| 10. | Lodi Borough | 988 | 95,275(1.04%)#10 | 480,873(0.21%)#42 |
| 11. | Linden | 955 | 95,275(1.00%)#11 | 480,873(0.20%)#44 |
| 12. | Trenton | 932 | 95,275(0.98%)#12 | 480,873(0.19%)#50 |
| 13. | North Plainfield Borough | 901 | 95,275(0.95%)#13 | 480,873(0.19%)#54 |
| 14. | Twin Rivers | 888 | 95,275(0.93%)#14 | 480,873(0.18%)#55 |
| 15. | Bayonne | 816 | 95,275(0.86%)#15 | 480,873(0.17%)#57 |
| 16. | Guttenberg | 791 | 95,275(0.83%)#16 | 480,873(0.16%)#60 |
| 17. | Clifton | 775 | 95,275(0.81%)#17 | 480,873(0.16%)#62 |
| 18. | Dover | 774 | 95,275(0.81%)#18 | 480,873(0.16%)#63 |
| 19. | East Newark Borough | 770 | 95,275(0.81%)#19 | 480,873(0.16%)#65 |
| 20. | Cliffside Park Borough | 710 | 95,275(0.75%)#20 | 480,873(0.15%)#70 |
| 21. | Harrison | 696 | 95,275(0.73%)#21 | 480,873(0.14%)#72 |
| 22. | Silver Lake Cdp Essex County | 678 | 95,275(0.71%)#22 | 480,873(0.14%)#80 |
| 23. | Ampere North | 666 | 95,275(0.70%)#23 | 480,873(0.14%)#83 |
| 24. | Little Ferry Borough | 635 | 95,275(0.67%)#24 | 480,873(0.13%)#84 |
| 25. | Ridgefield Park | 617 | 95,275(0.65%)#25 | 480,873(0.13%)#88 |
| 26. | Perth Amboy | 591 | 95,275(0.62%)#26 | 480,873(0.12%)#94 |
| 27. | Roselle Borough | 571 | 95,275(0.60%)#27 | 480,873(0.12%)#95 |
| 28. | North Arlington Borough | 558 | 95,275(0.59%)#28 | 480,873(0.12%)#98 |
| 29. | Hightstown Borough | 552 | 95,275(0.58%)#29 | 480,873(0.11%)#99 |
| 30. | Secaucus | 499 | 95,275(0.52%)#30 | 480,873(0.10%)#106 |
| 31. | Passaic | 491 | 95,275(0.52%)#31 | 480,873(0.10%)#109 |
| 32. | Camden | 446 | 95,275(0.47%)#32 | 480,873(0.09%)#116 |
| 33. | Singac | 440 | 95,275(0.46%)#33 | 480,873(0.09%)#120 |
| 34. | New Brunswick | 400 | 95,275(0.42%)#34 | 480,873(0.08%)#135 |
| 35. | East Orange | 355 | 95,275(0.37%)#35 | 480,873(0.07%)#152 |
| 36. | Bogota Borough | 355 | 95,275(0.37%)#36 | 480,873(0.07%)#153 |
| 37. | Garfield | 350 | 95,275(0.37%)#37 | 480,873(0.07%)#155 |
| 38. | North Haledon Borough | 331 | 95,275(0.35%)#38 | 480,873(0.07%)#161 |
| 39. | Oakland Borough | 298 | 95,275(0.31%)#39 | 480,873(0.06%)#182 |
| 40. | Vineland | 295 | 95,275(0.31%)#40 | 480,873(0.06%)#183 |
| 41. | Hasbrouck Heights Borough | 293 | 95,275(0.31%)#41 | 480,873(0.06%)#185 |
| 42. | Hoboken | 266 | 95,275(0.28%)#42 | 480,873(0.06%)#201 |
| 43. | Totowa Borough | 265 | 95,275(0.28%)#43 | 480,873(0.06%)#202 |
| 44. | Hawthorne Borough | 260 | 95,275(0.27%)#44 | 480,873(0.05%)#207 |
| 45. | Ridgefield Borough | 252 | 95,275(0.26%)#45 | 480,873(0.05%)#216 |
| 46. | Fairview Borough | 244 | 95,275(0.26%)#46 | 480,873(0.05%)#222 |
| 47. | Flemington Borough | 238 | 95,275(0.25%)#47 | 480,873(0.05%)#229 |
| 48. | Westfield | 234 | 95,275(0.25%)#48 | 480,873(0.05%)#235 |
| 49. | Elmwood Park Borough | 213 | 95,275(0.22%)#49 | 480,873(0.04%)#264 |
| 50. | Jamesburg Borough | 206 | 95,275(0.22%)#50 | 480,873(0.04%)#269 |
| 51. | White Horse | 203 | 95,275(0.21%)#51 | 480,873(0.04%)#273 |
| 52. | Morristown | 200 | 95,275(0.21%)#52 | 480,873(0.04%)#279 |
| 53. | Beachwood Borough | 196 | 95,275(0.21%)#53 | 480,873(0.04%)#281 |
| 54. | Colonia | 186 | 95,275(0.20%)#54 | 480,873(0.04%)#296 |
| 55. | South River Borough | 185 | 95,275(0.19%)#55 | 480,873(0.04%)#297 |
| 56. | Moonachie Borough | 185 | 95,275(0.19%)#56 | 480,873(0.04%)#298 |
| 57. | Carlstadt Borough | 182 | 95,275(0.19%)#57 | 480,873(0.04%)#302 |
| 58. | Englewood | 163 | 95,275(0.17%)#58 | 480,873(0.03%)#330 |
| 59. | Bergenfield Borough | 160 | 95,275(0.17%)#59 | 480,873(0.03%)#337 |
| 60. | Wharton Borough | 149 | 95,275(0.16%)#60 | 480,873(0.03%)#367 |
| 61. | Avenel | 145 | 95,275(0.15%)#61 | 480,873(0.03%)#377 |
| 62. | Fort Lee Borough | 144 | 95,275(0.15%)#62 | 480,873(0.03%)#379 |
| 63. | Paramus Borough | 144 | 95,275(0.15%)#63 | 480,873(0.03%)#380 |
| 64. | Middlesex Borough | 143 | 95,275(0.15%)#64 | 480,873(0.03%)#386 |
| 65. | South Plainfield Borough | 141 | 95,275(0.15%)#65 | 480,873(0.03%)#391 |
| 66. | Leonia Borough | 140 | 95,275(0.15%)#66 | 480,873(0.03%)#393 |
| 67. | Florham Park Borough | 138 | 95,275(0.14%)#67 | 480,873(0.03%)#399 |
| 68. | Manville Borough | 128 | 95,275(0.13%)#68 | 480,873(0.03%)#427 |
| 69. | Maywood Borough | 115 | 95,275(0.12%)#69 | 480,873(0.02%)#461 |
| 70. | Bound Brook Borough | 114 | 95,275(0.12%)#70 | 480,873(0.02%)#463 |
| 71. | Dunellen Borough | 114 | 95,275(0.12%)#71 | 480,873(0.02%)#464 |
| 72. | Hamilton Square | 108 | 95,275(0.11%)#72 | 480,873(0.02%)#482 |
| 73. | Roseland Borough | 108 | 95,275(0.11%)#73 | 480,873(0.02%)#483 |
| 74. | Rutherford Borough | 105 | 95,275(0.11%)#74 | 480,873(0.02%)#491 |
| 75. | Iselin | 104 | 95,275(0.11%)#75 | 480,873(0.02%)#496 |
| 76. | Somerset | 103 | 95,275(0.11%)#76 | 480,873(0.02%)#503 |
| 77. | Vauxhall | 101 | 95,275(0.11%)#77 | 480,873(0.02%)#509 |
| 78. | Bernardsville Borough | 98 | 95,275(0.10%)#78 | 480,873(0.02%)#517 |
| 79. | Woodbridge | 96 | 95,275(0.10%)#79 | 480,873(0.02%)#526 |
| 80. | Old Bridge | 95 | 95,275(0.10%)#80 | 480,873(0.02%)#528 |
| 81. | Lakewood | 94 | 95,275(0.10%)#81 | 480,873(0.02%)#531 |
| 82. | Hillsborough | 86 | 95,275(0.09%)#82 | 480,873(0.02%)#569 |
| 83. | Parsippany | 85 | 95,275(0.09%)#83 | 480,873(0.02%)#575 |
| 84. | Rutgers University-Busch Campus | 84 | 95,275(0.09%)#84 | 480,873(0.02%)#584 |
| 85. | New Milford Borough | 83 | 95,275(0.09%)#85 | 480,873(0.02%)#586 |
| 86. | Roselle Park Borough | 83 | 95,275(0.09%)#86 | 480,873(0.02%)#587 |
| 87. | Atlantic City | 77 | 95,275(0.08%)#87 | 480,873(0.02%)#613 |
| 88. | Brookdale | 77 | 95,275(0.08%)#88 | 480,873(0.02%)#616 |
| 89. | Bloomingdale Borough | 77 | 95,275(0.08%)#89 | 480,873(0.02%)#617 |
| 90. | Point Pleasant Borough | 74 | 95,275(0.08%)#90 | 480,873(0.02%)#639 |
| 91. | Wallington Borough | 72 | 95,275(0.08%)#91 | 480,873(0.01%)#653 |
| 92. | Prospect Park Borough | 72 | 95,275(0.08%)#92 | 480,873(0.01%)#654 |
| 93. | Netcong Borough | 72 | 95,275(0.08%)#93 | 480,873(0.01%)#655 |
| 94. | Newton | 69 | 95,275(0.07%)#94 | 480,873(0.01%)#678 |
| 95. | Lawnside Borough | 69 | 95,275(0.07%)#95 | 480,873(0.01%)#680 |
| 96. | Carteret Borough | 67 | 95,275(0.07%)#96 | 480,873(0.01%)#699 |
| 97. | Hackettstown | 65 | 95,275(0.07%)#97 | 480,873(0.01%)#720 |
| 98. | Phillipsburg | 62 | 95,275(0.07%)#98 | 480,873(0.01%)#741 |
| 99. | Keansburg Borough | 62 | 95,275(0.07%)#99 | 480,873(0.01%)#742 |
| 100. | Fair Lawn Borough | 61 | 95,275(0.06%)#100 | 480,873(0.01%)#746 |
Common Questions
What are the Top 10 Cities with the Most Immigrants from Ecuador in New Jersey?
Top 10 Cities with the Most Immigrants from Ecuador in New Jersey are:
#1
18,452
#2
6,572
#3
4,491
#4
3,613
#5
2,922
#6
2,527
#7
2,500
#8
1,775
#9
1,657
#10
955
What city has the Most Immigrants from Ecuador in New Jersey?
Newark has the Most Immigrants from Ecuador in New Jersey with 18,452.
What is the Total Immigrants from Ecuador in the State of New Jersey?
Total Immigrants from Ecuador in New Jersey is 95,275.
What is the Total Immigrants from Ecuador in the United States?
Total Immigrants from Ecuador in the United States is 480,873.