Patchogue, NY Map & Demographics
Patchogue Map
Patchogue Overview
$60,363
PER CAPITA INCOME
$114,902
AVG FAMILY INCOME
$99,271
AVG HOUSEHOLD INCOME
28.8%
WAGE / INCOME GAP [ % ]
71.2¢/ $1
WAGE / INCOME GAP [ $ ]
0.49
INEQUALITY / GINI INDEX
12,343
TOTAL POPULATION
5,911
MALE POPULATION
6,432
FEMALE POPULATION
91.90
MALES / 100 FEMALES
108.81
FEMALES / 100 MALES
37.6
MEDIAN AGE
3.1
AVG FAMILY SIZE
2.3
AVG HOUSEHOLD SIZE
8,144
LABOR FORCE [ PEOPLE ]
77.9%
PERCENT IN LABOR FORCE
5.0%
UNEMPLOYMENT RATE
Patchogue Zip Codes
Patchogue Area Codes
Income in Patchogue
Income Overview in Patchogue
Per Capita Income in Patchogue is $60,363, while median incomes of families and households are $114,902 and $99,271 respectively.
| Characteristic | Number | Measure |
| Per Capita Income | 12,343 | $60,363 |
| Median Family Income | 2,886 | $114,902 |
| Mean Family Income | 2,886 | $169,434 |
| Median Household Income | 5,269 | $99,271 |
| Mean Household Income | 5,269 | $138,715 |
| Income Deficit | 2,886 | $0 |
| Wage / Income Gap (%) | 12,343 | 28.80% |
| Wage / Income Gap ($) | 12,343 | 71.20¢ per $1 |
| Gini / Inequality Index | 12,343 | 0.49 |
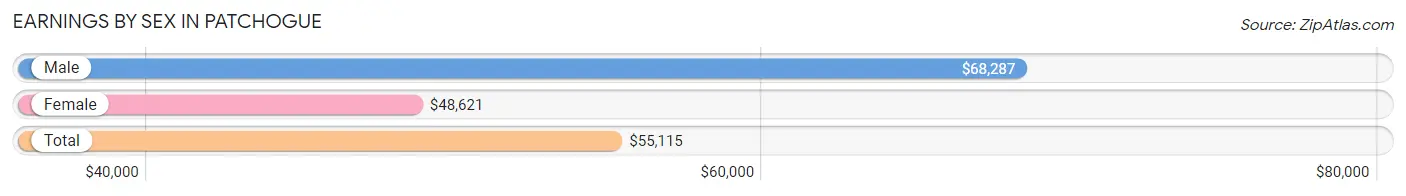
Earnings by Sex in Patchogue
Average Earnings in Patchogue are $55,115, $68,287 for men and $48,621 for women, a difference of 28.8%.
| Sex | Number | Average Earnings |
| Male | 4,185 (52.0%) | $68,287 |
| Female | 3,862 (48.0%) | $48,621 |
| Total | 8,047 (100.0%) | $55,115 |
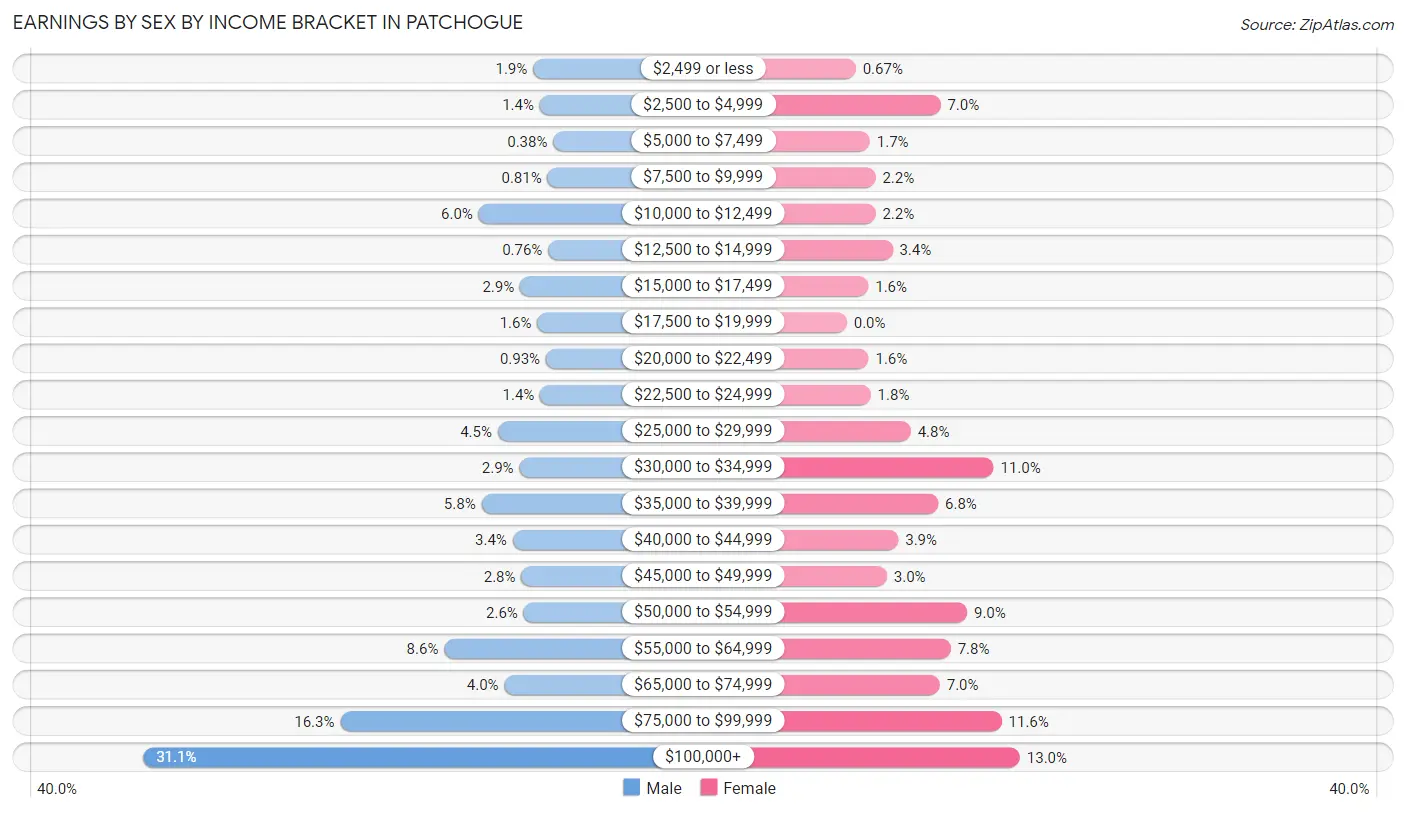
Earnings by Sex by Income Bracket in Patchogue
The most common earnings brackets in Patchogue are $100,000+ for men (1,302 | 31.1%) and $100,000+ for women (501 | 13.0%).
| Income | Male | Female |
| $2,499 or less | 79 (1.9%) | 26 (0.7%) |
| $2,500 to $4,999 | 58 (1.4%) | 271 (7.0%) |
| $5,000 to $7,499 | 16 (0.4%) | 67 (1.7%) |
| $7,500 to $9,999 | 34 (0.8%) | 83 (2.1%) |
| $10,000 to $12,499 | 250 (6.0%) | 83 (2.1%) |
| $12,500 to $14,999 | 32 (0.8%) | 132 (3.4%) |
| $15,000 to $17,499 | 120 (2.9%) | 62 (1.6%) |
| $17,500 to $19,999 | 66 (1.6%) | 0 (0.0%) |
| $20,000 to $22,499 | 39 (0.9%) | 63 (1.6%) |
| $22,500 to $24,999 | 57 (1.4%) | 69 (1.8%) |
| $25,000 to $29,999 | 190 (4.5%) | 185 (4.8%) |
| $30,000 to $34,999 | 122 (2.9%) | 425 (11.0%) |
| $35,000 to $39,999 | 241 (5.8%) | 264 (6.8%) |
| $40,000 to $44,999 | 143 (3.4%) | 149 (3.9%) |
| $45,000 to $49,999 | 116 (2.8%) | 116 (3.0%) |
| $50,000 to $54,999 | 109 (2.6%) | 348 (9.0%) |
| $55,000 to $64,999 | 358 (8.6%) | 301 (7.8%) |
| $65,000 to $74,999 | 169 (4.0%) | 269 (7.0%) |
| $75,000 to $99,999 | 684 (16.3%) | 448 (11.6%) |
| $100,000+ | 1,302 (31.1%) | 501 (13.0%) |
| Total | 4,185 (100.0%) | 3,862 (100.0%) |
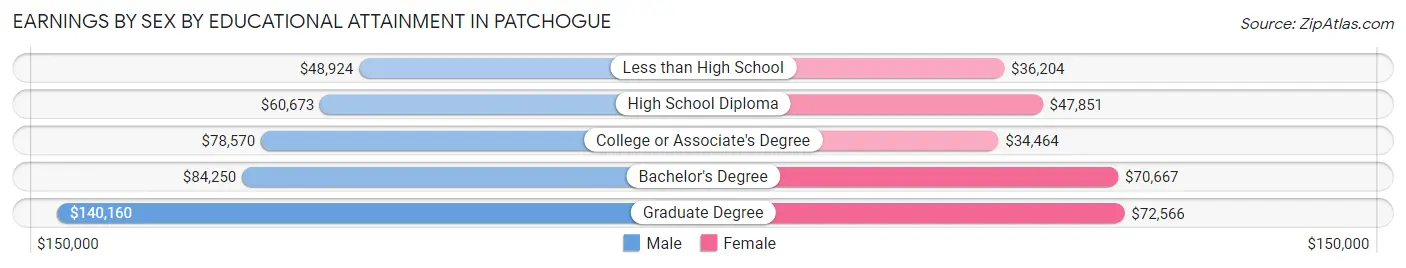
Earnings by Sex by Educational Attainment in Patchogue
Average earnings in Patchogue are $77,745 for men and $51,215 for women, a difference of 34.1%. Men with an educational attainment of graduate degree enjoy the highest average annual earnings of $140,160, while those with less than high school education earn the least with $48,924. Women with an educational attainment of graduate degree earn the most with the average annual earnings of $72,566, while those with college or associate's degree education have the smallest earnings of $34,464.
| Educational Attainment | Male Income | Female Income |
| Less than High School | $48,924 | $36,204 |
| High School Diploma | $60,673 | $47,851 |
| College or Associate's Degree | $78,570 | $34,464 |
| Bachelor's Degree | $84,250 | $70,667 |
| Graduate Degree | $140,160 | $72,566 |
| Total | $77,745 | $51,215 |
Family Income in Patchogue
Family Income Brackets in Patchogue
According to the Patchogue family income data, there are 788 families falling into the $100,000 to $149,999 income range, which is the most common income bracket and makes up 27.3% of all families. Conversely, the $25,000 to $34,999 income bracket is the least frequent group with only 17 families (0.6%) belonging to this category.
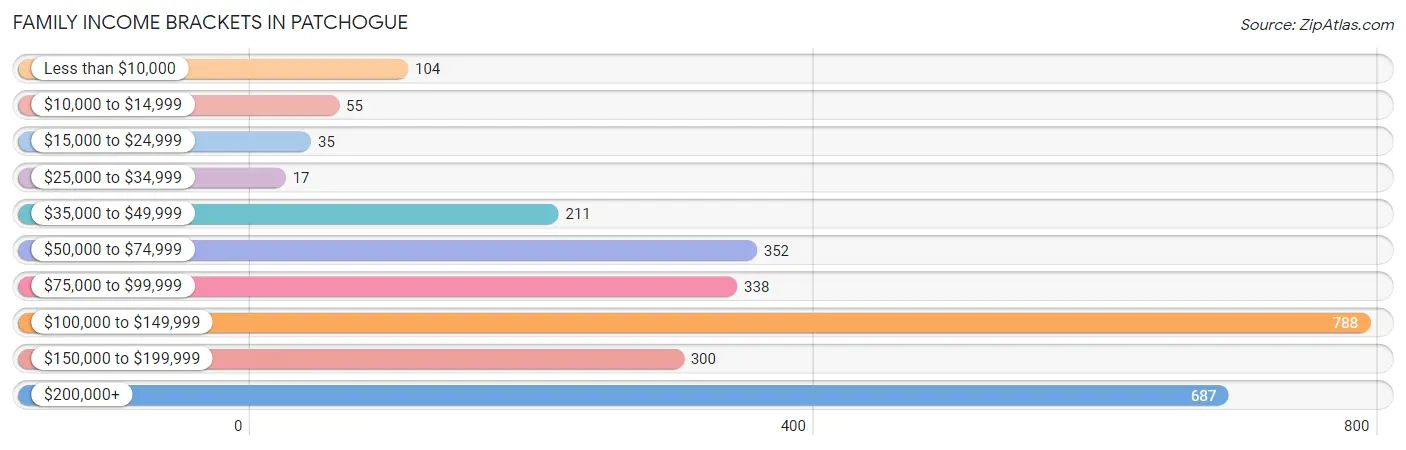
| Income Bracket | # Families | % Families |
| Less than $10,000 | 104 | 3.6% |
| $10,000 to $14,999 | 55 | 1.9% |
| $15,000 to $24,999 | 35 | 1.2% |
| $25,000 to $34,999 | 17 | 0.6% |
| $35,000 to $49,999 | 211 | 7.3% |
| $50,000 to $74,999 | 352 | 12.2% |
| $75,000 to $99,999 | 338 | 11.7% |
| $100,000 to $149,999 | 788 | 27.3% |
| $150,000 to $199,999 | 300 | 10.4% |
| $200,000+ | 687 | 23.8% |
Family Income by Famaliy Size in Patchogue
4-person families (498 | 17.3%) account for the highest median family income in Patchogue with $185,833 per family, while 2-person families (1,470 | 50.9%) have the highest median income of $56,663 per family member.
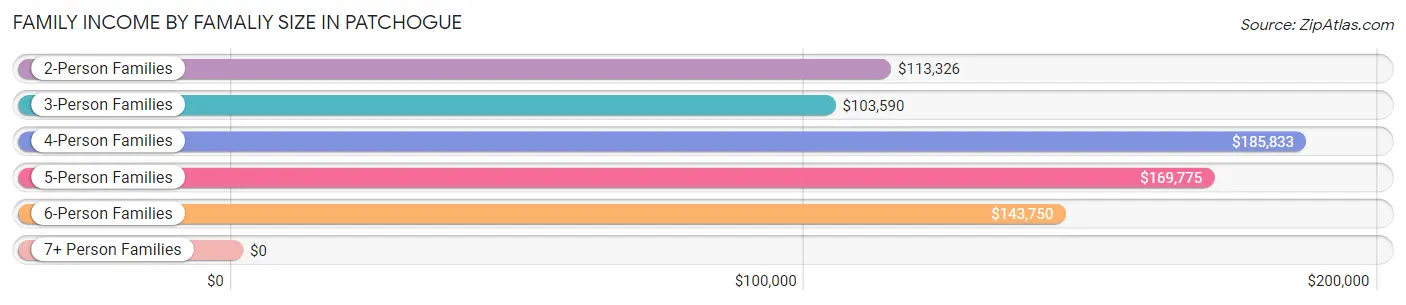
| Income Bracket | # Families | Median Income |
| 2-Person Families | 1,470 (50.9%) | $113,326 |
| 3-Person Families | 594 (20.6%) | $103,590 |
| 4-Person Families | 498 (17.3%) | $185,833 |
| 5-Person Families | 257 (8.9%) | $169,775 |
| 6-Person Families | 40 (1.4%) | $143,750 |
| 7+ Person Families | 27 (0.9%) | $0 |
| Total | 2,886 (100.0%) | $114,902 |
Family Income by Number of Earners in Patchogue
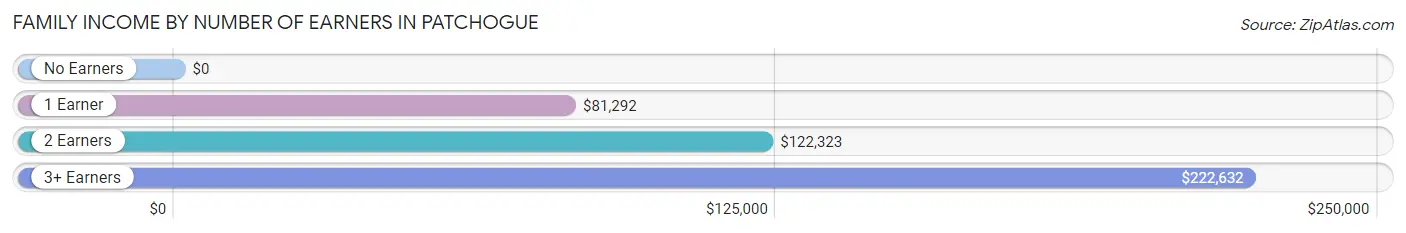
| Number of Earners | # Families | Median Income |
| No Earners | 153 (5.3%) | $0 |
| 1 Earner | 670 (23.2%) | $81,292 |
| 2 Earners | 1,663 (57.6%) | $122,323 |
| 3+ Earners | 400 (13.9%) | $222,632 |
| Total | 2,886 (100.0%) | $114,902 |
Household Income in Patchogue
Household Income Brackets in Patchogue
With 1,106 households falling in the category, the $100,000 to $149,999 income range is the most frequent in Patchogue, accounting for 21.0% of all households. In contrast, only 200 households (3.8%) fall into the $25,000 to $34,999 income bracket, making it the least populous group.
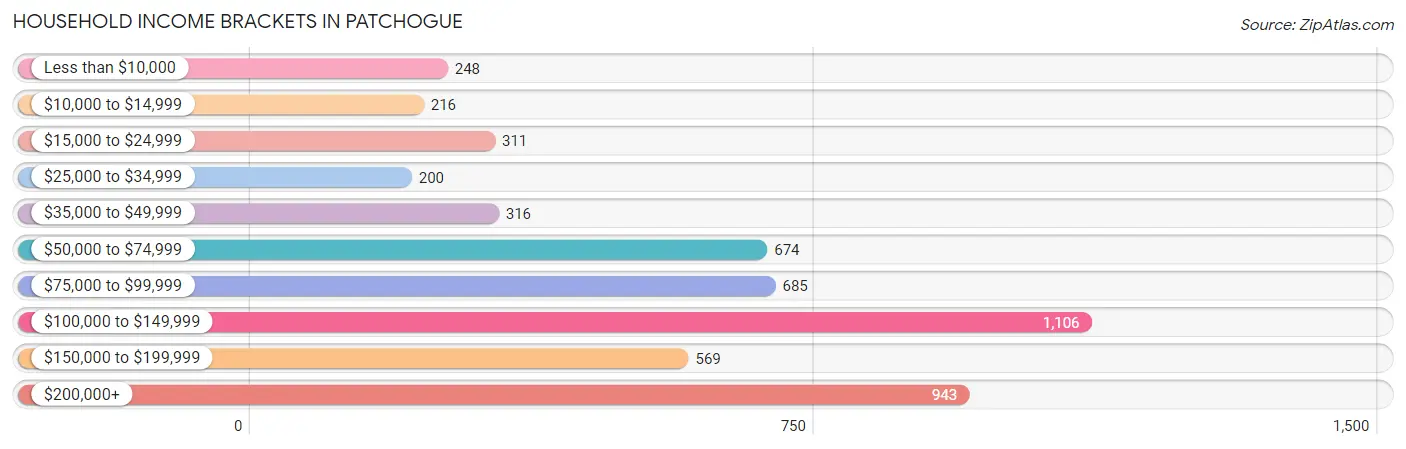
| Income Bracket | # Households | % Households |
| Less than $10,000 | 248 | 4.7% |
| $10,000 to $14,999 | 216 | 4.1% |
| $15,000 to $24,999 | 311 | 5.9% |
| $25,000 to $34,999 | 200 | 3.8% |
| $35,000 to $49,999 | 316 | 6.0% |
| $50,000 to $74,999 | 674 | 12.8% |
| $75,000 to $99,999 | 685 | 13.0% |
| $100,000 to $149,999 | 1,106 | 21.0% |
| $150,000 to $199,999 | 569 | 10.8% |
| $200,000+ | 943 | 17.9% |
Household Income by Householder Age in Patchogue
The median household income in Patchogue is $99,271, with the highest median household income of $113,410 found in the 25 to 44 years age bracket for the primary householder. A total of 2,331 households (44.2%) fall into this category. Meanwhile, the 15 to 24 years age bracket for the primary householder has the lowest median household income of $0, with 62 households (1.2%) in this group.
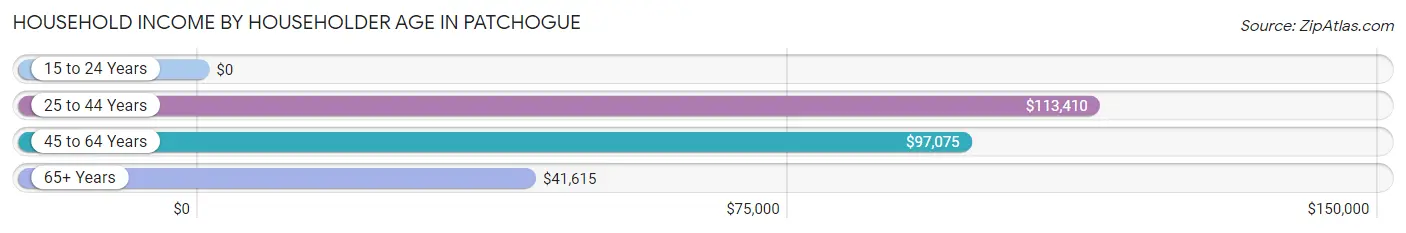
| Income Bracket | # Households | Median Income |
| 15 to 24 Years | 62 (1.2%) | $0 |
| 25 to 44 Years | 2,331 (44.2%) | $113,410 |
| 45 to 64 Years | 1,872 (35.5%) | $97,075 |
| 65+ Years | 1,004 (19.1%) | $41,615 |
| Total | 5,269 (100.0%) | $99,271 |
Poverty in Patchogue
Income Below Poverty by Sex and Age in Patchogue
With 6.4% poverty level for males and 9.1% for females among the residents of Patchogue, 55 to 64 year old males and 75 year old and over females are the most vulnerable to poverty, with 131 males (16.9%) and 86 females (25.8%) in their respective age groups living below the poverty level.
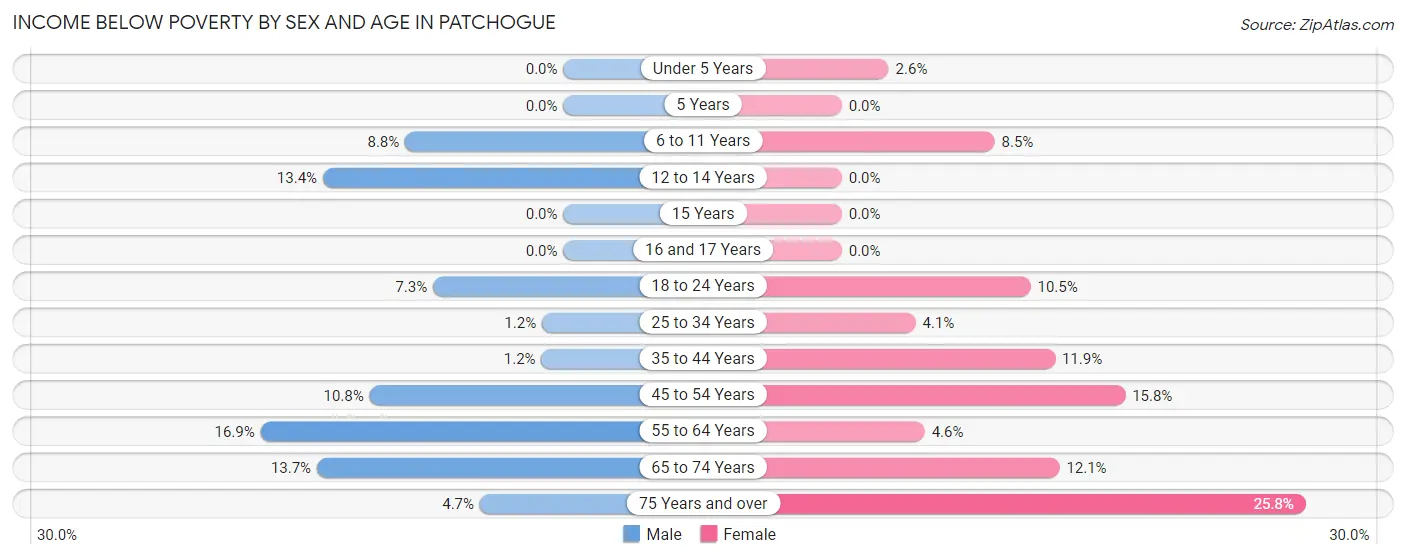
| Age Bracket | Male | Female |
| Under 5 Years | 0 (0.0%) | 11 (2.6%) |
| 5 Years | 0 (0.0%) | 0 (0.0%) |
| 6 to 11 Years | 28 (8.8%) | 37 (8.5%) |
| 12 to 14 Years | 15 (13.4%) | 0 (0.0%) |
| 15 Years | 0 (0.0%) | 0 (0.0%) |
| 16 and 17 Years | 0 (0.0%) | 0 (0.0%) |
| 18 to 24 Years | 23 (7.3%) | 54 (10.5%) |
| 25 to 34 Years | 16 (1.2%) | 53 (4.1%) |
| 35 to 44 Years | 15 (1.2%) | 125 (11.9%) |
| 45 to 54 Years | 92 (10.8%) | 130 (15.8%) |
| 55 to 64 Years | 131 (16.9%) | 39 (4.6%) |
| 65 to 74 Years | 52 (13.7%) | 48 (12.1%) |
| 75 Years and over | 8 (4.6%) | 86 (25.8%) |
| Total | 380 (6.4%) | 583 (9.1%) |
Income Above Poverty by Sex and Age in Patchogue
According to the poverty statistics in Patchogue, males aged under 5 years and females aged 5 years are the age groups that are most secure financially, with 100.0% of males and 100.0% of females in these age groups living above the poverty line.
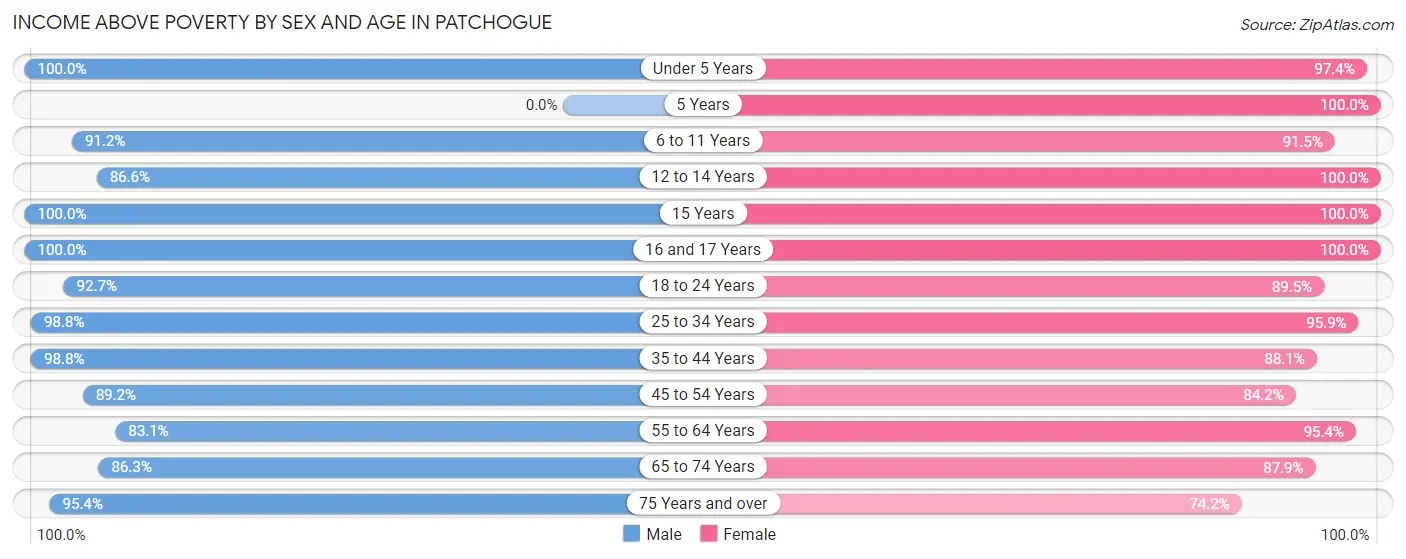
| Age Bracket | Male | Female |
| Under 5 Years | 299 (100.0%) | 410 (97.4%) |
| 5 Years | 0 (0.0%) | 138 (100.0%) |
| 6 to 11 Years | 290 (91.2%) | 398 (91.5%) |
| 12 to 14 Years | 97 (86.6%) | 40 (100.0%) |
| 15 Years | 53 (100.0%) | 73 (100.0%) |
| 16 and 17 Years | 61 (100.0%) | 55 (100.0%) |
| 18 to 24 Years | 294 (92.7%) | 460 (89.5%) |
| 25 to 34 Years | 1,329 (98.8%) | 1,238 (95.9%) |
| 35 to 44 Years | 1,210 (98.8%) | 928 (88.1%) |
| 45 to 54 Years | 761 (89.2%) | 694 (84.2%) |
| 55 to 64 Years | 646 (83.1%) | 805 (95.4%) |
| 65 to 74 Years | 327 (86.3%) | 348 (87.9%) |
| 75 Years and over | 164 (95.4%) | 247 (74.2%) |
| Total | 5,531 (93.6%) | 5,834 (90.9%) |
Income Below Poverty Among Married-Couple Families in Patchogue
The poverty statistics for married-couple families in Patchogue show that 2.3% or 44 of the total 1,929 families live below the poverty line. Families with no children have the highest poverty rate of 3.4%, comprising of 44 families. On the other hand, families with 1 or 2 children have the lowest poverty rate of 0.0%, which includes 0 families.
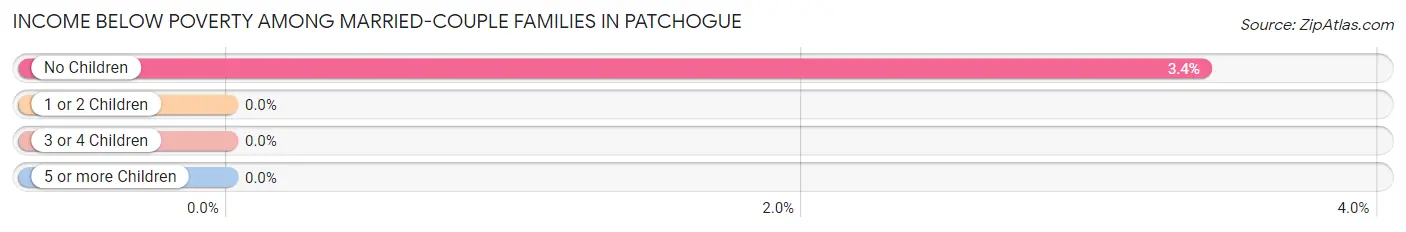
| Children | Above Poverty | Below Poverty |
| No Children | 1,254 (96.6%) | 44 (3.4%) |
| 1 or 2 Children | 561 (100.0%) | 0 (0.0%) |
| 3 or 4 Children | 70 (100.0%) | 0 (0.0%) |
| 5 or more Children | 0 (0.0%) | 0 (0.0%) |
| Total | 1,885 (97.7%) | 44 (2.3%) |
Income Below Poverty Among Single-Parent Households in Patchogue
According to the poverty data in Patchogue, 6.1% or 16 single-father households and 14.1% or 98 single-mother households are living below the poverty line. Among single-father households, those with 1 or 2 children have the highest poverty rate, with 16 households (14.9%) experiencing poverty. Likewise, among single-mother households, those with 3 or 4 children have the highest poverty rate, with 9 households (23.7%) falling below the poverty line.
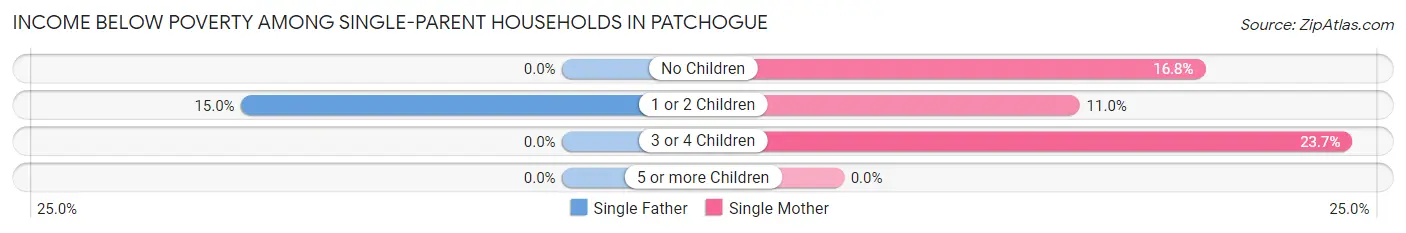
| Children | Single Father | Single Mother |
| No Children | 0 (0.0%) | 48 (16.8%) |
| 1 or 2 Children | 16 (14.9%) | 41 (11.0%) |
| 3 or 4 Children | 0 (0.0%) | 9 (23.7%) |
| 5 or more Children | 0 (0.0%) | 0 (0.0%) |
| Total | 16 (6.1%) | 98 (14.1%) |
Income Below Poverty Among Married-Couple vs Single-Parent Households in Patchogue
The poverty data for Patchogue shows that 44 of the married-couple family households (2.3%) and 114 of the single-parent households (11.9%) are living below the poverty level. Within the married-couple family households, those with no children have the highest poverty rate, with 44 households (3.4%) falling below the poverty line. Among the single-parent households, those with 3 or 4 children have the highest poverty rate, with 9 household (23.7%) living below poverty.
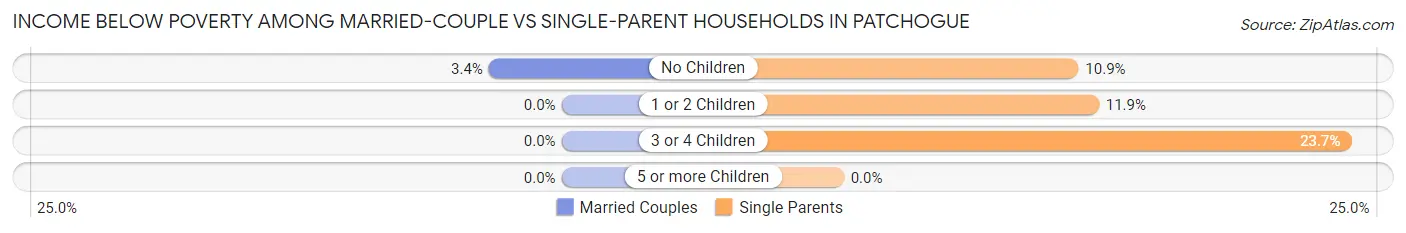
| Children | Married-Couple Families | Single-Parent Households |
| No Children | 44 (3.4%) | 48 (10.9%) |
| 1 or 2 Children | 0 (0.0%) | 57 (11.9%) |
| 3 or 4 Children | 0 (0.0%) | 9 (23.7%) |
| 5 or more Children | 0 (0.0%) | 0 (0.0%) |
| Total | 44 (2.3%) | 114 (11.9%) |
Race in Patchogue
The most populous races in Patchogue are White / Caucasian (9,014 | 73.0%), Hispanic or Latino (2,688 | 21.8%), and Two or more Races (1,193 | 9.7%).
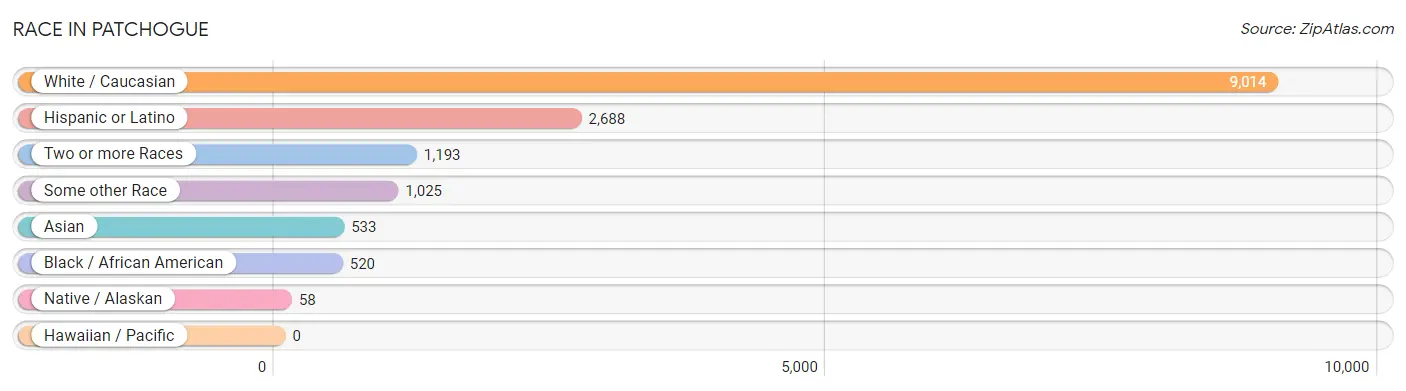
| Race | # Population | % Population |
| Asian | 533 | 4.3% |
| Black / African American | 520 | 4.2% |
| Hawaiian / Pacific | 0 | 0.0% |
| Hispanic or Latino | 2,688 | 21.8% |
| Native / Alaskan | 58 | 0.5% |
| White / Caucasian | 9,014 | 73.0% |
| Two or more Races | 1,193 | 9.7% |
| Some other Race | 1,025 | 8.3% |
| Total | 12,343 | 100.0% |
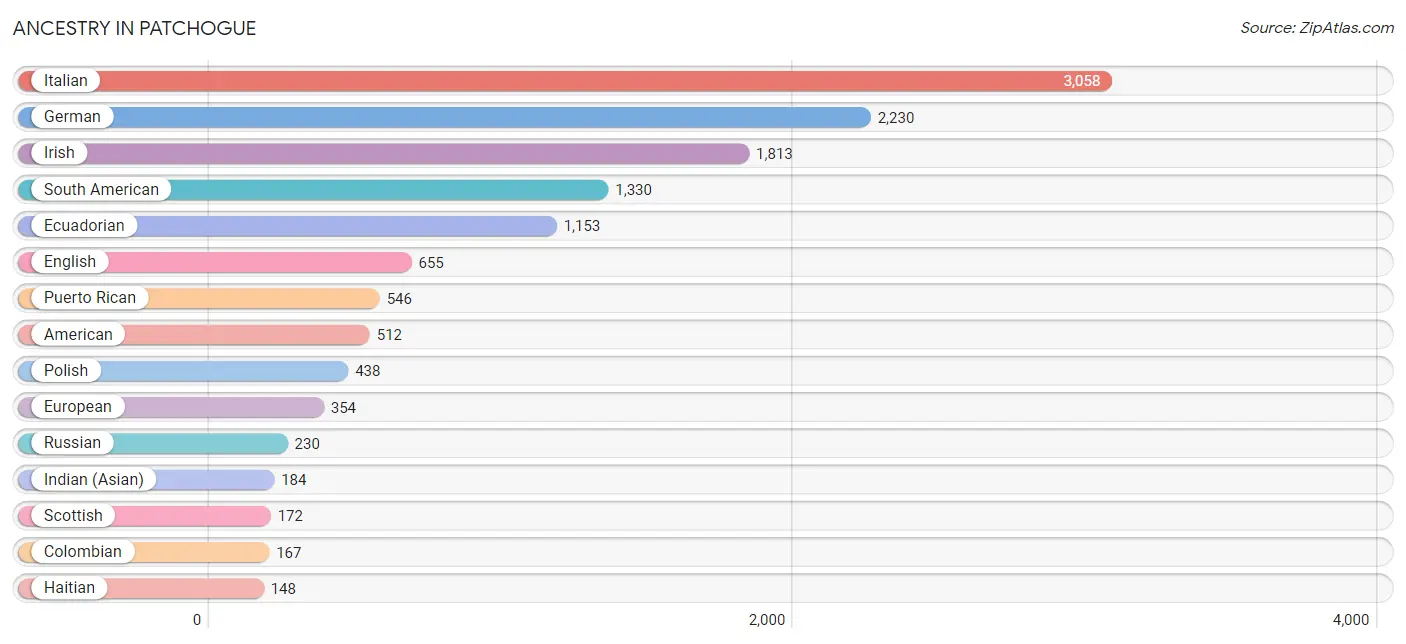
Ancestry in Patchogue
The most populous ancestries reported in Patchogue are Italian (3,058 | 24.8%), German (2,230 | 18.1%), Irish (1,813 | 14.7%), South American (1,330 | 10.8%), and Ecuadorian (1,153 | 9.3%), together accounting for 77.7% of all Patchogue residents.
| Ancestry | # Population | % Population |
| American | 512 | 4.2% |
| Apache | 16 | 0.1% |
| Arab | 30 | 0.2% |
| Australian | 12 | 0.1% |
| Austrian | 12 | 0.1% |
| Belgian | 9 | 0.1% |
| British | 26 | 0.2% |
| Burmese | 133 | 1.1% |
| Canadian | 25 | 0.2% |
| Central American | 126 | 1.0% |
| Cherokee | 16 | 0.1% |
| Colombian | 167 | 1.3% |
| Croatian | 22 | 0.2% |
| Cuban | 12 | 0.1% |
| Danish | 72 | 0.6% |
| Dominican | 121 | 1.0% |
| Dutch | 48 | 0.4% |
| Eastern European | 86 | 0.7% |
| Ecuadorian | 1,153 | 9.3% |
| Egyptian | 30 | 0.2% |
| English | 655 | 5.3% |
| European | 354 | 2.9% |
| French | 81 | 0.7% |
| German | 2,230 | 18.1% |
| Ghanaian | 51 | 0.4% |
| Greek | 74 | 0.6% |
| Haitian | 148 | 1.2% |
| Hungarian | 51 | 0.4% |
| Indian (Asian) | 184 | 1.5% |
| Inupiat | 25 | 0.2% |
| Iranian | 22 | 0.2% |
| Irish | 1,813 | 14.7% |
| Iroquois | 16 | 0.1% |
| Italian | 3,058 | 24.8% |
| Korean | 55 | 0.4% |
| Lithuanian | 18 | 0.2% |
| Mexican | 8 | 0.1% |
| Norwegian | 73 | 0.6% |
| Paraguayan | 10 | 0.1% |
| Polish | 438 | 3.5% |
| Portuguese | 28 | 0.2% |
| Puerto Rican | 546 | 4.4% |
| Russian | 230 | 1.9% |
| Salvadoran | 126 | 1.0% |
| Scandinavian | 47 | 0.4% |
| Scotch-Irish | 32 | 0.3% |
| Scottish | 172 | 1.4% |
| South American | 1,330 | 10.8% |
| Spaniard | 16 | 0.1% |
| Subsaharan African | 51 | 0.4% |
| Swedish | 86 | 0.7% |
| Swiss | 6 | 0.1% |
| Thai | 61 | 0.5% |
| Trinidadian and Tobagonian | 113 | 0.9% |
| Turkish | 26 | 0.2% |
| Ukrainian | 22 | 0.2% |
| Welsh | 26 | 0.2% |
| West Indian | 98 | 0.8% | View All 58 Rows |
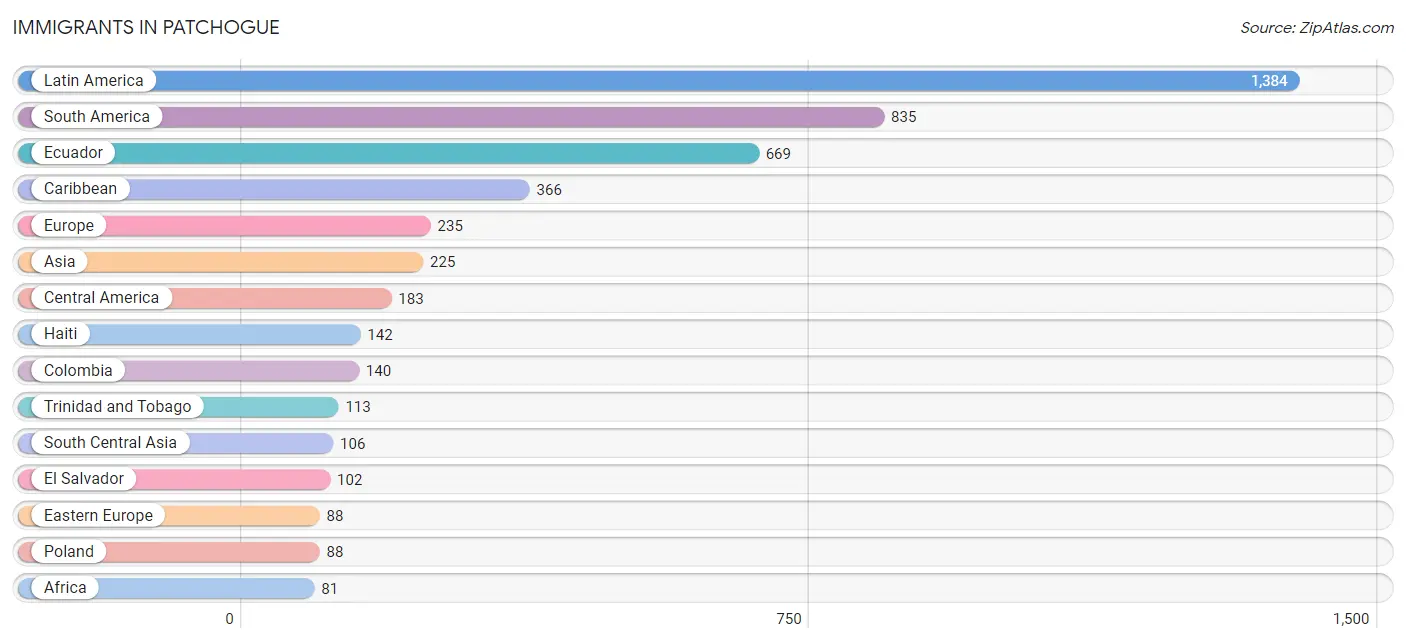
Immigrants in Patchogue
The most numerous immigrant groups reported in Patchogue came from Latin America (1,384 | 11.2%), South America (835 | 6.8%), Ecuador (669 | 5.4%), Caribbean (366 | 3.0%), and Europe (235 | 1.9%), together accounting for 28.3% of all Patchogue residents.
| Immigration Origin | # Population | % Population |
| Africa | 81 | 0.7% |
| Asia | 225 | 1.8% |
| Belgium | 9 | 0.1% |
| Caribbean | 366 | 3.0% |
| Central America | 183 | 1.5% |
| Colombia | 140 | 1.1% |
| Dominican Republic | 79 | 0.6% |
| Eastern Europe | 88 | 0.7% |
| Ecuador | 669 | 5.4% |
| Egypt | 30 | 0.2% |
| El Salvador | 102 | 0.8% |
| Europe | 235 | 1.9% |
| France | 28 | 0.2% |
| Germany | 35 | 0.3% |
| Ghana | 51 | 0.4% |
| Haiti | 142 | 1.1% |
| India | 41 | 0.3% |
| Latin America | 1,384 | 11.2% |
| Mexico | 81 | 0.7% |
| Northern Africa | 30 | 0.2% |
| Northern Europe | 15 | 0.1% |
| Pakistan | 65 | 0.5% |
| Peru | 16 | 0.1% |
| Philippines | 55 | 0.4% |
| Poland | 88 | 0.7% |
| South America | 835 | 6.8% |
| South Central Asia | 106 | 0.9% |
| South Eastern Asia | 55 | 0.4% |
| Southern Europe | 60 | 0.5% |
| Spain | 34 | 0.3% |
| Trinidad and Tobago | 113 | 0.9% |
| Turkey | 51 | 0.4% |
| Western Africa | 51 | 0.4% |
| Western Asia | 64 | 0.5% |
| Western Europe | 72 | 0.6% | View All 35 Rows |
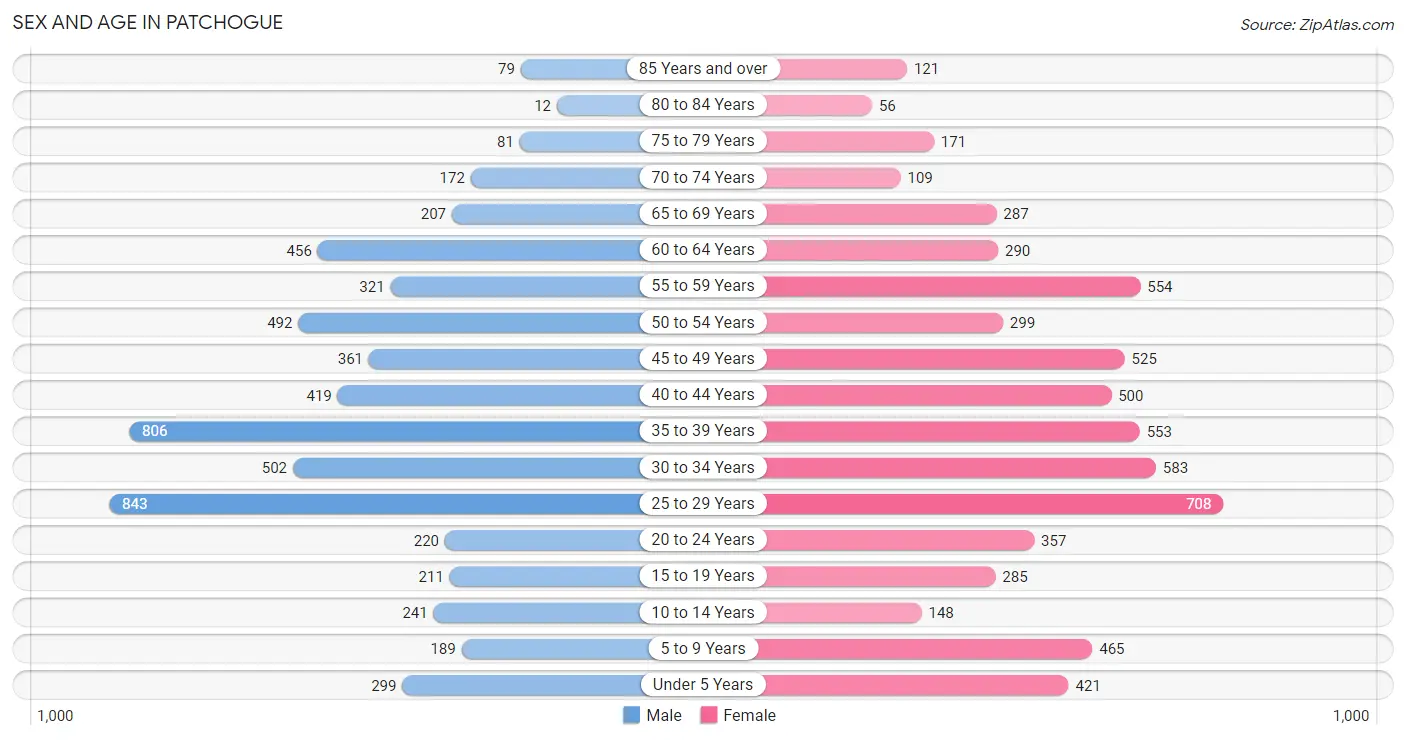
Sex and Age in Patchogue
Sex and Age in Patchogue
The most populous age groups in Patchogue are 25 to 29 Years (843 | 14.3%) for men and 25 to 29 Years (708 | 11.0%) for women.
| Age Bracket | Male | Female |
| Under 5 Years | 299 (5.1%) | 421 (6.6%) |
| 5 to 9 Years | 189 (3.2%) | 465 (7.2%) |
| 10 to 14 Years | 241 (4.1%) | 148 (2.3%) |
| 15 to 19 Years | 211 (3.6%) | 285 (4.4%) |
| 20 to 24 Years | 220 (3.7%) | 357 (5.6%) |
| 25 to 29 Years | 843 (14.3%) | 708 (11.0%) |
| 30 to 34 Years | 502 (8.5%) | 583 (9.1%) |
| 35 to 39 Years | 806 (13.6%) | 553 (8.6%) |
| 40 to 44 Years | 419 (7.1%) | 500 (7.8%) |
| 45 to 49 Years | 361 (6.1%) | 525 (8.2%) |
| 50 to 54 Years | 492 (8.3%) | 299 (4.6%) |
| 55 to 59 Years | 321 (5.4%) | 554 (8.6%) |
| 60 to 64 Years | 456 (7.7%) | 290 (4.5%) |
| 65 to 69 Years | 207 (3.5%) | 287 (4.5%) |
| 70 to 74 Years | 172 (2.9%) | 109 (1.7%) |
| 75 to 79 Years | 81 (1.4%) | 171 (2.7%) |
| 80 to 84 Years | 12 (0.2%) | 56 (0.9%) |
| 85 Years and over | 79 (1.3%) | 121 (1.9%) |
| Total | 5,911 (100.0%) | 6,432 (100.0%) |
Families and Households in Patchogue
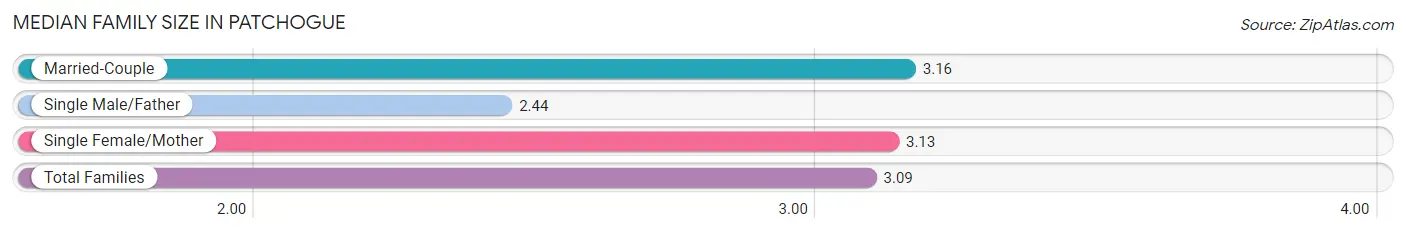
Median Family Size in Patchogue
The median family size in Patchogue is 3.09 persons per family, with married-couple families (1,929 | 66.8%) accounting for the largest median family size of 3.16 persons per family. On the other hand, single male/father families (261 | 9.0%) represent the smallest median family size with 2.44 persons per family.
| Family Type | # Families | Family Size |
| Married-Couple | 1,929 (66.8%) | 3.16 |
| Single Male/Father | 261 (9.0%) | 2.44 |
| Single Female/Mother | 696 (24.1%) | 3.13 |
| Total Families | 2,886 (100.0%) | 3.09 |
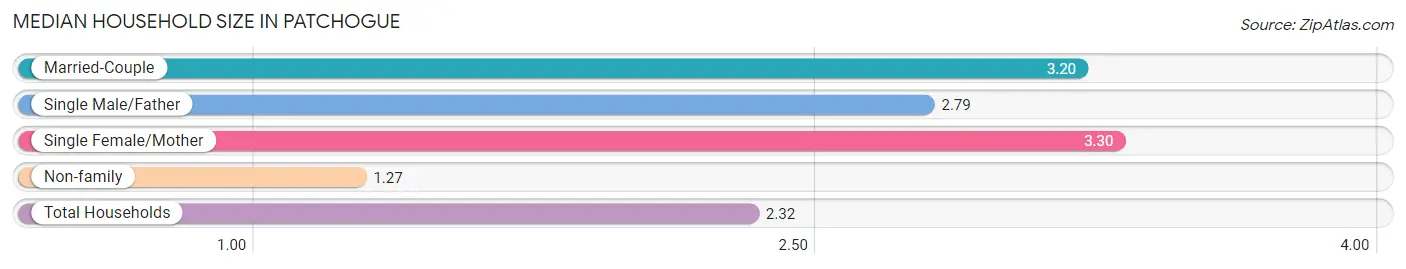
Median Household Size in Patchogue
The median household size in Patchogue is 2.32 persons per household, with single female/mother households (696 | 13.2%) accounting for the largest median household size of 3.3 persons per household. non-family households (2,383 | 45.2%) represent the smallest median household size with 1.27 persons per household.
| Household Type | # Households | Household Size |
| Married-Couple | 1,929 (36.6%) | 3.20 |
| Single Male/Father | 261 (5.0%) | 2.79 |
| Single Female/Mother | 696 (13.2%) | 3.30 |
| Non-family | 2,383 (45.2%) | 1.27 |
| Total Households | 5,269 (100.0%) | 2.32 |
Household Size by Marriage Status in Patchogue
Out of a total of 5,269 households in Patchogue, 2,886 (54.8%) are family households, while 2,383 (45.2%) are nonfamily households. The most numerous type of family households are 2-person households, comprising 1,264, and the most common type of nonfamily households are 1-person households, comprising 1,732.
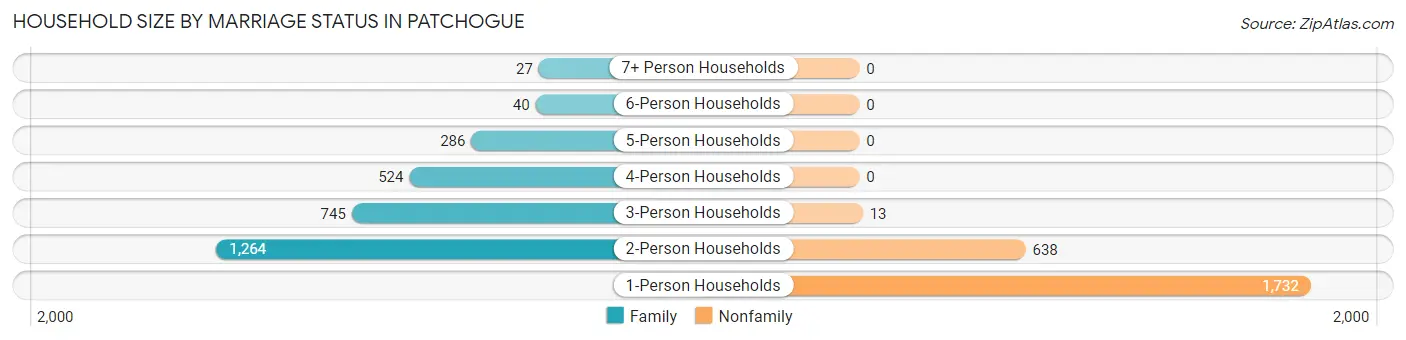
| Household Size | Family Households | Nonfamily Households |
| 1-Person Households | - | 1,732 (32.9%) |
| 2-Person Households | 1,264 (24.0%) | 638 (12.1%) |
| 3-Person Households | 745 (14.1%) | 13 (0.3%) |
| 4-Person Households | 524 (9.9%) | 0 (0.0%) |
| 5-Person Households | 286 (5.4%) | 0 (0.0%) |
| 6-Person Households | 40 (0.8%) | 0 (0.0%) |
| 7+ Person Households | 27 (0.5%) | 0 (0.0%) |
| Total | 2,886 (54.8%) | 2,383 (45.2%) |
Female Fertility in Patchogue
Fertility by Age in Patchogue
Average fertility rate in Patchogue is 31.0 births per 1,000 women. Women in the age bracket of 20 to 34 years have the highest fertility rate with 50.0 births per 1,000 women. Women in the age bracket of 20 to 34 years acount for 75.4% of all women with births.
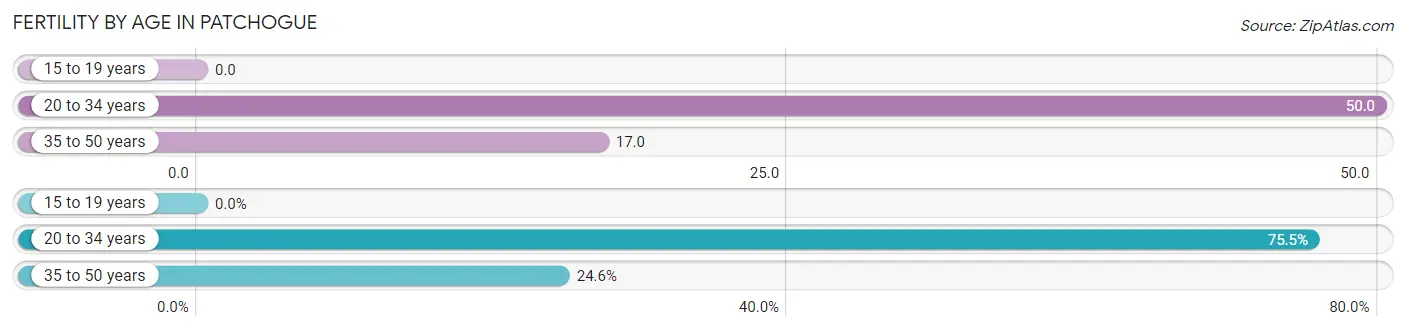
| Age Bracket | Women with Births | Births / 1,000 Women |
| 15 to 19 years | 0 (0.0%) | 0.0 |
| 20 to 34 years | 83 (75.4%) | 50.0 |
| 35 to 50 years | 27 (24.5%) | 17.0 |
| Total | 110 (100.0%) | 31.0 |
Fertility by Age by Marriage Status in Patchogue
49.1% of women with births (110) in Patchogue are married. The highest percentage of unmarried women with births falls into 20 to 34 years age bracket with 67.5% of them unmarried at the time of birth, while the lowest percentage of unmarried women with births belong to 35 to 50 years age bracket with 0.0% of them unmarried.
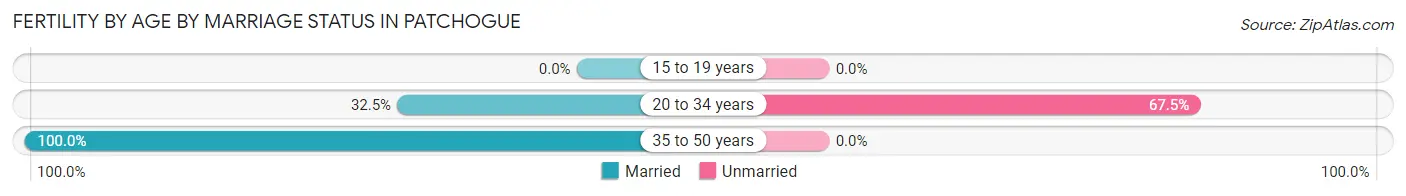
| Age Bracket | Married | Unmarried |
| 15 to 19 years | 0 (0.0%) | 0 (0.0%) |
| 20 to 34 years | 27 (32.5%) | 56 (67.5%) |
| 35 to 50 years | 27 (100.0%) | 0 (0.0%) |
| Total | 54 (49.1%) | 56 (50.9%) |
Fertility by Education in Patchogue
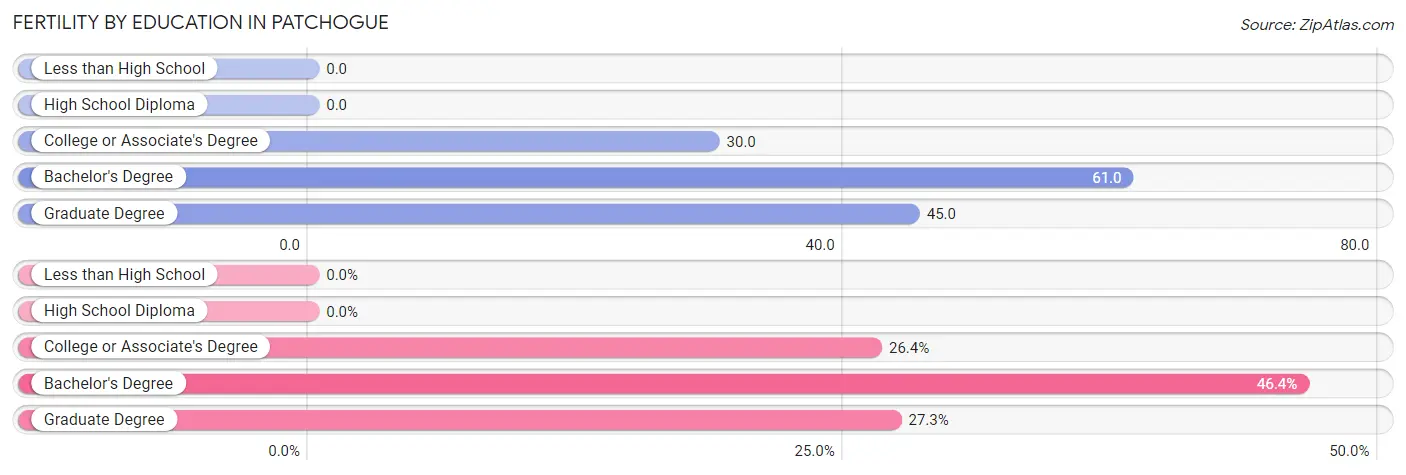
| Educational Attainment | Women with Births | Births / 1,000 Women |
| Less than High School | 0 (0.0%) | 0.0 |
| High School Diploma | 0 (0.0%) | 0.0 |
| College or Associate's Degree | 29 (26.4%) | 30.0 |
| Bachelor's Degree | 51 (46.4%) | 61.0 |
| Graduate Degree | 30 (27.3%) | 45.0 |
| Total | 110 (100.0%) | 31.0 |
Fertility by Education by Marriage Status in Patchogue
50.9% of women with births in Patchogue are unmarried. Women with the educational attainment of graduate degree are most likely to be married with 100.0% of them married at childbirth, while women with the educational attainment of college or associate's degree are least likely to be married with 100.0% of them unmarried at childbirth.
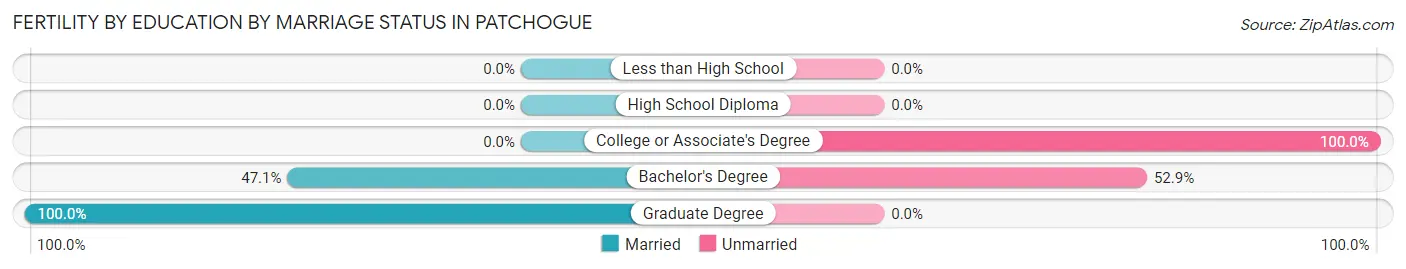
| Educational Attainment | Married | Unmarried |
| Less than High School | 0 (0.0%) | 0 (0.0%) |
| High School Diploma | 0 (0.0%) | 0 (0.0%) |
| College or Associate's Degree | 0 (0.0%) | 29 (100.0%) |
| Bachelor's Degree | 24 (47.1%) | 27 (52.9%) |
| Graduate Degree | 30 (100.0%) | 0 (0.0%) |
| Total | 54 (49.1%) | 56 (50.9%) |
Employment Characteristics in Patchogue
Employment by Class of Employer in Patchogue
Among the 7,597 employed individuals in Patchogue, private company employees (4,917 | 64.7%), local government employees (858 | 11.3%), and not-for-profit organizations (711 | 9.4%) make up the most common classes of employment.
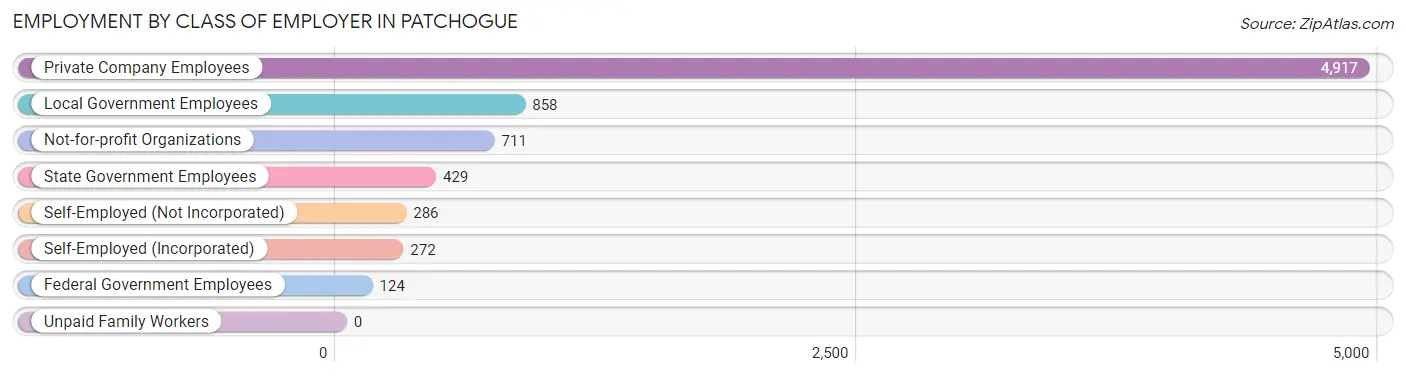
| Employer Class | # Employees | % Employees |
| Private Company Employees | 4,917 | 64.7% |
| Self-Employed (Incorporated) | 272 | 3.6% |
| Self-Employed (Not Incorporated) | 286 | 3.8% |
| Not-for-profit Organizations | 711 | 9.4% |
| Local Government Employees | 858 | 11.3% |
| State Government Employees | 429 | 5.7% |
| Federal Government Employees | 124 | 1.6% |
| Unpaid Family Workers | 0 | 0.0% |
| Total | 7,597 | 100.0% |
Employment Status by Age in Patchogue
According to the labor force statistics for Patchogue, out of the total population over 16 years of age (10,454), 77.9% or 8,144 individuals are in the labor force, with 5.0% or 407 of them unemployed. The age group with the highest labor force participation rate is 20 to 24 years, with 97.2% or 561 individuals in the labor force. Within the labor force, the 75 years and over age range has the highest percentage of unemployed individuals, with 41.4% or 46 of them being unemployed.
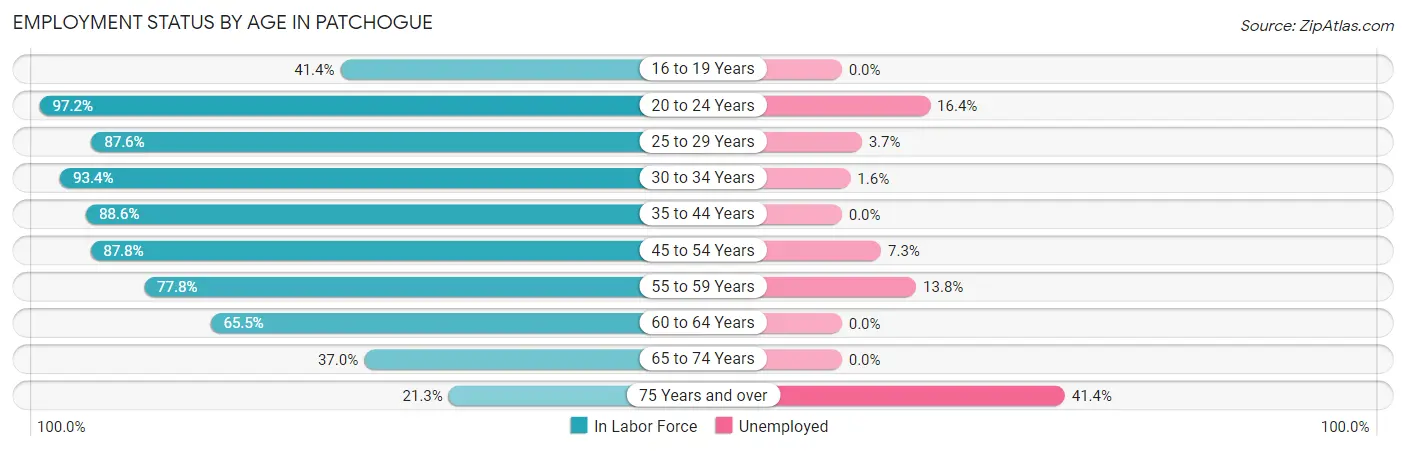
| Age Bracket | In Labor Force | Unemployed |
| 16 to 19 Years | 153 (41.4%) | 0 (0.0%) |
| 20 to 24 Years | 561 (97.2%) | 92 (16.4%) |
| 25 to 29 Years | 1,359 (87.6%) | 50 (3.7%) |
| 30 to 34 Years | 1,013 (93.4%) | 16 (1.6%) |
| 35 to 44 Years | 2,018 (88.6%) | 0 (0.0%) |
| 45 to 54 Years | 1,472 (87.8%) | 107 (7.3%) |
| 55 to 59 Years | 681 (77.8%) | 94 (13.8%) |
| 60 to 64 Years | 489 (65.5%) | 0 (0.0%) |
| 65 to 74 Years | 287 (37.0%) | 0 (0.0%) |
| 75 Years and over | 111 (21.3%) | 46 (41.4%) |
| Total | 8,144 (77.9%) | 407 (5.0%) |
Employment Status by Educational Attainment in Patchogue
According to labor force statistics for Patchogue, 85.6% of individuals (7,029) out of the total population between 25 and 64 years of age (8,212) are in the labor force, with 3.8% or 267 of them being unemployed. The group with the highest labor force participation rate are those with the educational attainment of bachelor's degree or higher, with 93.4% or 2,884 individuals in the labor force. Within the labor force, individuals with less than high school education have the highest percentage of unemployment, with 5.4% or 32 of them being unemployed.
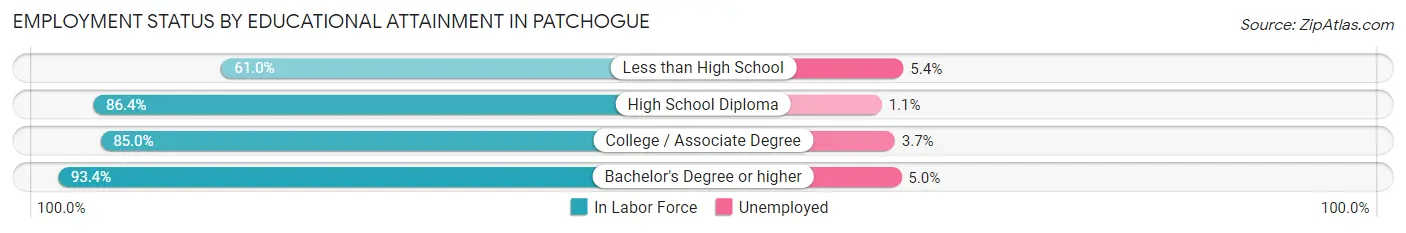
| Educational Attainment | In Labor Force | Unemployed |
| Less than High School | 588 (61.0%) | 52 (5.4%) |
| High School Diploma | 1,467 (86.4%) | 19 (1.1%) |
| College / Associate Degree | 2,093 (85.0%) | 91 (3.7%) |
| Bachelor's Degree or higher | 2,884 (93.4%) | 154 (5.0%) |
| Total | 7,029 (85.6%) | 312 (3.8%) |
Employment Occupations by Sex in Patchogue
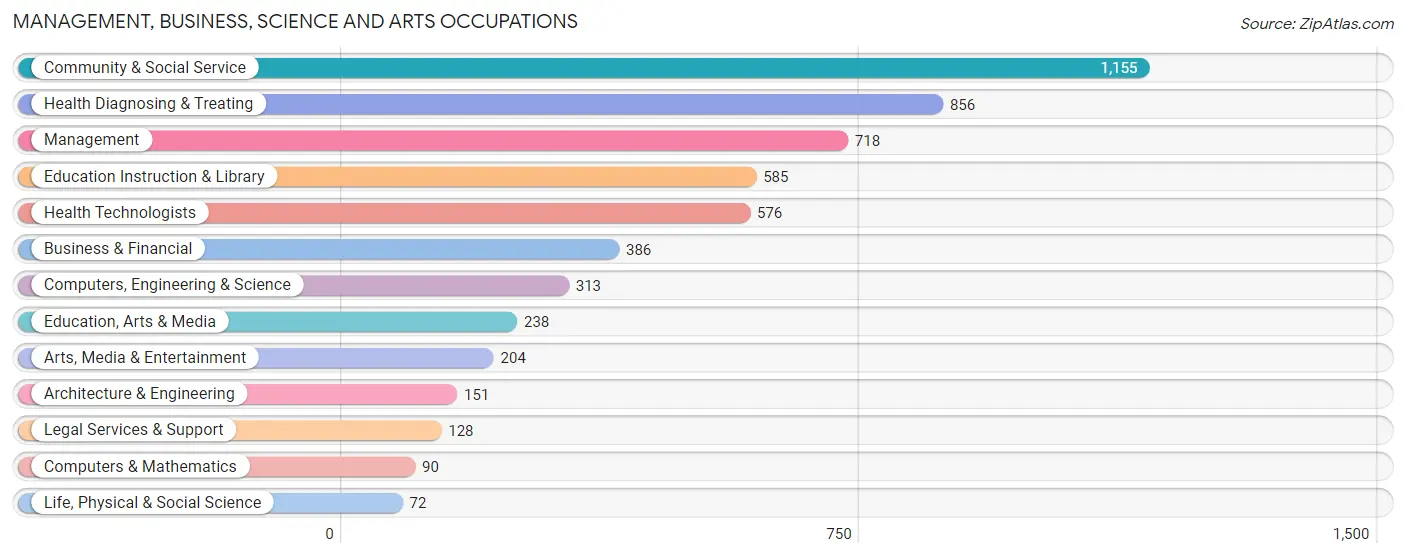
Management, Business, Science and Arts Occupations
The most common Management, Business, Science and Arts occupations in Patchogue are Community & Social Service (1,155 | 14.9%), Health Diagnosing & Treating (856 | 11.1%), Management (718 | 9.3%), Education Instruction & Library (585 | 7.6%), and Health Technologists (576 | 7.4%).
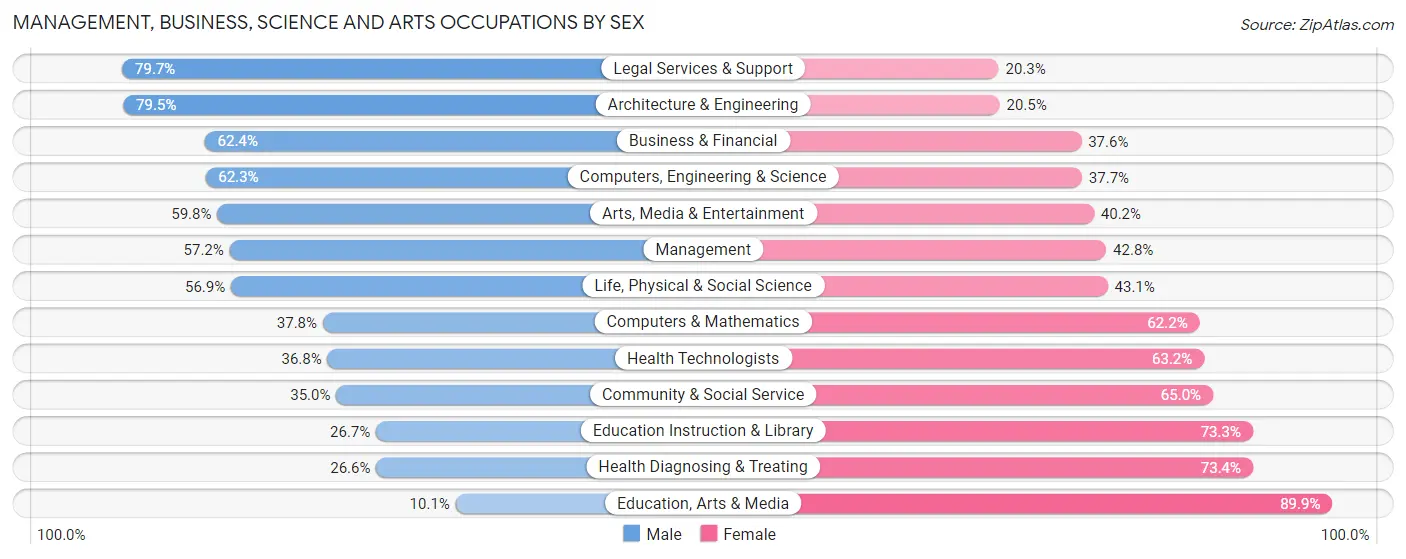
Management, Business, Science and Arts Occupations by Sex
Within the Management, Business, Science and Arts occupations in Patchogue, the most male-oriented occupations are Legal Services & Support (79.7%), Architecture & Engineering (79.5%), and Business & Financial (62.4%), while the most female-oriented occupations are Education, Arts & Media (89.9%), Health Diagnosing & Treating (73.4%), and Education Instruction & Library (73.3%).
| Occupation | Male | Female |
| Management | 411 (57.2%) | 307 (42.8%) |
| Business & Financial | 241 (62.4%) | 145 (37.6%) |
| Computers, Engineering & Science | 195 (62.3%) | 118 (37.7%) |
| Computers & Mathematics | 34 (37.8%) | 56 (62.2%) |
| Architecture & Engineering | 120 (79.5%) | 31 (20.5%) |
| Life, Physical & Social Science | 41 (56.9%) | 31 (43.1%) |
| Community & Social Service | 404 (35.0%) | 751 (65.0%) |
| Education, Arts & Media | 24 (10.1%) | 214 (89.9%) |
| Legal Services & Support | 102 (79.7%) | 26 (20.3%) |
| Education Instruction & Library | 156 (26.7%) | 429 (73.3%) |
| Arts, Media & Entertainment | 122 (59.8%) | 82 (40.2%) |
| Health Diagnosing & Treating | 228 (26.6%) | 628 (73.4%) |
| Health Technologists | 212 (36.8%) | 364 (63.2%) |
| Total (Category) | 1,479 (43.1%) | 1,949 (56.9%) |
| Total (Overall) | 4,051 (52.4%) | 3,686 (47.6%) |
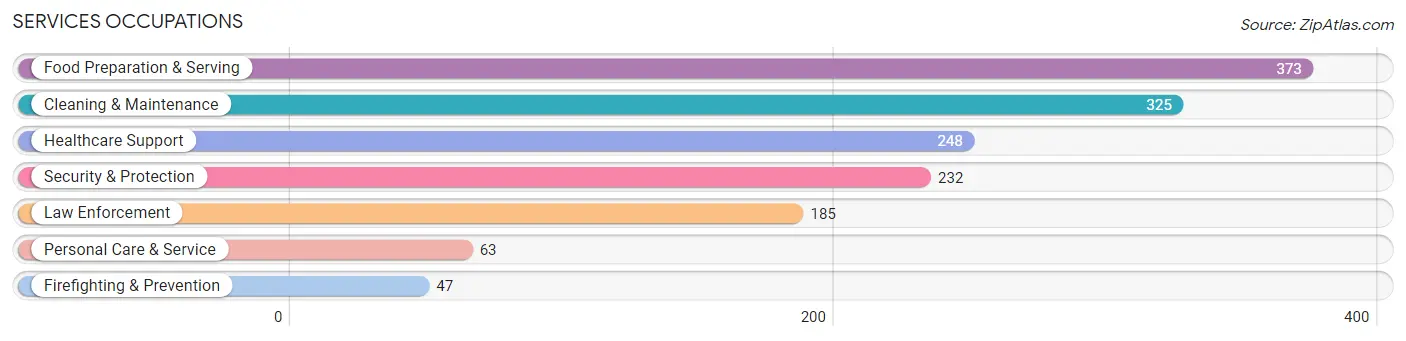
Services Occupations
The most common Services occupations in Patchogue are Food Preparation & Serving (373 | 4.8%), Cleaning & Maintenance (325 | 4.2%), Healthcare Support (248 | 3.2%), Security & Protection (232 | 3.0%), and Law Enforcement (185 | 2.4%).
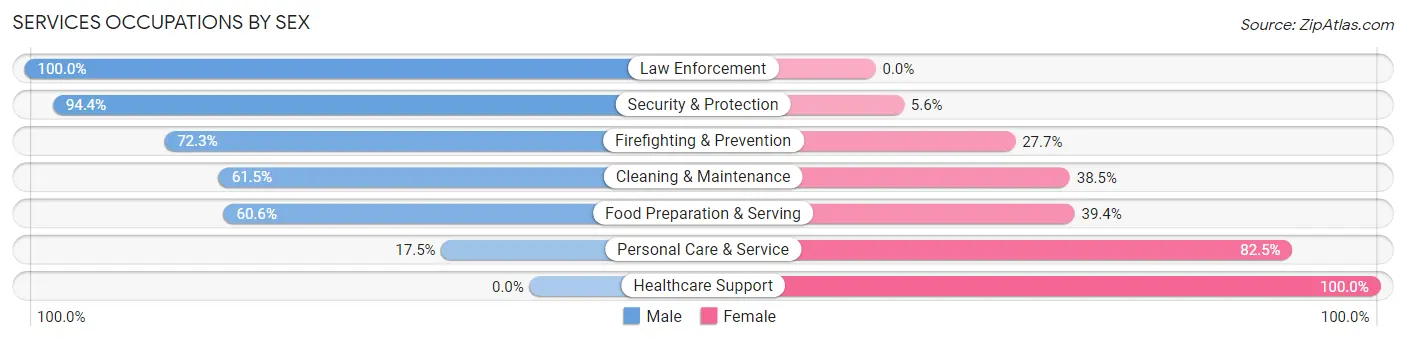
Services Occupations by Sex
Within the Services occupations in Patchogue, the most male-oriented occupations are Law Enforcement (100.0%), Security & Protection (94.4%), and Firefighting & Prevention (72.3%), while the most female-oriented occupations are Healthcare Support (100.0%), Personal Care & Service (82.5%), and Food Preparation & Serving (39.4%).
| Occupation | Male | Female |
| Healthcare Support | 0 (0.0%) | 248 (100.0%) |
| Security & Protection | 219 (94.4%) | 13 (5.6%) |
| Firefighting & Prevention | 34 (72.3%) | 13 (27.7%) |
| Law Enforcement | 185 (100.0%) | 0 (0.0%) |
| Food Preparation & Serving | 226 (60.6%) | 147 (39.4%) |
| Cleaning & Maintenance | 200 (61.5%) | 125 (38.5%) |
| Personal Care & Service | 11 (17.5%) | 52 (82.5%) |
| Total (Category) | 656 (52.9%) | 585 (47.1%) |
| Total (Overall) | 4,051 (52.4%) | 3,686 (47.6%) |
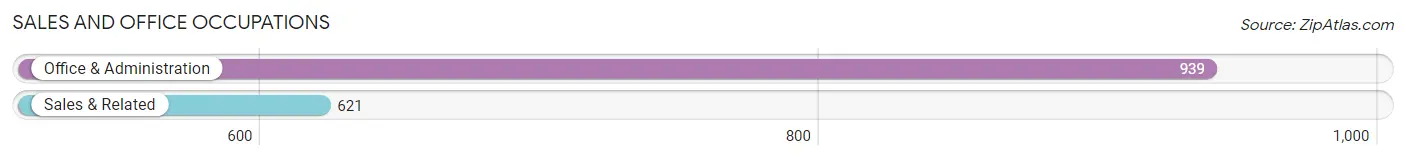
Sales and Office Occupations
The most common Sales and Office occupations in Patchogue are Office & Administration (939 | 12.1%), and Sales & Related (621 | 8.0%).
Sales and Office Occupations by Sex
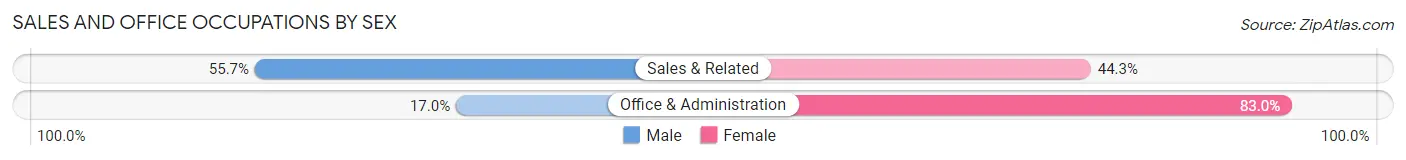
| Occupation | Male | Female |
| Sales & Related | 346 (55.7%) | 275 (44.3%) |
| Office & Administration | 160 (17.0%) | 779 (83.0%) |
| Total (Category) | 506 (32.4%) | 1,054 (67.6%) |
| Total (Overall) | 4,051 (52.4%) | 3,686 (47.6%) |
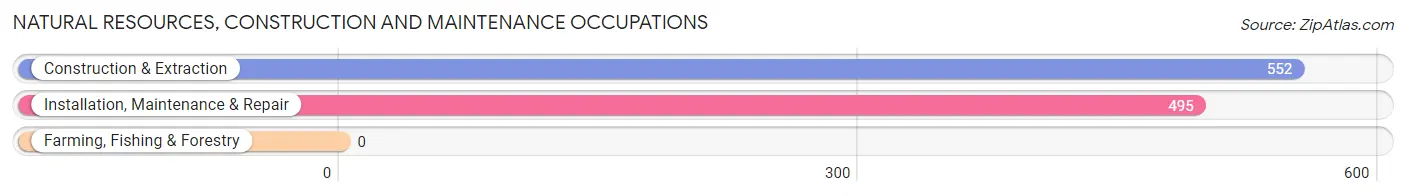
Natural Resources, Construction and Maintenance Occupations
The most common Natural Resources, Construction and Maintenance occupations in Patchogue are Construction & Extraction (552 | 7.1%), and Installation, Maintenance & Repair (495 | 6.4%).
Natural Resources, Construction and Maintenance Occupations by Sex
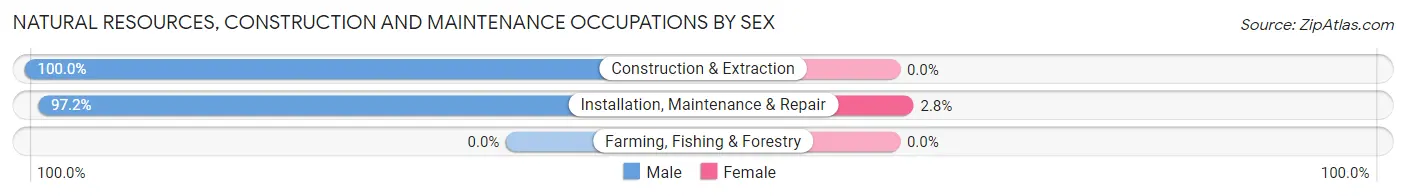
| Occupation | Male | Female |
| Farming, Fishing & Forestry | 0 (0.0%) | 0 (0.0%) |
| Construction & Extraction | 552 (100.0%) | 0 (0.0%) |
| Installation, Maintenance & Repair | 481 (97.2%) | 14 (2.8%) |
| Total (Category) | 1,033 (98.7%) | 14 (1.3%) |
| Total (Overall) | 4,051 (52.4%) | 3,686 (47.6%) |
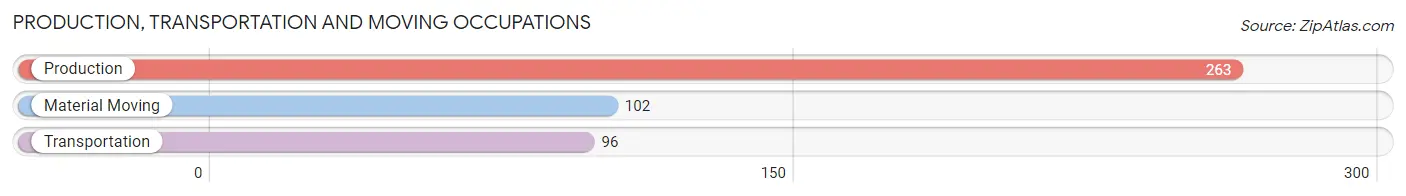
Production, Transportation and Moving Occupations
The most common Production, Transportation and Moving occupations in Patchogue are Production (263 | 3.4%), Material Moving (102 | 1.3%), and Transportation (96 | 1.2%).
Production, Transportation and Moving Occupations by Sex
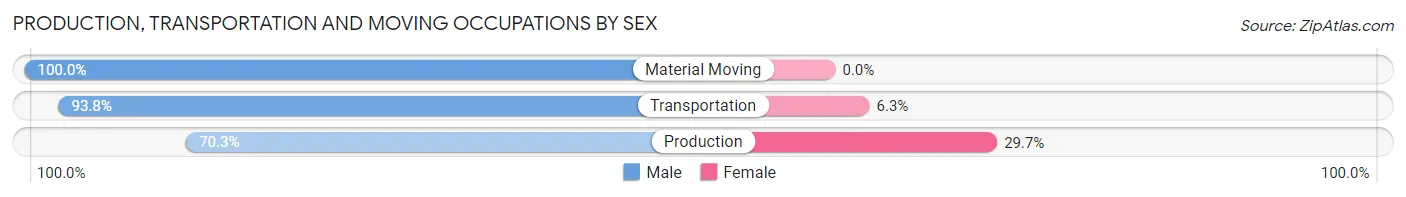
| Occupation | Male | Female |
| Production | 185 (70.3%) | 78 (29.7%) |
| Transportation | 90 (93.8%) | 6 (6.2%) |
| Material Moving | 102 (100.0%) | 0 (0.0%) |
| Total (Category) | 377 (81.8%) | 84 (18.2%) |
| Total (Overall) | 4,051 (52.4%) | 3,686 (47.6%) |
Employment Industries by Sex in Patchogue
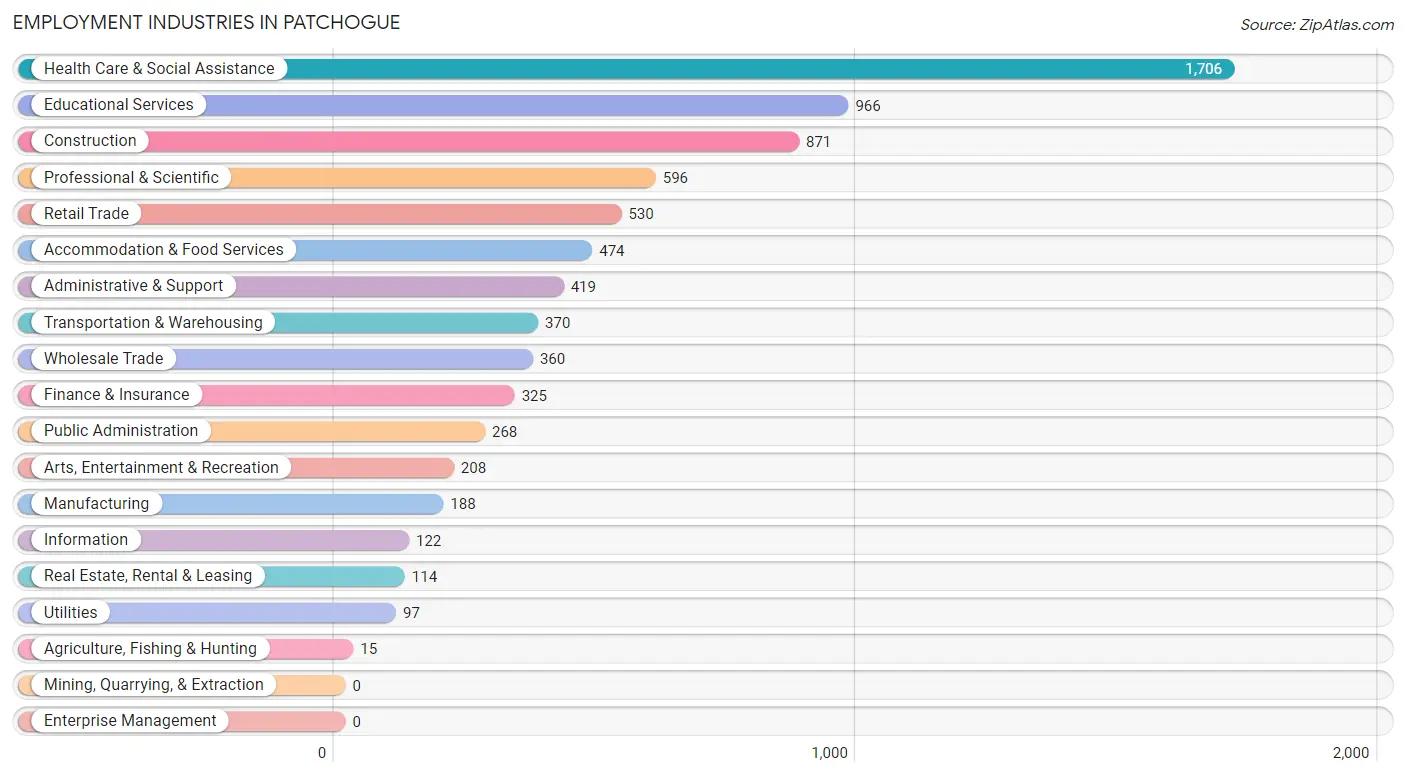
Employment Industries in Patchogue
The major employment industries in Patchogue include Health Care & Social Assistance (1,706 | 22.1%), Educational Services (966 | 12.5%), Construction (871 | 11.3%), Professional & Scientific (596 | 7.7%), and Retail Trade (530 | 6.9%).
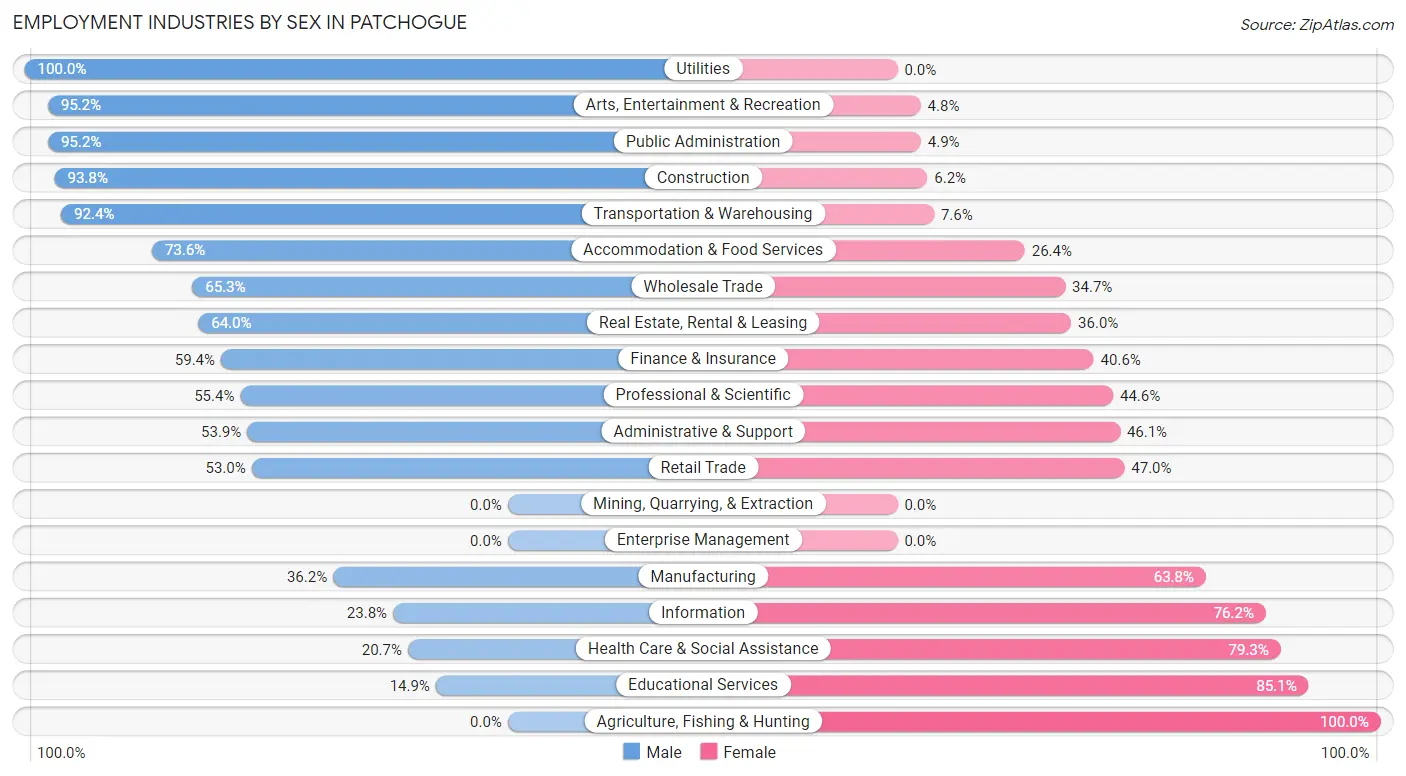
Employment Industries by Sex in Patchogue
The Patchogue industries that see more men than women are Utilities (100.0%), Arts, Entertainment & Recreation (95.2%), and Public Administration (95.2%), whereas the industries that tend to have a higher number of women are Agriculture, Fishing & Hunting (100.0%), Educational Services (85.1%), and Health Care & Social Assistance (79.3%).
| Industry | Male | Female |
| Agriculture, Fishing & Hunting | 0 (0.0%) | 15 (100.0%) |
| Mining, Quarrying, & Extraction | 0 (0.0%) | 0 (0.0%) |
| Construction | 817 (93.8%) | 54 (6.2%) |
| Manufacturing | 68 (36.2%) | 120 (63.8%) |
| Wholesale Trade | 235 (65.3%) | 125 (34.7%) |
| Retail Trade | 281 (53.0%) | 249 (47.0%) |
| Transportation & Warehousing | 342 (92.4%) | 28 (7.6%) |
| Utilities | 97 (100.0%) | 0 (0.0%) |
| Information | 29 (23.8%) | 93 (76.2%) |
| Finance & Insurance | 193 (59.4%) | 132 (40.6%) |
| Real Estate, Rental & Leasing | 73 (64.0%) | 41 (36.0%) |
| Professional & Scientific | 330 (55.4%) | 266 (44.6%) |
| Enterprise Management | 0 (0.0%) | 0 (0.0%) |
| Administrative & Support | 226 (53.9%) | 193 (46.1%) |
| Educational Services | 144 (14.9%) | 822 (85.1%) |
| Health Care & Social Assistance | 353 (20.7%) | 1,353 (79.3%) |
| Arts, Entertainment & Recreation | 198 (95.2%) | 10 (4.8%) |
| Accommodation & Food Services | 349 (73.6%) | 125 (26.4%) |
| Public Administration | 255 (95.2%) | 13 (4.9%) |
| Total | 4,051 (52.4%) | 3,686 (47.6%) |
Education in Patchogue
School Enrollment in Patchogue
The most common levels of schooling among the 2,122 students in Patchogue are elementary school (556 | 26.2%), college / undergraduate (439 | 20.7%), and high school (342 | 16.1%).
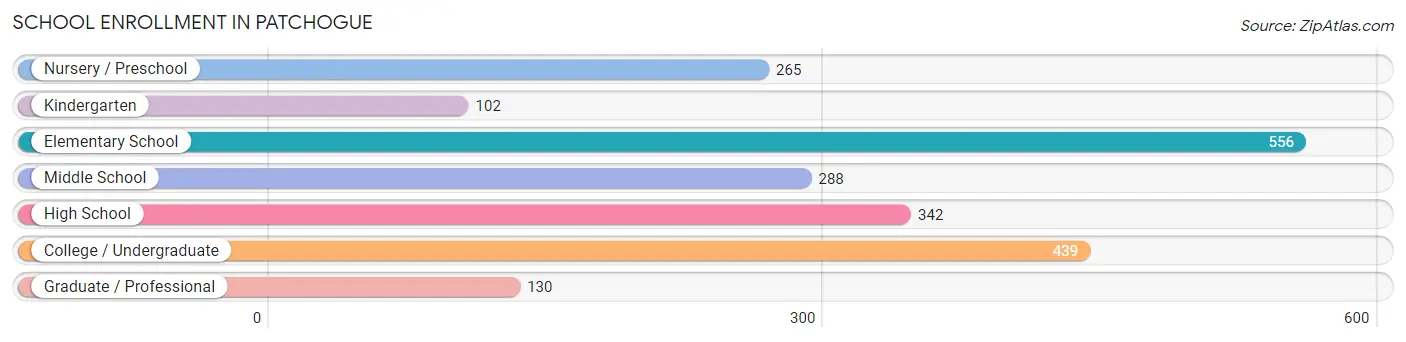
| School Level | # Students | % Students |
| Nursery / Preschool | 265 | 12.5% |
| Kindergarten | 102 | 4.8% |
| Elementary School | 556 | 26.2% |
| Middle School | 288 | 13.6% |
| High School | 342 | 16.1% |
| College / Undergraduate | 439 | 20.7% |
| Graduate / Professional | 130 | 6.1% |
| Total | 2,122 | 100.0% |
School Enrollment by Age by Funding Source in Patchogue
Out of a total of 2,122 students who are enrolled in schools in Patchogue, 511 (24.1%) attend a private institution, while the remaining 1,611 (75.9%) are enrolled in public schools. The age group of 20 to 24 year olds has the highest likelihood of being enrolled in private schools, with 213 (89.1% in the age bracket) enrolled. Conversely, the age group of 15 to 17 year olds has the lowest likelihood of being enrolled in a private school, with 242 (100.0% in the age bracket) attending a public institution.
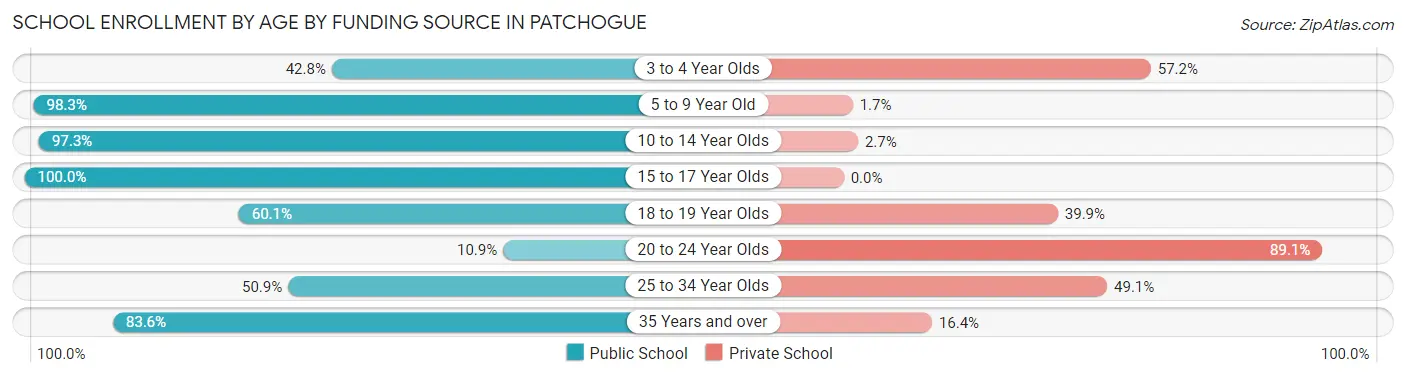
| Age Bracket | Public School | Private School |
| 3 to 4 Year Olds | 98 (42.8%) | 131 (57.2%) |
| 5 to 9 Year Old | 643 (98.3%) | 11 (1.7%) |
| 10 to 14 Year Olds | 364 (97.3%) | 10 (2.7%) |
| 15 to 17 Year Olds | 242 (100.0%) | 0 (0.0%) |
| 18 to 19 Year Olds | 122 (60.1%) | 81 (39.9%) |
| 20 to 24 Year Olds | 26 (10.9%) | 213 (89.1%) |
| 25 to 34 Year Olds | 55 (50.9%) | 53 (49.1%) |
| 35 Years and over | 61 (83.6%) | 12 (16.4%) |
| Total | 1,611 (75.9%) | 511 (24.1%) |
Educational Attainment by Field of Study in Patchogue
Bio, nature & agricultural (526 | 13.5%), business (495 | 12.7%), education (473 | 12.1%), social sciences (403 | 10.3%), and science & technology (345 | 8.9%) are the most common fields of study among 3,894 individuals in Patchogue who have obtained a bachelor's degree or higher.
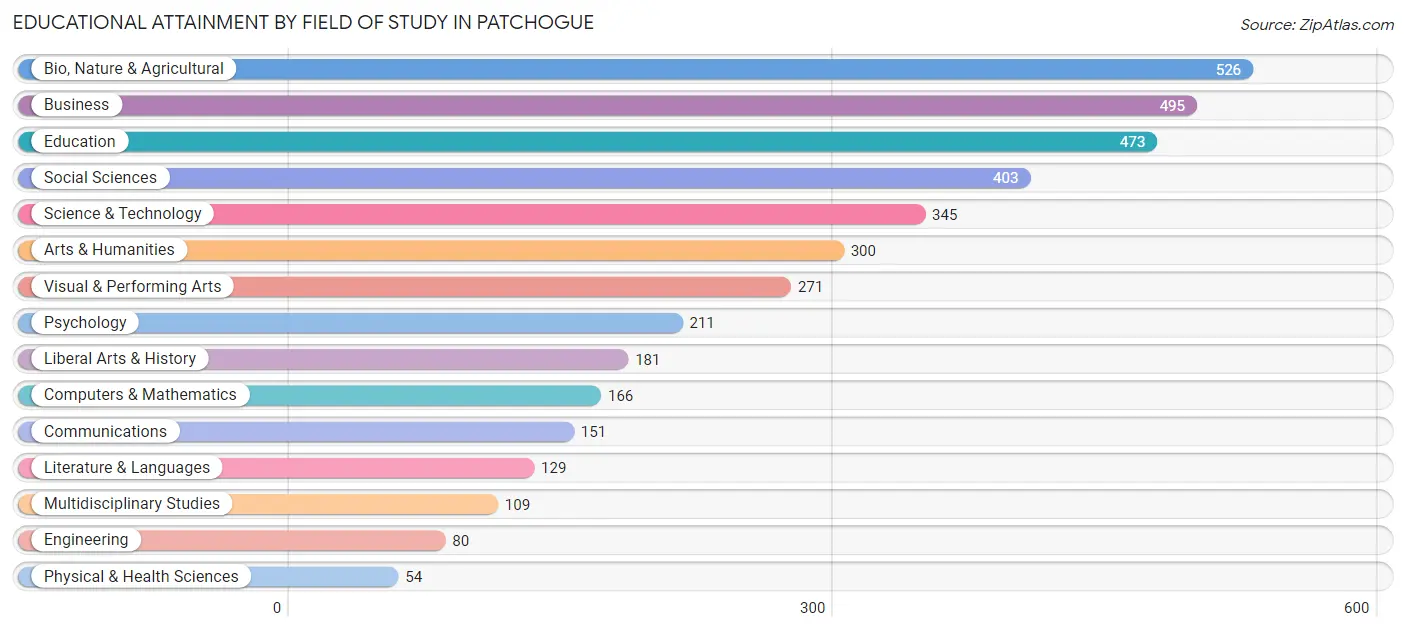
| Field of Study | # Graduates | % Graduates |
| Computers & Mathematics | 166 | 4.3% |
| Bio, Nature & Agricultural | 526 | 13.5% |
| Physical & Health Sciences | 54 | 1.4% |
| Psychology | 211 | 5.4% |
| Social Sciences | 403 | 10.3% |
| Engineering | 80 | 2.1% |
| Multidisciplinary Studies | 109 | 2.8% |
| Science & Technology | 345 | 8.9% |
| Business | 495 | 12.7% |
| Education | 473 | 12.1% |
| Literature & Languages | 129 | 3.3% |
| Liberal Arts & History | 181 | 4.6% |
| Visual & Performing Arts | 271 | 7.0% |
| Communications | 151 | 3.9% |
| Arts & Humanities | 300 | 7.7% |
| Total | 3,894 | 100.0% |
Transportation & Commute in Patchogue
Vehicle Availability by Sex in Patchogue
The most prevalent vehicle ownership categories in Patchogue are males with 2 vehicles (1,863, accounting for 47.2%) and females with 2 vehicles (1,609, making up 51.0%).
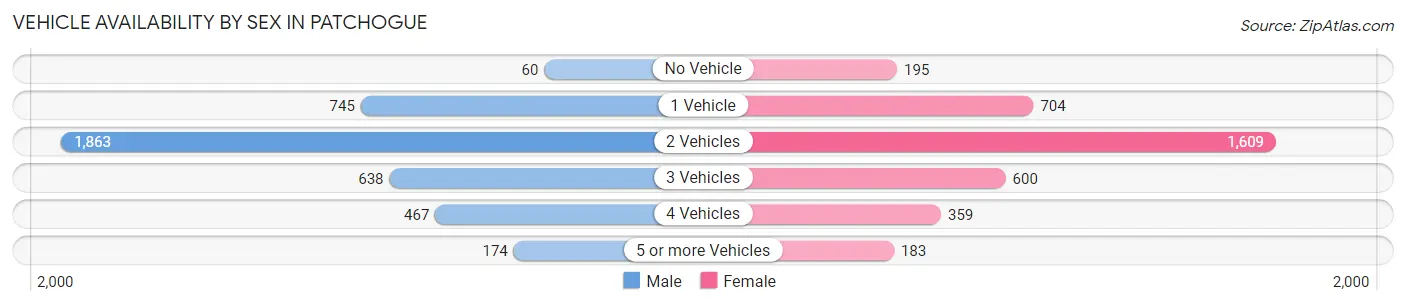
| Vehicles Available | Male | Female |
| No Vehicle | 60 (1.5%) | 195 (5.3%) |
| 1 Vehicle | 745 (18.9%) | 704 (19.3%) |
| 2 Vehicles | 1,863 (47.2%) | 1,609 (44.1%) |
| 3 Vehicles | 638 (16.2%) | 600 (16.4%) |
| 4 Vehicles | 467 (11.8%) | 359 (9.8%) |
| 5 or more Vehicles | 174 (4.4%) | 183 (5.0%) |
| Total | 3,947 (100.0%) | 3,650 (100.0%) |
Commute Time in Patchogue
The most frequently occuring commute durations in Patchogue are 30 to 34 minutes (1,165 commuters, 16.3%), 15 to 19 minutes (940 commuters, 13.2%), and 20 to 24 minutes (872 commuters, 12.2%).
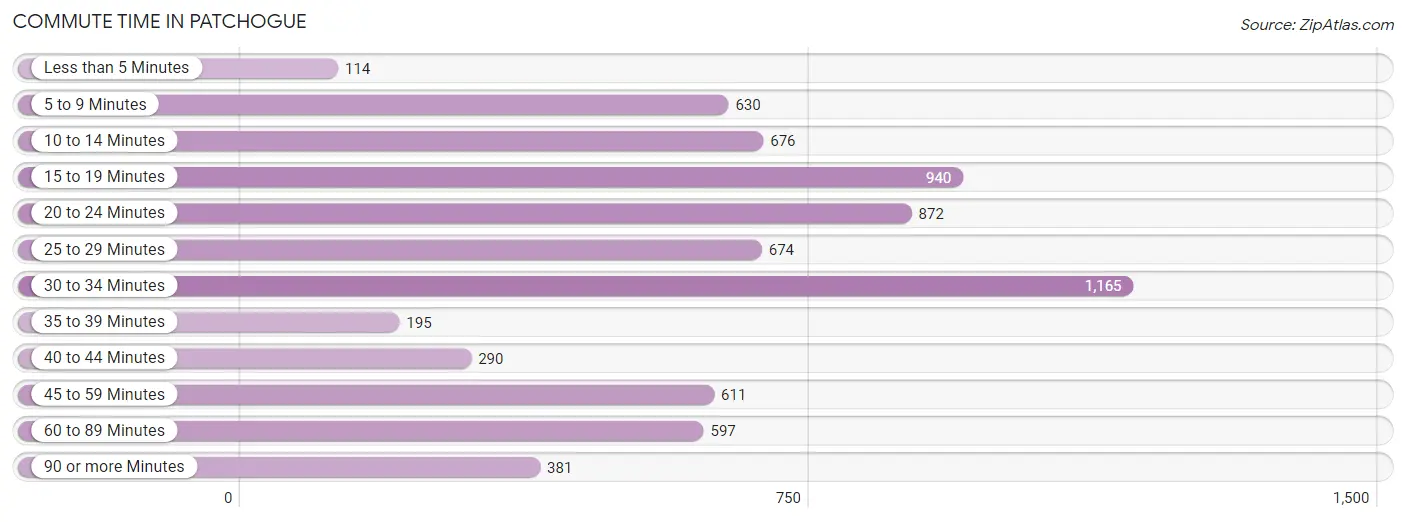
| Commute Time | # Commuters | % Commuters |
| Less than 5 Minutes | 114 | 1.6% |
| 5 to 9 Minutes | 630 | 8.8% |
| 10 to 14 Minutes | 676 | 9.5% |
| 15 to 19 Minutes | 940 | 13.2% |
| 20 to 24 Minutes | 872 | 12.2% |
| 25 to 29 Minutes | 674 | 9.4% |
| 30 to 34 Minutes | 1,165 | 16.3% |
| 35 to 39 Minutes | 195 | 2.7% |
| 40 to 44 Minutes | 290 | 4.1% |
| 45 to 59 Minutes | 611 | 8.6% |
| 60 to 89 Minutes | 597 | 8.4% |
| 90 or more Minutes | 381 | 5.3% |
Commute Time by Sex in Patchogue
The most common commute times in Patchogue are 15 to 19 minutes (599 commuters, 16.1%) for males and 30 to 34 minutes (723 commuters, 21.1%) for females.
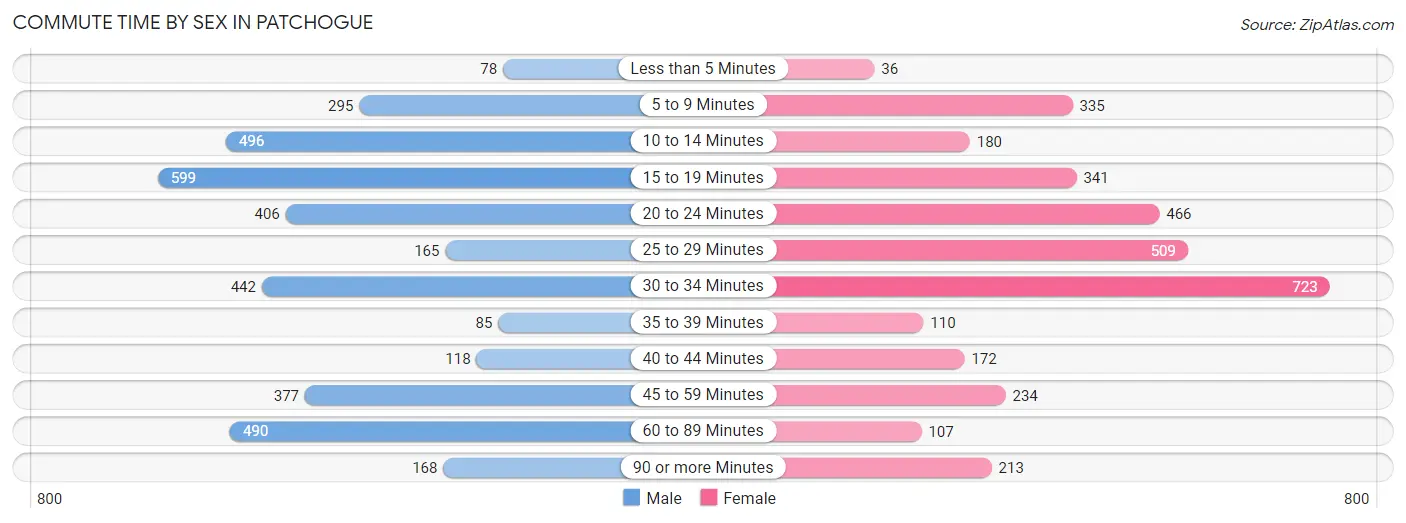
| Commute Time | Male | Female |
| Less than 5 Minutes | 78 (2.1%) | 36 (1.1%) |
| 5 to 9 Minutes | 295 (7.9%) | 335 (9.8%) |
| 10 to 14 Minutes | 496 (13.3%) | 180 (5.2%) |
| 15 to 19 Minutes | 599 (16.1%) | 341 (10.0%) |
| 20 to 24 Minutes | 406 (10.9%) | 466 (13.6%) |
| 25 to 29 Minutes | 165 (4.4%) | 509 (14.9%) |
| 30 to 34 Minutes | 442 (11.9%) | 723 (21.1%) |
| 35 to 39 Minutes | 85 (2.3%) | 110 (3.2%) |
| 40 to 44 Minutes | 118 (3.2%) | 172 (5.0%) |
| 45 to 59 Minutes | 377 (10.1%) | 234 (6.8%) |
| 60 to 89 Minutes | 490 (13.2%) | 107 (3.1%) |
| 90 or more Minutes | 168 (4.5%) | 213 (6.2%) |
Time of Departure to Work by Sex in Patchogue
The most frequent times of departure to work in Patchogue are 6:00 AM to 6:29 AM (651, 17.5%) for males and 8:00 AM to 8:29 AM (802, 23.4%) for females.
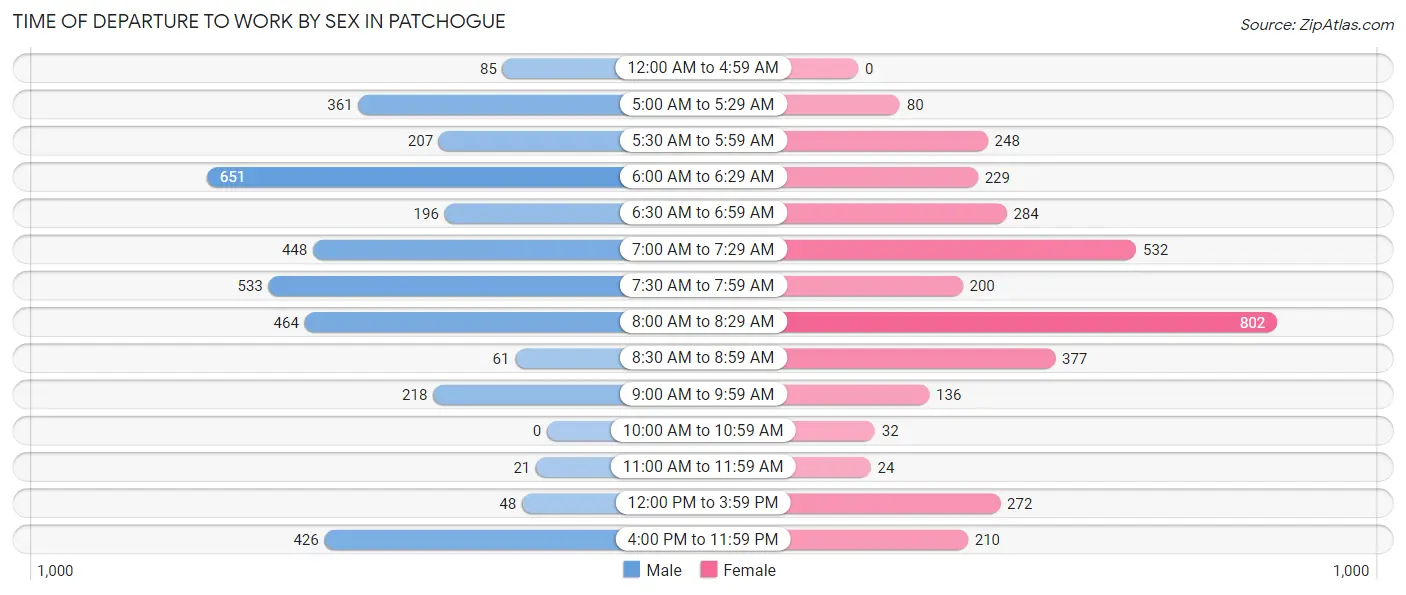
| Time of Departure | Male | Female |
| 12:00 AM to 4:59 AM | 85 (2.3%) | 0 (0.0%) |
| 5:00 AM to 5:29 AM | 361 (9.7%) | 80 (2.3%) |
| 5:30 AM to 5:59 AM | 207 (5.6%) | 248 (7.2%) |
| 6:00 AM to 6:29 AM | 651 (17.5%) | 229 (6.7%) |
| 6:30 AM to 6:59 AM | 196 (5.3%) | 284 (8.3%) |
| 7:00 AM to 7:29 AM | 448 (12.0%) | 532 (15.5%) |
| 7:30 AM to 7:59 AM | 533 (14.3%) | 200 (5.8%) |
| 8:00 AM to 8:29 AM | 464 (12.5%) | 802 (23.4%) |
| 8:30 AM to 8:59 AM | 61 (1.6%) | 377 (11.0%) |
| 9:00 AM to 9:59 AM | 218 (5.9%) | 136 (4.0%) |
| 10:00 AM to 10:59 AM | 0 (0.0%) | 32 (0.9%) |
| 11:00 AM to 11:59 AM | 21 (0.6%) | 24 (0.7%) |
| 12:00 PM to 3:59 PM | 48 (1.3%) | 272 (7.9%) |
| 4:00 PM to 11:59 PM | 426 (11.5%) | 210 (6.1%) |
| Total | 3,719 (100.0%) | 3,426 (100.0%) |
Housing Occupancy in Patchogue
Occupancy by Ownership in Patchogue
Of the total 5,269 dwellings in Patchogue, owner-occupied units account for 3,034 (57.6%), while renter-occupied units make up 2,235 (42.4%).
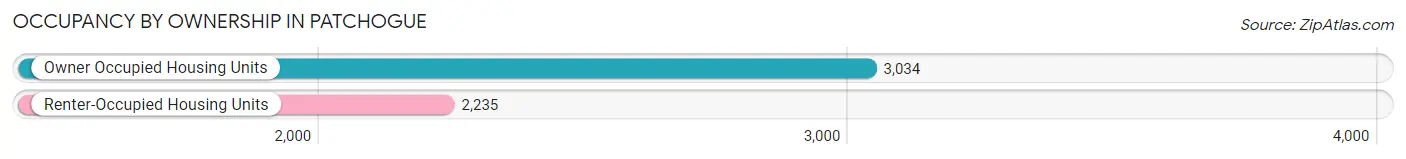
| Occupancy | # Housing Units | % Housing Units |
| Owner Occupied Housing Units | 3,034 | 57.6% |
| Renter-Occupied Housing Units | 2,235 | 42.4% |
| Total Occupied Housing Units | 5,269 | 100.0% |
Occupancy by Household Size in Patchogue
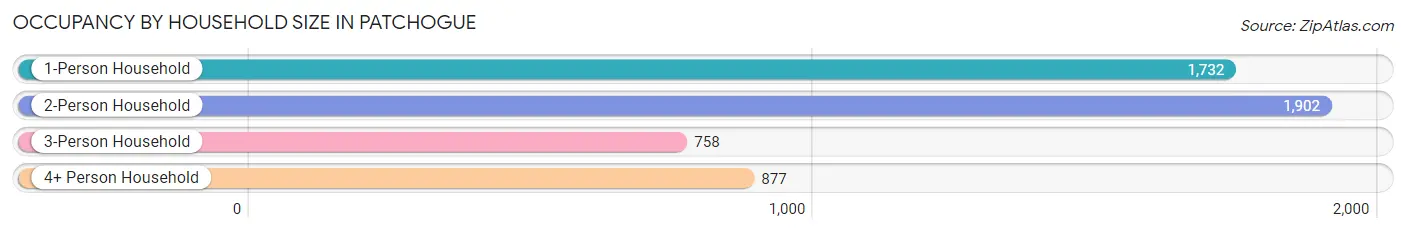
| Household Size | # Housing Units | % Housing Units |
| 1-Person Household | 1,732 | 32.9% |
| 2-Person Household | 1,902 | 36.1% |
| 3-Person Household | 758 | 14.4% |
| 4+ Person Household | 877 | 16.6% |
| Total Housing Units | 5,269 | 100.0% |
Occupancy by Ownership by Household Size in Patchogue
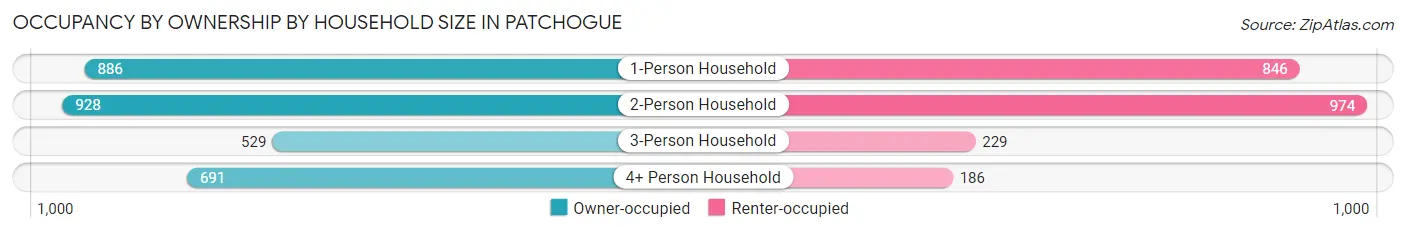
| Household Size | Owner-occupied | Renter-occupied |
| 1-Person Household | 886 (51.1%) | 846 (48.8%) |
| 2-Person Household | 928 (48.8%) | 974 (51.2%) |
| 3-Person Household | 529 (69.8%) | 229 (30.2%) |
| 4+ Person Household | 691 (78.8%) | 186 (21.2%) |
| Total Housing Units | 3,034 (57.6%) | 2,235 (42.4%) |
Occupancy by Educational Attainment in Patchogue
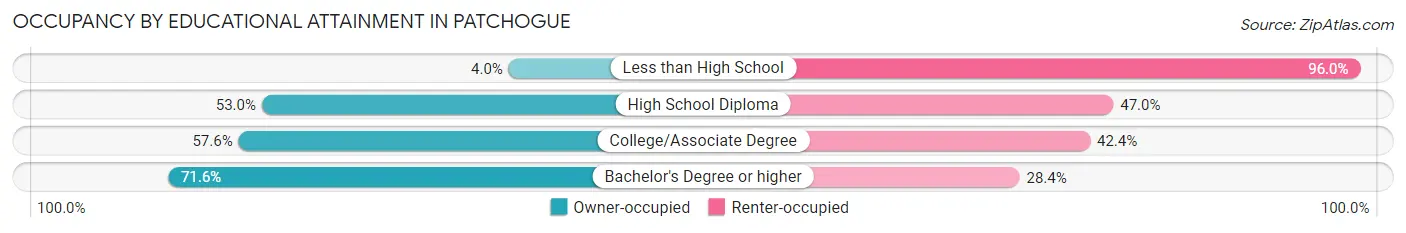
| Household Size | Owner-occupied | Renter-occupied |
| Less than High School | 20 (4.0%) | 478 (96.0%) |
| High School Diploma | 498 (53.0%) | 442 (47.0%) |
| College/Associate Degree | 930 (57.6%) | 685 (42.4%) |
| Bachelor's Degree or higher | 1,586 (71.6%) | 630 (28.4%) |
Occupancy by Age of Householder in Patchogue
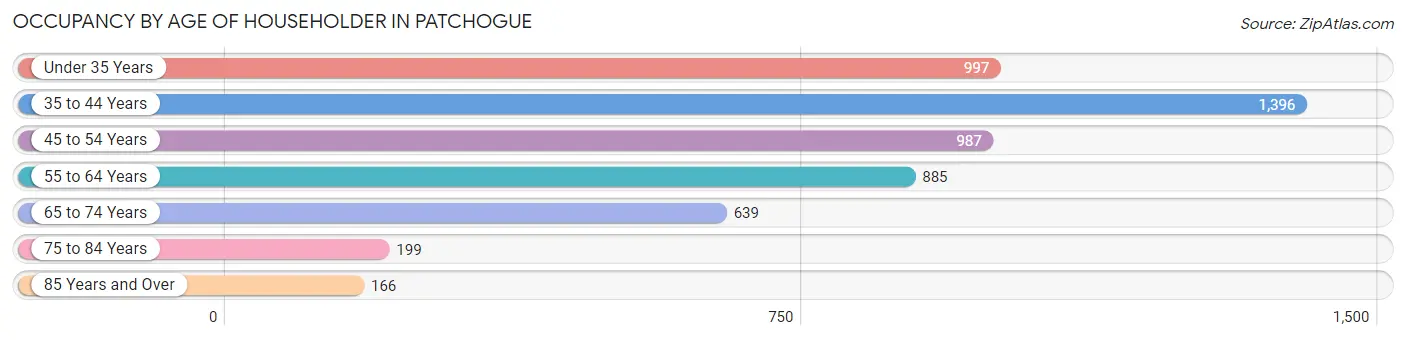
| Age Bracket | # Households | % Households |
| Under 35 Years | 997 | 18.9% |
| 35 to 44 Years | 1,396 | 26.5% |
| 45 to 54 Years | 987 | 18.7% |
| 55 to 64 Years | 885 | 16.8% |
| 65 to 74 Years | 639 | 12.1% |
| 75 to 84 Years | 199 | 3.8% |
| 85 Years and Over | 166 | 3.2% |
| Total | 5,269 | 100.0% |
Housing Finances in Patchogue
Median Income by Occupancy in Patchogue
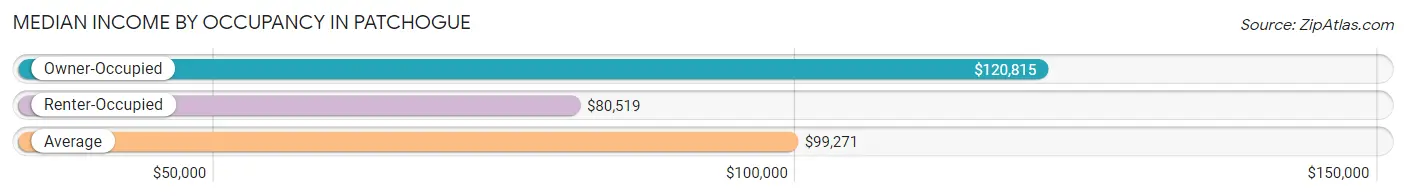
| Occupancy Type | # Households | Median Income |
| Owner-Occupied | 3,034 (57.6%) | $120,815 |
| Renter-Occupied | 2,235 (42.4%) | $80,519 |
| Average | 5,269 (100.0%) | $99,271 |
Occupancy by Householder Income Bracket in Patchogue
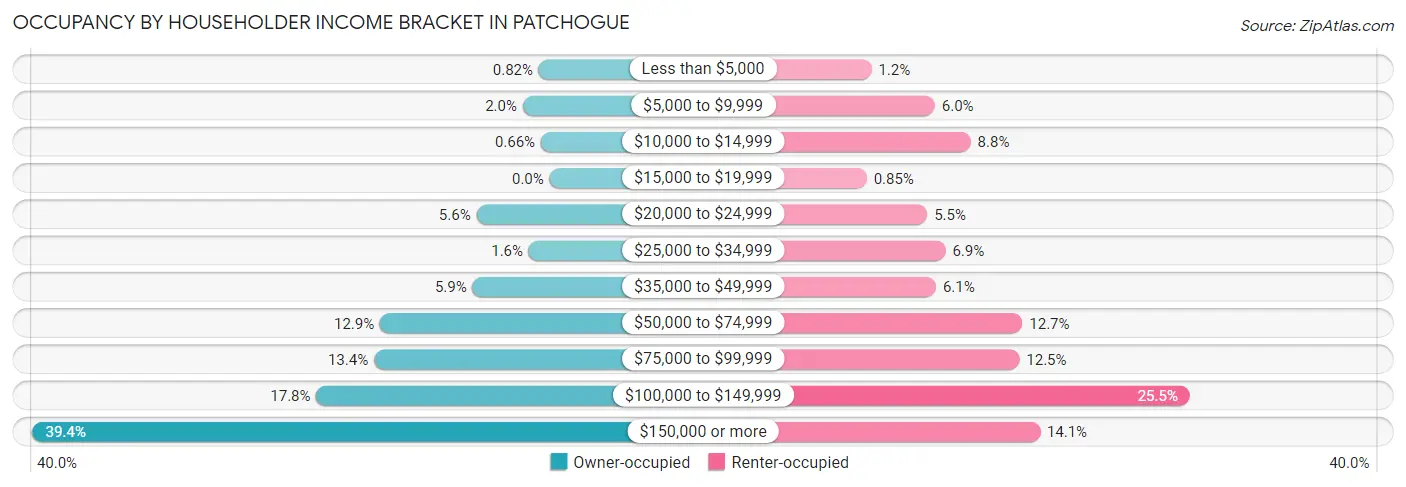
| Income Bracket | Owner-occupied | Renter-occupied |
| Less than $5,000 | 25 (0.8%) | 27 (1.2%) |
| $5,000 to $9,999 | 62 (2.0%) | 135 (6.0%) |
| $10,000 to $14,999 | 20 (0.7%) | 196 (8.8%) |
| $15,000 to $19,999 | 0 (0.0%) | 19 (0.9%) |
| $20,000 to $24,999 | 169 (5.6%) | 122 (5.5%) |
| $25,000 to $34,999 | 48 (1.6%) | 153 (6.9%) |
| $35,000 to $49,999 | 178 (5.9%) | 137 (6.1%) |
| $50,000 to $74,999 | 392 (12.9%) | 284 (12.7%) |
| $75,000 to $99,999 | 406 (13.4%) | 279 (12.5%) |
| $100,000 to $149,999 | 539 (17.8%) | 569 (25.5%) |
| $150,000 or more | 1,195 (39.4%) | 314 (14.1%) |
| Total | 3,034 (100.0%) | 2,235 (100.0%) |
Monthly Housing Cost Tiers in Patchogue
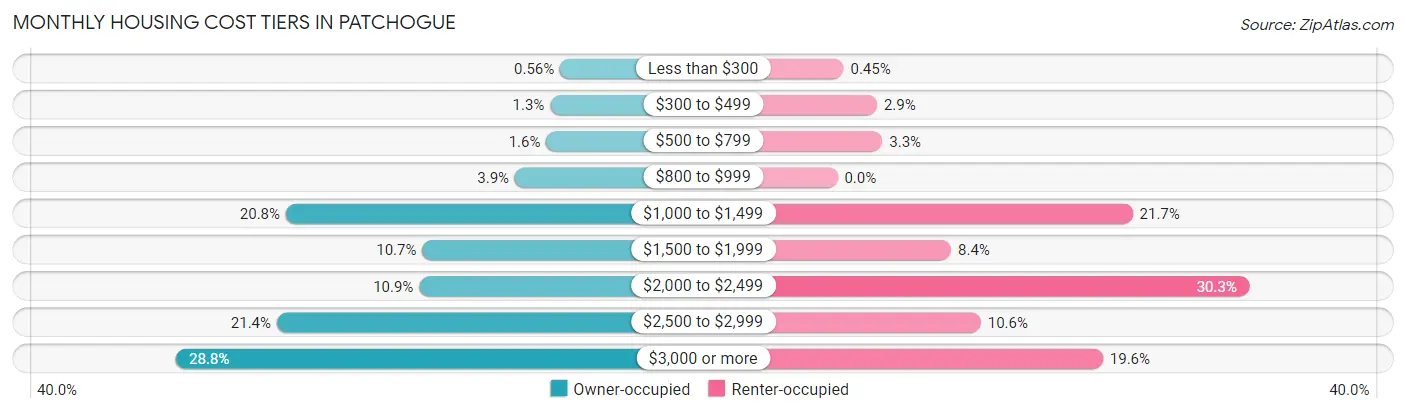
| Monthly Cost | Owner-occupied | Renter-occupied |
| Less than $300 | 17 (0.6%) | 10 (0.4%) |
| $300 to $499 | 39 (1.3%) | 65 (2.9%) |
| $500 to $799 | 48 (1.6%) | 74 (3.3%) |
| $800 to $999 | 118 (3.9%) | 0 (0.0%) |
| $1,000 to $1,499 | 630 (20.8%) | 486 (21.7%) |
| $1,500 to $1,999 | 325 (10.7%) | 187 (8.4%) |
| $2,000 to $2,499 | 332 (10.9%) | 677 (30.3%) |
| $2,500 to $2,999 | 650 (21.4%) | 236 (10.6%) |
| $3,000 or more | 875 (28.8%) | 437 (19.6%) |
| Total | 3,034 (100.0%) | 2,235 (100.0%) |
Physical Housing Characteristics in Patchogue
Housing Structures in Patchogue
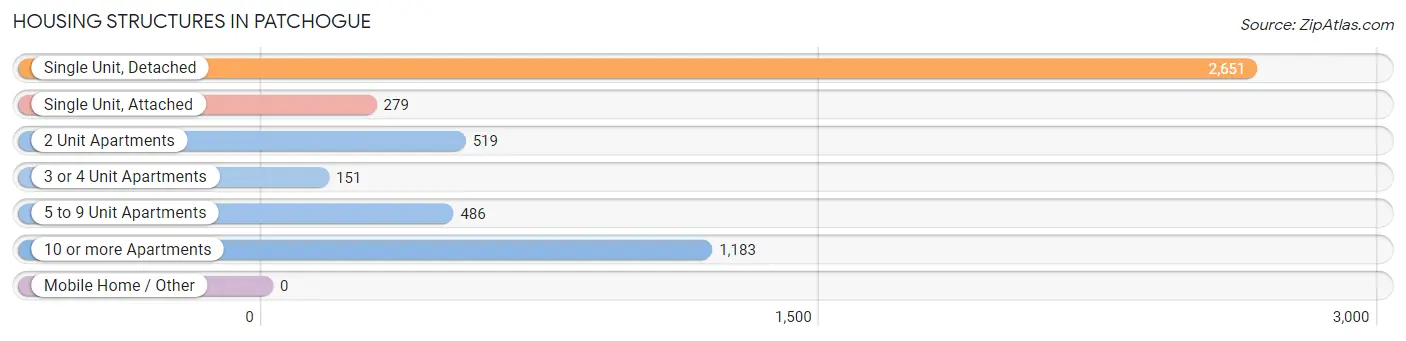
| Structure Type | # Housing Units | % Housing Units |
| Single Unit, Detached | 2,651 | 50.3% |
| Single Unit, Attached | 279 | 5.3% |
| 2 Unit Apartments | 519 | 9.9% |
| 3 or 4 Unit Apartments | 151 | 2.9% |
| 5 to 9 Unit Apartments | 486 | 9.2% |
| 10 or more Apartments | 1,183 | 22.5% |
| Mobile Home / Other | 0 | 0.0% |
| Total | 5,269 | 100.0% |
Housing Structures by Occupancy in Patchogue
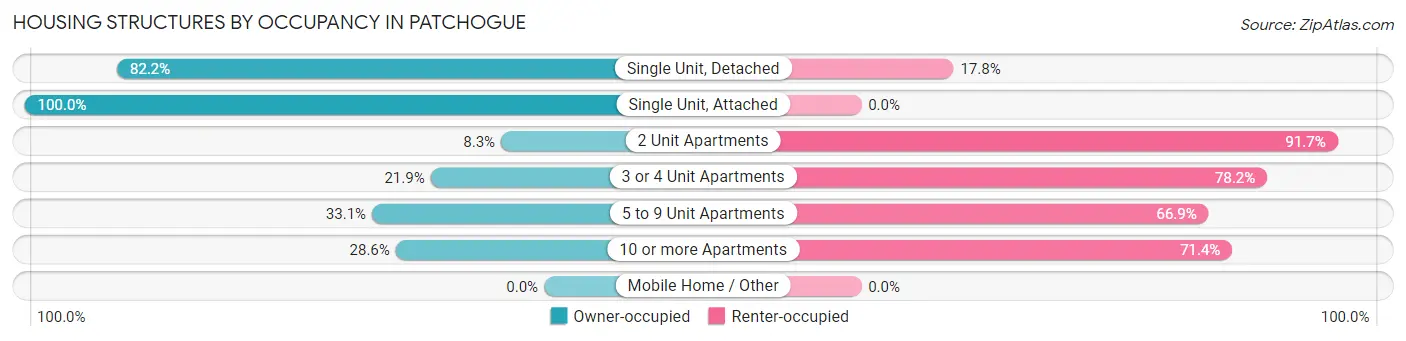
| Structure Type | Owner-occupied | Renter-occupied |
| Single Unit, Detached | 2,180 (82.2%) | 471 (17.8%) |
| Single Unit, Attached | 279 (100.0%) | 0 (0.0%) |
| 2 Unit Apartments | 43 (8.3%) | 476 (91.7%) |
| 3 or 4 Unit Apartments | 33 (21.8%) | 118 (78.1%) |
| 5 to 9 Unit Apartments | 161 (33.1%) | 325 (66.9%) |
| 10 or more Apartments | 338 (28.6%) | 845 (71.4%) |
| Mobile Home / Other | 0 (0.0%) | 0 (0.0%) |
| Total | 3,034 (57.6%) | 2,235 (42.4%) |
Housing Structures by Number of Rooms in Patchogue
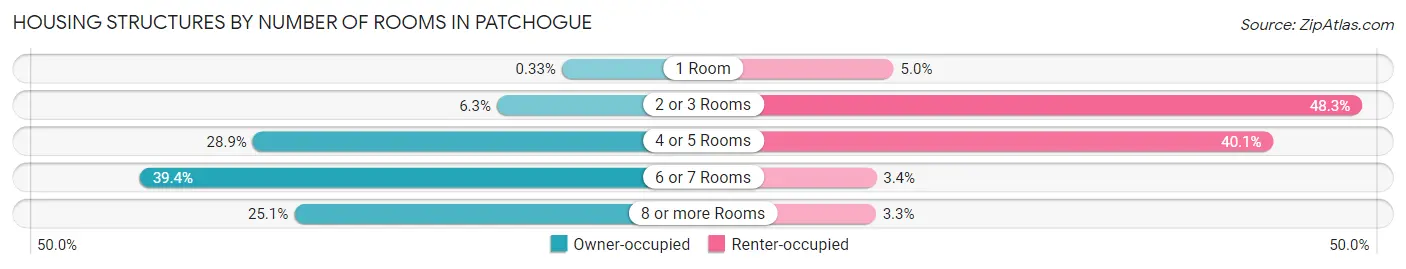
| Number of Rooms | Owner-occupied | Renter-occupied |
| 1 Room | 10 (0.3%) | 111 (5.0%) |
| 2 or 3 Rooms | 192 (6.3%) | 1,079 (48.3%) |
| 4 or 5 Rooms | 877 (28.9%) | 896 (40.1%) |
| 6 or 7 Rooms | 1,194 (39.4%) | 75 (3.4%) |
| 8 or more Rooms | 761 (25.1%) | 74 (3.3%) |
| Total | 3,034 (100.0%) | 2,235 (100.0%) |
Housing Structure by Heating Type in Patchogue
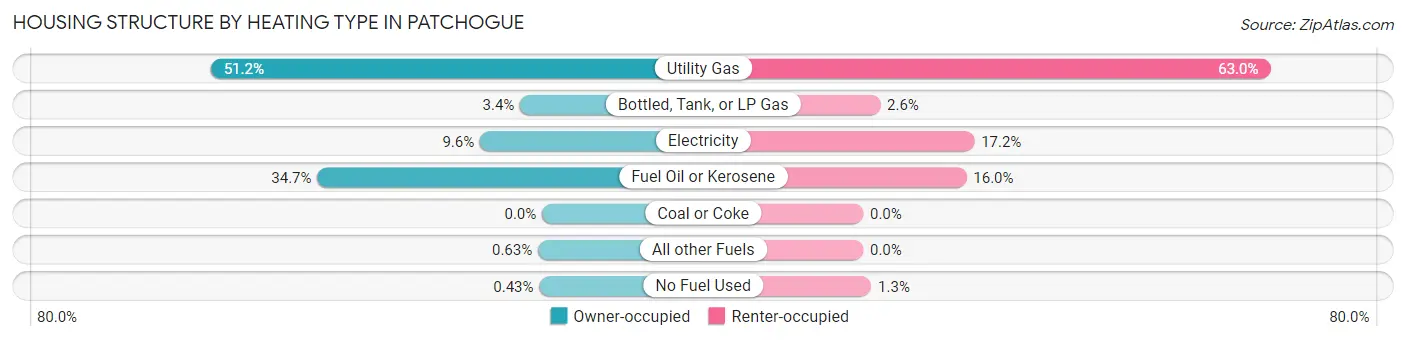
| Heating Type | Owner-occupied | Renter-occupied |
| Utility Gas | 1,554 (51.2%) | 1,407 (62.9%) |
| Bottled, Tank, or LP Gas | 103 (3.4%) | 59 (2.6%) |
| Electricity | 291 (9.6%) | 384 (17.2%) |
| Fuel Oil or Kerosene | 1,054 (34.7%) | 357 (16.0%) |
| Coal or Coke | 0 (0.0%) | 0 (0.0%) |
| All other Fuels | 19 (0.6%) | 0 (0.0%) |
| No Fuel Used | 13 (0.4%) | 28 (1.3%) |
| Total | 3,034 (100.0%) | 2,235 (100.0%) |
Household Vehicle Usage in Patchogue
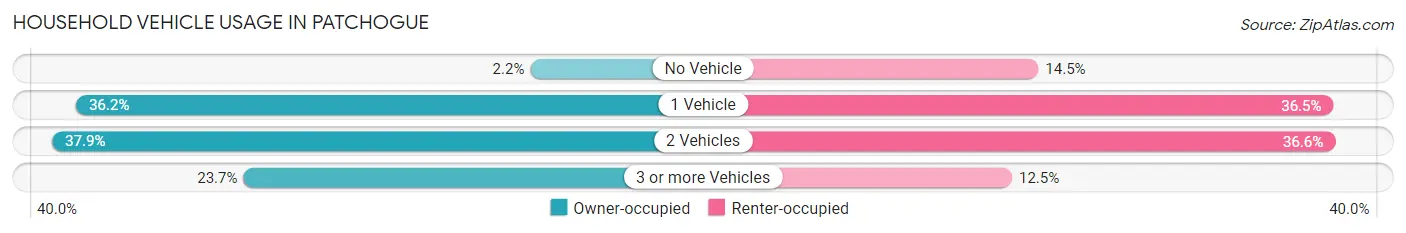
| Vehicles per Household | Owner-occupied | Renter-occupied |
| No Vehicle | 68 (2.2%) | 323 (14.4%) |
| 1 Vehicle | 1,097 (36.2%) | 815 (36.5%) |
| 2 Vehicles | 1,151 (37.9%) | 818 (36.6%) |
| 3 or more Vehicles | 718 (23.7%) | 279 (12.5%) |
| Total | 3,034 (100.0%) | 2,235 (100.0%) |
Real Estate & Mortgages in Patchogue
Real Estate and Mortgage Overview in Patchogue
| Characteristic | Without Mortgage | With Mortgage |
| Housing Units | 1,067 | 1,967 |
| Median Property Value | $450,000 | $412,400 |
| Median Household Income | $101,830 | $884 |
| Monthly Housing Costs | $1,371 | $875 |
| Real Estate Taxes | $10,001 | $33 |
Property Value by Mortgage Status in Patchogue
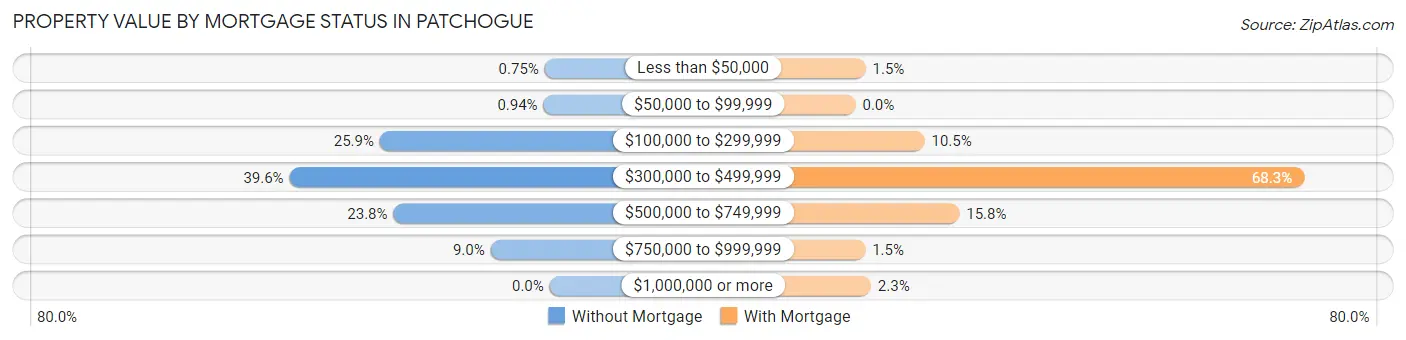
| Property Value | Without Mortgage | With Mortgage |
| Less than $50,000 | 8 (0.7%) | 30 (1.5%) |
| $50,000 to $99,999 | 10 (0.9%) | 0 (0.0%) |
| $100,000 to $299,999 | 276 (25.9%) | 207 (10.5%) |
| $300,000 to $499,999 | 423 (39.6%) | 1,344 (68.3%) |
| $500,000 to $749,999 | 254 (23.8%) | 311 (15.8%) |
| $750,000 to $999,999 | 96 (9.0%) | 29 (1.5%) |
| $1,000,000 or more | 0 (0.0%) | 46 (2.3%) |
| Total | 1,067 (100.0%) | 1,967 (100.0%) |
Household Income by Mortgage Status in Patchogue
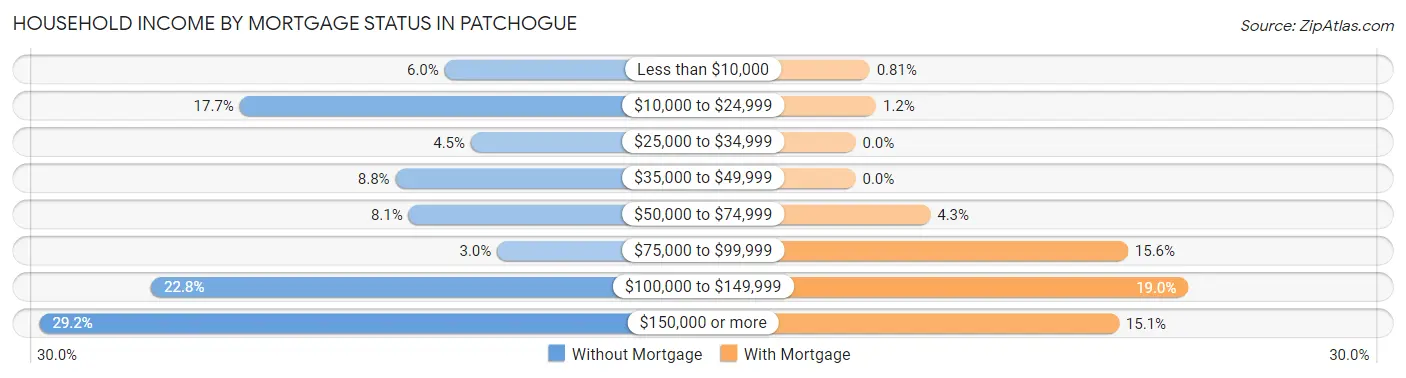
| Household Income | Without Mortgage | With Mortgage |
| Less than $10,000 | 64 (6.0%) | 16 (0.8%) |
| $10,000 to $24,999 | 189 (17.7%) | 23 (1.2%) |
| $25,000 to $34,999 | 48 (4.5%) | 0 (0.0%) |
| $35,000 to $49,999 | 94 (8.8%) | 0 (0.0%) |
| $50,000 to $74,999 | 86 (8.1%) | 84 (4.3%) |
| $75,000 to $99,999 | 32 (3.0%) | 306 (15.6%) |
| $100,000 to $149,999 | 243 (22.8%) | 374 (19.0%) |
| $150,000 or more | 311 (29.1%) | 296 (15.0%) |
| Total | 1,067 (100.0%) | 1,967 (100.0%) |
Property Value to Household Income Ratio in Patchogue
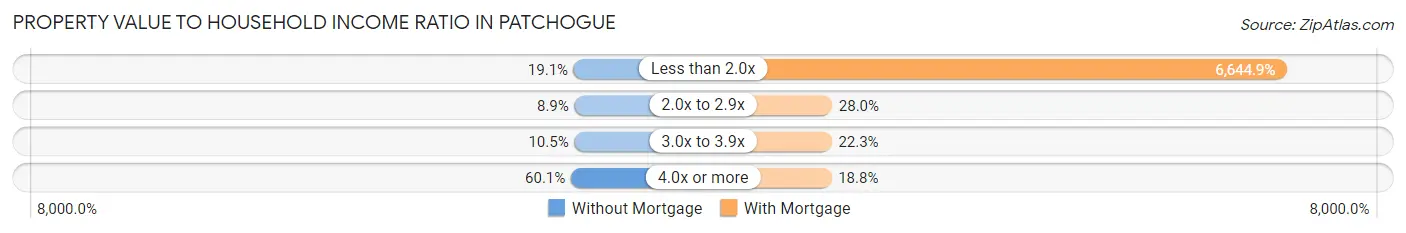
| Value-to-Income Ratio | Without Mortgage | With Mortgage |
| Less than 2.0x | 204 (19.1%) | 130,706 (6,644.9%) |
| 2.0x to 2.9x | 95 (8.9%) | 551 (28.0%) |
| 3.0x to 3.9x | 112 (10.5%) | 439 (22.3%) |
| 4.0x or more | 641 (60.1%) | 369 (18.8%) |
| Total | 1,067 (100.0%) | 1,967 (100.0%) |
Real Estate Taxes by Mortgage Status in Patchogue
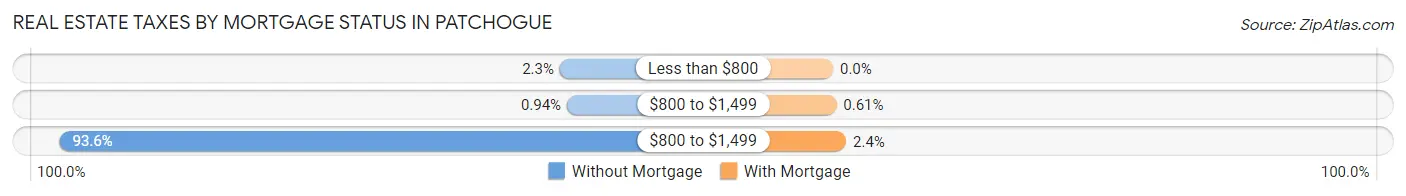
| Property Taxes | Without Mortgage | With Mortgage |
| Less than $800 | 24 (2.2%) | 0 (0.0%) |
| $800 to $1,499 | 10 (0.9%) | 12 (0.6%) |
| $800 to $1,499 | 999 (93.6%) | 47 (2.4%) |
| Total | 1,067 (100.0%) | 1,967 (100.0%) |
Health & Disability in Patchogue
Health Insurance Coverage by Age in Patchogue
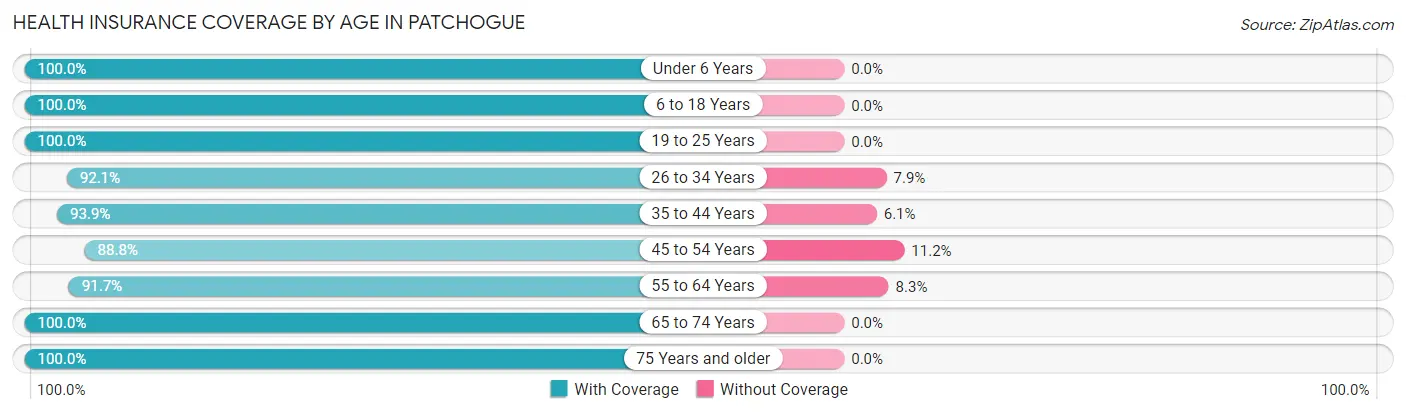
| Age Bracket | With Coverage | Without Coverage |
| Under 6 Years | 858 (100.0%) | 0 (0.0%) |
| 6 to 18 Years | 1,289 (100.0%) | 0 (0.0%) |
| 19 to 25 Years | 853 (100.0%) | 0 (0.0%) |
| 26 to 34 Years | 2,277 (92.1%) | 195 (7.9%) |
| 35 to 44 Years | 2,140 (93.9%) | 138 (6.1%) |
| 45 to 54 Years | 1,489 (88.8%) | 188 (11.2%) |
| 55 to 64 Years | 1,487 (91.7%) | 134 (8.3%) |
| 65 to 74 Years | 775 (100.0%) | 0 (0.0%) |
| 75 Years and older | 505 (100.0%) | 0 (0.0%) |
| Total | 11,673 (94.7%) | 655 (5.3%) |
Health Insurance Coverage by Citizenship Status in Patchogue
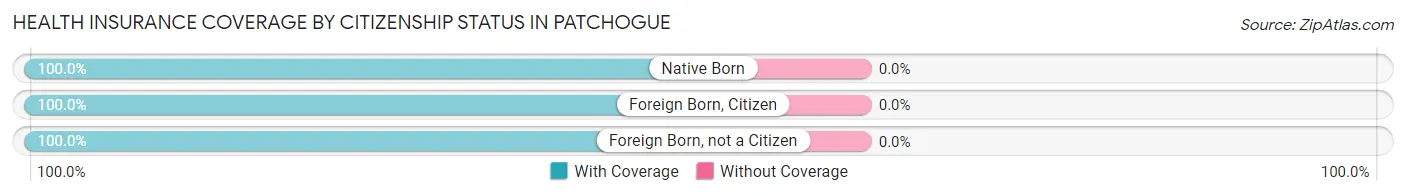
| Citizenship Status | With Coverage | Without Coverage |
| Native Born | 858 (100.0%) | 0 (0.0%) |
| Foreign Born, Citizen | 1,289 (100.0%) | 0 (0.0%) |
| Foreign Born, not a Citizen | 853 (100.0%) | 0 (0.0%) |
Health Insurance Coverage by Household Income in Patchogue
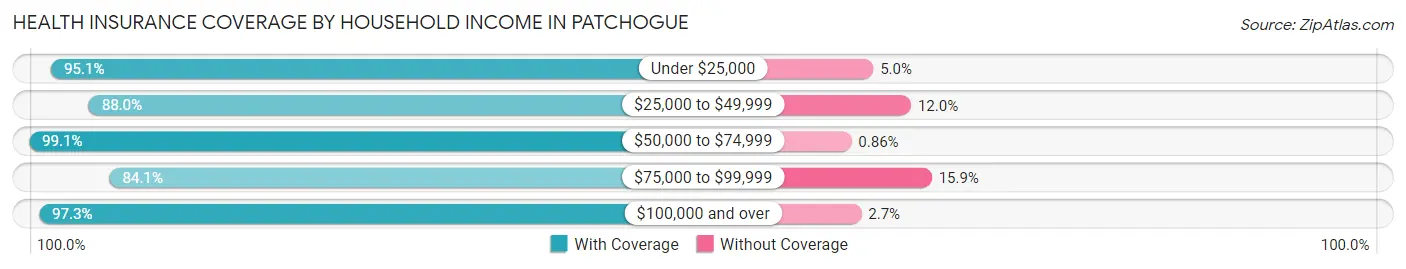
| Household Income | With Coverage | Without Coverage |
| Under $25,000 | 921 (95.1%) | 48 (5.0%) |
| $25,000 to $49,999 | 973 (88.0%) | 133 (12.0%) |
| $50,000 to $74,999 | 1,380 (99.1%) | 12 (0.9%) |
| $75,000 to $99,999 | 1,422 (84.1%) | 269 (15.9%) |
| $100,000 and over | 6,881 (97.3%) | 193 (2.7%) |
Public vs Private Health Insurance Coverage by Age in Patchogue
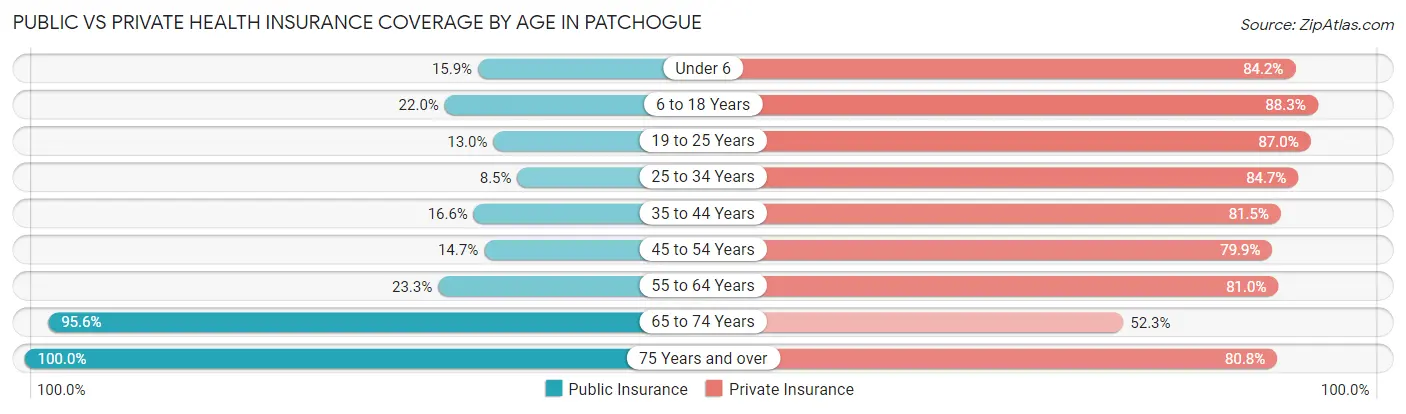
| Age Bracket | Public Insurance | Private Insurance |
| Under 6 | 136 (15.9%) | 722 (84.2%) |
| 6 to 18 Years | 284 (22.0%) | 1,138 (88.3%) |
| 19 to 25 Years | 111 (13.0%) | 742 (87.0%) |
| 25 to 34 Years | 211 (8.5%) | 2,094 (84.7%) |
| 35 to 44 Years | 379 (16.6%) | 1,856 (81.5%) |
| 45 to 54 Years | 247 (14.7%) | 1,340 (79.9%) |
| 55 to 64 Years | 377 (23.3%) | 1,313 (81.0%) |
| 65 to 74 Years | 741 (95.6%) | 405 (52.3%) |
| 75 Years and over | 505 (100.0%) | 408 (80.8%) |
| Total | 2,991 (24.3%) | 10,018 (81.3%) |
Disability Status by Sex by Age in Patchogue
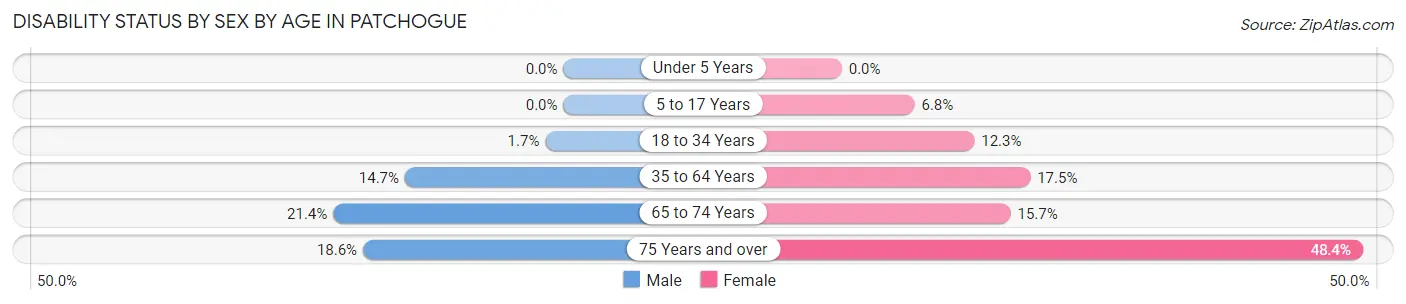
| Age Bracket | Male | Female |
| Under 5 Years | 0 (0.0%) | 0 (0.0%) |
| 5 to 17 Years | 0 (0.0%) | 50 (6.8%) |
| 18 to 34 Years | 28 (1.7%) | 222 (12.3%) |
| 35 to 64 Years | 420 (14.7%) | 476 (17.5%) |
| 65 to 74 Years | 81 (21.4%) | 62 (15.7%) |
| 75 Years and over | 32 (18.6%) | 161 (48.3%) |
Disability Class by Sex by Age in Patchogue
Disability Class: Hearing Difficulty
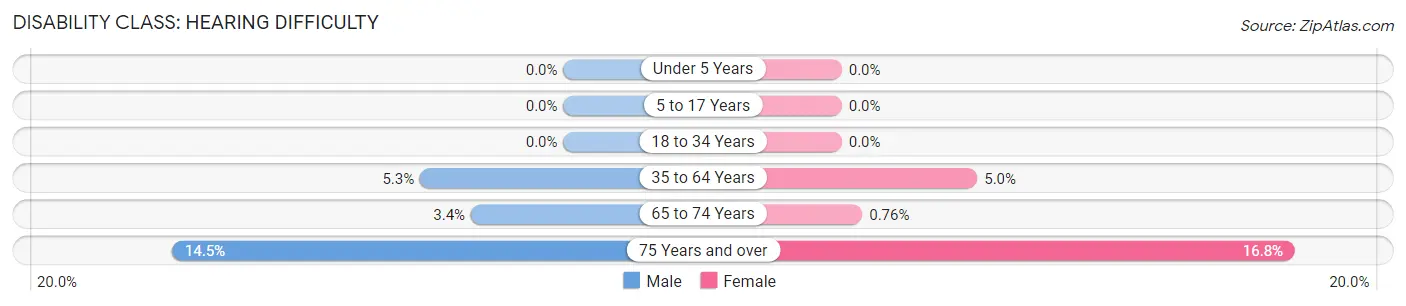
| Age Bracket | Male | Female |
| Under 5 Years | 0 (0.0%) | 0 (0.0%) |
| 5 to 17 Years | 0 (0.0%) | 0 (0.0%) |
| 18 to 34 Years | 0 (0.0%) | 0 (0.0%) |
| 35 to 64 Years | 152 (5.3%) | 137 (5.0%) |
| 65 to 74 Years | 13 (3.4%) | 3 (0.8%) |
| 75 Years and over | 25 (14.5%) | 56 (16.8%) |
Disability Class: Vision Difficulty
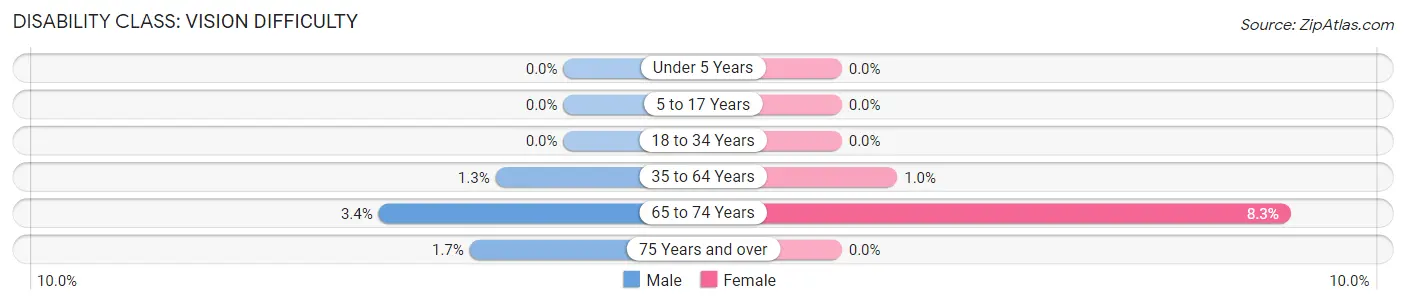
| Age Bracket | Male | Female |
| Under 5 Years | 0 (0.0%) | 0 (0.0%) |
| 5 to 17 Years | 0 (0.0%) | 0 (0.0%) |
| 18 to 34 Years | 0 (0.0%) | 0 (0.0%) |
| 35 to 64 Years | 36 (1.3%) | 28 (1.0%) |
| 65 to 74 Years | 13 (3.4%) | 33 (8.3%) |
| 75 Years and over | 3 (1.7%) | 0 (0.0%) |
Disability Class: Cognitive Difficulty
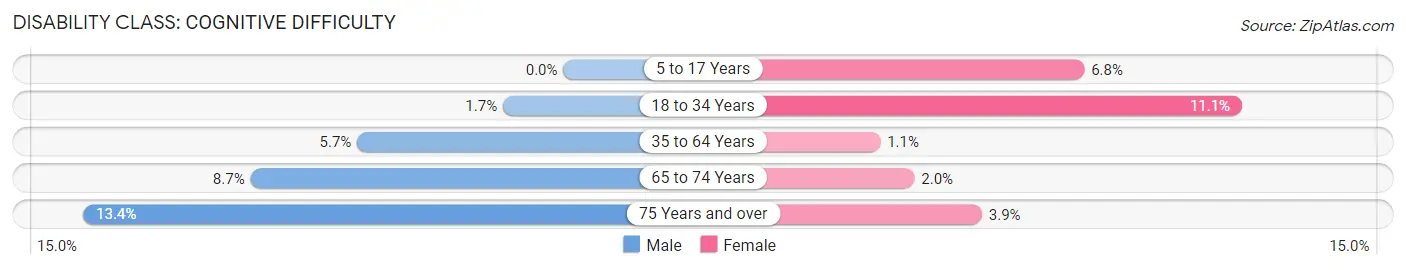
| Age Bracket | Male | Female |
| 5 to 17 Years | 0 (0.0%) | 50 (6.8%) |
| 18 to 34 Years | 28 (1.7%) | 201 (11.1%) |
| 35 to 64 Years | 164 (5.7%) | 29 (1.1%) |
| 65 to 74 Years | 33 (8.7%) | 8 (2.0%) |
| 75 Years and over | 23 (13.4%) | 13 (3.9%) |
Disability Class: Ambulatory Difficulty
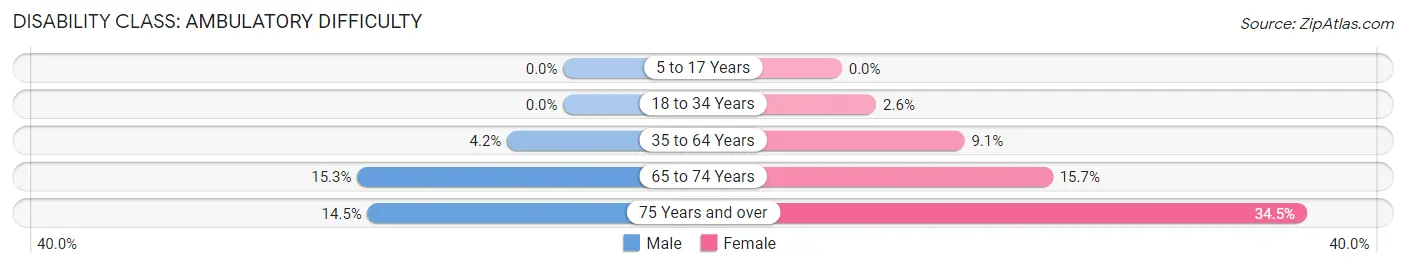
| Age Bracket | Male | Female |
| 5 to 17 Years | 0 (0.0%) | 0 (0.0%) |
| 18 to 34 Years | 0 (0.0%) | 46 (2.5%) |
| 35 to 64 Years | 119 (4.2%) | 248 (9.1%) |
| 65 to 74 Years | 58 (15.3%) | 62 (15.7%) |
| 75 Years and over | 25 (14.5%) | 115 (34.5%) |
Disability Class: Self-Care Difficulty
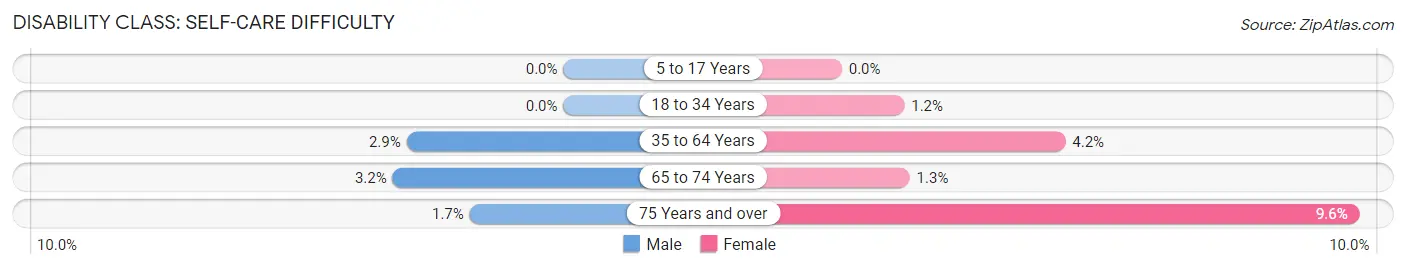
| Age Bracket | Male | Female |
| 5 to 17 Years | 0 (0.0%) | 0 (0.0%) |
| 18 to 34 Years | 0 (0.0%) | 21 (1.2%) |
| 35 to 64 Years | 83 (2.9%) | 113 (4.2%) |
| 65 to 74 Years | 12 (3.2%) | 5 (1.3%) |
| 75 Years and over | 3 (1.7%) | 32 (9.6%) |
Technology Access in Patchogue
Computing Device Access in Patchogue
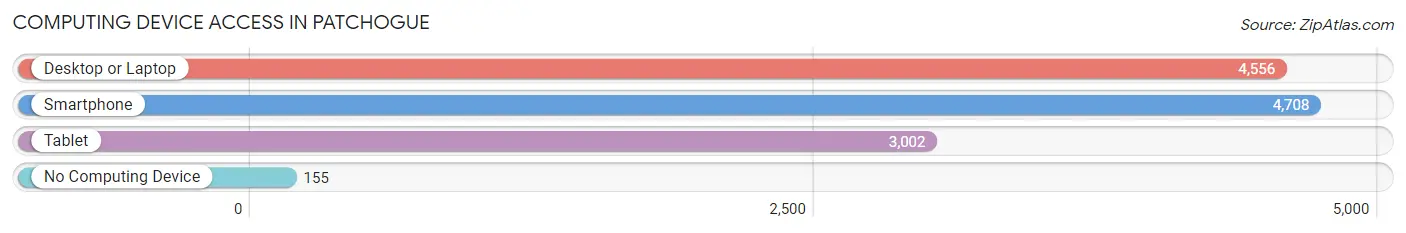
| Device Type | # Households | % Households |
| Desktop or Laptop | 4,556 | 86.5% |
| Smartphone | 4,708 | 89.3% |
| Tablet | 3,002 | 57.0% |
| No Computing Device | 155 | 2.9% |
| Total | 5,269 | 100.0% |
Internet Access in Patchogue
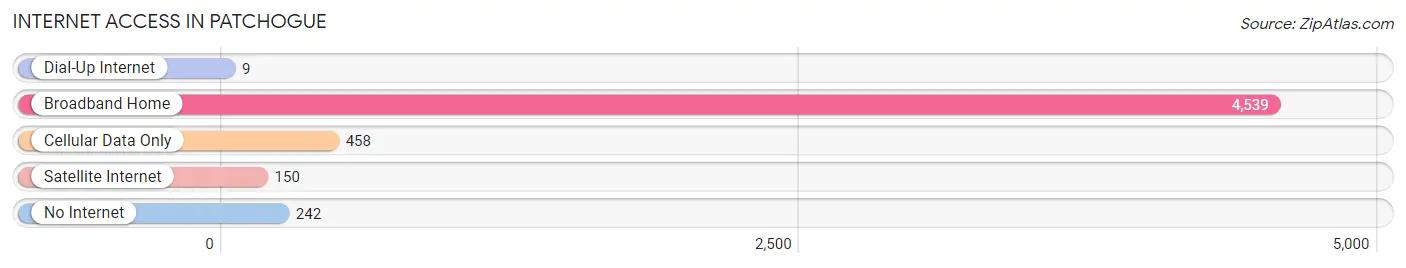
| Internet Type | # Households | % Households |
| Dial-Up Internet | 9 | 0.2% |
| Broadband Home | 4,539 | 86.2% |
| Cellular Data Only | 458 | 8.7% |
| Satellite Internet | 150 | 2.9% |
| No Internet | 242 | 4.6% |
| Total | 5,269 | 100.0% |
Patchogue Summary
Introduction
The village of Patchogue is located in Suffolk County, New York, on the south shore of Long Island. It is a vibrant community with a rich history, diverse geography, and a thriving economy. This paper will explore the history, geography, economy, and demographics of Patchogue in 2000 words.
History
The area now known as Patchogue was originally inhabited by the Secatogue tribe of the Algonquin nation. The first European settlers arrived in the area in 1650, and the village was officially incorporated in 1893. The name “Patchogue” is derived from the Algonquin word “Pachogue,” which means “where the river meets the bay.”
In the late 19th century, Patchogue was a popular resort destination for wealthy New Yorkers. The village was home to several grand hotels, including the Patchogue Hotel, which was built in 1872 and was the largest hotel on Long Island at the time.
In the early 20th century, Patchogue experienced a period of rapid growth and development. The village was home to several factories, including a silk mill, a paper mill, and a shoe factory. The village also had a thriving fishing industry, and was home to several seafood restaurants.
In the 1950s, Patchogue began to experience a decline in its economy. Many of the factories and businesses closed, and the village’s population began to decline. In the late 20th century, the village began to experience a resurgence, and today it is a vibrant community with a thriving economy.
Geography
Patchogue is located on the south shore of Long Island, approximately 60 miles east of New York City. The village is bordered by the Great South Bay to the north, the Patchogue River to the east, and the Fire Island National Seashore to the south.
The village is divided into two distinct areas: the downtown area and the residential area. The downtown area is home to a variety of shops, restaurants, and businesses, as well as the Patchogue Theatre for the Performing Arts. The residential area is home to a variety of single-family homes, townhouses, and apartment buildings.
Economy
Patchogue’s economy is largely driven by tourism, retail, and healthcare. The village is home to several popular tourist attractions, including the Patchogue Theatre for the Performing Arts, the Patchogue-Medford Library, and the Patchogue-Medford Historical Society. The village is also home to a variety of retail stores, restaurants, and businesses.
The village is also home to several healthcare facilities, including the Brookhaven Memorial Hospital Medical Center and the Southside Hospital. The village is also home to several educational institutions, including St. Joseph’s College and Suffolk County Community College.
Demographics
As of the 2010 census, the population of Patchogue was 11,798. The village is home to a diverse population, with a variety of ethnic and racial backgrounds. The largest racial group is White (77.3%), followed by Hispanic or Latino (14.2%), African American (4.2%), and Asian (2.3%).
The median household income in Patchogue is $63,945, and the median home value is $346,400. The village has a high rate of homeownership (76.2%), and the unemployment rate is 4.2%.
Conclusion
Patchogue is a vibrant community with a rich history, diverse geography, and a thriving economy. The village is home to a diverse population, and is a popular tourist destination. The village is also home to several healthcare facilities, educational institutions, and businesses. Patchogue is a great place to live, work, and visit.
Common Questions
What is Per Capita Income in Patchogue?
Per Capita income in Patchogue is $60,363.
What is the Median Family Income in Patchogue?
Median Family Income in Patchogue is $114,902.
What is the Median Household income in Patchogue?
Median Household Income in Patchogue is $99,271.
What is Income or Wage Gap in Patchogue?
Income or Wage Gap in Patchogue is 28.8%.
Women in Patchogue earn 71.2 cents for every dollar earned by a man.
What is Inequality or Gini Index in Patchogue?
Inequality or Gini Index in Patchogue is 0.49.
What is the Total Population of Patchogue?
Total Population of Patchogue is 12,343.
What is the Total Male Population of Patchogue?
Total Male Population of Patchogue is 5,911.
What is the Total Female Population of Patchogue?
Total Female Population of Patchogue is 6,432.
What is the Ratio of Males per 100 Females in Patchogue?
There are 91.90 Males per 100 Females in Patchogue.
What is the Ratio of Females per 100 Males in Patchogue?
There are 108.81 Females per 100 Males in Patchogue.
What is the Median Population Age in Patchogue?
Median Population Age in Patchogue is 37.6 Years.
What is the Average Family Size in Patchogue
Average Family Size in Patchogue is 3.1 People.
What is the Average Household Size in Patchogue
Average Household Size in Patchogue is 2.3 People.
How Large is the Labor Force in Patchogue?
There are 8,144 People in the Labor Forcein in Patchogue.
What is the Percentage of People in the Labor Force in Patchogue?
77.9% of People are in the Labor Force in Patchogue.
What is the Unemployment Rate in Patchogue?
Unemployment Rate in Patchogue is 5.0%.