Cities with the Most Immigrants from Ecuador in Illinois
RELATED REPORTS & OPTIONS
Ecuador
Illinois
Compare Cities
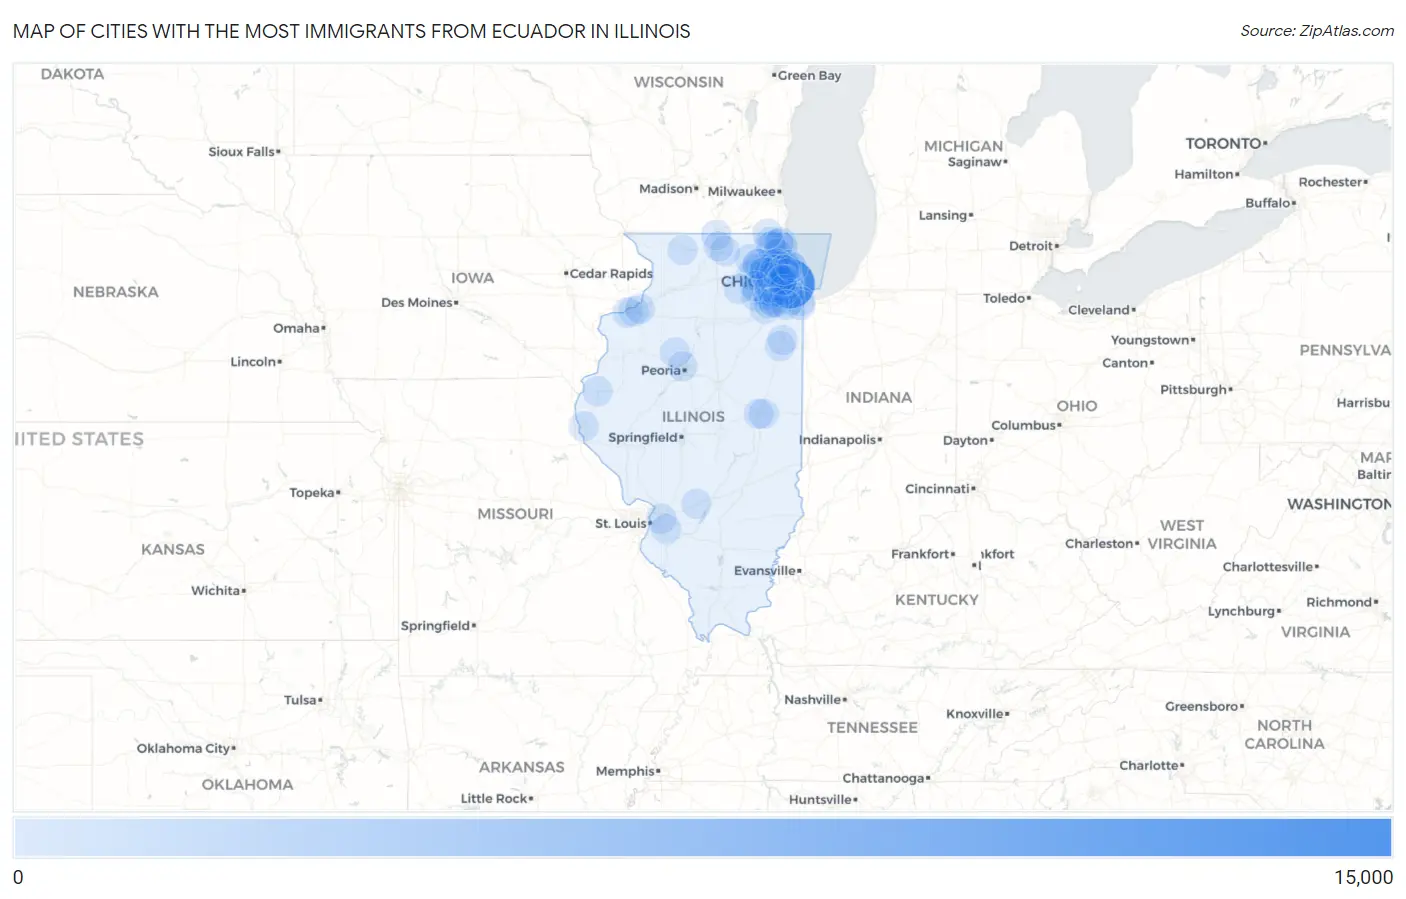
Map of Cities with the Most Immigrants from Ecuador in Illinois
0
15,000
Cities with the Most Immigrants from Ecuador in Illinois
| City | Ecuador | vs State | vs National | |
| 1. | Chicago | 11,340 | 16,844(67.32%)#1 | 480,873(2.36%)#3 |
| 2. | Rosemont | 308 | 16,844(1.83%)#2 | 480,873(0.06%)#174 |
| 3. | Berwyn | 239 | 16,844(1.42%)#3 | 480,873(0.05%)#227 |
| 4. | Romeoville | 228 | 16,844(1.35%)#4 | 480,873(0.05%)#241 |
| 5. | Wheeling | 218 | 16,844(1.29%)#5 | 480,873(0.05%)#255 |
| 6. | Oswego | 192 | 16,844(1.14%)#6 | 480,873(0.04%)#288 |
| 7. | Cicero | 181 | 16,844(1.07%)#7 | 480,873(0.04%)#304 |
| 8. | Aurora | 155 | 16,844(0.92%)#8 | 480,873(0.03%)#351 |
| 9. | Waukegan | 155 | 16,844(0.92%)#9 | 480,873(0.03%)#353 |
| 10. | North Chicago | 151 | 16,844(0.90%)#10 | 480,873(0.03%)#362 |
| 11. | Hoffman Estates | 150 | 16,844(0.89%)#11 | 480,873(0.03%)#365 |
| 12. | Melrose Park | 144 | 16,844(0.85%)#12 | 480,873(0.03%)#381 |
| 13. | Des Plaines | 136 | 16,844(0.81%)#13 | 480,873(0.03%)#401 |
| 14. | Elmwood Park | 120 | 16,844(0.71%)#14 | 480,873(0.02%)#446 |
| 15. | Naperville | 117 | 16,844(0.69%)#15 | 480,873(0.02%)#453 |
| 16. | East Dundee | 111 | 16,844(0.66%)#16 | 480,873(0.02%)#473 |
| 17. | Addison | 101 | 16,844(0.60%)#17 | 480,873(0.02%)#508 |
| 18. | Carol Stream | 96 | 16,844(0.57%)#18 | 480,873(0.02%)#525 |
| 19. | Palatine | 92 | 16,844(0.55%)#19 | 480,873(0.02%)#538 |
| 20. | Norridge | 90 | 16,844(0.53%)#20 | 480,873(0.02%)#551 |
| 21. | Hanover Park | 89 | 16,844(0.53%)#21 | 480,873(0.02%)#554 |
| 22. | Maywood | 89 | 16,844(0.53%)#22 | 480,873(0.02%)#556 |
| 23. | Midlothian | 89 | 16,844(0.53%)#23 | 480,873(0.02%)#557 |
| 24. | Countryside | 86 | 16,844(0.51%)#24 | 480,873(0.02%)#571 |
| 25. | Round Lake Beach | 84 | 16,844(0.50%)#25 | 480,873(0.02%)#580 |
| 26. | Collinsville | 79 | 16,844(0.47%)#26 | 480,873(0.02%)#604 |
| 27. | Streamwood | 75 | 16,844(0.45%)#27 | 480,873(0.02%)#629 |
| 28. | West Chicago | 69 | 16,844(0.41%)#28 | 480,873(0.01%)#674 |
| 29. | Elgin | 66 | 16,844(0.39%)#29 | 480,873(0.01%)#703 |
| 30. | Itasca | 66 | 16,844(0.39%)#30 | 480,873(0.01%)#710 |
| 31. | Bloomingdale | 65 | 16,844(0.39%)#31 | 480,873(0.01%)#719 |
| 32. | Niles | 58 | 16,844(0.34%)#32 | 480,873(0.01%)#774 |
| 33. | Wheaton | 50 | 16,844(0.30%)#33 | 480,873(0.01%)#857 |
| 34. | Glenview | 50 | 16,844(0.30%)#34 | 480,873(0.01%)#859 |
| 35. | Bolingbrook | 49 | 16,844(0.29%)#35 | 480,873(0.01%)#868 |
| 36. | Burbank | 45 | 16,844(0.27%)#36 | 480,873(0.01%)#918 |
| 37. | Lansing | 45 | 16,844(0.27%)#37 | 480,873(0.01%)#919 |
| 38. | Westmont | 44 | 16,844(0.26%)#38 | 480,873(0.01%)#931 |
| 39. | Franklin Park | 44 | 16,844(0.26%)#39 | 480,873(0.01%)#932 |
| 40. | Harwood Heights | 42 | 16,844(0.25%)#40 | 480,873(0.01%)#977 |
| 41. | Northlake | 39 | 16,844(0.23%)#41 | 480,873(0.01%)#1,022 |
| 42. | Morton Grove | 38 | 16,844(0.23%)#42 | 480,873(0.01%)#1,037 |
| 43. | Grayslake | 38 | 16,844(0.23%)#43 | 480,873(0.01%)#1,040 |
| 44. | Joliet | 37 | 16,844(0.22%)#44 | 480,873(0.01%)#1,048 |
| 45. | Princeville | 37 | 16,844(0.22%)#45 | 480,873(0.01%)#1,067 |
| 46. | Woodridge | 36 | 16,844(0.21%)#46 | 480,873(0.01%)#1,072 |
| 47. | Rolling Meadows | 34 | 16,844(0.20%)#47 | 480,873(0.01%)#1,118 |
| 48. | Willow Springs | 33 | 16,844(0.20%)#48 | 480,873(0.01%)#1,142 |
| 49. | Vernon Hills | 31 | 16,844(0.18%)#49 | 480,873(0.01%)#1,170 |
| 50. | Forest Park | 31 | 16,844(0.18%)#50 | 480,873(0.01%)#1,171 |
| 51. | Urbana | 27 | 16,844(0.16%)#51 | 480,873(0.01%)#1,257 |
| 52. | Moline | 25 | 16,844(0.15%)#52 | 480,873(0.01%)#1,311 |
| 53. | Chebanse | 25 | 16,844(0.15%)#53 | 480,873(0.01%)#1,332 |
| 54. | La Grange | 23 | 16,844(0.14%)#54 | 480,873(0.00%)#1,372 |
| 55. | Schaumburg | 22 | 16,844(0.13%)#55 | 480,873(0.00%)#1,387 |
| 56. | Mount Prospect | 22 | 16,844(0.13%)#56 | 480,873(0.00%)#1,388 |
| 57. | Roselle | 22 | 16,844(0.13%)#57 | 480,873(0.00%)#1,396 |
| 58. | Campton Hills | 22 | 16,844(0.13%)#58 | 480,873(0.00%)#1,403 |
| 59. | Huntley | 21 | 16,844(0.12%)#59 | 480,873(0.00%)#1,430 |
| 60. | Freeport | 21 | 16,844(0.12%)#60 | 480,873(0.00%)#1,432 |
| 61. | Westchester | 21 | 16,844(0.12%)#61 | 480,873(0.00%)#1,435 |
| 62. | Darien | 20 | 16,844(0.12%)#62 | 480,873(0.00%)#1,468 |
| 63. | Oak Park | 19 | 16,844(0.11%)#63 | 480,873(0.00%)#1,489 |
| 64. | Belvidere | 19 | 16,844(0.11%)#64 | 480,873(0.00%)#1,502 |
| 65. | Crest Hill | 19 | 16,844(0.11%)#65 | 480,873(0.00%)#1,505 |
| 66. | Round Lake Park | 19 | 16,844(0.11%)#66 | 480,873(0.00%)#1,518 |
| 67. | Peoria | 18 | 16,844(0.11%)#67 | 480,873(0.00%)#1,530 |
| 68. | Champaign | 18 | 16,844(0.11%)#68 | 480,873(0.00%)#1,531 |
| 69. | Glendale Heights | 18 | 16,844(0.11%)#69 | 480,873(0.00%)#1,541 |
| 70. | Lisle | 18 | 16,844(0.11%)#70 | 480,873(0.00%)#1,544 |
| 71. | Arlington Heights | 17 | 16,844(0.10%)#71 | 480,873(0.00%)#1,580 |
| 72. | River Forest | 17 | 16,844(0.10%)#72 | 480,873(0.00%)#1,604 |
| 73. | Hillside | 16 | 16,844(0.09%)#73 | 480,873(0.00%)#1,656 |
| 74. | Bartlett | 15 | 16,844(0.09%)#74 | 480,873(0.00%)#1,677 |
| 75. | Elk Grove Village | 15 | 16,844(0.09%)#75 | 480,873(0.00%)#1,680 |
| 76. | North Aurora | 15 | 16,844(0.09%)#76 | 480,873(0.00%)#1,689 |
| 77. | Hinckley | 15 | 16,844(0.09%)#77 | 480,873(0.00%)#1,711 |
| 78. | Kankakee | 13 | 16,844(0.08%)#78 | 480,873(0.00%)#1,774 |
| 79. | Elmhurst | 12 | 16,844(0.07%)#79 | 480,873(0.00%)#1,810 |
| 80. | Calumet City | 12 | 16,844(0.07%)#80 | 480,873(0.00%)#1,812 |
| 81. | Homer Glen | 12 | 16,844(0.07%)#81 | 480,873(0.00%)#1,815 |
| 82. | Justice | 12 | 16,844(0.07%)#82 | 480,873(0.00%)#1,825 |
| 83. | South Beloit | 12 | 16,844(0.07%)#83 | 480,873(0.00%)#1,834 |
| 84. | Greenville | 12 | 16,844(0.07%)#84 | 480,873(0.00%)#1,837 |
| 85. | Rock Island | 11 | 16,844(0.07%)#85 | 480,873(0.00%)#1,867 |
| 86. | Oak Lawn | 10 | 16,844(0.06%)#86 | 480,873(0.00%)#1,919 |
| 87. | Wilmette | 10 | 16,844(0.06%)#87 | 480,873(0.00%)#1,930 |
| 88. | Shiloh | 10 | 16,844(0.06%)#88 | 480,873(0.00%)#1,947 |
| 89. | Sleepy Hollow | 10 | 16,844(0.06%)#89 | 480,873(0.00%)#1,968 |
| 90. | Evanston | 9 | 16,844(0.05%)#90 | 480,873(0.00%)#1,987 |
| 91. | Gurnee | 9 | 16,844(0.05%)#91 | 480,873(0.00%)#1,995 |
| 92. | Bellwood | 9 | 16,844(0.05%)#92 | 480,873(0.00%)#2,008 |
| 93. | Carthage | 9 | 16,844(0.05%)#93 | 480,873(0.00%)#2,042 |
| 94. | Tinley Park | 6 | 16,844(0.04%)#94 | 480,873(0.00%)#2,165 |
| 95. | Park Ridge | 6 | 16,844(0.04%)#95 | 480,873(0.00%)#2,168 |
| 96. | Lockport | 6 | 16,844(0.04%)#96 | 480,873(0.00%)#2,174 |
| 97. | East Moline | 6 | 16,844(0.04%)#97 | 480,873(0.00%)#2,176 |
| 98. | Lake Catherine | 6 | 16,844(0.04%)#98 | 480,873(0.00%)#2,202 |
| 99. | Loves Park | 5 | 16,844(0.03%)#99 | 480,873(0.00%)#2,221 |
| 100. | Quincy | 4 | 16,844(0.02%)#100 | 480,873(0.00%)#2,256 |
Common Questions
What are the Top 10 Cities with the Most Immigrants from Ecuador in Illinois?
Top 10 Cities with the Most Immigrants from Ecuador in Illinois are:
#1
11,340
#2
308
#3
239
#4
228
#5
218
#6
192
#7
181
#8
155
#9
155
#10
151
What city has the Most Immigrants from Ecuador in Illinois?
Chicago has the Most Immigrants from Ecuador in Illinois with 11,340.
What is the Total Immigrants from Ecuador in the State of Illinois?
Total Immigrants from Ecuador in Illinois is 16,844.
What is the Total Immigrants from Ecuador in the United States?
Total Immigrants from Ecuador in the United States is 480,873.