Thornwood, NY Map & Demographics
Thornwood Map
Thornwood Overview
$66,607
PER CAPITA INCOME
$207,386
AVG FAMILY INCOME
$163,571
AVG HOUSEHOLD INCOME
40.8%
WAGE / INCOME GAP [ % ]
59.2¢/ $1
WAGE / INCOME GAP [ $ ]
0.41
INEQUALITY / GINI INDEX
4,396
TOTAL POPULATION
2,200
MALE POPULATION
2,196
FEMALE POPULATION
100.18
MALES / 100 FEMALES
99.82
FEMALES / 100 MALES
37.9
MEDIAN AGE
3.5
AVG FAMILY SIZE
3.0
AVG HOUSEHOLD SIZE
2,428
LABOR FORCE [ PEOPLE ]
68.6%
PERCENT IN LABOR FORCE
1.3%
UNEMPLOYMENT RATE
Thornwood Zip Codes
Thornwood Area Codes
Income in Thornwood
Income Overview in Thornwood
Per Capita Income in Thornwood is $66,607, while median incomes of families and households are $207,386 and $163,571 respectively.
| Characteristic | Number | Measure |
| Per Capita Income | 4,396 | $66,607 |
| Median Family Income | 1,097 | $207,386 |
| Mean Family Income | 1,097 | $231,242 |
| Median Household Income | 1,428 | $163,571 |
| Mean Household Income | 1,428 | $199,467 |
| Income Deficit | 1,097 | $0 |
| Wage / Income Gap (%) | 4,396 | 40.77% |
| Wage / Income Gap ($) | 4,396 | 59.23¢ per $1 |
| Gini / Inequality Index | 4,396 | 0.41 |
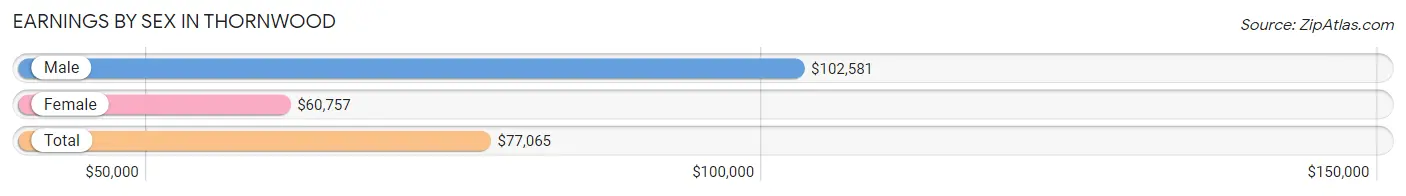
Earnings by Sex in Thornwood
Average Earnings in Thornwood are $77,065, $102,581 for men and $60,757 for women, a difference of 40.8%.
| Sex | Number | Average Earnings |
| Male | 1,276 (51.4%) | $102,581 |
| Female | 1,208 (48.6%) | $60,757 |
| Total | 2,484 (100.0%) | $77,065 |
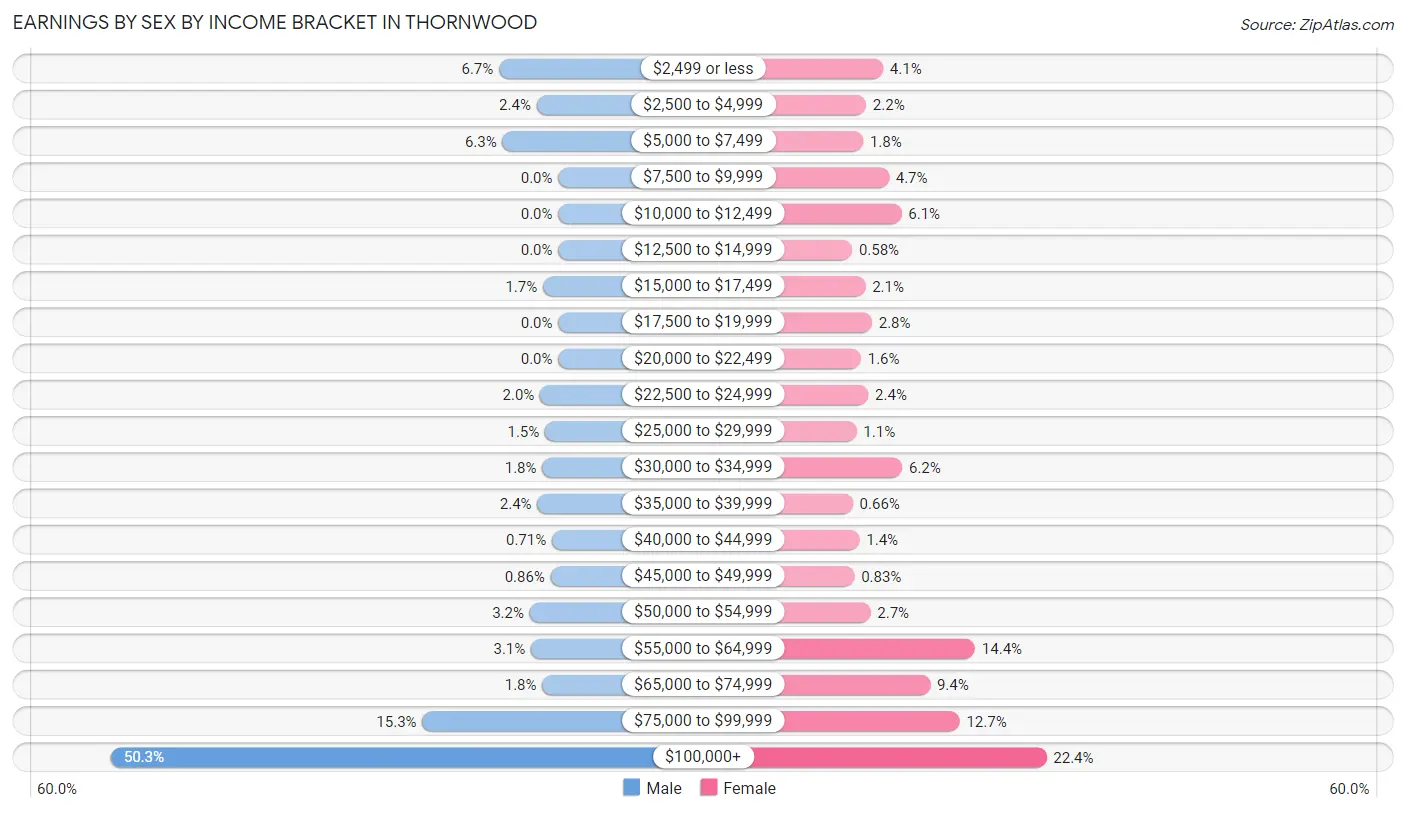
Earnings by Sex by Income Bracket in Thornwood
The most common earnings brackets in Thornwood are $100,000+ for men (642 | 50.3%) and $100,000+ for women (271 | 22.4%).
| Income | Male | Female |
| $2,499 or less | 85 (6.7%) | 49 (4.1%) |
| $2,500 to $4,999 | 31 (2.4%) | 26 (2.1%) |
| $5,000 to $7,499 | 80 (6.3%) | 22 (1.8%) |
| $7,500 to $9,999 | 0 (0.0%) | 57 (4.7%) |
| $10,000 to $12,499 | 0 (0.0%) | 74 (6.1%) |
| $12,500 to $14,999 | 0 (0.0%) | 7 (0.6%) |
| $15,000 to $17,499 | 22 (1.7%) | 25 (2.1%) |
| $17,500 to $19,999 | 0 (0.0%) | 34 (2.8%) |
| $20,000 to $22,499 | 0 (0.0%) | 19 (1.6%) |
| $22,500 to $24,999 | 26 (2.0%) | 29 (2.4%) |
| $25,000 to $29,999 | 19 (1.5%) | 13 (1.1%) |
| $30,000 to $34,999 | 23 (1.8%) | 75 (6.2%) |
| $35,000 to $39,999 | 30 (2.4%) | 8 (0.7%) |
| $40,000 to $44,999 | 9 (0.7%) | 17 (1.4%) |
| $45,000 to $49,999 | 11 (0.9%) | 10 (0.8%) |
| $50,000 to $54,999 | 41 (3.2%) | 32 (2.6%) |
| $55,000 to $64,999 | 39 (3.1%) | 174 (14.4%) |
| $65,000 to $74,999 | 23 (1.8%) | 113 (9.3%) |
| $75,000 to $99,999 | 195 (15.3%) | 153 (12.7%) |
| $100,000+ | 642 (50.3%) | 271 (22.4%) |
| Total | 1,276 (100.0%) | 1,208 (100.0%) |
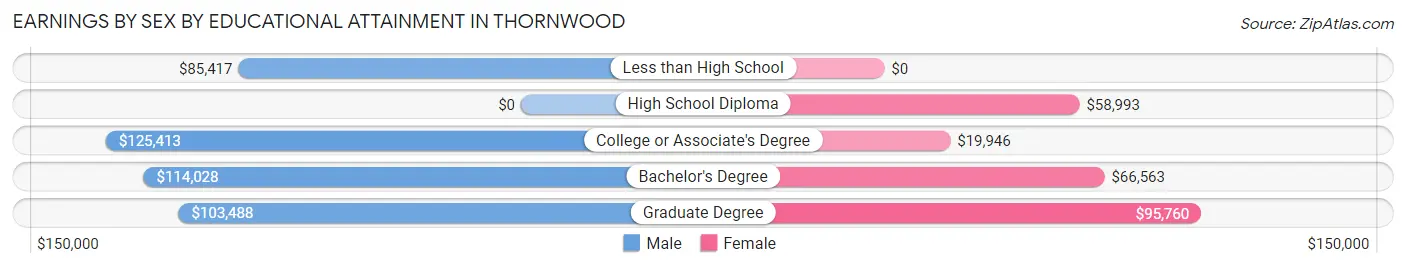
Earnings by Sex by Educational Attainment in Thornwood
Average earnings in Thornwood are $104,002 for men and $66,033 for women, a difference of 36.5%. Men with an educational attainment of college or associate's degree enjoy the highest average annual earnings of $125,413, while those with less than high school education earn the least with $85,417. Women with an educational attainment of graduate degree earn the most with the average annual earnings of $95,760, while those with college or associate's degree education have the smallest earnings of $19,946.
| Educational Attainment | Male Income | Female Income |
| Less than High School | $85,417 | $0 |
| High School Diploma | - | - |
| College or Associate's Degree | $125,413 | $19,946 |
| Bachelor's Degree | $114,028 | $66,563 |
| Graduate Degree | $103,488 | $95,760 |
| Total | $104,002 | $66,033 |
Family Income in Thornwood
Family Income Brackets in Thornwood
According to the Thornwood family income data, there are 578 families falling into the $200,000+ income range, which is the most common income bracket and makes up 52.7% of all families.

| Income Bracket | # Families | % Families |
| Less than $10,000 | 9 | 0.8% |
| $10,000 to $14,999 | 0 | 0.0% |
| $15,000 to $24,999 | 25 | 2.3% |
| $25,000 to $34,999 | 0 | 0.0% |
| $35,000 to $49,999 | 33 | 3.0% |
| $50,000 to $74,999 | 83 | 7.6% |
| $75,000 to $99,999 | 98 | 8.9% |
| $100,000 to $149,999 | 131 | 11.9% |
| $150,000 to $199,999 | 140 | 12.8% |
| $200,000+ | 578 | 52.7% |
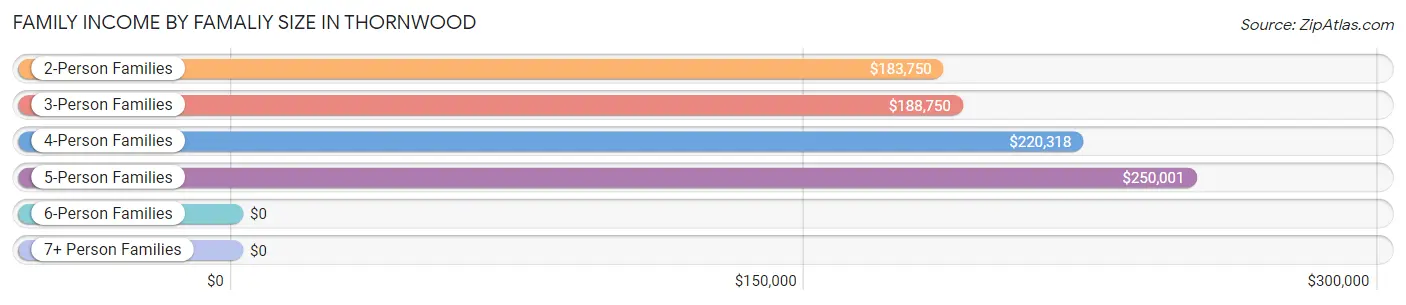
Family Income by Famaliy Size in Thornwood
5-person families (117 | 10.7%) account for the highest median family income in Thornwood with $250,001 per family, while 2-person families (391 | 35.6%) have the highest median income of $91,875 per family member.
| Income Bracket | # Families | Median Income |
| 2-Person Families | 391 (35.6%) | $183,750 |
| 3-Person Families | 188 (17.1%) | $188,750 |
| 4-Person Families | 362 (33.0%) | $220,318 |
| 5-Person Families | 117 (10.7%) | $250,001 |
| 6-Person Families | 9 (0.8%) | $0 |
| 7+ Person Families | 30 (2.7%) | $0 |
| Total | 1,097 (100.0%) | $207,386 |
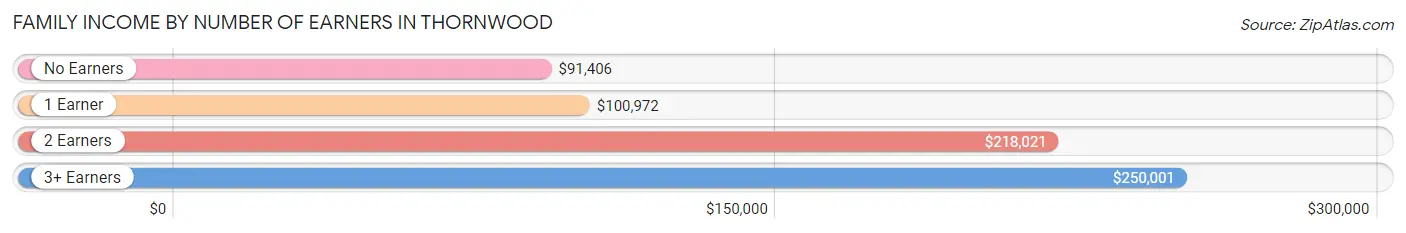
Family Income by Number of Earners in Thornwood
The median family income in Thornwood is $207,386, with families comprising 3+ earners (190) having the highest median family income of $250,001, while families with no earners (125) have the lowest median family income of $91,406, accounting for 17.3% and 11.4% of families, respectively.
| Number of Earners | # Families | Median Income |
| No Earners | 125 (11.4%) | $91,406 |
| 1 Earner | 163 (14.9%) | $100,972 |
| 2 Earners | 619 (56.4%) | $218,021 |
| 3+ Earners | 190 (17.3%) | $250,001 |
| Total | 1,097 (100.0%) | $207,386 |
Household Income in Thornwood
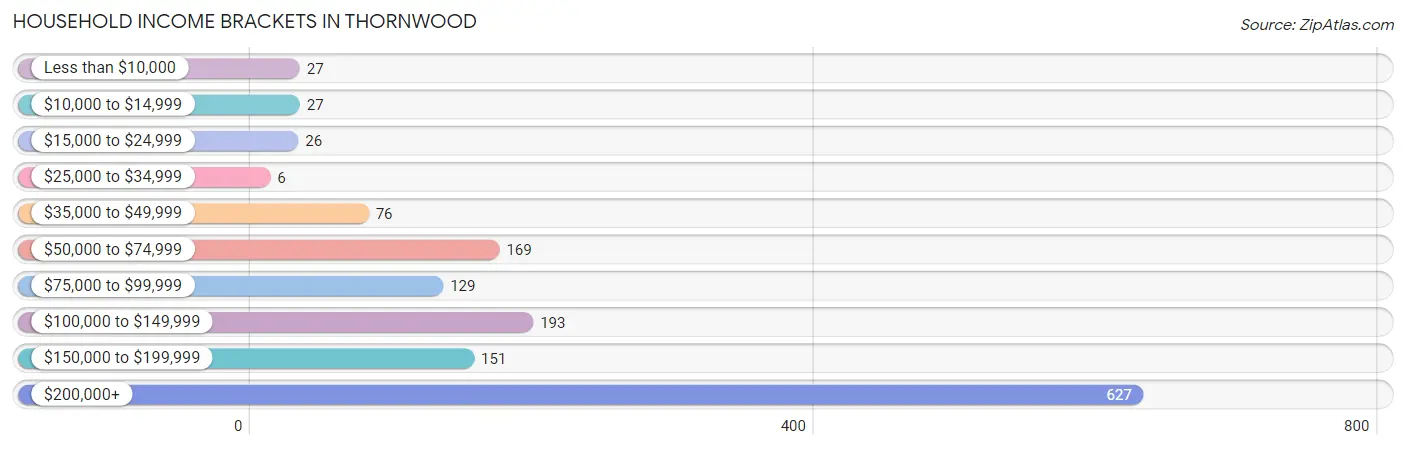
Household Income Brackets in Thornwood
With 627 households falling in the category, the $200,000+ income range is the most frequent in Thornwood, accounting for 43.9% of all households. In contrast, only 6 households (0.4%) fall into the $25,000 to $34,999 income bracket, making it the least populous group.
| Income Bracket | # Households | % Households |
| Less than $10,000 | 27 | 1.9% |
| $10,000 to $14,999 | 27 | 1.9% |
| $15,000 to $24,999 | 26 | 1.8% |
| $25,000 to $34,999 | 6 | 0.4% |
| $35,000 to $49,999 | 76 | 5.3% |
| $50,000 to $74,999 | 169 | 11.8% |
| $75,000 to $99,999 | 129 | 9.0% |
| $100,000 to $149,999 | 193 | 13.5% |
| $150,000 to $199,999 | 151 | 10.6% |
| $200,000+ | 627 | 43.9% |
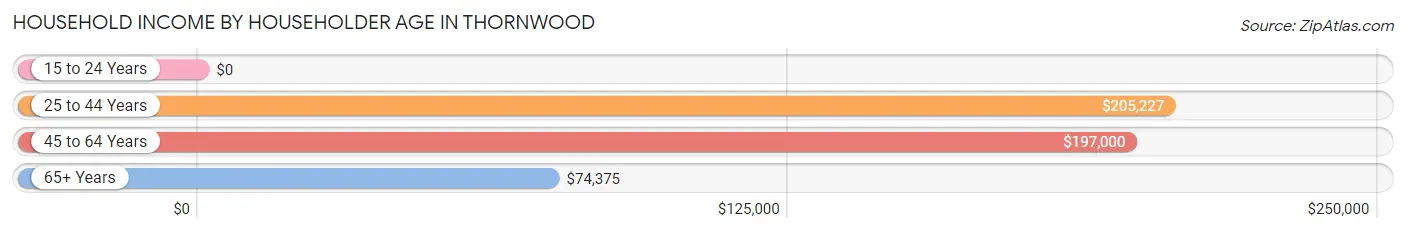
Household Income by Householder Age in Thornwood
The median household income in Thornwood is $163,571, with the highest median household income of $205,227 found in the 25 to 44 years age bracket for the primary householder. A total of 440 households (30.8%) fall into this category.
| Income Bracket | # Households | Median Income |
| 15 to 24 Years | 0 (0.0%) | $0 |
| 25 to 44 Years | 440 (30.8%) | $205,227 |
| 45 to 64 Years | 600 (42.0%) | $197,000 |
| 65+ Years | 388 (27.2%) | $74,375 |
| Total | 1,428 (100.0%) | $163,571 |
Poverty in Thornwood
Income Below Poverty by Sex and Age in Thornwood
With 2.5% poverty level for males and 7.2% for females among the residents of Thornwood, 45 to 54 year old males and 55 to 64 year old females are the most vulnerable to poverty, with 27 males (8.7%) and 132 females (37.3%) in their respective age groups living below the poverty level.
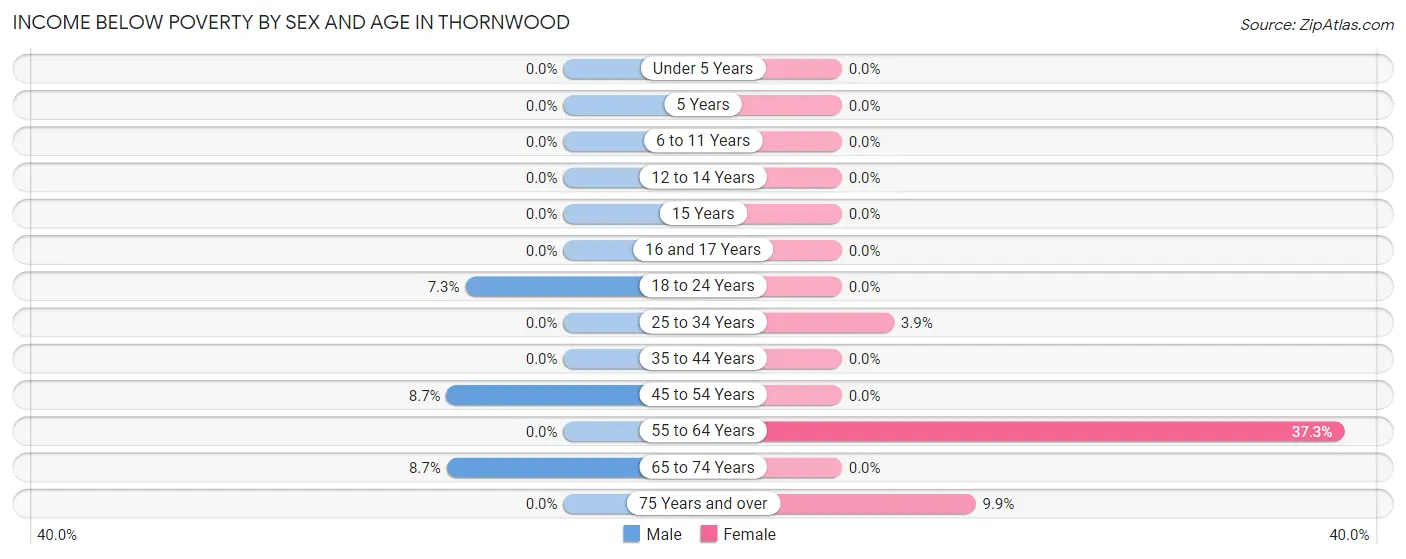
| Age Bracket | Male | Female |
| Under 5 Years | 0 (0.0%) | 0 (0.0%) |
| 5 Years | 0 (0.0%) | 0 (0.0%) |
| 6 to 11 Years | 0 (0.0%) | 0 (0.0%) |
| 12 to 14 Years | 0 (0.0%) | 0 (0.0%) |
| 15 Years | 0 (0.0%) | 0 (0.0%) |
| 16 and 17 Years | 0 (0.0%) | 0 (0.0%) |
| 18 to 24 Years | 11 (7.3%) | 0 (0.0%) |
| 25 to 34 Years | 0 (0.0%) | 11 (3.9%) |
| 35 to 44 Years | 0 (0.0%) | 0 (0.0%) |
| 45 to 54 Years | 27 (8.7%) | 0 (0.0%) |
| 55 to 64 Years | 0 (0.0%) | 132 (37.3%) |
| 65 to 74 Years | 17 (8.7%) | 0 (0.0%) |
| 75 Years and over | 0 (0.0%) | 15 (9.9%) |
| Total | 55 (2.5%) | 158 (7.2%) |
Income Above Poverty by Sex and Age in Thornwood
According to the poverty statistics in Thornwood, males aged under 5 years and females aged under 5 years are the age groups that are most secure financially, with 100.0% of males and 100.0% of females in these age groups living above the poverty line.
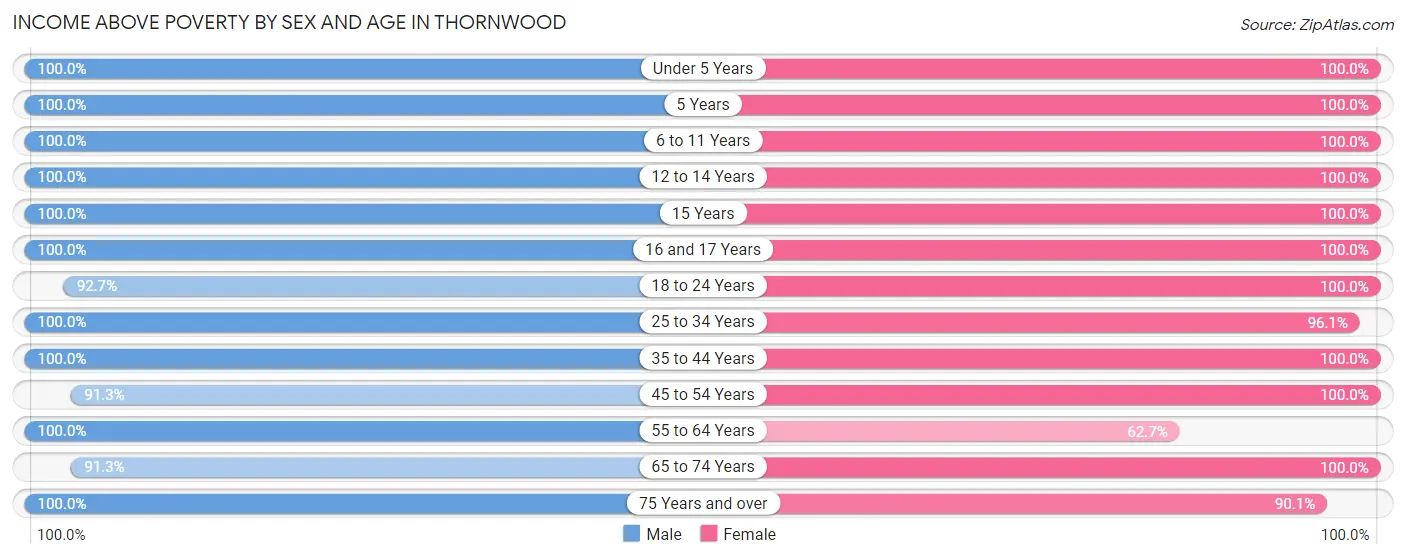
| Age Bracket | Male | Female |
| Under 5 Years | 146 (100.0%) | 183 (100.0%) |
| 5 Years | 155 (100.0%) | 17 (100.0%) |
| 6 to 11 Years | 98 (100.0%) | 59 (100.0%) |
| 12 to 14 Years | 99 (100.0%) | 50 (100.0%) |
| 15 Years | 11 (100.0%) | 38 (100.0%) |
| 16 and 17 Years | 54 (100.0%) | 62 (100.0%) |
| 18 to 24 Years | 140 (92.7%) | 222 (100.0%) |
| 25 to 34 Years | 187 (100.0%) | 273 (96.1%) |
| 35 to 44 Years | 369 (100.0%) | 274 (100.0%) |
| 45 to 54 Years | 284 (91.3%) | 298 (100.0%) |
| 55 to 64 Years | 304 (100.0%) | 222 (62.7%) |
| 65 to 74 Years | 179 (91.3%) | 191 (100.0%) |
| 75 Years and over | 107 (100.0%) | 136 (90.1%) |
| Total | 2,133 (97.5%) | 2,025 (92.8%) |
Income Below Poverty Among Married-Couple Families in Thornwood
The poverty statistics for married-couple families in Thornwood show that 1.7% or 17 of the total 1,016 families live below the poverty line. Families with no children have the highest poverty rate of 3.2%, comprising of 17 families. On the other hand, families with 1 or 2 children have the lowest poverty rate of 0.0%, which includes 0 families.
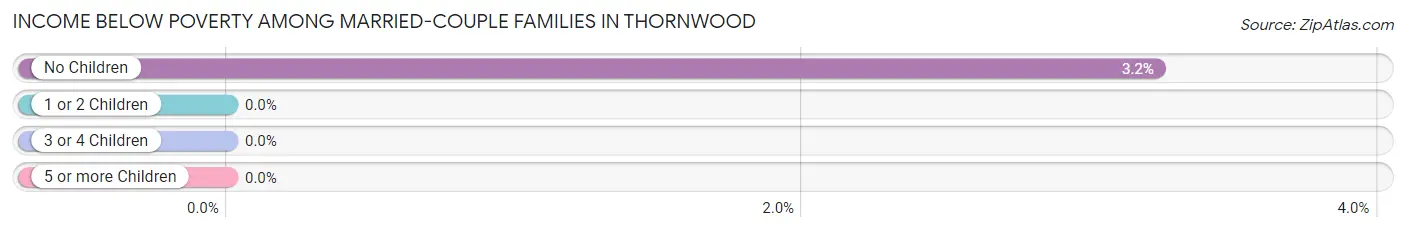
| Children | Above Poverty | Below Poverty |
| No Children | 509 (96.8%) | 17 (3.2%) |
| 1 or 2 Children | 461 (100.0%) | 0 (0.0%) |
| 3 or 4 Children | 11 (100.0%) | 0 (0.0%) |
| 5 or more Children | 18 (100.0%) | 0 (0.0%) |
| Total | 999 (98.3%) | 17 (1.7%) |
Income Below Poverty Among Single-Parent Households in Thornwood
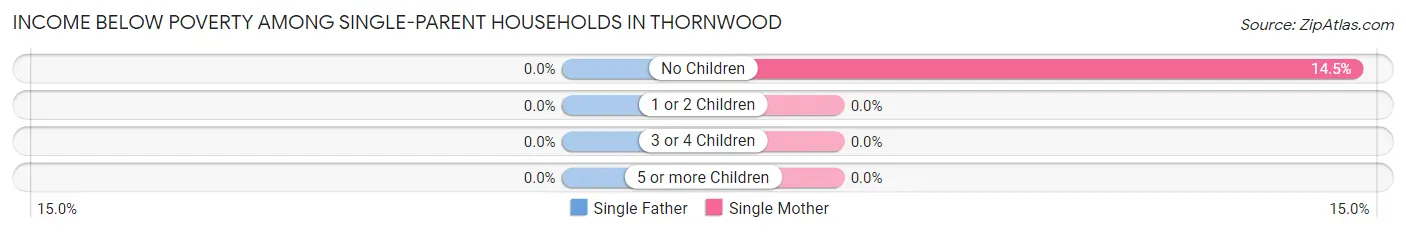
| Children | Single Father | Single Mother |
| No Children | 0 (0.0%) | 9 (14.5%) |
| 1 or 2 Children | 0 (0.0%) | 0 (0.0%) |
| 3 or 4 Children | 0 (0.0%) | 0 (0.0%) |
| 5 or more Children | 0 (0.0%) | 0 (0.0%) |
| Total | 0 (0.0%) | 9 (11.1%) |
Income Below Poverty Among Married-Couple vs Single-Parent Households in Thornwood
The poverty data for Thornwood shows that 17 of the married-couple family households (1.7%) and 9 of the single-parent households (11.1%) are living below the poverty level. Within the married-couple family households, those with no children have the highest poverty rate, with 17 households (3.2%) falling below the poverty line. Among the single-parent households, those with no children have the highest poverty rate, with 9 household (14.5%) living below poverty.
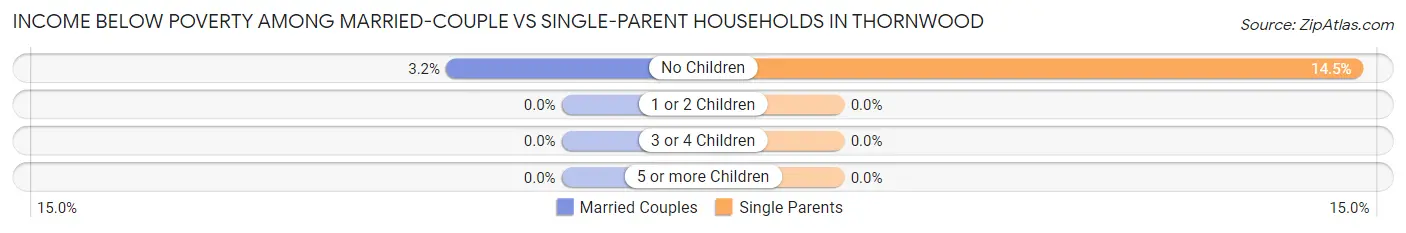
| Children | Married-Couple Families | Single-Parent Households |
| No Children | 17 (3.2%) | 9 (14.5%) |
| 1 or 2 Children | 0 (0.0%) | 0 (0.0%) |
| 3 or 4 Children | 0 (0.0%) | 0 (0.0%) |
| 5 or more Children | 0 (0.0%) | 0 (0.0%) |
| Total | 17 (1.7%) | 9 (11.1%) |
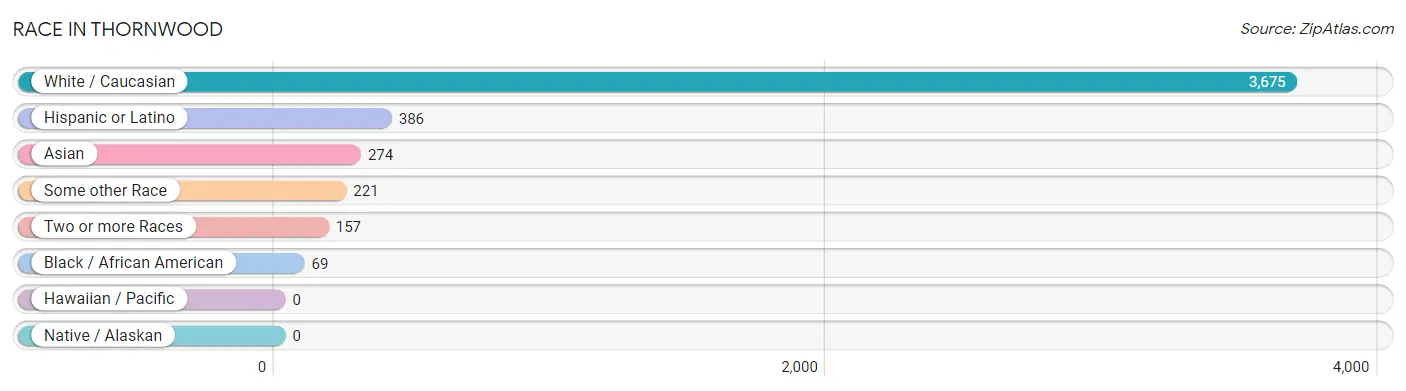
Race in Thornwood
The most populous races in Thornwood are White / Caucasian (3,675 | 83.6%), Hispanic or Latino (386 | 8.8%), and Asian (274 | 6.2%).
| Race | # Population | % Population |
| Asian | 274 | 6.2% |
| Black / African American | 69 | 1.6% |
| Hawaiian / Pacific | 0 | 0.0% |
| Hispanic or Latino | 386 | 8.8% |
| Native / Alaskan | 0 | 0.0% |
| White / Caucasian | 3,675 | 83.6% |
| Two or more Races | 157 | 3.6% |
| Some other Race | 221 | 5.0% |
| Total | 4,396 | 100.0% |
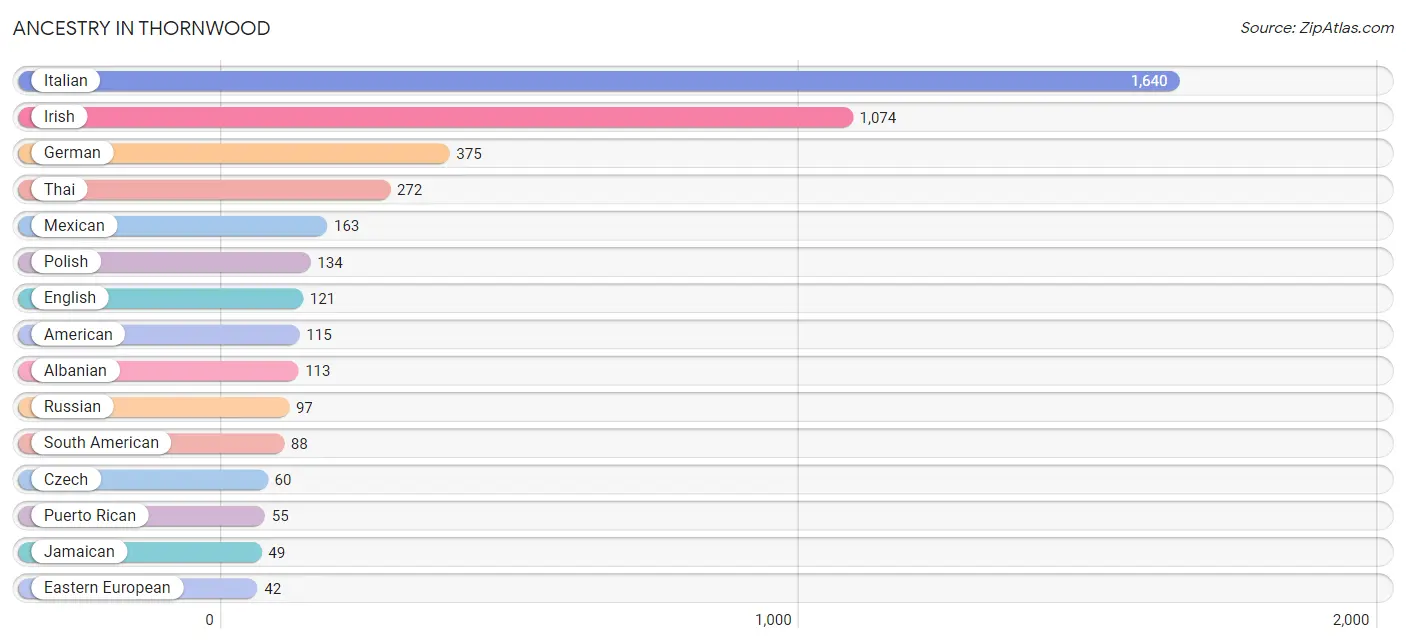
Ancestry in Thornwood
The most populous ancestries reported in Thornwood are Italian (1,640 | 37.3%), Irish (1,074 | 24.4%), German (375 | 8.5%), Thai (272 | 6.2%), and Mexican (163 | 3.7%), together accounting for 80.2% of all Thornwood residents.
| Ancestry | # Population | % Population |
| African | 11 | 0.3% |
| Albanian | 113 | 2.6% |
| American | 115 | 2.6% |
| Arab | 21 | 0.5% |
| Austrian | 16 | 0.4% |
| Belgian | 33 | 0.7% |
| Brazilian | 12 | 0.3% |
| Celtic | 9 | 0.2% |
| Central American | 9 | 0.2% |
| Colombian | 22 | 0.5% |
| Cuban | 21 | 0.5% |
| Czech | 60 | 1.4% |
| Dutch | 16 | 0.4% |
| Eastern European | 42 | 1.0% |
| Ecuadorian | 40 | 0.9% |
| English | 121 | 2.8% |
| European | 37 | 0.8% |
| Finnish | 7 | 0.2% |
| French | 10 | 0.2% |
| French Canadian | 26 | 0.6% |
| German | 375 | 8.5% |
| Greek | 14 | 0.3% |
| Guatemalan | 9 | 0.2% |
| Hungarian | 27 | 0.6% |
| Indian (Asian) | 9 | 0.2% |
| Iraqi | 21 | 0.5% |
| Irish | 1,074 | 24.4% |
| Italian | 1,640 | 37.3% |
| Jamaican | 49 | 1.1% |
| Lithuanian | 9 | 0.2% |
| Mexican | 163 | 3.7% |
| Northern European | 9 | 0.2% |
| Norwegian | 15 | 0.3% |
| Peruvian | 26 | 0.6% |
| Polish | 134 | 3.0% |
| Portuguese | 33 | 0.7% |
| Puerto Rican | 55 | 1.3% |
| Romanian | 12 | 0.3% |
| Russian | 97 | 2.2% |
| Scottish | 24 | 0.5% |
| Slovak | 6 | 0.1% |
| South American | 88 | 2.0% |
| Spaniard | 12 | 0.3% |
| Subsaharan African | 11 | 0.3% |
| Thai | 272 | 6.2% |
| Ukrainian | 8 | 0.2% | View All 46 Rows |
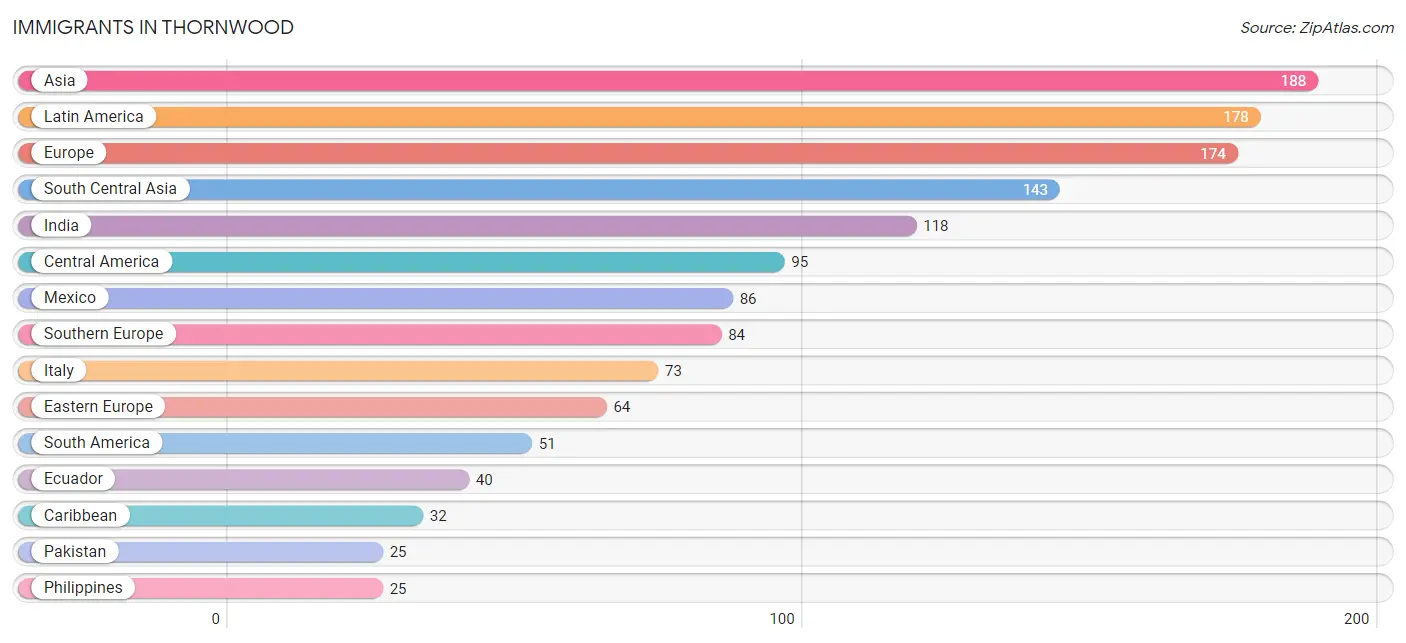
Immigrants in Thornwood
The most numerous immigrant groups reported in Thornwood came from Asia (188 | 4.3%), Latin America (178 | 4.1%), Europe (174 | 4.0%), South Central Asia (143 | 3.3%), and India (118 | 2.7%), together accounting for 18.2% of all Thornwood residents.
| Immigration Origin | # Population | % Population |
| Asia | 188 | 4.3% |
| Canada | 9 | 0.2% |
| Caribbean | 32 | 0.7% |
| Central America | 95 | 2.2% |
| China | 9 | 0.2% |
| Colombia | 11 | 0.3% |
| Cuba | 21 | 0.5% |
| Eastern Asia | 9 | 0.2% |
| Eastern Europe | 64 | 1.5% |
| Ecuador | 40 | 0.9% |
| Europe | 174 | 4.0% |
| Guatemala | 9 | 0.2% |
| Hong Kong | 9 | 0.2% |
| India | 118 | 2.7% |
| Ireland | 21 | 0.5% |
| Italy | 73 | 1.7% |
| Jamaica | 11 | 0.3% |
| Kuwait | 11 | 0.3% |
| Latin America | 178 | 4.1% |
| Mexico | 86 | 2.0% |
| Netherlands | 5 | 0.1% |
| Northern Europe | 21 | 0.5% |
| Pakistan | 25 | 0.6% |
| Philippines | 25 | 0.6% |
| Portugal | 11 | 0.3% |
| Russia | 9 | 0.2% |
| South America | 51 | 1.2% |
| South Central Asia | 143 | 3.3% |
| South Eastern Asia | 25 | 0.6% |
| Southern Europe | 84 | 1.9% |
| Western Asia | 11 | 0.3% |
| Western Europe | 5 | 0.1% | View All 32 Rows |
Sex and Age in Thornwood
Sex and Age in Thornwood
The most populous age groups in Thornwood are 35 to 39 Years (316 | 14.4%) for men and 35 to 39 Years (198 | 9.0%) for women.
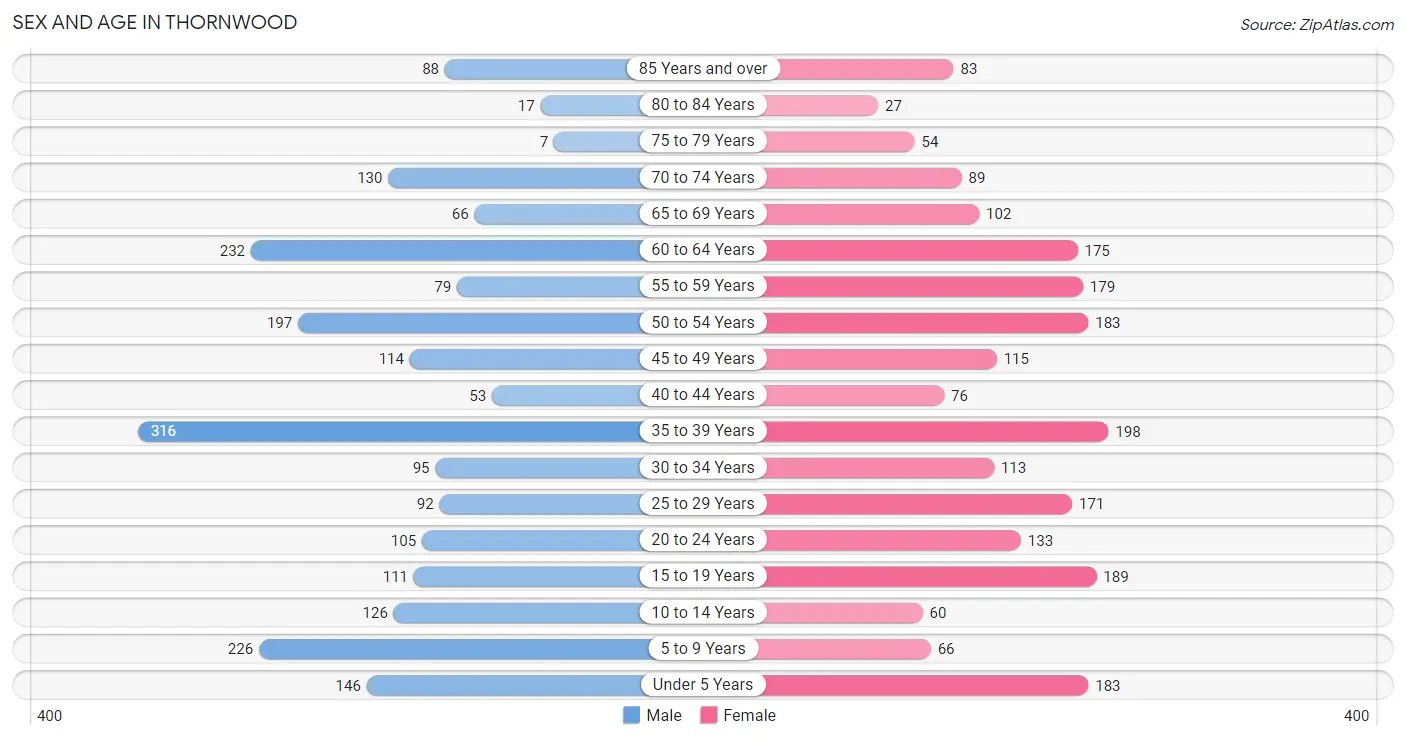
| Age Bracket | Male | Female |
| Under 5 Years | 146 (6.6%) | 183 (8.3%) |
| 5 to 9 Years | 226 (10.3%) | 66 (3.0%) |
| 10 to 14 Years | 126 (5.7%) | 60 (2.7%) |
| 15 to 19 Years | 111 (5.1%) | 189 (8.6%) |
| 20 to 24 Years | 105 (4.8%) | 133 (6.1%) |
| 25 to 29 Years | 92 (4.2%) | 171 (7.8%) |
| 30 to 34 Years | 95 (4.3%) | 113 (5.1%) |
| 35 to 39 Years | 316 (14.4%) | 198 (9.0%) |
| 40 to 44 Years | 53 (2.4%) | 76 (3.5%) |
| 45 to 49 Years | 114 (5.2%) | 115 (5.2%) |
| 50 to 54 Years | 197 (8.9%) | 183 (8.3%) |
| 55 to 59 Years | 79 (3.6%) | 179 (8.2%) |
| 60 to 64 Years | 232 (10.5%) | 175 (8.0%) |
| 65 to 69 Years | 66 (3.0%) | 102 (4.6%) |
| 70 to 74 Years | 130 (5.9%) | 89 (4.1%) |
| 75 to 79 Years | 7 (0.3%) | 54 (2.5%) |
| 80 to 84 Years | 17 (0.8%) | 27 (1.2%) |
| 85 Years and over | 88 (4.0%) | 83 (3.8%) |
| Total | 2,200 (100.0%) | 2,196 (100.0%) |
Families and Households in Thornwood
Median Family Size in Thornwood
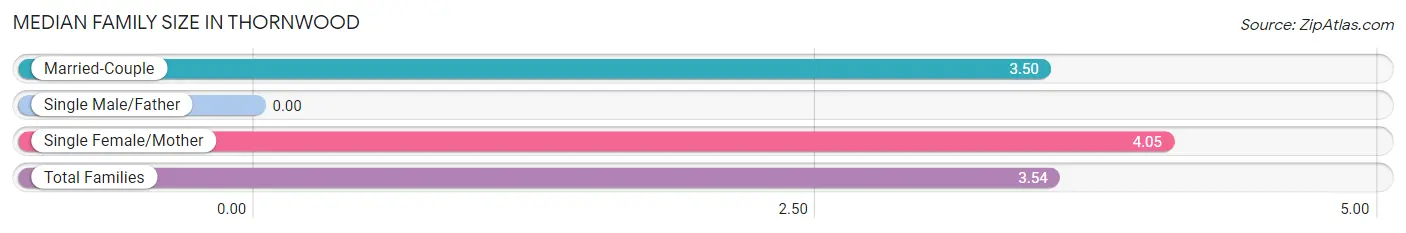
| Family Type | # Families | Family Size |
| Married-Couple | 1,016 (92.6%) | 3.50 |
| Single Male/Father | 0 (0.0%) | - |
| Single Female/Mother | 81 (7.4%) | 4.05 |
| Total Families | 1,097 (100.0%) | 3.54 |
Median Household Size in Thornwood
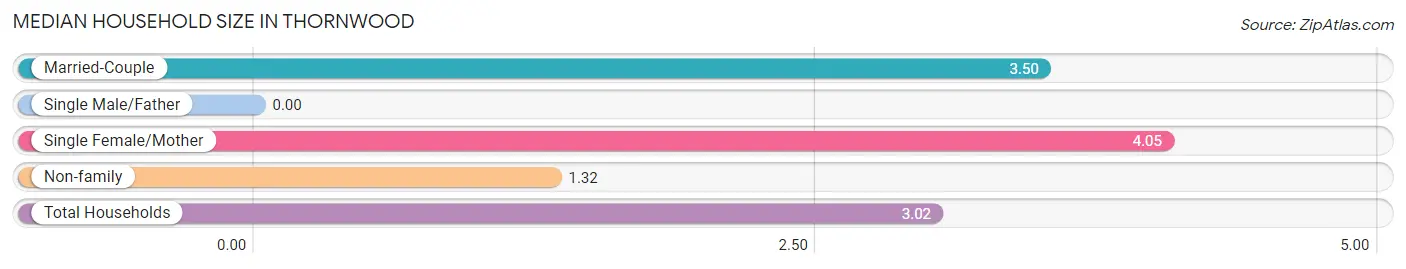
| Household Type | # Households | Household Size |
| Married-Couple | 1,016 (71.2%) | 3.50 |
| Single Male/Father | 0 (0.0%) | - |
| Single Female/Mother | 81 (5.7%) | 4.05 |
| Non-family | 331 (23.2%) | 1.32 |
| Total Households | 1,428 (100.0%) | 3.02 |
Household Size by Marriage Status in Thornwood
Out of a total of 1,428 households in Thornwood, 1,097 (76.8%) are family households, while 331 (23.2%) are nonfamily households. The most numerous type of family households are 2-person households, comprising 391, and the most common type of nonfamily households are 1-person households, comprising 248.
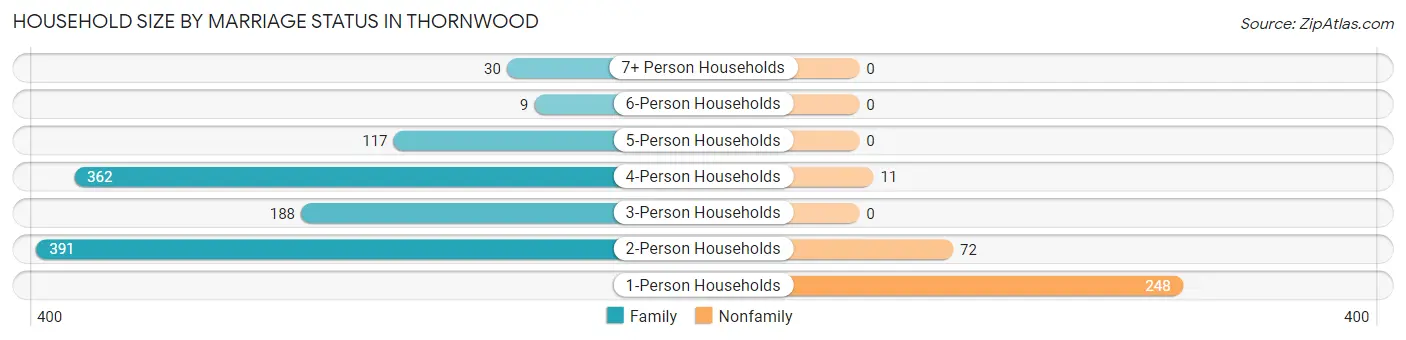
| Household Size | Family Households | Nonfamily Households |
| 1-Person Households | - | 248 (17.4%) |
| 2-Person Households | 391 (27.4%) | 72 (5.0%) |
| 3-Person Households | 188 (13.2%) | 0 (0.0%) |
| 4-Person Households | 362 (25.4%) | 11 (0.8%) |
| 5-Person Households | 117 (8.2%) | 0 (0.0%) |
| 6-Person Households | 9 (0.6%) | 0 (0.0%) |
| 7+ Person Households | 30 (2.1%) | 0 (0.0%) |
| Total | 1,097 (76.8%) | 331 (23.2%) |
Female Fertility in Thornwood
Fertility by Age in Thornwood
Average fertility rate in Thornwood is 34.0 births per 1,000 women. Women in the age bracket of 35 to 50 years have the highest fertility rate with 59.0 births per 1,000 women. Women in the age bracket of 35 to 50 years acount for 67.6% of all women with births.
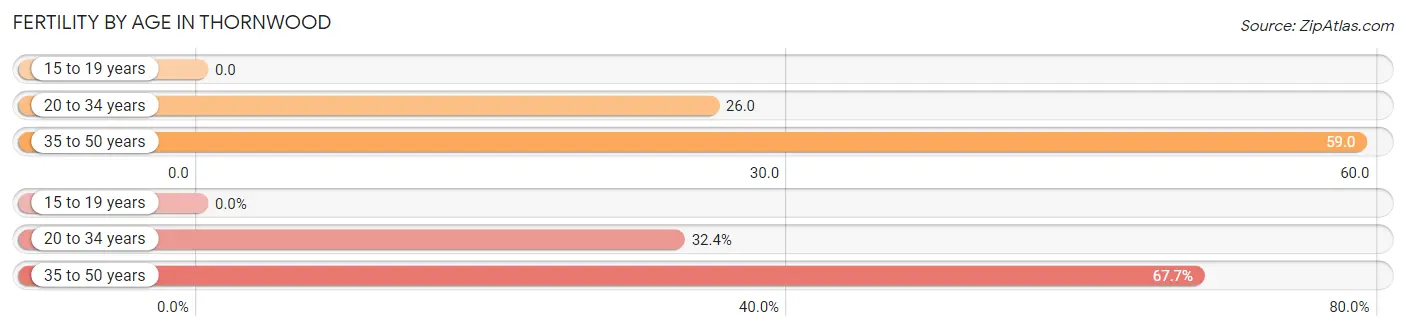
| Age Bracket | Women with Births | Births / 1,000 Women |
| 15 to 19 years | 0 (0.0%) | 0.0 |
| 20 to 34 years | 11 (32.4%) | 26.0 |
| 35 to 50 years | 23 (67.6%) | 59.0 |
| Total | 34 (100.0%) | 34.0 |
Fertility by Age by Marriage Status in Thornwood
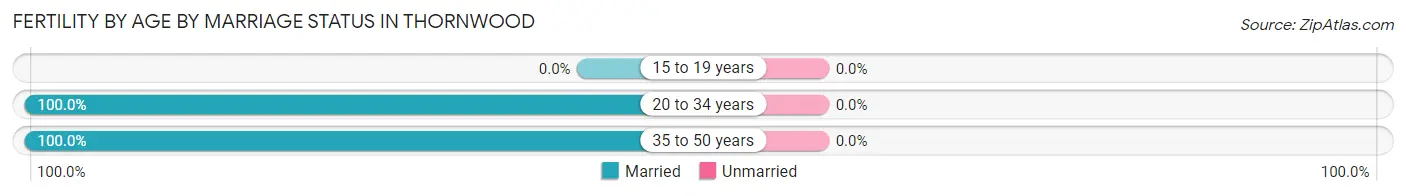
| Age Bracket | Married | Unmarried |
| 15 to 19 years | 0 (0.0%) | 0 (0.0%) |
| 20 to 34 years | 11 (100.0%) | 0 (0.0%) |
| 35 to 50 years | 23 (100.0%) | 0 (0.0%) |
| Total | 34 (100.0%) | 0 (0.0%) |
Fertility by Education in Thornwood
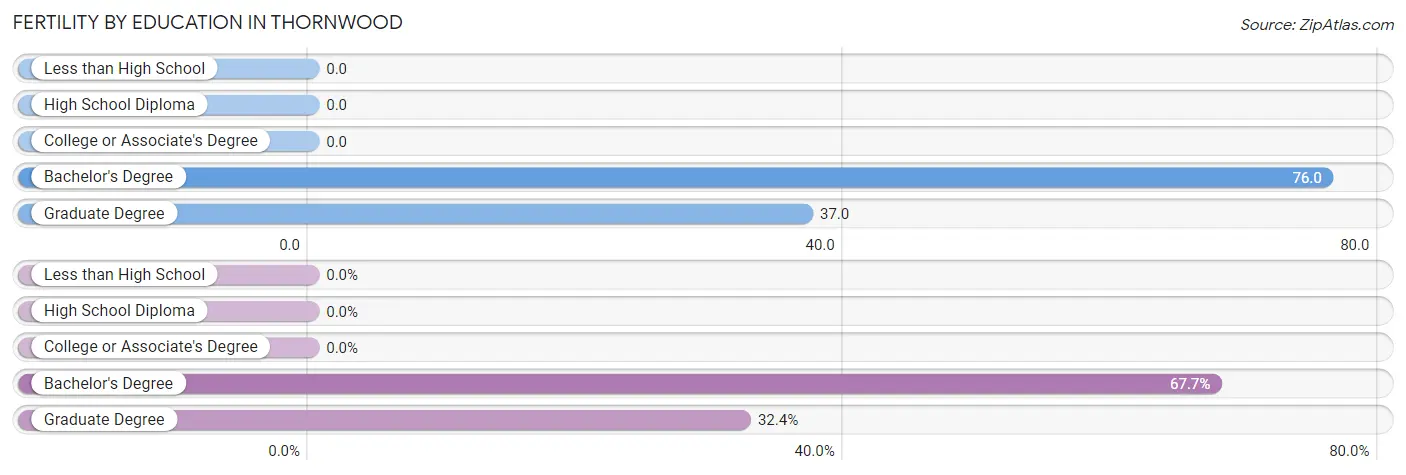
| Educational Attainment | Women with Births | Births / 1,000 Women |
| Less than High School | 0 (0.0%) | 0.0 |
| High School Diploma | 0 (0.0%) | 0.0 |
| College or Associate's Degree | 0 (0.0%) | 0.0 |
| Bachelor's Degree | 23 (67.6%) | 76.0 |
| Graduate Degree | 11 (32.4%) | 37.0 |
| Total | 34 (100.0%) | 34.0 |
Fertility by Education by Marriage Status in Thornwood
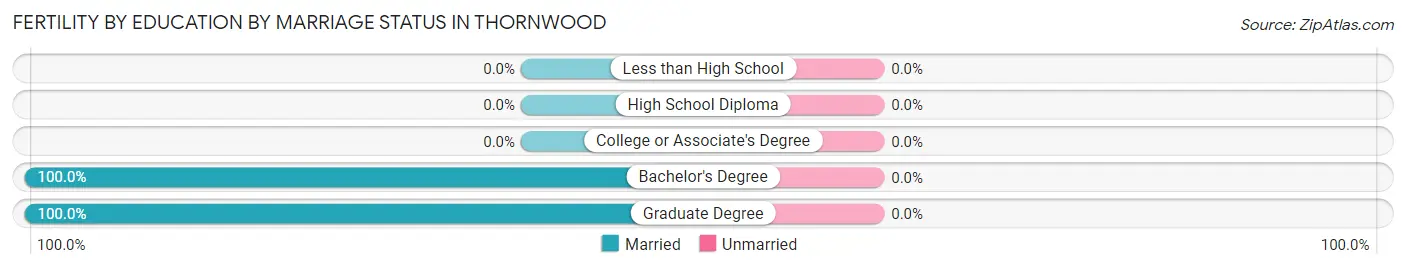
| Educational Attainment | Married | Unmarried |
| Less than High School | 0 (0.0%) | 0 (0.0%) |
| High School Diploma | 0 (0.0%) | 0 (0.0%) |
| College or Associate's Degree | 0 (0.0%) | 0 (0.0%) |
| Bachelor's Degree | 23 (100.0%) | 0 (0.0%) |
| Graduate Degree | 11 (100.0%) | 0 (0.0%) |
| Total | 34 (100.0%) | 0 (0.0%) |
Employment Characteristics in Thornwood
Employment by Class of Employer in Thornwood
Among the 2,279 employed individuals in Thornwood, private company employees (1,348 | 59.2%), local government employees (302 | 13.3%), and not-for-profit organizations (196 | 8.6%) make up the most common classes of employment.
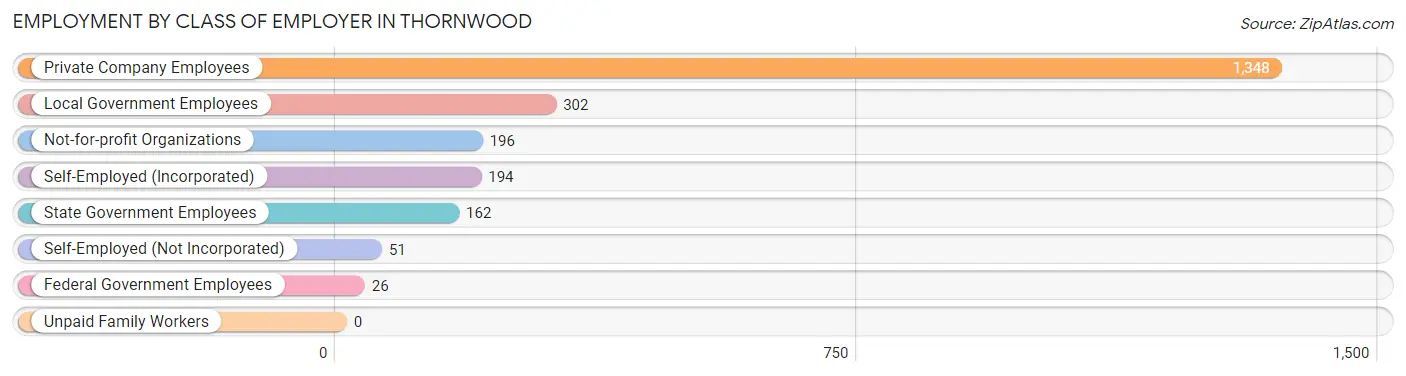
| Employer Class | # Employees | % Employees |
| Private Company Employees | 1,348 | 59.2% |
| Self-Employed (Incorporated) | 194 | 8.5% |
| Self-Employed (Not Incorporated) | 51 | 2.2% |
| Not-for-profit Organizations | 196 | 8.6% |
| Local Government Employees | 302 | 13.3% |
| State Government Employees | 162 | 7.1% |
| Federal Government Employees | 26 | 1.1% |
| Unpaid Family Workers | 0 | 0.0% |
| Total | 2,279 | 100.0% |
Employment Status by Age in Thornwood
According to the labor force statistics for Thornwood, out of the total population over 16 years of age (3,540), 68.6% or 2,428 individuals are in the labor force, with 1.3% or 32 of them unemployed. The age group with the highest labor force participation rate is 35 to 44 years, with 94.4% or 607 individuals in the labor force. Within the labor force, the 20 to 24 years age range has the highest percentage of unemployed individuals, with 5.6% or 11 of them being unemployed.
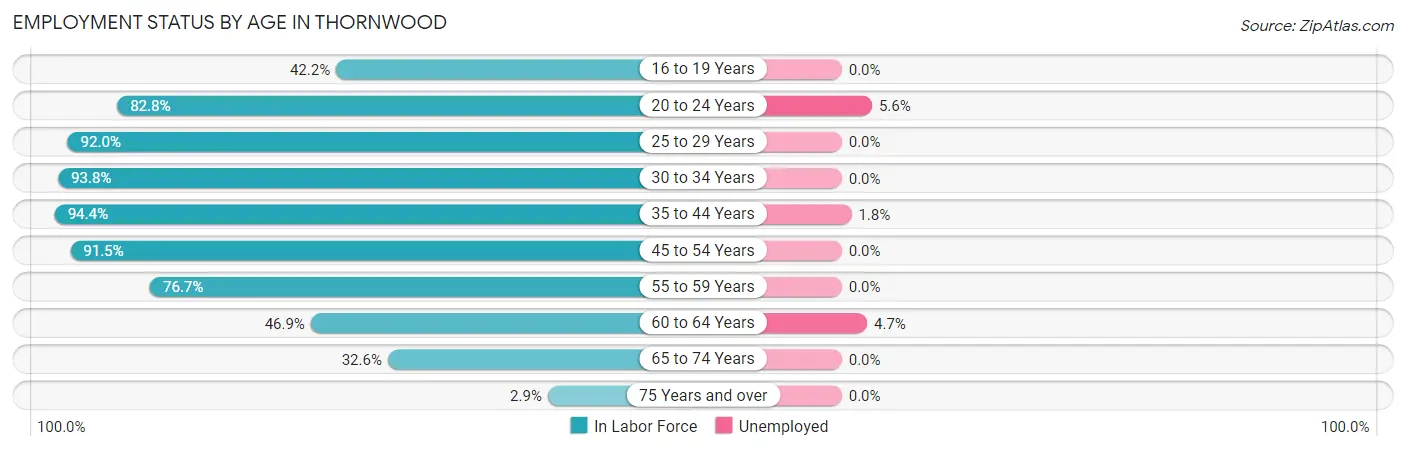
| Age Bracket | In Labor Force | Unemployed |
| 16 to 19 Years | 106 (42.2%) | 0 (0.0%) |
| 20 to 24 Years | 197 (82.8%) | 11 (5.6%) |
| 25 to 29 Years | 242 (92.0%) | 0 (0.0%) |
| 30 to 34 Years | 195 (93.8%) | 0 (0.0%) |
| 35 to 44 Years | 607 (94.4%) | 11 (1.8%) |
| 45 to 54 Years | 557 (91.5%) | 0 (0.0%) |
| 55 to 59 Years | 198 (76.7%) | 0 (0.0%) |
| 60 to 64 Years | 191 (46.9%) | 9 (4.7%) |
| 65 to 74 Years | 126 (32.6%) | 0 (0.0%) |
| 75 Years and over | 8 (2.9%) | 0 (0.0%) |
| Total | 2,428 (68.6%) | 32 (1.3%) |
Employment Status by Educational Attainment in Thornwood
According to labor force statistics for Thornwood, 83.3% of individuals (1,989) out of the total population between 25 and 64 years of age (2,388) are in the labor force, with 1.0% or 20 of them being unemployed. The group with the highest labor force participation rate are those with the educational attainment of bachelor's degree or higher, with 96.8% or 1,365 individuals in the labor force. Within the labor force, individuals with college / associate degree education have the highest percentage of unemployment, with 2.6% or 11 of them being unemployed.
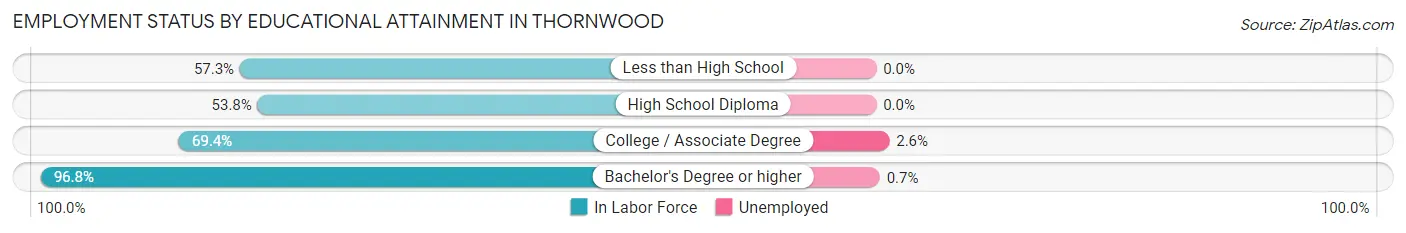
| Educational Attainment | In Labor Force | Unemployed |
| Less than High School | 59 (57.3%) | 0 (0.0%) |
| High School Diploma | 142 (53.8%) | 0 (0.0%) |
| College / Associate Degree | 424 (69.4%) | 16 (2.6%) |
| Bachelor's Degree or higher | 1,365 (96.8%) | 10 (0.7%) |
| Total | 1,989 (83.3%) | 24 (1.0%) |
Employment Occupations by Sex in Thornwood
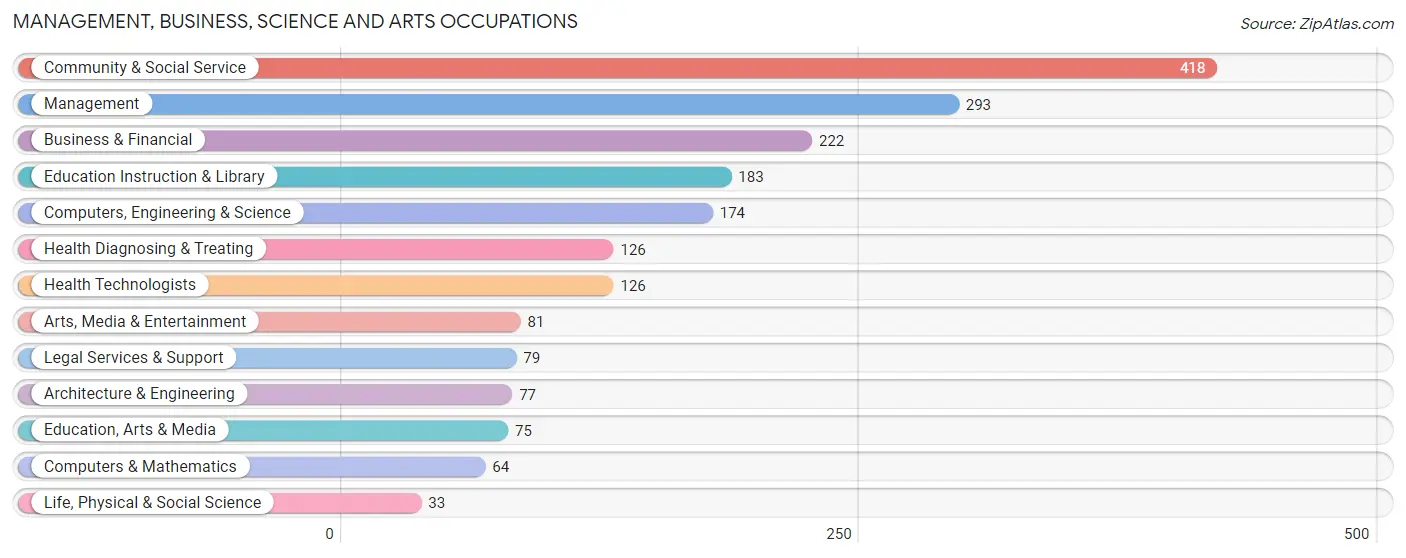
Management, Business, Science and Arts Occupations
The most common Management, Business, Science and Arts occupations in Thornwood are Community & Social Service (418 | 17.4%), Management (293 | 12.2%), Business & Financial (222 | 9.3%), Education Instruction & Library (183 | 7.6%), and Computers, Engineering & Science (174 | 7.3%).
Management, Business, Science and Arts Occupations by Sex
Within the Management, Business, Science and Arts occupations in Thornwood, the most male-oriented occupations are Arts, Media & Entertainment (88.9%), Computers & Mathematics (85.9%), and Computers, Engineering & Science (72.4%), while the most female-oriented occupations are Education, Arts & Media (88.0%), Education Instruction & Library (78.7%), and Business & Financial (73.9%).
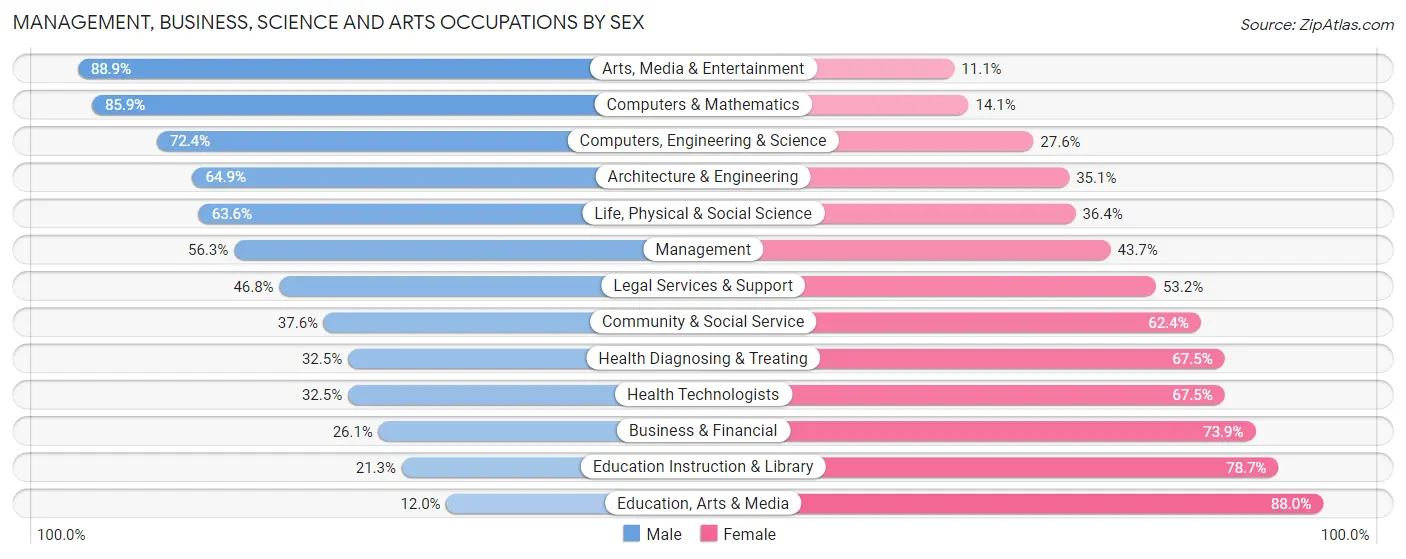
| Occupation | Male | Female |
| Management | 165 (56.3%) | 128 (43.7%) |
| Business & Financial | 58 (26.1%) | 164 (73.9%) |
| Computers, Engineering & Science | 126 (72.4%) | 48 (27.6%) |
| Computers & Mathematics | 55 (85.9%) | 9 (14.1%) |
| Architecture & Engineering | 50 (64.9%) | 27 (35.1%) |
| Life, Physical & Social Science | 21 (63.6%) | 12 (36.4%) |
| Community & Social Service | 157 (37.6%) | 261 (62.4%) |
| Education, Arts & Media | 9 (12.0%) | 66 (88.0%) |
| Legal Services & Support | 37 (46.8%) | 42 (53.2%) |
| Education Instruction & Library | 39 (21.3%) | 144 (78.7%) |
| Arts, Media & Entertainment | 72 (88.9%) | 9 (11.1%) |
| Health Diagnosing & Treating | 41 (32.5%) | 85 (67.5%) |
| Health Technologists | 41 (32.5%) | 85 (67.5%) |
| Total (Category) | 547 (44.4%) | 686 (55.6%) |
| Total (Overall) | 1,233 (51.5%) | 1,163 (48.5%) |
Services Occupations
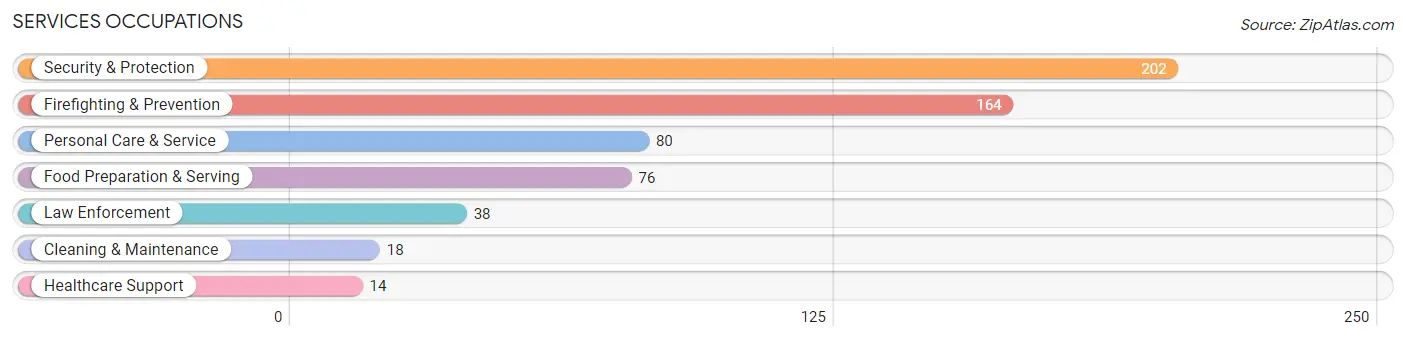
The most common Services occupations in Thornwood are Security & Protection (202 | 8.4%), Firefighting & Prevention (164 | 6.8%), Personal Care & Service (80 | 3.3%), Food Preparation & Serving (76 | 3.2%), and Law Enforcement (38 | 1.6%).
Services Occupations by Sex
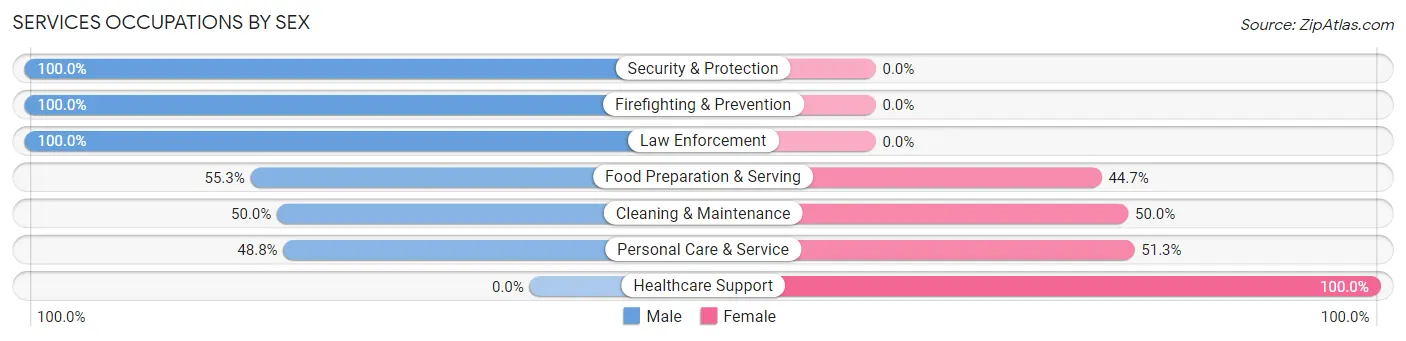
Within the Services occupations in Thornwood, the most male-oriented occupations are Security & Protection (100.0%), Firefighting & Prevention (100.0%), and Law Enforcement (100.0%), while the most female-oriented occupations are Healthcare Support (100.0%), Personal Care & Service (51.2%), and Cleaning & Maintenance (50.0%).
| Occupation | Male | Female |
| Healthcare Support | 0 (0.0%) | 14 (100.0%) |
| Security & Protection | 202 (100.0%) | 0 (0.0%) |
| Firefighting & Prevention | 164 (100.0%) | 0 (0.0%) |
| Law Enforcement | 38 (100.0%) | 0 (0.0%) |
| Food Preparation & Serving | 42 (55.3%) | 34 (44.7%) |
| Cleaning & Maintenance | 9 (50.0%) | 9 (50.0%) |
| Personal Care & Service | 39 (48.7%) | 41 (51.2%) |
| Total (Category) | 292 (74.9%) | 98 (25.1%) |
| Total (Overall) | 1,233 (51.5%) | 1,163 (48.5%) |
Sales and Office Occupations
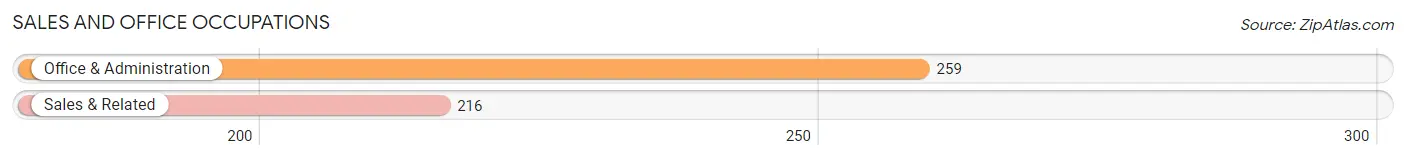
The most common Sales and Office occupations in Thornwood are Office & Administration (259 | 10.8%), and Sales & Related (216 | 9.0%).
Sales and Office Occupations by Sex
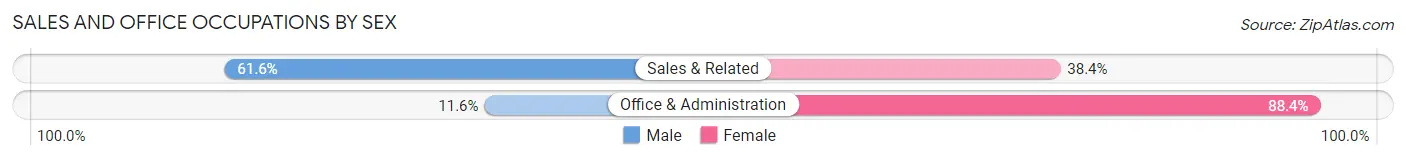
| Occupation | Male | Female |
| Sales & Related | 133 (61.6%) | 83 (38.4%) |
| Office & Administration | 30 (11.6%) | 229 (88.4%) |
| Total (Category) | 163 (34.3%) | 312 (65.7%) |
| Total (Overall) | 1,233 (51.5%) | 1,163 (48.5%) |
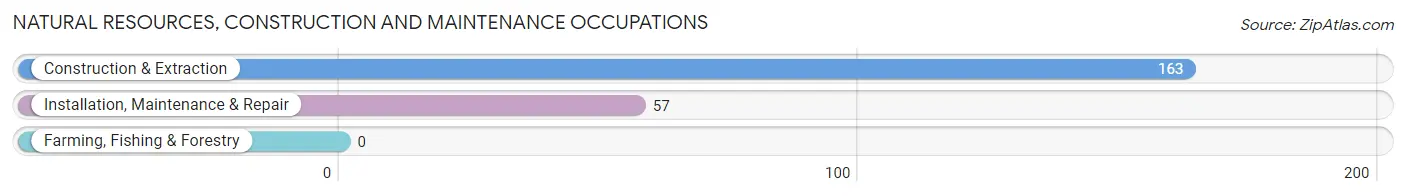
Natural Resources, Construction and Maintenance Occupations
The most common Natural Resources, Construction and Maintenance occupations in Thornwood are Construction & Extraction (163 | 6.8%), and Installation, Maintenance & Repair (57 | 2.4%).
Natural Resources, Construction and Maintenance Occupations by Sex
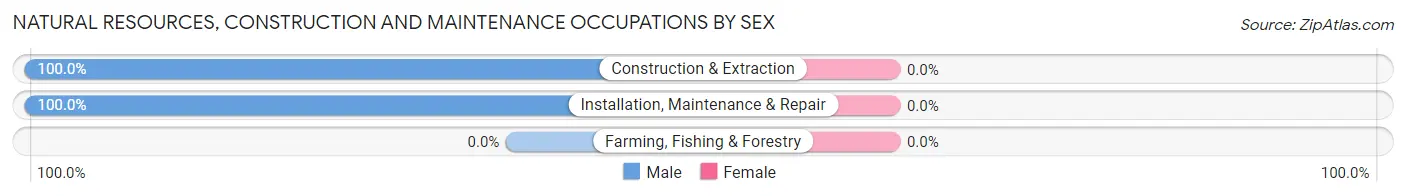
| Occupation | Male | Female |
| Farming, Fishing & Forestry | 0 (0.0%) | 0 (0.0%) |
| Construction & Extraction | 163 (100.0%) | 0 (0.0%) |
| Installation, Maintenance & Repair | 57 (100.0%) | 0 (0.0%) |
| Total (Category) | 220 (100.0%) | 0 (0.0%) |
| Total (Overall) | 1,233 (51.5%) | 1,163 (48.5%) |
Production, Transportation and Moving Occupations
The most common Production, Transportation and Moving occupations in Thornwood are Transportation (56 | 2.3%), Material Moving (13 | 0.5%), and Production (9 | 0.4%).
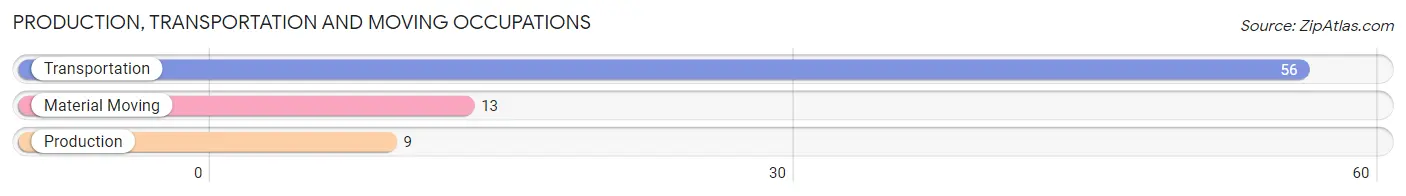
Production, Transportation and Moving Occupations by Sex
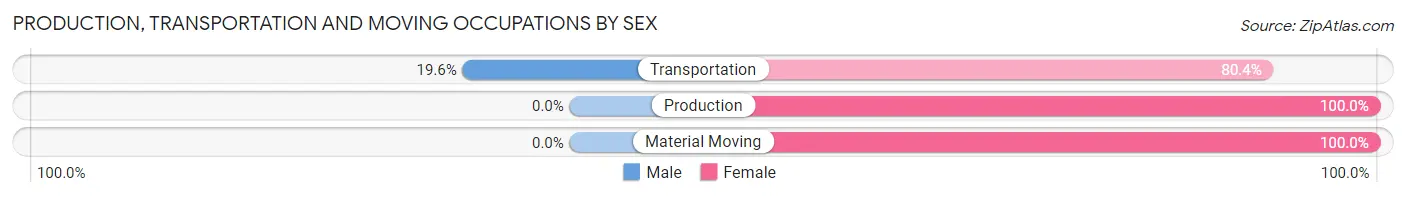
| Occupation | Male | Female |
| Production | 0 (0.0%) | 9 (100.0%) |
| Transportation | 11 (19.6%) | 45 (80.4%) |
| Material Moving | 0 (0.0%) | 13 (100.0%) |
| Total (Category) | 11 (14.1%) | 67 (85.9%) |
| Total (Overall) | 1,233 (51.5%) | 1,163 (48.5%) |
Employment Industries by Sex in Thornwood
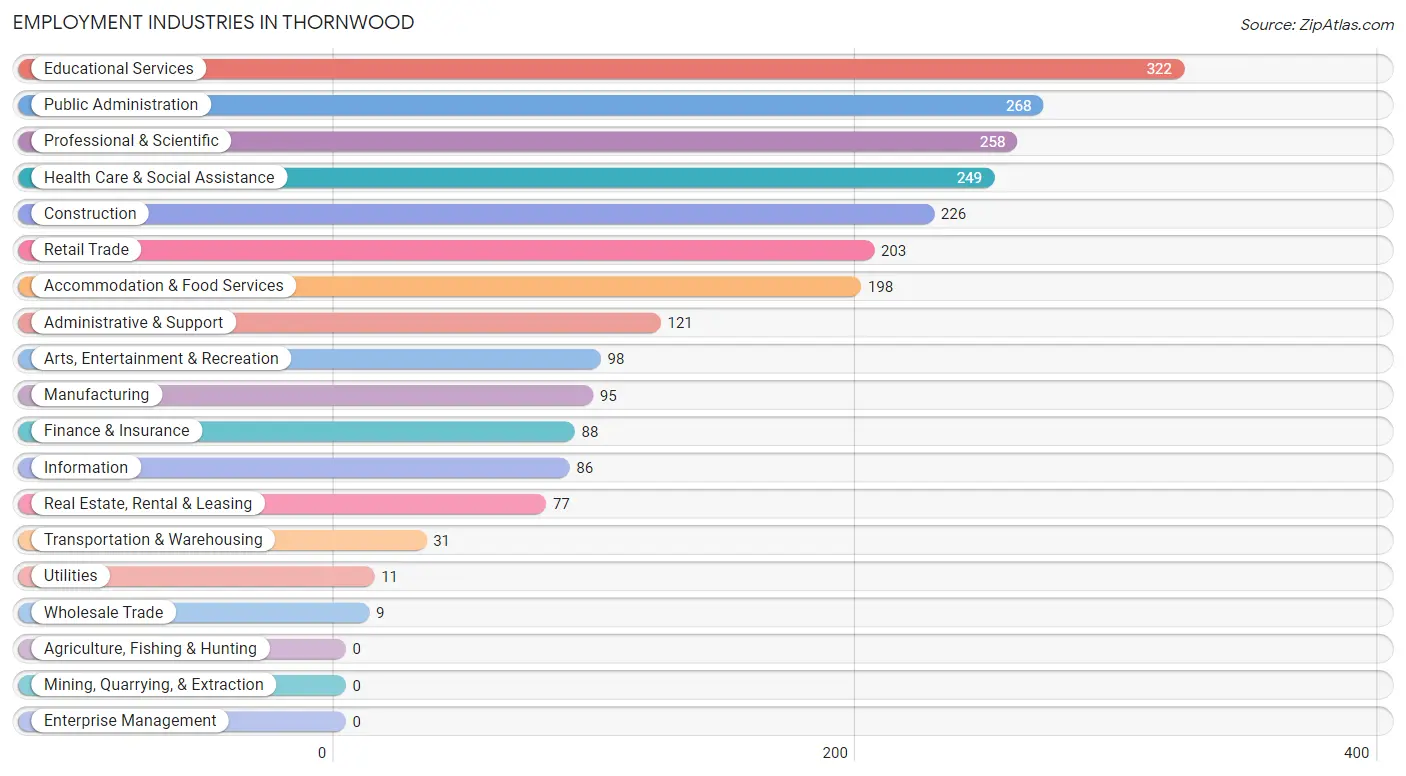
Employment Industries in Thornwood
The major employment industries in Thornwood include Educational Services (322 | 13.4%), Public Administration (268 | 11.2%), Professional & Scientific (258 | 10.8%), Health Care & Social Assistance (249 | 10.4%), and Construction (226 | 9.4%).
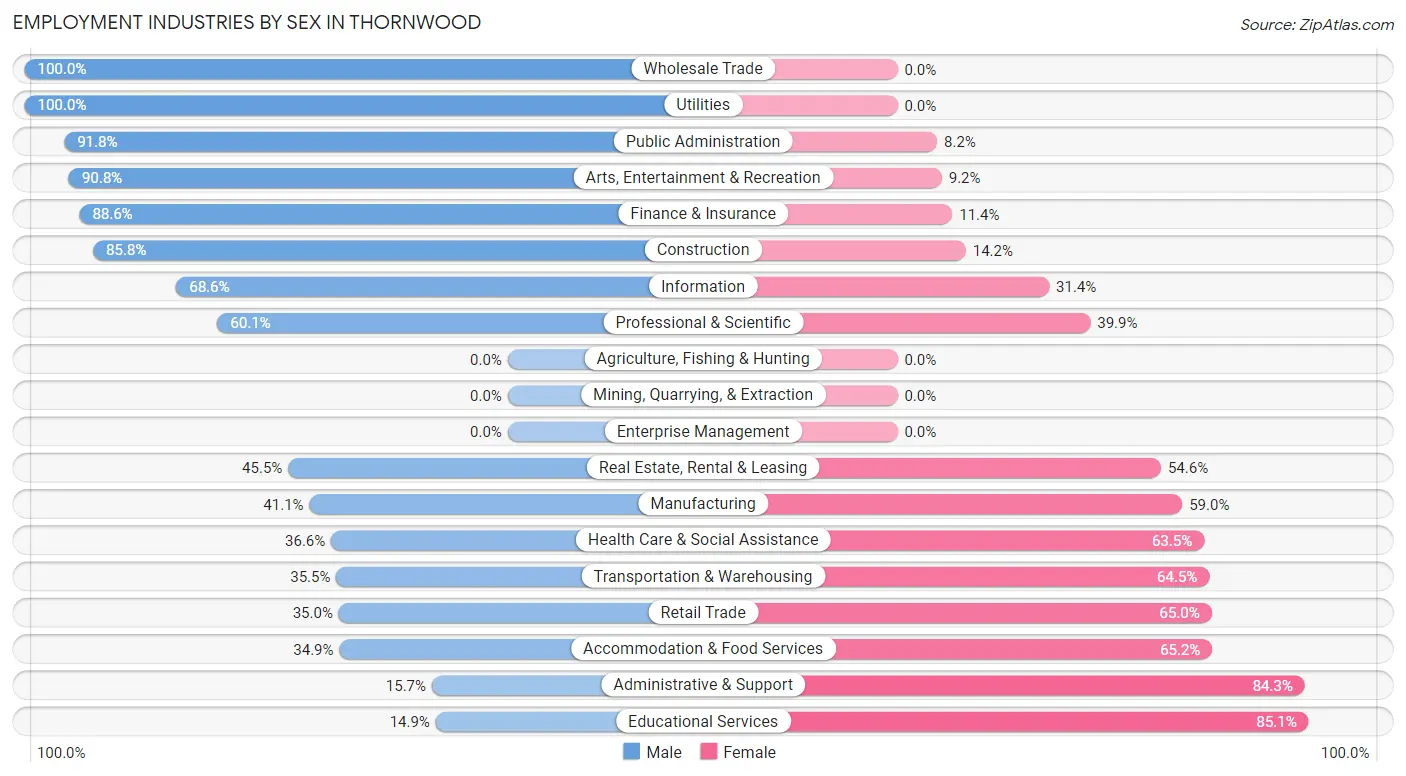
Employment Industries by Sex in Thornwood
The Thornwood industries that see more men than women are Wholesale Trade (100.0%), Utilities (100.0%), and Public Administration (91.8%), whereas the industries that tend to have a higher number of women are Educational Services (85.1%), Administrative & Support (84.3%), and Accommodation & Food Services (65.1%).
| Industry | Male | Female |
| Agriculture, Fishing & Hunting | 0 (0.0%) | 0 (0.0%) |
| Mining, Quarrying, & Extraction | 0 (0.0%) | 0 (0.0%) |
| Construction | 194 (85.8%) | 32 (14.2%) |
| Manufacturing | 39 (41.0%) | 56 (59.0%) |
| Wholesale Trade | 9 (100.0%) | 0 (0.0%) |
| Retail Trade | 71 (35.0%) | 132 (65.0%) |
| Transportation & Warehousing | 11 (35.5%) | 20 (64.5%) |
| Utilities | 11 (100.0%) | 0 (0.0%) |
| Information | 59 (68.6%) | 27 (31.4%) |
| Finance & Insurance | 78 (88.6%) | 10 (11.4%) |
| Real Estate, Rental & Leasing | 35 (45.5%) | 42 (54.5%) |
| Professional & Scientific | 155 (60.1%) | 103 (39.9%) |
| Enterprise Management | 0 (0.0%) | 0 (0.0%) |
| Administrative & Support | 19 (15.7%) | 102 (84.3%) |
| Educational Services | 48 (14.9%) | 274 (85.1%) |
| Health Care & Social Assistance | 91 (36.5%) | 158 (63.4%) |
| Arts, Entertainment & Recreation | 89 (90.8%) | 9 (9.2%) |
| Accommodation & Food Services | 69 (34.8%) | 129 (65.1%) |
| Public Administration | 246 (91.8%) | 22 (8.2%) |
| Total | 1,233 (51.5%) | 1,163 (48.5%) |
Education in Thornwood
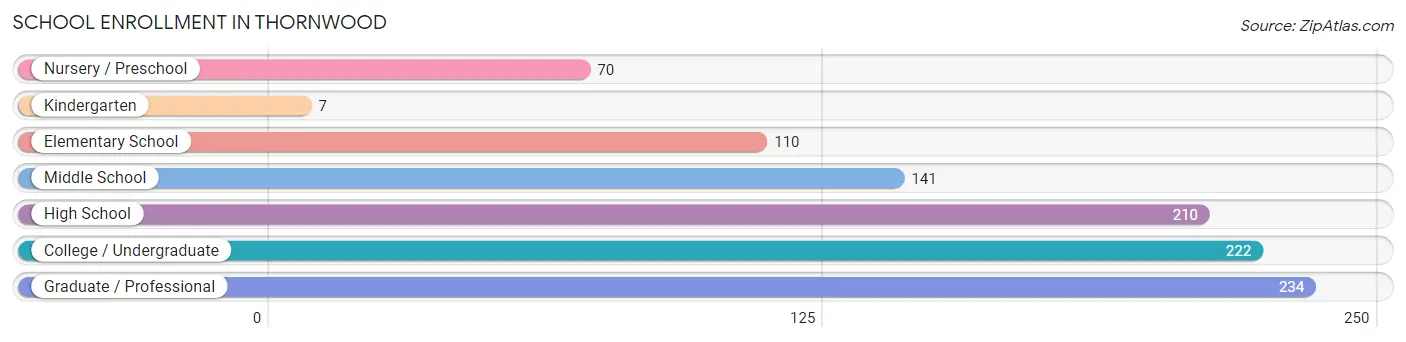
School Enrollment in Thornwood
The most common levels of schooling among the 994 students in Thornwood are graduate / professional (234 | 23.5%), college / undergraduate (222 | 22.3%), and high school (210 | 21.1%).
| School Level | # Students | % Students |
| Nursery / Preschool | 70 | 7.0% |
| Kindergarten | 7 | 0.7% |
| Elementary School | 110 | 11.1% |
| Middle School | 141 | 14.2% |
| High School | 210 | 21.1% |
| College / Undergraduate | 222 | 22.3% |
| Graduate / Professional | 234 | 23.5% |
| Total | 994 | 100.0% |
School Enrollment by Age by Funding Source in Thornwood
Out of a total of 994 students who are enrolled in schools in Thornwood, 388 (39.0%) attend a private institution, while the remaining 606 (61.0%) are enrolled in public schools. The age group of 3 to 4 year olds has the highest likelihood of being enrolled in private schools, with 43 (100.0% in the age bracket) enrolled. Conversely, the age group of 18 to 19 year olds has the lowest likelihood of being enrolled in a private school, with 135 (100.0% in the age bracket) attending a public institution.
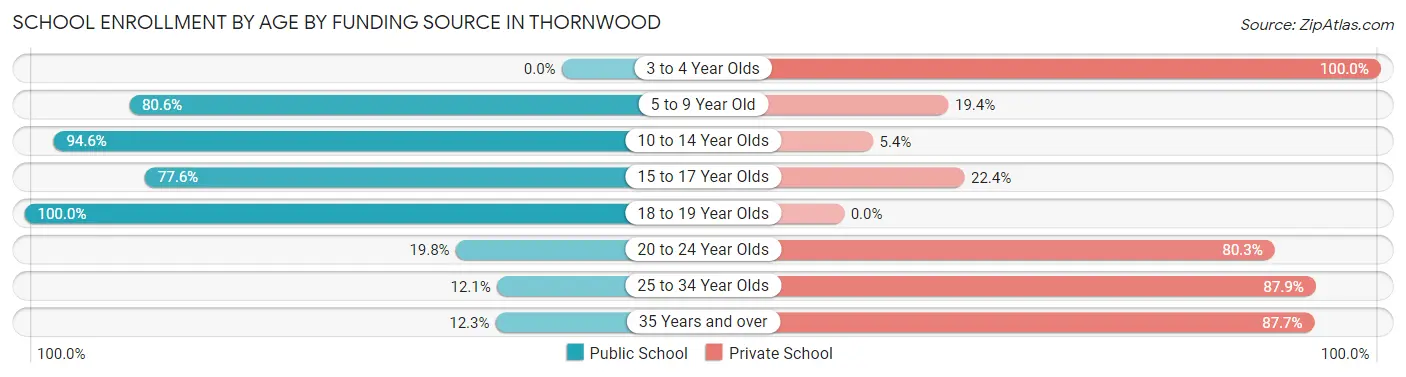
| Age Bracket | Public School | Private School |
| 3 to 4 Year Olds | 0 (0.0%) | 43 (100.0%) |
| 5 to 9 Year Old | 116 (80.6%) | 28 (19.4%) |
| 10 to 14 Year Olds | 176 (94.6%) | 10 (5.4%) |
| 15 to 17 Year Olds | 128 (77.6%) | 37 (22.4%) |
| 18 to 19 Year Olds | 135 (100.0%) | 0 (0.0%) |
| 20 to 24 Year Olds | 31 (19.8%) | 126 (80.2%) |
| 25 to 34 Year Olds | 11 (12.1%) | 80 (87.9%) |
| 35 Years and over | 9 (12.3%) | 64 (87.7%) |
| Total | 606 (61.0%) | 388 (39.0%) |
Educational Attainment by Field of Study in Thornwood
Business (598 | 34.6%), science & technology (146 | 8.5%), arts & humanities (135 | 7.8%), education (133 | 7.7%), and computers & mathematics (104 | 6.0%) are the most common fields of study among 1,727 individuals in Thornwood who have obtained a bachelor's degree or higher.
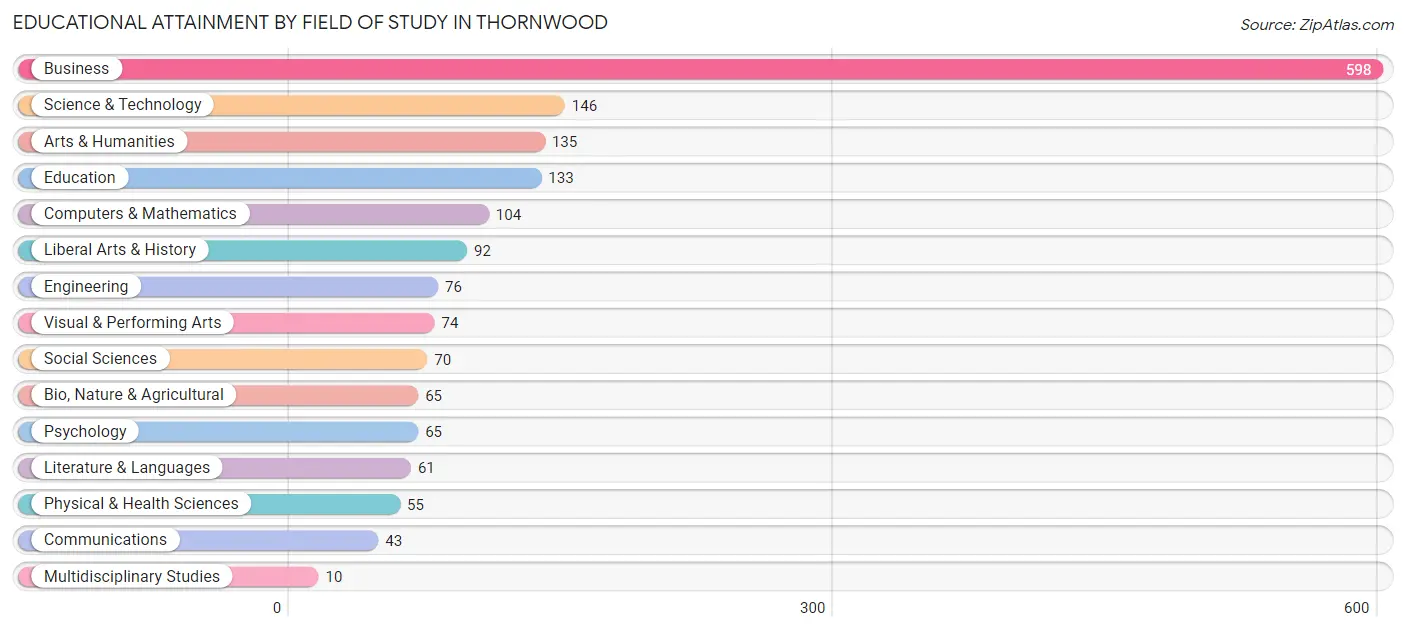
| Field of Study | # Graduates | % Graduates |
| Computers & Mathematics | 104 | 6.0% |
| Bio, Nature & Agricultural | 65 | 3.8% |
| Physical & Health Sciences | 55 | 3.2% |
| Psychology | 65 | 3.8% |
| Social Sciences | 70 | 4.1% |
| Engineering | 76 | 4.4% |
| Multidisciplinary Studies | 10 | 0.6% |
| Science & Technology | 146 | 8.5% |
| Business | 598 | 34.6% |
| Education | 133 | 7.7% |
| Literature & Languages | 61 | 3.5% |
| Liberal Arts & History | 92 | 5.3% |
| Visual & Performing Arts | 74 | 4.3% |
| Communications | 43 | 2.5% |
| Arts & Humanities | 135 | 7.8% |
| Total | 1,727 | 100.0% |
Transportation & Commute in Thornwood
Vehicle Availability by Sex in Thornwood
The most prevalent vehicle ownership categories in Thornwood are males with 2 vehicles (648, accounting for 55.1%) and females with 2 vehicles (562, making up 59.1%).
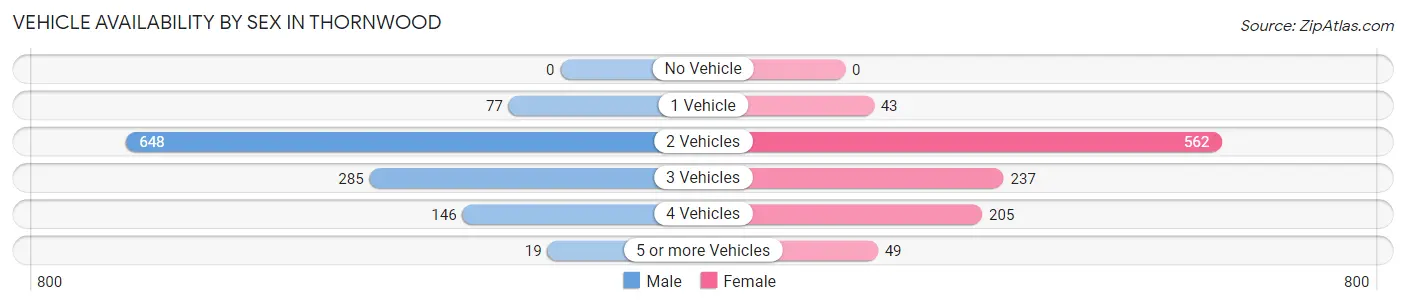
| Vehicles Available | Male | Female |
| No Vehicle | 0 (0.0%) | 0 (0.0%) |
| 1 Vehicle | 77 (6.6%) | 43 (3.9%) |
| 2 Vehicles | 648 (55.1%) | 562 (51.3%) |
| 3 Vehicles | 285 (24.3%) | 237 (21.6%) |
| 4 Vehicles | 146 (12.4%) | 205 (18.7%) |
| 5 or more Vehicles | 19 (1.6%) | 49 (4.5%) |
| Total | 1,175 (100.0%) | 1,096 (100.0%) |
Commute Time in Thornwood
The most frequently occuring commute durations in Thornwood are 10 to 14 minutes (344 commuters, 17.2%), 25 to 29 minutes (293 commuters, 14.7%), and 20 to 24 minutes (247 commuters, 12.4%).
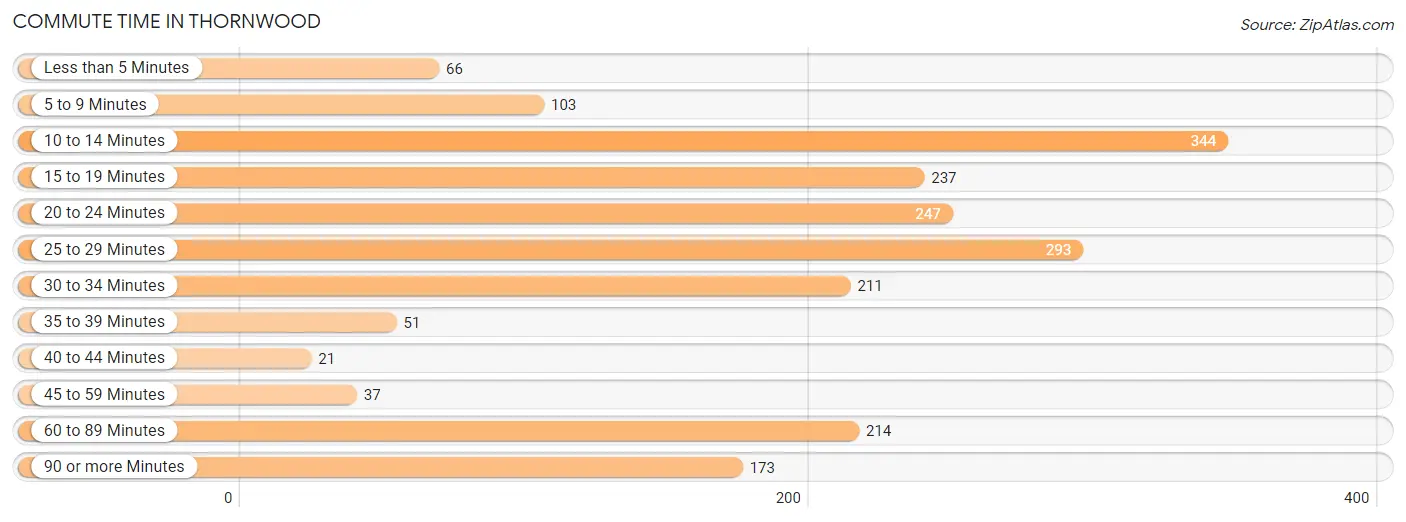
| Commute Time | # Commuters | % Commuters |
| Less than 5 Minutes | 66 | 3.3% |
| 5 to 9 Minutes | 103 | 5.2% |
| 10 to 14 Minutes | 344 | 17.2% |
| 15 to 19 Minutes | 237 | 11.9% |
| 20 to 24 Minutes | 247 | 12.4% |
| 25 to 29 Minutes | 293 | 14.7% |
| 30 to 34 Minutes | 211 | 10.6% |
| 35 to 39 Minutes | 51 | 2.5% |
| 40 to 44 Minutes | 21 | 1.1% |
| 45 to 59 Minutes | 37 | 1.8% |
| 60 to 89 Minutes | 214 | 10.7% |
| 90 or more Minutes | 173 | 8.7% |
Commute Time by Sex in Thornwood
The most common commute times in Thornwood are 10 to 14 minutes (267 commuters, 25.2%) for males and 25 to 29 minutes (217 commuters, 23.1%) for females.
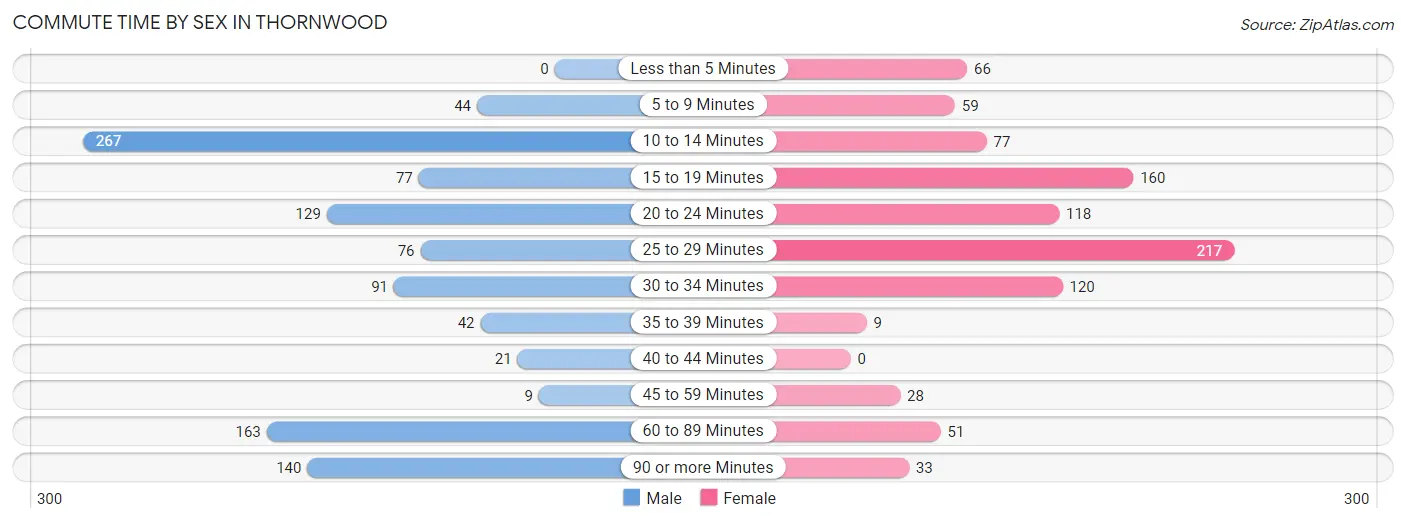
| Commute Time | Male | Female |
| Less than 5 Minutes | 0 (0.0%) | 66 (7.0%) |
| 5 to 9 Minutes | 44 (4.2%) | 59 (6.3%) |
| 10 to 14 Minutes | 267 (25.2%) | 77 (8.2%) |
| 15 to 19 Minutes | 77 (7.3%) | 160 (17.1%) |
| 20 to 24 Minutes | 129 (12.2%) | 118 (12.6%) |
| 25 to 29 Minutes | 76 (7.2%) | 217 (23.1%) |
| 30 to 34 Minutes | 91 (8.6%) | 120 (12.8%) |
| 35 to 39 Minutes | 42 (4.0%) | 9 (1.0%) |
| 40 to 44 Minutes | 21 (2.0%) | 0 (0.0%) |
| 45 to 59 Minutes | 9 (0.9%) | 28 (3.0%) |
| 60 to 89 Minutes | 163 (15.4%) | 51 (5.4%) |
| 90 or more Minutes | 140 (13.2%) | 33 (3.5%) |
Time of Departure to Work by Sex in Thornwood
The most frequent times of departure to work in Thornwood are 7:30 AM to 7:59 AM (322, 30.4%) for males and 8:30 AM to 8:59 AM (198, 21.1%) for females.
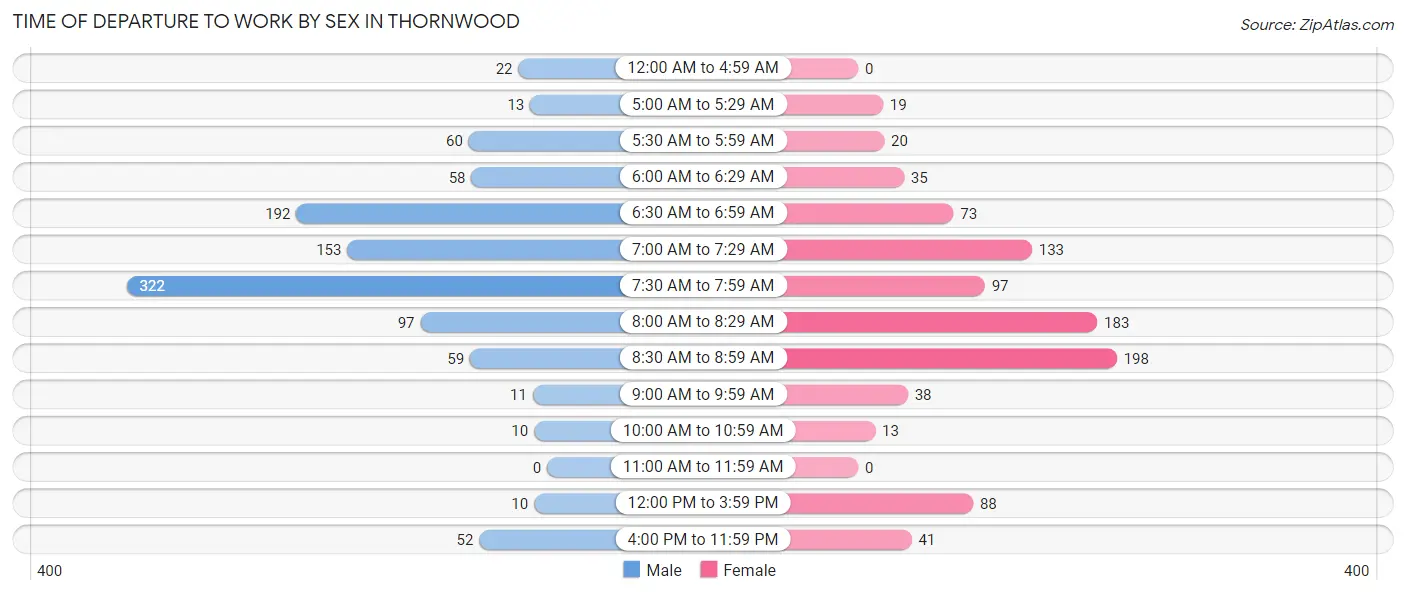
| Time of Departure | Male | Female |
| 12:00 AM to 4:59 AM | 22 (2.1%) | 0 (0.0%) |
| 5:00 AM to 5:29 AM | 13 (1.2%) | 19 (2.0%) |
| 5:30 AM to 5:59 AM | 60 (5.7%) | 20 (2.1%) |
| 6:00 AM to 6:29 AM | 58 (5.5%) | 35 (3.7%) |
| 6:30 AM to 6:59 AM | 192 (18.1%) | 73 (7.8%) |
| 7:00 AM to 7:29 AM | 153 (14.4%) | 133 (14.2%) |
| 7:30 AM to 7:59 AM | 322 (30.4%) | 97 (10.3%) |
| 8:00 AM to 8:29 AM | 97 (9.2%) | 183 (19.5%) |
| 8:30 AM to 8:59 AM | 59 (5.6%) | 198 (21.1%) |
| 9:00 AM to 9:59 AM | 11 (1.0%) | 38 (4.1%) |
| 10:00 AM to 10:59 AM | 10 (0.9%) | 13 (1.4%) |
| 11:00 AM to 11:59 AM | 0 (0.0%) | 0 (0.0%) |
| 12:00 PM to 3:59 PM | 10 (0.9%) | 88 (9.4%) |
| 4:00 PM to 11:59 PM | 52 (4.9%) | 41 (4.4%) |
| Total | 1,059 (100.0%) | 938 (100.0%) |
Housing Occupancy in Thornwood
Occupancy by Ownership in Thornwood
Of the total 1,428 dwellings in Thornwood, owner-occupied units account for 1,209 (84.7%), while renter-occupied units make up 219 (15.3%).
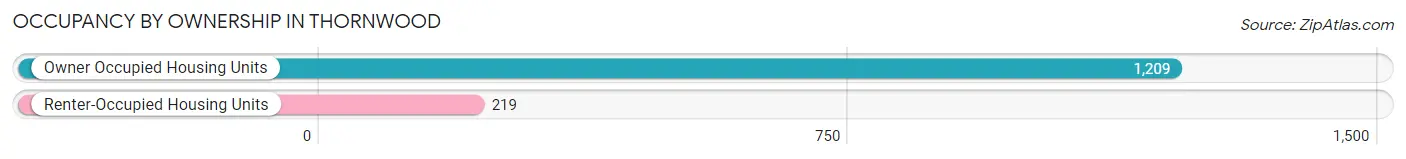
| Occupancy | # Housing Units | % Housing Units |
| Owner Occupied Housing Units | 1,209 | 84.7% |
| Renter-Occupied Housing Units | 219 | 15.3% |
| Total Occupied Housing Units | 1,428 | 100.0% |
Occupancy by Household Size in Thornwood
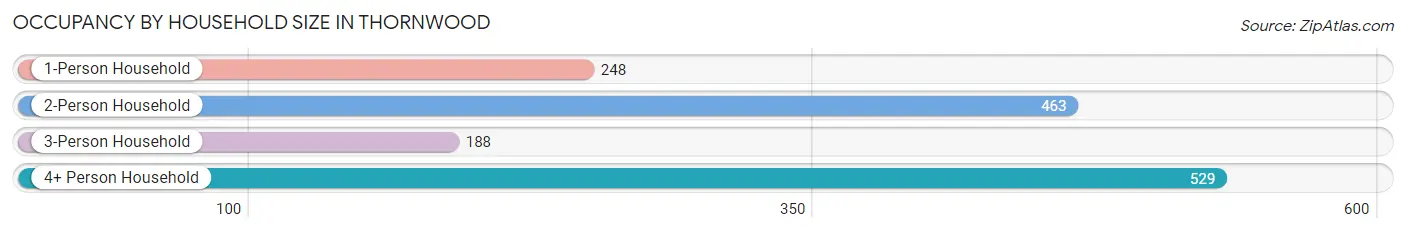
| Household Size | # Housing Units | % Housing Units |
| 1-Person Household | 248 | 17.4% |
| 2-Person Household | 463 | 32.4% |
| 3-Person Household | 188 | 13.2% |
| 4+ Person Household | 529 | 37.0% |
| Total Housing Units | 1,428 | 100.0% |
Occupancy by Ownership by Household Size in Thornwood
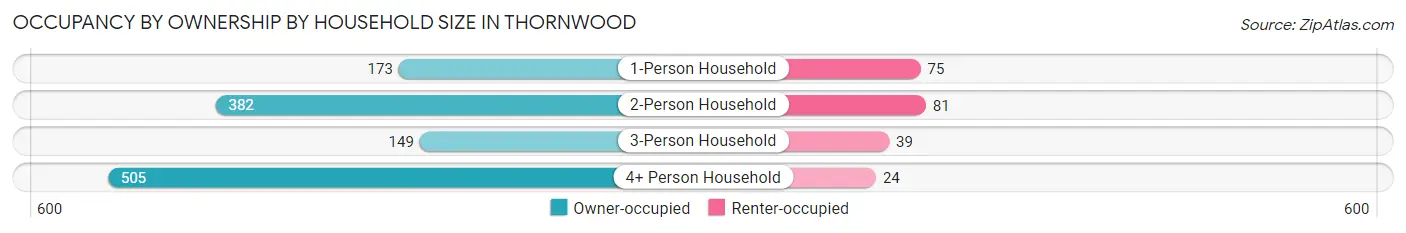
| Household Size | Owner-occupied | Renter-occupied |
| 1-Person Household | 173 (69.8%) | 75 (30.2%) |
| 2-Person Household | 382 (82.5%) | 81 (17.5%) |
| 3-Person Household | 149 (79.3%) | 39 (20.7%) |
| 4+ Person Household | 505 (95.5%) | 24 (4.5%) |
| Total Housing Units | 1,209 (84.7%) | 219 (15.3%) |
Occupancy by Educational Attainment in Thornwood
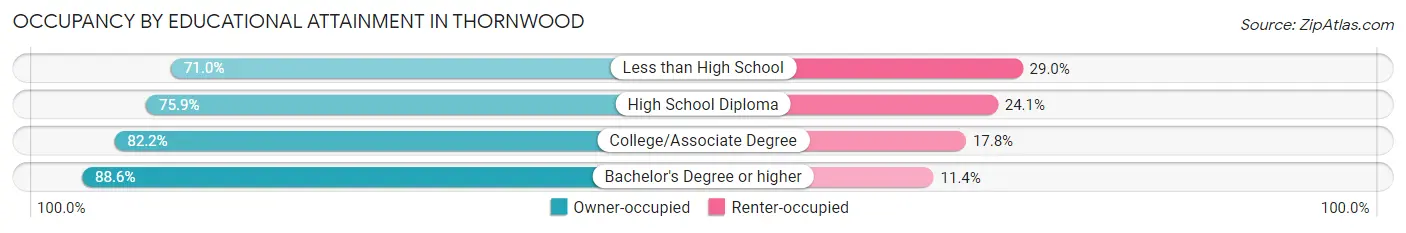
| Household Size | Owner-occupied | Renter-occupied |
| Less than High School | 44 (71.0%) | 18 (29.0%) |
| High School Diploma | 170 (75.9%) | 54 (24.1%) |
| College/Associate Degree | 217 (82.2%) | 47 (17.8%) |
| Bachelor's Degree or higher | 778 (88.6%) | 100 (11.4%) |
Occupancy by Age of Householder in Thornwood
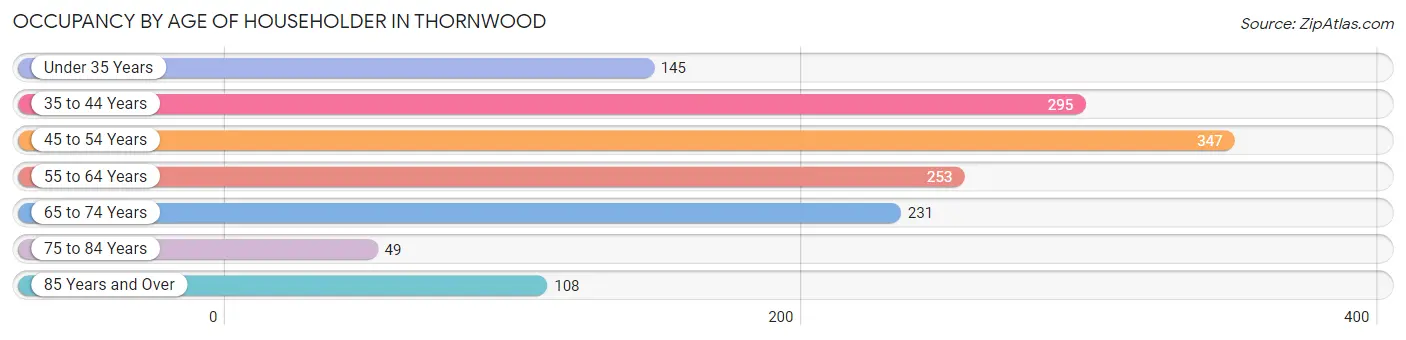
| Age Bracket | # Households | % Households |
| Under 35 Years | 145 | 10.2% |
| 35 to 44 Years | 295 | 20.7% |
| 45 to 54 Years | 347 | 24.3% |
| 55 to 64 Years | 253 | 17.7% |
| 65 to 74 Years | 231 | 16.2% |
| 75 to 84 Years | 49 | 3.4% |
| 85 Years and Over | 108 | 7.6% |
| Total | 1,428 | 100.0% |
Housing Finances in Thornwood
Median Income by Occupancy in Thornwood
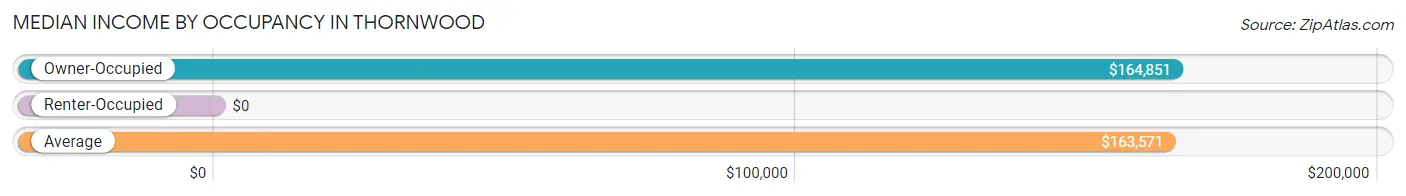
| Occupancy Type | # Households | Median Income |
| Owner-Occupied | 1,209 (84.7%) | $164,851 |
| Renter-Occupied | 219 (15.3%) | $0 |
| Average | 1,428 (100.0%) | $163,571 |
Occupancy by Householder Income Bracket in Thornwood
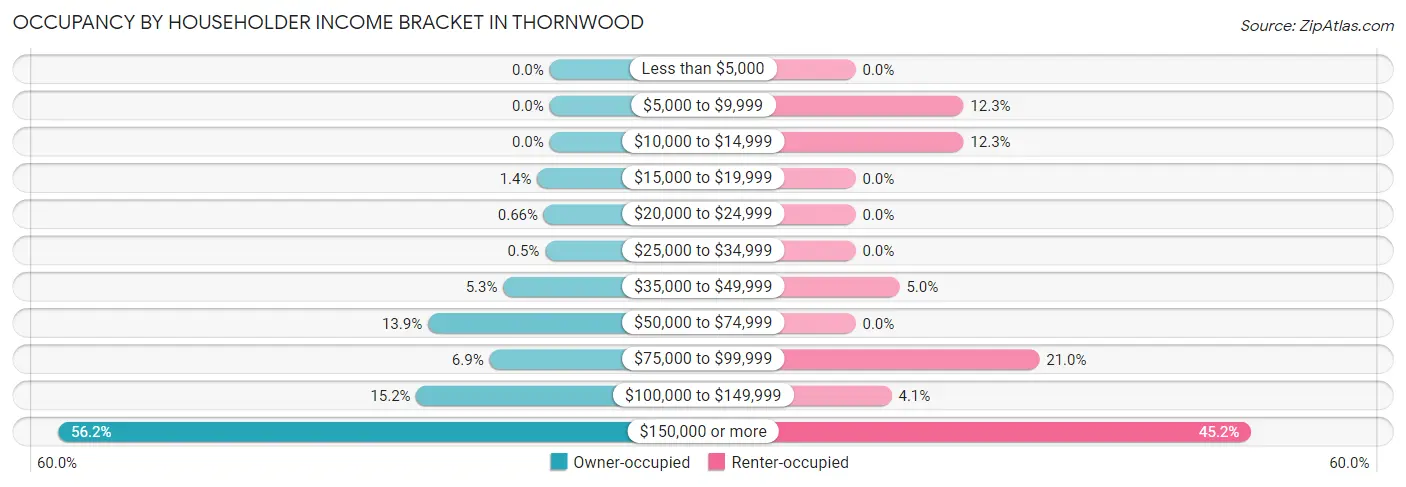
| Income Bracket | Owner-occupied | Renter-occupied |
| Less than $5,000 | 0 (0.0%) | 0 (0.0%) |
| $5,000 to $9,999 | 0 (0.0%) | 27 (12.3%) |
| $10,000 to $14,999 | 0 (0.0%) | 27 (12.3%) |
| $15,000 to $19,999 | 17 (1.4%) | 0 (0.0%) |
| $20,000 to $24,999 | 8 (0.7%) | 0 (0.0%) |
| $25,000 to $34,999 | 6 (0.5%) | 0 (0.0%) |
| $35,000 to $49,999 | 64 (5.3%) | 11 (5.0%) |
| $50,000 to $74,999 | 168 (13.9%) | 0 (0.0%) |
| $75,000 to $99,999 | 83 (6.9%) | 46 (21.0%) |
| $100,000 to $149,999 | 184 (15.2%) | 9 (4.1%) |
| $150,000 or more | 679 (56.2%) | 99 (45.2%) |
| Total | 1,209 (100.0%) | 219 (100.0%) |
Monthly Housing Cost Tiers in Thornwood
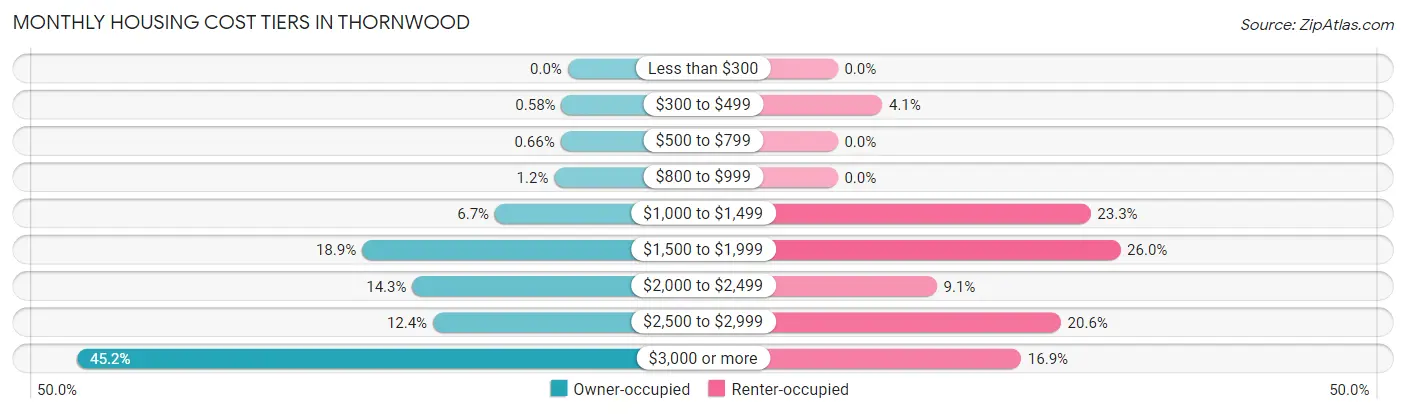
| Monthly Cost | Owner-occupied | Renter-occupied |
| Less than $300 | 0 (0.0%) | 0 (0.0%) |
| $300 to $499 | 7 (0.6%) | 9 (4.1%) |
| $500 to $799 | 8 (0.7%) | 0 (0.0%) |
| $800 to $999 | 15 (1.2%) | 0 (0.0%) |
| $1,000 to $1,499 | 81 (6.7%) | 51 (23.3%) |
| $1,500 to $1,999 | 229 (18.9%) | 57 (26.0%) |
| $2,000 to $2,499 | 173 (14.3%) | 20 (9.1%) |
| $2,500 to $2,999 | 150 (12.4%) | 45 (20.5%) |
| $3,000 or more | 546 (45.2%) | 37 (16.9%) |
| Total | 1,209 (100.0%) | 219 (100.0%) |
Physical Housing Characteristics in Thornwood
Housing Structures in Thornwood
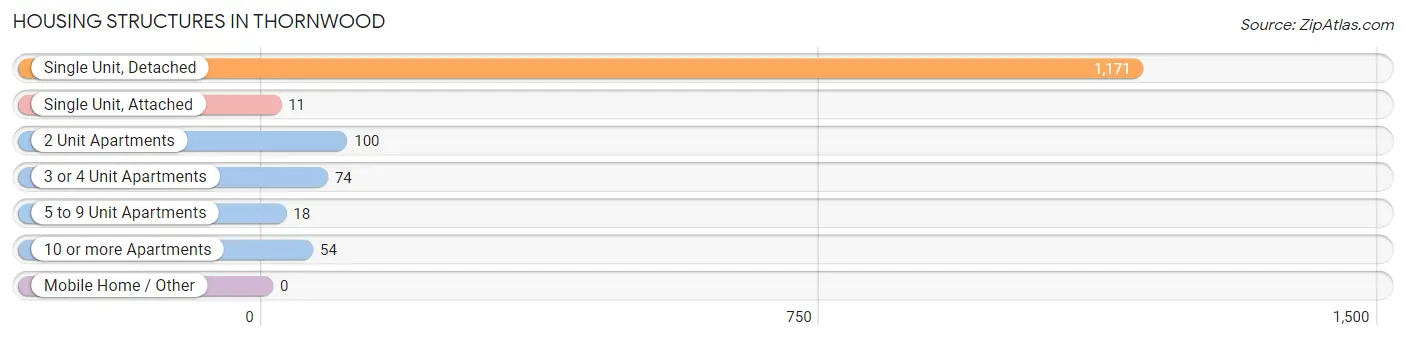
| Structure Type | # Housing Units | % Housing Units |
| Single Unit, Detached | 1,171 | 82.0% |
| Single Unit, Attached | 11 | 0.8% |
| 2 Unit Apartments | 100 | 7.0% |
| 3 or 4 Unit Apartments | 74 | 5.2% |
| 5 to 9 Unit Apartments | 18 | 1.3% |
| 10 or more Apartments | 54 | 3.8% |
| Mobile Home / Other | 0 | 0.0% |
| Total | 1,428 | 100.0% |
Housing Structures by Occupancy in Thornwood
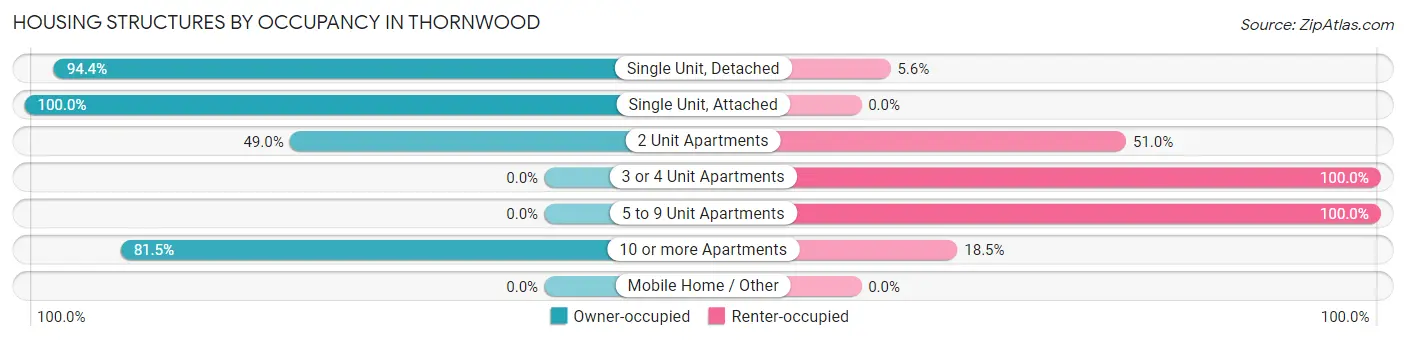
| Structure Type | Owner-occupied | Renter-occupied |
| Single Unit, Detached | 1,105 (94.4%) | 66 (5.6%) |
| Single Unit, Attached | 11 (100.0%) | 0 (0.0%) |
| 2 Unit Apartments | 49 (49.0%) | 51 (51.0%) |
| 3 or 4 Unit Apartments | 0 (0.0%) | 74 (100.0%) |
| 5 to 9 Unit Apartments | 0 (0.0%) | 18 (100.0%) |
| 10 or more Apartments | 44 (81.5%) | 10 (18.5%) |
| Mobile Home / Other | 0 (0.0%) | 0 (0.0%) |
| Total | 1,209 (84.7%) | 219 (15.3%) |
Housing Structures by Number of Rooms in Thornwood
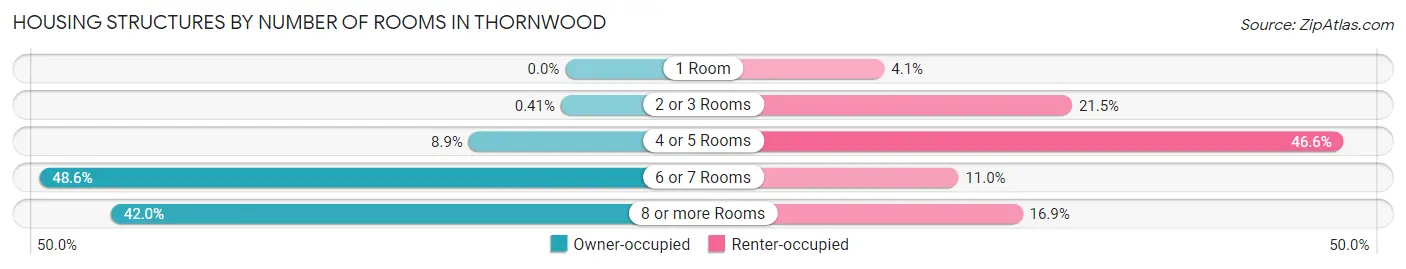
| Number of Rooms | Owner-occupied | Renter-occupied |
| 1 Room | 0 (0.0%) | 9 (4.1%) |
| 2 or 3 Rooms | 5 (0.4%) | 47 (21.5%) |
| 4 or 5 Rooms | 108 (8.9%) | 102 (46.6%) |
| 6 or 7 Rooms | 588 (48.6%) | 24 (11.0%) |
| 8 or more Rooms | 508 (42.0%) | 37 (16.9%) |
| Total | 1,209 (100.0%) | 219 (100.0%) |
Housing Structure by Heating Type in Thornwood
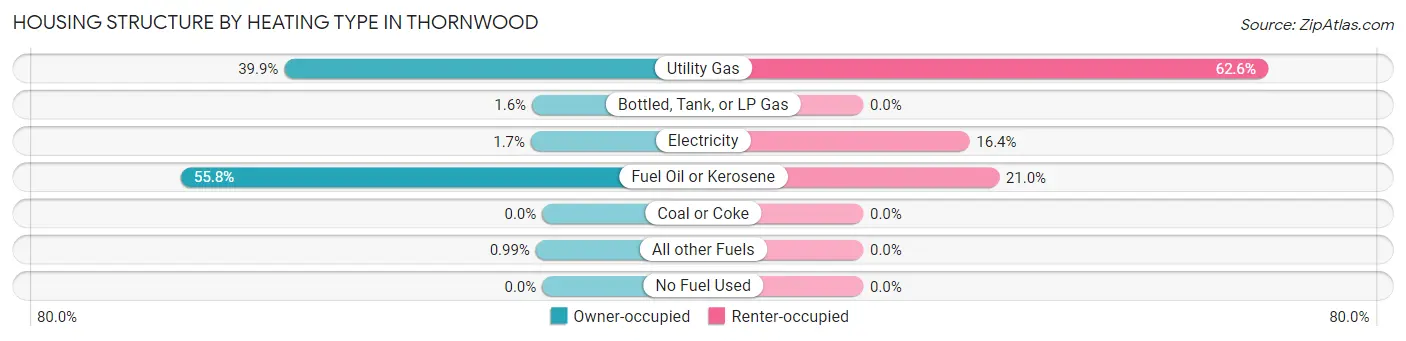
| Heating Type | Owner-occupied | Renter-occupied |
| Utility Gas | 482 (39.9%) | 137 (62.6%) |
| Bottled, Tank, or LP Gas | 19 (1.6%) | 0 (0.0%) |
| Electricity | 21 (1.7%) | 36 (16.4%) |
| Fuel Oil or Kerosene | 675 (55.8%) | 46 (21.0%) |
| Coal or Coke | 0 (0.0%) | 0 (0.0%) |
| All other Fuels | 12 (1.0%) | 0 (0.0%) |
| No Fuel Used | 0 (0.0%) | 0 (0.0%) |
| Total | 1,209 (100.0%) | 219 (100.0%) |
Household Vehicle Usage in Thornwood
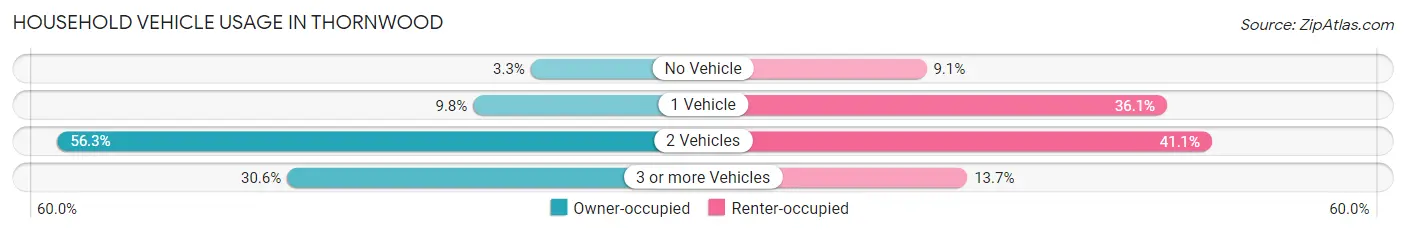
| Vehicles per Household | Owner-occupied | Renter-occupied |
| No Vehicle | 40 (3.3%) | 20 (9.1%) |
| 1 Vehicle | 118 (9.8%) | 79 (36.1%) |
| 2 Vehicles | 681 (56.3%) | 90 (41.1%) |
| 3 or more Vehicles | 370 (30.6%) | 30 (13.7%) |
| Total | 1,209 (100.0%) | 219 (100.0%) |
Real Estate & Mortgages in Thornwood
Real Estate and Mortgage Overview in Thornwood
| Characteristic | Without Mortgage | With Mortgage |
| Housing Units | 480 | 729 |
| Median Property Value | $642,400 | $662,300 |
| Median Household Income | $144,773 | $463 |
| Monthly Housing Costs | $1,501 | $518 |
| Real Estate Taxes | $10,001 | $11 |
Property Value by Mortgage Status in Thornwood
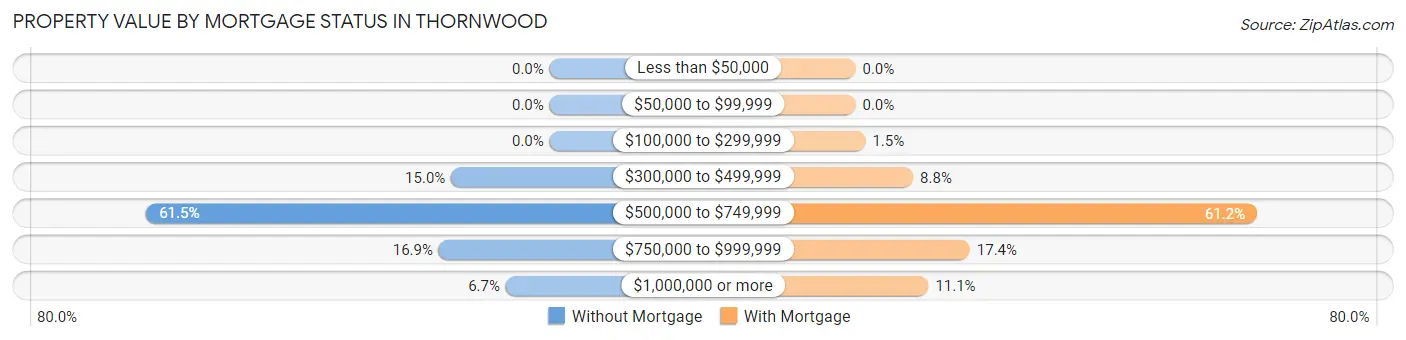
| Property Value | Without Mortgage | With Mortgage |
| Less than $50,000 | 0 (0.0%) | 0 (0.0%) |
| $50,000 to $99,999 | 0 (0.0%) | 0 (0.0%) |
| $100,000 to $299,999 | 0 (0.0%) | 11 (1.5%) |
| $300,000 to $499,999 | 72 (15.0%) | 64 (8.8%) |
| $500,000 to $749,999 | 295 (61.5%) | 446 (61.2%) |
| $750,000 to $999,999 | 81 (16.9%) | 127 (17.4%) |
| $1,000,000 or more | 32 (6.7%) | 81 (11.1%) |
| Total | 480 (100.0%) | 729 (100.0%) |
Household Income by Mortgage Status in Thornwood
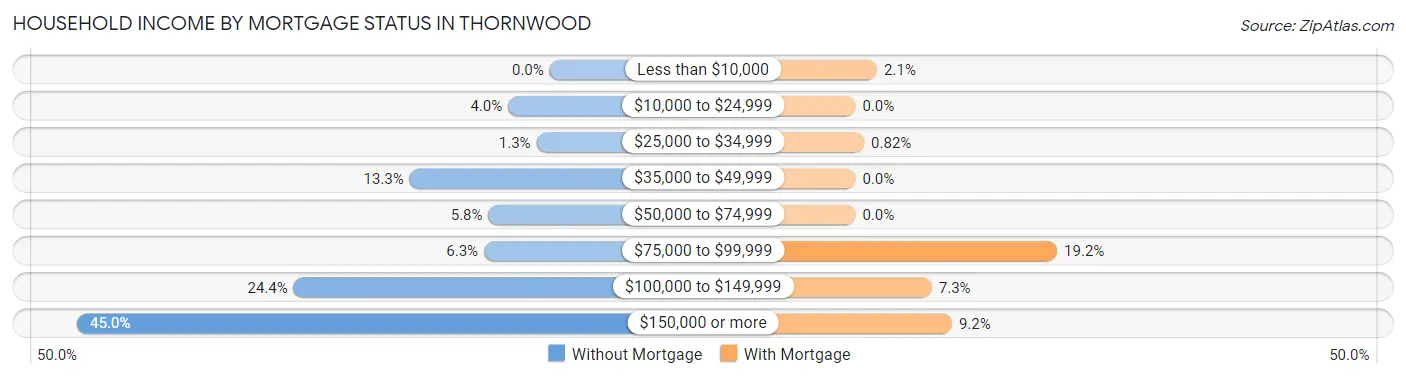
| Household Income | Without Mortgage | With Mortgage |
| Less than $10,000 | 0 (0.0%) | 15 (2.1%) |
| $10,000 to $24,999 | 19 (4.0%) | 0 (0.0%) |
| $25,000 to $34,999 | 6 (1.3%) | 6 (0.8%) |
| $35,000 to $49,999 | 64 (13.3%) | 0 (0.0%) |
| $50,000 to $74,999 | 28 (5.8%) | 0 (0.0%) |
| $75,000 to $99,999 | 30 (6.2%) | 140 (19.2%) |
| $100,000 to $149,999 | 117 (24.4%) | 53 (7.3%) |
| $150,000 or more | 216 (45.0%) | 67 (9.2%) |
| Total | 480 (100.0%) | 729 (100.0%) |
Property Value to Household Income Ratio in Thornwood
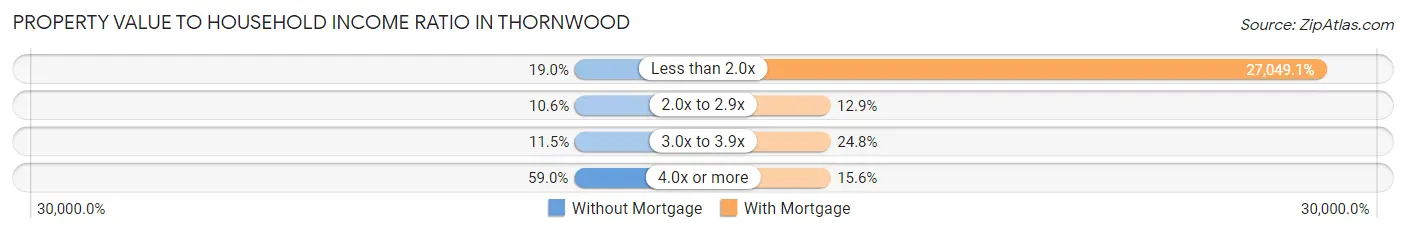
| Value-to-Income Ratio | Without Mortgage | With Mortgage |
| Less than 2.0x | 91 (19.0%) | 197,188 (27,049.1%) |
| 2.0x to 2.9x | 51 (10.6%) | 94 (12.9%) |
| 3.0x to 3.9x | 55 (11.5%) | 181 (24.8%) |
| 4.0x or more | 283 (59.0%) | 114 (15.6%) |
| Total | 480 (100.0%) | 729 (100.0%) |
Real Estate Taxes by Mortgage Status in Thornwood
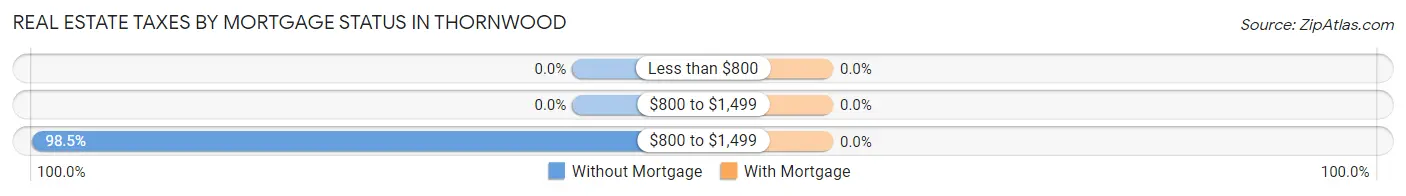
| Property Taxes | Without Mortgage | With Mortgage |
| Less than $800 | 0 (0.0%) | 0 (0.0%) |
| $800 to $1,499 | 0 (0.0%) | 0 (0.0%) |
| $800 to $1,499 | 473 (98.5%) | 0 (0.0%) |
| Total | 480 (100.0%) | 729 (100.0%) |
Health & Disability in Thornwood
Health Insurance Coverage by Age in Thornwood
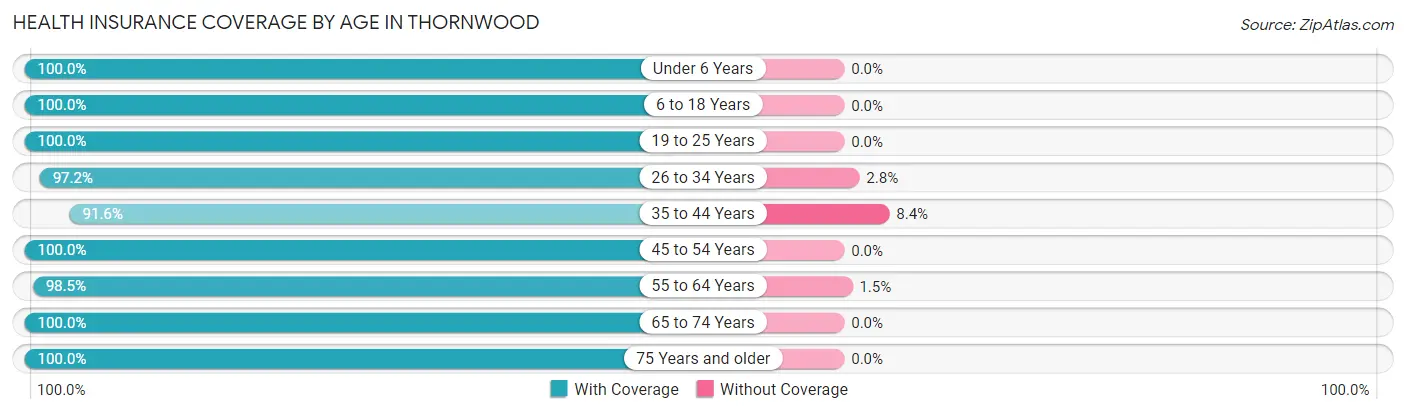
| Age Bracket | With Coverage | Without Coverage |
| Under 6 Years | 501 (100.0%) | 0 (0.0%) |
| 6 to 18 Years | 517 (100.0%) | 0 (0.0%) |
| 19 to 25 Years | 372 (100.0%) | 0 (0.0%) |
| 26 to 34 Years | 414 (97.2%) | 12 (2.8%) |
| 35 to 44 Years | 589 (91.6%) | 54 (8.4%) |
| 45 to 54 Years | 609 (100.0%) | 0 (0.0%) |
| 55 to 64 Years | 648 (98.5%) | 10 (1.5%) |
| 65 to 74 Years | 387 (100.0%) | 0 (0.0%) |
| 75 Years and older | 258 (100.0%) | 0 (0.0%) |
| Total | 4,295 (98.3%) | 76 (1.7%) |
Health Insurance Coverage by Citizenship Status in Thornwood
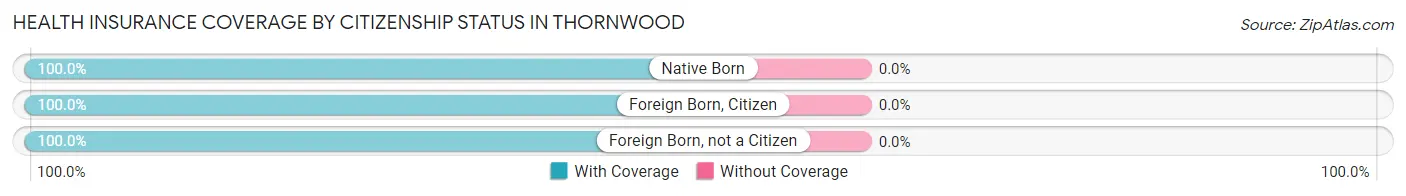
| Citizenship Status | With Coverage | Without Coverage |
| Native Born | 501 (100.0%) | 0 (0.0%) |
| Foreign Born, Citizen | 517 (100.0%) | 0 (0.0%) |
| Foreign Born, not a Citizen | 372 (100.0%) | 0 (0.0%) |
Health Insurance Coverage by Household Income in Thornwood
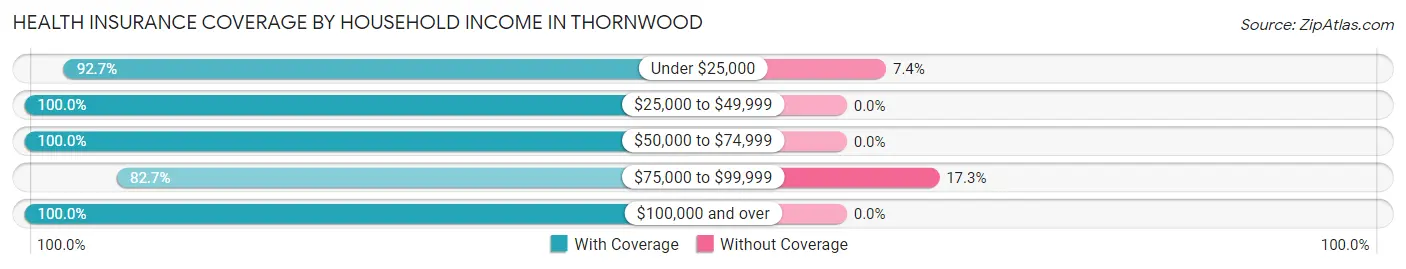
| Household Income | With Coverage | Without Coverage |
| Under $25,000 | 126 (92.6%) | 10 (7.3%) |
| $25,000 to $49,999 | 113 (100.0%) | 0 (0.0%) |
| $50,000 to $74,999 | 405 (100.0%) | 0 (0.0%) |
| $75,000 to $99,999 | 315 (82.7%) | 66 (17.3%) |
| $100,000 and over | 3,282 (100.0%) | 0 (0.0%) |
Public vs Private Health Insurance Coverage by Age in Thornwood
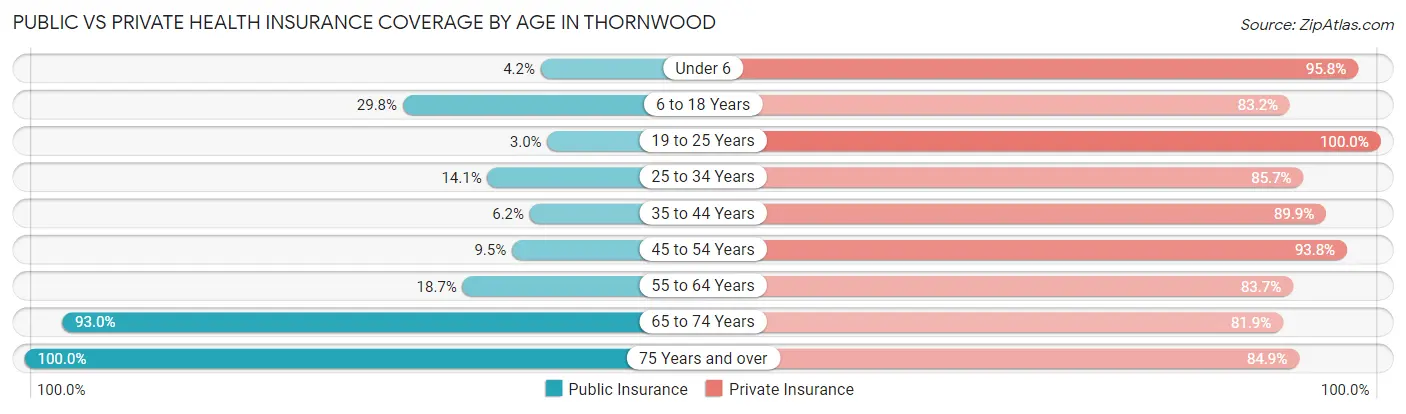
| Age Bracket | Public Insurance | Private Insurance |
| Under 6 | 21 (4.2%) | 480 (95.8%) |
| 6 to 18 Years | 154 (29.8%) | 430 (83.2%) |
| 19 to 25 Years | 11 (3.0%) | 372 (100.0%) |
| 25 to 34 Years | 60 (14.1%) | 365 (85.7%) |
| 35 to 44 Years | 40 (6.2%) | 578 (89.9%) |
| 45 to 54 Years | 58 (9.5%) | 571 (93.8%) |
| 55 to 64 Years | 123 (18.7%) | 551 (83.7%) |
| 65 to 74 Years | 360 (93.0%) | 317 (81.9%) |
| 75 Years and over | 258 (100.0%) | 219 (84.9%) |
| Total | 1,085 (24.8%) | 3,883 (88.8%) |
Disability Status by Sex by Age in Thornwood
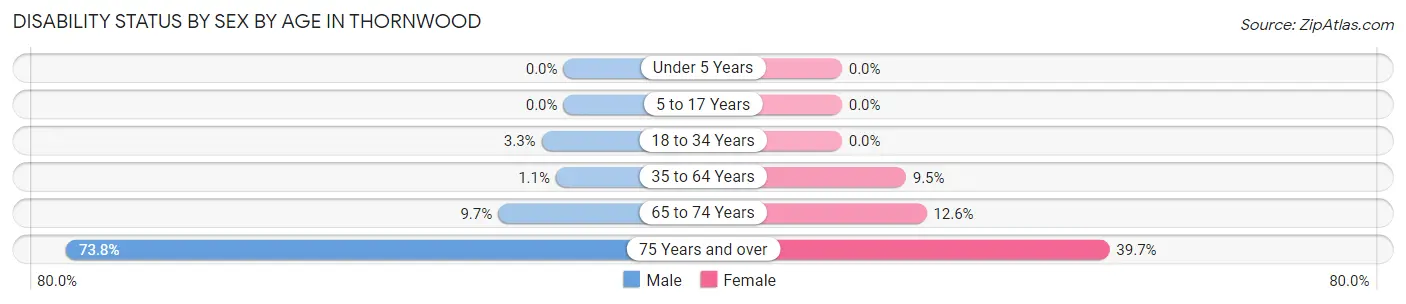
| Age Bracket | Male | Female |
| Under 5 Years | 0 (0.0%) | 0 (0.0%) |
| 5 to 17 Years | 0 (0.0%) | 0 (0.0%) |
| 18 to 34 Years | 11 (3.3%) | 0 (0.0%) |
| 35 to 64 Years | 11 (1.1%) | 88 (9.5%) |
| 65 to 74 Years | 19 (9.7%) | 24 (12.6%) |
| 75 Years and over | 79 (73.8%) | 60 (39.7%) |
Disability Class by Sex by Age in Thornwood
Disability Class: Hearing Difficulty
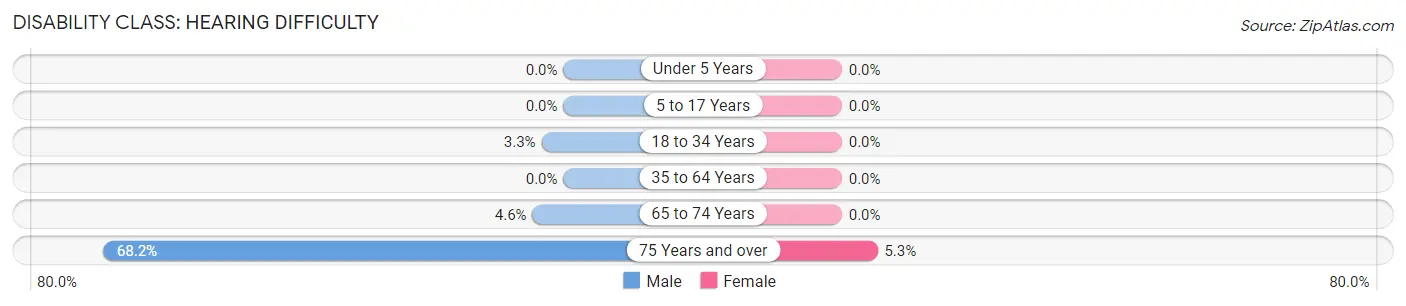
| Age Bracket | Male | Female |
| Under 5 Years | 0 (0.0%) | 0 (0.0%) |
| 5 to 17 Years | 0 (0.0%) | 0 (0.0%) |
| 18 to 34 Years | 11 (3.3%) | 0 (0.0%) |
| 35 to 64 Years | 0 (0.0%) | 0 (0.0%) |
| 65 to 74 Years | 9 (4.6%) | 0 (0.0%) |
| 75 Years and over | 73 (68.2%) | 8 (5.3%) |
Disability Class: Vision Difficulty
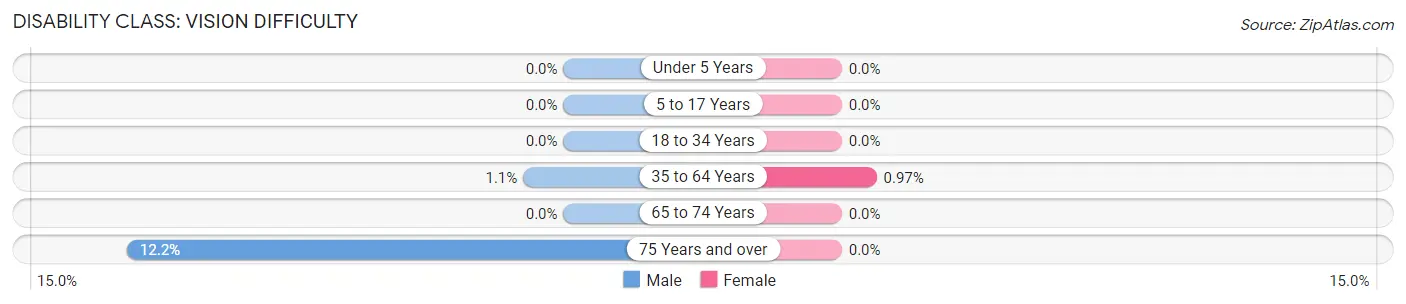
| Age Bracket | Male | Female |
| Under 5 Years | 0 (0.0%) | 0 (0.0%) |
| 5 to 17 Years | 0 (0.0%) | 0 (0.0%) |
| 18 to 34 Years | 0 (0.0%) | 0 (0.0%) |
| 35 to 64 Years | 11 (1.1%) | 9 (1.0%) |
| 65 to 74 Years | 0 (0.0%) | 0 (0.0%) |
| 75 Years and over | 13 (12.1%) | 0 (0.0%) |
Disability Class: Cognitive Difficulty
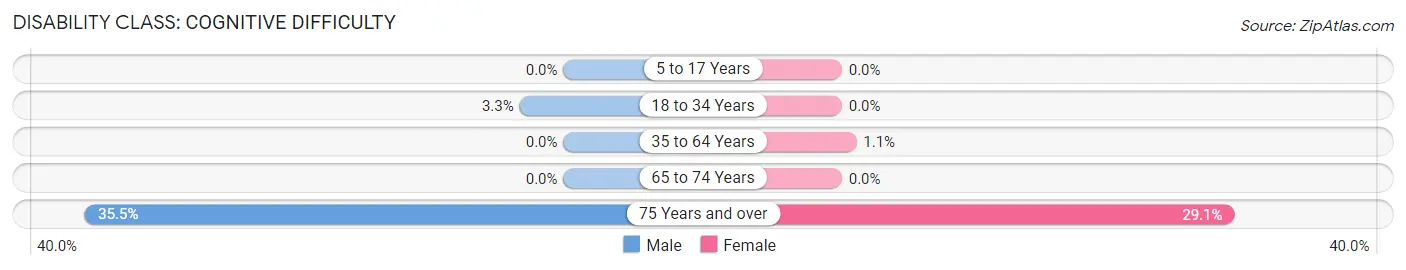
| Age Bracket | Male | Female |
| 5 to 17 Years | 0 (0.0%) | 0 (0.0%) |
| 18 to 34 Years | 11 (3.3%) | 0 (0.0%) |
| 35 to 64 Years | 0 (0.0%) | 10 (1.1%) |
| 65 to 74 Years | 0 (0.0%) | 0 (0.0%) |
| 75 Years and over | 38 (35.5%) | 44 (29.1%) |
Disability Class: Ambulatory Difficulty
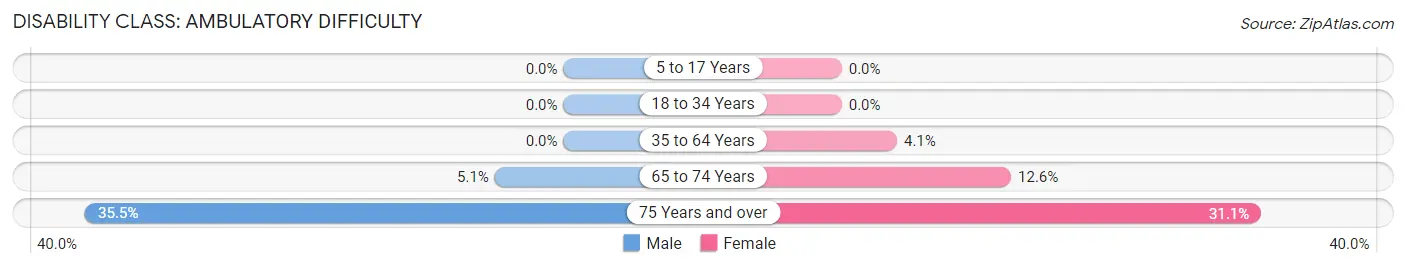
| Age Bracket | Male | Female |
| 5 to 17 Years | 0 (0.0%) | 0 (0.0%) |
| 18 to 34 Years | 0 (0.0%) | 0 (0.0%) |
| 35 to 64 Years | 0 (0.0%) | 38 (4.1%) |
| 65 to 74 Years | 10 (5.1%) | 24 (12.6%) |
| 75 Years and over | 38 (35.5%) | 47 (31.1%) |
Disability Class: Self-Care Difficulty
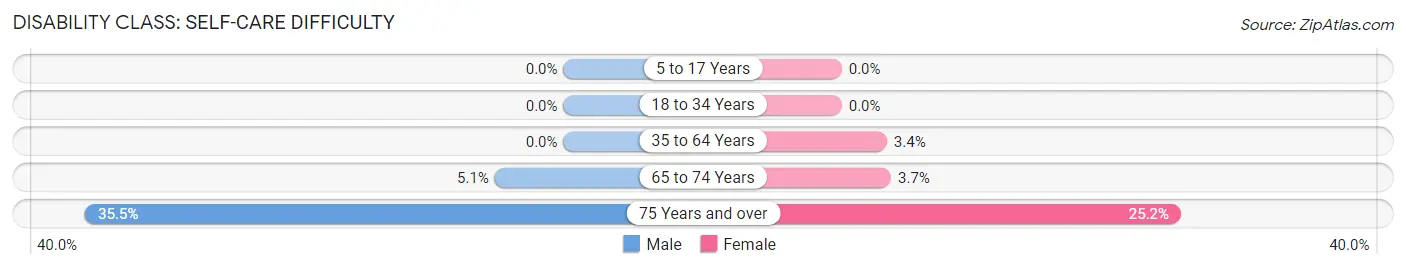
| Age Bracket | Male | Female |
| 5 to 17 Years | 0 (0.0%) | 0 (0.0%) |
| 18 to 34 Years | 0 (0.0%) | 0 (0.0%) |
| 35 to 64 Years | 0 (0.0%) | 31 (3.4%) |
| 65 to 74 Years | 10 (5.1%) | 7 (3.7%) |
| 75 Years and over | 38 (35.5%) | 38 (25.2%) |
Technology Access in Thornwood
Computing Device Access in Thornwood
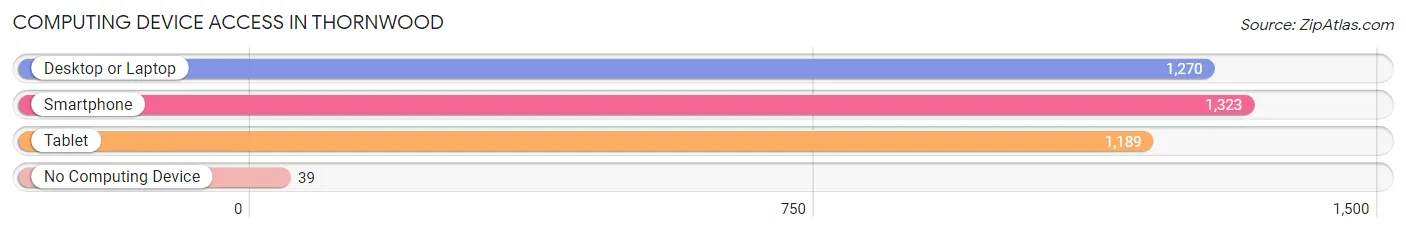
| Device Type | # Households | % Households |
| Desktop or Laptop | 1,270 | 88.9% |
| Smartphone | 1,323 | 92.6% |
| Tablet | 1,189 | 83.3% |
| No Computing Device | 39 | 2.7% |
| Total | 1,428 | 100.0% |
Internet Access in Thornwood
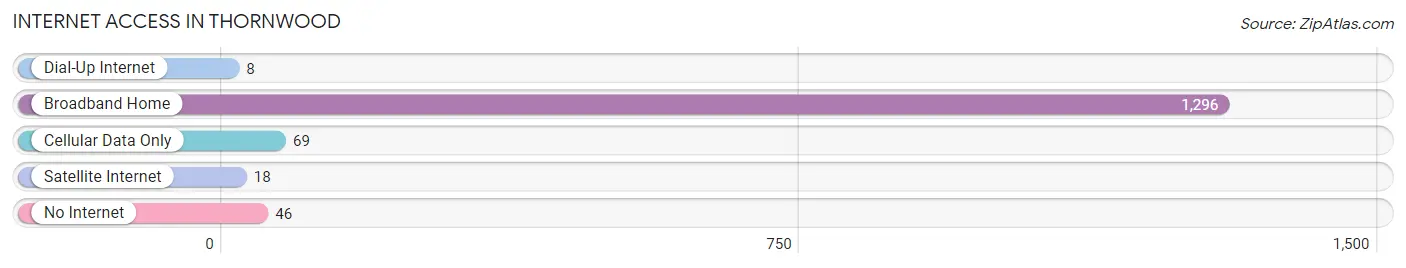
| Internet Type | # Households | % Households |
| Dial-Up Internet | 8 | 0.6% |
| Broadband Home | 1,296 | 90.8% |
| Cellular Data Only | 69 | 4.8% |
| Satellite Internet | 18 | 1.3% |
| No Internet | 46 | 3.2% |
| Total | 1,428 | 100.0% |
Thornwood Summary
Thornwood is a hamlet located in the town of Mount Pleasant in Westchester County, New York. It is situated about 30 miles north of New York City and is part of the New York metropolitan area. The hamlet is bordered by the towns of Pleasantville, Ossining, and North Castle.
History
The area that is now Thornwood was originally inhabited by the Siwanoy Native American tribe. The first European settlers arrived in the area in the late 17th century. The hamlet was originally known as “Thorn’s Wood” after the family who owned the land. The name was eventually shortened to Thornwood.
In the 19th century, the hamlet was a rural farming community. The area was known for its dairy farms and orchards. In the late 19th century, the hamlet began to develop into a residential community. The first post office was established in 1887.
Geography
Thornwood is located in the town of Mount Pleasant in Westchester County, New York. It is situated about 30 miles north of New York City and is part of the New York metropolitan area. The hamlet is bordered by the towns of Pleasantville, Ossining, and North Castle.
The hamlet is located in the Hudson Valley region of New York. The terrain is mostly hilly and wooded. The highest point in the hamlet is the summit of Bald Mountain, which is about 500 feet above sea level.
Economy
The economy of Thornwood is largely based on the service industry. The hamlet is home to several small businesses, including restaurants, retail stores, and professional services. The hamlet is also home to several corporate offices, including those of IBM and PepsiCo.
The hamlet is also home to several industrial parks, which provide employment opportunities for local residents. The industrial parks are home to a variety of businesses, including manufacturing, warehousing, and distribution.
Demographics
As of the 2010 census, the population of Thornwood was 5,945. The racial makeup of the hamlet was 87.3% White, 5.2% African American, 0.3% Native American, 3.2% Asian, and 3.9% from other races. Hispanic or Latino of any race were 8.2% of the population.
The median household income in Thornwood was $90,945, and the median family income was $103,945. The per capita income was $41,945. About 4.2% of families and 5.7% of the population were below the poverty line.
Thornwood is served by the Mount Pleasant Central School District. The hamlet is home to several public schools, including Westlake High School, Westlake Middle School, and Westlake Elementary School. The hamlet is also home to several private schools, including the Thornwood Montessori School and the Thornwood Christian Academy.
Common Questions
What is Per Capita Income in Thornwood?
Per Capita income in Thornwood is $66,607.
What is the Median Family Income in Thornwood?
Median Family Income in Thornwood is $207,386.
What is the Median Household income in Thornwood?
Median Household Income in Thornwood is $163,571.
What is Income or Wage Gap in Thornwood?
Income or Wage Gap in Thornwood is 40.8%.
Women in Thornwood earn 59.2 cents for every dollar earned by a man.
What is Inequality or Gini Index in Thornwood?
Inequality or Gini Index in Thornwood is 0.41.
What is the Total Population of Thornwood?
Total Population of Thornwood is 4,396.
What is the Total Male Population of Thornwood?
Total Male Population of Thornwood is 2,200.
What is the Total Female Population of Thornwood?
Total Female Population of Thornwood is 2,196.
What is the Ratio of Males per 100 Females in Thornwood?
There are 100.18 Males per 100 Females in Thornwood.
What is the Ratio of Females per 100 Males in Thornwood?
There are 99.82 Females per 100 Males in Thornwood.
What is the Median Population Age in Thornwood?
Median Population Age in Thornwood is 37.9 Years.
What is the Average Family Size in Thornwood
Average Family Size in Thornwood is 3.5 People.
What is the Average Household Size in Thornwood
Average Household Size in Thornwood is 3.0 People.
How Large is the Labor Force in Thornwood?
There are 2,428 People in the Labor Forcein in Thornwood.
What is the Percentage of People in the Labor Force in Thornwood?
68.6% of People are in the Labor Force in Thornwood.
What is the Unemployment Rate in Thornwood?
Unemployment Rate in Thornwood is 1.3%.