Bellerose, NY Map & Demographics
Bellerose Map
Bellerose Overview
$70,307
PER CAPITA INCOME
$224,375
AVG FAMILY INCOME
$204,167
AVG HOUSEHOLD INCOME
27.1%
WAGE / INCOME GAP [ % ]
72.9¢/ $1
WAGE / INCOME GAP [ $ ]
0.37
INEQUALITY / GINI INDEX
999
TOTAL POPULATION
507
MALE POPULATION
492
FEMALE POPULATION
103.05
MALES / 100 FEMALES
97.04
FEMALES / 100 MALES
43.0
MEDIAN AGE
3.4
AVG FAMILY SIZE
3.1
AVG HOUSEHOLD SIZE
421
LABOR FORCE [ PEOPLE ]
54.5%
PERCENT IN LABOR FORCE
6.2%
UNEMPLOYMENT RATE
Bellerose Zip Codes
Income in Bellerose
Income Overview in Bellerose
Per Capita Income in Bellerose is $70,307, while median incomes of families and households are $224,375 and $204,167 respectively.
| Characteristic | Number | Measure |
| Per Capita Income | 999 | $70,307 |
| Median Family Income | 281 | $224,375 |
| Mean Family Income | 281 | $231,536 |
| Median Household Income | 322 | $204,167 |
| Mean Household Income | 322 | $215,260 |
| Income Deficit | 281 | $0 |
| Wage / Income Gap (%) | 999 | 27.12% |
| Wage / Income Gap ($) | 999 | 72.88¢ per $1 |
| Gini / Inequality Index | 999 | 0.37 |
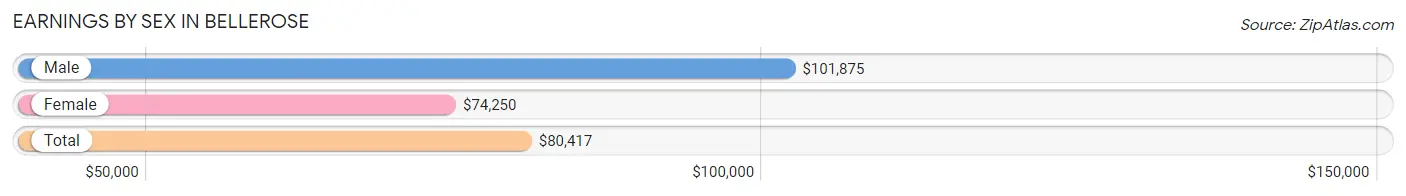
Earnings by Sex in Bellerose
Average Earnings in Bellerose are $80,417, $101,875 for men and $74,250 for women, a difference of 27.1%.
| Sex | Number | Average Earnings |
| Male | 271 (57.7%) | $101,875 |
| Female | 199 (42.3%) | $74,250 |
| Total | 470 (100.0%) | $80,417 |
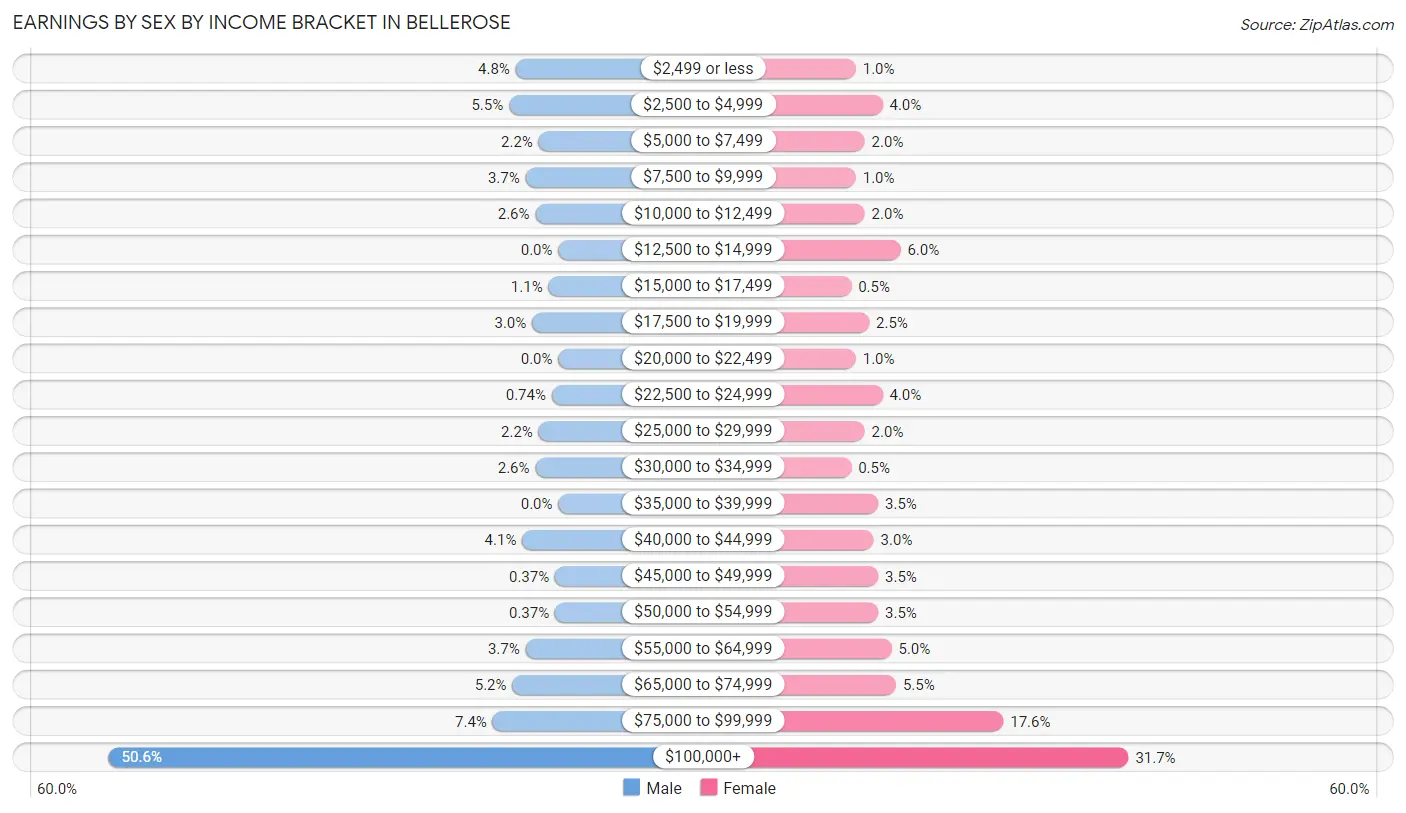
Earnings by Sex by Income Bracket in Bellerose
The most common earnings brackets in Bellerose are $100,000+ for men (137 | 50.5%) and $100,000+ for women (63 | 31.7%).
| Income | Male | Female |
| $2,499 or less | 13 (4.8%) | 2 (1.0%) |
| $2,500 to $4,999 | 15 (5.5%) | 8 (4.0%) |
| $5,000 to $7,499 | 6 (2.2%) | 4 (2.0%) |
| $7,500 to $9,999 | 10 (3.7%) | 2 (1.0%) |
| $10,000 to $12,499 | 7 (2.6%) | 4 (2.0%) |
| $12,500 to $14,999 | 0 (0.0%) | 12 (6.0%) |
| $15,000 to $17,499 | 3 (1.1%) | 1 (0.5%) |
| $17,500 to $19,999 | 8 (2.9%) | 5 (2.5%) |
| $20,000 to $22,499 | 0 (0.0%) | 2 (1.0%) |
| $22,500 to $24,999 | 2 (0.7%) | 8 (4.0%) |
| $25,000 to $29,999 | 6 (2.2%) | 4 (2.0%) |
| $30,000 to $34,999 | 7 (2.6%) | 1 (0.5%) |
| $35,000 to $39,999 | 0 (0.0%) | 7 (3.5%) |
| $40,000 to $44,999 | 11 (4.1%) | 6 (3.0%) |
| $45,000 to $49,999 | 1 (0.4%) | 7 (3.5%) |
| $50,000 to $54,999 | 1 (0.4%) | 7 (3.5%) |
| $55,000 to $64,999 | 10 (3.7%) | 10 (5.0%) |
| $65,000 to $74,999 | 14 (5.2%) | 11 (5.5%) |
| $75,000 to $99,999 | 20 (7.4%) | 35 (17.6%) |
| $100,000+ | 137 (50.5%) | 63 (31.7%) |
| Total | 271 (100.0%) | 199 (100.0%) |
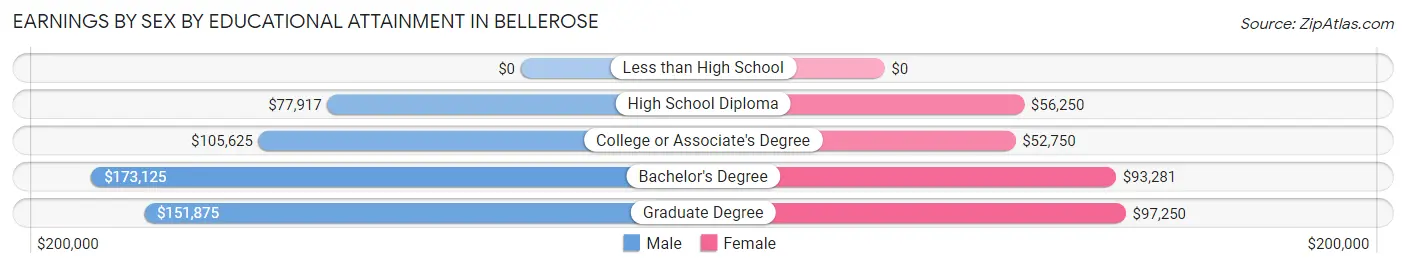
Earnings by Sex by Educational Attainment in Bellerose
Average earnings in Bellerose are $138,250 for men and $77,917 for women, a difference of 43.6%. Men with an educational attainment of bachelor's degree enjoy the highest average annual earnings of $173,125, while those with high school diploma education earn the least with $77,917. Women with an educational attainment of graduate degree earn the most with the average annual earnings of $97,250, while those with college or associate's degree education have the smallest earnings of $52,750.
| Educational Attainment | Male Income | Female Income |
| Less than High School | - | - |
| High School Diploma | $77,917 | $56,250 |
| College or Associate's Degree | $105,625 | $52,750 |
| Bachelor's Degree | $173,125 | $93,281 |
| Graduate Degree | $151,875 | $97,250 |
| Total | $138,250 | $77,917 |
Family Income in Bellerose
Family Income Brackets in Bellerose
According to the Bellerose family income data, there are 159 families falling into the $200,000+ income range, which is the most common income bracket and makes up 56.6% of all families.
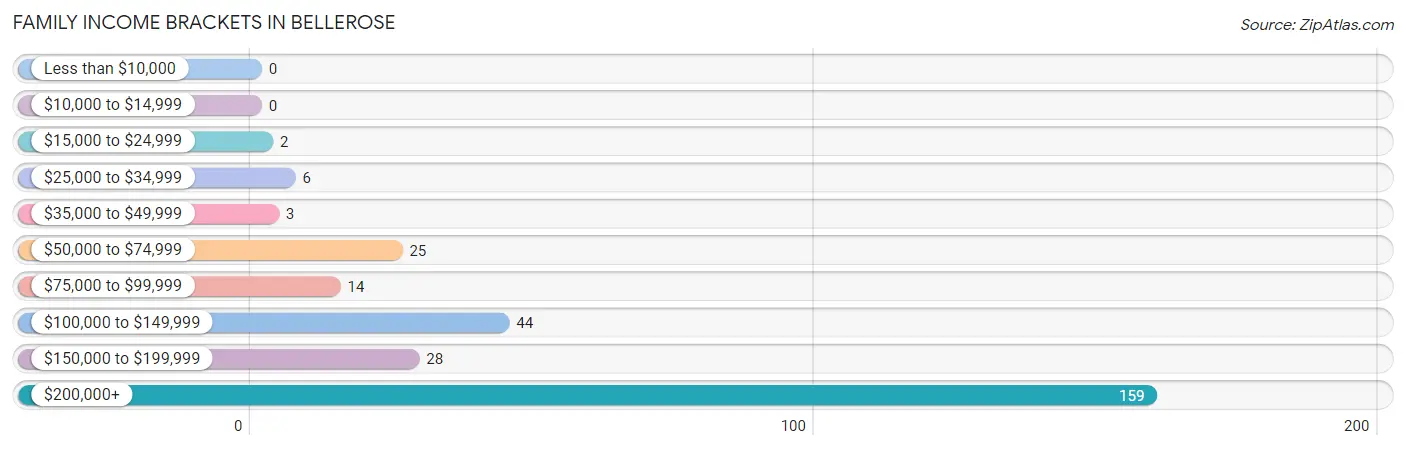
| Income Bracket | # Families | % Families |
| Less than $10,000 | 0 | 0.0% |
| $10,000 to $14,999 | 0 | 0.0% |
| $15,000 to $24,999 | 2 | 0.7% |
| $25,000 to $34,999 | 6 | 2.1% |
| $35,000 to $49,999 | 3 | 1.1% |
| $50,000 to $74,999 | 25 | 8.9% |
| $75,000 to $99,999 | 14 | 5.0% |
| $100,000 to $149,999 | 44 | 15.7% |
| $150,000 to $199,999 | 28 | 10.0% |
| $200,000+ | 159 | 56.6% |
Family Income by Famaliy Size in Bellerose
6-person families (6 | 2.1%) account for the highest median family income in Bellerose with $250,001 per family, while 3-person families (51 | 18.1%) have the highest median income of $80,521 per family member.
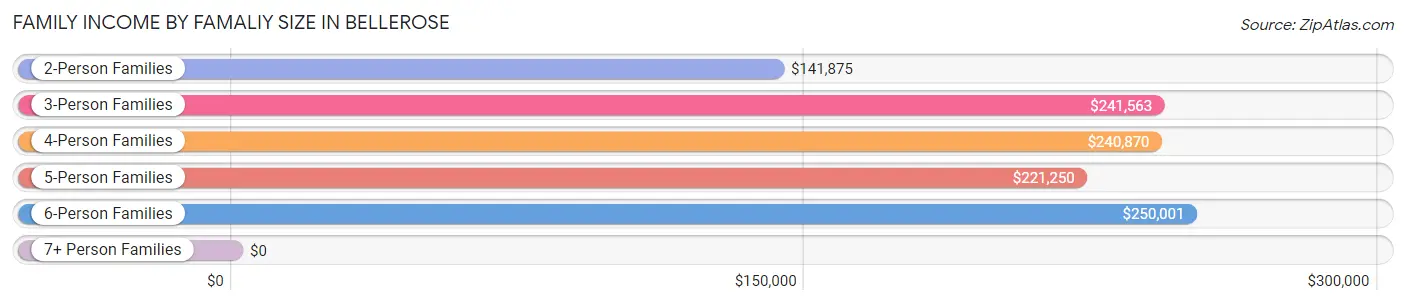
| Income Bracket | # Families | Median Income |
| 2-Person Families | 95 (33.8%) | $141,875 |
| 3-Person Families | 51 (18.1%) | $241,563 |
| 4-Person Families | 94 (33.5%) | $240,870 |
| 5-Person Families | 35 (12.5%) | $221,250 |
| 6-Person Families | 6 (2.1%) | $250,001 |
| 7+ Person Families | 0 (0.0%) | $0 |
| Total | 281 (100.0%) | $224,375 |
Family Income by Number of Earners in Bellerose
The median family income in Bellerose is $224,375, with families comprising 2 earners (101) having the highest median family income of $250,001, while families with no earners (43) have the lowest median family income of $104,063, accounting for 35.9% and 15.3% of families, respectively.
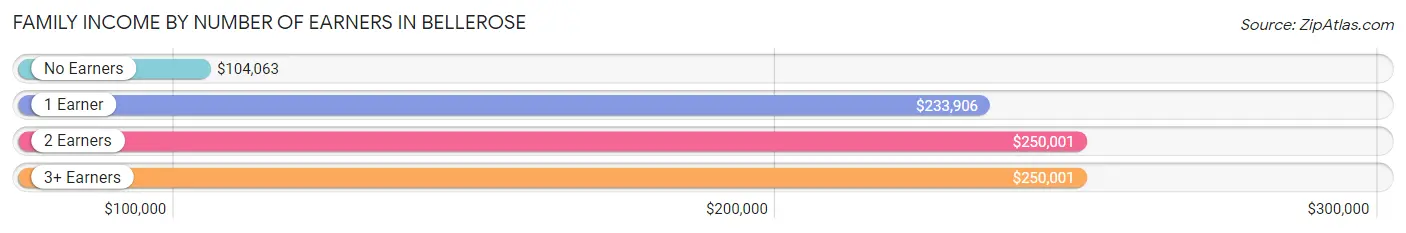
| Number of Earners | # Families | Median Income |
| No Earners | 43 (15.3%) | $104,063 |
| 1 Earner | 91 (32.4%) | $233,906 |
| 2 Earners | 101 (35.9%) | $250,001 |
| 3+ Earners | 46 (16.4%) | $250,001 |
| Total | 281 (100.0%) | $224,375 |
Household Income in Bellerose
Household Income Brackets in Bellerose
With 165 households falling in the category, the $200,000+ income range is the most frequent in Bellerose, accounting for 51.2% of all households. In contrast, only 1 households (0.3%) fall into the less than $10,000 income bracket, making it the least populous group.
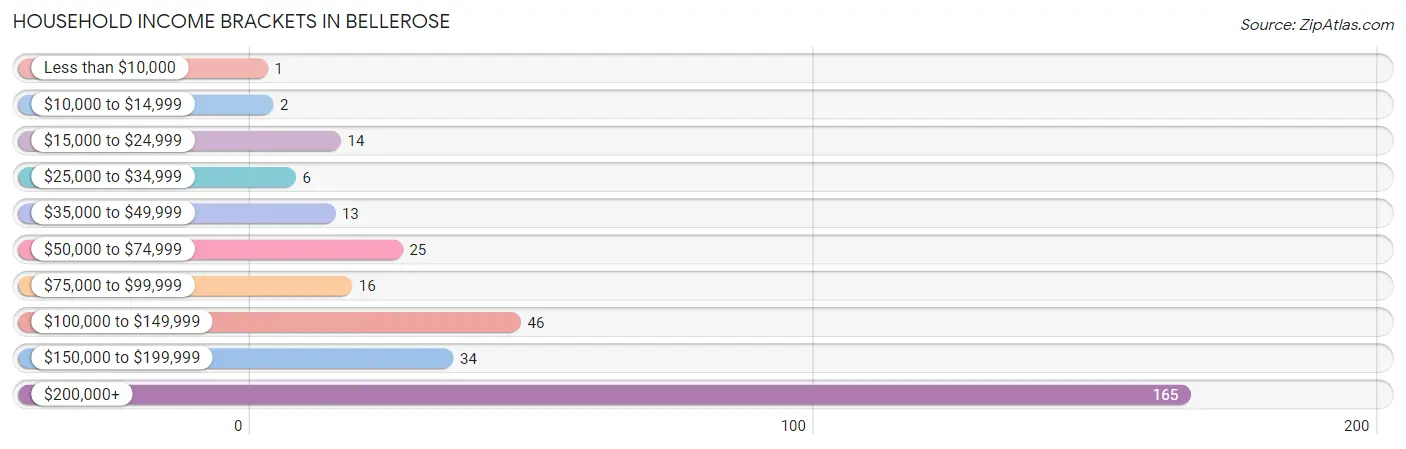
| Income Bracket | # Households | % Households |
| Less than $10,000 | 1 | 0.3% |
| $10,000 to $14,999 | 2 | 0.6% |
| $15,000 to $24,999 | 14 | 4.3% |
| $25,000 to $34,999 | 6 | 1.9% |
| $35,000 to $49,999 | 13 | 4.0% |
| $50,000 to $74,999 | 25 | 7.8% |
| $75,000 to $99,999 | 16 | 5.0% |
| $100,000 to $149,999 | 46 | 14.3% |
| $150,000 to $199,999 | 34 | 10.6% |
| $200,000+ | 165 | 51.2% |
Household Income by Householder Age in Bellerose
The median household income in Bellerose is $204,167, with the highest median household income of $250,001 found in the 25 to 44 years age bracket for the primary householder. A total of 48 households (14.9%) fall into this category.
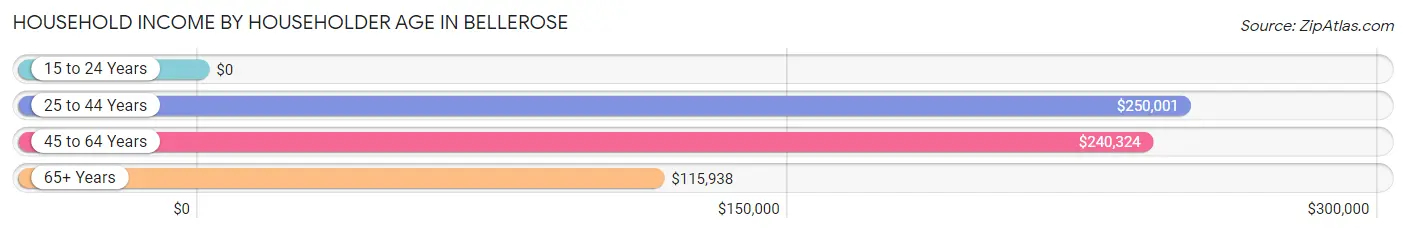
| Income Bracket | # Households | Median Income |
| 15 to 24 Years | 0 (0.0%) | $0 |
| 25 to 44 Years | 48 (14.9%) | $250,001 |
| 45 to 64 Years | 147 (45.7%) | $240,324 |
| 65+ Years | 127 (39.4%) | $115,938 |
| Total | 322 (100.0%) | $204,167 |
Poverty in Bellerose
Income Below Poverty by Sex and Age in Bellerose
With 1.8% poverty level for males and 0.8% for females among the residents of Bellerose, 25 to 34 year old males and 18 to 24 year old females are the most vulnerable to poverty, with 2 males (5.1%) and 2 females (8.3%) in their respective age groups living below the poverty level.
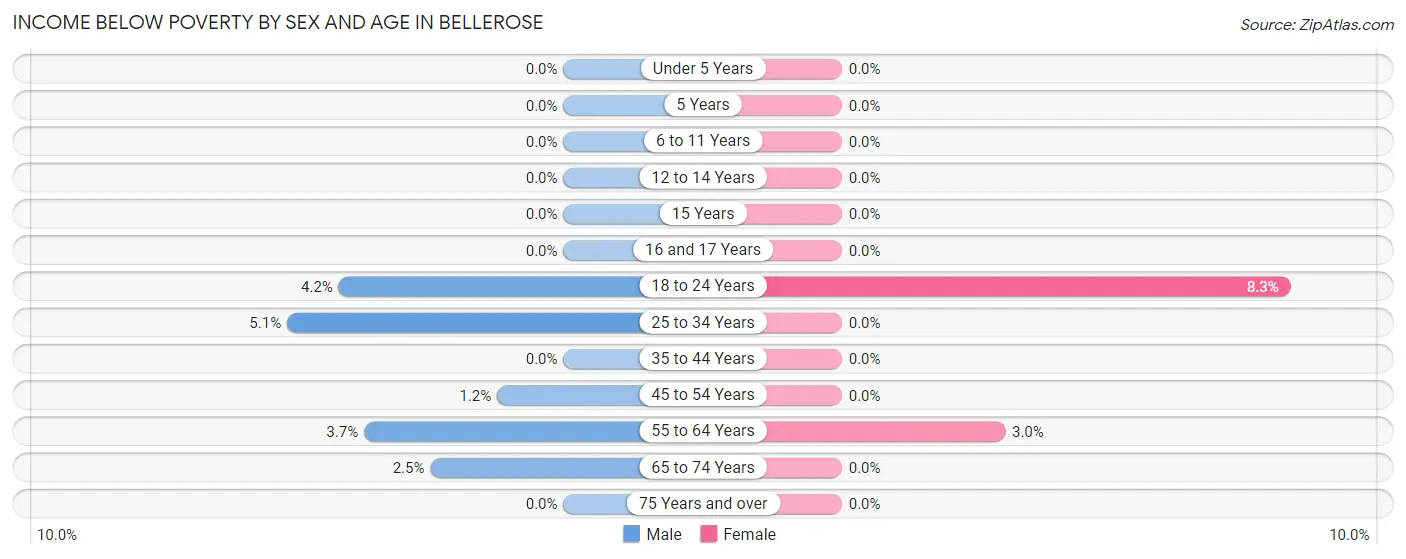
| Age Bracket | Male | Female |
| Under 5 Years | 0 (0.0%) | 0 (0.0%) |
| 5 Years | 0 (0.0%) | 0 (0.0%) |
| 6 to 11 Years | 0 (0.0%) | 0 (0.0%) |
| 12 to 14 Years | 0 (0.0%) | 0 (0.0%) |
| 15 Years | 0 (0.0%) | 0 (0.0%) |
| 16 and 17 Years | 0 (0.0%) | 0 (0.0%) |
| 18 to 24 Years | 2 (4.2%) | 2 (8.3%) |
| 25 to 34 Years | 2 (5.1%) | 0 (0.0%) |
| 35 to 44 Years | 0 (0.0%) | 0 (0.0%) |
| 45 to 54 Years | 1 (1.2%) | 0 (0.0%) |
| 55 to 64 Years | 2 (3.7%) | 2 (3.0%) |
| 65 to 74 Years | 2 (2.5%) | 0 (0.0%) |
| 75 Years and over | 0 (0.0%) | 0 (0.0%) |
| Total | 9 (1.8%) | 4 (0.8%) |
Income Above Poverty by Sex and Age in Bellerose
According to the poverty statistics in Bellerose, males aged under 5 years and females aged under 5 years are the age groups that are most secure financially, with 100.0% of males and 100.0% of females in these age groups living above the poverty line.
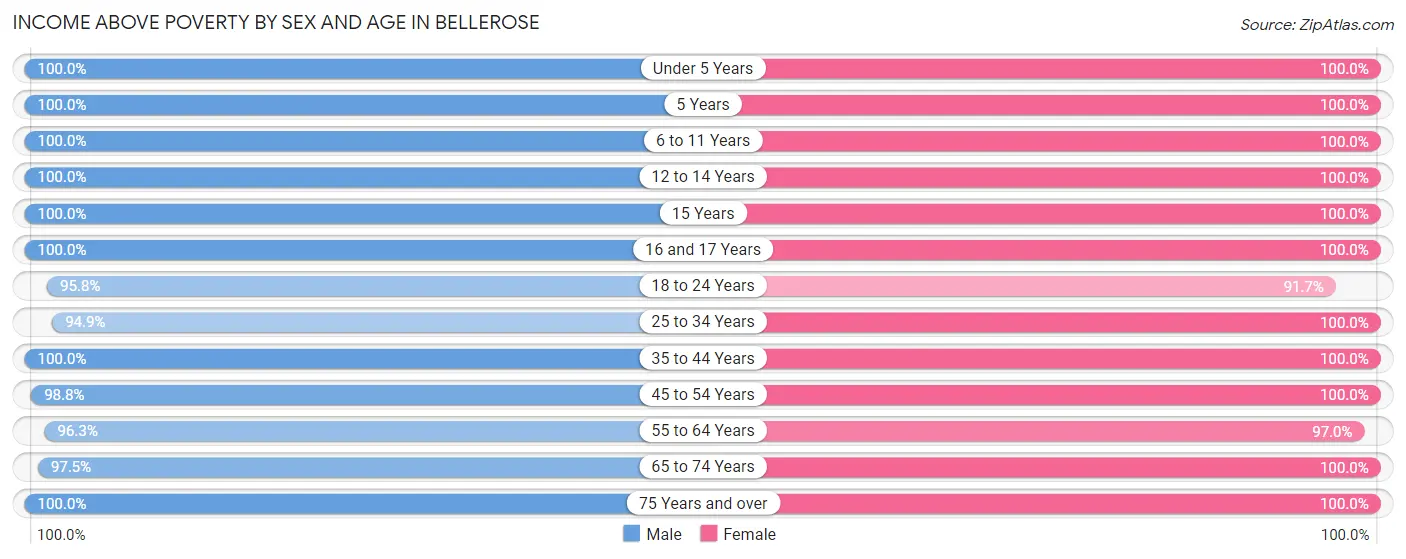
| Age Bracket | Male | Female |
| Under 5 Years | 14 (100.0%) | 57 (100.0%) |
| 5 Years | 6 (100.0%) | 4 (100.0%) |
| 6 to 11 Years | 42 (100.0%) | 49 (100.0%) |
| 12 to 14 Years | 19 (100.0%) | 13 (100.0%) |
| 15 Years | 12 (100.0%) | 10 (100.0%) |
| 16 and 17 Years | 22 (100.0%) | 5 (100.0%) |
| 18 to 24 Years | 46 (95.8%) | 22 (91.7%) |
| 25 to 34 Years | 37 (94.9%) | 35 (100.0%) |
| 35 to 44 Years | 60 (100.0%) | 60 (100.0%) |
| 45 to 54 Years | 80 (98.8%) | 62 (100.0%) |
| 55 to 64 Years | 52 (96.3%) | 64 (97.0%) |
| 65 to 74 Years | 79 (97.5%) | 74 (100.0%) |
| 75 Years and over | 29 (100.0%) | 33 (100.0%) |
| Total | 498 (98.2%) | 488 (99.2%) |
Income Below Poverty Among Married-Couple Families in Bellerose
The poverty statistics for married-couple families in Bellerose show that 0.8% or 2 of the total 251 families live below the poverty line. Families with no children have the highest poverty rate of 1.6%, comprising of 2 families. On the other hand, families with 1 or 2 children have the lowest poverty rate of 0.0%, which includes 0 families.
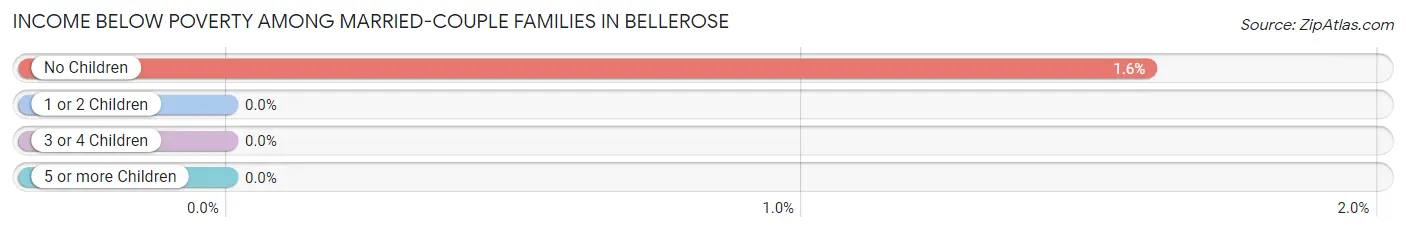
| Children | Above Poverty | Below Poverty |
| No Children | 123 (98.4%) | 2 (1.6%) |
| 1 or 2 Children | 103 (100.0%) | 0 (0.0%) |
| 3 or 4 Children | 23 (100.0%) | 0 (0.0%) |
| 5 or more Children | 0 (0.0%) | 0 (0.0%) |
| Total | 249 (99.2%) | 2 (0.8%) |
Income Below Poverty Among Single-Parent Households in Bellerose
| Children | Single Father | Single Mother |
| No Children | 0 (0.0%) | 0 (0.0%) |
| 1 or 2 Children | 0 (0.0%) | 0 (0.0%) |
| 3 or 4 Children | 0 (0.0%) | 0 (0.0%) |
| 5 or more Children | 0 (0.0%) | 0 (0.0%) |
| Total | 0 (0.0%) | 0 (0.0%) |
Income Below Poverty Among Married-Couple vs Single-Parent Households in Bellerose
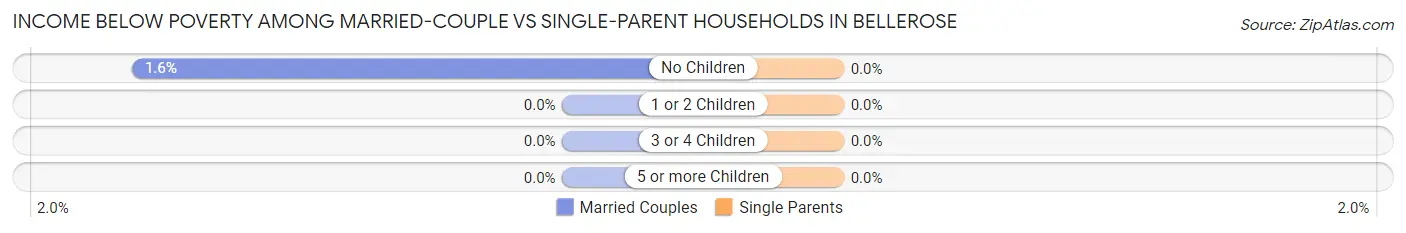
| Children | Married-Couple Families | Single-Parent Households |
| No Children | 2 (1.6%) | 0 (0.0%) |
| 1 or 2 Children | 0 (0.0%) | 0 (0.0%) |
| 3 or 4 Children | 0 (0.0%) | 0 (0.0%) |
| 5 or more Children | 0 (0.0%) | 0 (0.0%) |
| Total | 2 (0.8%) | 0 (0.0%) |
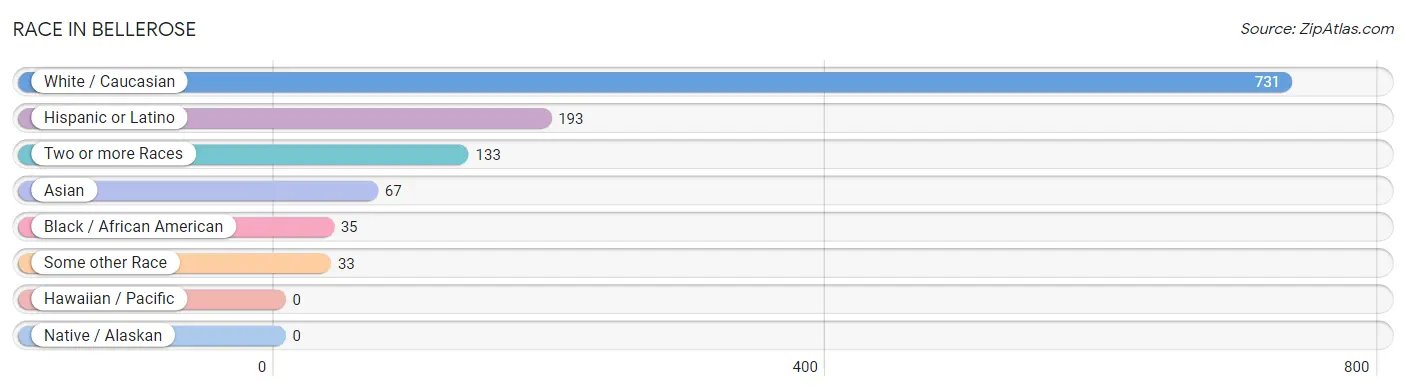
Race in Bellerose
The most populous races in Bellerose are White / Caucasian (731 | 73.2%), Hispanic or Latino (193 | 19.3%), and Two or more Races (133 | 13.3%).
| Race | # Population | % Population |
| Asian | 67 | 6.7% |
| Black / African American | 35 | 3.5% |
| Hawaiian / Pacific | 0 | 0.0% |
| Hispanic or Latino | 193 | 19.3% |
| Native / Alaskan | 0 | 0.0% |
| White / Caucasian | 731 | 73.2% |
| Two or more Races | 133 | 13.3% |
| Some other Race | 33 | 3.3% |
| Total | 999 | 100.0% |
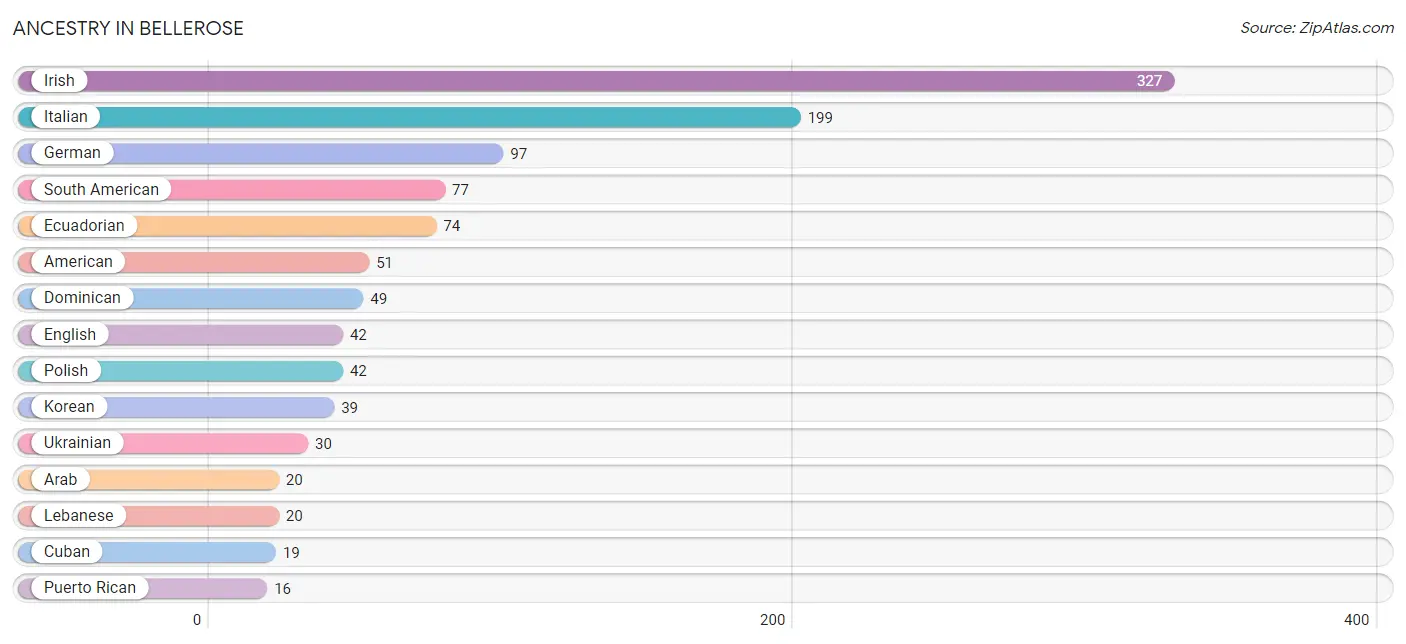
Ancestry in Bellerose
The most populous ancestries reported in Bellerose are Irish (327 | 32.7%), Italian (199 | 19.9%), German (97 | 9.7%), South American (77 | 7.7%), and Ecuadorian (74 | 7.4%), together accounting for 77.5% of all Bellerose residents.
| Ancestry | # Population | % Population |
| Alsatian | 1 | 0.1% |
| American | 51 | 5.1% |
| Arab | 20 | 2.0% |
| Argentinean | 3 | 0.3% |
| Armenian | 4 | 0.4% |
| Austrian | 13 | 1.3% |
| Basque | 9 | 0.9% |
| British | 1 | 0.1% |
| Burmese | 2 | 0.2% |
| Canadian | 3 | 0.3% |
| Cuban | 19 | 1.9% |
| Czech | 4 | 0.4% |
| Danish | 2 | 0.2% |
| Dominican | 49 | 4.9% |
| Dutch | 1 | 0.1% |
| Ecuadorian | 74 | 7.4% |
| English | 42 | 4.2% |
| European | 7 | 0.7% |
| Finnish | 6 | 0.6% |
| French | 4 | 0.4% |
| French Canadian | 2 | 0.2% |
| German | 97 | 9.7% |
| Greek | 4 | 0.4% |
| Hungarian | 7 | 0.7% |
| Indian (Asian) | 15 | 1.5% |
| Irish | 327 | 32.7% |
| Italian | 199 | 19.9% |
| Jamaican | 7 | 0.7% |
| Korean | 39 | 3.9% |
| Lebanese | 20 | 2.0% |
| Lithuanian | 2 | 0.2% |
| Mexican | 10 | 1.0% |
| Norwegian | 1 | 0.1% |
| Pakistani | 1 | 0.1% |
| Polish | 42 | 4.2% |
| Portuguese | 3 | 0.3% |
| Puerto Rican | 16 | 1.6% |
| Russian | 11 | 1.1% |
| Scotch-Irish | 12 | 1.2% |
| Slavic | 2 | 0.2% |
| South American | 77 | 7.7% |
| Spaniard | 16 | 1.6% |
| Swedish | 15 | 1.5% |
| Swiss | 3 | 0.3% |
| Thai | 16 | 1.6% |
| Ukrainian | 30 | 3.0% | View All 46 Rows |
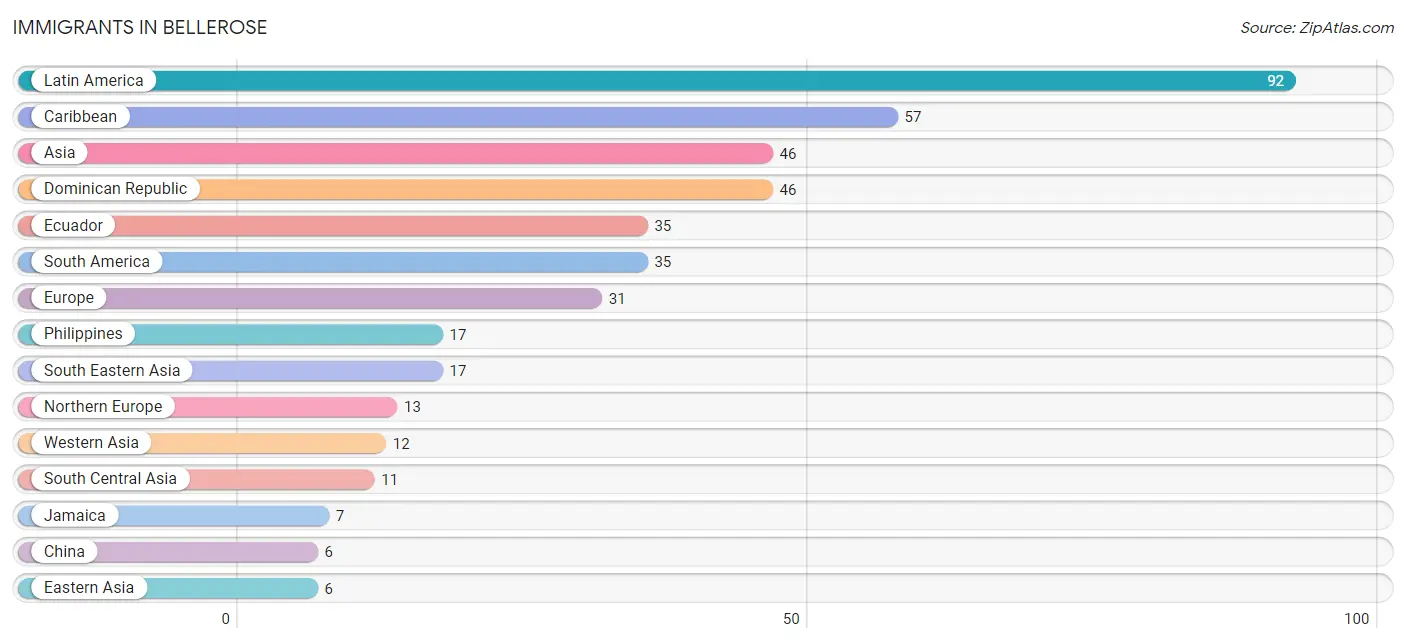
Immigrants in Bellerose
The most numerous immigrant groups reported in Bellerose came from Latin America (92 | 9.2%), Caribbean (57 | 5.7%), Asia (46 | 4.6%), Dominican Republic (46 | 4.6%), and Ecuador (35 | 3.5%), together accounting for 27.6% of all Bellerose residents.
| Immigration Origin | # Population | % Population |
| Asia | 46 | 4.6% |
| Bangladesh | 4 | 0.4% |
| Canada | 3 | 0.3% |
| Caribbean | 57 | 5.7% |
| China | 6 | 0.6% |
| Cuba | 4 | 0.4% |
| Dominican Republic | 46 | 4.6% |
| Eastern Asia | 6 | 0.6% |
| Eastern Europe | 6 | 0.6% |
| Ecuador | 35 | 3.5% |
| England | 6 | 0.6% |
| Europe | 31 | 3.1% |
| Germany | 6 | 0.6% |
| Greece | 1 | 0.1% |
| Hong Kong | 2 | 0.2% |
| Hungary | 3 | 0.3% |
| India | 6 | 0.6% |
| Ireland | 6 | 0.6% |
| Italy | 3 | 0.3% |
| Jamaica | 7 | 0.7% |
| Kazakhstan | 1 | 0.1% |
| Kuwait | 6 | 0.6% |
| Latin America | 92 | 9.2% |
| Lebanon | 6 | 0.6% |
| Northern Europe | 13 | 1.3% |
| Philippines | 17 | 1.7% |
| Poland | 1 | 0.1% |
| Romania | 2 | 0.2% |
| Scotland | 1 | 0.1% |
| South America | 35 | 3.5% |
| South Central Asia | 11 | 1.1% |
| South Eastern Asia | 17 | 1.7% |
| Southern Europe | 6 | 0.6% |
| Spain | 2 | 0.2% |
| Western Asia | 12 | 1.2% |
| Western Europe | 6 | 0.6% | View All 36 Rows |
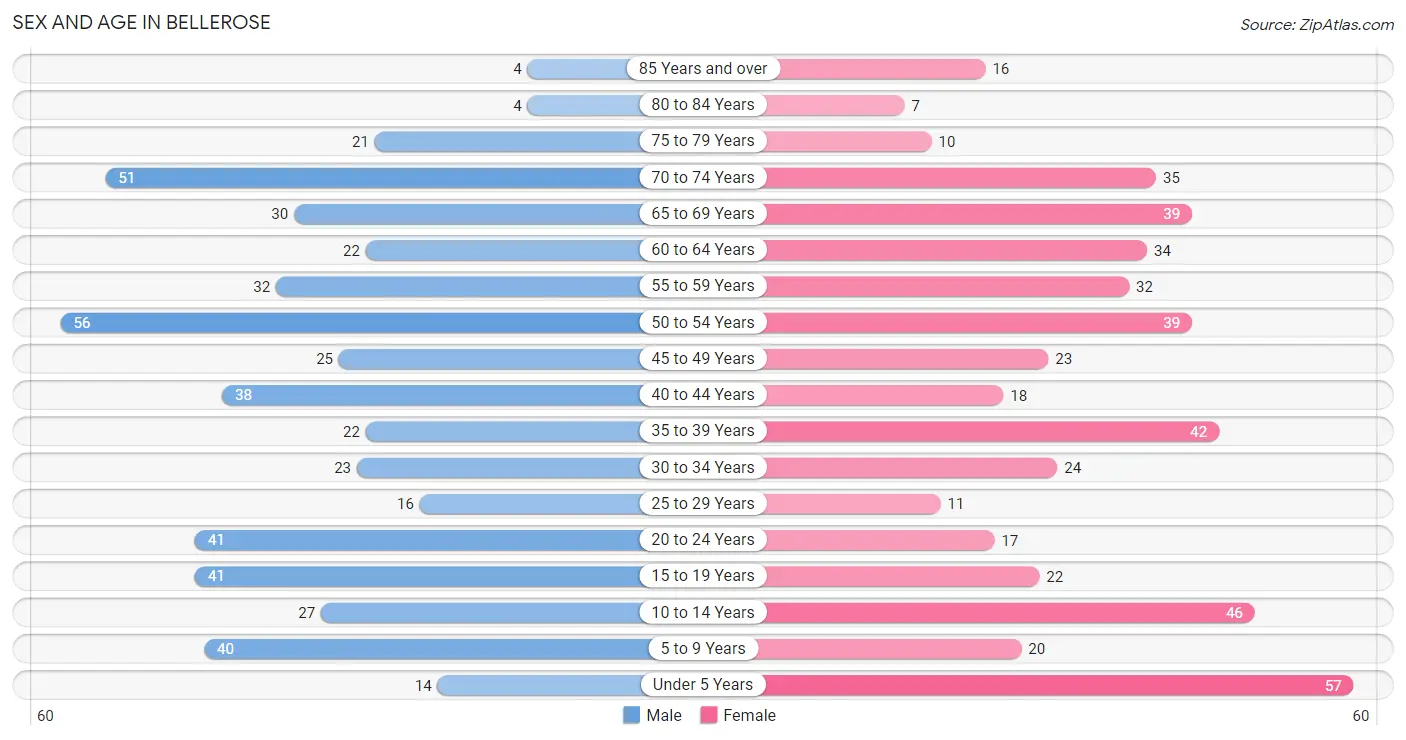
Sex and Age in Bellerose
Sex and Age in Bellerose
The most populous age groups in Bellerose are 50 to 54 Years (56 | 11.1%) for men and Under 5 Years (57 | 11.6%) for women.
| Age Bracket | Male | Female |
| Under 5 Years | 14 (2.8%) | 57 (11.6%) |
| 5 to 9 Years | 40 (7.9%) | 20 (4.1%) |
| 10 to 14 Years | 27 (5.3%) | 46 (9.3%) |
| 15 to 19 Years | 41 (8.1%) | 22 (4.5%) |
| 20 to 24 Years | 41 (8.1%) | 17 (3.5%) |
| 25 to 29 Years | 16 (3.2%) | 11 (2.2%) |
| 30 to 34 Years | 23 (4.5%) | 24 (4.9%) |
| 35 to 39 Years | 22 (4.3%) | 42 (8.5%) |
| 40 to 44 Years | 38 (7.5%) | 18 (3.7%) |
| 45 to 49 Years | 25 (4.9%) | 23 (4.7%) |
| 50 to 54 Years | 56 (11.1%) | 39 (7.9%) |
| 55 to 59 Years | 32 (6.3%) | 32 (6.5%) |
| 60 to 64 Years | 22 (4.3%) | 34 (6.9%) |
| 65 to 69 Years | 30 (5.9%) | 39 (7.9%) |
| 70 to 74 Years | 51 (10.1%) | 35 (7.1%) |
| 75 to 79 Years | 21 (4.1%) | 10 (2.0%) |
| 80 to 84 Years | 4 (0.8%) | 7 (1.4%) |
| 85 Years and over | 4 (0.8%) | 16 (3.3%) |
| Total | 507 (100.0%) | 492 (100.0%) |
Families and Households in Bellerose
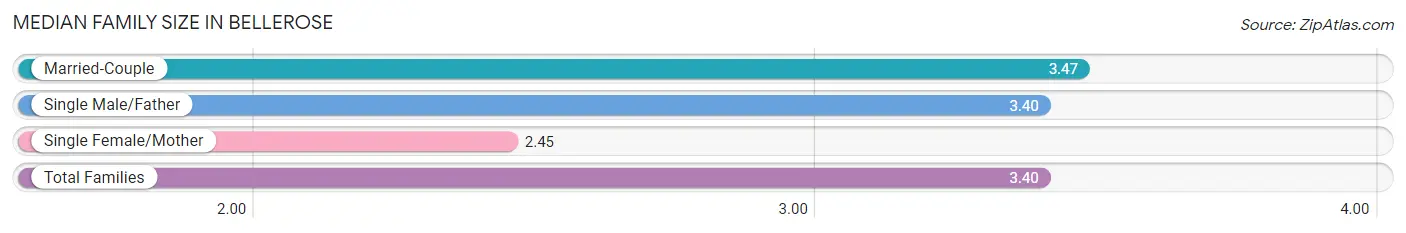
Median Family Size in Bellerose
The median family size in Bellerose is 3.40 persons per family, with married-couple families (251 | 89.3%) accounting for the largest median family size of 3.47 persons per family. On the other hand, single female/mother families (20 | 7.1%) represent the smallest median family size with 2.45 persons per family.
| Family Type | # Families | Family Size |
| Married-Couple | 251 (89.3%) | 3.47 |
| Single Male/Father | 10 (3.6%) | 3.40 |
| Single Female/Mother | 20 (7.1%) | 2.45 |
| Total Families | 281 (100.0%) | 3.40 |
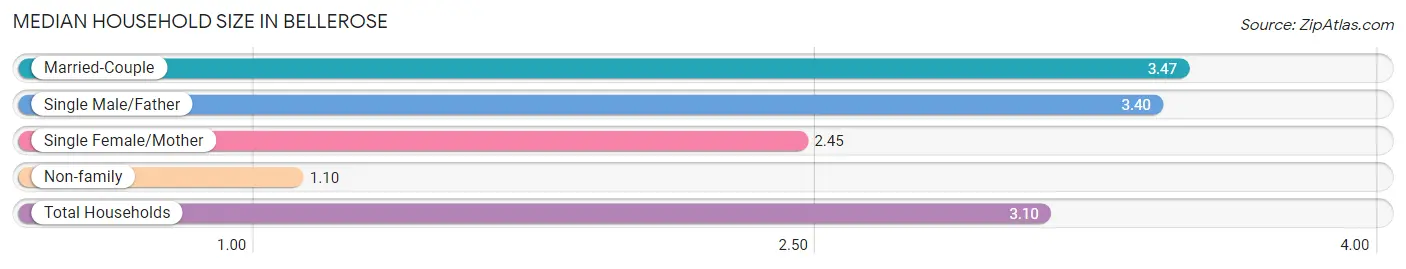
Median Household Size in Bellerose
The median household size in Bellerose is 3.10 persons per household, with married-couple households (251 | 77.9%) accounting for the largest median household size of 3.47 persons per household. non-family households (41 | 12.7%) represent the smallest median household size with 1.10 persons per household.
| Household Type | # Households | Household Size |
| Married-Couple | 251 (77.9%) | 3.47 |
| Single Male/Father | 10 (3.1%) | 3.40 |
| Single Female/Mother | 20 (6.2%) | 2.45 |
| Non-family | 41 (12.7%) | 1.10 |
| Total Households | 322 (100.0%) | 3.10 |
Household Size by Marriage Status in Bellerose
Out of a total of 322 households in Bellerose, 281 (87.3%) are family households, while 41 (12.7%) are nonfamily households. The most numerous type of family households are 2-person households, comprising 95, and the most common type of nonfamily households are 1-person households, comprising 37.
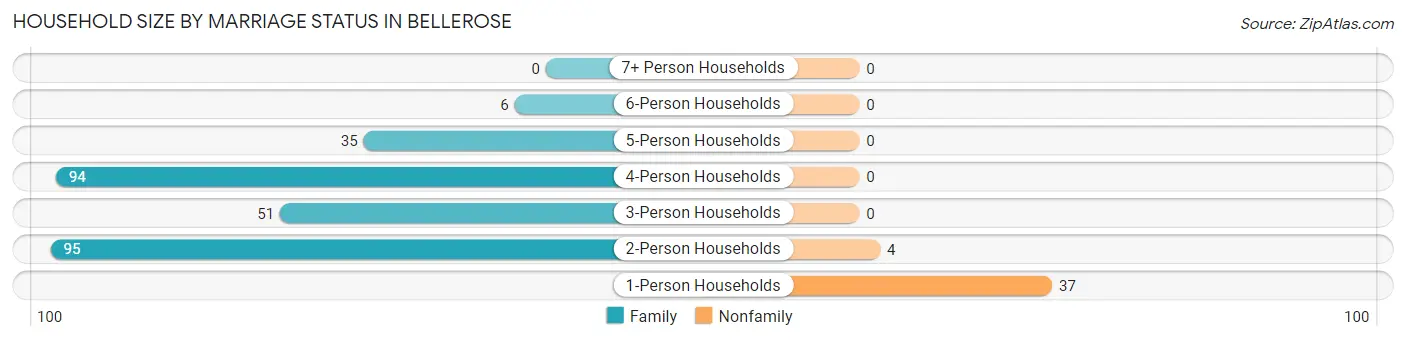
| Household Size | Family Households | Nonfamily Households |
| 1-Person Households | - | 37 (11.5%) |
| 2-Person Households | 95 (29.5%) | 4 (1.2%) |
| 3-Person Households | 51 (15.8%) | 0 (0.0%) |
| 4-Person Households | 94 (29.2%) | 0 (0.0%) |
| 5-Person Households | 35 (10.9%) | 0 (0.0%) |
| 6-Person Households | 6 (1.9%) | 0 (0.0%) |
| 7+ Person Households | 0 (0.0%) | 0 (0.0%) |
| Total | 281 (87.3%) | 41 (12.7%) |
Female Fertility in Bellerose
Fertility by Age in Bellerose
Average fertility rate in Bellerose is 30.0 births per 1,000 women. Women in the age bracket of 20 to 34 years have the highest fertility rate with 58.0 births per 1,000 women. Women in the age bracket of 20 to 34 years acount for 60.0% of all women with births.
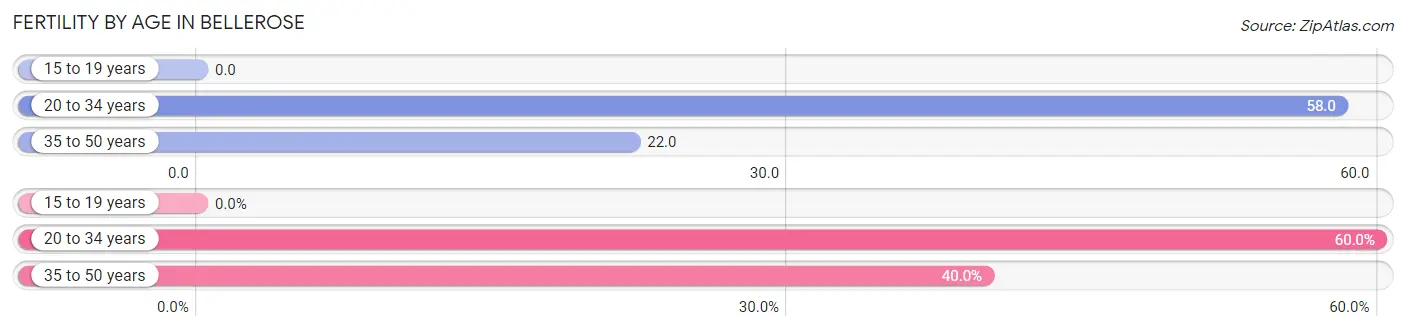
| Age Bracket | Women with Births | Births / 1,000 Women |
| 15 to 19 years | 0 (0.0%) | 0.0 |
| 20 to 34 years | 3 (60.0%) | 58.0 |
| 35 to 50 years | 2 (40.0%) | 22.0 |
| Total | 5 (100.0%) | 30.0 |
Fertility by Age by Marriage Status in Bellerose
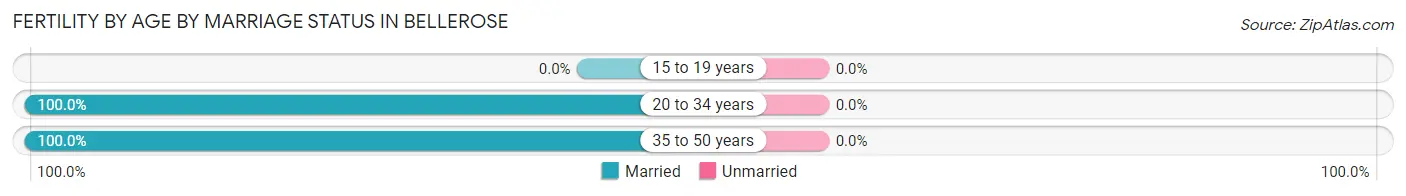
| Age Bracket | Married | Unmarried |
| 15 to 19 years | 0 (0.0%) | 0 (0.0%) |
| 20 to 34 years | 3 (100.0%) | 0 (0.0%) |
| 35 to 50 years | 2 (100.0%) | 0 (0.0%) |
| Total | 5 (100.0%) | 0 (0.0%) |
Fertility by Education in Bellerose
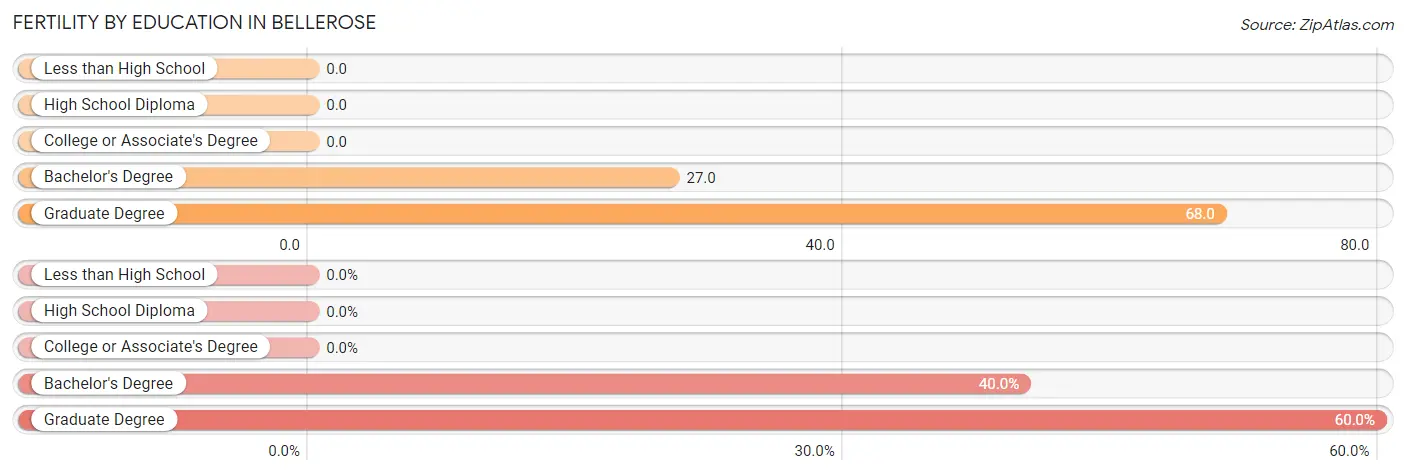
| Educational Attainment | Women with Births | Births / 1,000 Women |
| Less than High School | 0 (0.0%) | 0.0 |
| High School Diploma | 0 (0.0%) | 0.0 |
| College or Associate's Degree | 0 (0.0%) | 0.0 |
| Bachelor's Degree | 2 (40.0%) | 27.0 |
| Graduate Degree | 3 (60.0%) | 68.0 |
| Total | 5 (100.0%) | 30.0 |
Fertility by Education by Marriage Status in Bellerose
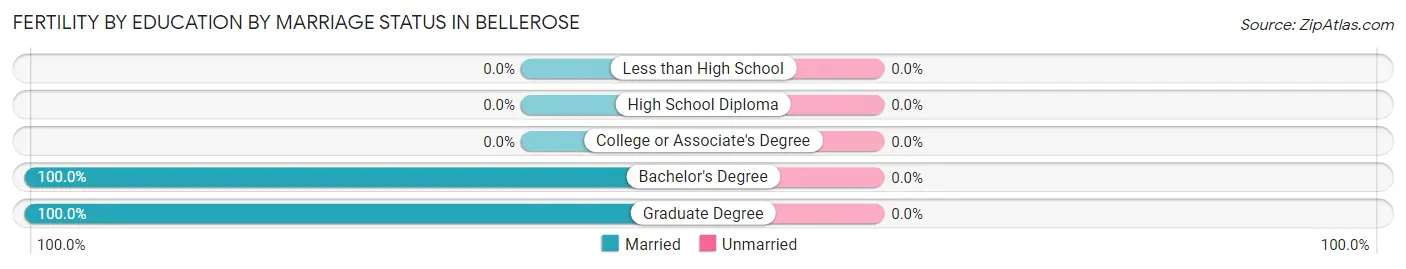
| Educational Attainment | Married | Unmarried |
| Less than High School | 0 (0.0%) | 0 (0.0%) |
| High School Diploma | 0 (0.0%) | 0 (0.0%) |
| College or Associate's Degree | 0 (0.0%) | 0 (0.0%) |
| Bachelor's Degree | 2 (100.0%) | 0 (0.0%) |
| Graduate Degree | 3 (100.0%) | 0 (0.0%) |
| Total | 5 (100.0%) | 0 (0.0%) |
Employment Characteristics in Bellerose
Employment by Class of Employer in Bellerose
Among the 392 employed individuals in Bellerose, private company employees (229 | 58.4%), not-for-profit organizations (49 | 12.5%), and local government employees (48 | 12.2%) make up the most common classes of employment.
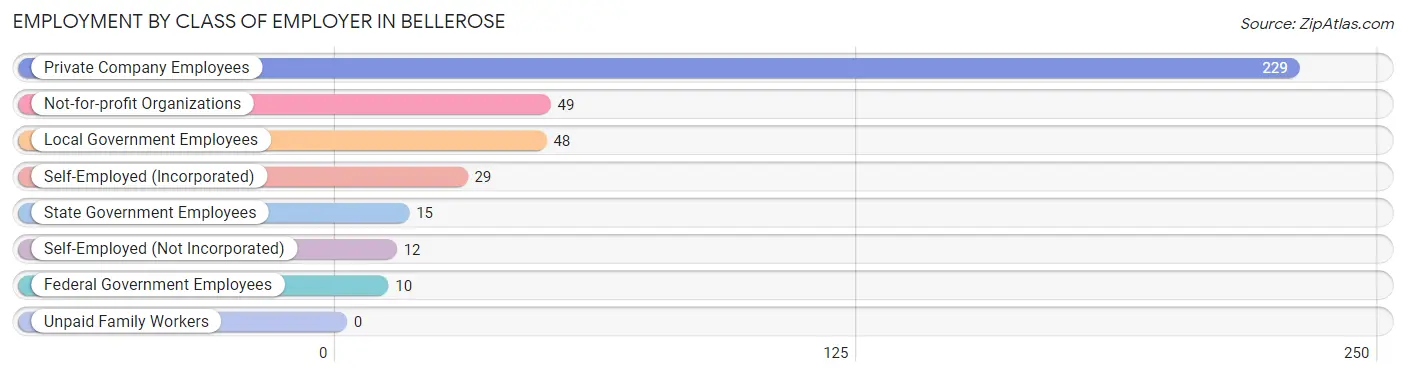
| Employer Class | # Employees | % Employees |
| Private Company Employees | 229 | 58.4% |
| Self-Employed (Incorporated) | 29 | 7.4% |
| Self-Employed (Not Incorporated) | 12 | 3.1% |
| Not-for-profit Organizations | 49 | 12.5% |
| Local Government Employees | 48 | 12.2% |
| State Government Employees | 15 | 3.8% |
| Federal Government Employees | 10 | 2.5% |
| Unpaid Family Workers | 0 | 0.0% |
| Total | 392 | 100.0% |
Employment Status by Age in Bellerose
According to the labor force statistics for Bellerose, out of the total population over 16 years of age (773), 54.5% or 421 individuals are in the labor force, with 6.2% or 26 of them unemployed. The age group with the highest labor force participation rate is 25 to 29 years, with 100.0% or 27 individuals in the labor force. Within the labor force, the 16 to 19 years age range has the highest percentage of unemployed individuals, with 18.2% or 4 of them being unemployed.
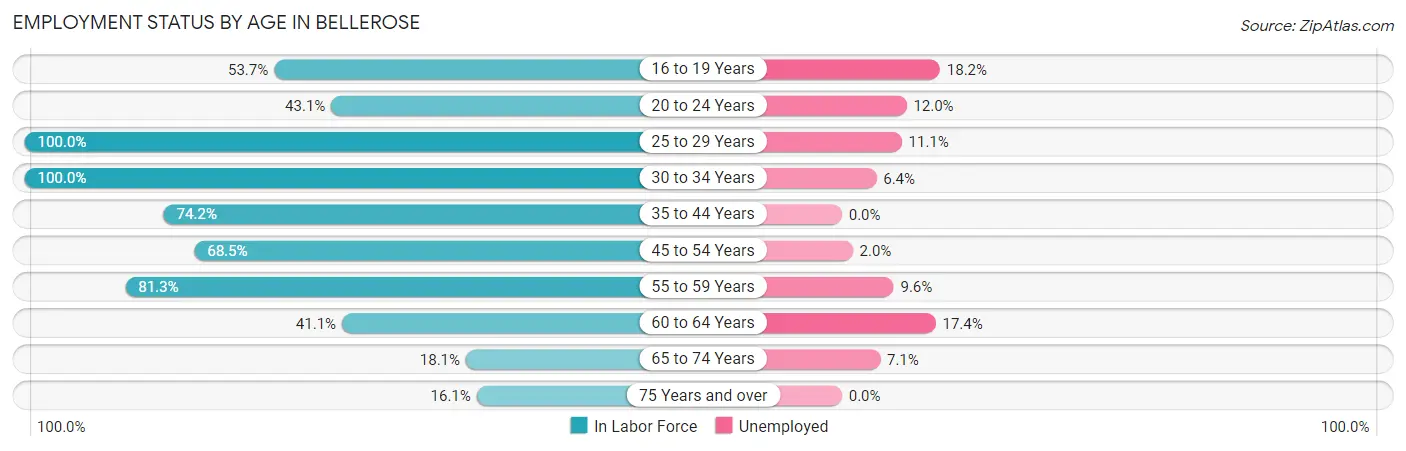
| Age Bracket | In Labor Force | Unemployed |
| 16 to 19 Years | 22 (53.7%) | 4 (18.2%) |
| 20 to 24 Years | 25 (43.1%) | 3 (12.0%) |
| 25 to 29 Years | 27 (100.0%) | 3 (11.1%) |
| 30 to 34 Years | 47 (100.0%) | 3 (6.4%) |
| 35 to 44 Years | 89 (74.2%) | 0 (0.0%) |
| 45 to 54 Years | 98 (68.5%) | 2 (2.0%) |
| 55 to 59 Years | 52 (81.3%) | 5 (9.6%) |
| 60 to 64 Years | 23 (41.1%) | 4 (17.4%) |
| 65 to 74 Years | 28 (18.1%) | 2 (7.1%) |
| 75 Years and over | 10 (16.1%) | 0 (0.0%) |
| Total | 421 (54.5%) | 26 (6.2%) |
Employment Status by Educational Attainment in Bellerose
According to labor force statistics for Bellerose, 73.5% of individuals (336) out of the total population between 25 and 64 years of age (457) are in the labor force, with 5.1% or 17 of them being unemployed. The group with the highest labor force participation rate are those with the educational attainment of high school diploma, with 82.1% or 23 individuals in the labor force. Within the labor force, individuals with college / associate degree education have the highest percentage of unemployment, with 8.3% or 4 of them being unemployed.
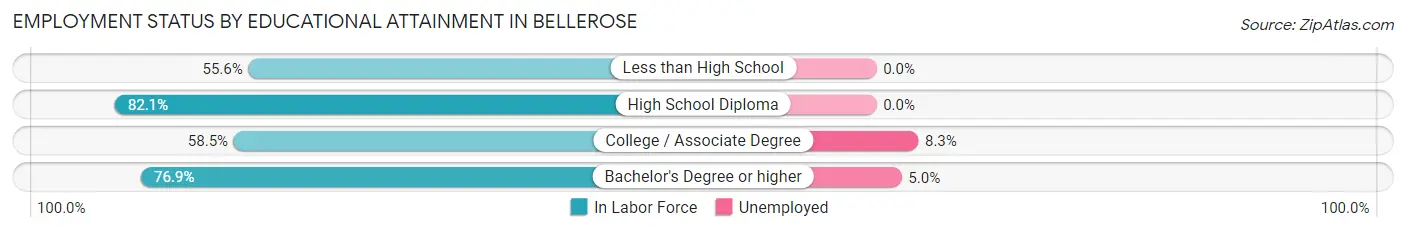
| Educational Attainment | In Labor Force | Unemployed |
| Less than High School | 5 (55.6%) | 0 (0.0%) |
| High School Diploma | 23 (82.1%) | 0 (0.0%) |
| College / Associate Degree | 48 (58.5%) | 7 (8.3%) |
| Bachelor's Degree or higher | 260 (76.9%) | 17 (5.0%) |
| Total | 336 (73.5%) | 23 (5.1%) |
Employment Occupations by Sex in Bellerose
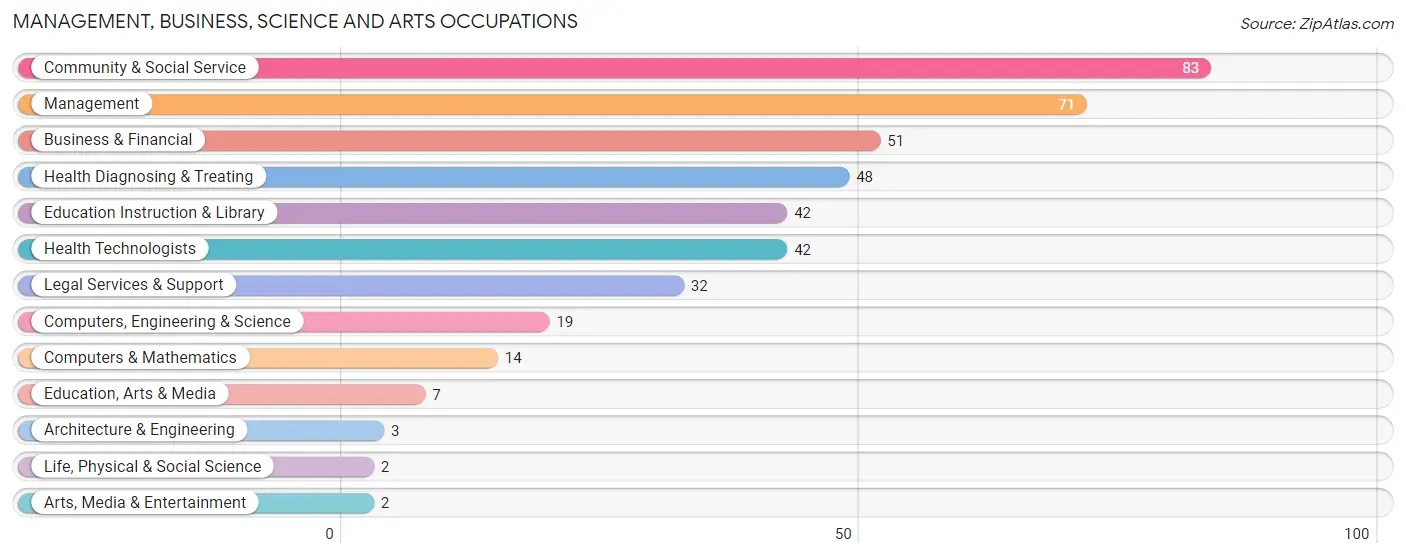
Management, Business, Science and Arts Occupations
The most common Management, Business, Science and Arts occupations in Bellerose are Community & Social Service (83 | 21.0%), Management (71 | 18.0%), Business & Financial (51 | 12.9%), Health Diagnosing & Treating (48 | 12.1%), and Education Instruction & Library (42 | 10.6%).
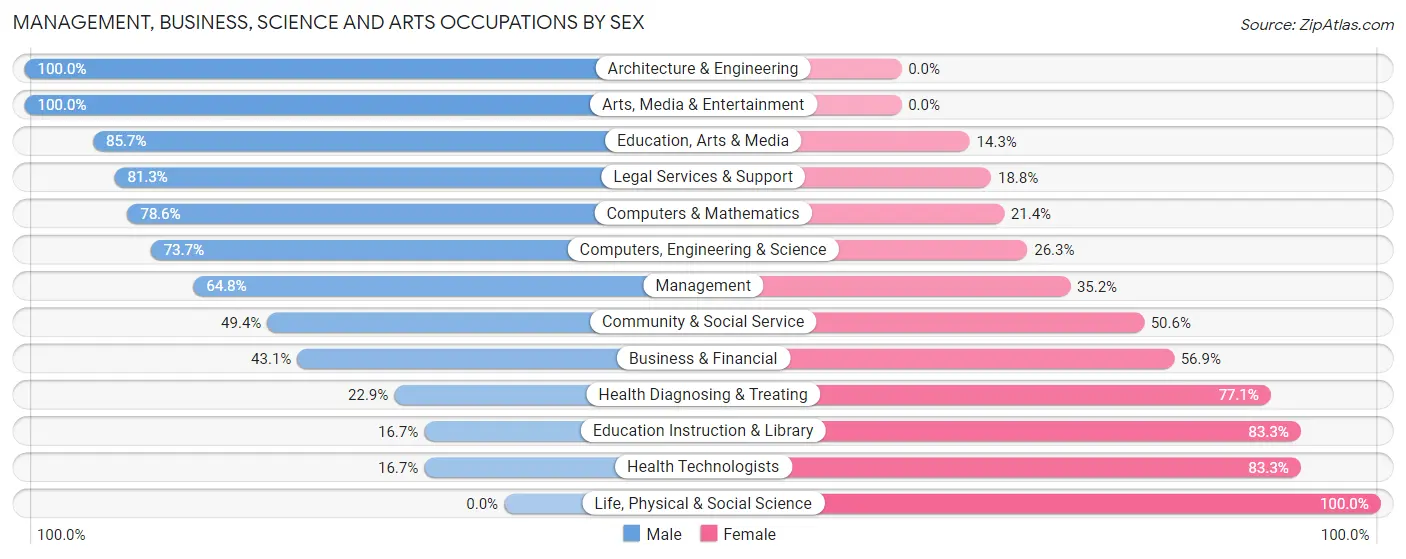
Management, Business, Science and Arts Occupations by Sex
Within the Management, Business, Science and Arts occupations in Bellerose, the most male-oriented occupations are Architecture & Engineering (100.0%), Arts, Media & Entertainment (100.0%), and Education, Arts & Media (85.7%), while the most female-oriented occupations are Life, Physical & Social Science (100.0%), Education Instruction & Library (83.3%), and Health Technologists (83.3%).
| Occupation | Male | Female |
| Management | 46 (64.8%) | 25 (35.2%) |
| Business & Financial | 22 (43.1%) | 29 (56.9%) |
| Computers, Engineering & Science | 14 (73.7%) | 5 (26.3%) |
| Computers & Mathematics | 11 (78.6%) | 3 (21.4%) |
| Architecture & Engineering | 3 (100.0%) | 0 (0.0%) |
| Life, Physical & Social Science | 0 (0.0%) | 2 (100.0%) |
| Community & Social Service | 41 (49.4%) | 42 (50.6%) |
| Education, Arts & Media | 6 (85.7%) | 1 (14.3%) |
| Legal Services & Support | 26 (81.2%) | 6 (18.8%) |
| Education Instruction & Library | 7 (16.7%) | 35 (83.3%) |
| Arts, Media & Entertainment | 2 (100.0%) | 0 (0.0%) |
| Health Diagnosing & Treating | 11 (22.9%) | 37 (77.1%) |
| Health Technologists | 7 (16.7%) | 35 (83.3%) |
| Total (Category) | 134 (49.3%) | 138 (50.7%) |
| Total (Overall) | 213 (53.9%) | 182 (46.1%) |
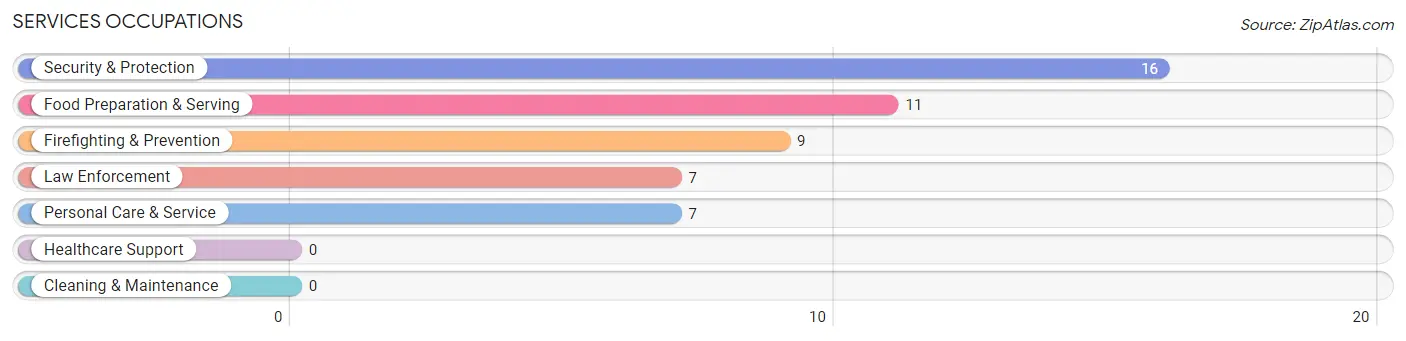
Services Occupations
The most common Services occupations in Bellerose are Security & Protection (16 | 4.1%), Food Preparation & Serving (11 | 2.8%), Firefighting & Prevention (9 | 2.3%), Law Enforcement (7 | 1.8%), and Personal Care & Service (7 | 1.8%).
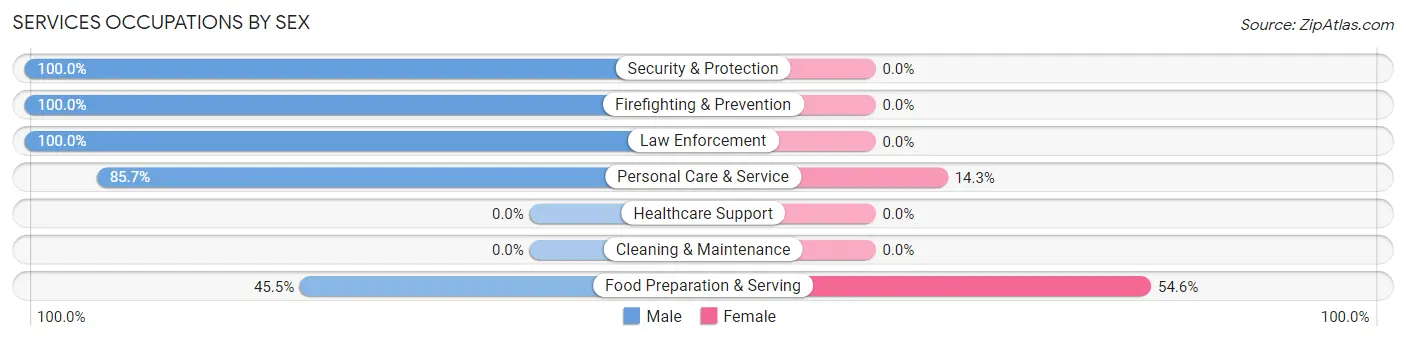
Services Occupations by Sex
Within the Services occupations in Bellerose, the most male-oriented occupations are Security & Protection (100.0%), Firefighting & Prevention (100.0%), and Law Enforcement (100.0%), while the most female-oriented occupations are Food Preparation & Serving (54.5%), and Personal Care & Service (14.3%).
| Occupation | Male | Female |
| Healthcare Support | 0 (0.0%) | 0 (0.0%) |
| Security & Protection | 16 (100.0%) | 0 (0.0%) |
| Firefighting & Prevention | 9 (100.0%) | 0 (0.0%) |
| Law Enforcement | 7 (100.0%) | 0 (0.0%) |
| Food Preparation & Serving | 5 (45.5%) | 6 (54.5%) |
| Cleaning & Maintenance | 0 (0.0%) | 0 (0.0%) |
| Personal Care & Service | 6 (85.7%) | 1 (14.3%) |
| Total (Category) | 27 (79.4%) | 7 (20.6%) |
| Total (Overall) | 213 (53.9%) | 182 (46.1%) |
Sales and Office Occupations
The most common Sales and Office occupations in Bellerose are Office & Administration (34 | 8.6%), and Sales & Related (32 | 8.1%).
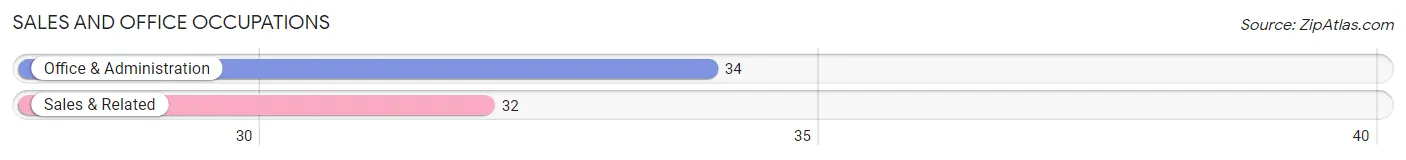
Sales and Office Occupations by Sex
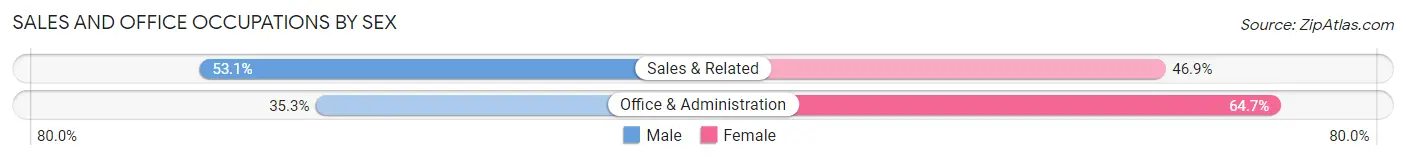
| Occupation | Male | Female |
| Sales & Related | 17 (53.1%) | 15 (46.9%) |
| Office & Administration | 12 (35.3%) | 22 (64.7%) |
| Total (Category) | 29 (43.9%) | 37 (56.1%) |
| Total (Overall) | 213 (53.9%) | 182 (46.1%) |
Natural Resources, Construction and Maintenance Occupations
The most common Natural Resources, Construction and Maintenance occupations in Bellerose are , and Construction & Extraction (10 | 2.5%).
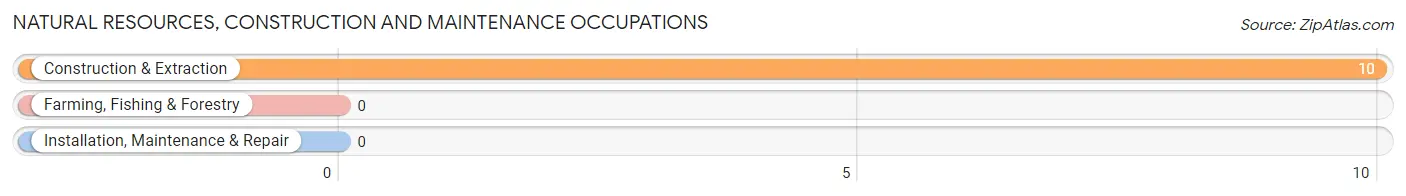
Natural Resources, Construction and Maintenance Occupations by Sex
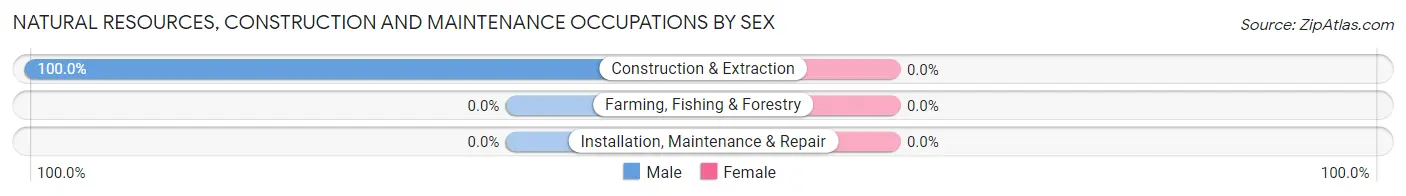
| Occupation | Male | Female |
| Farming, Fishing & Forestry | 0 (0.0%) | 0 (0.0%) |
| Construction & Extraction | 10 (100.0%) | 0 (0.0%) |
| Installation, Maintenance & Repair | 0 (0.0%) | 0 (0.0%) |
| Total (Category) | 10 (100.0%) | 0 (0.0%) |
| Total (Overall) | 213 (53.9%) | 182 (46.1%) |
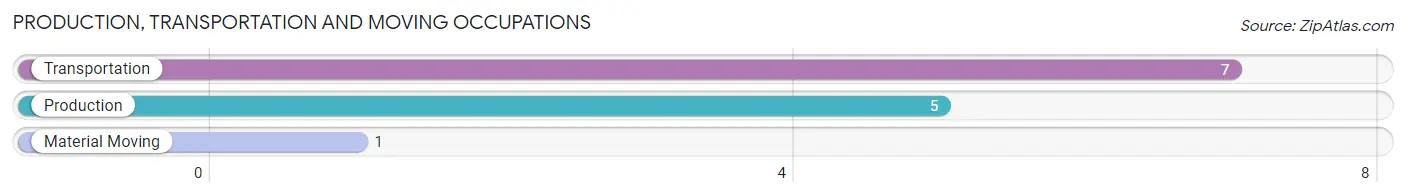
Production, Transportation and Moving Occupations
The most common Production, Transportation and Moving occupations in Bellerose are Transportation (7 | 1.8%), Production (5 | 1.3%), and Material Moving (1 | 0.3%).
Production, Transportation and Moving Occupations by Sex
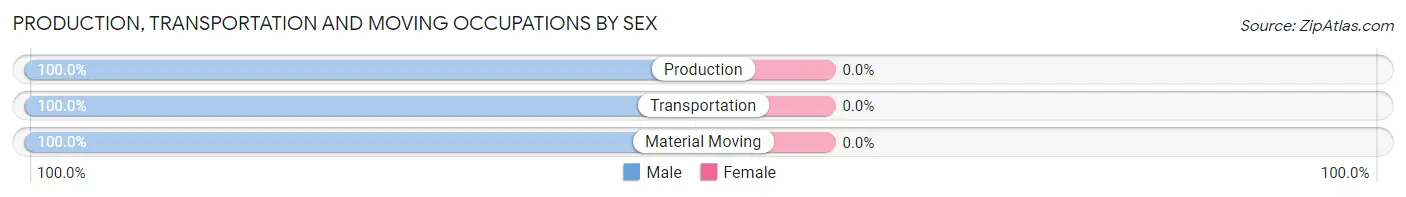
| Occupation | Male | Female |
| Production | 5 (100.0%) | 0 (0.0%) |
| Transportation | 7 (100.0%) | 0 (0.0%) |
| Material Moving | 1 (100.0%) | 0 (0.0%) |
| Total (Category) | 13 (100.0%) | 0 (0.0%) |
| Total (Overall) | 213 (53.9%) | 182 (46.1%) |
Employment Industries by Sex in Bellerose
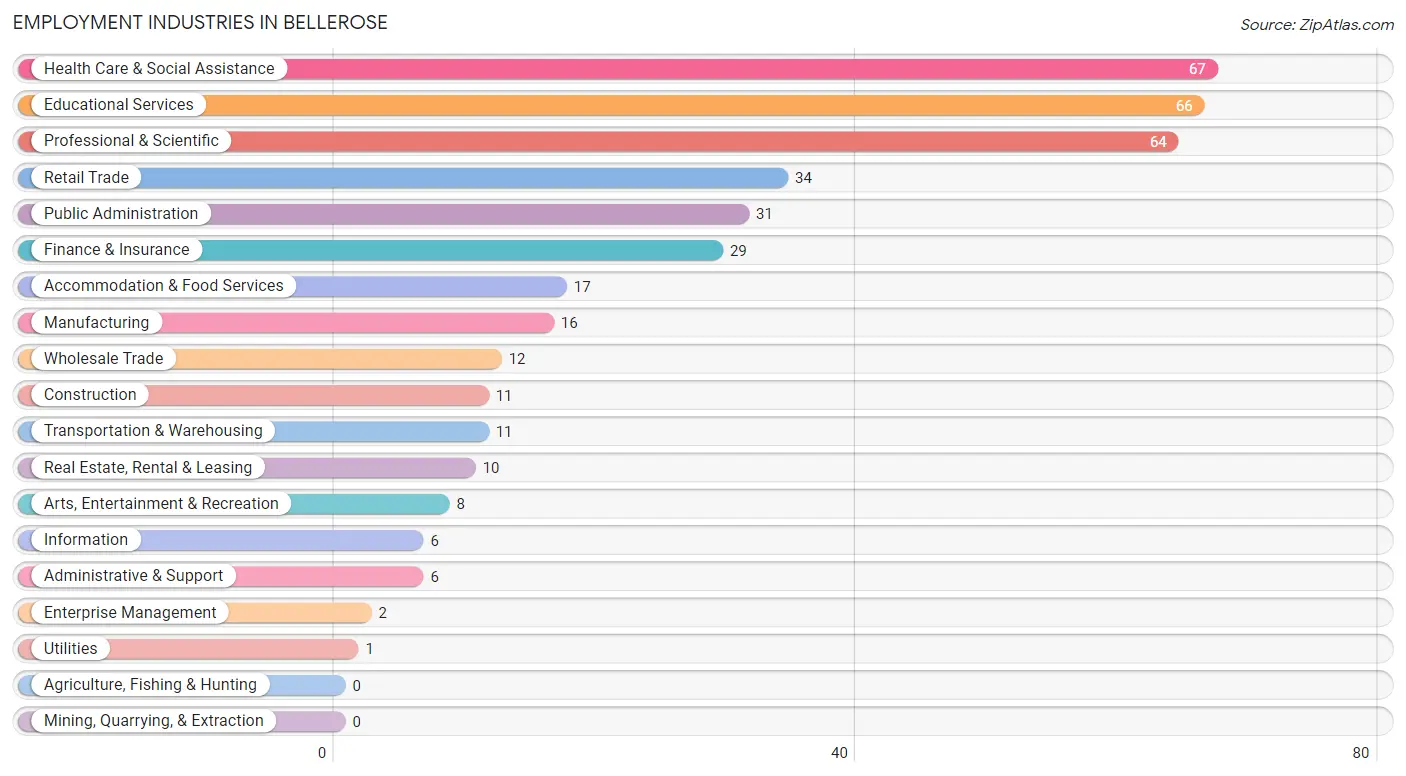
Employment Industries in Bellerose
The major employment industries in Bellerose include Health Care & Social Assistance (67 | 17.0%), Educational Services (66 | 16.7%), Professional & Scientific (64 | 16.2%), Retail Trade (34 | 8.6%), and Public Administration (31 | 7.9%).
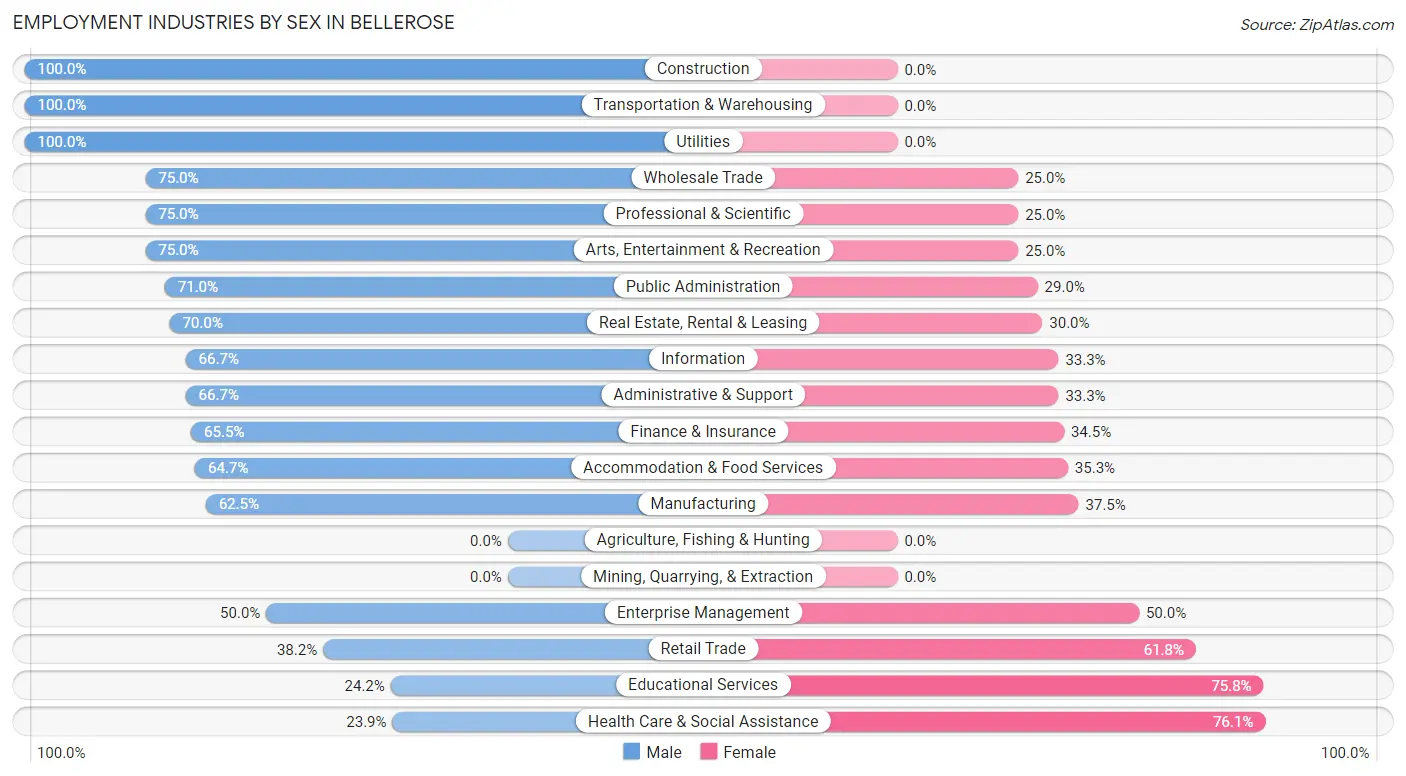
Employment Industries by Sex in Bellerose
The Bellerose industries that see more men than women are Construction (100.0%), Transportation & Warehousing (100.0%), and Utilities (100.0%), whereas the industries that tend to have a higher number of women are Health Care & Social Assistance (76.1%), Educational Services (75.8%), and Retail Trade (61.8%).
| Industry | Male | Female |
| Agriculture, Fishing & Hunting | 0 (0.0%) | 0 (0.0%) |
| Mining, Quarrying, & Extraction | 0 (0.0%) | 0 (0.0%) |
| Construction | 11 (100.0%) | 0 (0.0%) |
| Manufacturing | 10 (62.5%) | 6 (37.5%) |
| Wholesale Trade | 9 (75.0%) | 3 (25.0%) |
| Retail Trade | 13 (38.2%) | 21 (61.8%) |
| Transportation & Warehousing | 11 (100.0%) | 0 (0.0%) |
| Utilities | 1 (100.0%) | 0 (0.0%) |
| Information | 4 (66.7%) | 2 (33.3%) |
| Finance & Insurance | 19 (65.5%) | 10 (34.5%) |
| Real Estate, Rental & Leasing | 7 (70.0%) | 3 (30.0%) |
| Professional & Scientific | 48 (75.0%) | 16 (25.0%) |
| Enterprise Management | 1 (50.0%) | 1 (50.0%) |
| Administrative & Support | 4 (66.7%) | 2 (33.3%) |
| Educational Services | 16 (24.2%) | 50 (75.8%) |
| Health Care & Social Assistance | 16 (23.9%) | 51 (76.1%) |
| Arts, Entertainment & Recreation | 6 (75.0%) | 2 (25.0%) |
| Accommodation & Food Services | 11 (64.7%) | 6 (35.3%) |
| Public Administration | 22 (71.0%) | 9 (29.0%) |
| Total | 213 (53.9%) | 182 (46.1%) |
Education in Bellerose
School Enrollment in Bellerose
The most common levels of schooling among the 259 students in Bellerose are high school (68 | 26.3%), middle school (56 | 21.6%), and elementary school (50 | 19.3%).
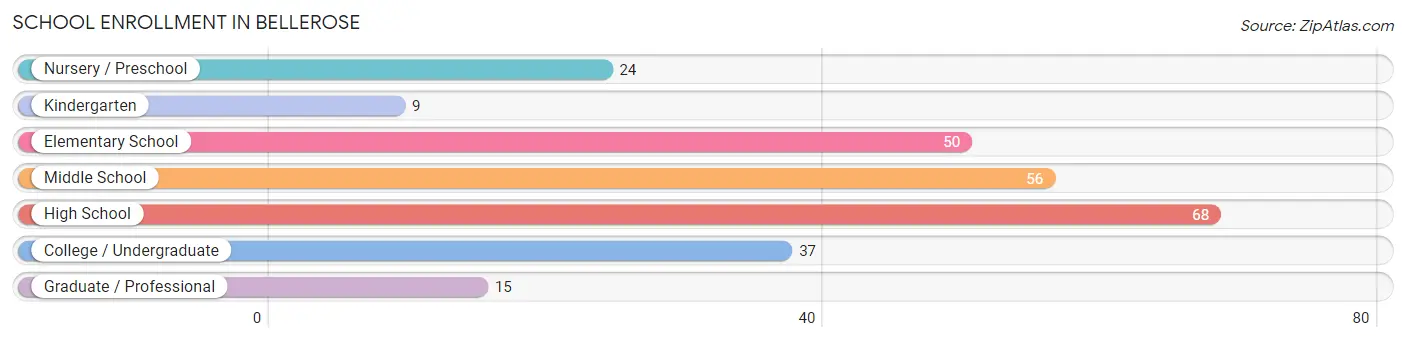
| School Level | # Students | % Students |
| Nursery / Preschool | 24 | 9.3% |
| Kindergarten | 9 | 3.5% |
| Elementary School | 50 | 19.3% |
| Middle School | 56 | 21.6% |
| High School | 68 | 26.3% |
| College / Undergraduate | 37 | 14.3% |
| Graduate / Professional | 15 | 5.8% |
| Total | 259 | 100.0% |
School Enrollment by Age by Funding Source in Bellerose
Out of a total of 259 students who are enrolled in schools in Bellerose, 86 (33.2%) attend a private institution, while the remaining 173 (66.8%) are enrolled in public schools. The age group of 25 to 34 year olds has the highest likelihood of being enrolled in private schools, with 5 (71.4% in the age bracket) enrolled. Conversely, the age group of 5 to 9 year old has the lowest likelihood of being enrolled in a private school, with 54 (90.0% in the age bracket) attending a public institution.
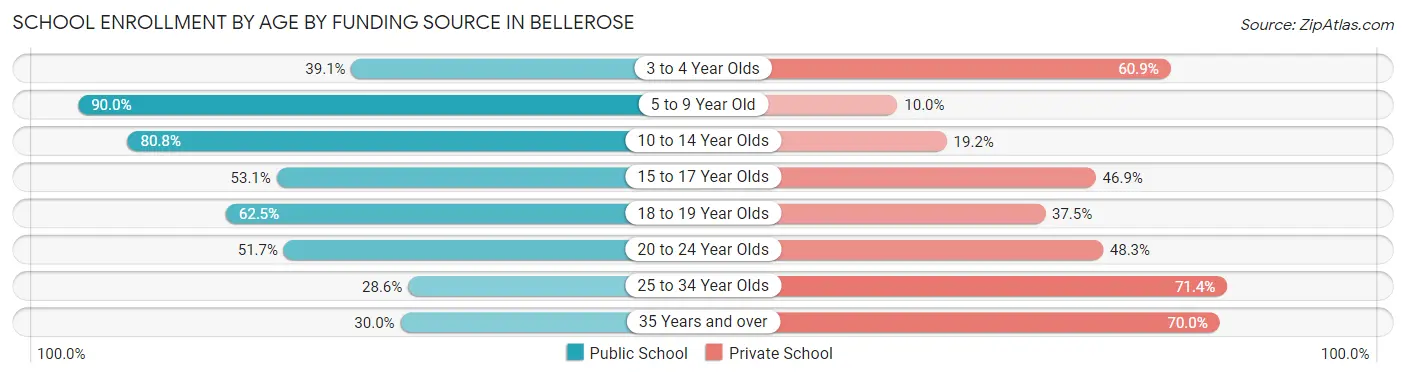
| Age Bracket | Public School | Private School |
| 3 to 4 Year Olds | 9 (39.1%) | 14 (60.9%) |
| 5 to 9 Year Old | 54 (90.0%) | 6 (10.0%) |
| 10 to 14 Year Olds | 59 (80.8%) | 14 (19.2%) |
| 15 to 17 Year Olds | 26 (53.1%) | 23 (46.9%) |
| 18 to 19 Year Olds | 5 (62.5%) | 3 (37.5%) |
| 20 to 24 Year Olds | 15 (51.7%) | 14 (48.3%) |
| 25 to 34 Year Olds | 2 (28.6%) | 5 (71.4%) |
| 35 Years and over | 3 (30.0%) | 7 (70.0%) |
| Total | 173 (66.8%) | 86 (33.2%) |
Educational Attainment by Field of Study in Bellerose
Business (123 | 26.2%), education (47 | 10.0%), engineering (40 | 8.5%), liberal arts & history (36 | 7.7%), and science & technology (32 | 6.8%) are the most common fields of study among 469 individuals in Bellerose who have obtained a bachelor's degree or higher.
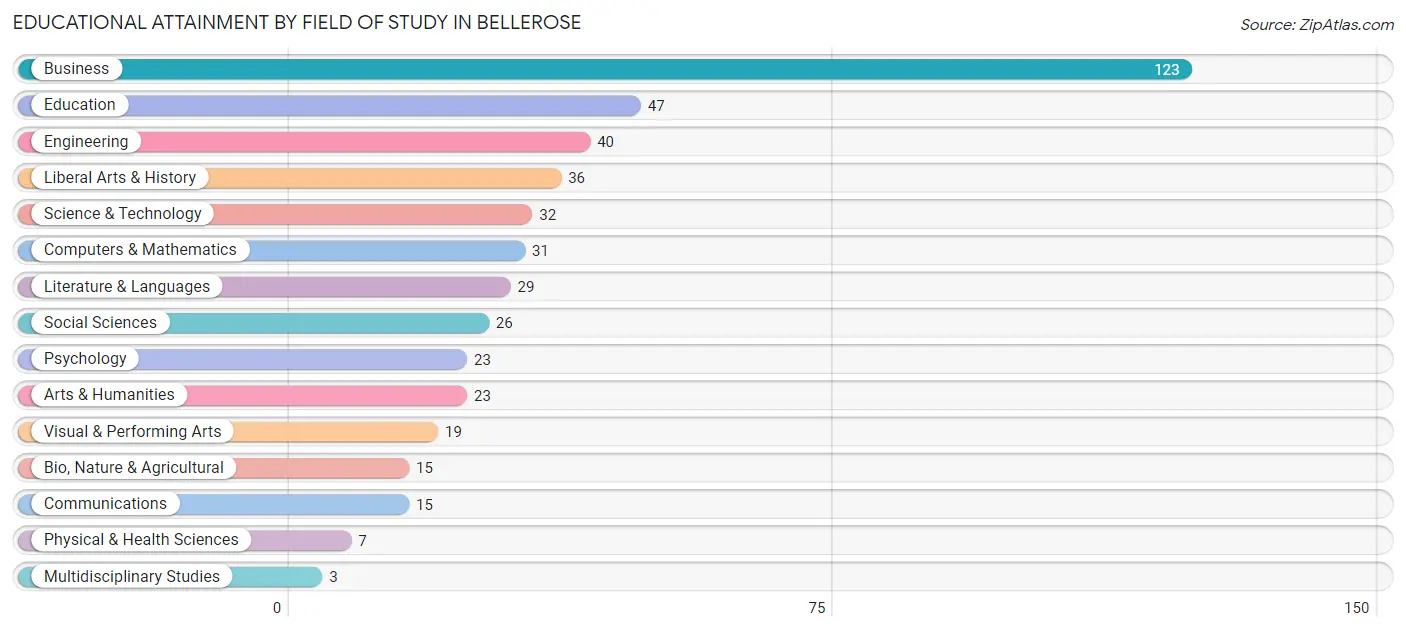
| Field of Study | # Graduates | % Graduates |
| Computers & Mathematics | 31 | 6.6% |
| Bio, Nature & Agricultural | 15 | 3.2% |
| Physical & Health Sciences | 7 | 1.5% |
| Psychology | 23 | 4.9% |
| Social Sciences | 26 | 5.5% |
| Engineering | 40 | 8.5% |
| Multidisciplinary Studies | 3 | 0.6% |
| Science & Technology | 32 | 6.8% |
| Business | 123 | 26.2% |
| Education | 47 | 10.0% |
| Literature & Languages | 29 | 6.2% |
| Liberal Arts & History | 36 | 7.7% |
| Visual & Performing Arts | 19 | 4.1% |
| Communications | 15 | 3.2% |
| Arts & Humanities | 23 | 4.9% |
| Total | 469 | 100.0% |
Transportation & Commute in Bellerose
Vehicle Availability by Sex in Bellerose
The most prevalent vehicle ownership categories in Bellerose are males with 2 vehicles (83, accounting for 39.2%) and females with 2 vehicles (89, making up 46.1%).
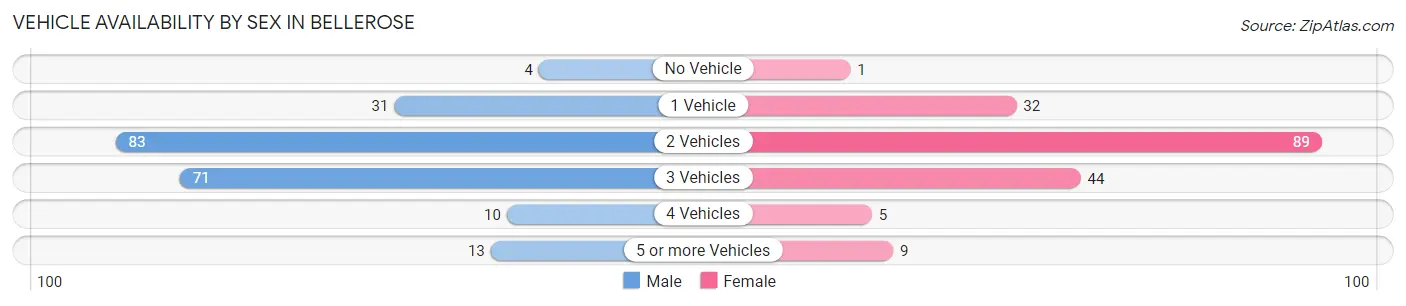
| Vehicles Available | Male | Female |
| No Vehicle | 4 (1.9%) | 1 (0.6%) |
| 1 Vehicle | 31 (14.6%) | 32 (17.8%) |
| 2 Vehicles | 83 (39.2%) | 89 (49.4%) |
| 3 Vehicles | 71 (33.5%) | 44 (24.4%) |
| 4 Vehicles | 10 (4.7%) | 5 (2.8%) |
| 5 or more Vehicles | 13 (6.1%) | 9 (5.0%) |
| Total | 212 (100.0%) | 180 (100.0%) |
Commute Time in Bellerose
The most frequently occuring commute durations in Bellerose are 60 to 89 minutes (88 commuters, 26.2%), 45 to 59 minutes (44 commuters, 13.1%), and 20 to 24 minutes (41 commuters, 12.2%).
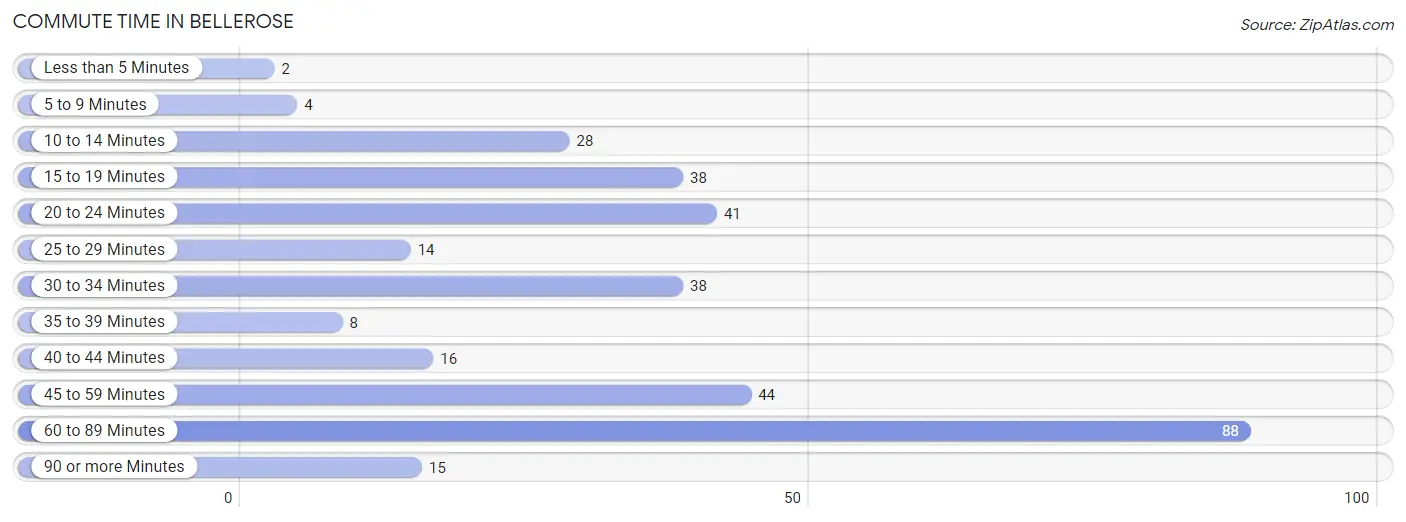
| Commute Time | # Commuters | % Commuters |
| Less than 5 Minutes | 2 | 0.6% |
| 5 to 9 Minutes | 4 | 1.2% |
| 10 to 14 Minutes | 28 | 8.3% |
| 15 to 19 Minutes | 38 | 11.3% |
| 20 to 24 Minutes | 41 | 12.2% |
| 25 to 29 Minutes | 14 | 4.2% |
| 30 to 34 Minutes | 38 | 11.3% |
| 35 to 39 Minutes | 8 | 2.4% |
| 40 to 44 Minutes | 16 | 4.8% |
| 45 to 59 Minutes | 44 | 13.1% |
| 60 to 89 Minutes | 88 | 26.2% |
| 90 or more Minutes | 15 | 4.5% |
Commute Time by Sex in Bellerose
The most common commute times in Bellerose are 60 to 89 minutes (46 commuters, 26.9%) for males and 60 to 89 minutes (42 commuters, 25.5%) for females.
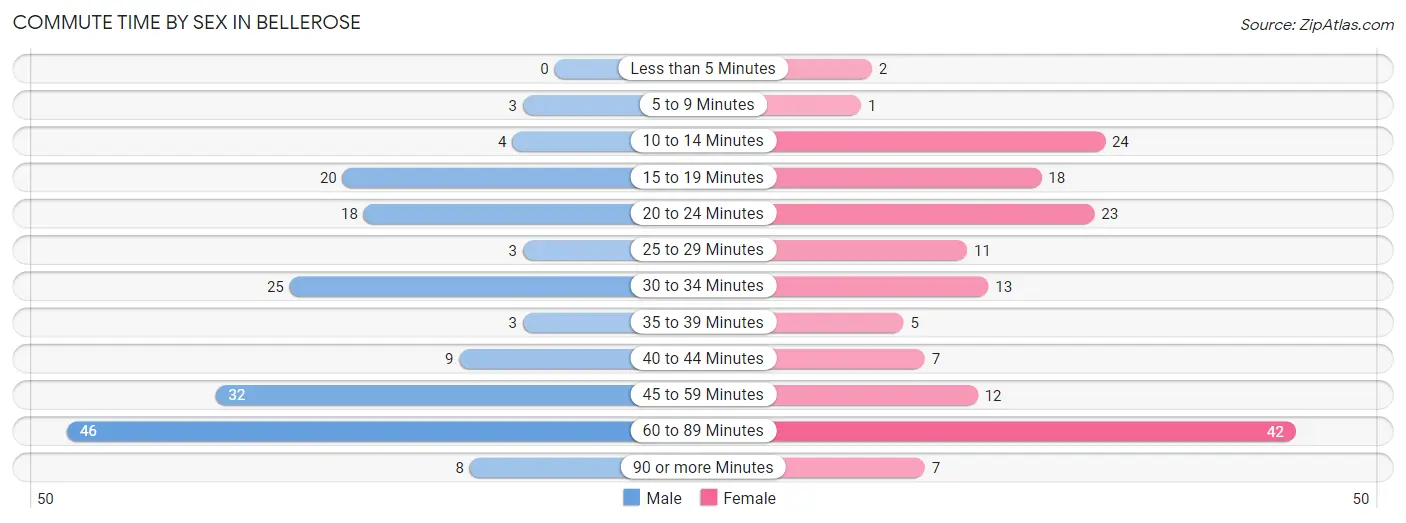
| Commute Time | Male | Female |
| Less than 5 Minutes | 0 (0.0%) | 2 (1.2%) |
| 5 to 9 Minutes | 3 (1.8%) | 1 (0.6%) |
| 10 to 14 Minutes | 4 (2.3%) | 24 (14.5%) |
| 15 to 19 Minutes | 20 (11.7%) | 18 (10.9%) |
| 20 to 24 Minutes | 18 (10.5%) | 23 (13.9%) |
| 25 to 29 Minutes | 3 (1.8%) | 11 (6.7%) |
| 30 to 34 Minutes | 25 (14.6%) | 13 (7.9%) |
| 35 to 39 Minutes | 3 (1.8%) | 5 (3.0%) |
| 40 to 44 Minutes | 9 (5.3%) | 7 (4.2%) |
| 45 to 59 Minutes | 32 (18.7%) | 12 (7.3%) |
| 60 to 89 Minutes | 46 (26.9%) | 42 (25.5%) |
| 90 or more Minutes | 8 (4.7%) | 7 (4.2%) |
Time of Departure to Work by Sex in Bellerose
The most frequent times of departure to work in Bellerose are 7:00 AM to 7:29 AM (27, 15.8%) for males and 7:00 AM to 7:29 AM (34, 20.6%) for females.
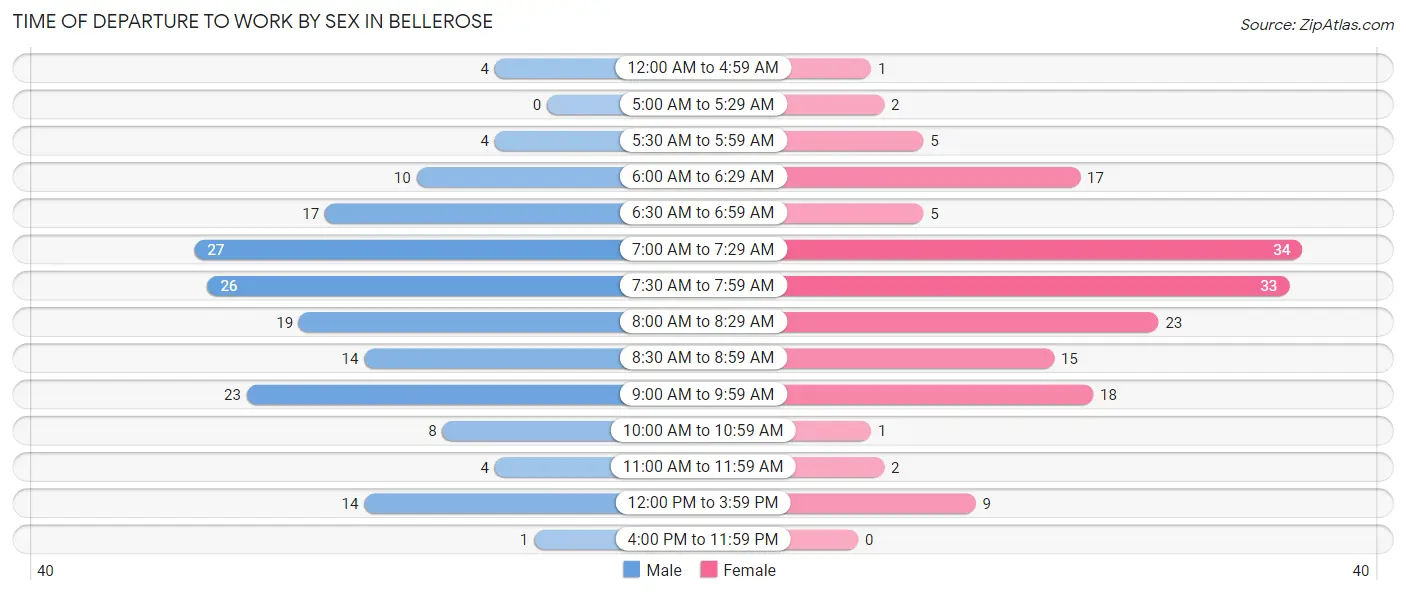
| Time of Departure | Male | Female |
| 12:00 AM to 4:59 AM | 4 (2.3%) | 1 (0.6%) |
| 5:00 AM to 5:29 AM | 0 (0.0%) | 2 (1.2%) |
| 5:30 AM to 5:59 AM | 4 (2.3%) | 5 (3.0%) |
| 6:00 AM to 6:29 AM | 10 (5.9%) | 17 (10.3%) |
| 6:30 AM to 6:59 AM | 17 (9.9%) | 5 (3.0%) |
| 7:00 AM to 7:29 AM | 27 (15.8%) | 34 (20.6%) |
| 7:30 AM to 7:59 AM | 26 (15.2%) | 33 (20.0%) |
| 8:00 AM to 8:29 AM | 19 (11.1%) | 23 (13.9%) |
| 8:30 AM to 8:59 AM | 14 (8.2%) | 15 (9.1%) |
| 9:00 AM to 9:59 AM | 23 (13.5%) | 18 (10.9%) |
| 10:00 AM to 10:59 AM | 8 (4.7%) | 1 (0.6%) |
| 11:00 AM to 11:59 AM | 4 (2.3%) | 2 (1.2%) |
| 12:00 PM to 3:59 PM | 14 (8.2%) | 9 (5.4%) |
| 4:00 PM to 11:59 PM | 1 (0.6%) | 0 (0.0%) |
| Total | 171 (100.0%) | 165 (100.0%) |
Housing Occupancy in Bellerose
Occupancy by Ownership in Bellerose
Of the total 322 dwellings in Bellerose, owner-occupied units account for 315 (97.8%), while renter-occupied units make up 7 (2.2%).
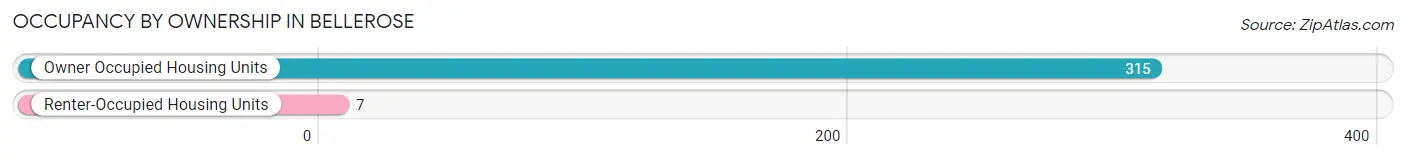
| Occupancy | # Housing Units | % Housing Units |
| Owner Occupied Housing Units | 315 | 97.8% |
| Renter-Occupied Housing Units | 7 | 2.2% |
| Total Occupied Housing Units | 322 | 100.0% |
Occupancy by Household Size in Bellerose
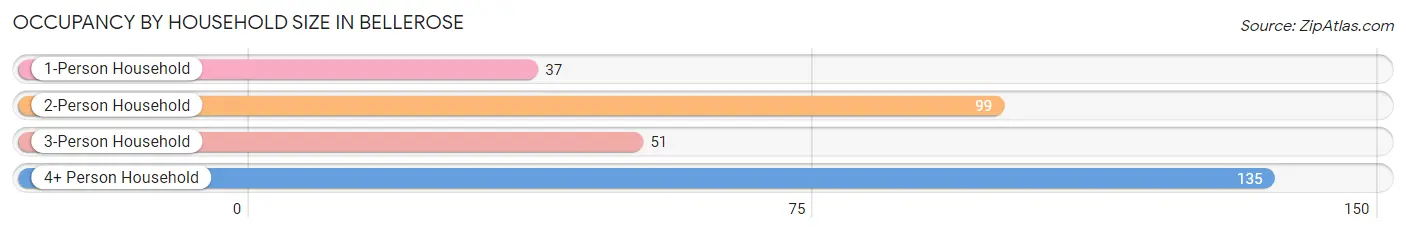
| Household Size | # Housing Units | % Housing Units |
| 1-Person Household | 37 | 11.5% |
| 2-Person Household | 99 | 30.7% |
| 3-Person Household | 51 | 15.8% |
| 4+ Person Household | 135 | 41.9% |
| Total Housing Units | 322 | 100.0% |
Occupancy by Ownership by Household Size in Bellerose
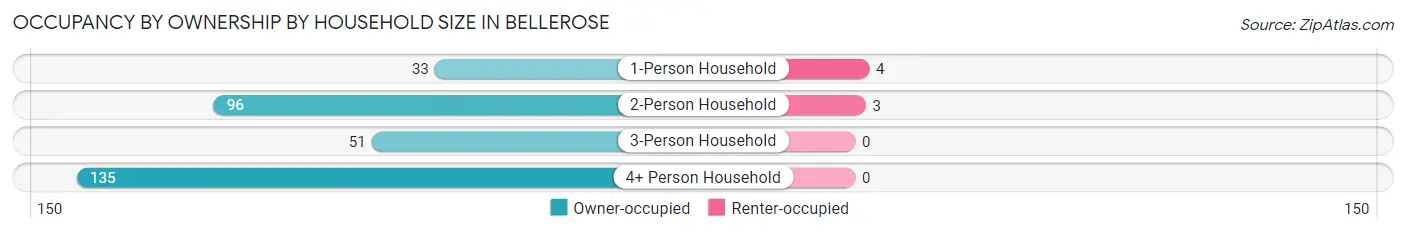
| Household Size | Owner-occupied | Renter-occupied |
| 1-Person Household | 33 (89.2%) | 4 (10.8%) |
| 2-Person Household | 96 (97.0%) | 3 (3.0%) |
| 3-Person Household | 51 (100.0%) | 0 (0.0%) |
| 4+ Person Household | 135 (100.0%) | 0 (0.0%) |
| Total Housing Units | 315 (97.8%) | 7 (2.2%) |
Occupancy by Educational Attainment in Bellerose
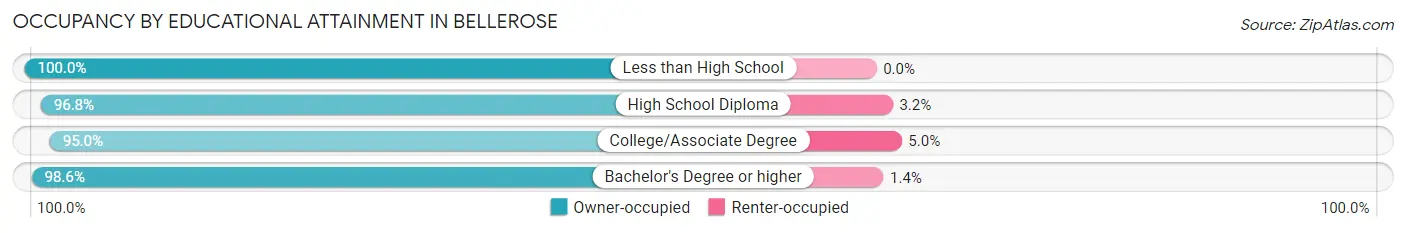
| Household Size | Owner-occupied | Renter-occupied |
| Less than High School | 12 (100.0%) | 0 (0.0%) |
| High School Diploma | 30 (96.8%) | 1 (3.2%) |
| College/Associate Degree | 57 (95.0%) | 3 (5.0%) |
| Bachelor's Degree or higher | 216 (98.6%) | 3 (1.4%) |
Occupancy by Age of Householder in Bellerose
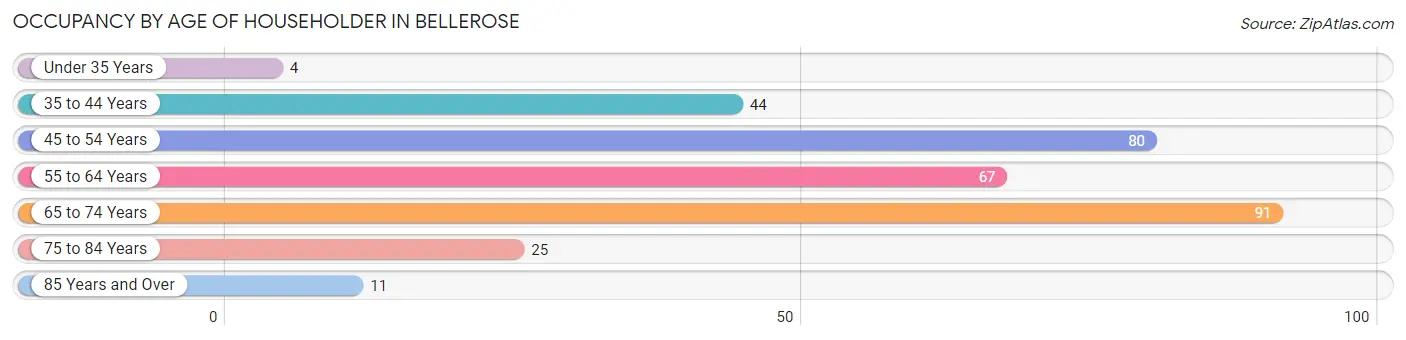
| Age Bracket | # Households | % Households |
| Under 35 Years | 4 | 1.2% |
| 35 to 44 Years | 44 | 13.7% |
| 45 to 54 Years | 80 | 24.8% |
| 55 to 64 Years | 67 | 20.8% |
| 65 to 74 Years | 91 | 28.3% |
| 75 to 84 Years | 25 | 7.8% |
| 85 Years and Over | 11 | 3.4% |
| Total | 322 | 100.0% |
Housing Finances in Bellerose
Median Income by Occupancy in Bellerose
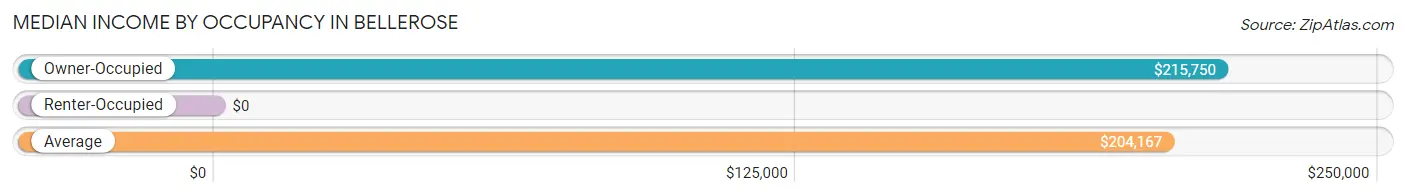
| Occupancy Type | # Households | Median Income |
| Owner-Occupied | 315 (97.8%) | $215,750 |
| Renter-Occupied | 7 (2.2%) | $0 |
| Average | 322 (100.0%) | $204,167 |
Occupancy by Householder Income Bracket in Bellerose
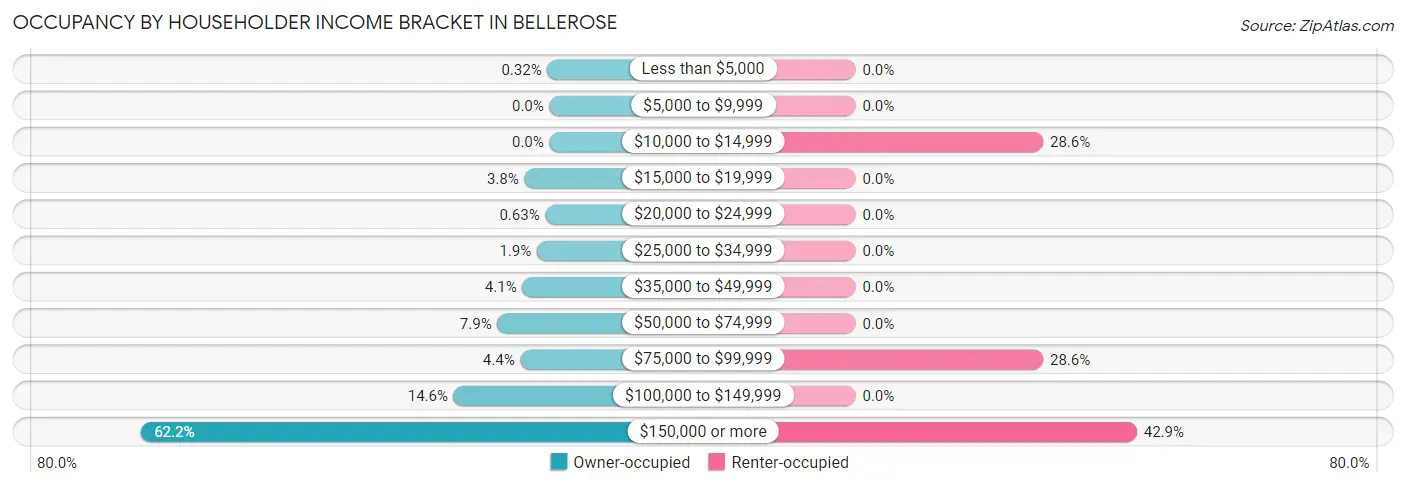
| Income Bracket | Owner-occupied | Renter-occupied |
| Less than $5,000 | 1 (0.3%) | 0 (0.0%) |
| $5,000 to $9,999 | 0 (0.0%) | 0 (0.0%) |
| $10,000 to $14,999 | 0 (0.0%) | 2 (28.6%) |
| $15,000 to $19,999 | 12 (3.8%) | 0 (0.0%) |
| $20,000 to $24,999 | 2 (0.6%) | 0 (0.0%) |
| $25,000 to $34,999 | 6 (1.9%) | 0 (0.0%) |
| $35,000 to $49,999 | 13 (4.1%) | 0 (0.0%) |
| $50,000 to $74,999 | 25 (7.9%) | 0 (0.0%) |
| $75,000 to $99,999 | 14 (4.4%) | 2 (28.6%) |
| $100,000 to $149,999 | 46 (14.6%) | 0 (0.0%) |
| $150,000 or more | 196 (62.2%) | 3 (42.9%) |
| Total | 315 (100.0%) | 7 (100.0%) |
Monthly Housing Cost Tiers in Bellerose
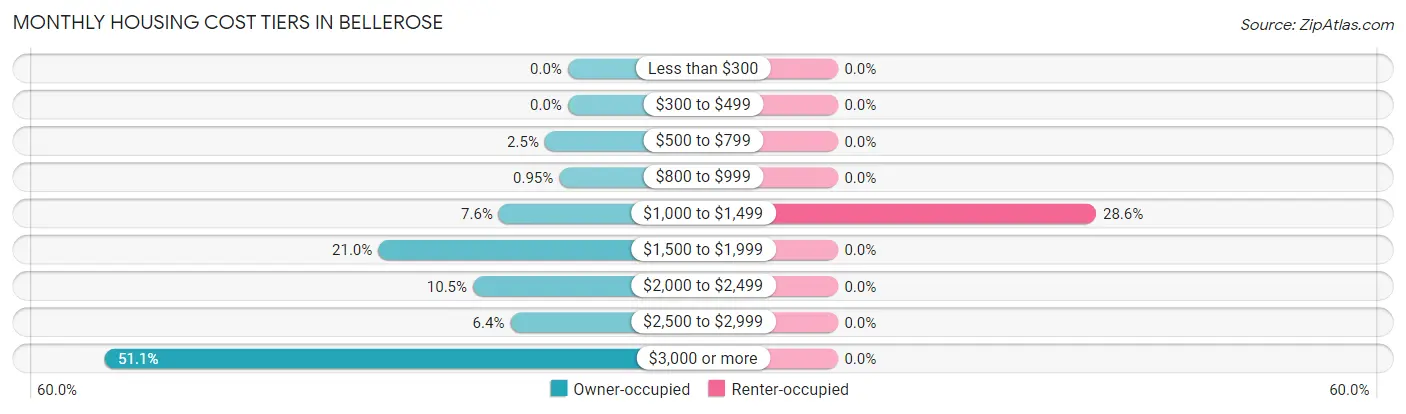
| Monthly Cost | Owner-occupied | Renter-occupied |
| Less than $300 | 0 (0.0%) | 0 (0.0%) |
| $300 to $499 | 0 (0.0%) | 0 (0.0%) |
| $500 to $799 | 8 (2.5%) | 0 (0.0%) |
| $800 to $999 | 3 (0.9%) | 0 (0.0%) |
| $1,000 to $1,499 | 24 (7.6%) | 2 (28.6%) |
| $1,500 to $1,999 | 66 (20.9%) | 0 (0.0%) |
| $2,000 to $2,499 | 33 (10.5%) | 0 (0.0%) |
| $2,500 to $2,999 | 20 (6.4%) | 0 (0.0%) |
| $3,000 or more | 161 (51.1%) | 0 (0.0%) |
| Total | 315 (100.0%) | 7 (100.0%) |
Physical Housing Characteristics in Bellerose
Housing Structures in Bellerose
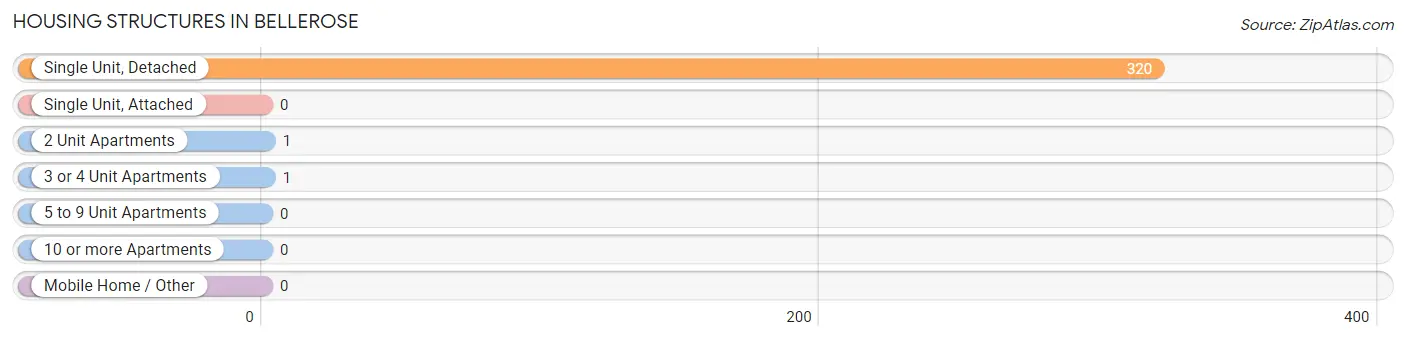
| Structure Type | # Housing Units | % Housing Units |
| Single Unit, Detached | 320 | 99.4% |
| Single Unit, Attached | 0 | 0.0% |
| 2 Unit Apartments | 1 | 0.3% |
| 3 or 4 Unit Apartments | 1 | 0.3% |
| 5 to 9 Unit Apartments | 0 | 0.0% |
| 10 or more Apartments | 0 | 0.0% |
| Mobile Home / Other | 0 | 0.0% |
| Total | 322 | 100.0% |
Housing Structures by Occupancy in Bellerose
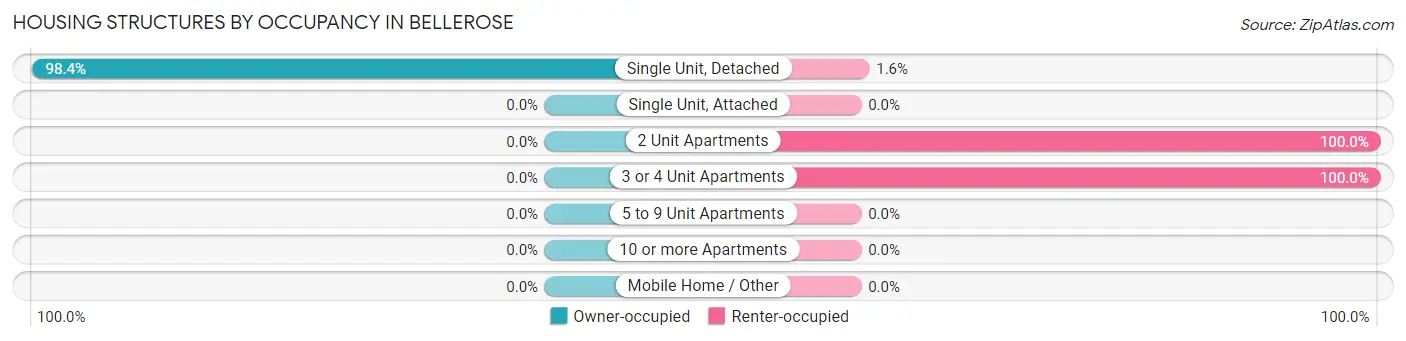
| Structure Type | Owner-occupied | Renter-occupied |
| Single Unit, Detached | 315 (98.4%) | 5 (1.6%) |
| Single Unit, Attached | 0 (0.0%) | 0 (0.0%) |
| 2 Unit Apartments | 0 (0.0%) | 1 (100.0%) |
| 3 or 4 Unit Apartments | 0 (0.0%) | 1 (100.0%) |
| 5 to 9 Unit Apartments | 0 (0.0%) | 0 (0.0%) |
| 10 or more Apartments | 0 (0.0%) | 0 (0.0%) |
| Mobile Home / Other | 0 (0.0%) | 0 (0.0%) |
| Total | 315 (97.8%) | 7 (2.2%) |
Housing Structures by Number of Rooms in Bellerose
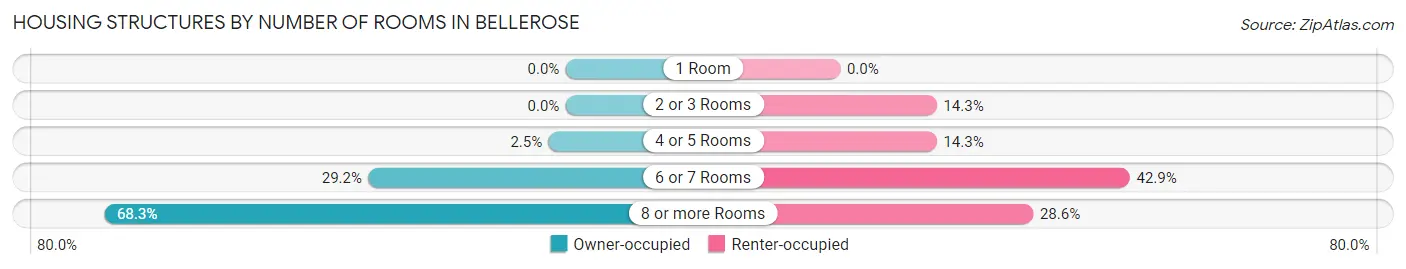
| Number of Rooms | Owner-occupied | Renter-occupied |
| 1 Room | 0 (0.0%) | 0 (0.0%) |
| 2 or 3 Rooms | 0 (0.0%) | 1 (14.3%) |
| 4 or 5 Rooms | 8 (2.5%) | 1 (14.3%) |
| 6 or 7 Rooms | 92 (29.2%) | 3 (42.9%) |
| 8 or more Rooms | 215 (68.2%) | 2 (28.6%) |
| Total | 315 (100.0%) | 7 (100.0%) |
Housing Structure by Heating Type in Bellerose
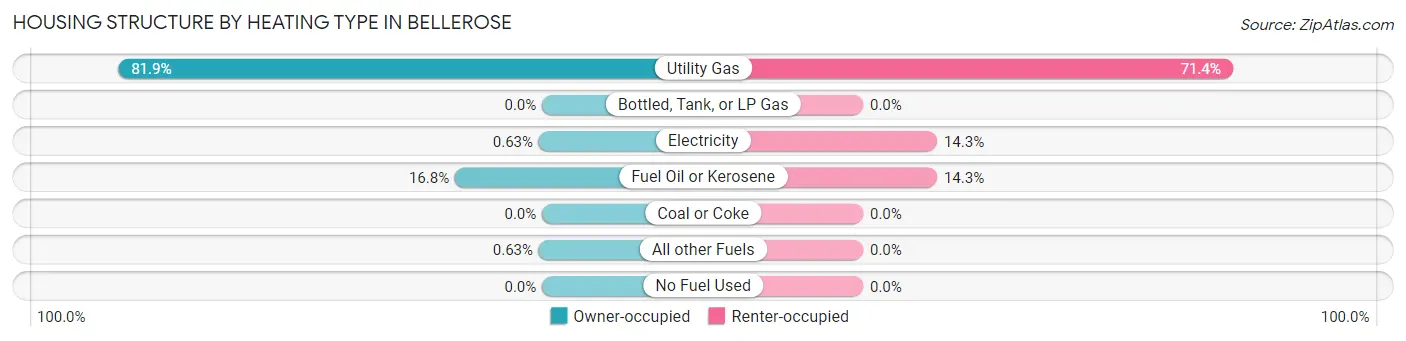
| Heating Type | Owner-occupied | Renter-occupied |
| Utility Gas | 258 (81.9%) | 5 (71.4%) |
| Bottled, Tank, or LP Gas | 0 (0.0%) | 0 (0.0%) |
| Electricity | 2 (0.6%) | 1 (14.3%) |
| Fuel Oil or Kerosene | 53 (16.8%) | 1 (14.3%) |
| Coal or Coke | 0 (0.0%) | 0 (0.0%) |
| All other Fuels | 2 (0.6%) | 0 (0.0%) |
| No Fuel Used | 0 (0.0%) | 0 (0.0%) |
| Total | 315 (100.0%) | 7 (100.0%) |
Household Vehicle Usage in Bellerose
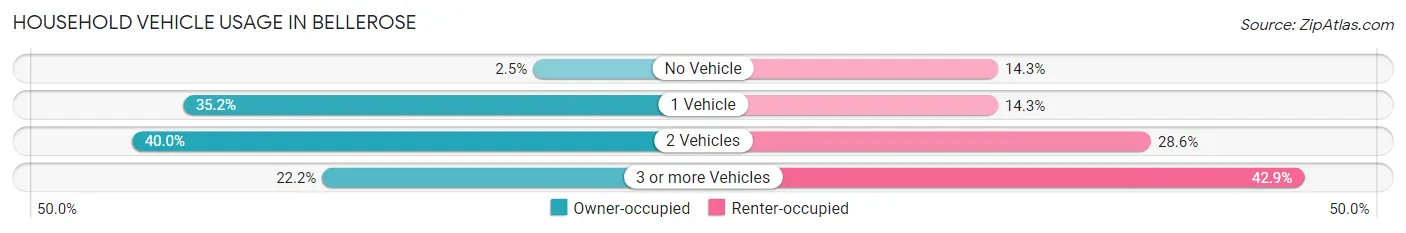
| Vehicles per Household | Owner-occupied | Renter-occupied |
| No Vehicle | 8 (2.5%) | 1 (14.3%) |
| 1 Vehicle | 111 (35.2%) | 1 (14.3%) |
| 2 Vehicles | 126 (40.0%) | 2 (28.6%) |
| 3 or more Vehicles | 70 (22.2%) | 3 (42.9%) |
| Total | 315 (100.0%) | 7 (100.0%) |
Real Estate & Mortgages in Bellerose
Real Estate and Mortgage Overview in Bellerose
| Characteristic | Without Mortgage | With Mortgage |
| Housing Units | 118 | 197 |
| Median Property Value | $820,000 | $832,300 |
| Median Household Income | $125,625 | $152 |
| Monthly Housing Costs | $1,501 | $161 |
| Real Estate Taxes | $10,001 | $0 |
Property Value by Mortgage Status in Bellerose
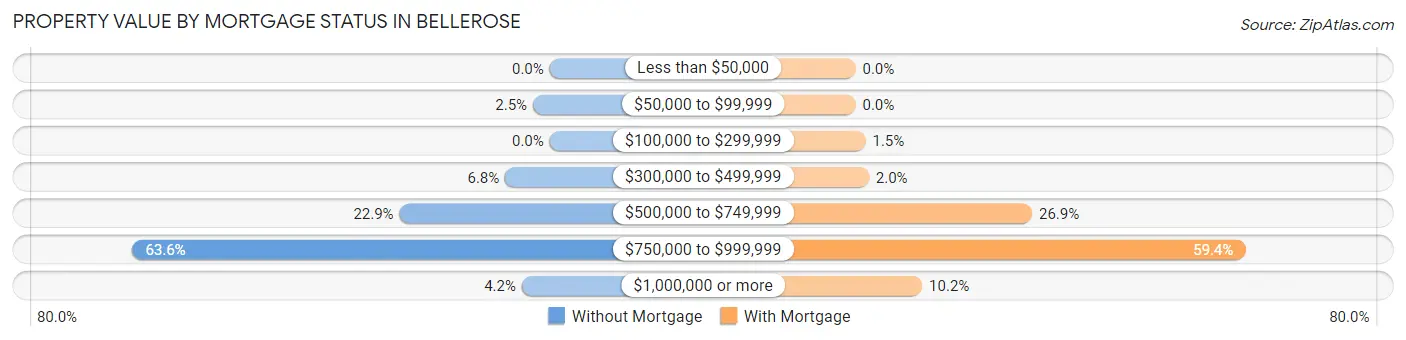
| Property Value | Without Mortgage | With Mortgage |
| Less than $50,000 | 0 (0.0%) | 0 (0.0%) |
| $50,000 to $99,999 | 3 (2.5%) | 0 (0.0%) |
| $100,000 to $299,999 | 0 (0.0%) | 3 (1.5%) |
| $300,000 to $499,999 | 8 (6.8%) | 4 (2.0%) |
| $500,000 to $749,999 | 27 (22.9%) | 53 (26.9%) |
| $750,000 to $999,999 | 75 (63.6%) | 117 (59.4%) |
| $1,000,000 or more | 5 (4.2%) | 20 (10.2%) |
| Total | 118 (100.0%) | 197 (100.0%) |
Household Income by Mortgage Status in Bellerose
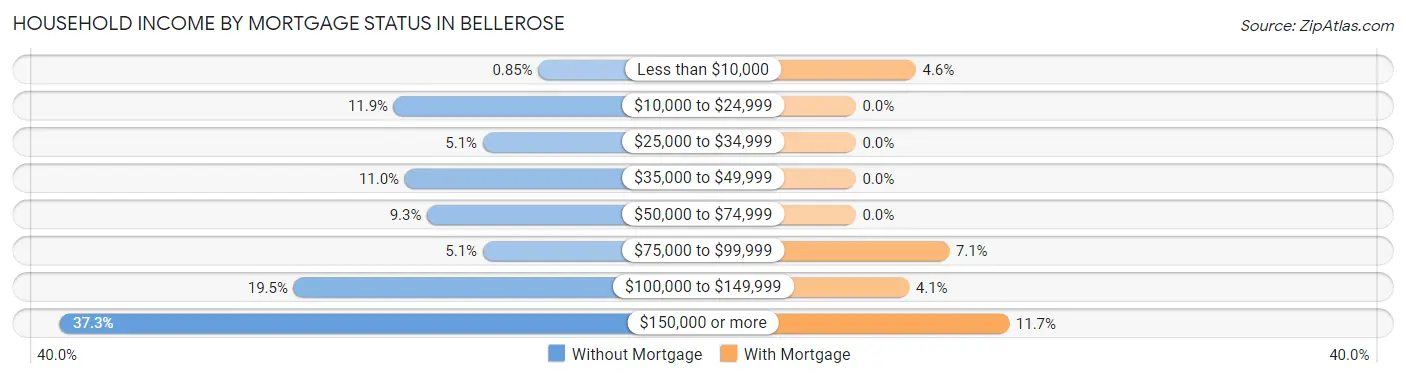
| Household Income | Without Mortgage | With Mortgage |
| Less than $10,000 | 1 (0.9%) | 9 (4.6%) |
| $10,000 to $24,999 | 14 (11.9%) | 0 (0.0%) |
| $25,000 to $34,999 | 6 (5.1%) | 0 (0.0%) |
| $35,000 to $49,999 | 13 (11.0%) | 0 (0.0%) |
| $50,000 to $74,999 | 11 (9.3%) | 0 (0.0%) |
| $75,000 to $99,999 | 6 (5.1%) | 14 (7.1%) |
| $100,000 to $149,999 | 23 (19.5%) | 8 (4.1%) |
| $150,000 or more | 44 (37.3%) | 23 (11.7%) |
| Total | 118 (100.0%) | 197 (100.0%) |
Property Value to Household Income Ratio in Bellerose
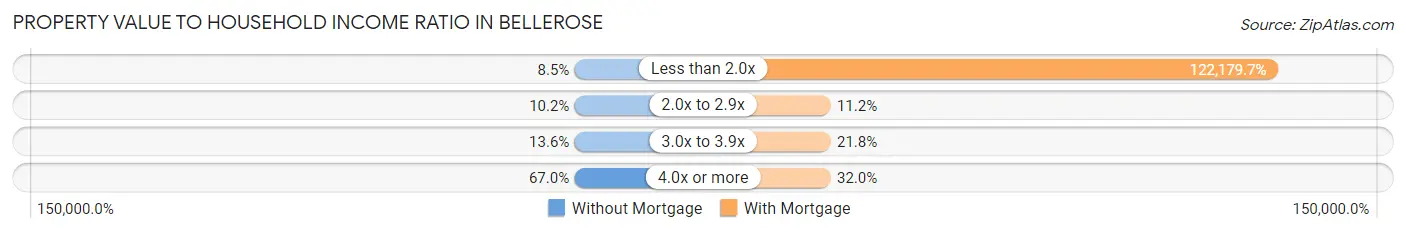
| Value-to-Income Ratio | Without Mortgage | With Mortgage |
| Less than 2.0x | 10 (8.5%) | 240,694 (122,179.7%) |
| 2.0x to 2.9x | 12 (10.2%) | 22 (11.2%) |
| 3.0x to 3.9x | 16 (13.6%) | 43 (21.8%) |
| 4.0x or more | 79 (66.9%) | 63 (32.0%) |
| Total | 118 (100.0%) | 197 (100.0%) |
Real Estate Taxes by Mortgage Status in Bellerose
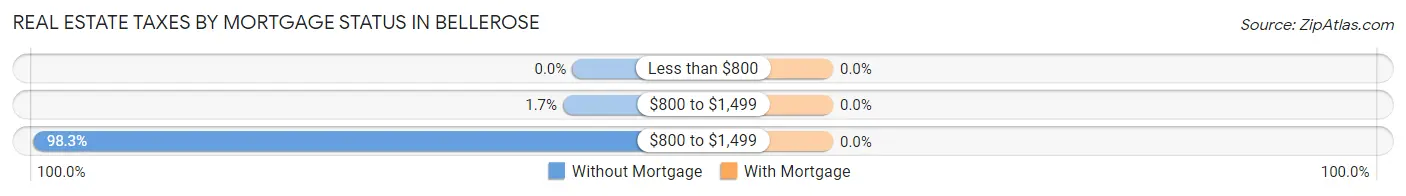
| Property Taxes | Without Mortgage | With Mortgage |
| Less than $800 | 0 (0.0%) | 0 (0.0%) |
| $800 to $1,499 | 2 (1.7%) | 0 (0.0%) |
| $800 to $1,499 | 116 (98.3%) | 0 (0.0%) |
| Total | 118 (100.0%) | 197 (100.0%) |
Health & Disability in Bellerose
Health Insurance Coverage by Age in Bellerose
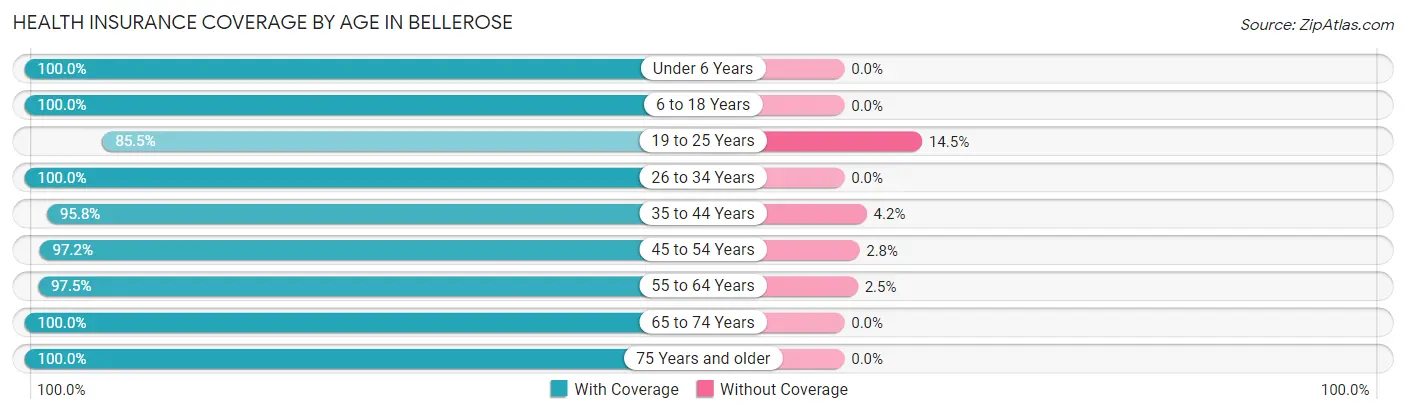
| Age Bracket | With Coverage | Without Coverage |
| Under 6 Years | 81 (100.0%) | 0 (0.0%) |
| 6 to 18 Years | 181 (100.0%) | 0 (0.0%) |
| 19 to 25 Years | 59 (85.5%) | 10 (14.5%) |
| 26 to 34 Years | 68 (100.0%) | 0 (0.0%) |
| 35 to 44 Years | 115 (95.8%) | 5 (4.2%) |
| 45 to 54 Years | 139 (97.2%) | 4 (2.8%) |
| 55 to 64 Years | 117 (97.5%) | 3 (2.5%) |
| 65 to 74 Years | 155 (100.0%) | 0 (0.0%) |
| 75 Years and older | 62 (100.0%) | 0 (0.0%) |
| Total | 977 (97.8%) | 22 (2.2%) |
Health Insurance Coverage by Citizenship Status in Bellerose
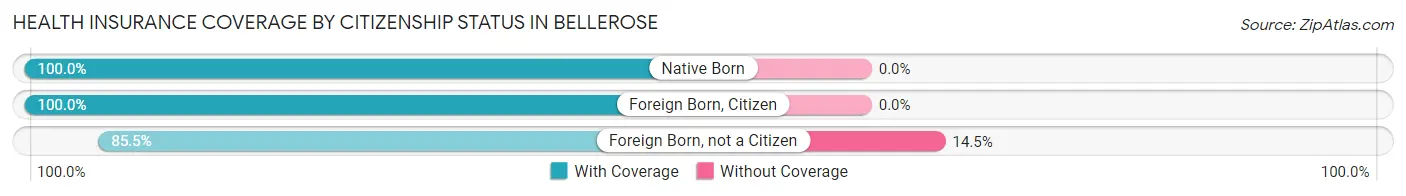
| Citizenship Status | With Coverage | Without Coverage |
| Native Born | 81 (100.0%) | 0 (0.0%) |
| Foreign Born, Citizen | 181 (100.0%) | 0 (0.0%) |
| Foreign Born, not a Citizen | 59 (85.5%) | 10 (14.5%) |
Health Insurance Coverage by Household Income in Bellerose
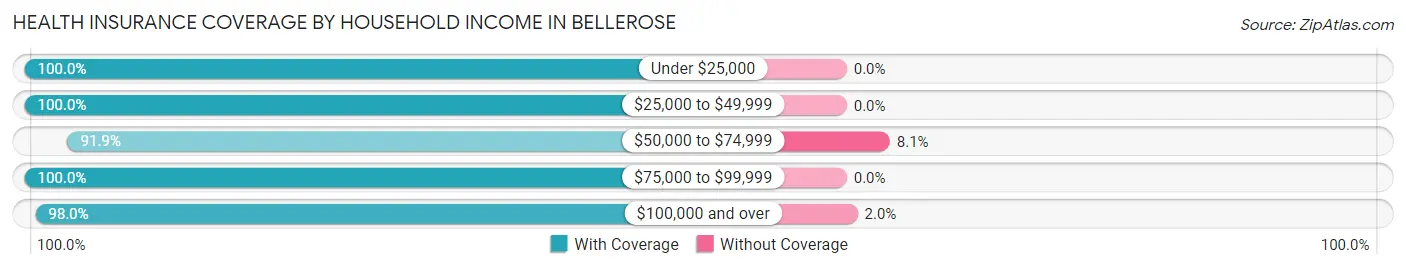
| Household Income | With Coverage | Without Coverage |
| Under $25,000 | 25 (100.0%) | 0 (0.0%) |
| $25,000 to $49,999 | 31 (100.0%) | 0 (0.0%) |
| $50,000 to $74,999 | 57 (91.9%) | 5 (8.1%) |
| $75,000 to $99,999 | 38 (100.0%) | 0 (0.0%) |
| $100,000 and over | 826 (98.0%) | 17 (2.0%) |
Public vs Private Health Insurance Coverage by Age in Bellerose
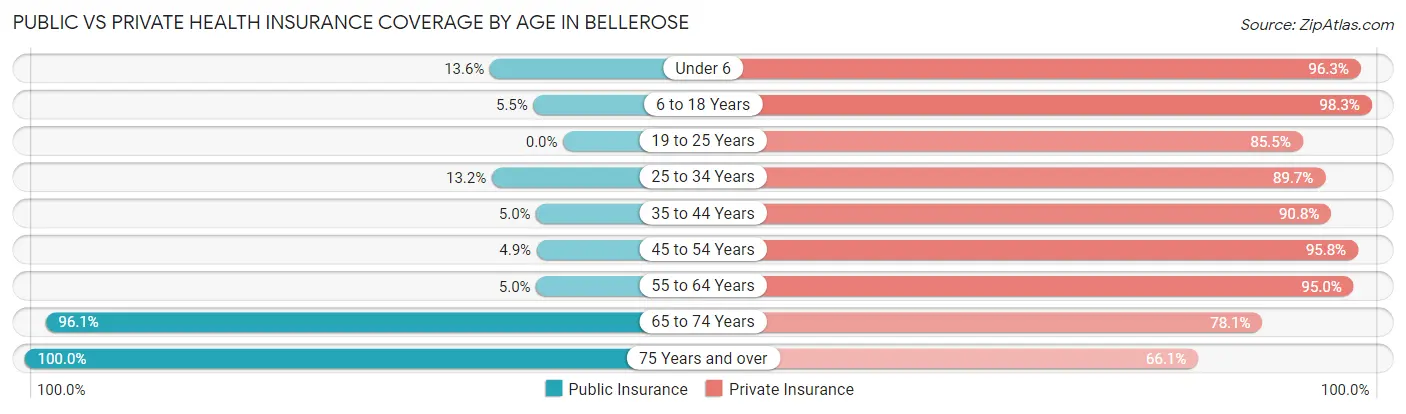
| Age Bracket | Public Insurance | Private Insurance |
| Under 6 | 11 (13.6%) | 78 (96.3%) |
| 6 to 18 Years | 10 (5.5%) | 178 (98.3%) |
| 19 to 25 Years | 0 (0.0%) | 59 (85.5%) |
| 25 to 34 Years | 9 (13.2%) | 61 (89.7%) |
| 35 to 44 Years | 6 (5.0%) | 109 (90.8%) |
| 45 to 54 Years | 7 (4.9%) | 137 (95.8%) |
| 55 to 64 Years | 6 (5.0%) | 114 (95.0%) |
| 65 to 74 Years | 149 (96.1%) | 121 (78.1%) |
| 75 Years and over | 62 (100.0%) | 41 (66.1%) |
| Total | 260 (26.0%) | 898 (89.9%) |
Disability Status by Sex by Age in Bellerose
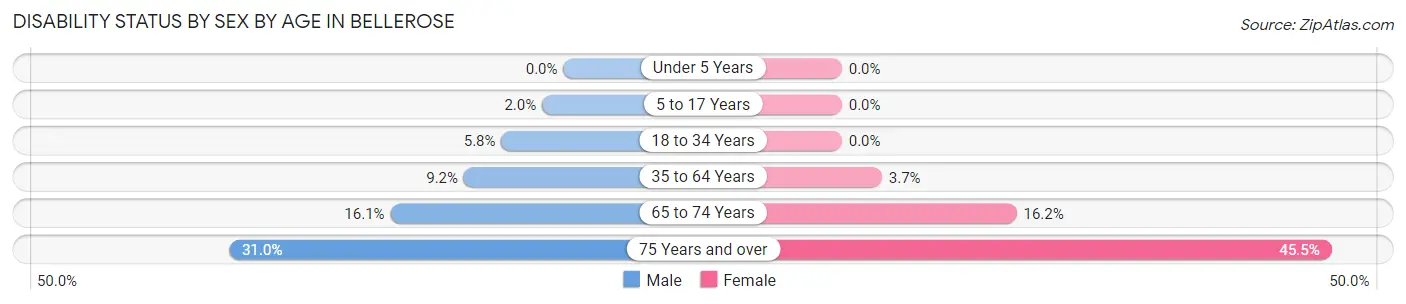
| Age Bracket | Male | Female |
| Under 5 Years | 0 (0.0%) | 0 (0.0%) |
| 5 to 17 Years | 2 (2.0%) | 0 (0.0%) |
| 18 to 34 Years | 5 (5.8%) | 0 (0.0%) |
| 35 to 64 Years | 18 (9.2%) | 7 (3.7%) |
| 65 to 74 Years | 13 (16.1%) | 12 (16.2%) |
| 75 Years and over | 9 (31.0%) | 15 (45.5%) |
Disability Class by Sex by Age in Bellerose
Disability Class: Hearing Difficulty
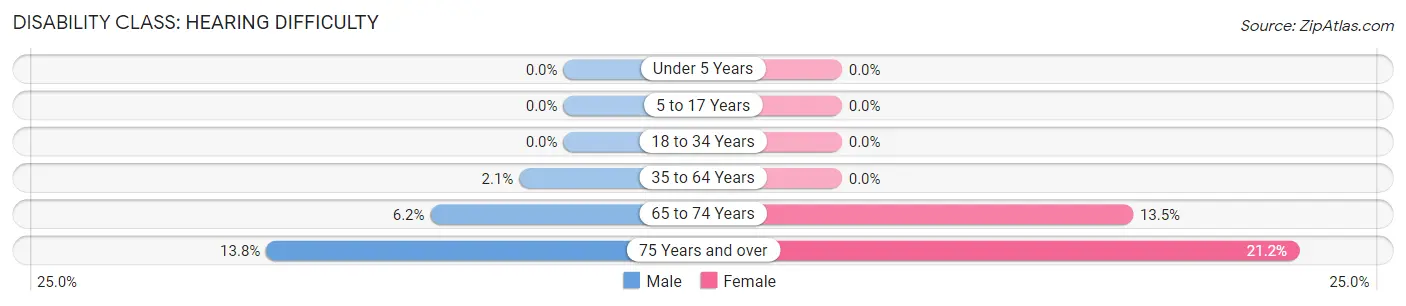
| Age Bracket | Male | Female |
| Under 5 Years | 0 (0.0%) | 0 (0.0%) |
| 5 to 17 Years | 0 (0.0%) | 0 (0.0%) |
| 18 to 34 Years | 0 (0.0%) | 0 (0.0%) |
| 35 to 64 Years | 4 (2.1%) | 0 (0.0%) |
| 65 to 74 Years | 5 (6.2%) | 10 (13.5%) |
| 75 Years and over | 4 (13.8%) | 7 (21.2%) |
Disability Class: Vision Difficulty
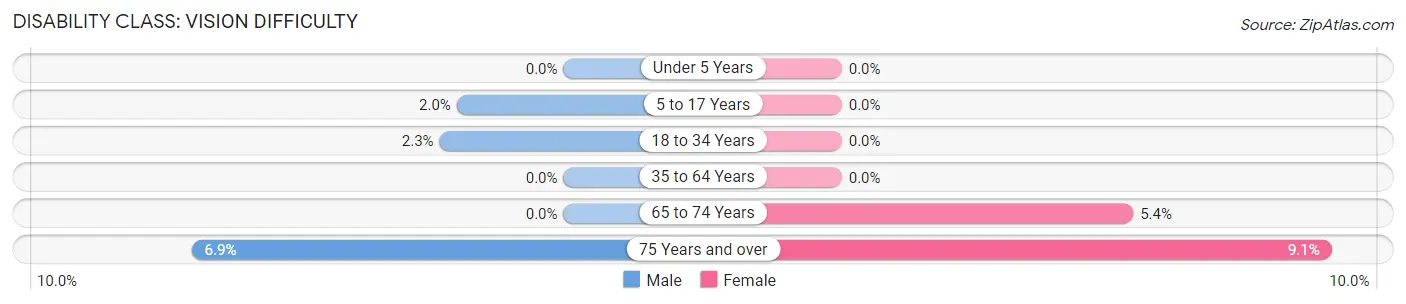
| Age Bracket | Male | Female |
| Under 5 Years | 0 (0.0%) | 0 (0.0%) |
| 5 to 17 Years | 2 (2.0%) | 0 (0.0%) |
| 18 to 34 Years | 2 (2.3%) | 0 (0.0%) |
| 35 to 64 Years | 0 (0.0%) | 0 (0.0%) |
| 65 to 74 Years | 0 (0.0%) | 4 (5.4%) |
| 75 Years and over | 2 (6.9%) | 3 (9.1%) |
Disability Class: Cognitive Difficulty
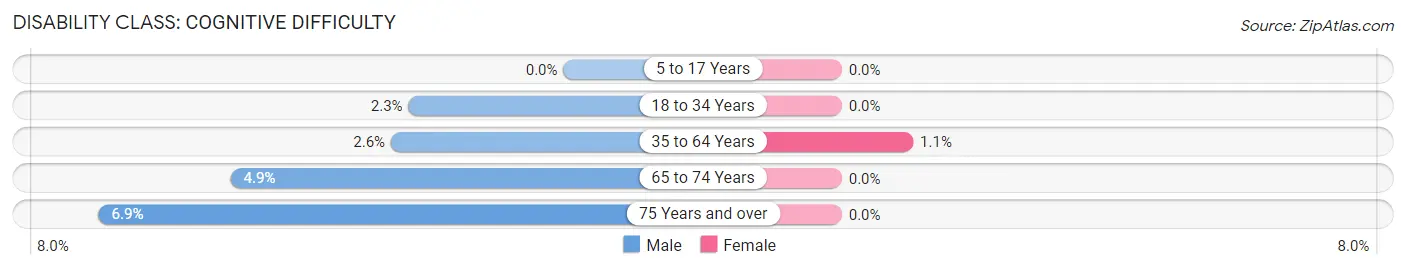
| Age Bracket | Male | Female |
| 5 to 17 Years | 0 (0.0%) | 0 (0.0%) |
| 18 to 34 Years | 2 (2.3%) | 0 (0.0%) |
| 35 to 64 Years | 5 (2.6%) | 2 (1.1%) |
| 65 to 74 Years | 4 (4.9%) | 0 (0.0%) |
| 75 Years and over | 2 (6.9%) | 0 (0.0%) |
Disability Class: Ambulatory Difficulty
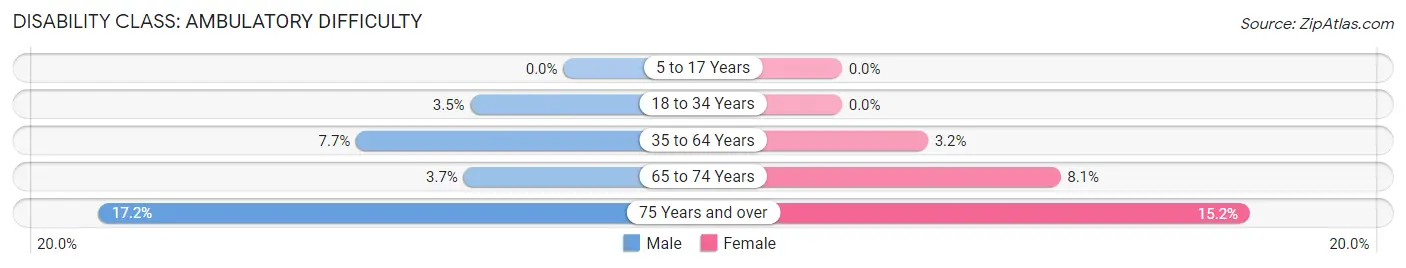
| Age Bracket | Male | Female |
| 5 to 17 Years | 0 (0.0%) | 0 (0.0%) |
| 18 to 34 Years | 3 (3.5%) | 0 (0.0%) |
| 35 to 64 Years | 15 (7.7%) | 6 (3.2%) |
| 65 to 74 Years | 3 (3.7%) | 6 (8.1%) |
| 75 Years and over | 5 (17.2%) | 5 (15.1%) |
Disability Class: Self-Care Difficulty
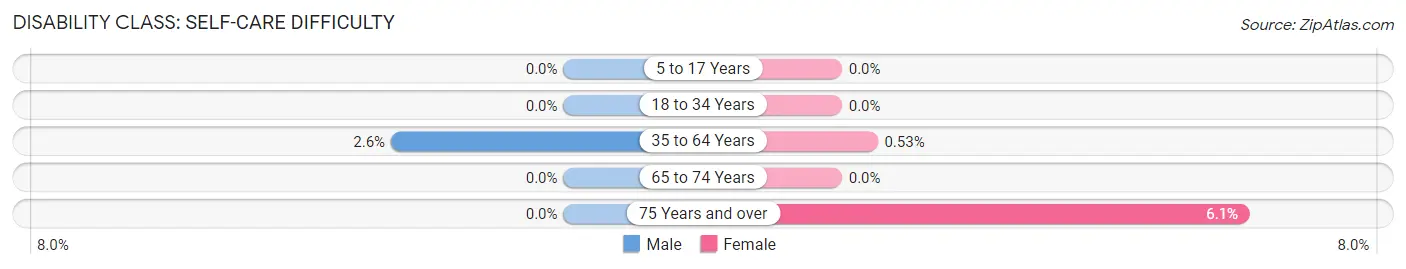
| Age Bracket | Male | Female |
| 5 to 17 Years | 0 (0.0%) | 0 (0.0%) |
| 18 to 34 Years | 0 (0.0%) | 0 (0.0%) |
| 35 to 64 Years | 5 (2.6%) | 1 (0.5%) |
| 65 to 74 Years | 0 (0.0%) | 0 (0.0%) |
| 75 Years and over | 0 (0.0%) | 2 (6.1%) |
Technology Access in Bellerose
Computing Device Access in Bellerose
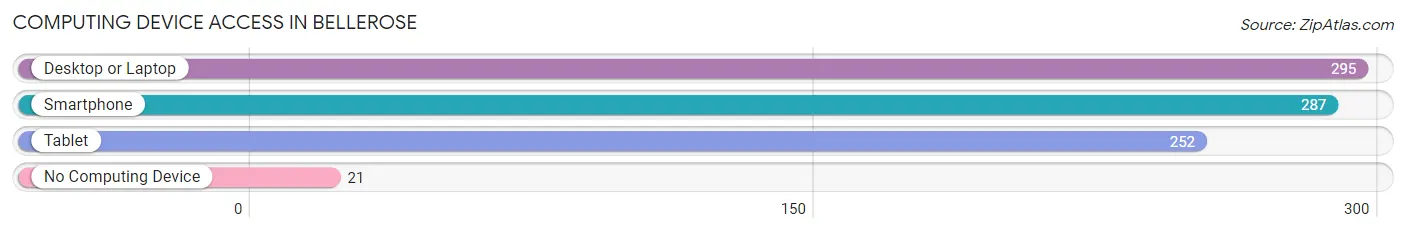
| Device Type | # Households | % Households |
| Desktop or Laptop | 295 | 91.6% |
| Smartphone | 287 | 89.1% |
| Tablet | 252 | 78.3% |
| No Computing Device | 21 | 6.5% |
| Total | 322 | 100.0% |
Internet Access in Bellerose
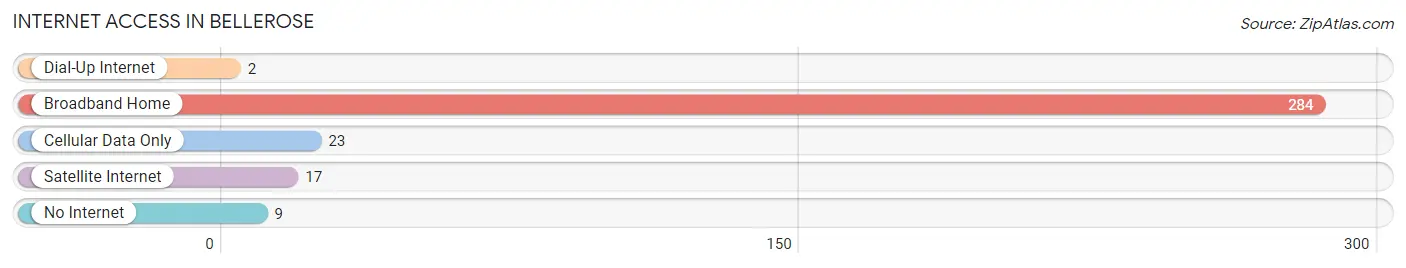
| Internet Type | # Households | % Households |
| Dial-Up Internet | 2 | 0.6% |
| Broadband Home | 284 | 88.2% |
| Cellular Data Only | 23 | 7.1% |
| Satellite Internet | 17 | 5.3% |
| No Internet | 9 | 2.8% |
| Total | 322 | 100.0% |
Bellerose Summary
Bellerose is a village located in the town of Hempstead in Nassau County, New York. It is situated on the south shore of Long Island, approximately 25 miles east of Manhattan. The village has a population of approximately 5,000 people and covers an area of 0.6 square miles.
History
The area that is now Bellerose was originally inhabited by the Matinecock Native American tribe. The first European settlers arrived in the area in the late 1600s and the village was officially incorporated in 1925. The village was named after the Bellerose family, who were among the first settlers in the area.
The village was largely agricultural until the 1950s, when it began to experience rapid growth and development. This was due to the construction of the Long Island Expressway, which made the village more accessible to commuters. The village has since become a popular residential area for commuters to New York City.
Geography
Bellerose is located on the south shore of Long Island, approximately 25 miles east of Manhattan. It is bordered by the villages of Floral Park and Stewart Manor to the west, Elmont to the north, and Bellerose Terrace to the east. The village is situated on a flat plain, with an elevation of approximately 30 feet above sea level.
The climate in Bellerose is classified as humid subtropical, with hot, humid summers and mild winters. The average annual temperature is around 55°F, with an average high of around 80°F in the summer and an average low of around 40°F in the winter.
Economy
The economy of Bellerose is largely based on retail and services. The village is home to a variety of small businesses, including restaurants, shops, and professional services. The village also has a number of corporate offices, including those of the Long Island Power Authority and the New York State Department of Motor Vehicles.
The village is also home to a number of industrial and manufacturing businesses, including a printing company, a plastics manufacturer, and a food processing plant. The village is also home to a number of medical facilities, including a hospital and a number of medical offices.
Demographics
As of the 2010 census, the population of Bellerose was 5,000. The racial makeup of the village was 79.2% White, 8.2% African American, 0.2% Native American, 5.2% Asian, and 6.2% from other races. Hispanic or Latino of any race were 11.2% of the population.
The median household income in Bellerose was $76,250, and the median family income was $87,500. The per capita income was $32,000. About 8.2% of families and 10.2% of the population were below the poverty line.
The village is served by the Bellerose Union Free School District, which includes two elementary schools, one middle school, and one high school. The village is also home to a number of private schools, including a Catholic school and a Jewish day school.
Common Questions
What is Per Capita Income in Bellerose?
Per Capita income in Bellerose is $70,307.
What is the Median Family Income in Bellerose?
Median Family Income in Bellerose is $224,375.
What is the Median Household income in Bellerose?
Median Household Income in Bellerose is $204,167.
What is Income or Wage Gap in Bellerose?
Income or Wage Gap in Bellerose is 27.1%.
Women in Bellerose earn 72.9 cents for every dollar earned by a man.
What is Inequality or Gini Index in Bellerose?
Inequality or Gini Index in Bellerose is 0.37.
What is the Total Population of Bellerose?
Total Population of Bellerose is 999.
What is the Total Male Population of Bellerose?
Total Male Population of Bellerose is 507.
What is the Total Female Population of Bellerose?
Total Female Population of Bellerose is 492.
What is the Ratio of Males per 100 Females in Bellerose?
There are 103.05 Males per 100 Females in Bellerose.
What is the Ratio of Females per 100 Males in Bellerose?
There are 97.04 Females per 100 Males in Bellerose.
What is the Median Population Age in Bellerose?
Median Population Age in Bellerose is 43.0 Years.
What is the Average Family Size in Bellerose
Average Family Size in Bellerose is 3.4 People.
What is the Average Household Size in Bellerose
Average Household Size in Bellerose is 3.1 People.
How Large is the Labor Force in Bellerose?
There are 421 People in the Labor Forcein in Bellerose.
What is the Percentage of People in the Labor Force in Bellerose?
54.5% of People are in the Labor Force in Bellerose.
What is the Unemployment Rate in Bellerose?
Unemployment Rate in Bellerose is 6.2%.