Stoneham, MA Map & Demographics
Stoneham Map
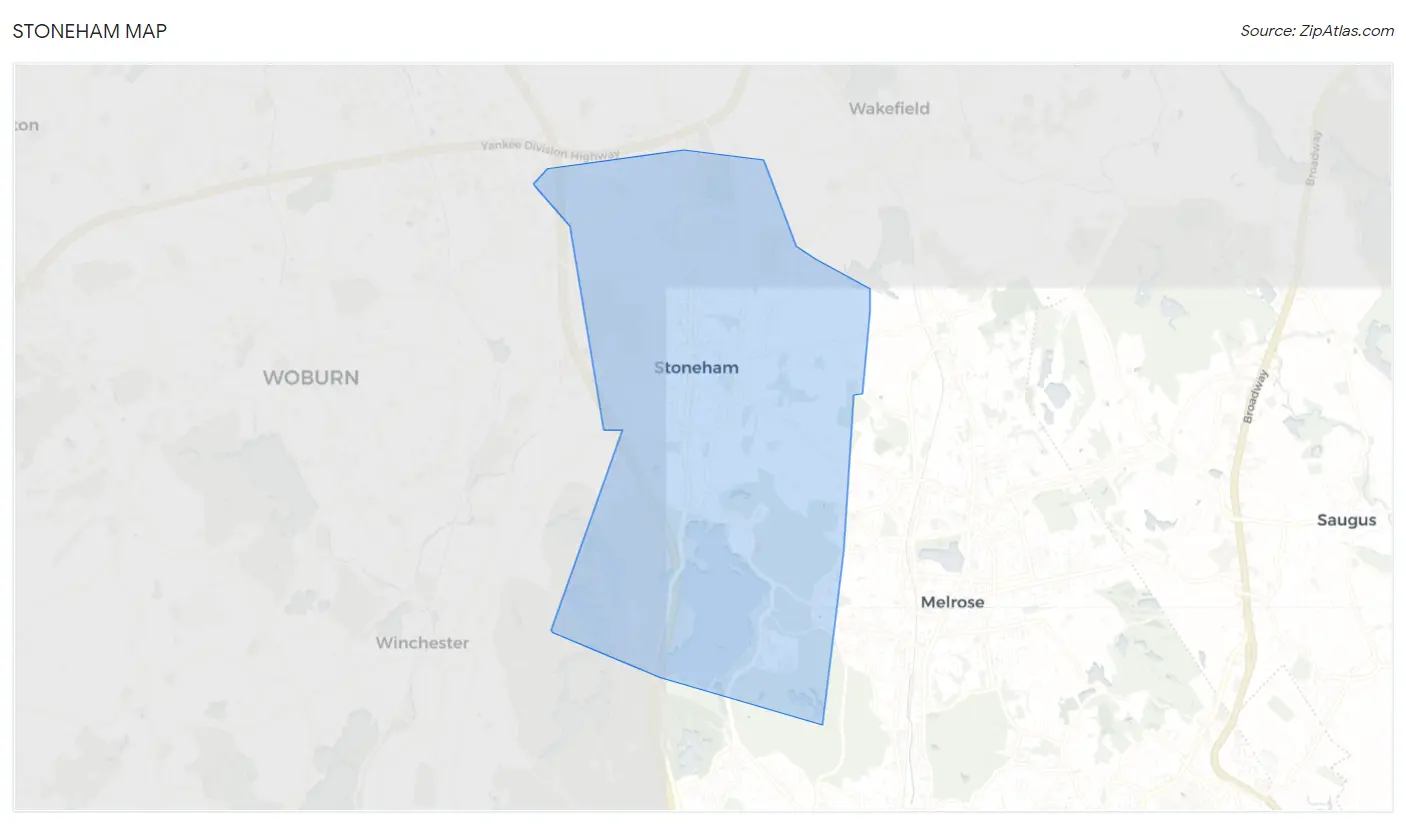
Stoneham Overview
$60,043
PER CAPITA INCOME
$153,873
AVG FAMILY INCOME
$112,935
AVG HOUSEHOLD INCOME
23.3%
WAGE / INCOME GAP [ % ]
76.7¢/ $1
WAGE / INCOME GAP [ $ ]
0.42
INEQUALITY / GINI INDEX
22,992
TOTAL POPULATION
10,929
MALE POPULATION
12,063
FEMALE POPULATION
90.60
MALES / 100 FEMALES
110.38
FEMALES / 100 MALES
42.1
MEDIAN AGE
3.0
AVG FAMILY SIZE
2.4
AVG HOUSEHOLD SIZE
13,535
LABOR FORCE [ PEOPLE ]
71.8%
PERCENT IN LABOR FORCE
3.3%
UNEMPLOYMENT RATE
Stoneham Zip Codes
Income in Stoneham
Income Overview in Stoneham
Per Capita Income in Stoneham is $60,043, while median incomes of families and households are $153,873 and $112,935 respectively.
| Characteristic | Number | Measure |
| Per Capita Income | 22,992 | $60,043 |
| Median Family Income | 5,922 | $153,873 |
| Mean Family Income | 5,922 | $179,689 |
| Median Household Income | 9,654 | $112,935 |
| Mean Household Income | 9,654 | $141,403 |
| Income Deficit | 5,922 | $0 |
| Wage / Income Gap (%) | 22,992 | 23.26% |
| Wage / Income Gap ($) | 22,992 | 76.74¢ per $1 |
| Gini / Inequality Index | 22,992 | 0.42 |
Earnings by Sex in Stoneham
Average Earnings in Stoneham are $69,422, $75,829 for men and $58,194 for women, a difference of 23.3%.
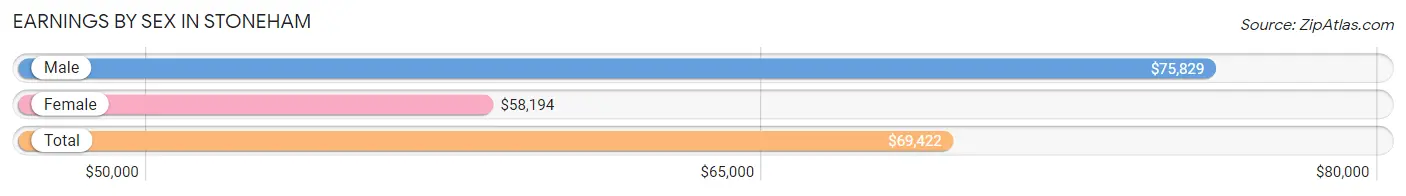
| Sex | Number | Average Earnings |
| Male | 6,955 (50.3%) | $75,829 |
| Female | 6,875 (49.7%) | $58,194 |
| Total | 13,830 (100.0%) | $69,422 |
Earnings by Sex by Income Bracket in Stoneham
The most common earnings brackets in Stoneham are $100,000+ for men (2,614 | 37.6%) and $100,000+ for women (1,488 | 21.6%).
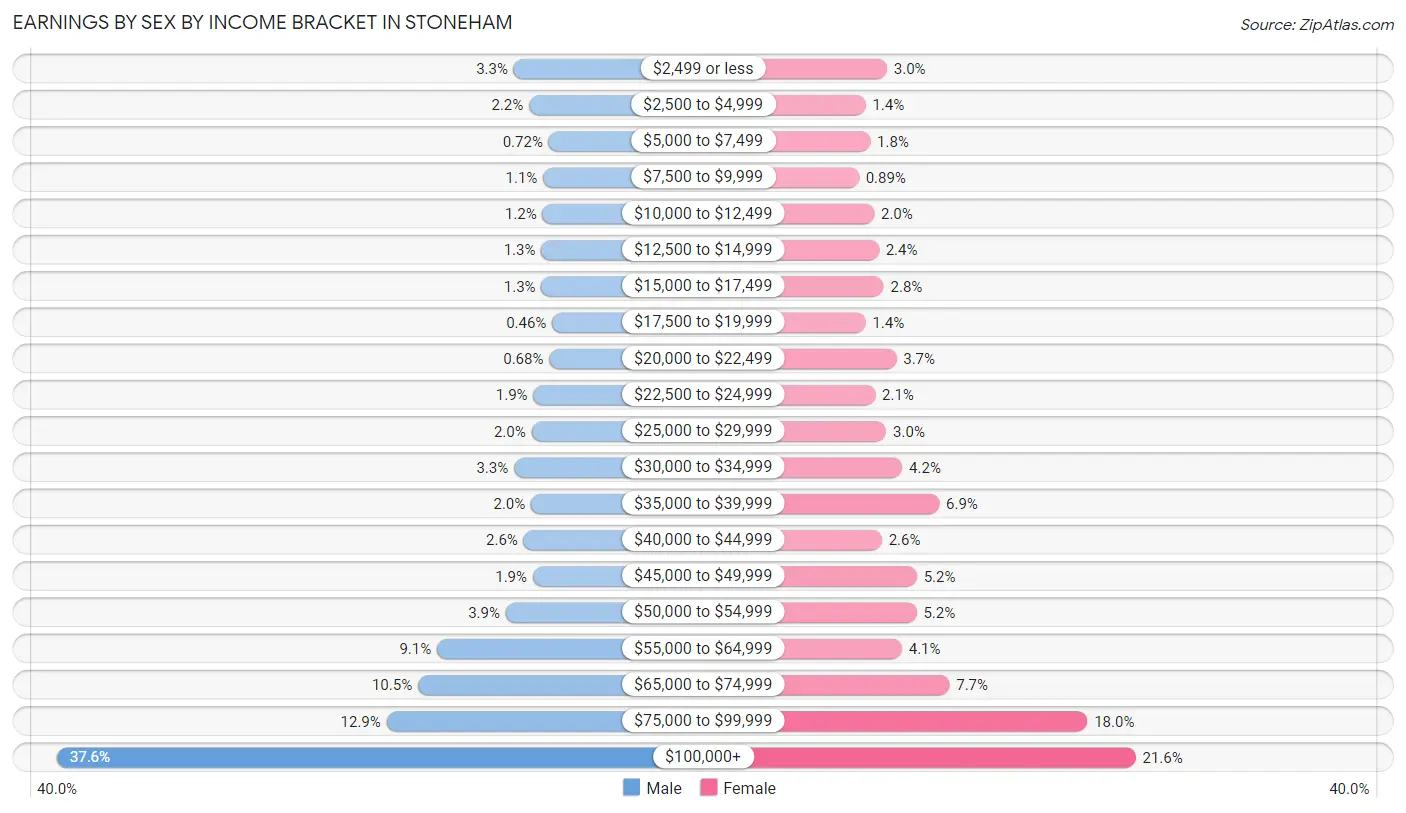
| Income | Male | Female |
| $2,499 or less | 232 (3.3%) | 206 (3.0%) |
| $2,500 to $4,999 | 152 (2.2%) | 96 (1.4%) |
| $5,000 to $7,499 | 50 (0.7%) | 120 (1.8%) |
| $7,500 to $9,999 | 79 (1.1%) | 61 (0.9%) |
| $10,000 to $12,499 | 82 (1.2%) | 140 (2.0%) |
| $12,500 to $14,999 | 89 (1.3%) | 164 (2.4%) |
| $15,000 to $17,499 | 88 (1.3%) | 190 (2.8%) |
| $17,500 to $19,999 | 32 (0.5%) | 96 (1.4%) |
| $20,000 to $22,499 | 47 (0.7%) | 255 (3.7%) |
| $22,500 to $24,999 | 130 (1.9%) | 146 (2.1%) |
| $25,000 to $29,999 | 140 (2.0%) | 203 (2.9%) |
| $30,000 to $34,999 | 231 (3.3%) | 285 (4.2%) |
| $35,000 to $39,999 | 142 (2.0%) | 476 (6.9%) |
| $40,000 to $44,999 | 181 (2.6%) | 180 (2.6%) |
| $45,000 to $49,999 | 133 (1.9%) | 360 (5.2%) |
| $50,000 to $54,999 | 274 (3.9%) | 359 (5.2%) |
| $55,000 to $64,999 | 632 (9.1%) | 283 (4.1%) |
| $65,000 to $74,999 | 732 (10.5%) | 528 (7.7%) |
| $75,000 to $99,999 | 895 (12.9%) | 1,239 (18.0%) |
| $100,000+ | 2,614 (37.6%) | 1,488 (21.6%) |
| Total | 6,955 (100.0%) | 6,875 (100.0%) |
Earnings by Sex by Educational Attainment in Stoneham
Average earnings in Stoneham are $83,823 for men and $66,336 for women, a difference of 20.9%. Men with an educational attainment of graduate degree enjoy the highest average annual earnings of $132,782, while those with high school diploma education earn the least with $57,777. Women with an educational attainment of graduate degree earn the most with the average annual earnings of $93,826, while those with college or associate's degree education have the smallest earnings of $39,253.
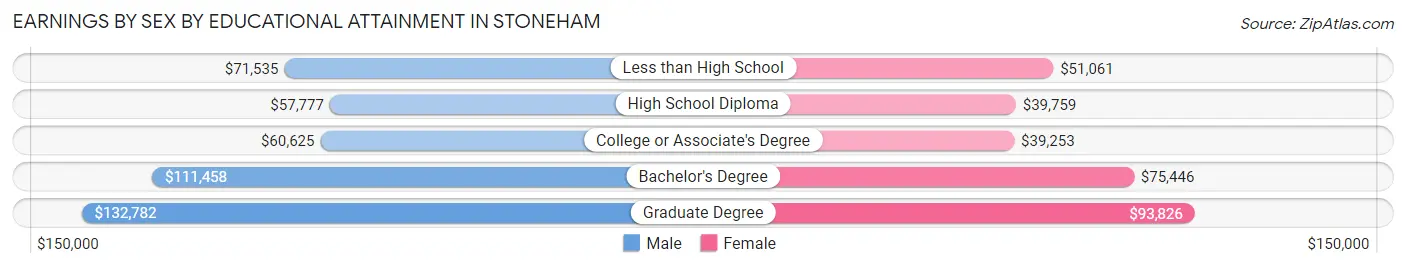
| Educational Attainment | Male Income | Female Income |
| Less than High School | $71,535 | $51,061 |
| High School Diploma | $57,777 | $39,759 |
| College or Associate's Degree | $60,625 | $39,253 |
| Bachelor's Degree | $111,458 | $75,446 |
| Graduate Degree | $132,782 | $93,826 |
| Total | $83,823 | $66,336 |
Family Income in Stoneham
Family Income Brackets in Stoneham
According to the Stoneham family income data, there are 1,996 families falling into the $200,000+ income range, which is the most common income bracket and makes up 33.7% of all families. Conversely, the less than $10,000 income bracket is the least frequent group with only 47 families (0.8%) belonging to this category.
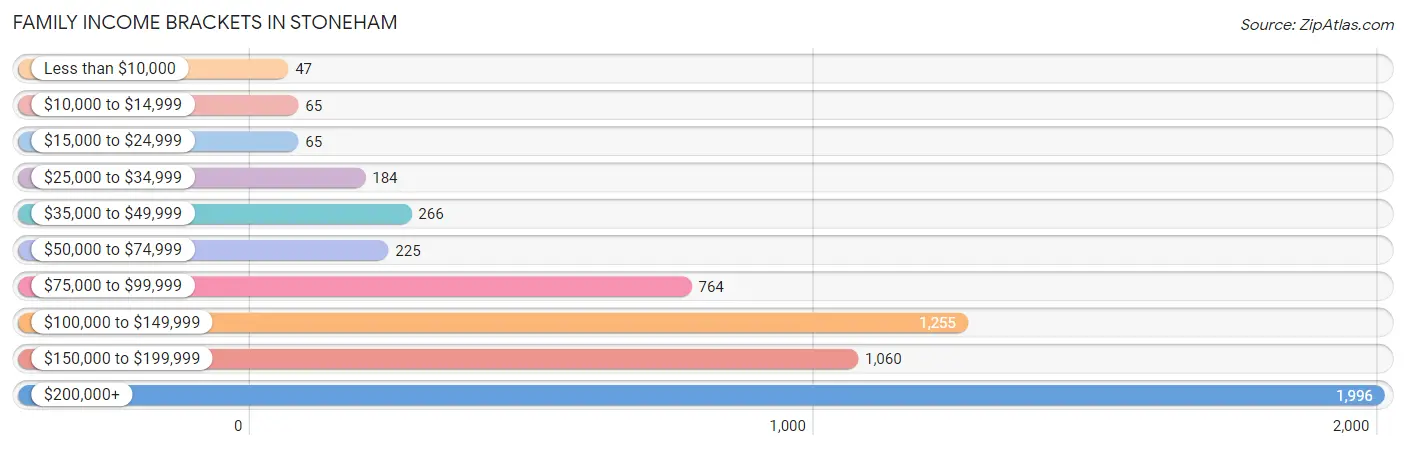
| Income Bracket | # Families | % Families |
| Less than $10,000 | 47 | 0.8% |
| $10,000 to $14,999 | 65 | 1.1% |
| $15,000 to $24,999 | 65 | 1.1% |
| $25,000 to $34,999 | 184 | 3.1% |
| $35,000 to $49,999 | 266 | 4.5% |
| $50,000 to $74,999 | 225 | 3.8% |
| $75,000 to $99,999 | 764 | 12.9% |
| $100,000 to $149,999 | 1,255 | 21.2% |
| $150,000 to $199,999 | 1,060 | 17.9% |
| $200,000+ | 1,996 | 33.7% |
Family Income by Famaliy Size in Stoneham
5-person families (423 | 7.1%) account for the highest median family income in Stoneham with $203,918 per family, while 2-person families (2,813 | 47.5%) have the highest median income of $61,702 per family member.
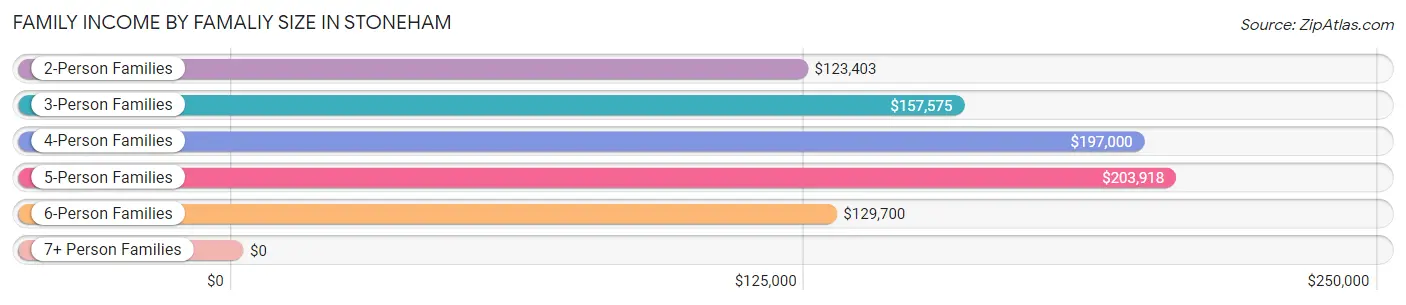
| Income Bracket | # Families | Median Income |
| 2-Person Families | 2,813 (47.5%) | $123,403 |
| 3-Person Families | 1,291 (21.8%) | $157,575 |
| 4-Person Families | 1,240 (20.9%) | $197,000 |
| 5-Person Families | 423 (7.1%) | $203,918 |
| 6-Person Families | 132 (2.2%) | $129,700 |
| 7+ Person Families | 23 (0.4%) | $0 |
| Total | 5,922 (100.0%) | $153,873 |
Family Income by Number of Earners in Stoneham
The median family income in Stoneham is $153,873, with families comprising 3+ earners (920) having the highest median family income of $217,237, while families with no earners (674) have the lowest median family income of $84,688, accounting for 15.5% and 11.4% of families, respectively.
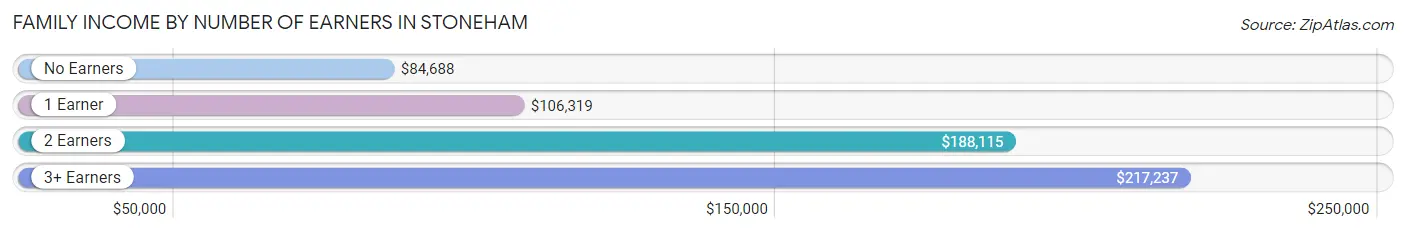
| Number of Earners | # Families | Median Income |
| No Earners | 674 (11.4%) | $84,688 |
| 1 Earner | 1,381 (23.3%) | $106,319 |
| 2 Earners | 2,947 (49.8%) | $188,115 |
| 3+ Earners | 920 (15.5%) | $217,237 |
| Total | 5,922 (100.0%) | $153,873 |
Household Income in Stoneham
Household Income Brackets in Stoneham
With 2,346 households falling in the category, the $200,000+ income range is the most frequent in Stoneham, accounting for 24.3% of all households. In contrast, only 203 households (2.1%) fall into the $10,000 to $14,999 income bracket, making it the least populous group.
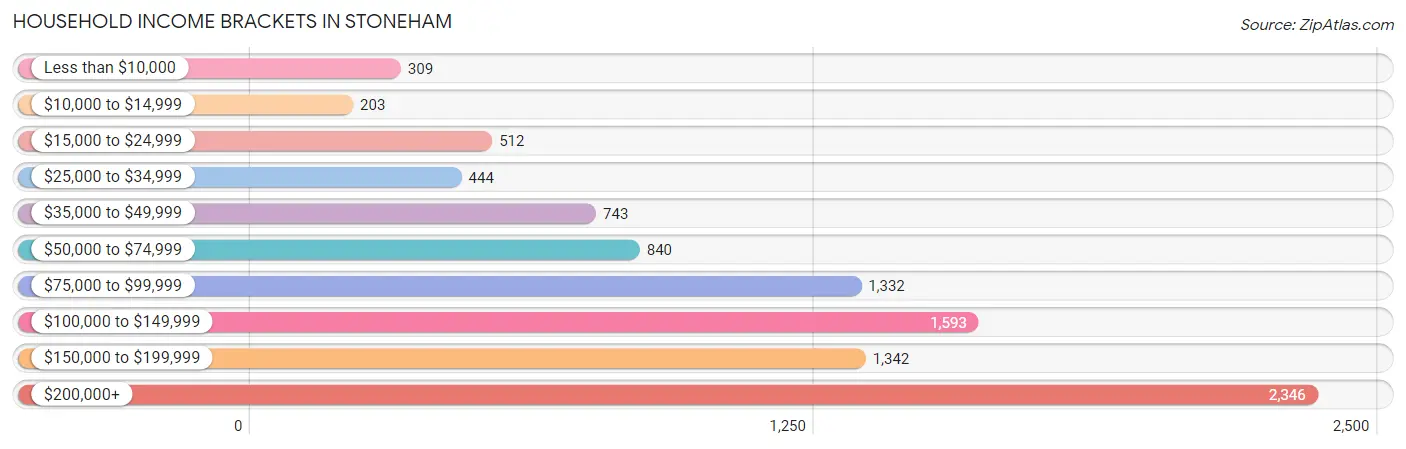
| Income Bracket | # Households | % Households |
| Less than $10,000 | 309 | 3.2% |
| $10,000 to $14,999 | 203 | 2.1% |
| $15,000 to $24,999 | 512 | 5.3% |
| $25,000 to $34,999 | 444 | 4.6% |
| $35,000 to $49,999 | 743 | 7.7% |
| $50,000 to $74,999 | 840 | 8.7% |
| $75,000 to $99,999 | 1,332 | 13.8% |
| $100,000 to $149,999 | 1,593 | 16.5% |
| $150,000 to $199,999 | 1,342 | 13.9% |
| $200,000+ | 2,346 | 24.3% |
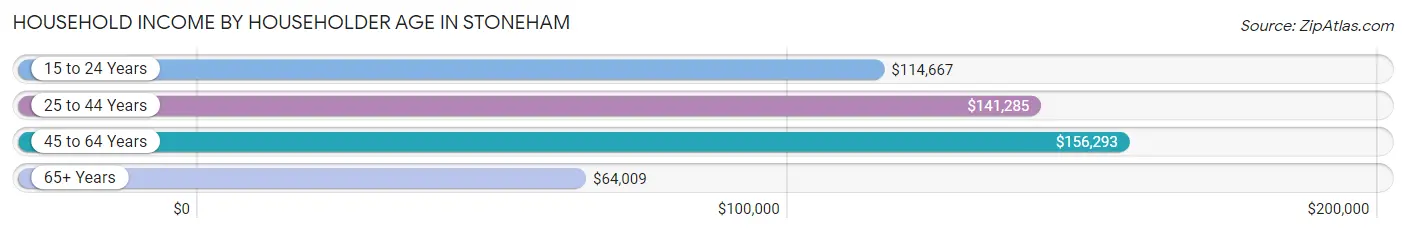
Household Income by Householder Age in Stoneham
The median household income in Stoneham is $112,935, with the highest median household income of $156,293 found in the 45 to 64 years age bracket for the primary householder. A total of 3,186 households (33.0%) fall into this category. Meanwhile, the 65+ years age bracket for the primary householder has the lowest median household income of $64,009, with 3,045 households (31.5%) in this group.
| Income Bracket | # Households | Median Income |
| 15 to 24 Years | 106 (1.1%) | $114,667 |
| 25 to 44 Years | 3,317 (34.4%) | $141,285 |
| 45 to 64 Years | 3,186 (33.0%) | $156,293 |
| 65+ Years | 3,045 (31.5%) | $64,009 |
| Total | 9,654 (100.0%) | $112,935 |
Poverty in Stoneham
Income Below Poverty by Sex and Age in Stoneham
With 4.5% poverty level for males and 4.9% for females among the residents of Stoneham, 65 to 74 year old males and 15 year old females are the most vulnerable to poverty, with 98 males (9.7%) and 35 females (46.1%) in their respective age groups living below the poverty level.
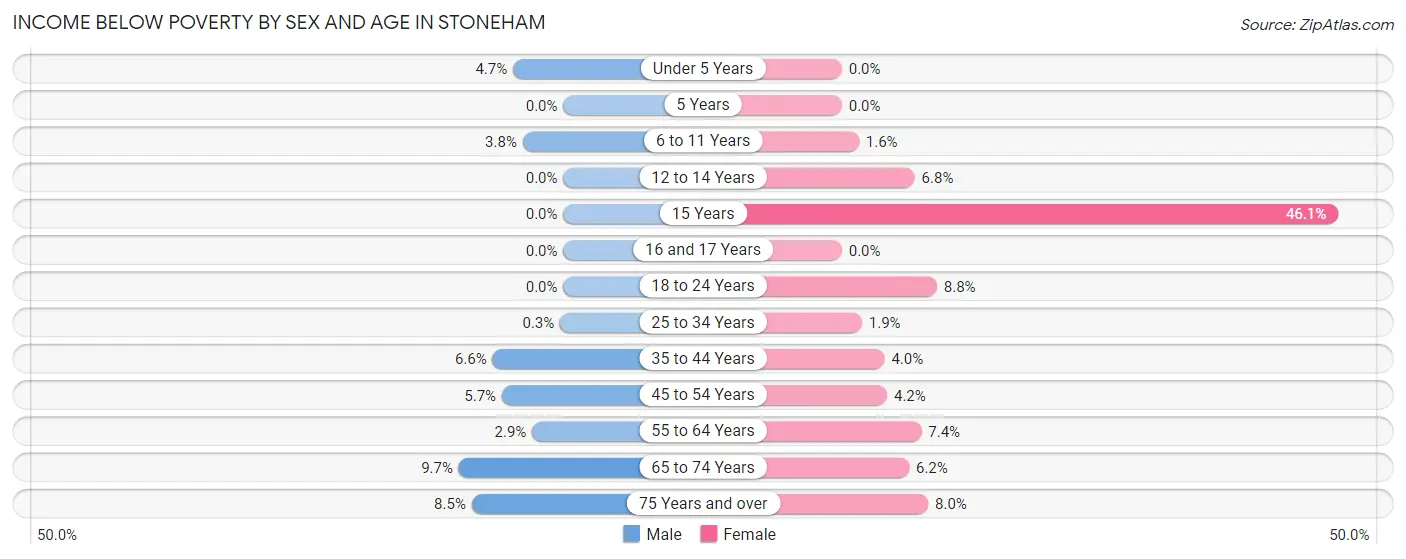
| Age Bracket | Male | Female |
| Under 5 Years | 26 (4.7%) | 0 (0.0%) |
| 5 Years | 0 (0.0%) | 0 (0.0%) |
| 6 to 11 Years | 28 (3.8%) | 11 (1.6%) |
| 12 to 14 Years | 0 (0.0%) | 37 (6.8%) |
| 15 Years | 0 (0.0%) | 35 (46.1%) |
| 16 and 17 Years | 0 (0.0%) | 0 (0.0%) |
| 18 to 24 Years | 0 (0.0%) | 44 (8.8%) |
| 25 to 34 Years | 4 (0.3%) | 31 (1.9%) |
| 35 to 44 Years | 139 (6.6%) | 75 (4.0%) |
| 45 to 54 Years | 72 (5.7%) | 55 (4.2%) |
| 55 to 64 Years | 49 (2.9%) | 119 (7.4%) |
| 65 to 74 Years | 98 (9.7%) | 77 (6.2%) |
| 75 Years and over | 75 (8.5%) | 102 (8.0%) |
| Total | 491 (4.5%) | 586 (4.9%) |
Income Above Poverty by Sex and Age in Stoneham
According to the poverty statistics in Stoneham, males aged 5 years and females aged under 5 years are the age groups that are most secure financially, with 100.0% of males and 100.0% of females in these age groups living above the poverty line.
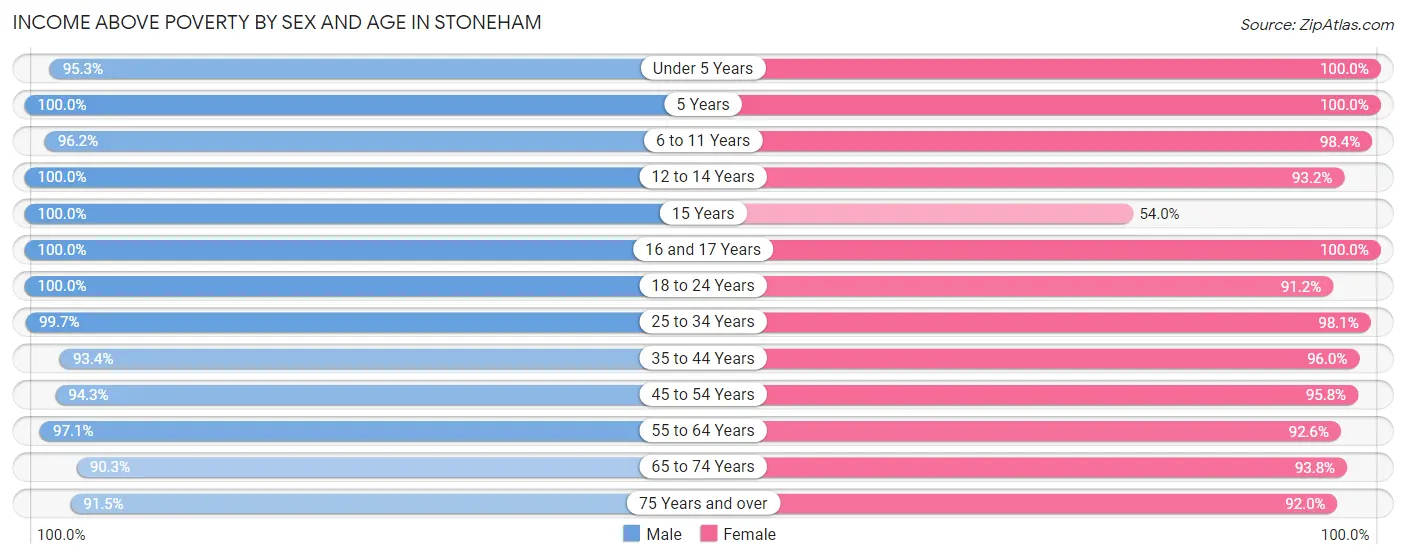
| Age Bracket | Male | Female |
| Under 5 Years | 531 (95.3%) | 814 (100.0%) |
| 5 Years | 193 (100.0%) | 82 (100.0%) |
| 6 to 11 Years | 714 (96.2%) | 686 (98.4%) |
| 12 to 14 Years | 340 (100.0%) | 510 (93.2%) |
| 15 Years | 40 (100.0%) | 41 (53.9%) |
| 16 and 17 Years | 126 (100.0%) | 263 (100.0%) |
| 18 to 24 Years | 610 (100.0%) | 455 (91.2%) |
| 25 to 34 Years | 1,322 (99.7%) | 1,632 (98.1%) |
| 35 to 44 Years | 1,976 (93.4%) | 1,820 (96.0%) |
| 45 to 54 Years | 1,192 (94.3%) | 1,254 (95.8%) |
| 55 to 64 Years | 1,646 (97.1%) | 1,493 (92.6%) |
| 65 to 74 Years | 912 (90.3%) | 1,157 (93.8%) |
| 75 Years and over | 807 (91.5%) | 1,171 (92.0%) |
| Total | 10,409 (95.5%) | 11,378 (95.1%) |
Income Below Poverty Among Married-Couple Families in Stoneham
The poverty statistics for married-couple families in Stoneham show that 2.4% or 120 of the total 4,946 families live below the poverty line. Families with 1 or 2 children have the highest poverty rate of 2.7%, comprising of 46 families. On the other hand, families with 3 or 4 children have the lowest poverty rate of 0.0%, which includes 0 families.
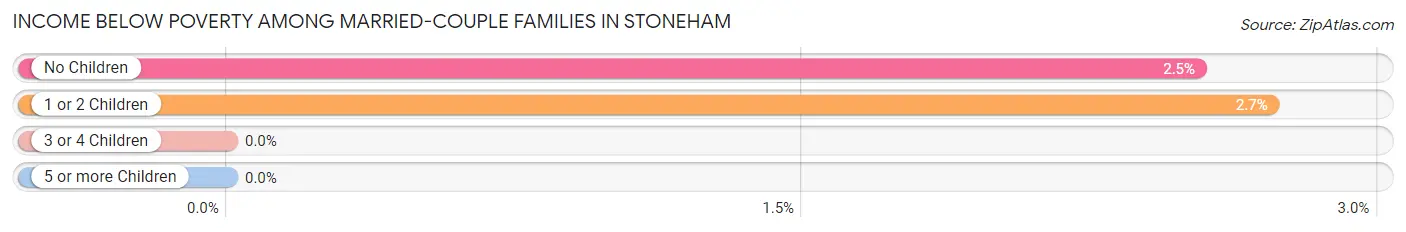
| Children | Above Poverty | Below Poverty |
| No Children | 2,847 (97.5%) | 74 (2.5%) |
| 1 or 2 Children | 1,645 (97.3%) | 46 (2.7%) |
| 3 or 4 Children | 334 (100.0%) | 0 (0.0%) |
| 5 or more Children | 0 (0.0%) | 0 (0.0%) |
| Total | 4,826 (97.6%) | 120 (2.4%) |
Income Below Poverty Among Single-Parent Households in Stoneham
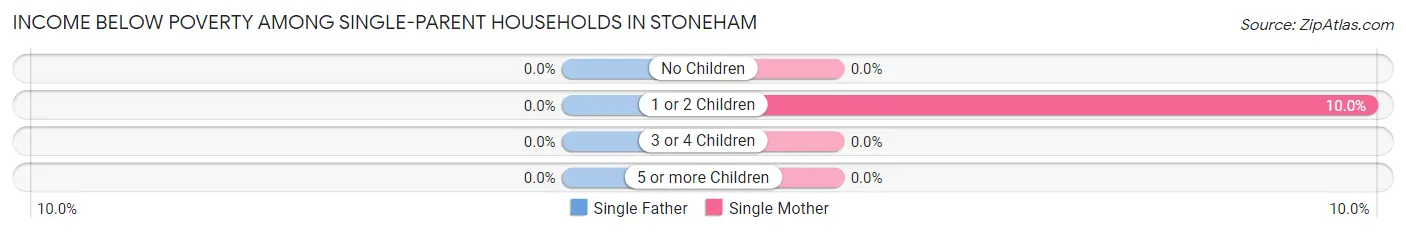
| Children | Single Father | Single Mother |
| No Children | 0 (0.0%) | 0 (0.0%) |
| 1 or 2 Children | 0 (0.0%) | 40 (10.0%) |
| 3 or 4 Children | 0 (0.0%) | 0 (0.0%) |
| 5 or more Children | 0 (0.0%) | 0 (0.0%) |
| Total | 0 (0.0%) | 40 (4.6%) |
Income Below Poverty Among Married-Couple vs Single-Parent Households in Stoneham
The poverty data for Stoneham shows that 120 of the married-couple family households (2.4%) and 40 of the single-parent households (4.1%) are living below the poverty level. Within the married-couple family households, those with 1 or 2 children have the highest poverty rate, with 46 households (2.7%) falling below the poverty line. Among the single-parent households, those with 1 or 2 children have the highest poverty rate, with 40 household (9.6%) living below poverty.
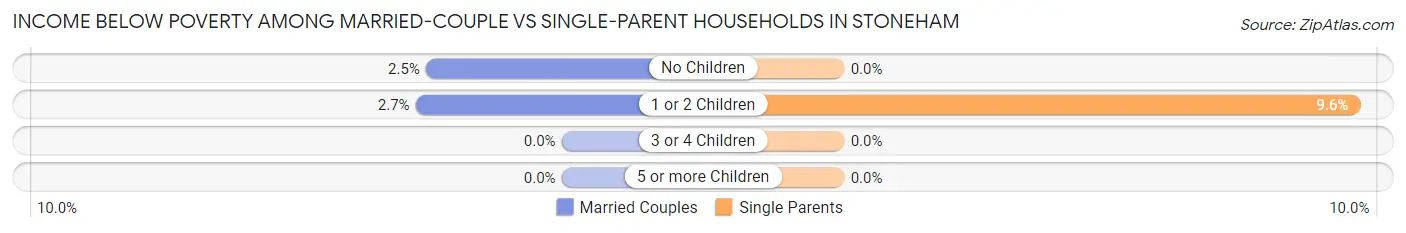
| Children | Married-Couple Families | Single-Parent Households |
| No Children | 74 (2.5%) | 0 (0.0%) |
| 1 or 2 Children | 46 (2.7%) | 40 (9.6%) |
| 3 or 4 Children | 0 (0.0%) | 0 (0.0%) |
| 5 or more Children | 0 (0.0%) | 0 (0.0%) |
| Total | 120 (2.4%) | 40 (4.1%) |
Race in Stoneham
The most populous races in Stoneham are White / Caucasian (19,224 | 83.6%), Asian (1,707 | 7.4%), and Two or more Races (1,267 | 5.5%).
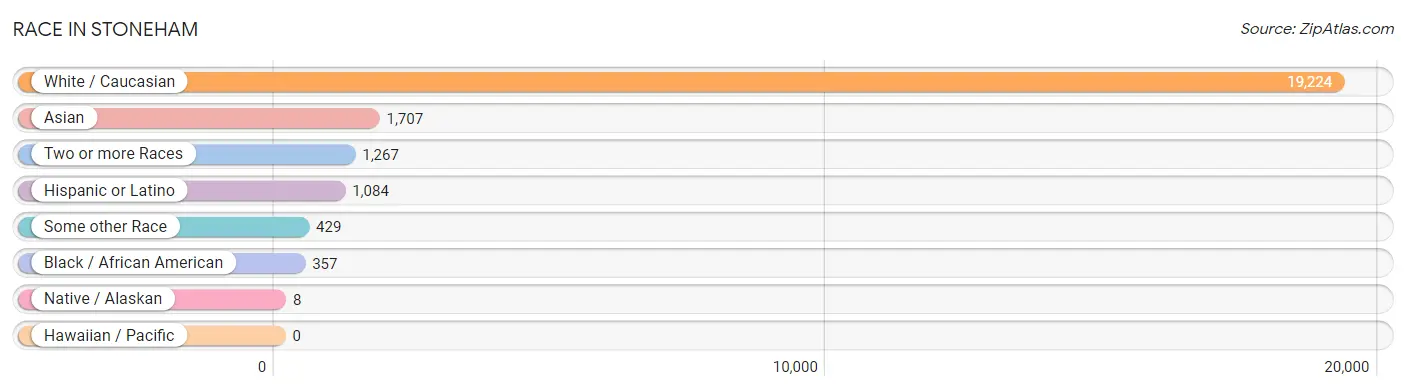
| Race | # Population | % Population |
| Asian | 1,707 | 7.4% |
| Black / African American | 357 | 1.5% |
| Hawaiian / Pacific | 0 | 0.0% |
| Hispanic or Latino | 1,084 | 4.7% |
| Native / Alaskan | 8 | 0.0% |
| White / Caucasian | 19,224 | 83.6% |
| Two or more Races | 1,267 | 5.5% |
| Some other Race | 429 | 1.9% |
| Total | 22,992 | 100.0% |
Ancestry in Stoneham
The most populous ancestries reported in Stoneham are Italian (6,331 | 27.5%), Irish (6,176 | 26.9%), English (1,996 | 8.7%), German (886 | 3.8%), and French (759 | 3.3%), together accounting for 70.2% of all Stoneham residents.
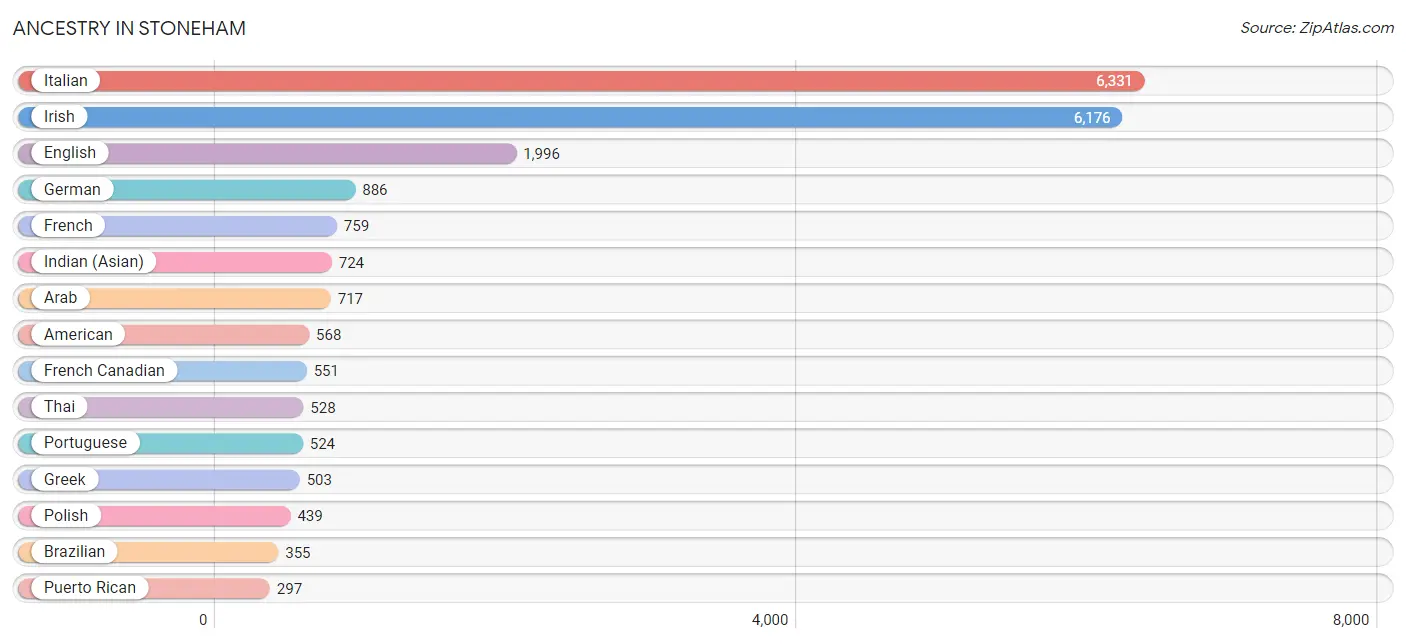
| Ancestry | # Population | % Population |
| Albanian | 31 | 0.1% |
| American | 568 | 2.5% |
| Arab | 717 | 3.1% |
| Armenian | 122 | 0.5% |
| Austrian | 24 | 0.1% |
| Belgian | 14 | 0.1% |
| Bhutanese | 33 | 0.1% |
| Brazilian | 355 | 1.5% |
| British | 18 | 0.1% |
| Bulgarian | 43 | 0.2% |
| Burmese | 195 | 0.9% |
| Canadian | 209 | 0.9% |
| Celtic | 65 | 0.3% |
| Central American | 129 | 0.6% |
| Chilean | 10 | 0.0% |
| Colombian | 104 | 0.4% |
| Costa Rican | 42 | 0.2% |
| Cuban | 10 | 0.0% |
| Czech | 57 | 0.3% |
| Danish | 17 | 0.1% |
| Delaware | 10 | 0.0% |
| Dominican | 30 | 0.1% |
| Dutch | 70 | 0.3% |
| Eastern European | 36 | 0.2% |
| English | 1,996 | 8.7% |
| Ethiopian | 35 | 0.2% |
| European | 259 | 1.1% |
| Filipino | 16 | 0.1% |
| Finnish | 28 | 0.1% |
| French | 759 | 3.3% |
| French Canadian | 551 | 2.4% |
| German | 886 | 3.8% |
| Greek | 503 | 2.2% |
| Guatemalan | 20 | 0.1% |
| Haitian | 46 | 0.2% |
| Honduran | 21 | 0.1% |
| Indian (Asian) | 724 | 3.2% |
| Iranian | 73 | 0.3% |
| Irish | 6,176 | 26.9% |
| Italian | 6,331 | 27.5% |
| Jamaican | 33 | 0.1% |
| Japanese | 20 | 0.1% |
| Jordanian | 237 | 1.0% |
| Kenyan | 26 | 0.1% |
| Korean | 230 | 1.0% |
| Lebanese | 153 | 0.7% |
| Lithuanian | 153 | 0.7% |
| Mexican | 163 | 0.7% |
| Navajo | 8 | 0.0% |
| Northern European | 27 | 0.1% |
| Norwegian | 175 | 0.8% |
| Pakistani | 68 | 0.3% |
| Palestinian | 286 | 1.2% |
| Polish | 439 | 1.9% |
| Portuguese | 524 | 2.3% |
| Puerto Rican | 297 | 1.3% |
| Russian | 137 | 0.6% |
| Salvadoran | 46 | 0.2% |
| Scandinavian | 82 | 0.4% |
| Scotch-Irish | 114 | 0.5% |
| Scottish | 296 | 1.3% |
| Sioux | 70 | 0.3% |
| Slovak | 21 | 0.1% |
| South American | 157 | 0.7% |
| Spaniard | 125 | 0.5% |
| Spanish | 14 | 0.1% |
| Sri Lankan | 243 | 1.1% |
| Subsaharan African | 61 | 0.3% |
| Swedish | 121 | 0.5% |
| Swiss | 43 | 0.2% |
| Syrian | 10 | 0.0% |
| Thai | 528 | 2.3% |
| Ukrainian | 209 | 0.9% |
| Venezuelan | 43 | 0.2% |
| Vietnamese | 1 | 0.0% |
| Welsh | 23 | 0.1% | View All 76 Rows |
Immigrants in Stoneham
The most numerous immigrant groups reported in Stoneham came from Asia (1,362 | 5.9%), Latin America (836 | 3.6%), South America (653 | 2.8%), Europe (651 | 2.8%), and Eastern Asia (584 | 2.5%), together accounting for 17.8% of all Stoneham residents.
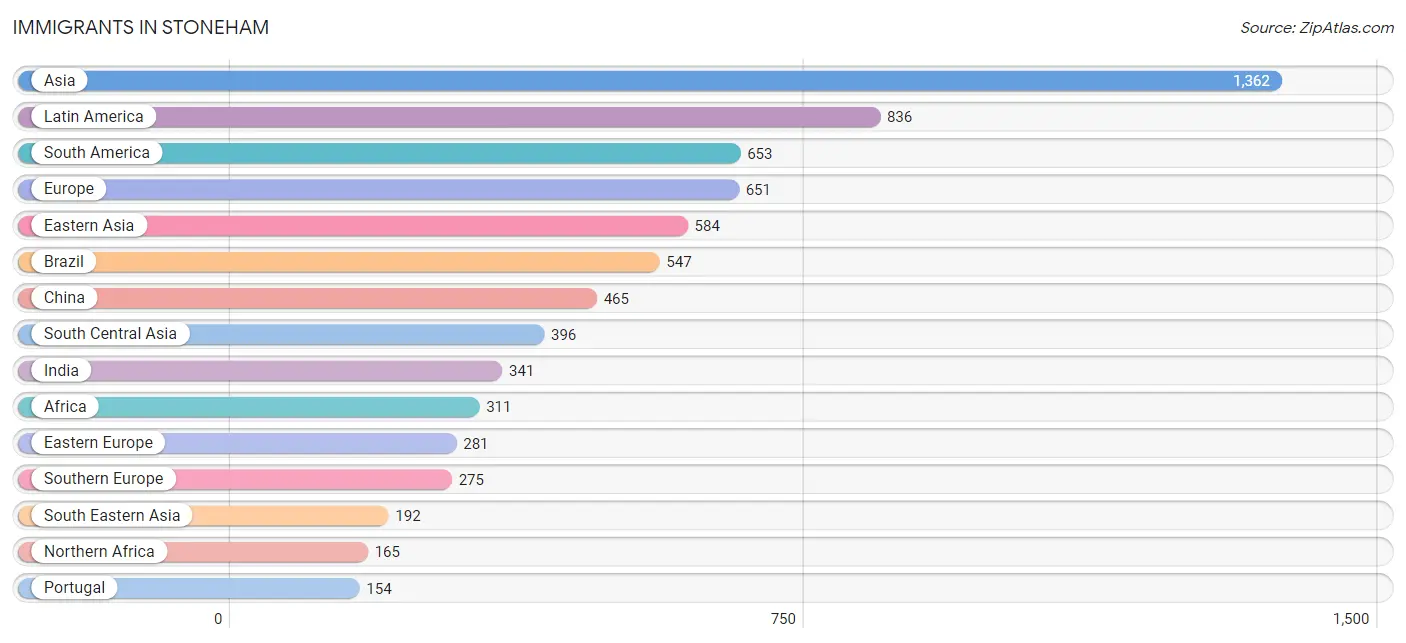
| Immigration Origin | # Population | % Population |
| Africa | 311 | 1.3% |
| Asia | 1,362 | 5.9% |
| Azores | 10 | 0.0% |
| Bangladesh | 1 | 0.0% |
| Belarus | 12 | 0.1% |
| Brazil | 547 | 2.4% |
| Bulgaria | 21 | 0.1% |
| Cambodia | 20 | 0.1% |
| Canada | 74 | 0.3% |
| Caribbean | 60 | 0.3% |
| Central America | 123 | 0.5% |
| China | 465 | 2.0% |
| Colombia | 90 | 0.4% |
| Costa Rica | 42 | 0.2% |
| Eastern Africa | 132 | 0.6% |
| Eastern Asia | 584 | 2.5% |
| Eastern Europe | 281 | 1.2% |
| El Salvador | 46 | 0.2% |
| Ethiopia | 90 | 0.4% |
| Europe | 651 | 2.8% |
| France | 8 | 0.0% |
| Germany | 19 | 0.1% |
| Greece | 22 | 0.1% |
| Guatemala | 20 | 0.1% |
| Haiti | 47 | 0.2% |
| Hong Kong | 129 | 0.6% |
| India | 341 | 1.5% |
| Iran | 36 | 0.2% |
| Ireland | 27 | 0.1% |
| Israel | 67 | 0.3% |
| Italy | 99 | 0.4% |
| Jamaica | 13 | 0.1% |
| Japan | 47 | 0.2% |
| Jordan | 18 | 0.1% |
| Kenya | 28 | 0.1% |
| Korea | 72 | 0.3% |
| Kuwait | 53 | 0.2% |
| Latin America | 836 | 3.6% |
| Lithuania | 10 | 0.0% |
| Mexico | 15 | 0.1% |
| Nepal | 18 | 0.1% |
| Northern Africa | 165 | 0.7% |
| Northern Europe | 52 | 0.2% |
| Philippines | 104 | 0.4% |
| Poland | 66 | 0.3% |
| Portugal | 154 | 0.7% |
| Russia | 36 | 0.2% |
| South America | 653 | 2.8% |
| South Central Asia | 396 | 1.7% |
| South Eastern Asia | 192 | 0.8% |
| Southern Europe | 275 | 1.2% |
| Switzerland | 16 | 0.1% |
| Taiwan | 16 | 0.1% |
| Thailand | 68 | 0.3% |
| Uganda | 14 | 0.1% |
| Ukraine | 136 | 0.6% |
| Western Africa | 14 | 0.1% |
| Western Asia | 138 | 0.6% |
| Western Europe | 43 | 0.2% | View All 59 Rows |
Sex and Age in Stoneham
Sex and Age in Stoneham
The most populous age groups in Stoneham are 35 to 39 Years (1,114 | 10.2%) for men and 40 to 44 Years (972 | 8.1%) for women.
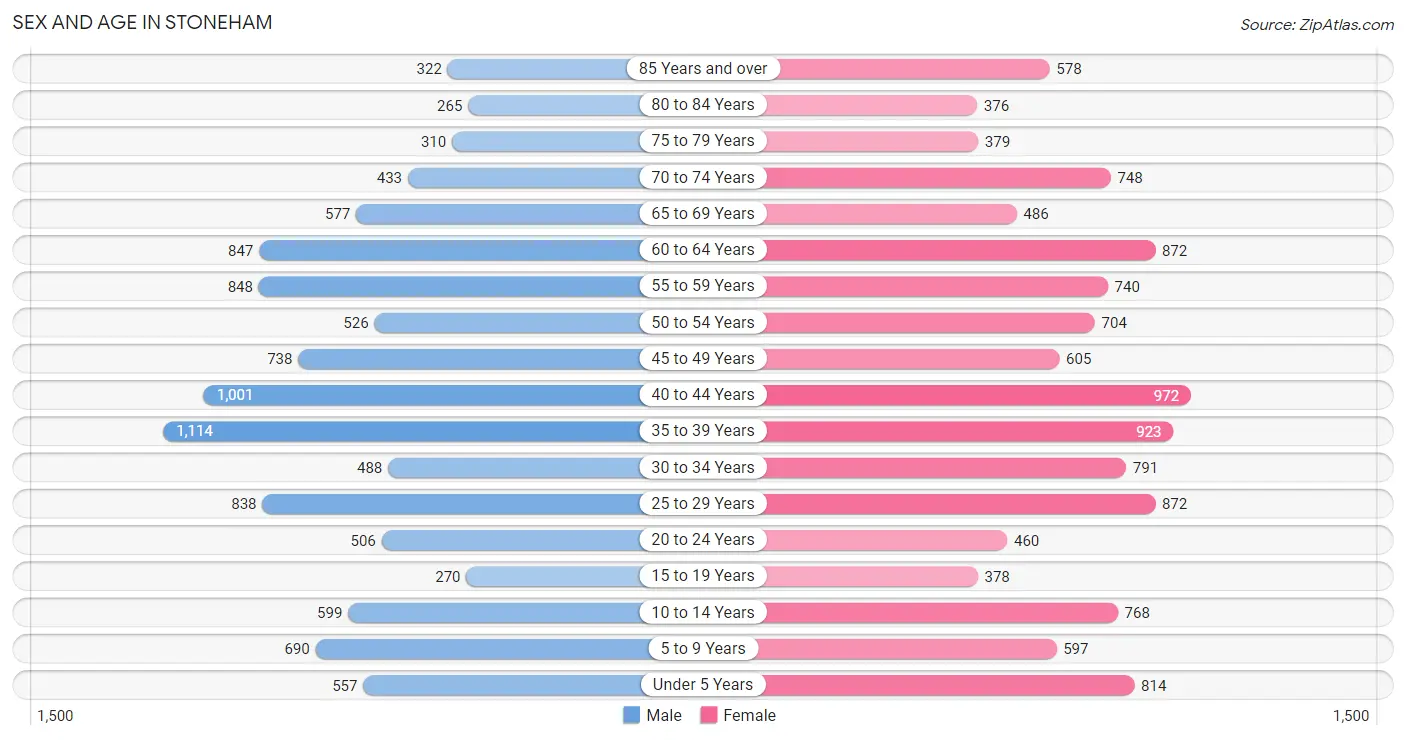
| Age Bracket | Male | Female |
| Under 5 Years | 557 (5.1%) | 814 (6.8%) |
| 5 to 9 Years | 690 (6.3%) | 597 (5.0%) |
| 10 to 14 Years | 599 (5.5%) | 768 (6.4%) |
| 15 to 19 Years | 270 (2.5%) | 378 (3.1%) |
| 20 to 24 Years | 506 (4.6%) | 460 (3.8%) |
| 25 to 29 Years | 838 (7.7%) | 872 (7.2%) |
| 30 to 34 Years | 488 (4.5%) | 791 (6.6%) |
| 35 to 39 Years | 1,114 (10.2%) | 923 (7.6%) |
| 40 to 44 Years | 1,001 (9.2%) | 972 (8.1%) |
| 45 to 49 Years | 738 (6.8%) | 605 (5.0%) |
| 50 to 54 Years | 526 (4.8%) | 704 (5.8%) |
| 55 to 59 Years | 848 (7.8%) | 740 (6.1%) |
| 60 to 64 Years | 847 (7.7%) | 872 (7.2%) |
| 65 to 69 Years | 577 (5.3%) | 486 (4.0%) |
| 70 to 74 Years | 433 (4.0%) | 748 (6.2%) |
| 75 to 79 Years | 310 (2.8%) | 379 (3.1%) |
| 80 to 84 Years | 265 (2.4%) | 376 (3.1%) |
| 85 Years and over | 322 (2.9%) | 578 (4.8%) |
| Total | 10,929 (100.0%) | 12,063 (100.0%) |
Families and Households in Stoneham
Median Family Size in Stoneham
The median family size in Stoneham is 3.01 persons per family, with single male/father families (108 | 1.8%) accounting for the largest median family size of 3.4 persons per family. On the other hand, single female/mother families (868 | 14.7%) represent the smallest median family size with 2.39 persons per family.
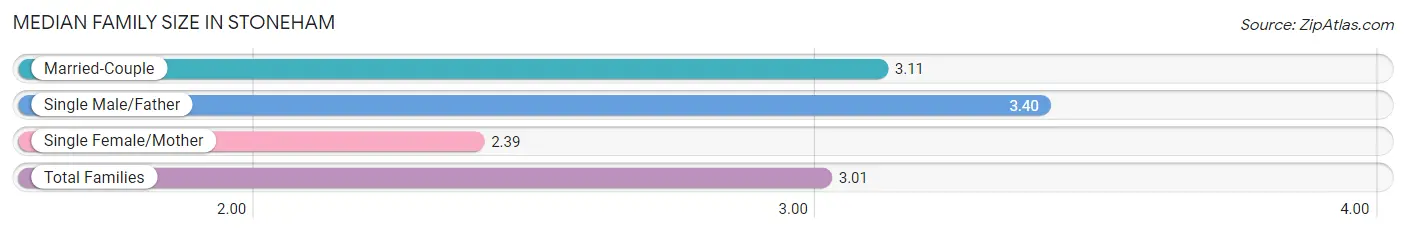
| Family Type | # Families | Family Size |
| Married-Couple | 4,946 (83.5%) | 3.11 |
| Single Male/Father | 108 (1.8%) | 3.40 |
| Single Female/Mother | 868 (14.7%) | 2.39 |
| Total Families | 5,922 (100.0%) | 3.01 |
Median Household Size in Stoneham
The median household size in Stoneham is 2.37 persons per household, with single male/father households (108 | 1.1%) accounting for the largest median household size of 3.61 persons per household. non-family households (3,732 | 38.7%) represent the smallest median household size with 1.28 persons per household.
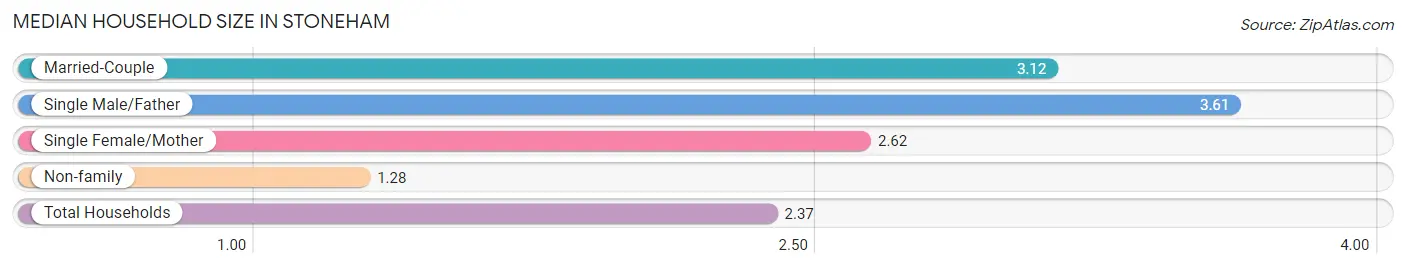
| Household Type | # Households | Household Size |
| Married-Couple | 4,946 (51.2%) | 3.12 |
| Single Male/Father | 108 (1.1%) | 3.61 |
| Single Female/Mother | 868 (9.0%) | 2.62 |
| Non-family | 3,732 (38.7%) | 1.28 |
| Total Households | 9,654 (100.0%) | 2.37 |
Household Size by Marriage Status in Stoneham
Out of a total of 9,654 households in Stoneham, 5,922 (61.3%) are family households, while 3,732 (38.7%) are nonfamily households. The most numerous type of family households are 2-person households, comprising 2,747, and the most common type of nonfamily households are 1-person households, comprising 2,966.
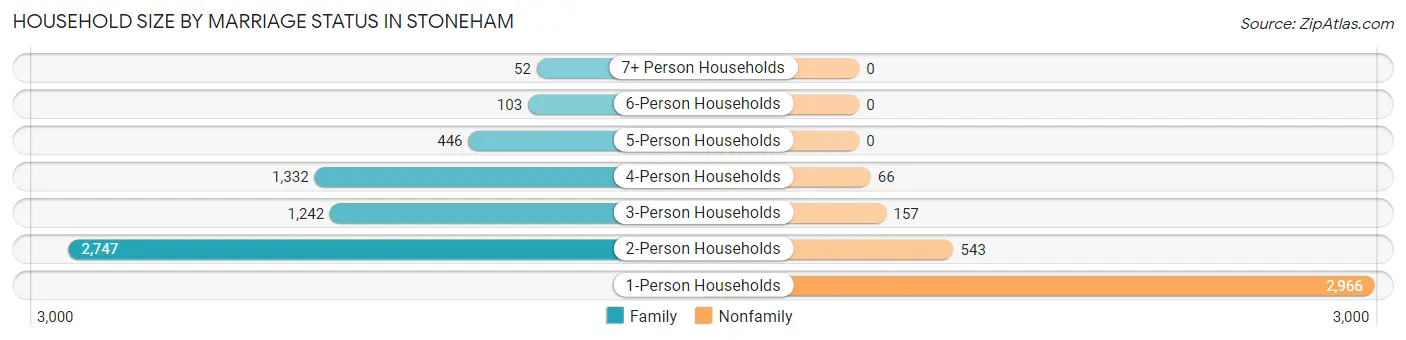
| Household Size | Family Households | Nonfamily Households |
| 1-Person Households | - | 2,966 (30.7%) |
| 2-Person Households | 2,747 (28.4%) | 543 (5.6%) |
| 3-Person Households | 1,242 (12.9%) | 157 (1.6%) |
| 4-Person Households | 1,332 (13.8%) | 66 (0.7%) |
| 5-Person Households | 446 (4.6%) | 0 (0.0%) |
| 6-Person Households | 103 (1.1%) | 0 (0.0%) |
| 7+ Person Households | 52 (0.5%) | 0 (0.0%) |
| Total | 5,922 (61.3%) | 3,732 (38.7%) |
Female Fertility in Stoneham
Fertility by Age in Stoneham
Average fertility rate in Stoneham is 80.0 births per 1,000 women. Women in the age bracket of 35 to 50 years have the highest fertility rate with 126.0 births per 1,000 women. Women in the age bracket of 35 to 50 years acount for 81.2% of all women with births.
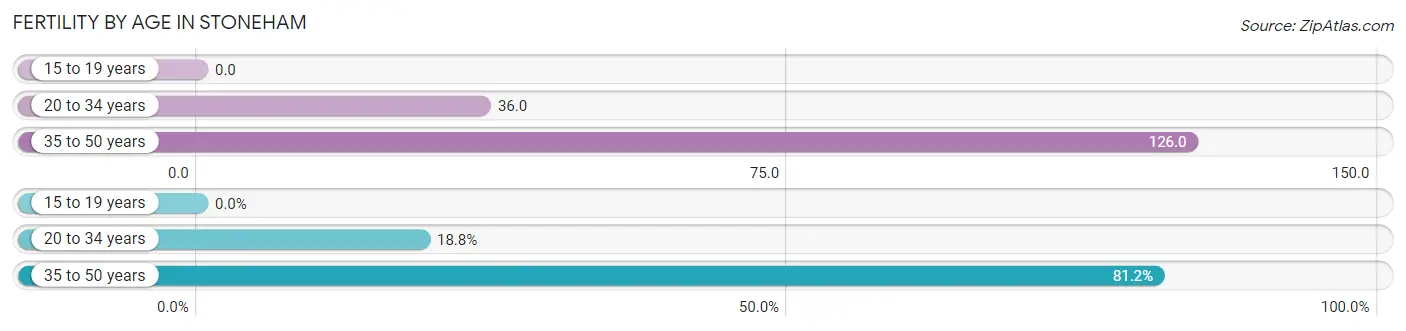
| Age Bracket | Women with Births | Births / 1,000 Women |
| 15 to 19 years | 0 (0.0%) | 0.0 |
| 20 to 34 years | 77 (18.8%) | 36.0 |
| 35 to 50 years | 332 (81.2%) | 126.0 |
| Total | 409 (100.0%) | 80.0 |
Fertility by Age by Marriage Status in Stoneham
96.8% of women with births (409) in Stoneham are married. The highest percentage of unmarried women with births falls into 20 to 34 years age bracket with 16.9% of them unmarried at the time of birth, while the lowest percentage of unmarried women with births belong to 35 to 50 years age bracket with 0.0% of them unmarried.
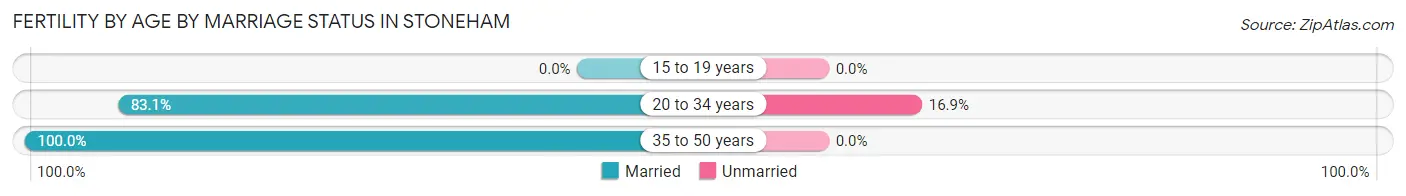
| Age Bracket | Married | Unmarried |
| 15 to 19 years | 0 (0.0%) | 0 (0.0%) |
| 20 to 34 years | 64 (83.1%) | 13 (16.9%) |
| 35 to 50 years | 332 (100.0%) | 0 (0.0%) |
| Total | 396 (96.8%) | 13 (3.2%) |
Fertility by Education in Stoneham
Average fertility rate in Stoneham is 80.0 births per 1,000 women. Women with the education attainment of graduate degree have the highest fertility rate of 154.0 births per 1,000 women, while women with the education attainment of college or associate's degree have the lowest fertility at 40.0 births per 1,000 women. Women with the education attainment of graduate degree represent 42.8% of all women with births.
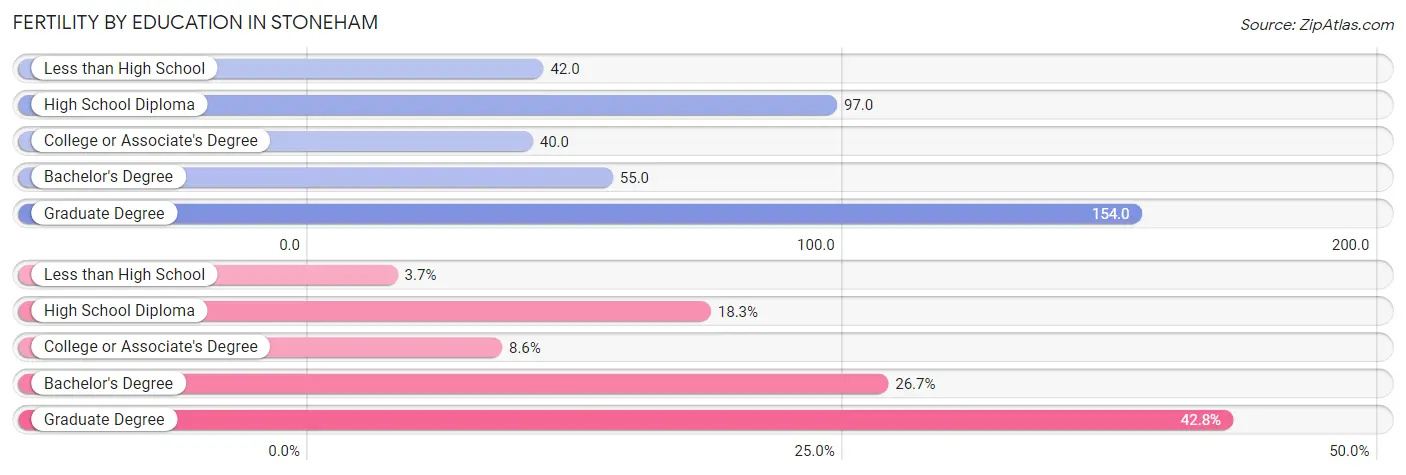
| Educational Attainment | Women with Births | Births / 1,000 Women |
| Less than High School | 15 (3.7%) | 42.0 |
| High School Diploma | 75 (18.3%) | 97.0 |
| College or Associate's Degree | 35 (8.6%) | 40.0 |
| Bachelor's Degree | 109 (26.7%) | 55.0 |
| Graduate Degree | 175 (42.8%) | 154.0 |
| Total | 409 (100.0%) | 80.0 |
Fertility by Education by Marriage Status in Stoneham
3.2% of women with births in Stoneham are unmarried. Women with the educational attainment of less than high school are most likely to be married with 100.0% of them married at childbirth, while women with the educational attainment of college or associate's degree are least likely to be married with 37.1% of them unmarried at childbirth.
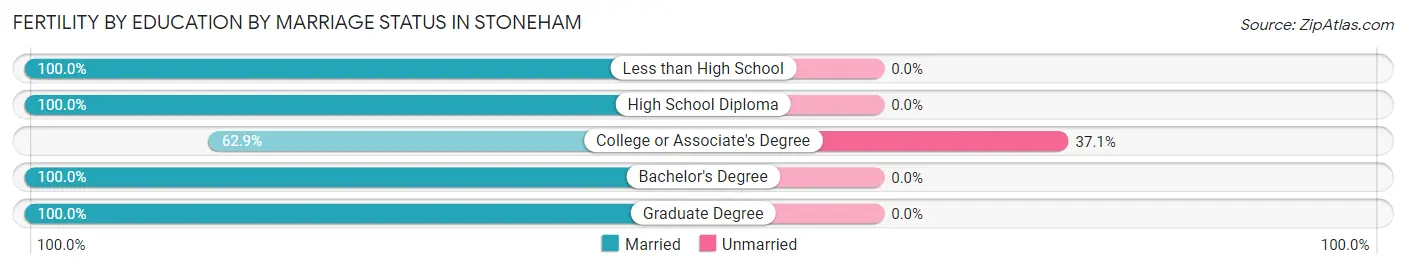
| Educational Attainment | Married | Unmarried |
| Less than High School | 15 (100.0%) | 0 (0.0%) |
| High School Diploma | 75 (100.0%) | 0 (0.0%) |
| College or Associate's Degree | 22 (62.9%) | 13 (37.1%) |
| Bachelor's Degree | 109 (100.0%) | 0 (0.0%) |
| Graduate Degree | 175 (100.0%) | 0 (0.0%) |
| Total | 396 (96.8%) | 13 (3.2%) |
Employment Characteristics in Stoneham
Employment by Class of Employer in Stoneham
Among the 12,843 employed individuals in Stoneham, private company employees (8,365 | 65.1%), not-for-profit organizations (1,867 | 14.5%), and local government employees (1,002 | 7.8%) make up the most common classes of employment.
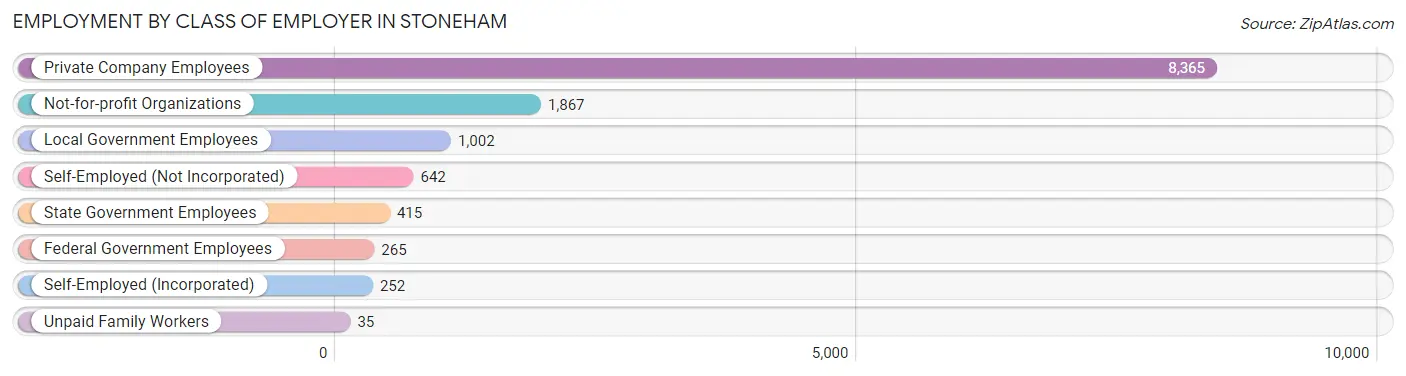
| Employer Class | # Employees | % Employees |
| Private Company Employees | 8,365 | 65.1% |
| Self-Employed (Incorporated) | 252 | 2.0% |
| Self-Employed (Not Incorporated) | 642 | 5.0% |
| Not-for-profit Organizations | 1,867 | 14.5% |
| Local Government Employees | 1,002 | 7.8% |
| State Government Employees | 415 | 3.2% |
| Federal Government Employees | 265 | 2.1% |
| Unpaid Family Workers | 35 | 0.3% |
| Total | 12,843 | 100.0% |
Employment Status by Age in Stoneham
According to the labor force statistics for Stoneham, out of the total population over 16 years of age (18,851), 71.8% or 13,535 individuals are in the labor force, with 3.3% or 447 of them unemployed. The age group with the highest labor force participation rate is 20 to 24 years, with 98.4% or 951 individuals in the labor force. Within the labor force, the 16 to 19 years age range has the highest percentage of unemployed individuals, with 14.0% or 40 of them being unemployed.
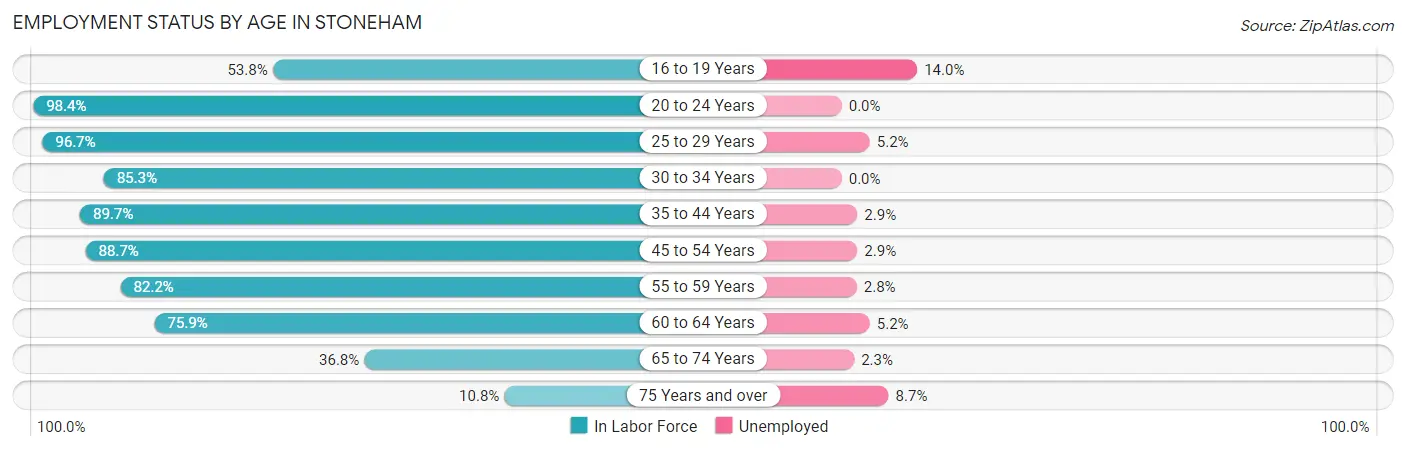
| Age Bracket | In Labor Force | Unemployed |
| 16 to 19 Years | 286 (53.8%) | 40 (14.0%) |
| 20 to 24 Years | 951 (98.4%) | 0 (0.0%) |
| 25 to 29 Years | 1,654 (96.7%) | 86 (5.2%) |
| 30 to 34 Years | 1,091 (85.3%) | 0 (0.0%) |
| 35 to 44 Years | 3,597 (89.7%) | 104 (2.9%) |
| 45 to 54 Years | 2,282 (88.7%) | 66 (2.9%) |
| 55 to 59 Years | 1,305 (82.2%) | 37 (2.8%) |
| 60 to 64 Years | 1,305 (75.9%) | 68 (5.2%) |
| 65 to 74 Years | 826 (36.8%) | 19 (2.3%) |
| 75 Years and over | 241 (10.8%) | 21 (8.7%) |
| Total | 13,535 (71.8%) | 447 (3.3%) |
Employment Status by Educational Attainment in Stoneham
According to labor force statistics for Stoneham, 87.2% of individuals (11,230) out of the total population between 25 and 64 years of age (12,879) are in the labor force, with 3.2% or 359 of them being unemployed. The group with the highest labor force participation rate are those with the educational attainment of bachelor's degree or higher, with 91.4% or 6,779 individuals in the labor force. Within the labor force, individuals with less than high school education have the highest percentage of unemployment, with 7.8% or 27 of them being unemployed.
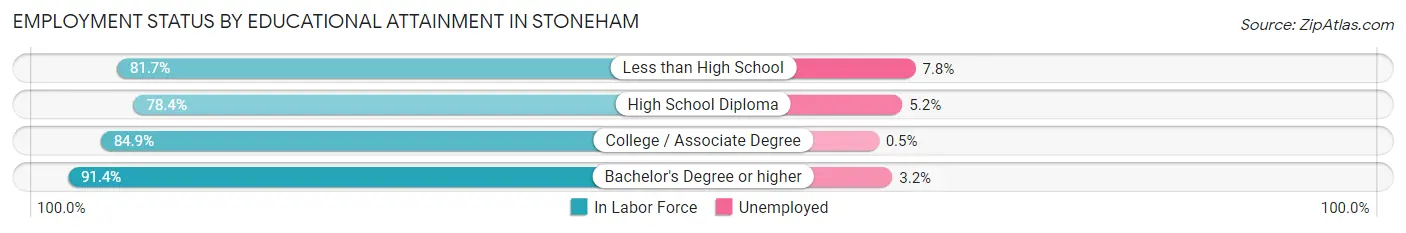
| Educational Attainment | In Labor Force | Unemployed |
| Less than High School | 344 (81.7%) | 33 (7.8%) |
| High School Diploma | 1,997 (78.4%) | 132 (5.2%) |
| College / Associate Degree | 2,117 (84.9%) | 12 (0.5%) |
| Bachelor's Degree or higher | 6,779 (91.4%) | 237 (3.2%) |
| Total | 11,230 (87.2%) | 412 (3.2%) |
Employment Occupations by Sex in Stoneham
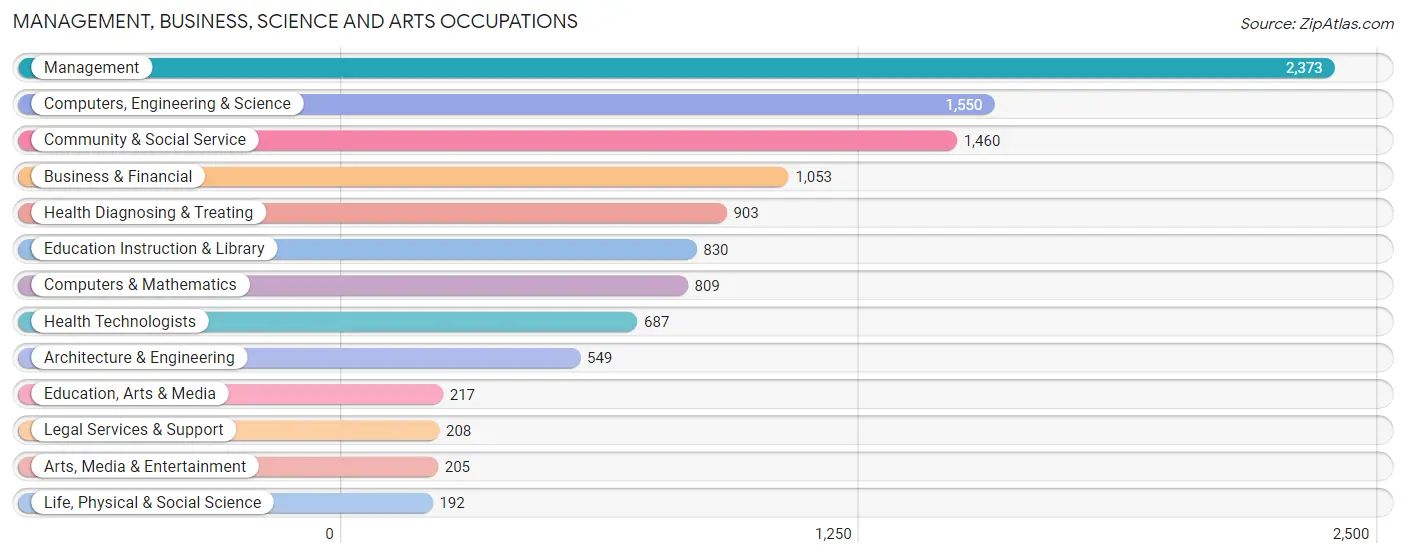
Management, Business, Science and Arts Occupations
The most common Management, Business, Science and Arts occupations in Stoneham are Management (2,373 | 18.1%), Computers, Engineering & Science (1,550 | 11.8%), Community & Social Service (1,460 | 11.2%), Business & Financial (1,053 | 8.0%), and Health Diagnosing & Treating (903 | 6.9%).
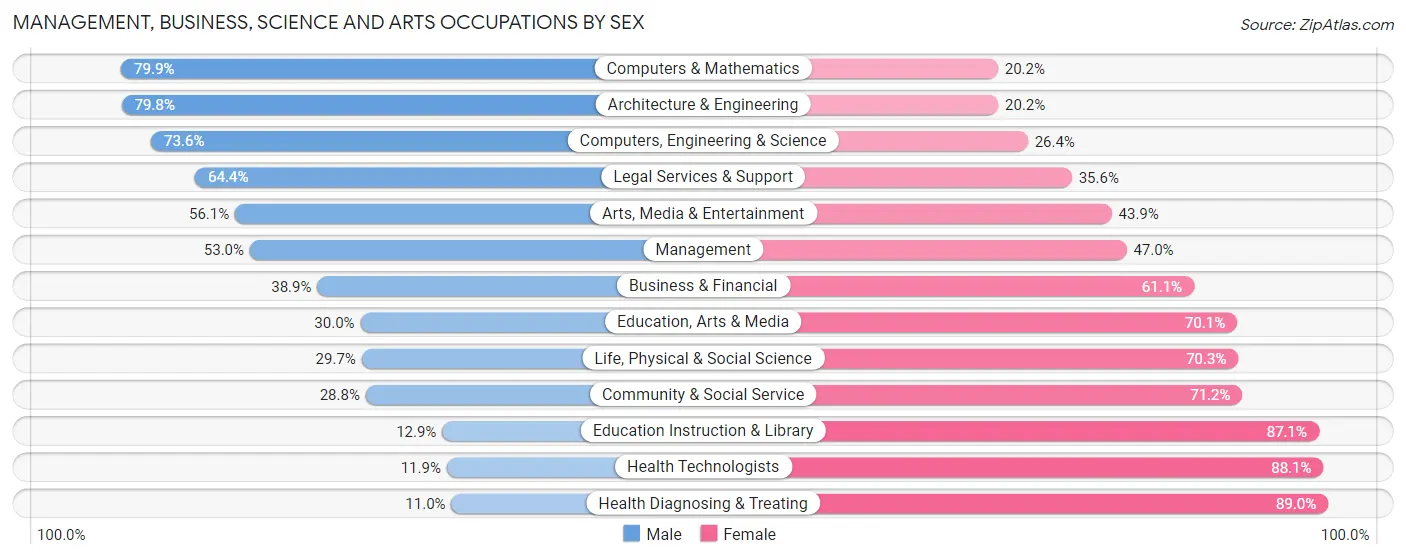
Management, Business, Science and Arts Occupations by Sex
Within the Management, Business, Science and Arts occupations in Stoneham, the most male-oriented occupations are Computers & Mathematics (79.8%), Architecture & Engineering (79.8%), and Computers, Engineering & Science (73.6%), while the most female-oriented occupations are Health Diagnosing & Treating (89.0%), Health Technologists (88.1%), and Education Instruction & Library (87.1%).
| Occupation | Male | Female |
| Management | 1,258 (53.0%) | 1,115 (47.0%) |
| Business & Financial | 410 (38.9%) | 643 (61.1%) |
| Computers, Engineering & Science | 1,141 (73.6%) | 409 (26.4%) |
| Computers & Mathematics | 646 (79.8%) | 163 (20.2%) |
| Architecture & Engineering | 438 (79.8%) | 111 (20.2%) |
| Life, Physical & Social Science | 57 (29.7%) | 135 (70.3%) |
| Community & Social Service | 421 (28.8%) | 1,039 (71.2%) |
| Education, Arts & Media | 65 (29.9%) | 152 (70.1%) |
| Legal Services & Support | 134 (64.4%) | 74 (35.6%) |
| Education Instruction & Library | 107 (12.9%) | 723 (87.1%) |
| Arts, Media & Entertainment | 115 (56.1%) | 90 (43.9%) |
| Health Diagnosing & Treating | 99 (11.0%) | 804 (89.0%) |
| Health Technologists | 82 (11.9%) | 605 (88.1%) |
| Total (Category) | 3,329 (45.4%) | 4,010 (54.6%) |
| Total (Overall) | 6,583 (50.3%) | 6,513 (49.7%) |
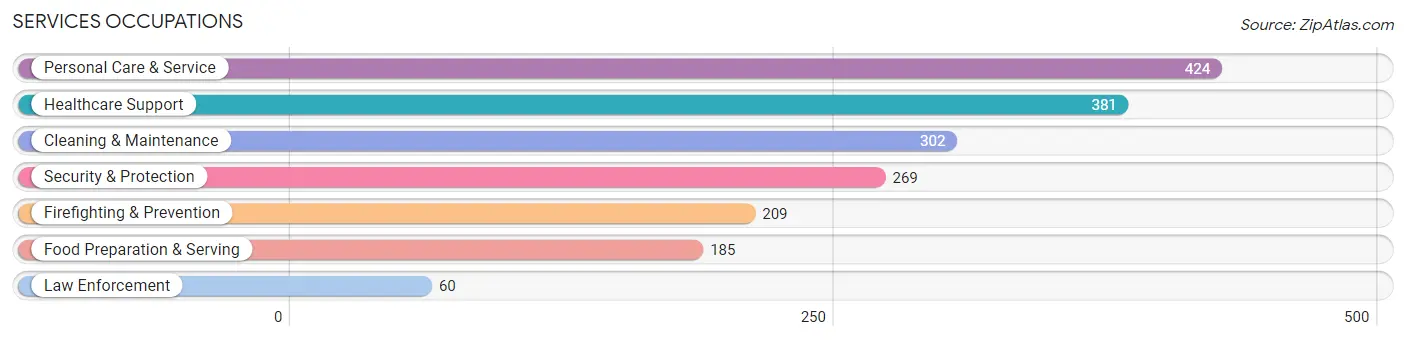
Services Occupations
The most common Services occupations in Stoneham are Personal Care & Service (424 | 3.2%), Healthcare Support (381 | 2.9%), Cleaning & Maintenance (302 | 2.3%), Security & Protection (269 | 2.1%), and Firefighting & Prevention (209 | 1.6%).
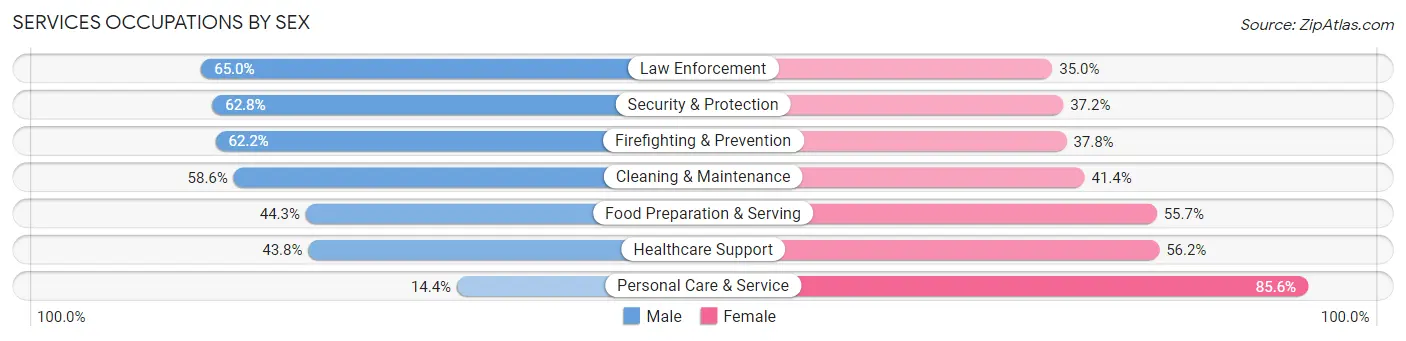
Services Occupations by Sex
Within the Services occupations in Stoneham, the most male-oriented occupations are Law Enforcement (65.0%), Security & Protection (62.8%), and Firefighting & Prevention (62.2%), while the most female-oriented occupations are Personal Care & Service (85.6%), Healthcare Support (56.2%), and Food Preparation & Serving (55.7%).
| Occupation | Male | Female |
| Healthcare Support | 167 (43.8%) | 214 (56.2%) |
| Security & Protection | 169 (62.8%) | 100 (37.2%) |
| Firefighting & Prevention | 130 (62.2%) | 79 (37.8%) |
| Law Enforcement | 39 (65.0%) | 21 (35.0%) |
| Food Preparation & Serving | 82 (44.3%) | 103 (55.7%) |
| Cleaning & Maintenance | 177 (58.6%) | 125 (41.4%) |
| Personal Care & Service | 61 (14.4%) | 363 (85.6%) |
| Total (Category) | 656 (42.0%) | 905 (58.0%) |
| Total (Overall) | 6,583 (50.3%) | 6,513 (49.7%) |
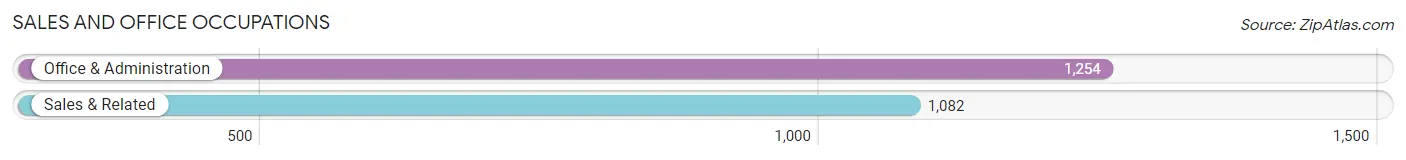
Sales and Office Occupations
The most common Sales and Office occupations in Stoneham are Office & Administration (1,254 | 9.6%), and Sales & Related (1,082 | 8.3%).
Sales and Office Occupations by Sex
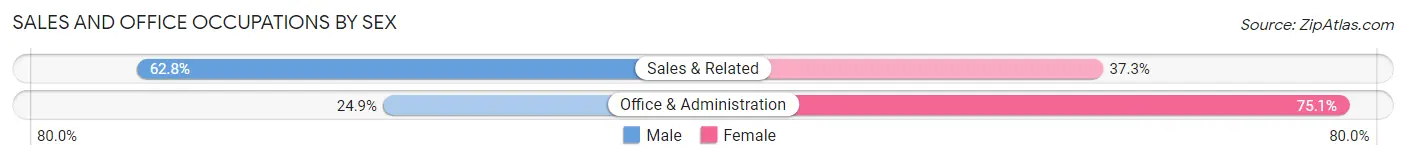
| Occupation | Male | Female |
| Sales & Related | 679 (62.7%) | 403 (37.2%) |
| Office & Administration | 312 (24.9%) | 942 (75.1%) |
| Total (Category) | 991 (42.4%) | 1,345 (57.6%) |
| Total (Overall) | 6,583 (50.3%) | 6,513 (49.7%) |
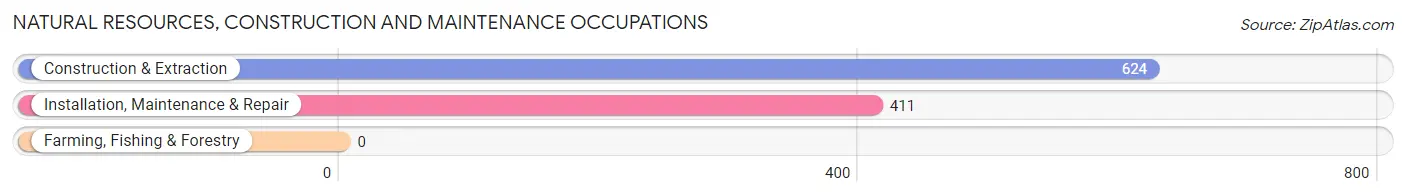
Natural Resources, Construction and Maintenance Occupations
The most common Natural Resources, Construction and Maintenance occupations in Stoneham are Construction & Extraction (624 | 4.8%), and Installation, Maintenance & Repair (411 | 3.1%).
Natural Resources, Construction and Maintenance Occupations by Sex
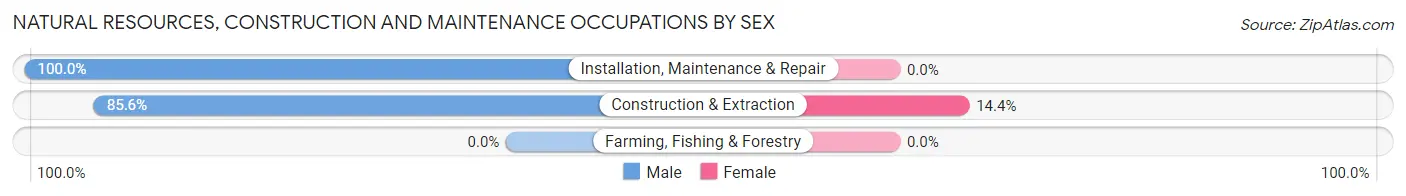
| Occupation | Male | Female |
| Farming, Fishing & Forestry | 0 (0.0%) | 0 (0.0%) |
| Construction & Extraction | 534 (85.6%) | 90 (14.4%) |
| Installation, Maintenance & Repair | 411 (100.0%) | 0 (0.0%) |
| Total (Category) | 945 (91.3%) | 90 (8.7%) |
| Total (Overall) | 6,583 (50.3%) | 6,513 (49.7%) |
Production, Transportation and Moving Occupations
The most common Production, Transportation and Moving occupations in Stoneham are Transportation (400 | 3.0%), Production (303 | 2.3%), and Material Moving (122 | 0.9%).
Production, Transportation and Moving Occupations by Sex
| Occupation | Male | Female |
| Production | 195 (64.4%) | 108 (35.6%) |
| Transportation | 374 (93.5%) | 26 (6.5%) |
| Material Moving | 93 (76.2%) | 29 (23.8%) |
| Total (Category) | 662 (80.2%) | 163 (19.8%) |
| Total (Overall) | 6,583 (50.3%) | 6,513 (49.7%) |
Employment Industries by Sex in Stoneham
Employment Industries in Stoneham
The major employment industries in Stoneham include Health Care & Social Assistance (2,004 | 15.3%), Professional & Scientific (1,601 | 12.2%), Educational Services (1,537 | 11.7%), Retail Trade (1,145 | 8.7%), and Manufacturing (1,020 | 7.8%).
Employment Industries by Sex in Stoneham
The Stoneham industries that see more men than women are Utilities (100.0%), Arts, Entertainment & Recreation (87.9%), and Wholesale Trade (86.2%), whereas the industries that tend to have a higher number of women are Health Care & Social Assistance (76.6%), Educational Services (68.5%), and Accommodation & Food Services (68.2%).
| Industry | Male | Female |
| Agriculture, Fishing & Hunting | 0 (0.0%) | 0 (0.0%) |
| Mining, Quarrying, & Extraction | 0 (0.0%) | 0 (0.0%) |
| Construction | 692 (74.5%) | 237 (25.5%) |
| Manufacturing | 639 (62.6%) | 381 (37.3%) |
| Wholesale Trade | 398 (86.2%) | 64 (13.9%) |
| Retail Trade | 747 (65.2%) | 398 (34.8%) |
| Transportation & Warehousing | 340 (82.3%) | 73 (17.7%) |
| Utilities | 105 (100.0%) | 0 (0.0%) |
| Information | 268 (69.3%) | 119 (30.7%) |
| Finance & Insurance | 408 (45.6%) | 486 (54.4%) |
| Real Estate, Rental & Leasing | 199 (71.6%) | 79 (28.4%) |
| Professional & Scientific | 850 (53.1%) | 751 (46.9%) |
| Enterprise Management | 0 (0.0%) | 0 (0.0%) |
| Administrative & Support | 268 (53.9%) | 229 (46.1%) |
| Educational Services | 484 (31.5%) | 1,053 (68.5%) |
| Health Care & Social Assistance | 468 (23.4%) | 1,536 (76.6%) |
| Arts, Entertainment & Recreation | 102 (87.9%) | 14 (12.1%) |
| Accommodation & Food Services | 152 (31.8%) | 326 (68.2%) |
| Public Administration | 200 (40.9%) | 289 (59.1%) |
| Total | 6,583 (50.3%) | 6,513 (49.7%) |
Education in Stoneham
School Enrollment in Stoneham
The most common levels of schooling among the 4,756 students in Stoneham are middle school (1,130 | 23.8%), elementary school (972 | 20.4%), and college / undergraduate (720 | 15.1%).
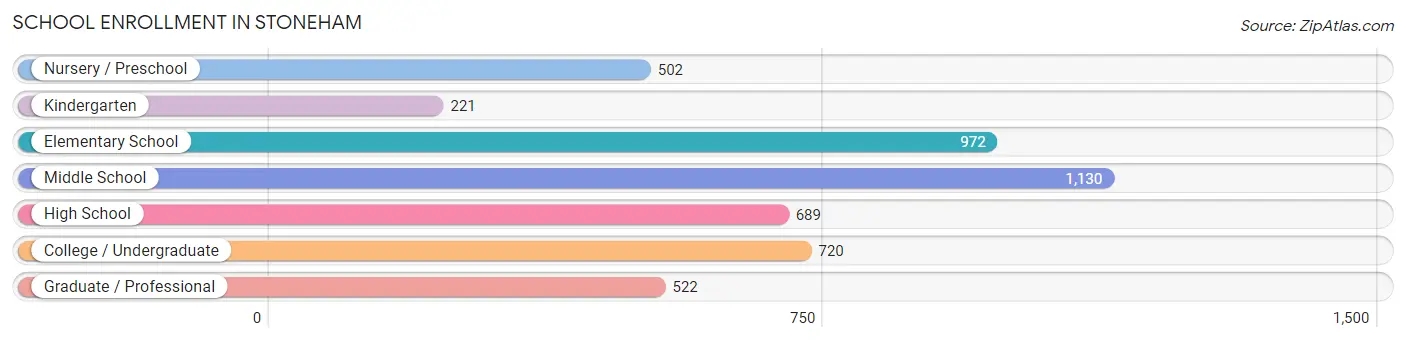
| School Level | # Students | % Students |
| Nursery / Preschool | 502 | 10.6% |
| Kindergarten | 221 | 4.6% |
| Elementary School | 972 | 20.4% |
| Middle School | 1,130 | 23.8% |
| High School | 689 | 14.5% |
| College / Undergraduate | 720 | 15.1% |
| Graduate / Professional | 522 | 11.0% |
| Total | 4,756 | 100.0% |
School Enrollment by Age by Funding Source in Stoneham
Out of a total of 4,756 students who are enrolled in schools in Stoneham, 1,289 (27.1%) attend a private institution, while the remaining 3,467 (72.9%) are enrolled in public schools. The age group of 25 to 34 year olds has the highest likelihood of being enrolled in private schools, with 263 (67.8% in the age bracket) enrolled. Conversely, the age group of 10 to 14 year olds has the lowest likelihood of being enrolled in a private school, with 1,287 (95.8% in the age bracket) attending a public institution.
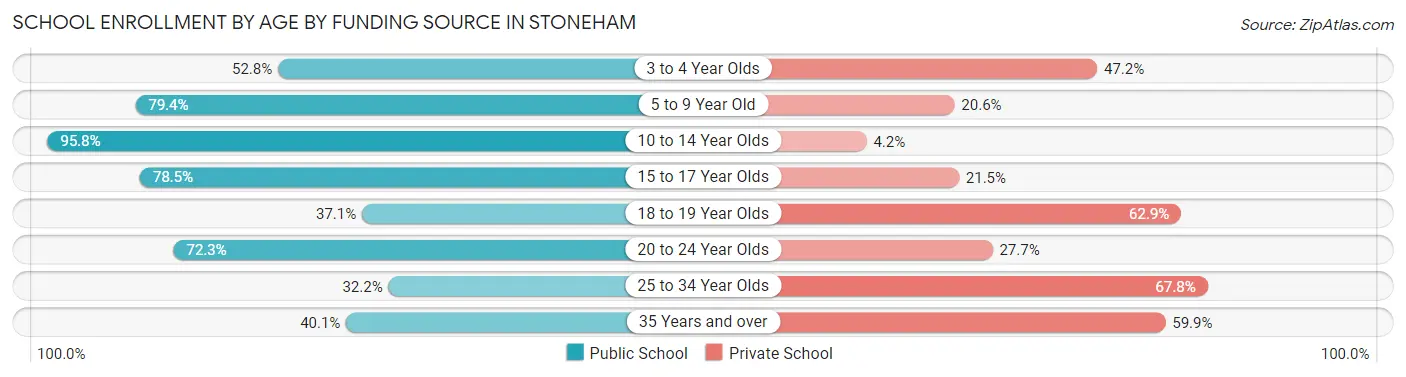
| Age Bracket | Public School | Private School |
| 3 to 4 Year Olds | 198 (52.8%) | 177 (47.2%) |
| 5 to 9 Year Old | 977 (79.4%) | 254 (20.6%) |
| 10 to 14 Year Olds | 1,287 (95.8%) | 57 (4.2%) |
| 15 to 17 Year Olds | 344 (78.5%) | 94 (21.5%) |
| 18 to 19 Year Olds | 52 (37.1%) | 88 (62.9%) |
| 20 to 24 Year Olds | 326 (72.3%) | 125 (27.7%) |
| 25 to 34 Year Olds | 125 (32.2%) | 263 (67.8%) |
| 35 Years and over | 156 (40.1%) | 233 (59.9%) |
| Total | 3,467 (72.9%) | 1,289 (27.1%) |
Educational Attainment by Field of Study in Stoneham
Business (1,919 | 20.0%), social sciences (1,260 | 13.2%), engineering (978 | 10.2%), science & technology (895 | 9.3%), and education (795 | 8.3%) are the most common fields of study among 9,582 individuals in Stoneham who have obtained a bachelor's degree or higher.
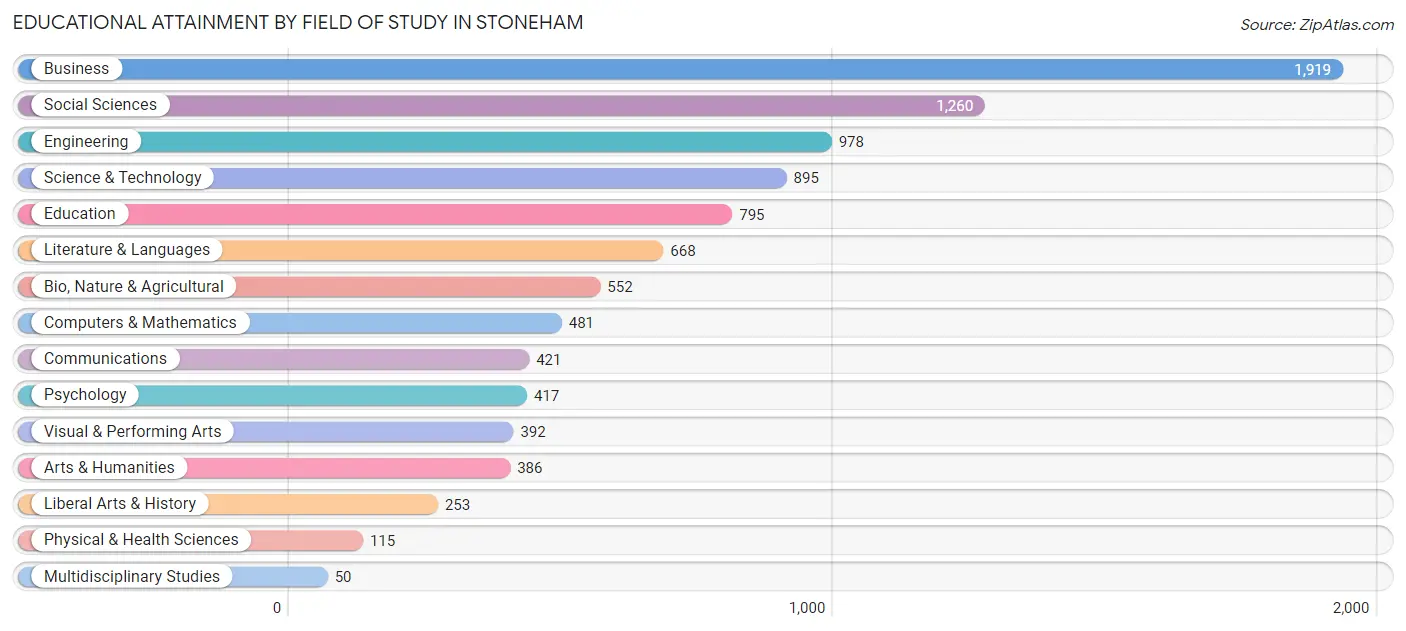
| Field of Study | # Graduates | % Graduates |
| Computers & Mathematics | 481 | 5.0% |
| Bio, Nature & Agricultural | 552 | 5.8% |
| Physical & Health Sciences | 115 | 1.2% |
| Psychology | 417 | 4.3% |
| Social Sciences | 1,260 | 13.2% |
| Engineering | 978 | 10.2% |
| Multidisciplinary Studies | 50 | 0.5% |
| Science & Technology | 895 | 9.3% |
| Business | 1,919 | 20.0% |
| Education | 795 | 8.3% |
| Literature & Languages | 668 | 7.0% |
| Liberal Arts & History | 253 | 2.6% |
| Visual & Performing Arts | 392 | 4.1% |
| Communications | 421 | 4.4% |
| Arts & Humanities | 386 | 4.0% |
| Total | 9,582 | 100.0% |
Transportation & Commute in Stoneham
Vehicle Availability by Sex in Stoneham
The most prevalent vehicle ownership categories in Stoneham are males with 2 vehicles (3,367, accounting for 52.3%) and females with 2 vehicles (2,768, making up 52.6%).
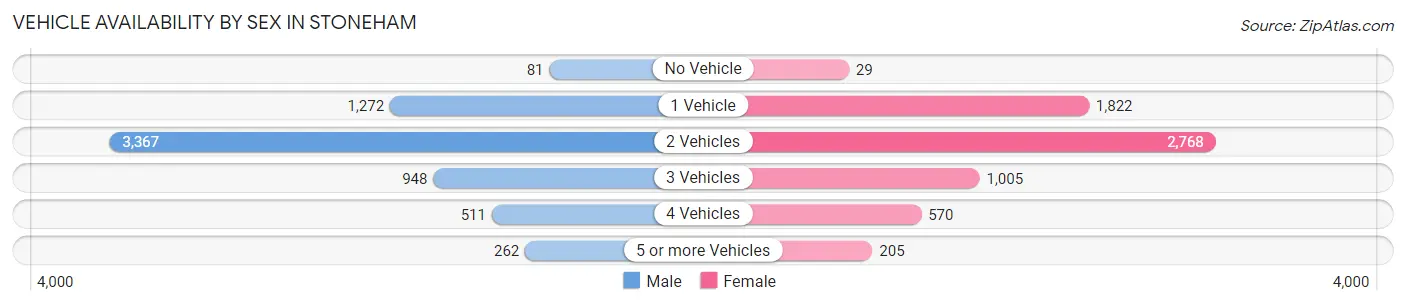
| Vehicles Available | Male | Female |
| No Vehicle | 81 (1.3%) | 29 (0.4%) |
| 1 Vehicle | 1,272 (19.8%) | 1,822 (28.5%) |
| 2 Vehicles | 3,367 (52.3%) | 2,768 (43.3%) |
| 3 Vehicles | 948 (14.7%) | 1,005 (15.7%) |
| 4 Vehicles | 511 (7.9%) | 570 (8.9%) |
| 5 or more Vehicles | 262 (4.1%) | 205 (3.2%) |
| Total | 6,441 (100.0%) | 6,399 (100.0%) |
Commute Time in Stoneham
The most frequently occuring commute durations in Stoneham are 30 to 34 minutes (1,733 commuters, 16.1%), 60 to 89 minutes (1,574 commuters, 14.6%), and 10 to 14 minutes (1,386 commuters, 12.8%).
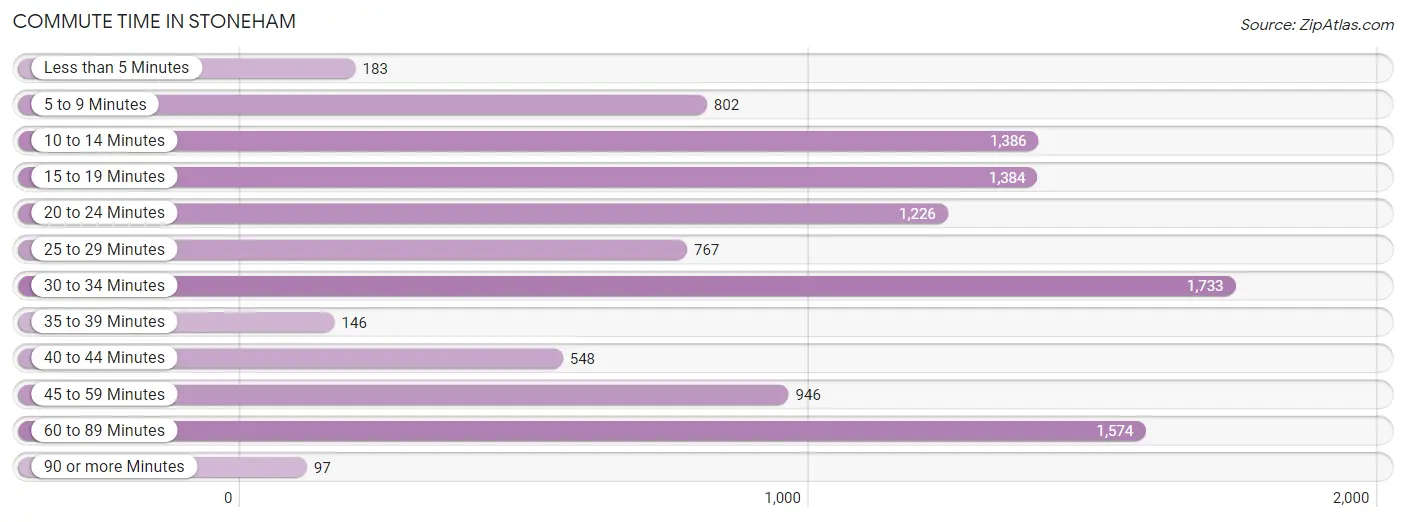
| Commute Time | # Commuters | % Commuters |
| Less than 5 Minutes | 183 | 1.7% |
| 5 to 9 Minutes | 802 | 7.4% |
| 10 to 14 Minutes | 1,386 | 12.8% |
| 15 to 19 Minutes | 1,384 | 12.8% |
| 20 to 24 Minutes | 1,226 | 11.4% |
| 25 to 29 Minutes | 767 | 7.1% |
| 30 to 34 Minutes | 1,733 | 16.1% |
| 35 to 39 Minutes | 146 | 1.3% |
| 40 to 44 Minutes | 548 | 5.1% |
| 45 to 59 Minutes | 946 | 8.8% |
| 60 to 89 Minutes | 1,574 | 14.6% |
| 90 or more Minutes | 97 | 0.9% |
Commute Time by Sex in Stoneham
The most common commute times in Stoneham are 30 to 34 minutes (1,046 commuters, 19.3%) for males and 15 to 19 minutes (928 commuters, 17.3%) for females.
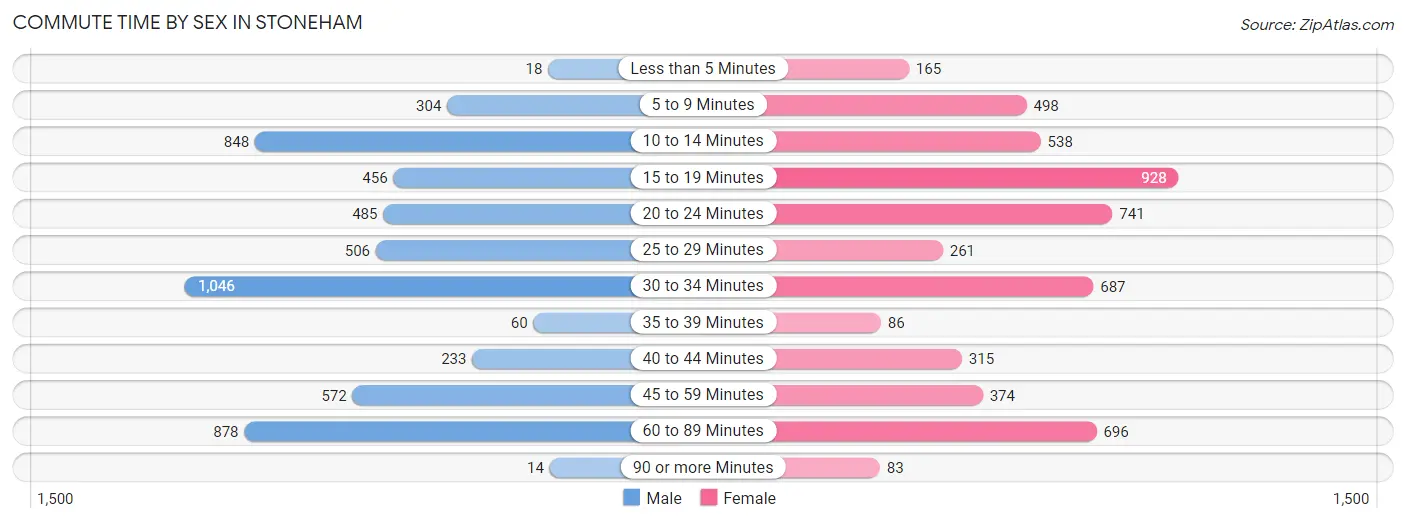
| Commute Time | Male | Female |
| Less than 5 Minutes | 18 (0.3%) | 165 (3.1%) |
| 5 to 9 Minutes | 304 (5.6%) | 498 (9.3%) |
| 10 to 14 Minutes | 848 (15.7%) | 538 (10.0%) |
| 15 to 19 Minutes | 456 (8.4%) | 928 (17.3%) |
| 20 to 24 Minutes | 485 (8.9%) | 741 (13.8%) |
| 25 to 29 Minutes | 506 (9.3%) | 261 (4.9%) |
| 30 to 34 Minutes | 1,046 (19.3%) | 687 (12.8%) |
| 35 to 39 Minutes | 60 (1.1%) | 86 (1.6%) |
| 40 to 44 Minutes | 233 (4.3%) | 315 (5.9%) |
| 45 to 59 Minutes | 572 (10.5%) | 374 (7.0%) |
| 60 to 89 Minutes | 878 (16.2%) | 696 (13.0%) |
| 90 or more Minutes | 14 (0.3%) | 83 (1.5%) |
Time of Departure to Work by Sex in Stoneham
The most frequent times of departure to work in Stoneham are 6:30 AM to 6:59 AM (964, 17.8%) for males and 7:00 AM to 7:29 AM (852, 15.9%) for females.
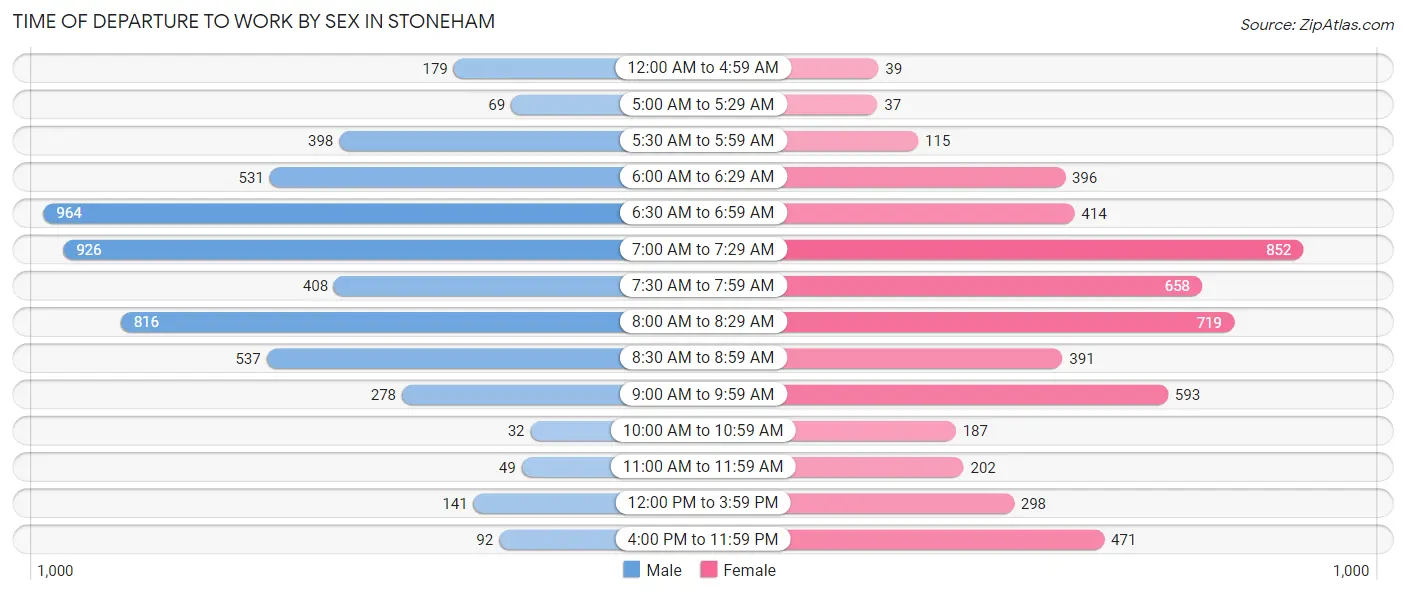
| Time of Departure | Male | Female |
| 12:00 AM to 4:59 AM | 179 (3.3%) | 39 (0.7%) |
| 5:00 AM to 5:29 AM | 69 (1.3%) | 37 (0.7%) |
| 5:30 AM to 5:59 AM | 398 (7.3%) | 115 (2.1%) |
| 6:00 AM to 6:29 AM | 531 (9.8%) | 396 (7.4%) |
| 6:30 AM to 6:59 AM | 964 (17.8%) | 414 (7.7%) |
| 7:00 AM to 7:29 AM | 926 (17.1%) | 852 (15.9%) |
| 7:30 AM to 7:59 AM | 408 (7.5%) | 658 (12.2%) |
| 8:00 AM to 8:29 AM | 816 (15.1%) | 719 (13.4%) |
| 8:30 AM to 8:59 AM | 537 (9.9%) | 391 (7.3%) |
| 9:00 AM to 9:59 AM | 278 (5.1%) | 593 (11.0%) |
| 10:00 AM to 10:59 AM | 32 (0.6%) | 187 (3.5%) |
| 11:00 AM to 11:59 AM | 49 (0.9%) | 202 (3.8%) |
| 12:00 PM to 3:59 PM | 141 (2.6%) | 298 (5.6%) |
| 4:00 PM to 11:59 PM | 92 (1.7%) | 471 (8.8%) |
| Total | 5,420 (100.0%) | 5,372 (100.0%) |
Housing Occupancy in Stoneham
Occupancy by Ownership in Stoneham
Of the total 9,654 dwellings in Stoneham, owner-occupied units account for 6,547 (67.8%), while renter-occupied units make up 3,107 (32.2%).
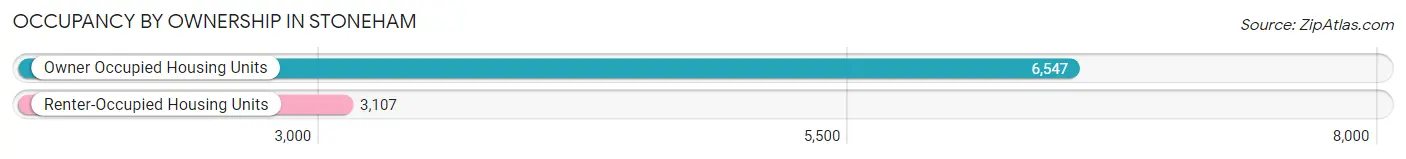
| Occupancy | # Housing Units | % Housing Units |
| Owner Occupied Housing Units | 6,547 | 67.8% |
| Renter-Occupied Housing Units | 3,107 | 32.2% |
| Total Occupied Housing Units | 9,654 | 100.0% |
Occupancy by Household Size in Stoneham
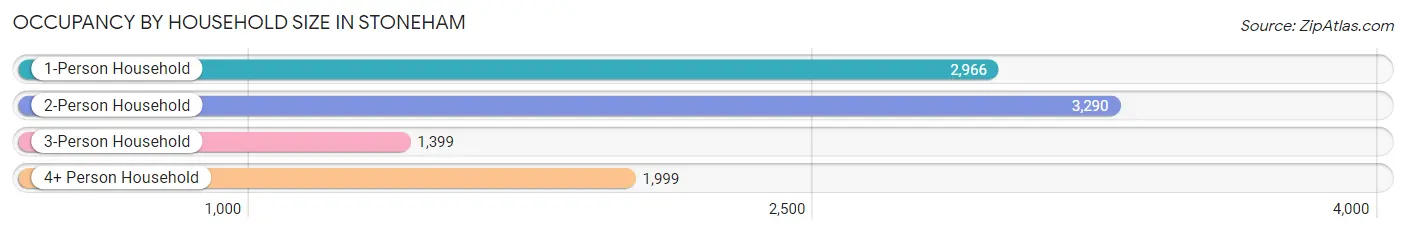
| Household Size | # Housing Units | % Housing Units |
| 1-Person Household | 2,966 | 30.7% |
| 2-Person Household | 3,290 | 34.1% |
| 3-Person Household | 1,399 | 14.5% |
| 4+ Person Household | 1,999 | 20.7% |
| Total Housing Units | 9,654 | 100.0% |
Occupancy by Ownership by Household Size in Stoneham
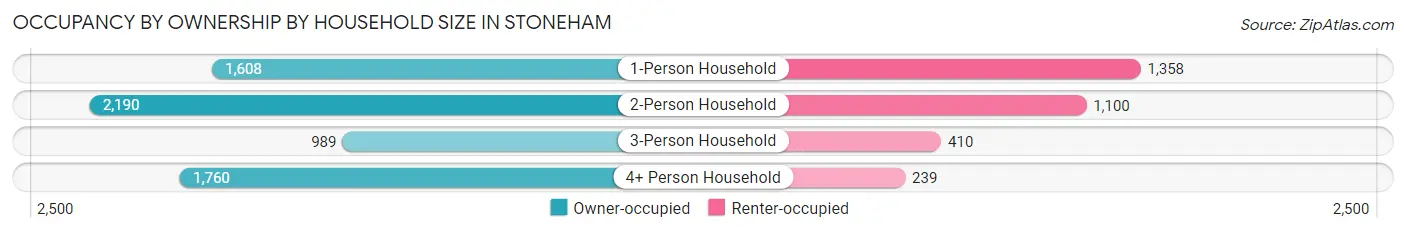
| Household Size | Owner-occupied | Renter-occupied |
| 1-Person Household | 1,608 (54.2%) | 1,358 (45.8%) |
| 2-Person Household | 2,190 (66.6%) | 1,100 (33.4%) |
| 3-Person Household | 989 (70.7%) | 410 (29.3%) |
| 4+ Person Household | 1,760 (88.0%) | 239 (12.0%) |
| Total Housing Units | 6,547 (67.8%) | 3,107 (32.2%) |
Occupancy by Educational Attainment in Stoneham
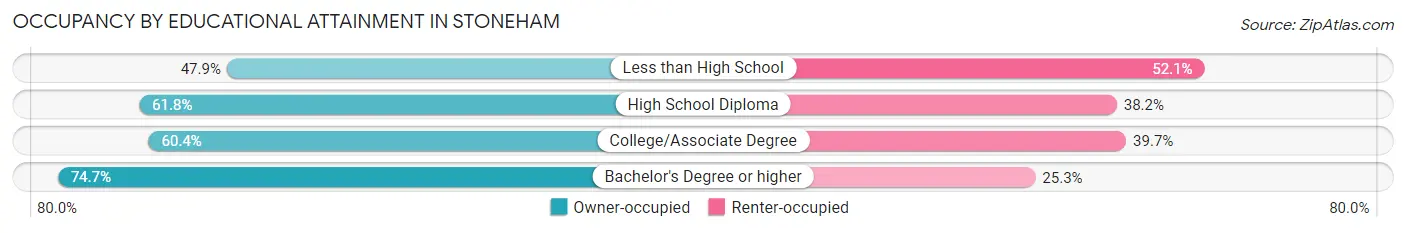
| Household Size | Owner-occupied | Renter-occupied |
| Less than High School | 209 (47.9%) | 227 (52.1%) |
| High School Diploma | 1,299 (61.8%) | 802 (38.2%) |
| College/Associate Degree | 1,175 (60.4%) | 772 (39.7%) |
| Bachelor's Degree or higher | 3,864 (74.7%) | 1,306 (25.3%) |
Occupancy by Age of Householder in Stoneham
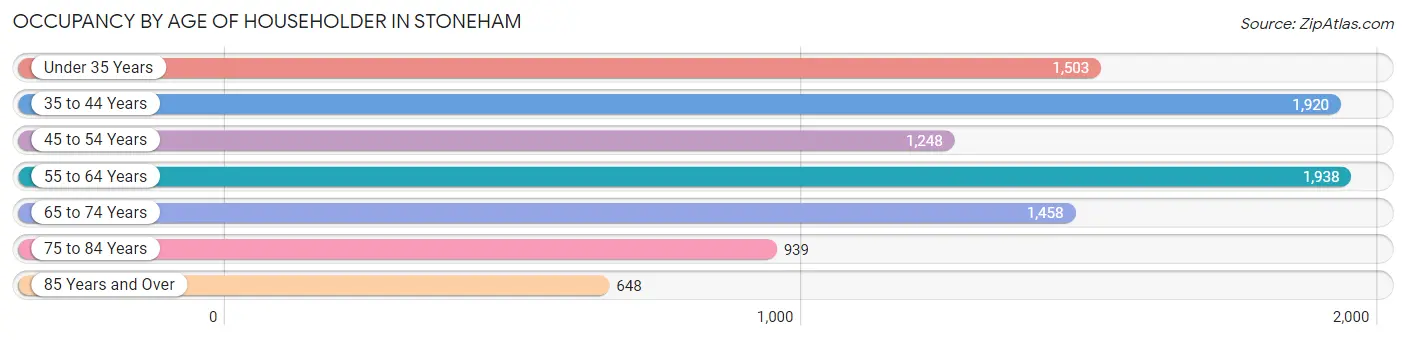
| Age Bracket | # Households | % Households |
| Under 35 Years | 1,503 | 15.6% |
| 35 to 44 Years | 1,920 | 19.9% |
| 45 to 54 Years | 1,248 | 12.9% |
| 55 to 64 Years | 1,938 | 20.1% |
| 65 to 74 Years | 1,458 | 15.1% |
| 75 to 84 Years | 939 | 9.7% |
| 85 Years and Over | 648 | 6.7% |
| Total | 9,654 | 100.0% |
Housing Finances in Stoneham
Median Income by Occupancy in Stoneham
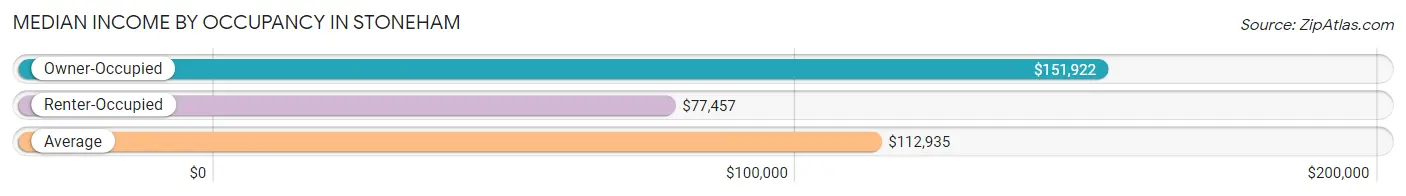
| Occupancy Type | # Households | Median Income |
| Owner-Occupied | 6,547 (67.8%) | $151,922 |
| Renter-Occupied | 3,107 (32.2%) | $77,457 |
| Average | 9,654 (100.0%) | $112,935 |
Occupancy by Householder Income Bracket in Stoneham
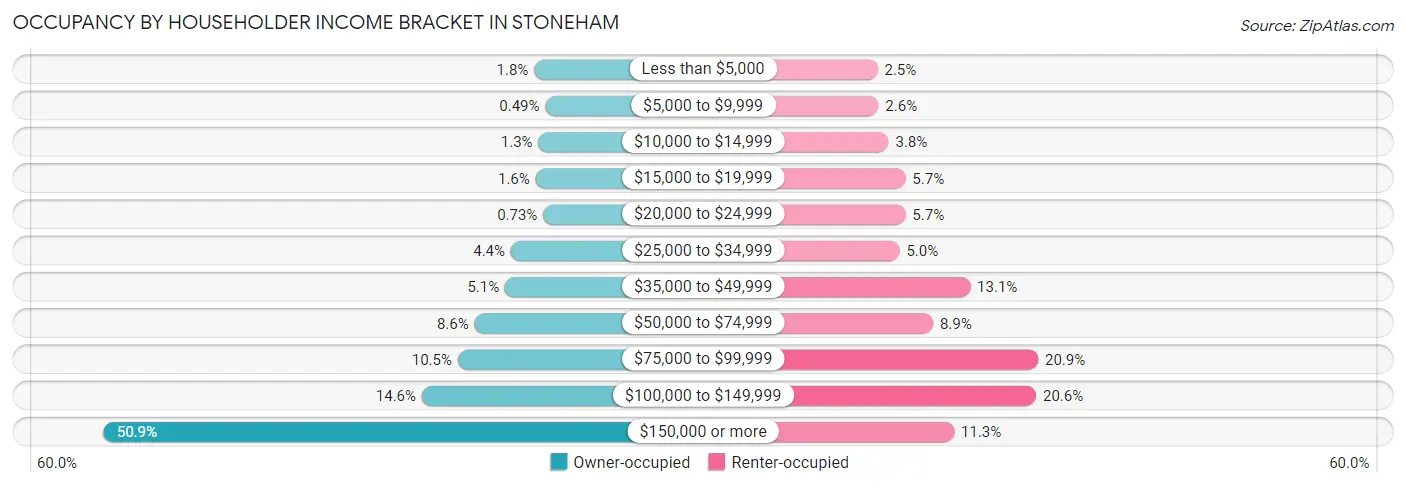
| Income Bracket | Owner-occupied | Renter-occupied |
| Less than $5,000 | 115 (1.8%) | 78 (2.5%) |
| $5,000 to $9,999 | 32 (0.5%) | 81 (2.6%) |
| $10,000 to $14,999 | 84 (1.3%) | 117 (3.8%) |
| $15,000 to $19,999 | 105 (1.6%) | 177 (5.7%) |
| $20,000 to $24,999 | 48 (0.7%) | 177 (5.7%) |
| $25,000 to $34,999 | 290 (4.4%) | 156 (5.0%) |
| $35,000 to $49,999 | 333 (5.1%) | 407 (13.1%) |
| $50,000 to $74,999 | 562 (8.6%) | 275 (8.8%) |
| $75,000 to $99,999 | 687 (10.5%) | 648 (20.9%) |
| $100,000 to $149,999 | 956 (14.6%) | 641 (20.6%) |
| $150,000 or more | 3,335 (50.9%) | 350 (11.3%) |
| Total | 6,547 (100.0%) | 3,107 (100.0%) |
Monthly Housing Cost Tiers in Stoneham
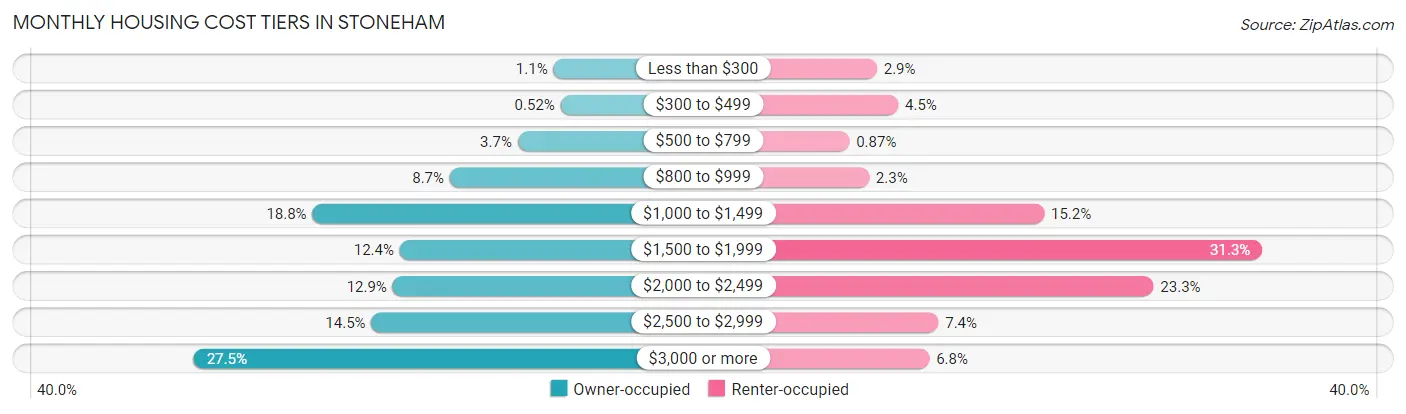
| Monthly Cost | Owner-occupied | Renter-occupied |
| Less than $300 | 69 (1.1%) | 90 (2.9%) |
| $300 to $499 | 34 (0.5%) | 139 (4.5%) |
| $500 to $799 | 241 (3.7%) | 27 (0.9%) |
| $800 to $999 | 568 (8.7%) | 72 (2.3%) |
| $1,000 to $1,499 | 1,231 (18.8%) | 473 (15.2%) |
| $1,500 to $1,999 | 810 (12.4%) | 972 (31.3%) |
| $2,000 to $2,499 | 844 (12.9%) | 723 (23.3%) |
| $2,500 to $2,999 | 947 (14.5%) | 231 (7.4%) |
| $3,000 or more | 1,803 (27.5%) | 210 (6.8%) |
| Total | 6,547 (100.0%) | 3,107 (100.0%) |
Physical Housing Characteristics in Stoneham
Housing Structures in Stoneham
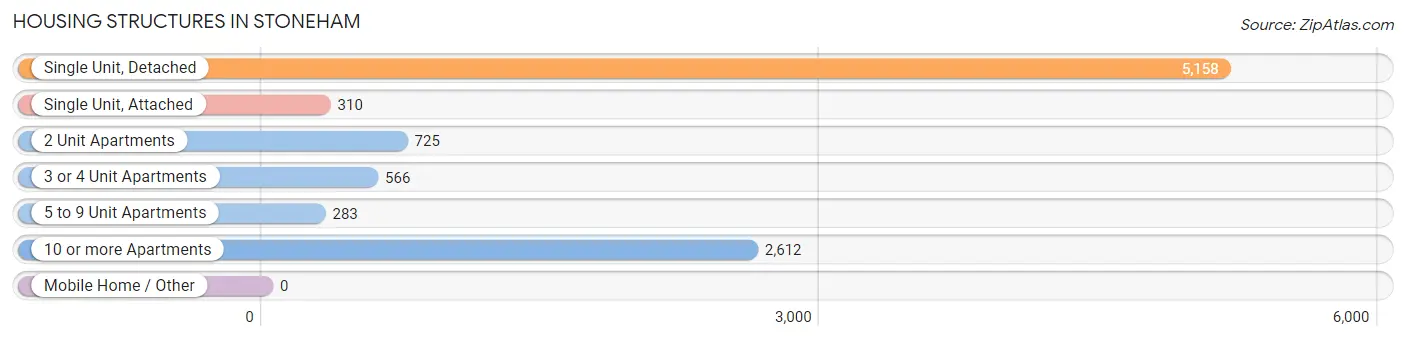
| Structure Type | # Housing Units | % Housing Units |
| Single Unit, Detached | 5,158 | 53.4% |
| Single Unit, Attached | 310 | 3.2% |
| 2 Unit Apartments | 725 | 7.5% |
| 3 or 4 Unit Apartments | 566 | 5.9% |
| 5 to 9 Unit Apartments | 283 | 2.9% |
| 10 or more Apartments | 2,612 | 27.1% |
| Mobile Home / Other | 0 | 0.0% |
| Total | 9,654 | 100.0% |
Housing Structures by Occupancy in Stoneham
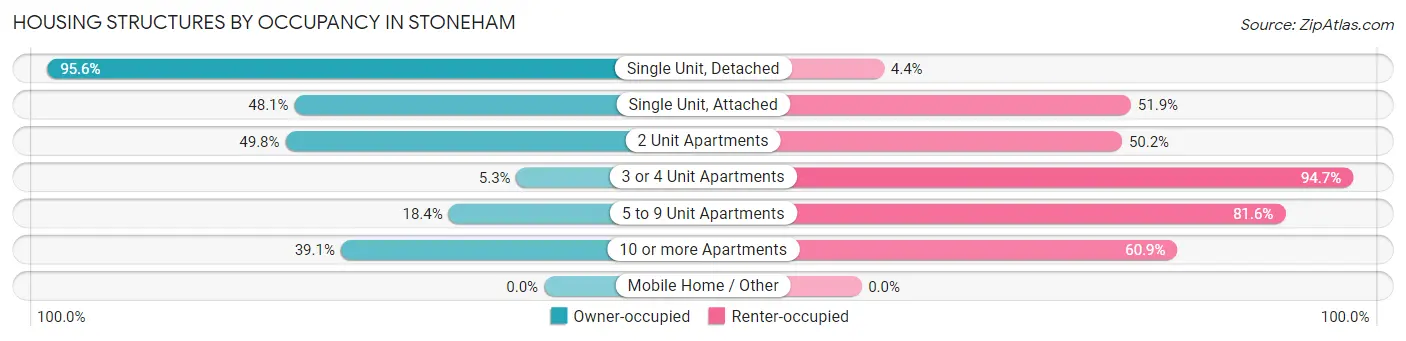
| Structure Type | Owner-occupied | Renter-occupied |
| Single Unit, Detached | 4,933 (95.6%) | 225 (4.4%) |
| Single Unit, Attached | 149 (48.1%) | 161 (51.9%) |
| 2 Unit Apartments | 361 (49.8%) | 364 (50.2%) |
| 3 or 4 Unit Apartments | 30 (5.3%) | 536 (94.7%) |
| 5 to 9 Unit Apartments | 52 (18.4%) | 231 (81.6%) |
| 10 or more Apartments | 1,022 (39.1%) | 1,590 (60.9%) |
| Mobile Home / Other | 0 (0.0%) | 0 (0.0%) |
| Total | 6,547 (67.8%) | 3,107 (32.2%) |
Housing Structures by Number of Rooms in Stoneham
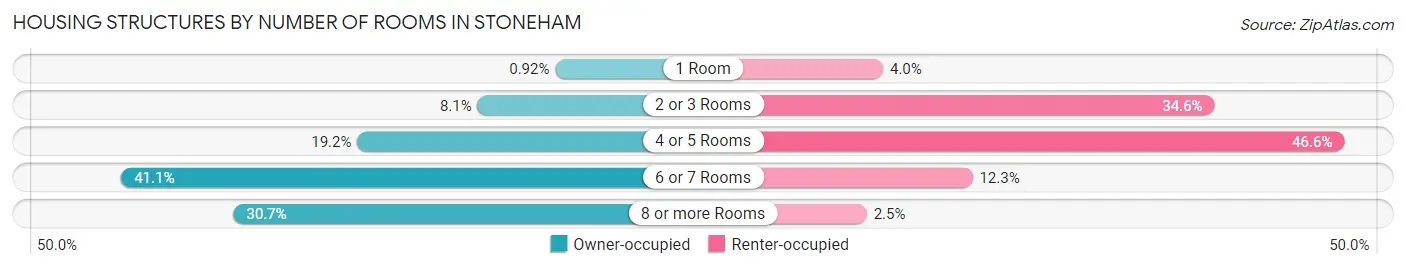
| Number of Rooms | Owner-occupied | Renter-occupied |
| 1 Room | 60 (0.9%) | 124 (4.0%) |
| 2 or 3 Rooms | 531 (8.1%) | 1,076 (34.6%) |
| 4 or 5 Rooms | 1,259 (19.2%) | 1,449 (46.6%) |
| 6 or 7 Rooms | 2,688 (41.1%) | 381 (12.3%) |
| 8 or more Rooms | 2,009 (30.7%) | 77 (2.5%) |
| Total | 6,547 (100.0%) | 3,107 (100.0%) |
Housing Structure by Heating Type in Stoneham
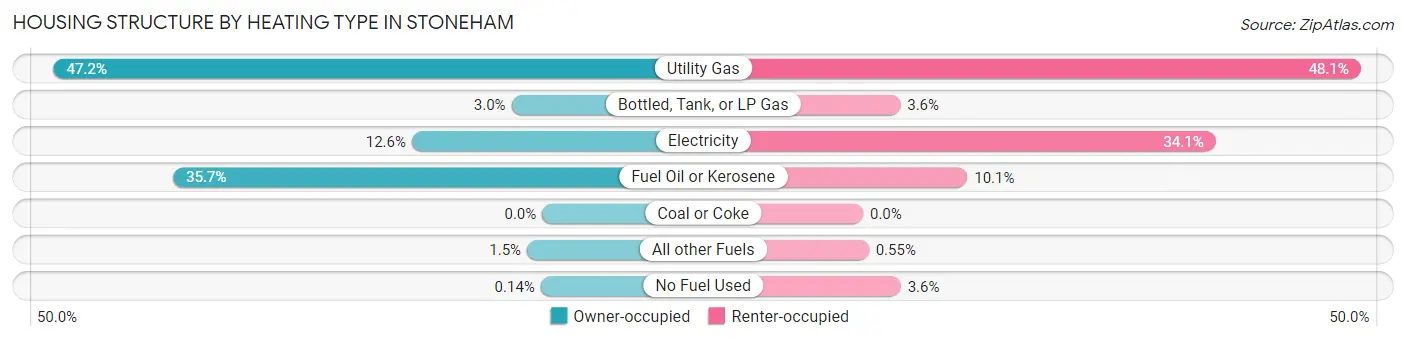
| Heating Type | Owner-occupied | Renter-occupied |
| Utility Gas | 3,090 (47.2%) | 1,494 (48.1%) |
| Bottled, Tank, or LP Gas | 194 (3.0%) | 112 (3.6%) |
| Electricity | 824 (12.6%) | 1,058 (34.1%) |
| Fuel Oil or Kerosene | 2,334 (35.6%) | 313 (10.1%) |
| Coal or Coke | 0 (0.0%) | 0 (0.0%) |
| All other Fuels | 96 (1.5%) | 17 (0.5%) |
| No Fuel Used | 9 (0.1%) | 113 (3.6%) |
| Total | 6,547 (100.0%) | 3,107 (100.0%) |
Household Vehicle Usage in Stoneham
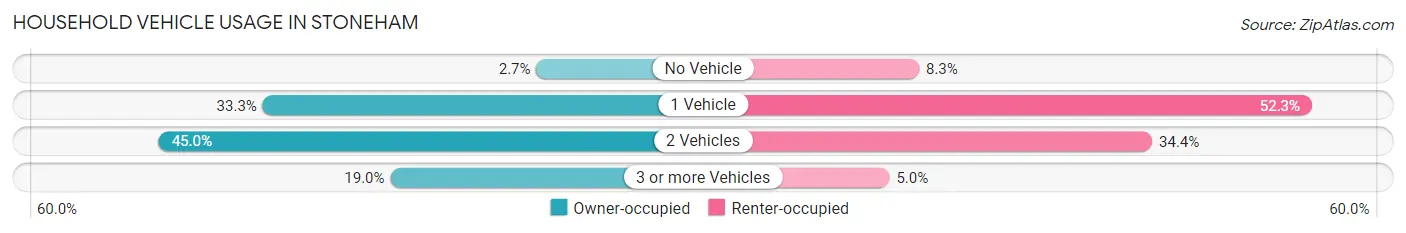
| Vehicles per Household | Owner-occupied | Renter-occupied |
| No Vehicle | 175 (2.7%) | 258 (8.3%) |
| 1 Vehicle | 2,182 (33.3%) | 1,625 (52.3%) |
| 2 Vehicles | 2,944 (45.0%) | 1,069 (34.4%) |
| 3 or more Vehicles | 1,246 (19.0%) | 155 (5.0%) |
| Total | 6,547 (100.0%) | 3,107 (100.0%) |
Real Estate & Mortgages in Stoneham
Real Estate and Mortgage Overview in Stoneham
| Characteristic | Without Mortgage | With Mortgage |
| Housing Units | 2,099 | 4,448 |
| Median Property Value | $577,500 | $620,800 |
| Median Household Income | $92,019 | $2,641 |
| Monthly Housing Costs | $1,043 | $1,803 |
| Real Estate Taxes | $6,106 | $33 |
Property Value by Mortgage Status in Stoneham
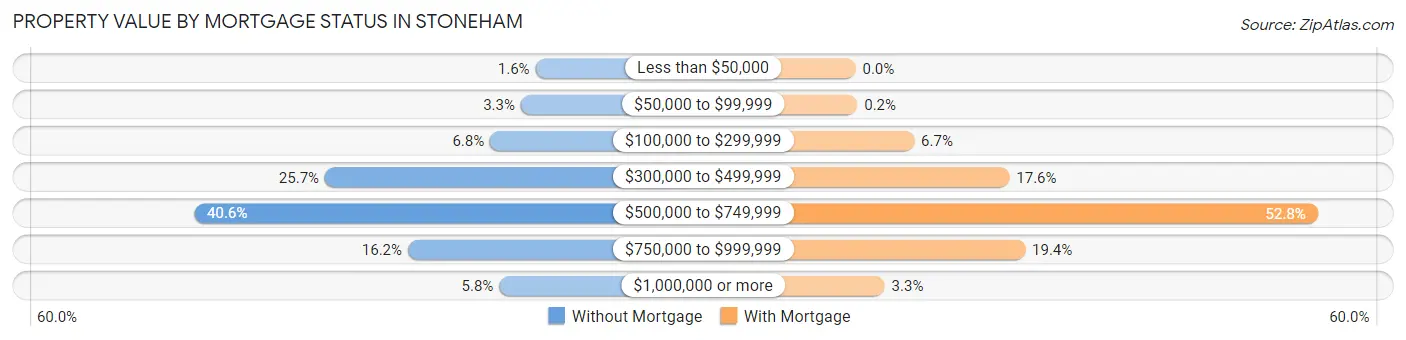
| Property Value | Without Mortgage | With Mortgage |
| Less than $50,000 | 34 (1.6%) | 0 (0.0%) |
| $50,000 to $99,999 | 69 (3.3%) | 9 (0.2%) |
| $100,000 to $299,999 | 143 (6.8%) | 298 (6.7%) |
| $300,000 to $499,999 | 539 (25.7%) | 782 (17.6%) |
| $500,000 to $749,999 | 853 (40.6%) | 2,349 (52.8%) |
| $750,000 to $999,999 | 340 (16.2%) | 862 (19.4%) |
| $1,000,000 or more | 121 (5.8%) | 148 (3.3%) |
| Total | 2,099 (100.0%) | 4,448 (100.0%) |
Household Income by Mortgage Status in Stoneham
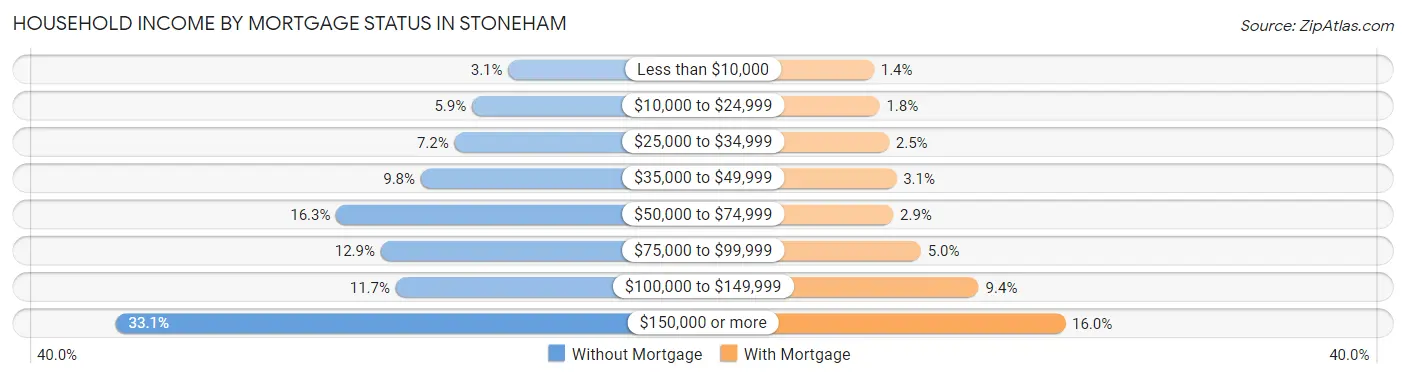
| Household Income | Without Mortgage | With Mortgage |
| Less than $10,000 | 66 (3.1%) | 62 (1.4%) |
| $10,000 to $24,999 | 124 (5.9%) | 81 (1.8%) |
| $25,000 to $34,999 | 152 (7.2%) | 113 (2.5%) |
| $35,000 to $49,999 | 206 (9.8%) | 138 (3.1%) |
| $50,000 to $74,999 | 341 (16.3%) | 127 (2.9%) |
| $75,000 to $99,999 | 270 (12.9%) | 221 (5.0%) |
| $100,000 to $149,999 | 246 (11.7%) | 417 (9.4%) |
| $150,000 or more | 694 (33.1%) | 710 (16.0%) |
| Total | 2,099 (100.0%) | 4,448 (100.0%) |
Property Value to Household Income Ratio in Stoneham
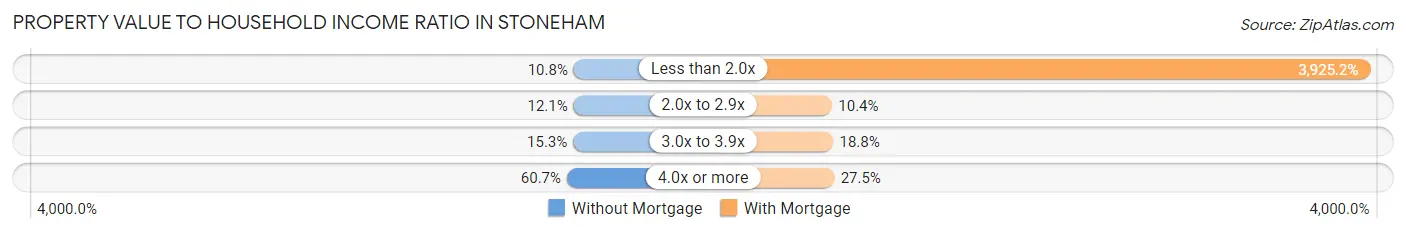
| Value-to-Income Ratio | Without Mortgage | With Mortgage |
| Less than 2.0x | 226 (10.8%) | 174,593 (3,925.2%) |
| 2.0x to 2.9x | 253 (12.0%) | 464 (10.4%) |
| 3.0x to 3.9x | 321 (15.3%) | 835 (18.8%) |
| 4.0x or more | 1,274 (60.7%) | 1,224 (27.5%) |
| Total | 2,099 (100.0%) | 4,448 (100.0%) |
Real Estate Taxes by Mortgage Status in Stoneham
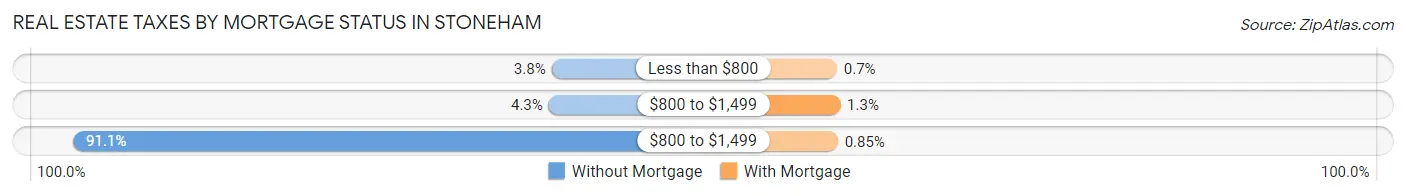
| Property Taxes | Without Mortgage | With Mortgage |
| Less than $800 | 79 (3.8%) | 31 (0.7%) |
| $800 to $1,499 | 90 (4.3%) | 58 (1.3%) |
| $800 to $1,499 | 1,913 (91.1%) | 38 (0.9%) |
| Total | 2,099 (100.0%) | 4,448 (100.0%) |
Health & Disability in Stoneham
Health Insurance Coverage by Age in Stoneham
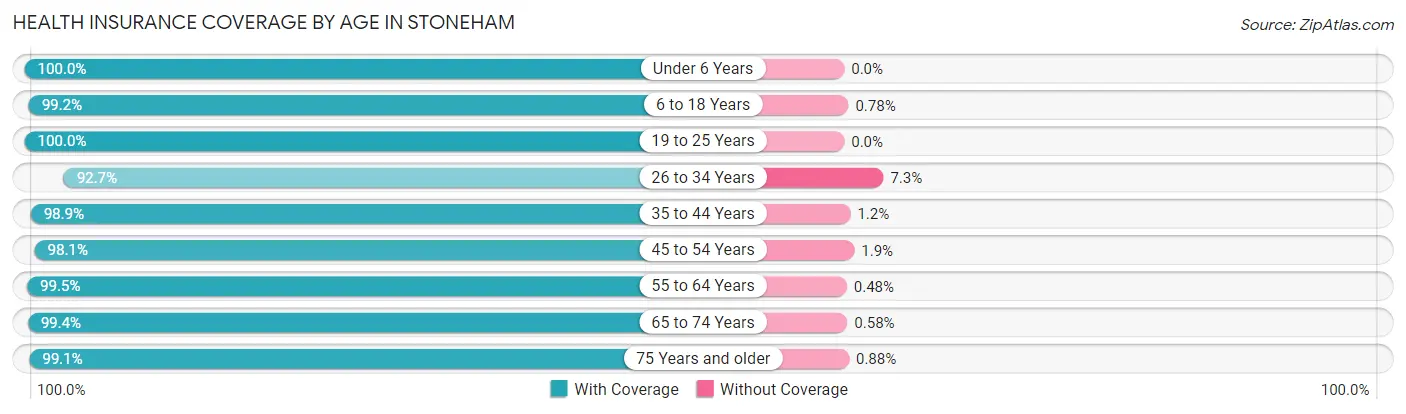
| Age Bracket | With Coverage | Without Coverage |
| Under 6 Years | 1,646 (100.0%) | 0 (0.0%) |
| 6 to 18 Years | 2,939 (99.2%) | 23 (0.8%) |
| 19 to 25 Years | 1,349 (100.0%) | 0 (0.0%) |
| 26 to 34 Years | 2,463 (92.7%) | 194 (7.3%) |
| 35 to 44 Years | 3,964 (98.9%) | 46 (1.1%) |
| 45 to 54 Years | 2,525 (98.1%) | 48 (1.9%) |
| 55 to 64 Years | 3,291 (99.5%) | 16 (0.5%) |
| 65 to 74 Years | 2,231 (99.4%) | 13 (0.6%) |
| 75 Years and older | 2,136 (99.1%) | 19 (0.9%) |
| Total | 22,544 (98.4%) | 359 (1.6%) |
Health Insurance Coverage by Citizenship Status in Stoneham
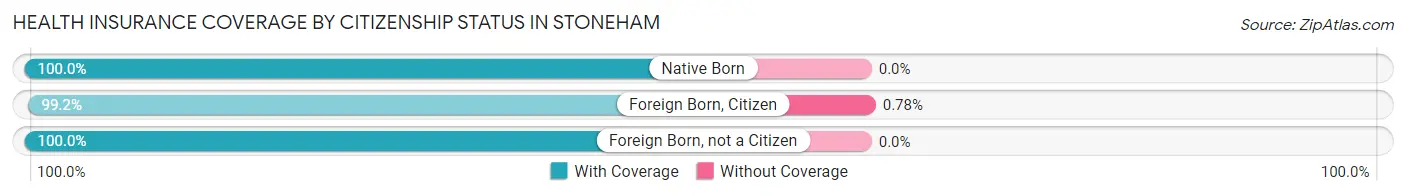
| Citizenship Status | With Coverage | Without Coverage |
| Native Born | 1,646 (100.0%) | 0 (0.0%) |
| Foreign Born, Citizen | 2,939 (99.2%) | 23 (0.8%) |
| Foreign Born, not a Citizen | 1,349 (100.0%) | 0 (0.0%) |
Health Insurance Coverage by Household Income in Stoneham
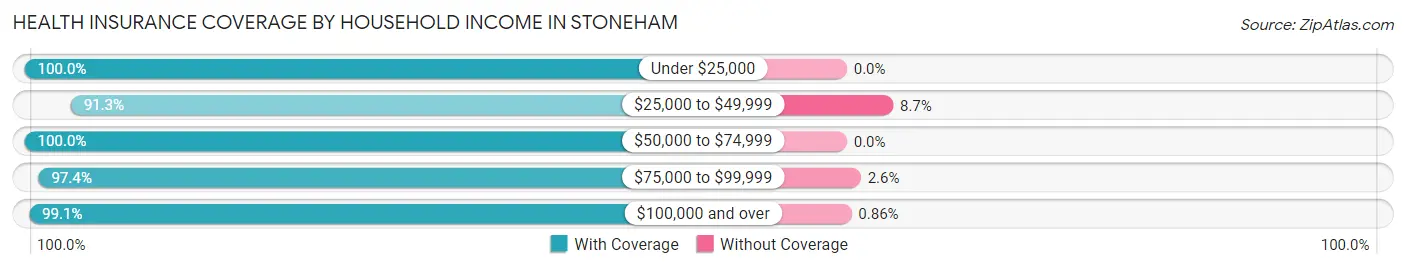
| Household Income | With Coverage | Without Coverage |
| Under $25,000 | 1,277 (100.0%) | 0 (0.0%) |
| $25,000 to $49,999 | 1,592 (91.3%) | 151 (8.7%) |
| $50,000 to $74,999 | 1,212 (100.0%) | 0 (0.0%) |
| $75,000 to $99,999 | 2,570 (97.4%) | 69 (2.6%) |
| $100,000 and over | 15,881 (99.1%) | 138 (0.9%) |
Public vs Private Health Insurance Coverage by Age in Stoneham
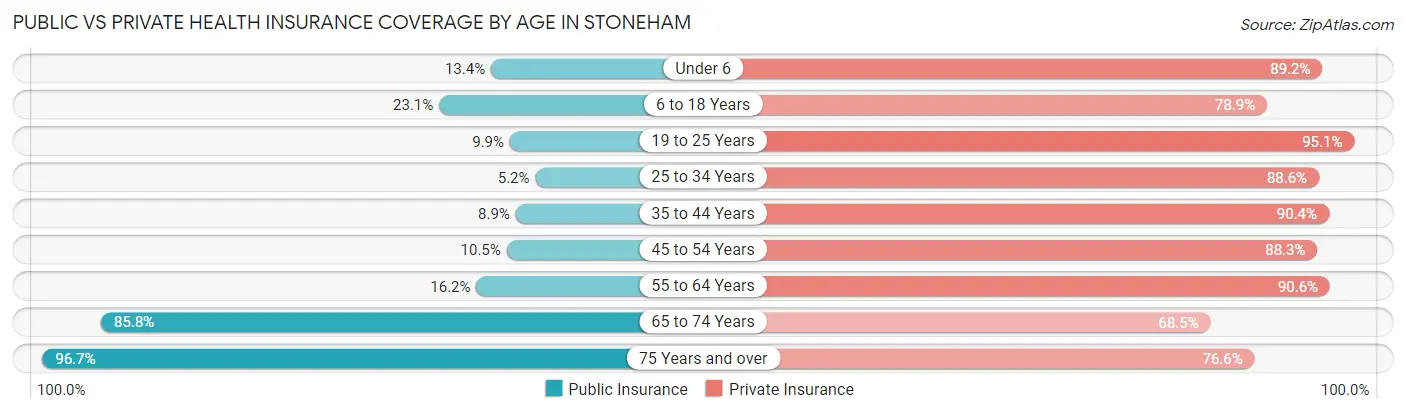
| Age Bracket | Public Insurance | Private Insurance |
| Under 6 | 221 (13.4%) | 1,468 (89.2%) |
| 6 to 18 Years | 683 (23.1%) | 2,338 (78.9%) |
| 19 to 25 Years | 134 (9.9%) | 1,283 (95.1%) |
| 25 to 34 Years | 138 (5.2%) | 2,353 (88.6%) |
| 35 to 44 Years | 355 (8.8%) | 3,625 (90.4%) |
| 45 to 54 Years | 271 (10.5%) | 2,271 (88.3%) |
| 55 to 64 Years | 534 (16.2%) | 2,996 (90.6%) |
| 65 to 74 Years | 1,926 (85.8%) | 1,536 (68.4%) |
| 75 Years and over | 2,084 (96.7%) | 1,651 (76.6%) |
| Total | 6,346 (27.7%) | 19,521 (85.2%) |
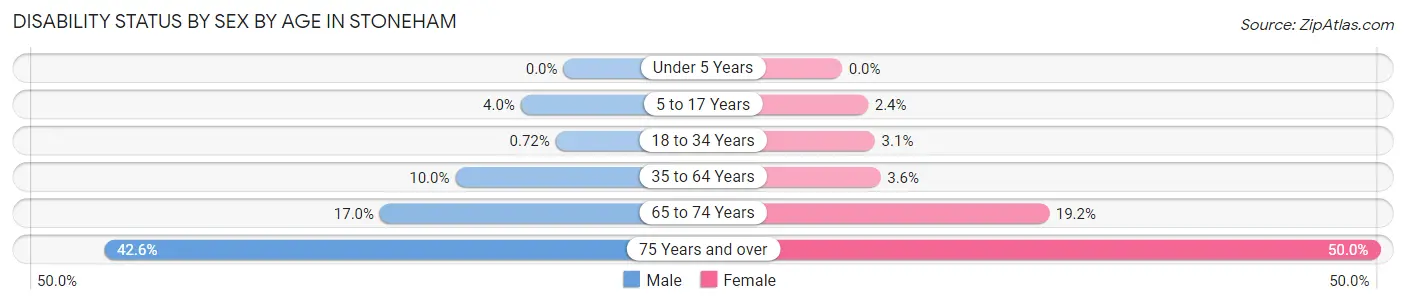
Disability Status by Sex by Age in Stoneham
| Age Bracket | Male | Female |
| Under 5 Years | 0 (0.0%) | 0 (0.0%) |
| 5 to 17 Years | 57 (4.0%) | 41 (2.4%) |
| 18 to 34 Years | 14 (0.7%) | 66 (3.0%) |
| 35 to 64 Years | 509 (10.0%) | 172 (3.6%) |
| 65 to 74 Years | 172 (17.0%) | 237 (19.2%) |
| 75 Years and over | 376 (42.6%) | 636 (50.0%) |
Disability Class by Sex by Age in Stoneham
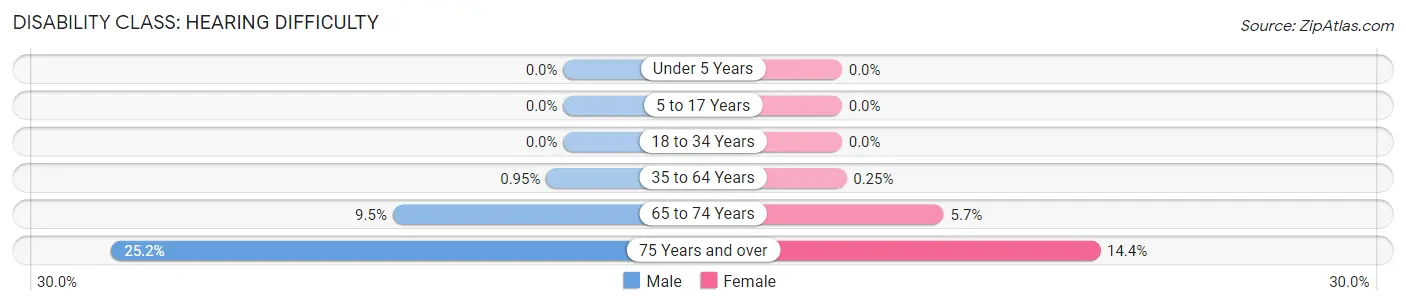
Disability Class: Hearing Difficulty
| Age Bracket | Male | Female |
| Under 5 Years | 0 (0.0%) | 0 (0.0%) |
| 5 to 17 Years | 0 (0.0%) | 0 (0.0%) |
| 18 to 34 Years | 0 (0.0%) | 0 (0.0%) |
| 35 to 64 Years | 48 (0.9%) | 12 (0.3%) |
| 65 to 74 Years | 96 (9.5%) | 70 (5.7%) |
| 75 Years and over | 222 (25.2%) | 183 (14.4%) |
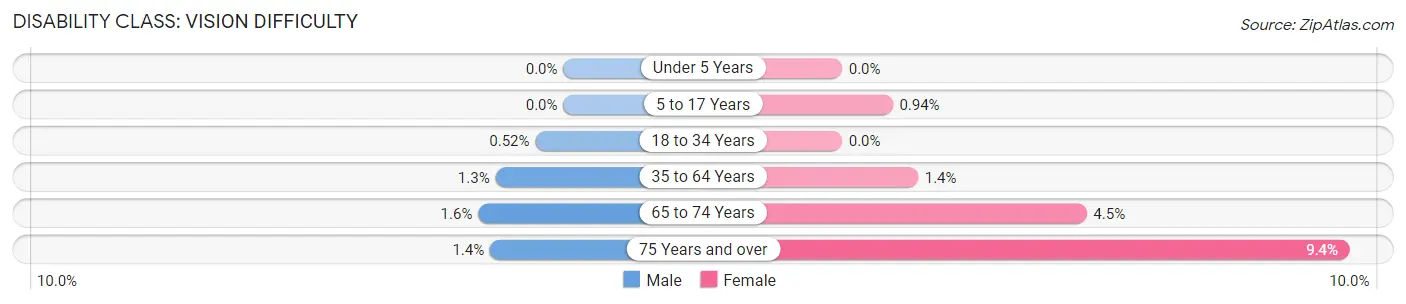
Disability Class: Vision Difficulty
| Age Bracket | Male | Female |
| Under 5 Years | 0 (0.0%) | 0 (0.0%) |
| 5 to 17 Years | 0 (0.0%) | 16 (0.9%) |
| 18 to 34 Years | 10 (0.5%) | 0 (0.0%) |
| 35 to 64 Years | 64 (1.3%) | 68 (1.4%) |
| 65 to 74 Years | 16 (1.6%) | 56 (4.5%) |
| 75 Years and over | 12 (1.4%) | 120 (9.4%) |
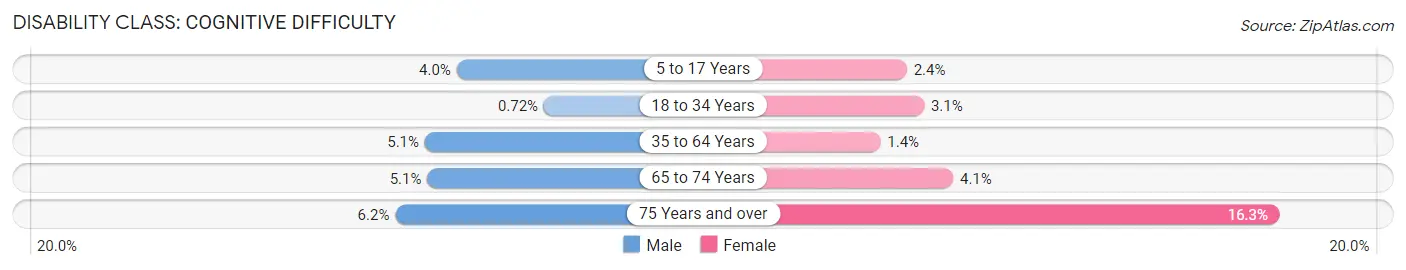
Disability Class: Cognitive Difficulty
| Age Bracket | Male | Female |
| 5 to 17 Years | 57 (4.0%) | 41 (2.4%) |
| 18 to 34 Years | 14 (0.7%) | 66 (3.0%) |
| 35 to 64 Years | 261 (5.1%) | 69 (1.4%) |
| 65 to 74 Years | 51 (5.1%) | 51 (4.1%) |
| 75 Years and over | 55 (6.2%) | 207 (16.3%) |
Disability Class: Ambulatory Difficulty
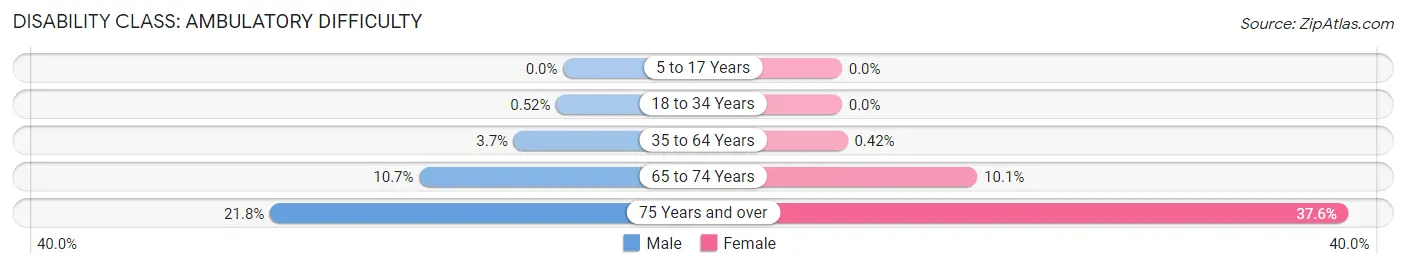
| Age Bracket | Male | Female |
| 5 to 17 Years | 0 (0.0%) | 0 (0.0%) |
| 18 to 34 Years | 10 (0.5%) | 0 (0.0%) |
| 35 to 64 Years | 186 (3.7%) | 20 (0.4%) |
| 65 to 74 Years | 108 (10.7%) | 124 (10.1%) |
| 75 Years and over | 192 (21.8%) | 479 (37.6%) |
Disability Class: Self-Care Difficulty
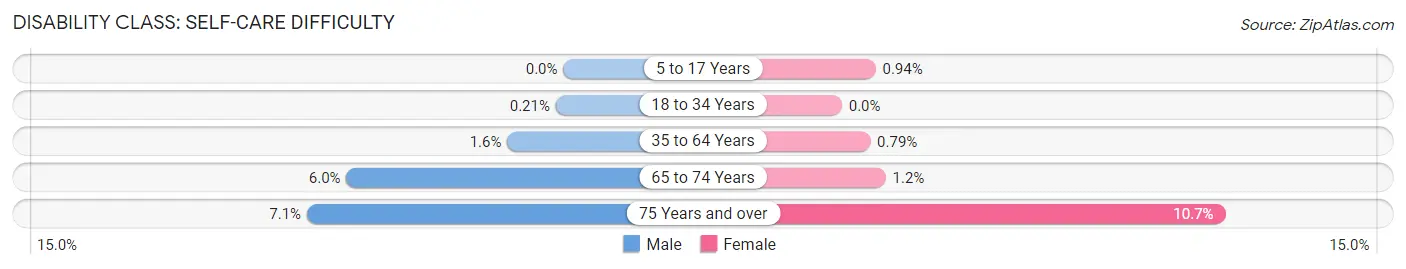
| Age Bracket | Male | Female |
| 5 to 17 Years | 0 (0.0%) | 16 (0.9%) |
| 18 to 34 Years | 4 (0.2%) | 0 (0.0%) |
| 35 to 64 Years | 79 (1.6%) | 38 (0.8%) |
| 65 to 74 Years | 61 (6.0%) | 15 (1.2%) |
| 75 Years and over | 63 (7.1%) | 136 (10.7%) |
Technology Access in Stoneham
Computing Device Access in Stoneham
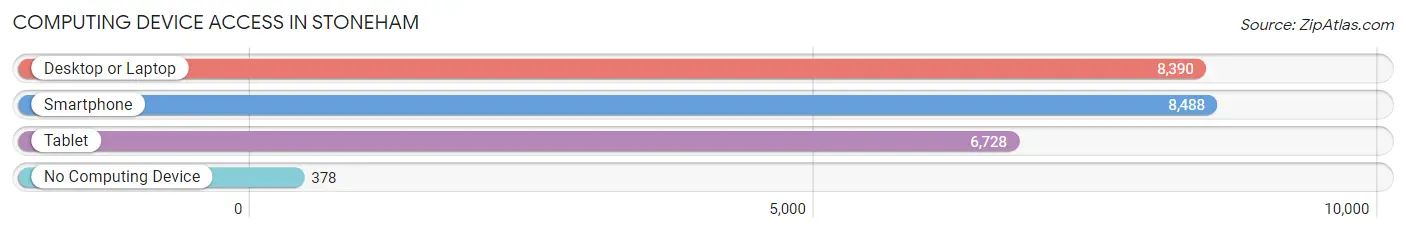
| Device Type | # Households | % Households |
| Desktop or Laptop | 8,390 | 86.9% |
| Smartphone | 8,488 | 87.9% |
| Tablet | 6,728 | 69.7% |
| No Computing Device | 378 | 3.9% |
| Total | 9,654 | 100.0% |
Internet Access in Stoneham
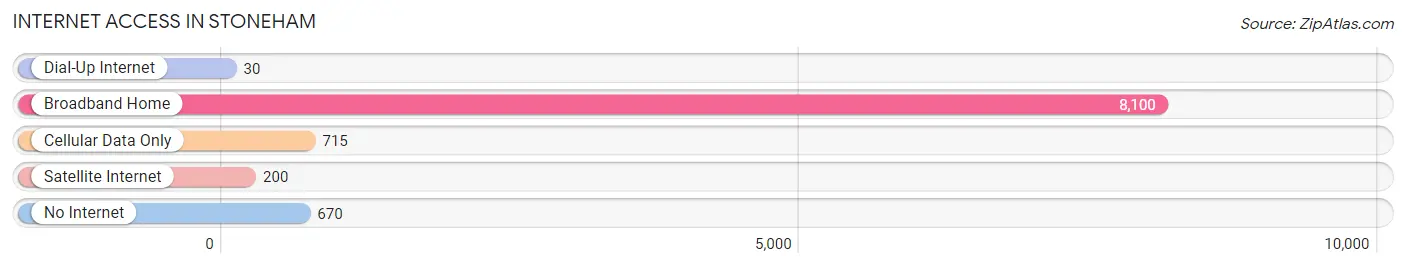
| Internet Type | # Households | % Households |
| Dial-Up Internet | 30 | 0.3% |
| Broadband Home | 8,100 | 83.9% |
| Cellular Data Only | 715 | 7.4% |
| Satellite Internet | 200 | 2.1% |
| No Internet | 670 | 6.9% |
| Total | 9,654 | 100.0% |
Stoneham Summary
History
The area now known as Stoneham, Massachusetts was first settled in 1634 by Europeans. The area was originally part of Charlestown, and was known as “Mistic Side”. The area was then incorporated as a separate town in 1725, and was named after the town of Stoneham in England.
The town of Stoneham was primarily an agricultural community for much of its history. The town was home to a variety of farms, including dairy farms, orchards, and vegetable farms. The town was also home to a number of mills, including a grist mill, a saw mill, and a paper mill.
In the late 19th century, the town began to experience a period of industrialization. The town was home to a number of factories, including a shoe factory, a paper mill, and a tannery. The town also became home to a number of businesses, including a bank, a post office, and a variety of stores.
In the early 20th century, the town began to experience a period of suburbanization. The town was home to a number of new housing developments, and the population of the town began to grow rapidly. The town was also home to a number of new businesses, including a movie theater, a bowling alley, and a variety of restaurants.
Geography
Stoneham is located in Middlesex County, Massachusetts. The town is bordered by the towns of Wakefield, Reading, Winchester, Woburn, and Melrose. The town is located approximately 8 miles north of Boston.
The town has a total area of 5.3 square miles, of which 5.2 square miles is land and 0.1 square miles is water. The town is located in the Mystic River Valley, and is home to a number of ponds and streams. The town is also home to a number of parks, including Spot Pond, Bear Hill, and Breakheart Reservation.
Economy
The economy of Stoneham is largely based on the service industry. The town is home to a number of retail stores, restaurants, and other businesses. The town is also home to a number of corporate offices, including those of the Boston Globe, the Boston Red Sox, and the Boston Celtics.
The town is also home to a number of manufacturing companies, including a paper mill, a shoe factory, and a tannery. The town is also home to a number of medical facilities, including a hospital and a number of medical offices.
Demographics
As of the 2010 census, the town of Stoneham had a population of 21,437. The racial makeup of the town was 87.3% White, 4.2% African American, 0.3% Native American, 4.7% Asian, 0.1% Pacific Islander, 1.7% from other races, and 2.0% from two or more races. Hispanic or Latino of any race were 4.3% of the population.
The median household income in the town was $76,837, and the median family income was $90,945. The per capita income in the town was $35,945. About 4.2% of families and 5.7% of the population were below the poverty line.
Common Questions
What is Per Capita Income in Stoneham?
Per Capita income in Stoneham is $60,043.
What is the Median Family Income in Stoneham?
Median Family Income in Stoneham is $153,873.
What is the Median Household income in Stoneham?
Median Household Income in Stoneham is $112,935.
What is Income or Wage Gap in Stoneham?
Income or Wage Gap in Stoneham is 23.3%.
Women in Stoneham earn 76.7 cents for every dollar earned by a man.
What is Inequality or Gini Index in Stoneham?
Inequality or Gini Index in Stoneham is 0.42.
What is the Total Population of Stoneham?
Total Population of Stoneham is 22,992.
What is the Total Male Population of Stoneham?
Total Male Population of Stoneham is 10,929.
What is the Total Female Population of Stoneham?
Total Female Population of Stoneham is 12,063.
What is the Ratio of Males per 100 Females in Stoneham?
There are 90.60 Males per 100 Females in Stoneham.
What is the Ratio of Females per 100 Males in Stoneham?
There are 110.38 Females per 100 Males in Stoneham.
What is the Median Population Age in Stoneham?
Median Population Age in Stoneham is 42.1 Years.
What is the Average Family Size in Stoneham
Average Family Size in Stoneham is 3.0 People.
What is the Average Household Size in Stoneham
Average Household Size in Stoneham is 2.4 People.
How Large is the Labor Force in Stoneham?
There are 13,535 People in the Labor Forcein in Stoneham.
What is the Percentage of People in the Labor Force in Stoneham?
71.8% of People are in the Labor Force in Stoneham.
What is the Unemployment Rate in Stoneham?
Unemployment Rate in Stoneham is 3.3%.