Alfred, NY Map & Demographics
Alfred Map
Alfred Overview
$11,618
PER CAPITA INCOME
$105,938
AVG FAMILY INCOME
$43,583
AVG HOUSEHOLD INCOME
39.0%
WAGE / INCOME GAP [ % ]
61.0¢/ $1
WAGE / INCOME GAP [ $ ]
0.50
INEQUALITY / GINI INDEX
4,577
TOTAL POPULATION
2,519
MALE POPULATION
2,058
FEMALE POPULATION
122.40
MALES / 100 FEMALES
81.70
FEMALES / 100 MALES
20.2
MEDIAN AGE
2.9
AVG FAMILY SIZE
2.4
AVG HOUSEHOLD SIZE
1,814
LABOR FORCE [ PEOPLE ]
40.5%
PERCENT IN LABOR FORCE
16.4%
UNEMPLOYMENT RATE
Alfred Zip Codes
Alfred Area Codes
Income in Alfred
Income Overview in Alfred
Per Capita Income in Alfred is $11,618, while median incomes of families and households are $105,938 and $43,583 respectively.
| Characteristic | Number | Measure |
| Per Capita Income | 4,577 | $11,618 |
| Median Family Income | 189 | $105,938 |
| Mean Family Income | 189 | $111,726 |
| Median Household Income | 503 | $43,583 |
| Mean Household Income | 503 | $65,373 |
| Income Deficit | 189 | $0 |
| Wage / Income Gap (%) | 4,577 | 39.04% |
| Wage / Income Gap ($) | 4,577 | 60.96¢ per $1 |
| Gini / Inequality Index | 4,577 | 0.50 |
Earnings by Sex in Alfred
Average Earnings in Alfred are $4,721, $5,935 for men and $3,618 for women, a difference of 39.0%.
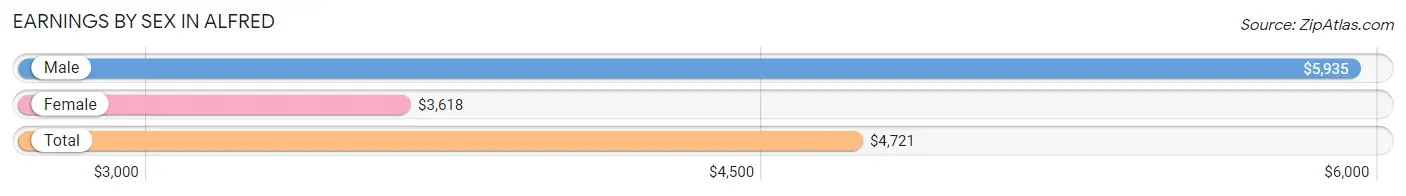
| Sex | Number | Average Earnings |
| Male | 1,530 (51.8%) | $5,935 |
| Female | 1,422 (48.2%) | $3,618 |
| Total | 2,952 (100.0%) | $4,721 |
Earnings by Sex by Income Bracket in Alfred
The most common earnings brackets in Alfred are $2,499 or less for men (409 | 26.7%) and $2,499 or less for women (541 | 38.1%).
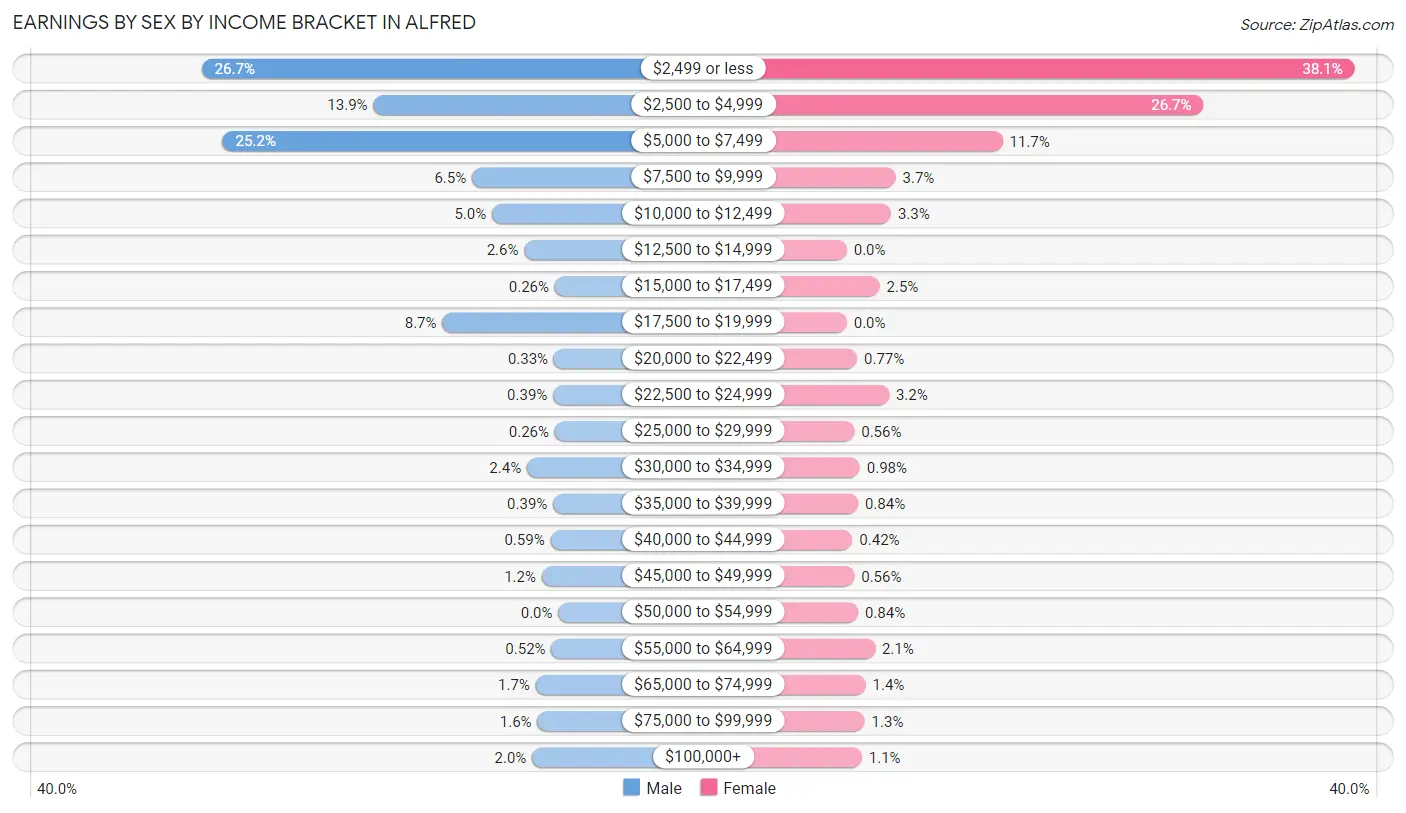
| Income | Male | Female |
| $2,499 or less | 409 (26.7%) | 541 (38.1%) |
| $2,500 to $4,999 | 212 (13.9%) | 380 (26.7%) |
| $5,000 to $7,499 | 385 (25.2%) | 166 (11.7%) |
| $7,500 to $9,999 | 99 (6.5%) | 52 (3.7%) |
| $10,000 to $12,499 | 76 (5.0%) | 47 (3.3%) |
| $12,500 to $14,999 | 39 (2.5%) | 0 (0.0%) |
| $15,000 to $17,499 | 4 (0.3%) | 35 (2.5%) |
| $17,500 to $19,999 | 133 (8.7%) | 0 (0.0%) |
| $20,000 to $22,499 | 5 (0.3%) | 11 (0.8%) |
| $22,500 to $24,999 | 6 (0.4%) | 45 (3.2%) |
| $25,000 to $29,999 | 4 (0.3%) | 8 (0.6%) |
| $30,000 to $34,999 | 36 (2.4%) | 14 (1.0%) |
| $35,000 to $39,999 | 6 (0.4%) | 12 (0.8%) |
| $40,000 to $44,999 | 9 (0.6%) | 6 (0.4%) |
| $45,000 to $49,999 | 19 (1.2%) | 8 (0.6%) |
| $50,000 to $54,999 | 0 (0.0%) | 12 (0.8%) |
| $55,000 to $64,999 | 8 (0.5%) | 30 (2.1%) |
| $65,000 to $74,999 | 26 (1.7%) | 20 (1.4%) |
| $75,000 to $99,999 | 24 (1.6%) | 19 (1.3%) |
| $100,000+ | 30 (2.0%) | 16 (1.1%) |
| Total | 1,530 (100.0%) | 1,422 (100.0%) |
Earnings by Sex by Educational Attainment in Alfred
Average earnings in Alfred are $32,070 for men and $54,167 for women, a difference of 40.8%. Men with an educational attainment of graduate degree enjoy the highest average annual earnings of $57,750, while those with bachelor's degree education earn the least with $19,125. Women with an educational attainment of graduate degree earn the most with the average annual earnings of $60,536, while those with bachelor's degree education have the smallest earnings of $57,917.
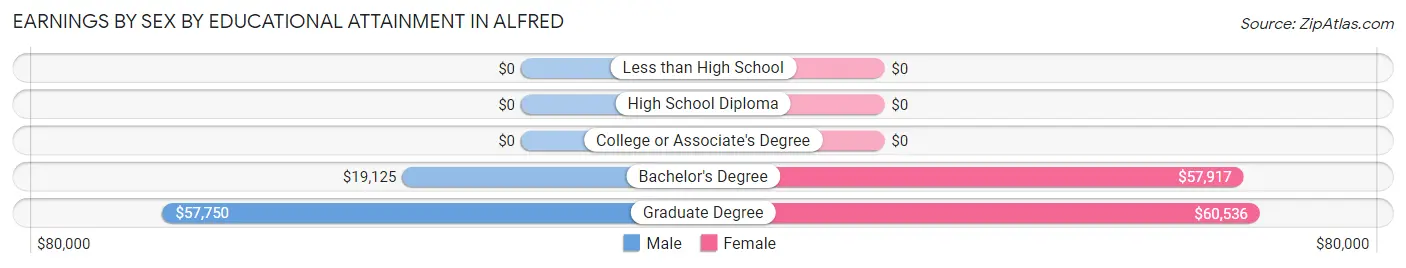
| Educational Attainment | Male Income | Female Income |
| Less than High School | - | - |
| High School Diploma | - | - |
| College or Associate's Degree | - | - |
| Bachelor's Degree | $19,125 | $57,917 |
| Graduate Degree | $57,750 | $60,536 |
| Total | $32,070 | $54,167 |
Family Income in Alfred
Family Income Brackets in Alfred
According to the Alfred family income data, there are 57 families falling into the $100,000 to $149,999 income range, which is the most common income bracket and makes up 30.2% of all families.
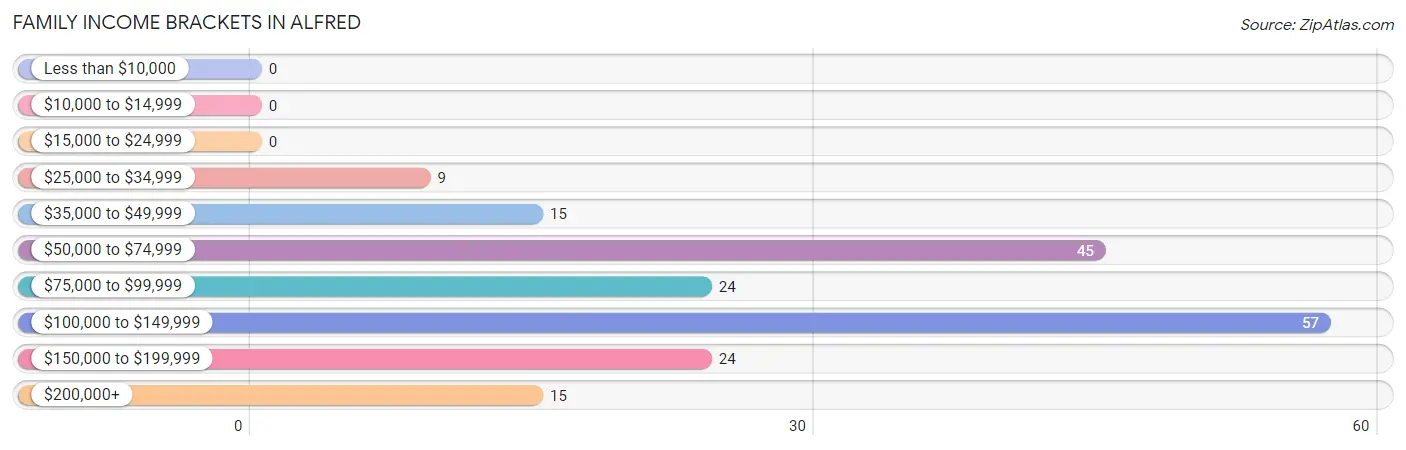
| Income Bracket | # Families | % Families |
| Less than $10,000 | 0 | 0.0% |
| $10,000 to $14,999 | 0 | 0.0% |
| $15,000 to $24,999 | 0 | 0.0% |
| $25,000 to $34,999 | 9 | 4.8% |
| $35,000 to $49,999 | 15 | 7.9% |
| $50,000 to $74,999 | 45 | 23.8% |
| $75,000 to $99,999 | 24 | 12.7% |
| $100,000 to $149,999 | 57 | 30.2% |
| $150,000 to $199,999 | 24 | 12.7% |
| $200,000+ | 15 | 7.9% |
Family Income by Famaliy Size in Alfred
2-person families (115 | 60.9%) account for the highest median family income in Alfred with $105,938 per family, while 2-person families (115 | 60.9%) have the highest median income of $52,969 per family member.
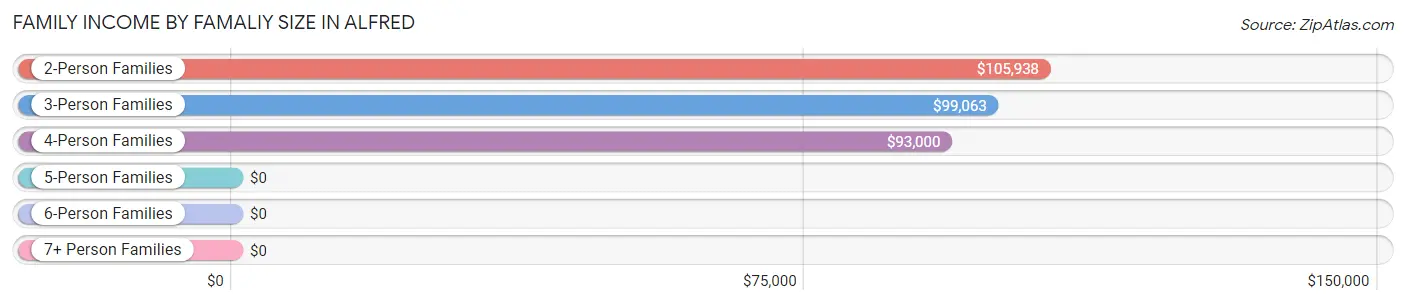
| Income Bracket | # Families | Median Income |
| 2-Person Families | 115 (60.9%) | $105,938 |
| 3-Person Families | 41 (21.7%) | $99,063 |
| 4-Person Families | 22 (11.6%) | $93,000 |
| 5-Person Families | 7 (3.7%) | $0 |
| 6-Person Families | 4 (2.1%) | $0 |
| 7+ Person Families | 0 (0.0%) | $0 |
| Total | 189 (100.0%) | $105,938 |
Family Income by Number of Earners in Alfred
The median family income in Alfred is $105,938, with families comprising 3+ earners (20) having the highest median family income of $146,429, while families with no earners (45) have the lowest median family income of $73,843, accounting for 10.6% and 23.8% of families, respectively.
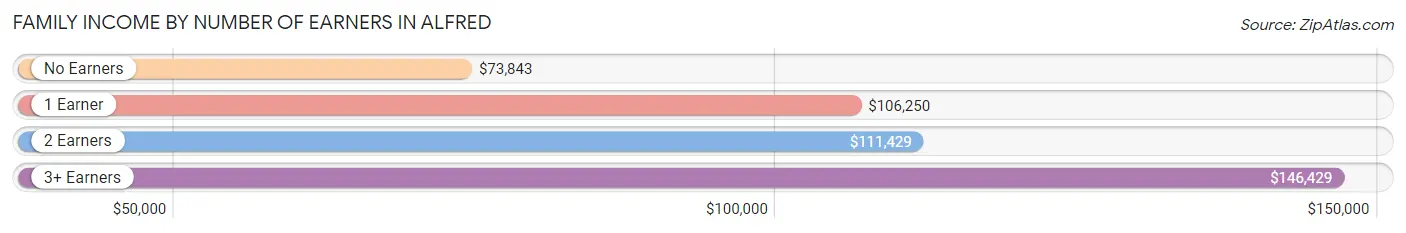
| Number of Earners | # Families | Median Income |
| No Earners | 45 (23.8%) | $73,843 |
| 1 Earner | 24 (12.7%) | $106,250 |
| 2 Earners | 100 (52.9%) | $111,429 |
| 3+ Earners | 20 (10.6%) | $146,429 |
| Total | 189 (100.0%) | $105,938 |
Household Income in Alfred
Household Income Brackets in Alfred
With 80 households falling in the category, the $50,000 to $74,999 income range is the most frequent in Alfred, accounting for 15.9% of all households. In contrast, only 20 households (4.0%) fall into the $25,000 to $34,999 income bracket, making it the least populous group.
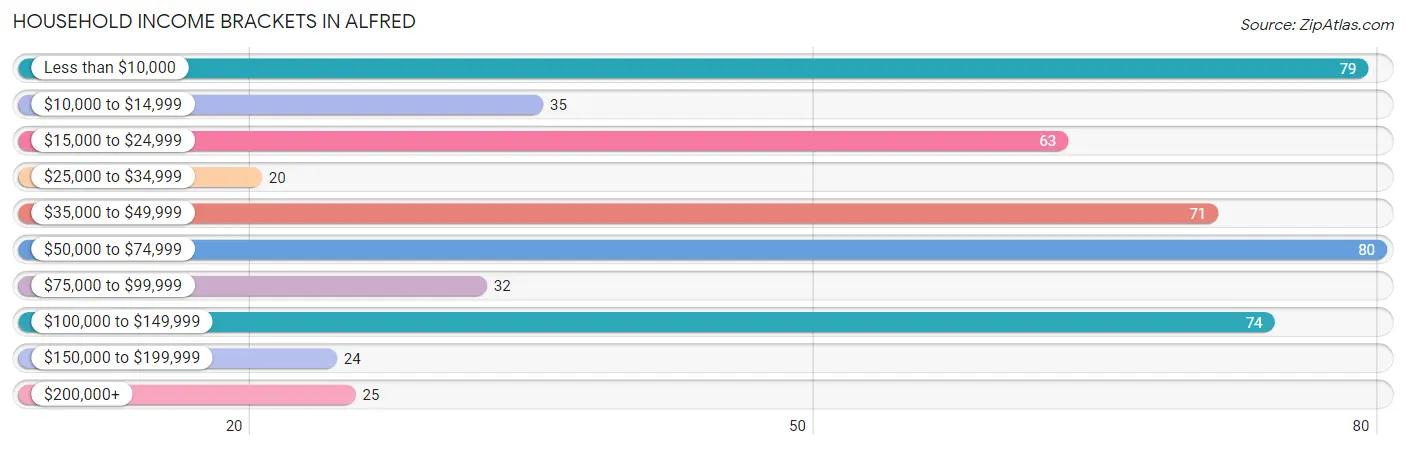
| Income Bracket | # Households | % Households |
| Less than $10,000 | 79 | 15.7% |
| $10,000 to $14,999 | 35 | 7.0% |
| $15,000 to $24,999 | 63 | 12.5% |
| $25,000 to $34,999 | 20 | 4.0% |
| $35,000 to $49,999 | 71 | 14.1% |
| $50,000 to $74,999 | 80 | 15.9% |
| $75,000 to $99,999 | 32 | 6.4% |
| $100,000 to $149,999 | 74 | 14.7% |
| $150,000 to $199,999 | 24 | 4.8% |
| $200,000+ | 25 | 5.0% |
Household Income by Householder Age in Alfred
The median household income in Alfred is $43,583, with the highest median household income of $74,375 found in the 45 to 64 years age bracket for the primary householder. A total of 113 households (22.5%) fall into this category. Meanwhile, the 15 to 24 years age bracket for the primary householder has the lowest median household income of $11,681, with 113 households (22.5%) in this group.
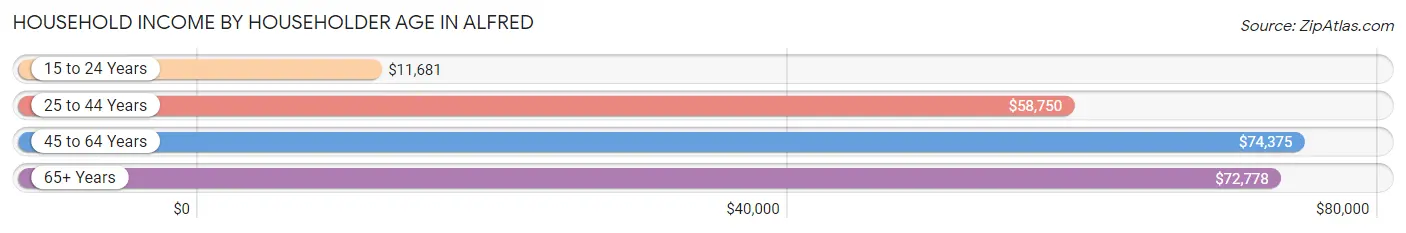
| Income Bracket | # Households | Median Income |
| 15 to 24 Years | 113 (22.5%) | $11,681 |
| 25 to 44 Years | 115 (22.9%) | $58,750 |
| 45 to 64 Years | 113 (22.5%) | $74,375 |
| 65+ Years | 162 (32.2%) | $72,778 |
| Total | 503 (100.0%) | $43,583 |
Poverty in Alfred
Income Below Poverty by Sex and Age in Alfred
With 48.4% poverty level for males and 20.6% for females among the residents of Alfred, 18 to 24 year old males and 18 to 24 year old females are the most vulnerable to poverty, with 255 males (88.2%) and 99 females (65.1%) in their respective age groups living below the poverty level.
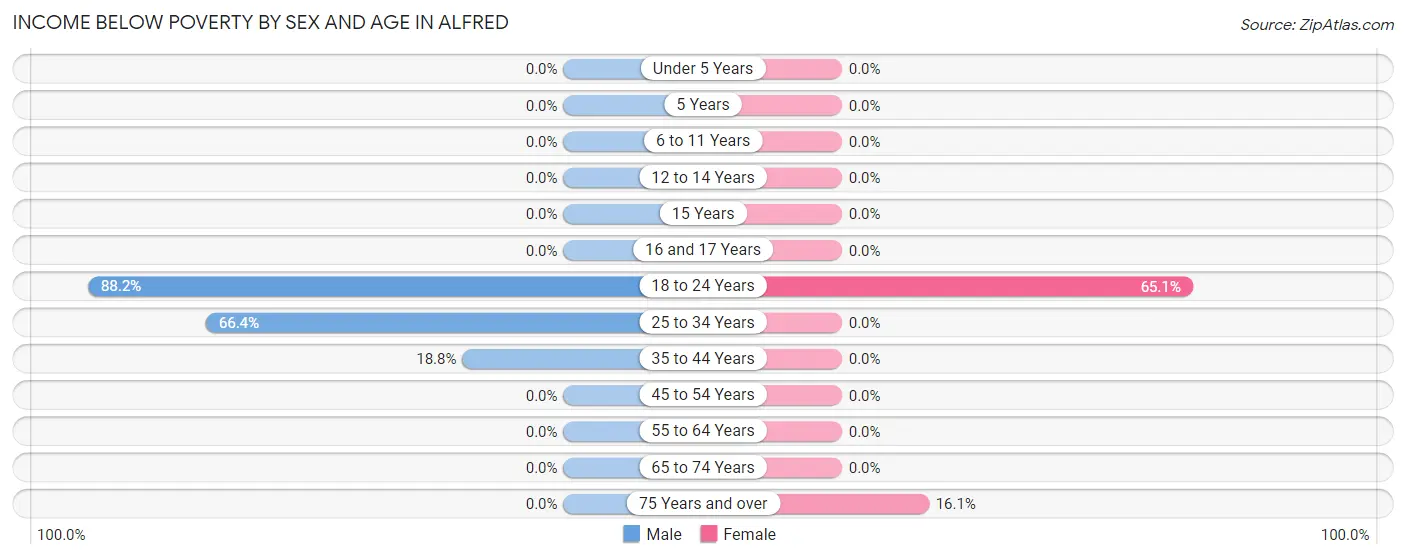
| Age Bracket | Male | Female |
| Under 5 Years | 0 (0.0%) | 0 (0.0%) |
| 5 Years | 0 (0.0%) | 0 (0.0%) |
| 6 to 11 Years | 0 (0.0%) | 0 (0.0%) |
| 12 to 14 Years | 0 (0.0%) | 0 (0.0%) |
| 15 Years | 0 (0.0%) | 0 (0.0%) |
| 16 and 17 Years | 0 (0.0%) | 0 (0.0%) |
| 18 to 24 Years | 255 (88.2%) | 99 (65.1%) |
| 25 to 34 Years | 69 (66.3%) | 0 (0.0%) |
| 35 to 44 Years | 6 (18.8%) | 0 (0.0%) |
| 45 to 54 Years | 0 (0.0%) | 0 (0.0%) |
| 55 to 64 Years | 0 (0.0%) | 0 (0.0%) |
| 65 to 74 Years | 0 (0.0%) | 0 (0.0%) |
| 75 Years and over | 0 (0.0%) | 10 (16.1%) |
| Total | 330 (48.4%) | 109 (20.6%) |
Income Above Poverty by Sex and Age in Alfred
According to the poverty statistics in Alfred, males aged under 5 years and females aged under 5 years are the age groups that are most secure financially, with 100.0% of males and 100.0% of females in these age groups living above the poverty line.
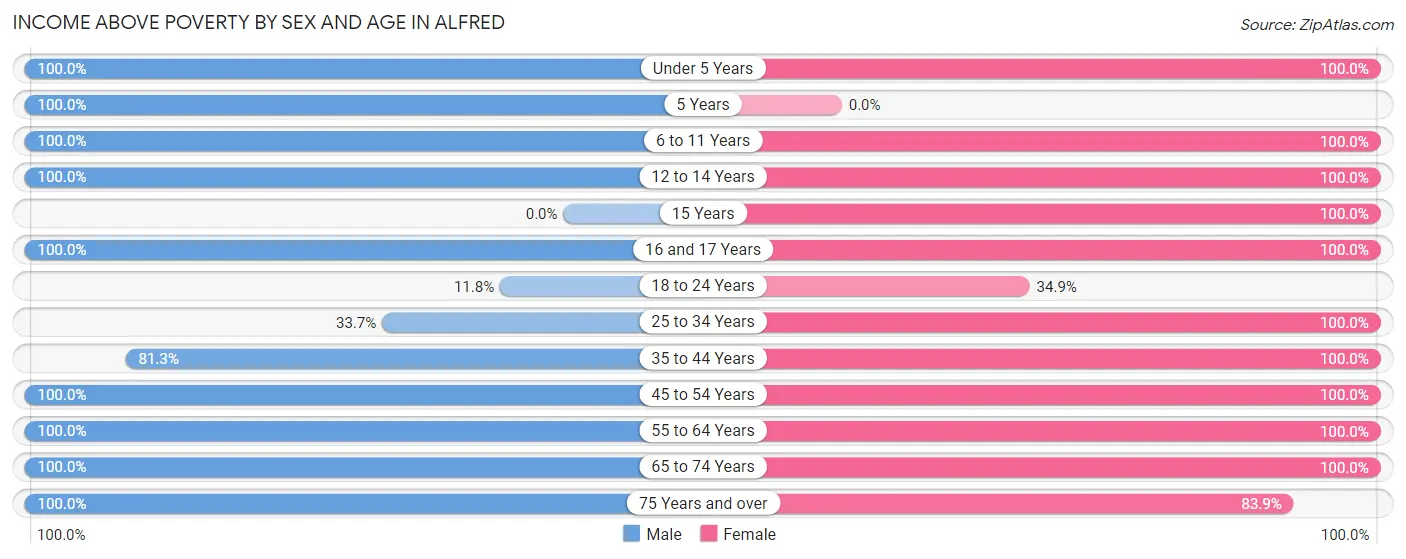
| Age Bracket | Male | Female |
| Under 5 Years | 17 (100.0%) | 4 (100.0%) |
| 5 Years | 3 (100.0%) | 0 (0.0%) |
| 6 to 11 Years | 33 (100.0%) | 20 (100.0%) |
| 12 to 14 Years | 9 (100.0%) | 7 (100.0%) |
| 15 Years | 0 (0.0%) | 5 (100.0%) |
| 16 and 17 Years | 7 (100.0%) | 9 (100.0%) |
| 18 to 24 Years | 34 (11.8%) | 53 (34.9%) |
| 25 to 34 Years | 35 (33.7%) | 47 (100.0%) |
| 35 to 44 Years | 26 (81.2%) | 26 (100.0%) |
| 45 to 54 Years | 31 (100.0%) | 40 (100.0%) |
| 55 to 64 Years | 87 (100.0%) | 52 (100.0%) |
| 65 to 74 Years | 45 (100.0%) | 105 (100.0%) |
| 75 Years and over | 25 (100.0%) | 52 (83.9%) |
| Total | 352 (51.6%) | 420 (79.4%) |
Income Below Poverty Among Married-Couple Families in Alfred
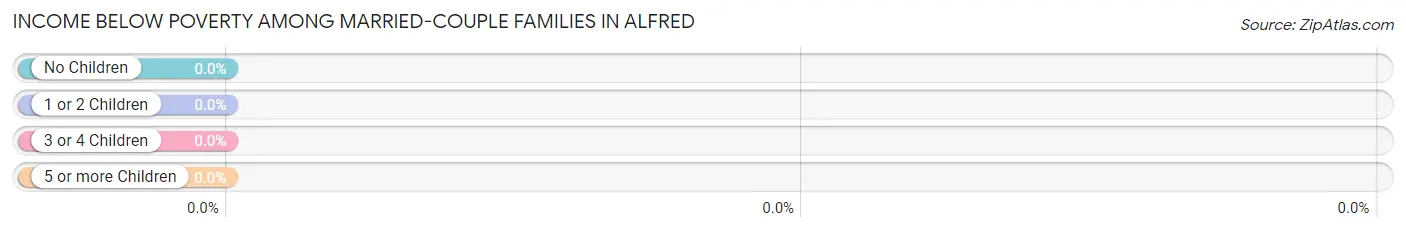
| Children | Above Poverty | Below Poverty |
| No Children | 123 (100.0%) | 0 (0.0%) |
| 1 or 2 Children | 50 (100.0%) | 0 (0.0%) |
| 3 or 4 Children | 7 (100.0%) | 0 (0.0%) |
| 5 or more Children | 0 (0.0%) | 0 (0.0%) |
| Total | 180 (100.0%) | 0 (0.0%) |
Income Below Poverty Among Single-Parent Households in Alfred
| Children | Single Father | Single Mother |
| No Children | 0 (0.0%) | 0 (0.0%) |
| 1 or 2 Children | 0 (0.0%) | 0 (0.0%) |
| 3 or 4 Children | 0 (0.0%) | 0 (0.0%) |
| 5 or more Children | 0 (0.0%) | 0 (0.0%) |
| Total | 0 (0.0%) | 0 (0.0%) |
Income Below Poverty Among Married-Couple vs Single-Parent Households in Alfred
| Children | Married-Couple Families | Single-Parent Households |
| No Children | 0 (0.0%) | 0 (0.0%) |
| 1 or 2 Children | 0 (0.0%) | 0 (0.0%) |
| 3 or 4 Children | 0 (0.0%) | 0 (0.0%) |
| 5 or more Children | 0 (0.0%) | 0 (0.0%) |
| Total | 0 (0.0%) | 0 (0.0%) |
Race in Alfred
The most populous races in Alfred are White / Caucasian (3,440 | 75.2%), Black / African American (540 | 11.8%), and Hispanic or Latino (504 | 11.0%).
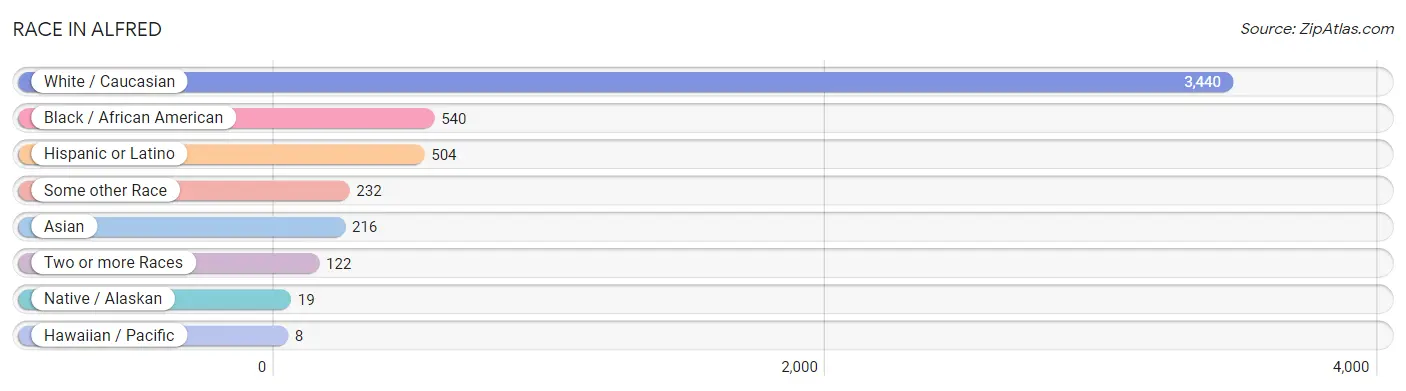
| Race | # Population | % Population |
| Asian | 216 | 4.7% |
| Black / African American | 540 | 11.8% |
| Hawaiian / Pacific | 8 | 0.2% |
| Hispanic or Latino | 504 | 11.0% |
| Native / Alaskan | 19 | 0.4% |
| White / Caucasian | 3,440 | 75.2% |
| Two or more Races | 122 | 2.7% |
| Some other Race | 232 | 5.1% |
| Total | 4,577 | 100.0% |
Ancestry in Alfred
The most populous ancestries reported in Alfred are German (632 | 13.8%), Irish (444 | 9.7%), English (169 | 3.7%), Italian (135 | 2.9%), and Indian (Asian) (114 | 2.5%), together accounting for 32.6% of all Alfred residents.
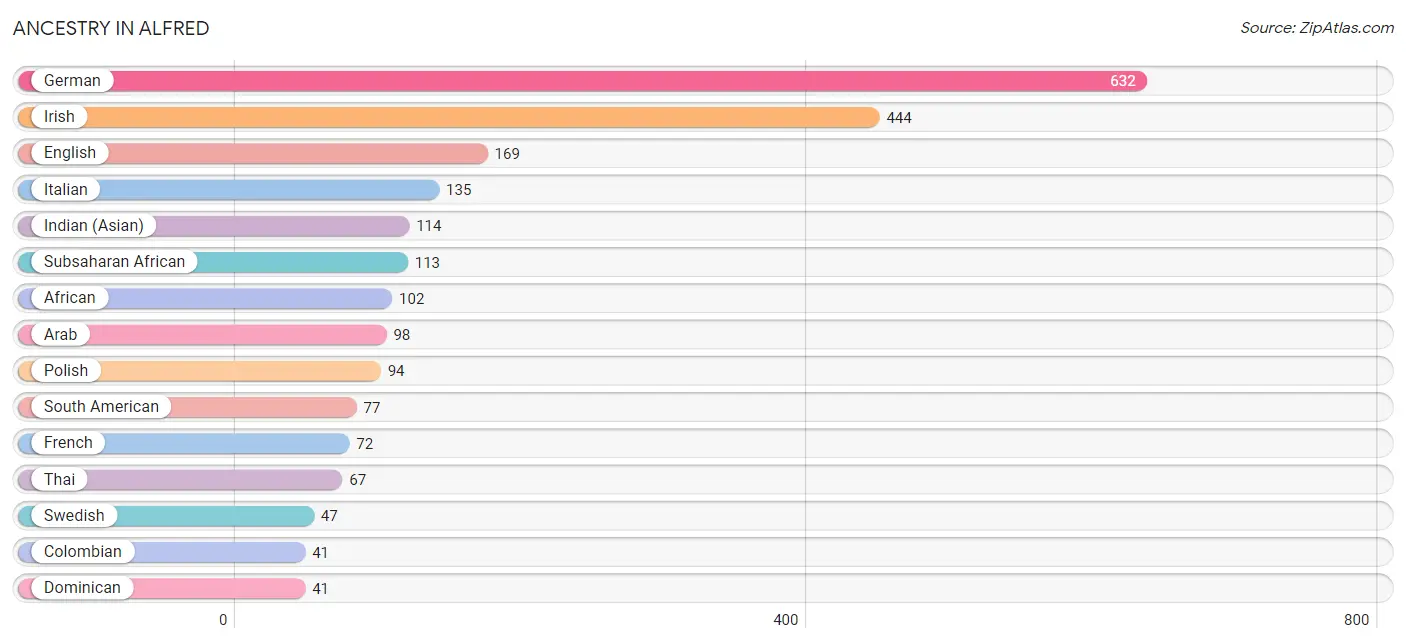
| Ancestry | # Population | % Population |
| African | 102 | 2.2% |
| American | 22 | 0.5% |
| Arab | 98 | 2.1% |
| Australian | 11 | 0.2% |
| Barbadian | 7 | 0.2% |
| Bolivian | 1 | 0.0% |
| British | 11 | 0.2% |
| Burmese | 8 | 0.2% |
| Central American | 26 | 0.6% |
| Colombian | 41 | 0.9% |
| Croatian | 4 | 0.1% |
| Cuban | 10 | 0.2% |
| Czech | 10 | 0.2% |
| Czechoslovakian | 10 | 0.2% |
| Dominican | 41 | 0.9% |
| Dutch | 32 | 0.7% |
| Eastern European | 4 | 0.1% |
| Ecuadorian | 35 | 0.8% |
| Egyptian | 28 | 0.6% |
| English | 169 | 3.7% |
| Estonian | 12 | 0.3% |
| European | 25 | 0.5% |
| Finnish | 8 | 0.2% |
| French | 72 | 1.6% |
| French Canadian | 12 | 0.3% |
| German | 632 | 13.8% |
| Ghanaian | 5 | 0.1% |
| Guatemalan | 6 | 0.1% |
| Haitian | 5 | 0.1% |
| Honduran | 20 | 0.4% |
| Hungarian | 4 | 0.1% |
| Indian (Asian) | 114 | 2.5% |
| Indonesian | 4 | 0.1% |
| Irish | 444 | 9.7% |
| Italian | 135 | 2.9% |
| Jamaican | 14 | 0.3% |
| Korean | 31 | 0.7% |
| Lebanese | 16 | 0.4% |
| Lithuanian | 4 | 0.1% |
| Mexican | 26 | 0.6% |
| Native Hawaiian | 5 | 0.1% |
| Nigerian | 6 | 0.1% |
| Northern European | 4 | 0.1% |
| Norwegian | 3 | 0.1% |
| Polish | 94 | 2.1% |
| Portuguese | 7 | 0.2% |
| Puerto Rican | 10 | 0.2% |
| Romanian | 3 | 0.1% |
| Russian | 27 | 0.6% |
| Scotch-Irish | 9 | 0.2% |
| Scottish | 25 | 0.5% |
| Slovak | 3 | 0.1% |
| South American | 77 | 1.7% |
| Spaniard | 32 | 0.7% |
| Spanish | 5 | 0.1% |
| Subsaharan African | 113 | 2.5% |
| Swedish | 47 | 1.0% |
| Swiss | 17 | 0.4% |
| Syrian | 16 | 0.4% |
| Thai | 67 | 1.5% |
| Trinidadian and Tobagonian | 6 | 0.1% |
| Turkish | 2 | 0.0% |
| Ukrainian | 16 | 0.4% |
| Welsh | 32 | 0.7% |
| West Indian | 11 | 0.2% | View All 65 Rows |
Immigrants in Alfred
The most numerous immigrant groups reported in Alfred came from Asia (186 | 4.1%), Eastern Asia (79 | 1.7%), China (70 | 1.5%), Africa (69 | 1.5%), and Western Asia (54 | 1.2%), together accounting for 10.0% of all Alfred residents.
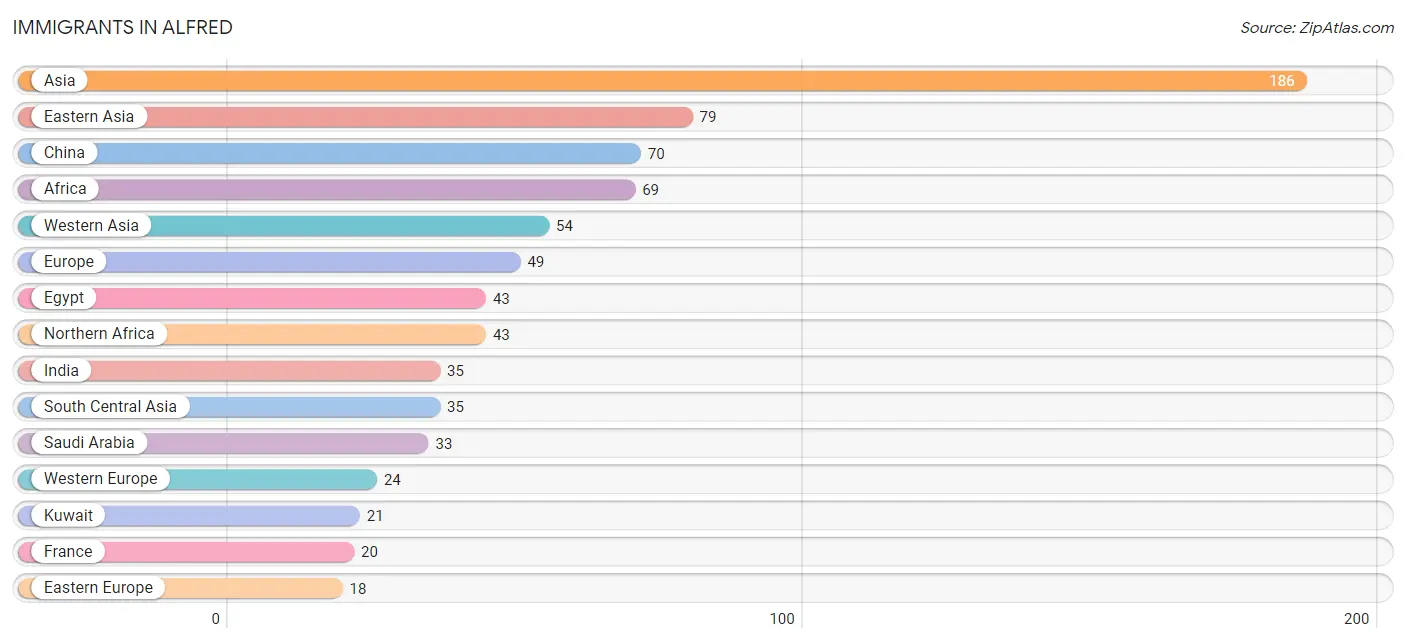
| Immigration Origin | # Population | % Population |
| Africa | 69 | 1.5% |
| Asia | 186 | 4.1% |
| Canada | 15 | 0.3% |
| Caribbean | 11 | 0.2% |
| China | 70 | 1.5% |
| Czechoslovakia | 11 | 0.2% |
| Eastern Asia | 79 | 1.7% |
| Eastern Europe | 18 | 0.4% |
| Ecuador | 4 | 0.1% |
| Egypt | 43 | 0.9% |
| Europe | 49 | 1.1% |
| France | 20 | 0.4% |
| Germany | 4 | 0.1% |
| Hungary | 4 | 0.1% |
| India | 35 | 0.8% |
| Jamaica | 11 | 0.2% |
| Korea | 9 | 0.2% |
| Kuwait | 21 | 0.5% |
| Latin America | 15 | 0.3% |
| Northern Africa | 43 | 0.9% |
| Northern Europe | 7 | 0.2% |
| Oceania | 9 | 0.2% |
| Philippines | 10 | 0.2% |
| Romania | 3 | 0.1% |
| Saudi Arabia | 33 | 0.7% |
| South Africa | 9 | 0.2% |
| South America | 4 | 0.1% |
| South Central Asia | 35 | 0.8% |
| South Eastern Asia | 18 | 0.4% |
| Taiwan | 4 | 0.1% |
| Western Africa | 17 | 0.4% |
| Western Asia | 54 | 1.2% |
| Western Europe | 24 | 0.5% | View All 33 Rows |
Sex and Age in Alfred
Sex and Age in Alfred
The most populous age groups in Alfred are 15 to 19 Years (1,110 | 44.1%) for men and 15 to 19 Years (943 | 45.8%) for women.
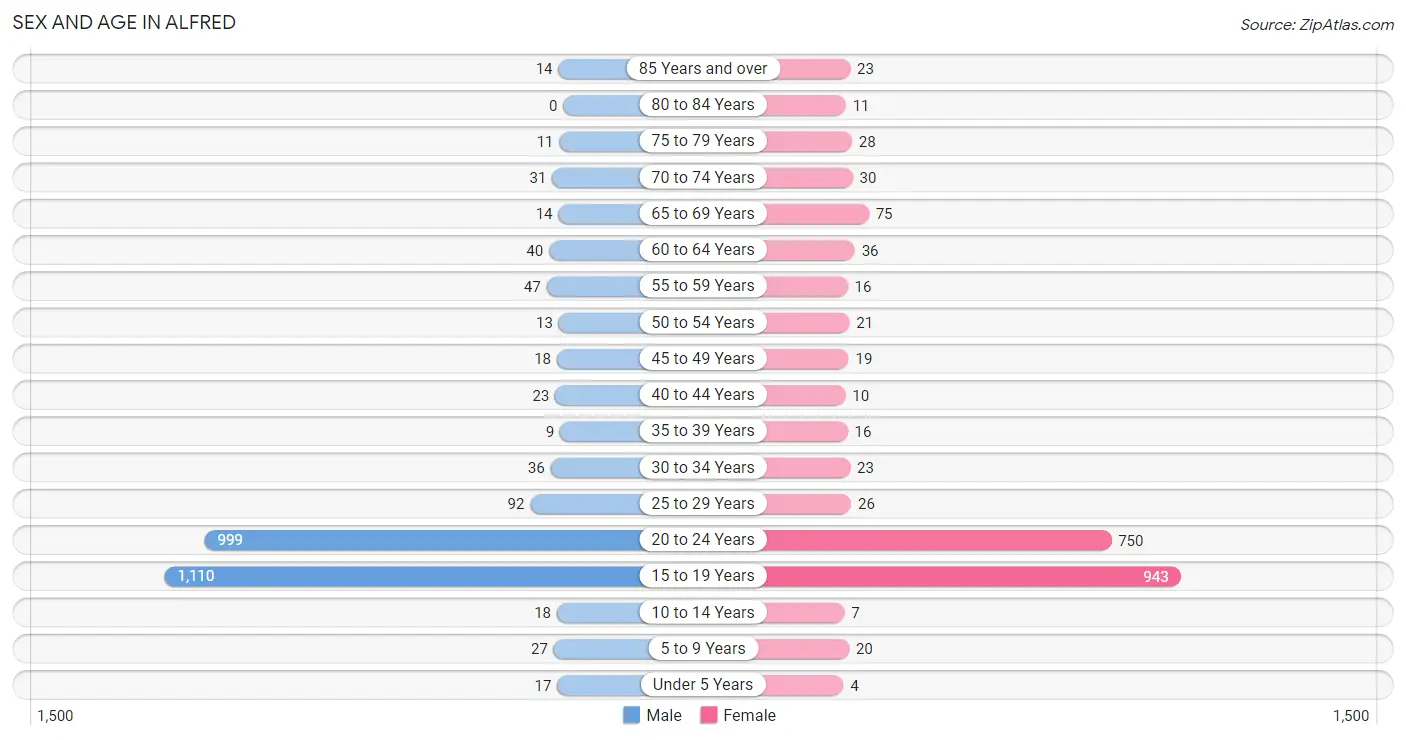
| Age Bracket | Male | Female |
| Under 5 Years | 17 (0.7%) | 4 (0.2%) |
| 5 to 9 Years | 27 (1.1%) | 20 (1.0%) |
| 10 to 14 Years | 18 (0.7%) | 7 (0.3%) |
| 15 to 19 Years | 1,110 (44.1%) | 943 (45.8%) |
| 20 to 24 Years | 999 (39.7%) | 750 (36.4%) |
| 25 to 29 Years | 92 (3.6%) | 26 (1.3%) |
| 30 to 34 Years | 36 (1.4%) | 23 (1.1%) |
| 35 to 39 Years | 9 (0.4%) | 16 (0.8%) |
| 40 to 44 Years | 23 (0.9%) | 10 (0.5%) |
| 45 to 49 Years | 18 (0.7%) | 19 (0.9%) |
| 50 to 54 Years | 13 (0.5%) | 21 (1.0%) |
| 55 to 59 Years | 47 (1.9%) | 16 (0.8%) |
| 60 to 64 Years | 40 (1.6%) | 36 (1.8%) |
| 65 to 69 Years | 14 (0.6%) | 75 (3.6%) |
| 70 to 74 Years | 31 (1.2%) | 30 (1.5%) |
| 75 to 79 Years | 11 (0.4%) | 28 (1.4%) |
| 80 to 84 Years | 0 (0.0%) | 11 (0.5%) |
| 85 Years and over | 14 (0.6%) | 23 (1.1%) |
| Total | 2,519 (100.0%) | 2,058 (100.0%) |
Families and Households in Alfred
Median Family Size in Alfred
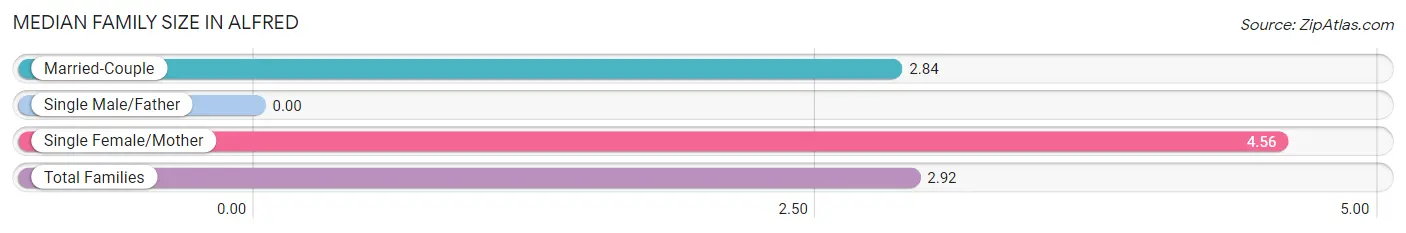
| Family Type | # Families | Family Size |
| Married-Couple | 180 (95.2%) | 2.84 |
| Single Male/Father | 0 (0.0%) | - |
| Single Female/Mother | 9 (4.8%) | 4.56 |
| Total Families | 189 (100.0%) | 2.92 |
Median Household Size in Alfred
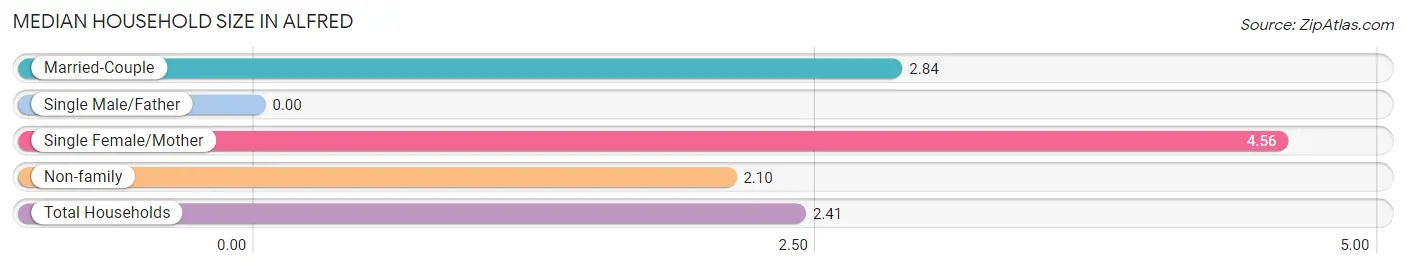
| Household Type | # Households | Household Size |
| Married-Couple | 180 (35.8%) | 2.84 |
| Single Male/Father | 0 (0.0%) | - |
| Single Female/Mother | 9 (1.8%) | 4.56 |
| Non-family | 314 (62.4%) | 2.10 |
| Total Households | 503 (100.0%) | 2.41 |
Household Size by Marriage Status in Alfred
Out of a total of 503 households in Alfred, 189 (37.6%) are family households, while 314 (62.4%) are nonfamily households. The most numerous type of family households are 2-person households, comprising 115, and the most common type of nonfamily households are 1-person households, comprising 221.
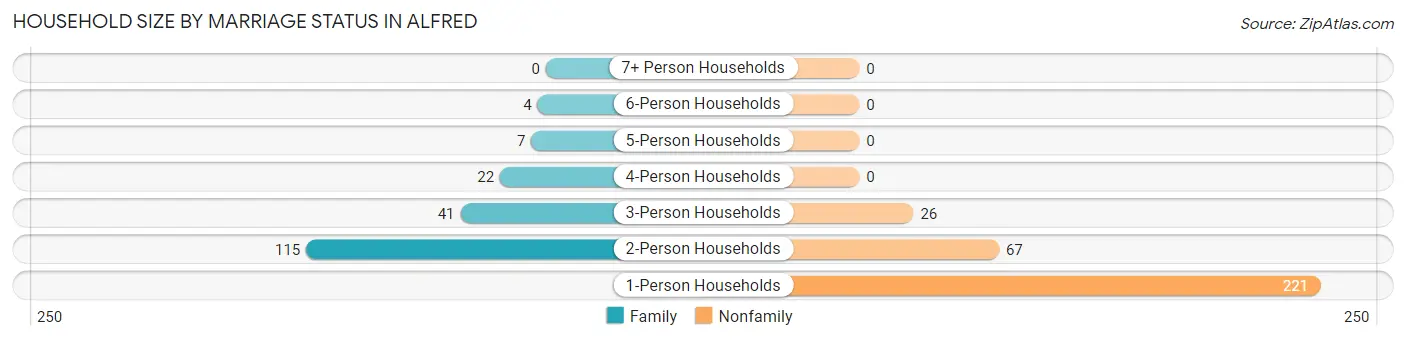
| Household Size | Family Households | Nonfamily Households |
| 1-Person Households | - | 221 (43.9%) |
| 2-Person Households | 115 (22.9%) | 67 (13.3%) |
| 3-Person Households | 41 (8.2%) | 26 (5.2%) |
| 4-Person Households | 22 (4.4%) | 0 (0.0%) |
| 5-Person Households | 7 (1.4%) | 0 (0.0%) |
| 6-Person Households | 4 (0.8%) | 0 (0.0%) |
| 7+ Person Households | 0 (0.0%) | 0 (0.0%) |
| Total | 189 (37.6%) | 314 (62.4%) |
Female Fertility in Alfred
Fertility by Age in Alfred
Average fertility rate in Alfred is 10.0 births per 1,000 women. Women in the age bracket of 35 to 50 years have the highest fertility rate with 180.0 births per 1,000 women. Women in the age bracket of 20 to 34 years acount for 50.0% of all women with births.
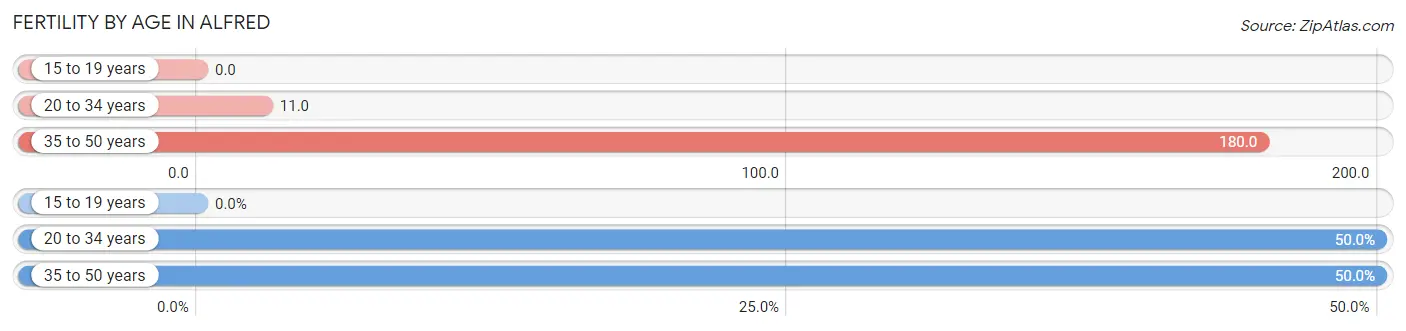
| Age Bracket | Women with Births | Births / 1,000 Women |
| 15 to 19 years | 0 (0.0%) | 0.0 |
| 20 to 34 years | 9 (50.0%) | 11.0 |
| 35 to 50 years | 9 (50.0%) | 180.0 |
| Total | 18 (100.0%) | 10.0 |
Fertility by Age by Marriage Status in Alfred
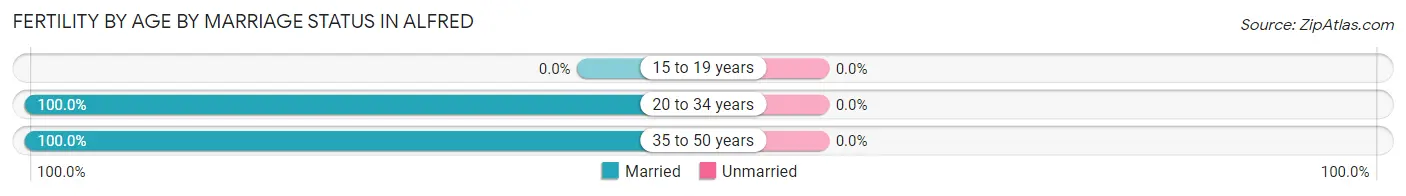
| Age Bracket | Married | Unmarried |
| 15 to 19 years | 0 (0.0%) | 0 (0.0%) |
| 20 to 34 years | 9 (100.0%) | 0 (0.0%) |
| 35 to 50 years | 9 (100.0%) | 0 (0.0%) |
| Total | 18 (100.0%) | 0 (0.0%) |
Fertility by Education in Alfred
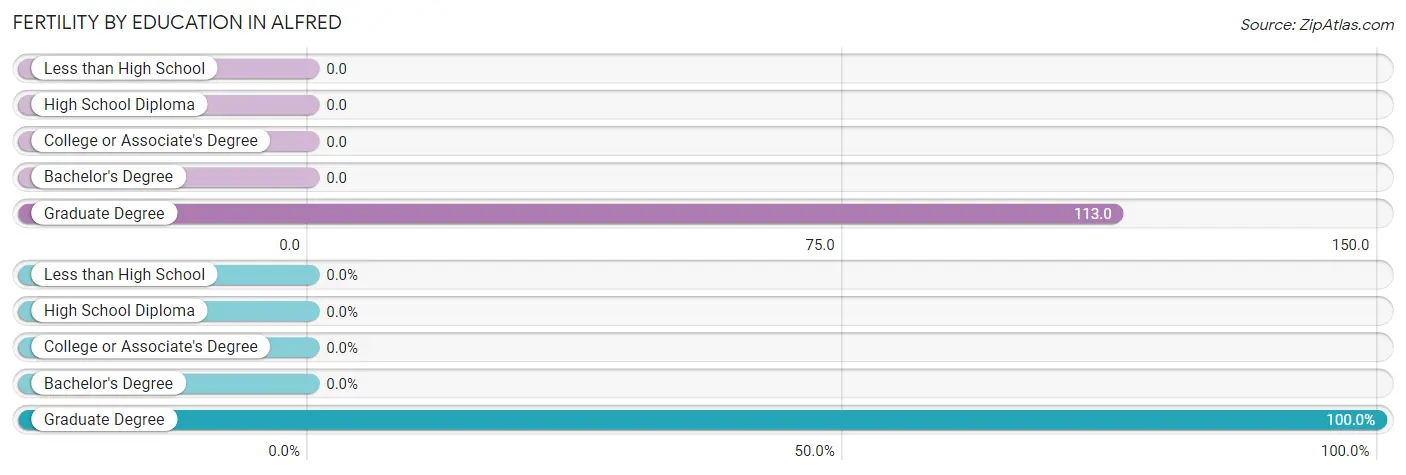
| Educational Attainment | Women with Births | Births / 1,000 Women |
| Less than High School | 0 (0.0%) | 0.0 |
| High School Diploma | 0 (0.0%) | 0.0 |
| College or Associate's Degree | 0 (0.0%) | 0.0 |
| Bachelor's Degree | 0 (0.0%) | 0.0 |
| Graduate Degree | 18 (100.0%) | 113.0 |
| Total | 18 (100.0%) | 10.0 |
Fertility by Education by Marriage Status in Alfred
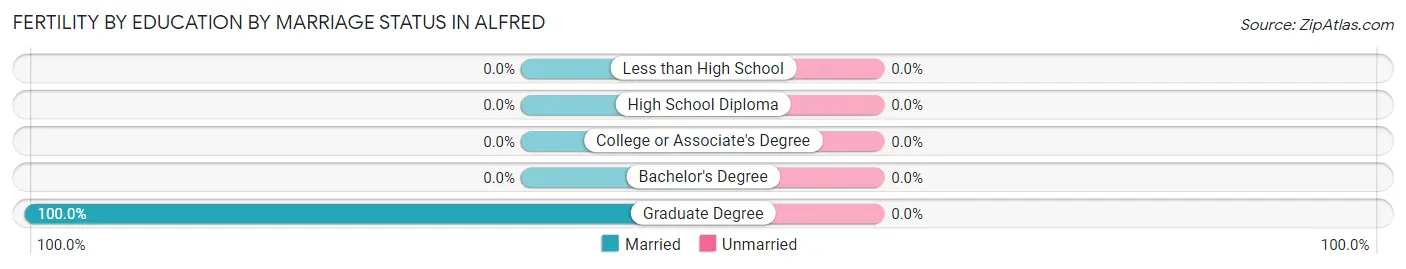
| Educational Attainment | Married | Unmarried |
| Less than High School | 0 (0.0%) | 0 (0.0%) |
| High School Diploma | 0 (0.0%) | 0 (0.0%) |
| College or Associate's Degree | 0 (0.0%) | 0 (0.0%) |
| Bachelor's Degree | 0 (0.0%) | 0 (0.0%) |
| Graduate Degree | 18 (100.0%) | 0 (0.0%) |
| Total | 18 (100.0%) | 0 (0.0%) |
Employment Characteristics in Alfred
Employment by Class of Employer in Alfred
Among the 1,334 employed individuals in Alfred, private company employees (637 | 47.7%), not-for-profit organizations (371 | 27.8%), and state government employees (198 | 14.8%) make up the most common classes of employment.
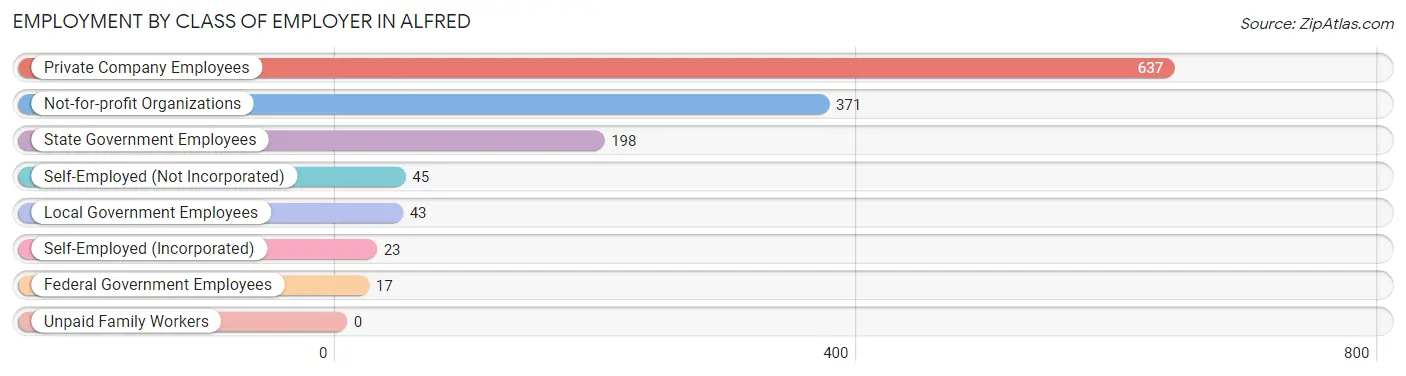
| Employer Class | # Employees | % Employees |
| Private Company Employees | 637 | 47.7% |
| Self-Employed (Incorporated) | 23 | 1.7% |
| Self-Employed (Not Incorporated) | 45 | 3.4% |
| Not-for-profit Organizations | 371 | 27.8% |
| Local Government Employees | 43 | 3.2% |
| State Government Employees | 198 | 14.8% |
| Federal Government Employees | 17 | 1.3% |
| Unpaid Family Workers | 0 | 0.0% |
| Total | 1,334 | 100.0% |
Employment Status by Age in Alfred
According to the labor force statistics for Alfred, out of the total population over 16 years of age (4,479), 40.5% or 1,814 individuals are in the labor force, with 16.4% or 297 of them unemployed. The age group with the highest labor force participation rate is 45 to 54 years, with 100.0% or 71 individuals in the labor force. Within the labor force, the 20 to 24 years age range has the highest percentage of unemployed individuals, with 20.3% or 186 of them being unemployed.
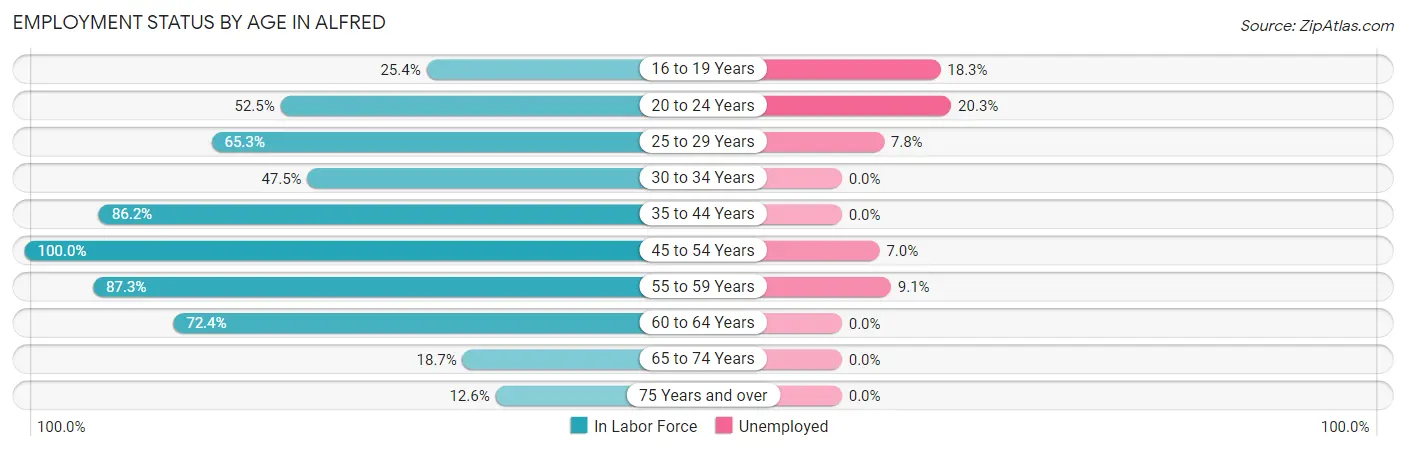
| Age Bracket | In Labor Force | Unemployed |
| 16 to 19 Years | 520 (25.4%) | 95 (18.3%) |
| 20 to 24 Years | 918 (52.5%) | 186 (20.3%) |
| 25 to 29 Years | 77 (65.3%) | 6 (7.8%) |
| 30 to 34 Years | 28 (47.5%) | 0 (0.0%) |
| 35 to 44 Years | 50 (86.2%) | 0 (0.0%) |
| 45 to 54 Years | 71 (100.0%) | 5 (7.0%) |
| 55 to 59 Years | 55 (87.3%) | 5 (9.1%) |
| 60 to 64 Years | 55 (72.4%) | 0 (0.0%) |
| 65 to 74 Years | 28 (18.7%) | 0 (0.0%) |
| 75 Years and over | 11 (12.6%) | 0 (0.0%) |
| Total | 1,814 (40.5%) | 297 (16.4%) |
Employment Status by Educational Attainment in Alfred
According to labor force statistics for Alfred, 75.5% of individuals (336) out of the total population between 25 and 64 years of age (445) are in the labor force, with 4.8% or 16 of them being unemployed. The group with the highest labor force participation rate are those with the educational attainment of high school diploma, with 100.0% or 6 individuals in the labor force. Within the labor force, individuals with less than high school education have the highest percentage of unemployment, with 22.7% or 5 of them being unemployed.
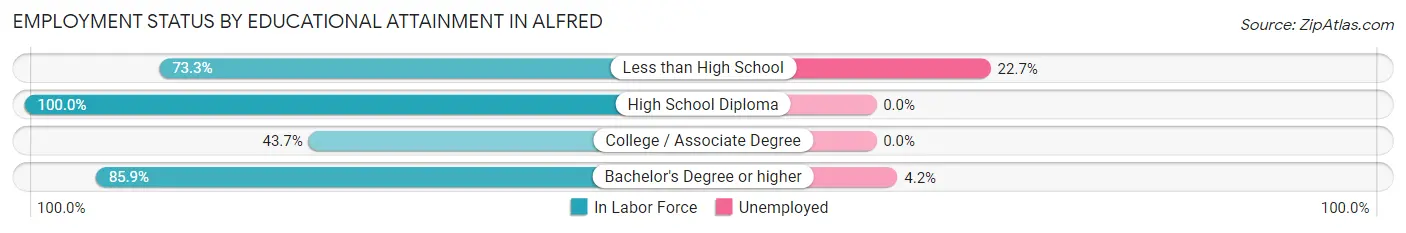
| Educational Attainment | In Labor Force | Unemployed |
| Less than High School | 22 (73.3%) | 7 (22.7%) |
| High School Diploma | 6 (100.0%) | 0 (0.0%) |
| College / Associate Degree | 45 (43.7%) | 0 (0.0%) |
| Bachelor's Degree or higher | 263 (85.9%) | 13 (4.2%) |
| Total | 336 (75.5%) | 21 (4.8%) |
Employment Occupations by Sex in Alfred
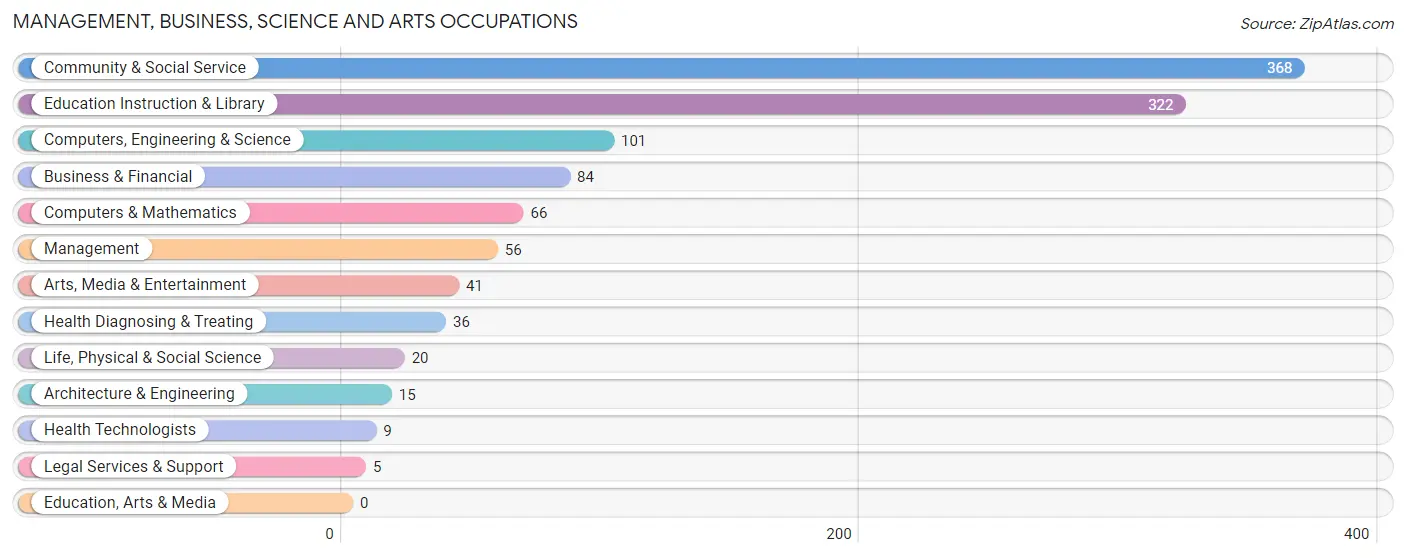
Management, Business, Science and Arts Occupations
The most common Management, Business, Science and Arts occupations in Alfred are Community & Social Service (368 | 24.3%), Education Instruction & Library (322 | 21.2%), Computers, Engineering & Science (101 | 6.7%), Business & Financial (84 | 5.5%), and Computers & Mathematics (66 | 4.3%).
Management, Business, Science and Arts Occupations by Sex
Within the Management, Business, Science and Arts occupations in Alfred, the most male-oriented occupations are Life, Physical & Social Science (100.0%), Legal Services & Support (100.0%), and Business & Financial (76.2%), while the most female-oriented occupations are Arts, Media & Entertainment (65.8%), Education Instruction & Library (62.1%), and Community & Social Service (61.7%).
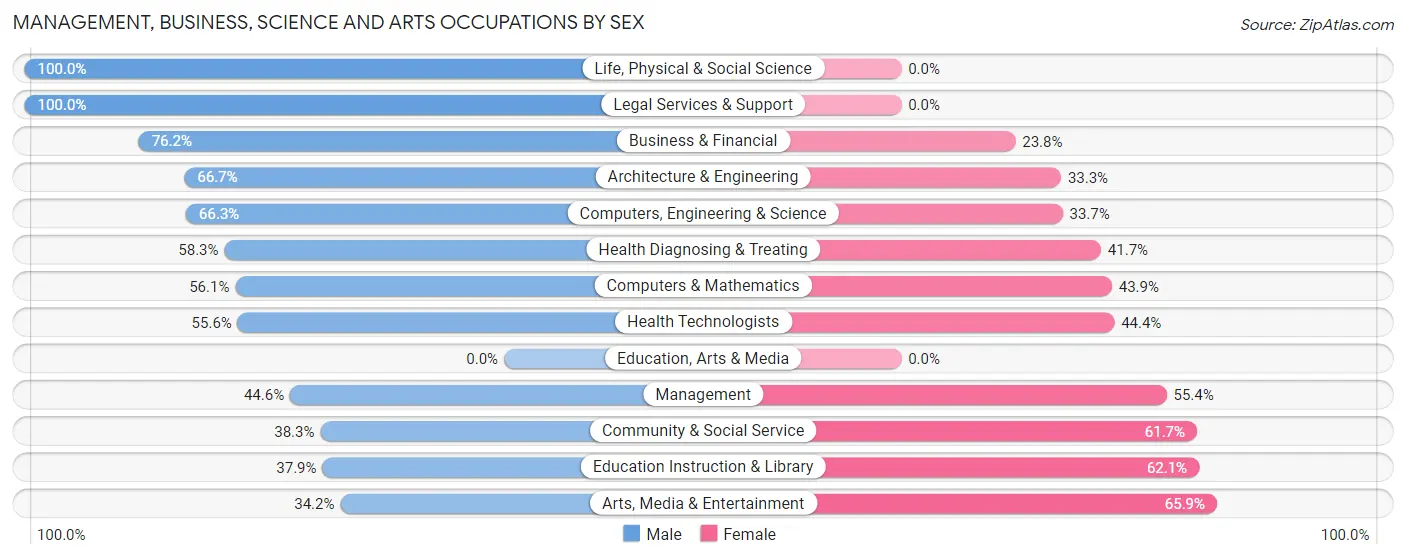
| Occupation | Male | Female |
| Management | 25 (44.6%) | 31 (55.4%) |
| Business & Financial | 64 (76.2%) | 20 (23.8%) |
| Computers, Engineering & Science | 67 (66.3%) | 34 (33.7%) |
| Computers & Mathematics | 37 (56.1%) | 29 (43.9%) |
| Architecture & Engineering | 10 (66.7%) | 5 (33.3%) |
| Life, Physical & Social Science | 20 (100.0%) | 0 (0.0%) |
| Community & Social Service | 141 (38.3%) | 227 (61.7%) |
| Education, Arts & Media | 0 (0.0%) | 0 (0.0%) |
| Legal Services & Support | 5 (100.0%) | 0 (0.0%) |
| Education Instruction & Library | 122 (37.9%) | 200 (62.1%) |
| Arts, Media & Entertainment | 14 (34.2%) | 27 (65.8%) |
| Health Diagnosing & Treating | 21 (58.3%) | 15 (41.7%) |
| Health Technologists | 5 (55.6%) | 4 (44.4%) |
| Total (Category) | 318 (49.3%) | 327 (50.7%) |
| Total (Overall) | 629 (41.5%) | 887 (58.5%) |
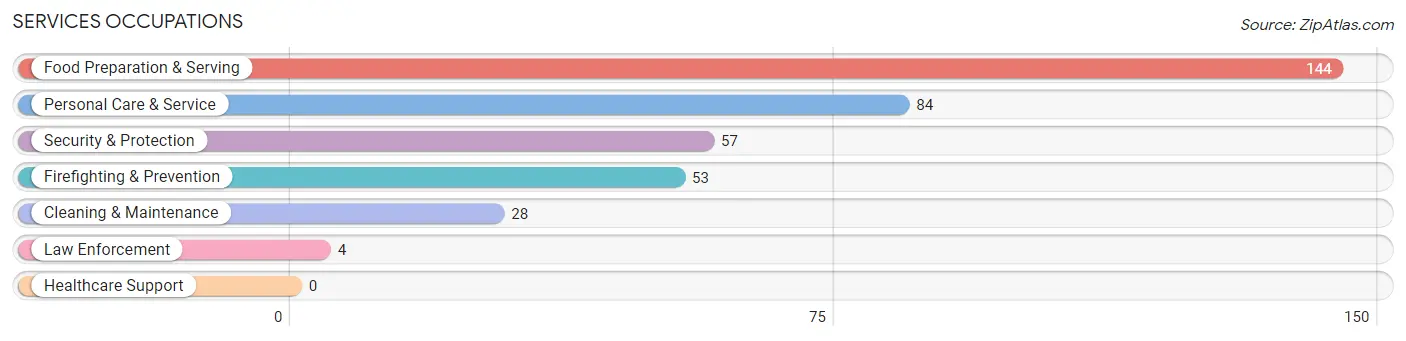
Services Occupations
The most common Services occupations in Alfred are Food Preparation & Serving (144 | 9.5%), Personal Care & Service (84 | 5.5%), Security & Protection (57 | 3.8%), Firefighting & Prevention (53 | 3.5%), and Cleaning & Maintenance (28 | 1.8%).
Services Occupations by Sex
Within the Services occupations in Alfred, the most male-oriented occupations are Firefighting & Prevention (100.0%), Security & Protection (93.0%), and Personal Care & Service (45.2%), while the most female-oriented occupations are Law Enforcement (100.0%), Cleaning & Maintenance (82.1%), and Food Preparation & Serving (63.2%).
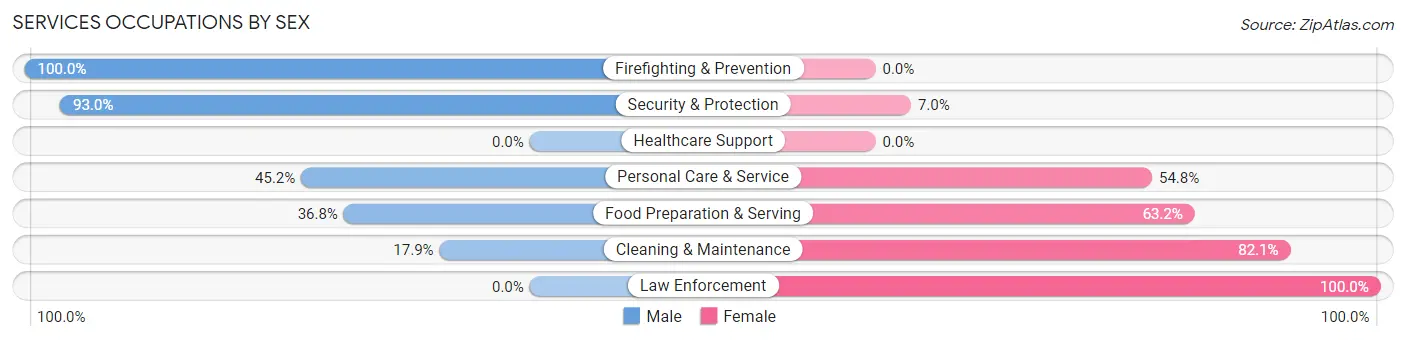
| Occupation | Male | Female |
| Healthcare Support | 0 (0.0%) | 0 (0.0%) |
| Security & Protection | 53 (93.0%) | 4 (7.0%) |
| Firefighting & Prevention | 53 (100.0%) | 0 (0.0%) |
| Law Enforcement | 0 (0.0%) | 4 (100.0%) |
| Food Preparation & Serving | 53 (36.8%) | 91 (63.2%) |
| Cleaning & Maintenance | 5 (17.9%) | 23 (82.1%) |
| Personal Care & Service | 38 (45.2%) | 46 (54.8%) |
| Total (Category) | 149 (47.6%) | 164 (52.4%) |
| Total (Overall) | 629 (41.5%) | 887 (58.5%) |
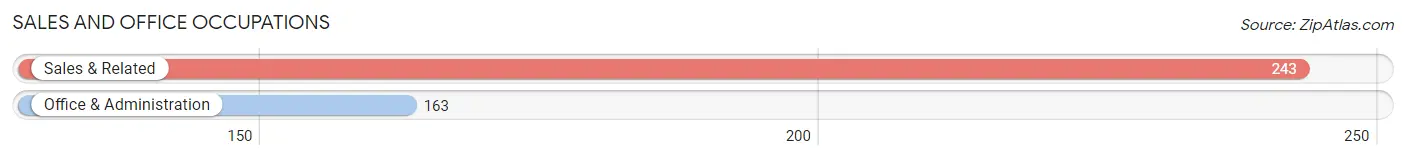
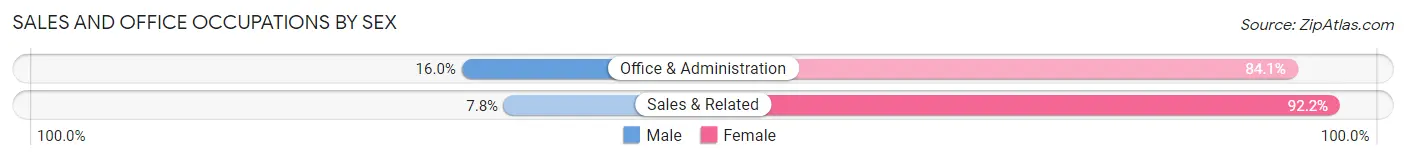
Sales and Office Occupations
The most common Sales and Office occupations in Alfred are Sales & Related (243 | 16.0%), and Office & Administration (163 | 10.7%).
Sales and Office Occupations by Sex
| Occupation | Male | Female |
| Sales & Related | 19 (7.8%) | 224 (92.2%) |
| Office & Administration | 26 (16.0%) | 137 (84.1%) |
| Total (Category) | 45 (11.1%) | 361 (88.9%) |
| Total (Overall) | 629 (41.5%) | 887 (58.5%) |
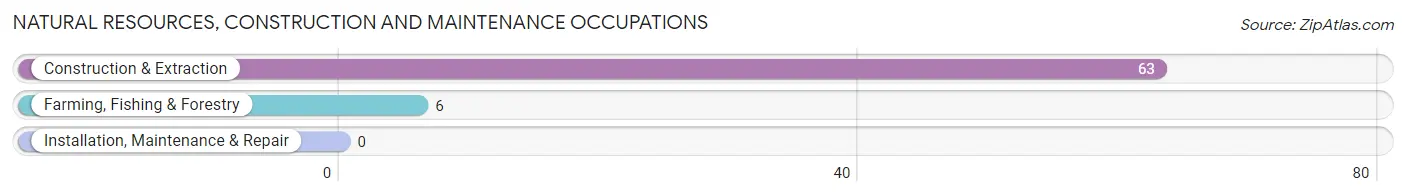
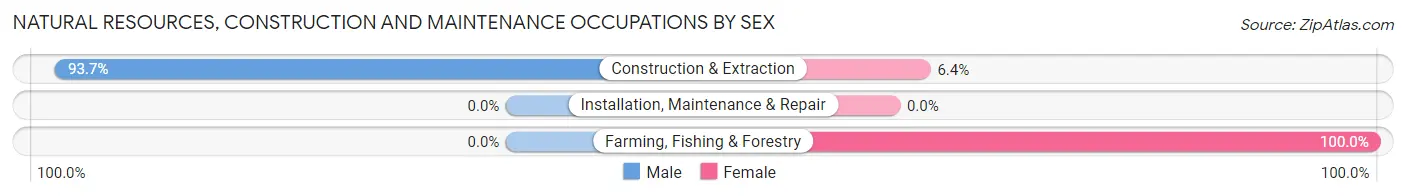
Natural Resources, Construction and Maintenance Occupations
The most common Natural Resources, Construction and Maintenance occupations in Alfred are Construction & Extraction (63 | 4.2%), and Farming, Fishing & Forestry (6 | 0.4%).
Natural Resources, Construction and Maintenance Occupations by Sex
| Occupation | Male | Female |
| Farming, Fishing & Forestry | 0 (0.0%) | 6 (100.0%) |
| Construction & Extraction | 59 (93.6%) | 4 (6.4%) |
| Installation, Maintenance & Repair | 0 (0.0%) | 0 (0.0%) |
| Total (Category) | 59 (85.5%) | 10 (14.5%) |
| Total (Overall) | 629 (41.5%) | 887 (58.5%) |
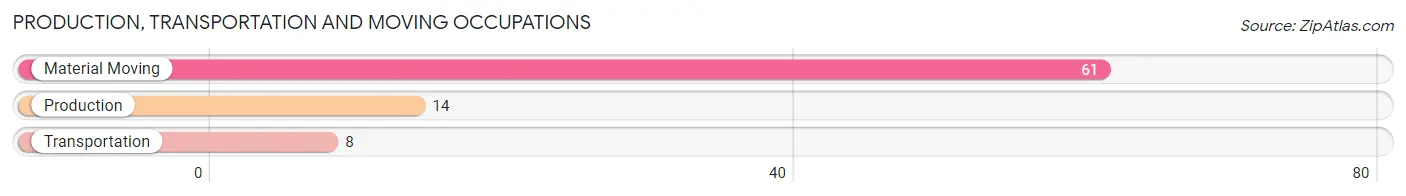
Production, Transportation and Moving Occupations
The most common Production, Transportation and Moving occupations in Alfred are Material Moving (61 | 4.0%), Production (14 | 0.9%), and Transportation (8 | 0.5%).
Production, Transportation and Moving Occupations by Sex
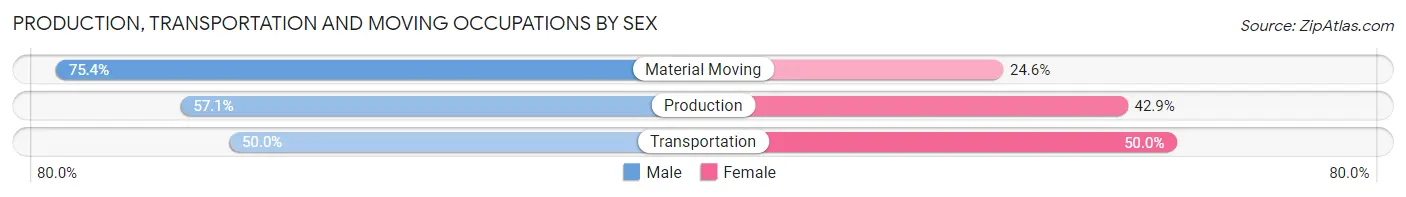
| Occupation | Male | Female |
| Production | 8 (57.1%) | 6 (42.9%) |
| Transportation | 4 (50.0%) | 4 (50.0%) |
| Material Moving | 46 (75.4%) | 15 (24.6%) |
| Total (Category) | 58 (69.9%) | 25 (30.1%) |
| Total (Overall) | 629 (41.5%) | 887 (58.5%) |
Employment Industries by Sex in Alfred
Employment Industries in Alfred
The major employment industries in Alfred include Educational Services (671 | 44.3%), Retail Trade (248 | 16.4%), Accommodation & Food Services (232 | 15.3%), Health Care & Social Assistance (72 | 4.8%), and Construction (62 | 4.1%).
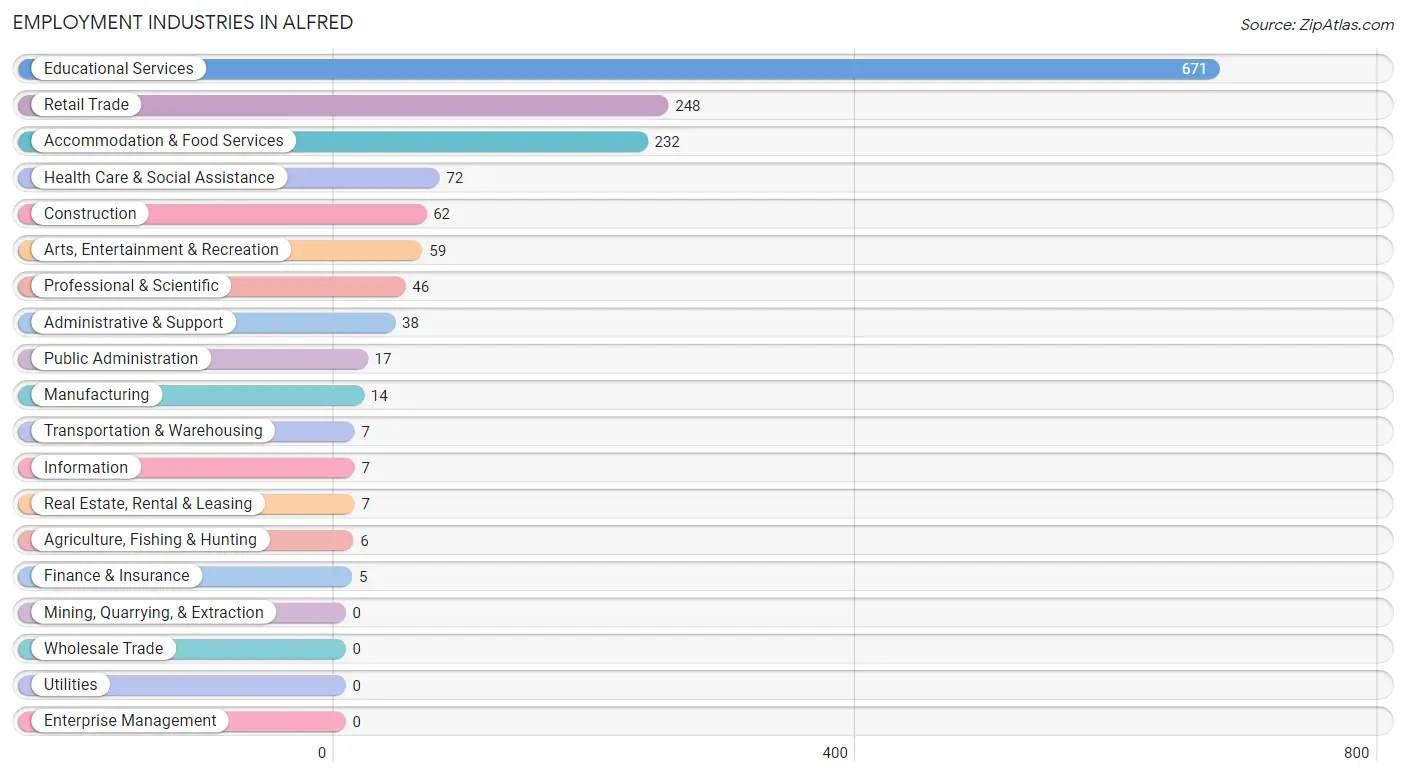
Employment Industries by Sex in Alfred
The Alfred industries that see more men than women are Construction (100.0%), Administrative & Support (100.0%), and Arts, Entertainment & Recreation (74.6%), whereas the industries that tend to have a higher number of women are Agriculture, Fishing & Hunting (100.0%), Information (100.0%), and Finance & Insurance (100.0%).
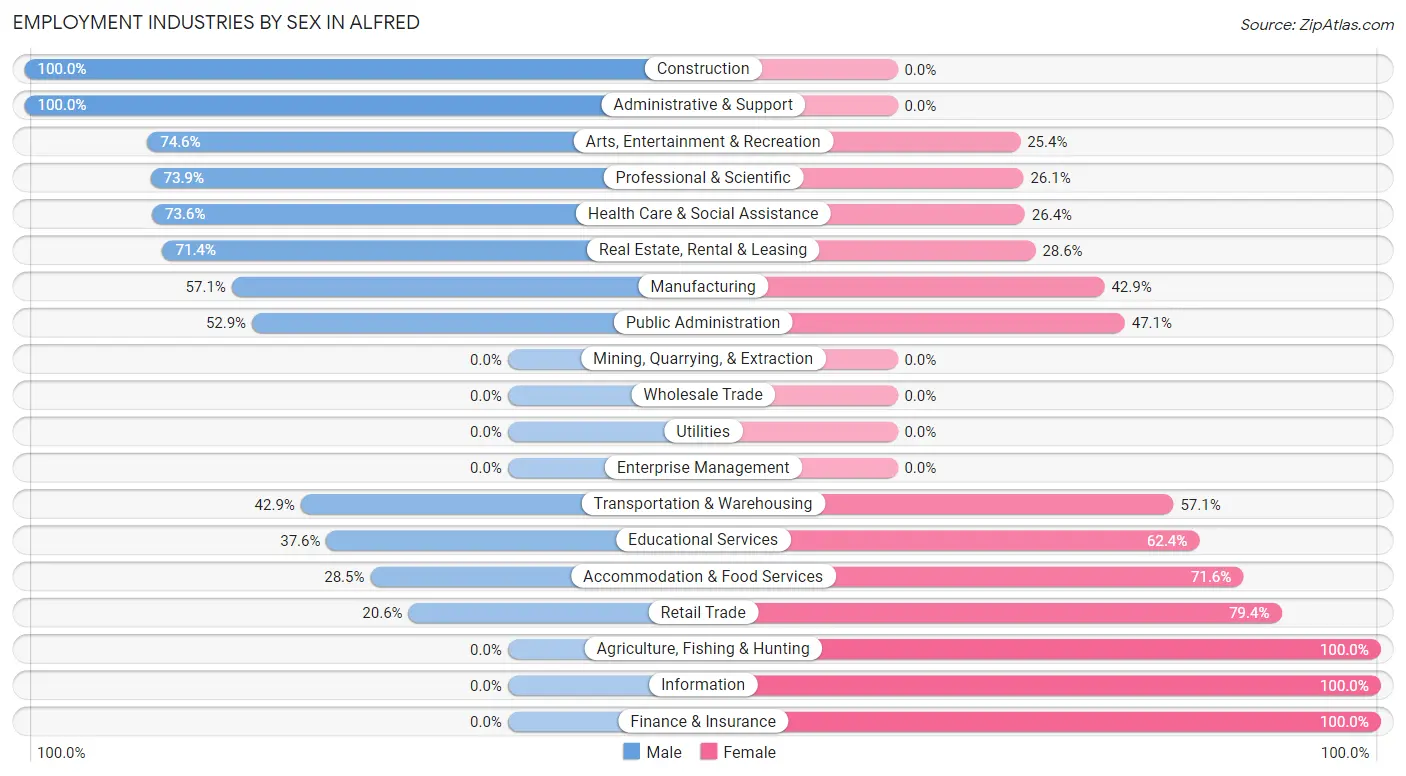
| Industry | Male | Female |
| Agriculture, Fishing & Hunting | 0 (0.0%) | 6 (100.0%) |
| Mining, Quarrying, & Extraction | 0 (0.0%) | 0 (0.0%) |
| Construction | 62 (100.0%) | 0 (0.0%) |
| Manufacturing | 8 (57.1%) | 6 (42.9%) |
| Wholesale Trade | 0 (0.0%) | 0 (0.0%) |
| Retail Trade | 51 (20.6%) | 197 (79.4%) |
| Transportation & Warehousing | 3 (42.9%) | 4 (57.1%) |
| Utilities | 0 (0.0%) | 0 (0.0%) |
| Information | 0 (0.0%) | 7 (100.0%) |
| Finance & Insurance | 0 (0.0%) | 5 (100.0%) |
| Real Estate, Rental & Leasing | 5 (71.4%) | 2 (28.6%) |
| Professional & Scientific | 34 (73.9%) | 12 (26.1%) |
| Enterprise Management | 0 (0.0%) | 0 (0.0%) |
| Administrative & Support | 38 (100.0%) | 0 (0.0%) |
| Educational Services | 252 (37.6%) | 419 (62.4%) |
| Health Care & Social Assistance | 53 (73.6%) | 19 (26.4%) |
| Arts, Entertainment & Recreation | 44 (74.6%) | 15 (25.4%) |
| Accommodation & Food Services | 66 (28.4%) | 166 (71.6%) |
| Public Administration | 9 (52.9%) | 8 (47.1%) |
| Total | 629 (41.5%) | 887 (58.5%) |
Education in Alfred
School Enrollment in Alfred
The most common levels of schooling among the 3,795 students in Alfred are college / undergraduate (3,591 | 94.6%), graduate / professional (116 | 3.1%), and elementary school (39 | 1.0%).
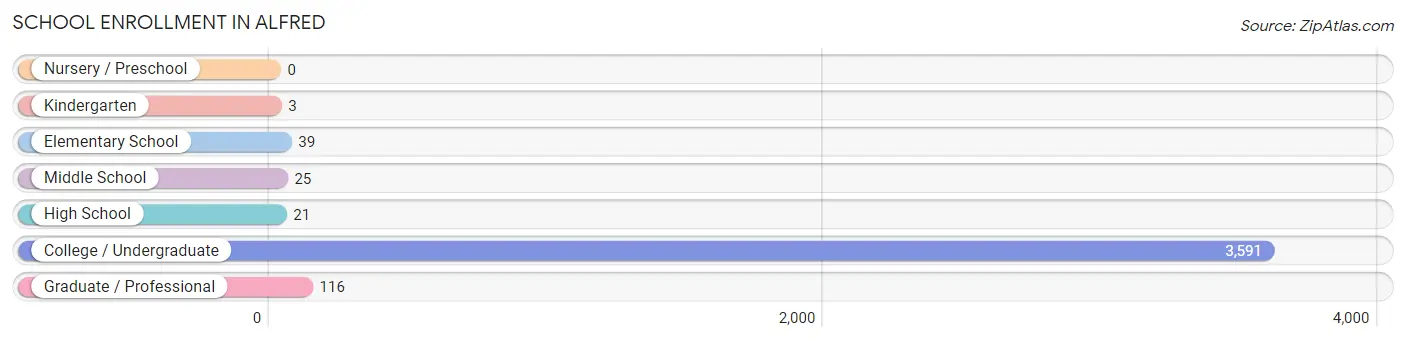
| School Level | # Students | % Students |
| Nursery / Preschool | 0 | 0.0% |
| Kindergarten | 3 | 0.1% |
| Elementary School | 39 | 1.0% |
| Middle School | 25 | 0.7% |
| High School | 21 | 0.5% |
| College / Undergraduate | 3,591 | 94.6% |
| Graduate / Professional | 116 | 3.1% |
| Total | 3,795 | 100.0% |
School Enrollment by Age by Funding Source in Alfred
Out of a total of 3,795 students who are enrolled in schools in Alfred, 1,476 (38.9%) attend a private institution, while the remaining 2,319 (61.1%) are enrolled in public schools. The age group of 25 to 34 year olds has the highest likelihood of being enrolled in private schools, with 103 (92.0% in the age bracket) enrolled. Conversely, the age group of 10 to 14 year olds has the lowest likelihood of being enrolled in a private school, with 25 (100.0% in the age bracket) attending a public institution.
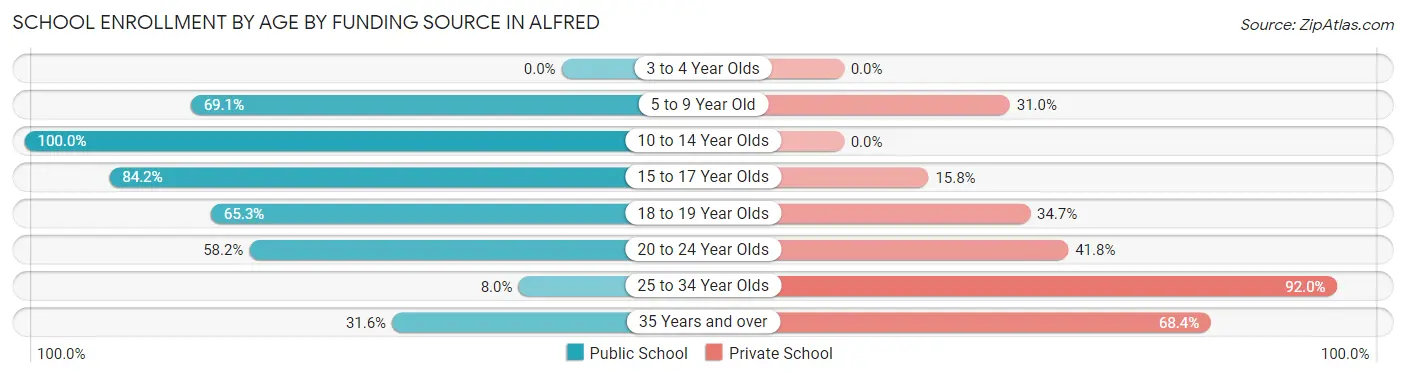
| Age Bracket | Public School | Private School |
| 3 to 4 Year Olds | 0 (0.0%) | 0 (0.0%) |
| 5 to 9 Year Old | 29 (69.1%) | 13 (30.9%) |
| 10 to 14 Year Olds | 25 (100.0%) | 0 (0.0%) |
| 15 to 17 Year Olds | 48 (84.2%) | 9 (15.8%) |
| 18 to 19 Year Olds | 1,300 (65.3%) | 691 (34.7%) |
| 20 to 24 Year Olds | 901 (58.2%) | 648 (41.8%) |
| 25 to 34 Year Olds | 9 (8.0%) | 103 (92.0%) |
| 35 Years and over | 6 (31.6%) | 13 (68.4%) |
| Total | 2,319 (61.1%) | 1,476 (38.9%) |
Educational Attainment by Field of Study in Alfred
Literature & languages (75 | 14.0%), engineering (59 | 11.0%), communications (59 | 11.0%), physical & health sciences (55 | 10.3%), and social sciences (50 | 9.3%) are the most common fields of study among 535 individuals in Alfred who have obtained a bachelor's degree or higher.
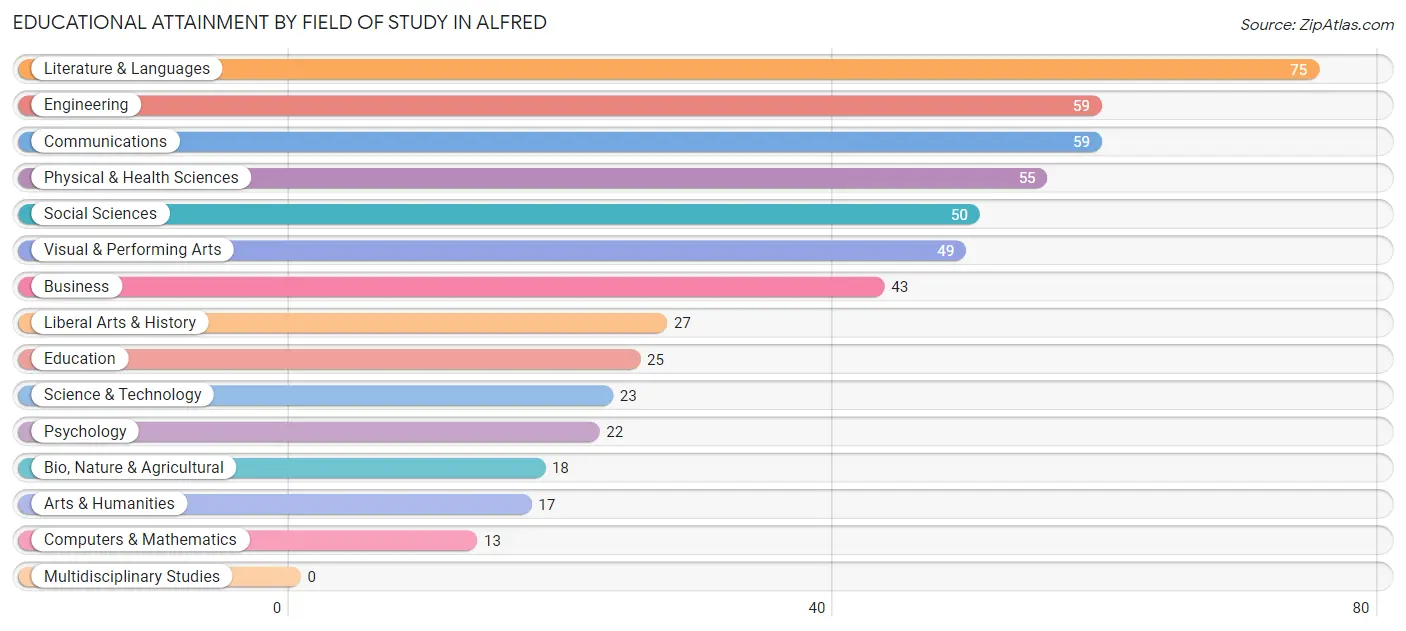
| Field of Study | # Graduates | % Graduates |
| Computers & Mathematics | 13 | 2.4% |
| Bio, Nature & Agricultural | 18 | 3.4% |
| Physical & Health Sciences | 55 | 10.3% |
| Psychology | 22 | 4.1% |
| Social Sciences | 50 | 9.3% |
| Engineering | 59 | 11.0% |
| Multidisciplinary Studies | 0 | 0.0% |
| Science & Technology | 23 | 4.3% |
| Business | 43 | 8.0% |
| Education | 25 | 4.7% |
| Literature & Languages | 75 | 14.0% |
| Liberal Arts & History | 27 | 5.1% |
| Visual & Performing Arts | 49 | 9.2% |
| Communications | 59 | 11.0% |
| Arts & Humanities | 17 | 3.2% |
| Total | 535 | 100.0% |
Transportation & Commute in Alfred
Vehicle Availability by Sex in Alfred
The most prevalent vehicle ownership categories in Alfred are males with 2 vehicles (81, accounting for 41.5%) and females with 2 vehicles (120, making up 27.7%).
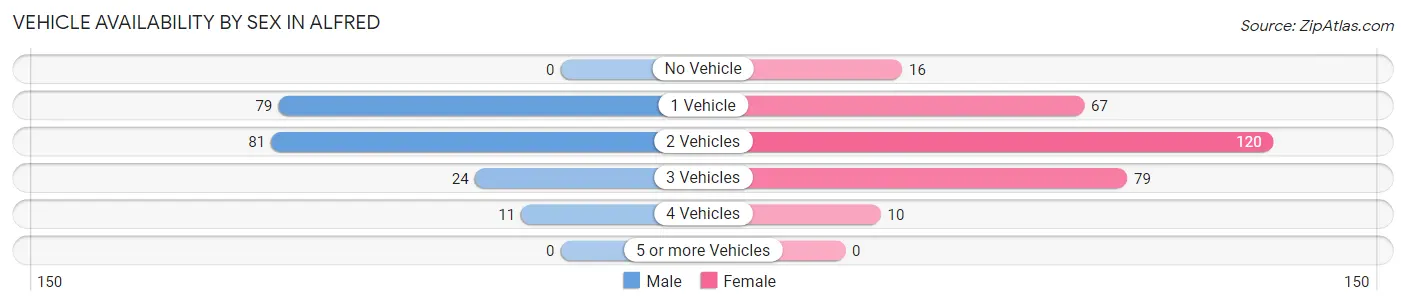
| Vehicles Available | Male | Female |
| No Vehicle | 0 (0.0%) | 16 (5.5%) |
| 1 Vehicle | 79 (40.5%) | 67 (23.0%) |
| 2 Vehicles | 81 (41.5%) | 120 (41.1%) |
| 3 Vehicles | 24 (12.3%) | 79 (27.1%) |
| 4 Vehicles | 11 (5.6%) | 10 (3.4%) |
| 5 or more Vehicles | 0 (0.0%) | 0 (0.0%) |
| Total | 195 (100.0%) | 292 (100.0%) |
Commute Time in Alfred
The most frequently occuring commute durations in Alfred are 10 to 14 minutes (404 commuters, 33.2%), 5 to 9 minutes (387 commuters, 31.8%), and less than 5 minutes (134 commuters, 11.0%).
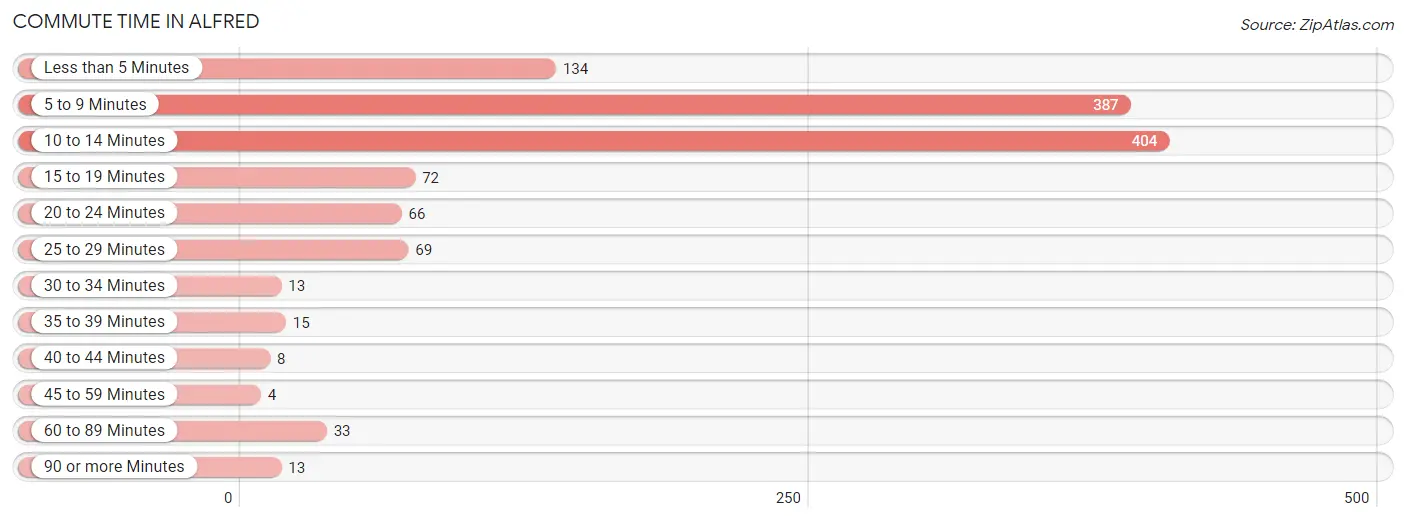
| Commute Time | # Commuters | % Commuters |
| Less than 5 Minutes | 134 | 11.0% |
| 5 to 9 Minutes | 387 | 31.8% |
| 10 to 14 Minutes | 404 | 33.2% |
| 15 to 19 Minutes | 72 | 5.9% |
| 20 to 24 Minutes | 66 | 5.4% |
| 25 to 29 Minutes | 69 | 5.7% |
| 30 to 34 Minutes | 13 | 1.1% |
| 35 to 39 Minutes | 15 | 1.2% |
| 40 to 44 Minutes | 8 | 0.7% |
| 45 to 59 Minutes | 4 | 0.3% |
| 60 to 89 Minutes | 33 | 2.7% |
| 90 or more Minutes | 13 | 1.1% |
Commute Time by Sex in Alfred
The most common commute times in Alfred are 10 to 14 minutes (187 commuters, 34.0%) for males and 10 to 14 minutes (217 commuters, 32.5%) for females.
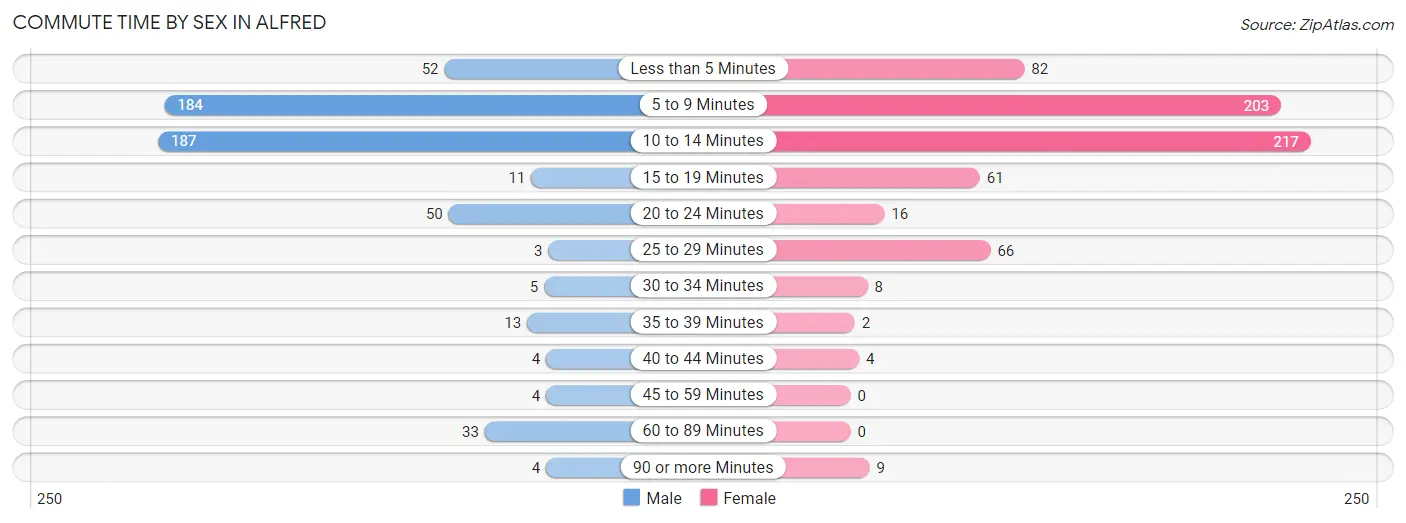
| Commute Time | Male | Female |
| Less than 5 Minutes | 52 (9.5%) | 82 (12.3%) |
| 5 to 9 Minutes | 184 (33.5%) | 203 (30.4%) |
| 10 to 14 Minutes | 187 (34.0%) | 217 (32.5%) |
| 15 to 19 Minutes | 11 (2.0%) | 61 (9.1%) |
| 20 to 24 Minutes | 50 (9.1%) | 16 (2.4%) |
| 25 to 29 Minutes | 3 (0.5%) | 66 (9.9%) |
| 30 to 34 Minutes | 5 (0.9%) | 8 (1.2%) |
| 35 to 39 Minutes | 13 (2.4%) | 2 (0.3%) |
| 40 to 44 Minutes | 4 (0.7%) | 4 (0.6%) |
| 45 to 59 Minutes | 4 (0.7%) | 0 (0.0%) |
| 60 to 89 Minutes | 33 (6.0%) | 0 (0.0%) |
| 90 or more Minutes | 4 (0.7%) | 9 (1.3%) |
Time of Departure to Work by Sex in Alfred
The most frequent times of departure to work in Alfred are 4:00 PM to 11:59 PM (192, 34.9%) for males and 12:00 PM to 3:59 PM (146, 21.9%) for females.
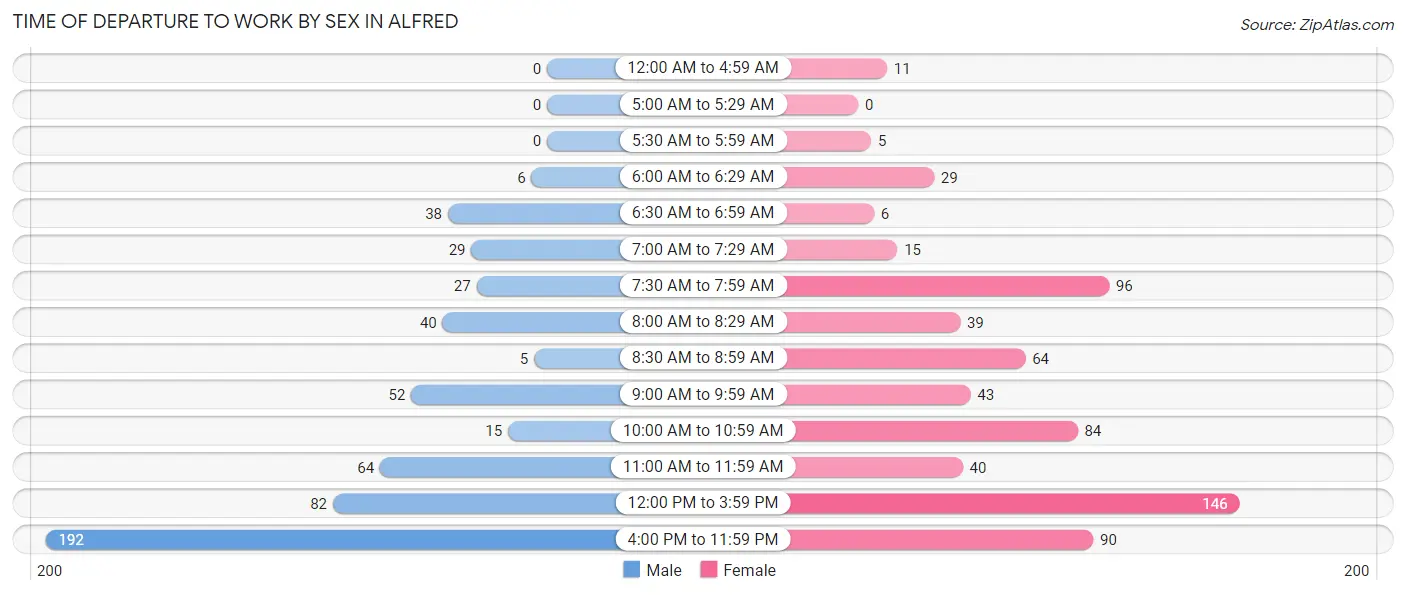
| Time of Departure | Male | Female |
| 12:00 AM to 4:59 AM | 0 (0.0%) | 11 (1.7%) |
| 5:00 AM to 5:29 AM | 0 (0.0%) | 0 (0.0%) |
| 5:30 AM to 5:59 AM | 0 (0.0%) | 5 (0.7%) |
| 6:00 AM to 6:29 AM | 6 (1.1%) | 29 (4.3%) |
| 6:30 AM to 6:59 AM | 38 (6.9%) | 6 (0.9%) |
| 7:00 AM to 7:29 AM | 29 (5.3%) | 15 (2.2%) |
| 7:30 AM to 7:59 AM | 27 (4.9%) | 96 (14.4%) |
| 8:00 AM to 8:29 AM | 40 (7.3%) | 39 (5.8%) |
| 8:30 AM to 8:59 AM | 5 (0.9%) | 64 (9.6%) |
| 9:00 AM to 9:59 AM | 52 (9.5%) | 43 (6.4%) |
| 10:00 AM to 10:59 AM | 15 (2.7%) | 84 (12.6%) |
| 11:00 AM to 11:59 AM | 64 (11.6%) | 40 (6.0%) |
| 12:00 PM to 3:59 PM | 82 (14.9%) | 146 (21.9%) |
| 4:00 PM to 11:59 PM | 192 (34.9%) | 90 (13.5%) |
| Total | 550 (100.0%) | 668 (100.0%) |
Housing Occupancy in Alfred
Occupancy by Ownership in Alfred
Of the total 503 dwellings in Alfred, owner-occupied units account for 285 (56.7%), while renter-occupied units make up 218 (43.3%).
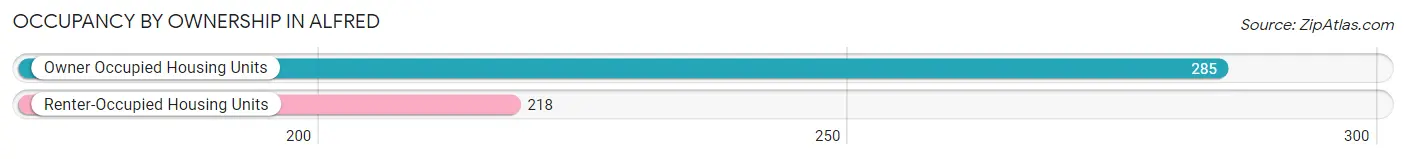
| Occupancy | # Housing Units | % Housing Units |
| Owner Occupied Housing Units | 285 | 56.7% |
| Renter-Occupied Housing Units | 218 | 43.3% |
| Total Occupied Housing Units | 503 | 100.0% |
Occupancy by Household Size in Alfred
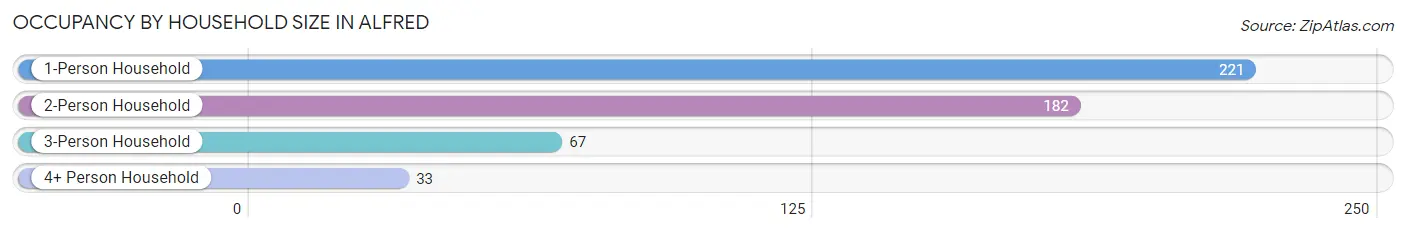
| Household Size | # Housing Units | % Housing Units |
| 1-Person Household | 221 | 43.9% |
| 2-Person Household | 182 | 36.2% |
| 3-Person Household | 67 | 13.3% |
| 4+ Person Household | 33 | 6.6% |
| Total Housing Units | 503 | 100.0% |
Occupancy by Ownership by Household Size in Alfred
| Household Size | Owner-occupied | Renter-occupied |
| 1-Person Household | 88 (39.8%) | 133 (60.2%) |
| 2-Person Household | 139 (76.4%) | 43 (23.6%) |
| 3-Person Household | 37 (55.2%) | 30 (44.8%) |
| 4+ Person Household | 21 (63.6%) | 12 (36.4%) |
| Total Housing Units | 285 (56.7%) | 218 (43.3%) |
Occupancy by Educational Attainment in Alfred
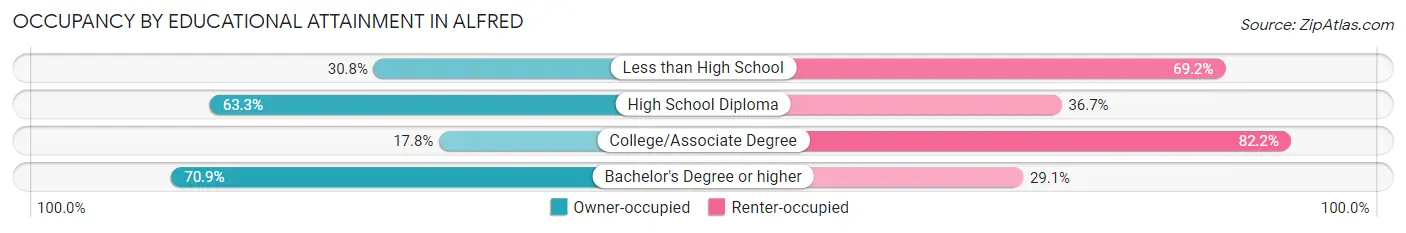
| Household Size | Owner-occupied | Renter-occupied |
| Less than High School | 4 (30.8%) | 9 (69.2%) |
| High School Diploma | 31 (63.3%) | 18 (36.7%) |
| College/Associate Degree | 21 (17.8%) | 97 (82.2%) |
| Bachelor's Degree or higher | 229 (70.9%) | 94 (29.1%) |
Occupancy by Age of Householder in Alfred
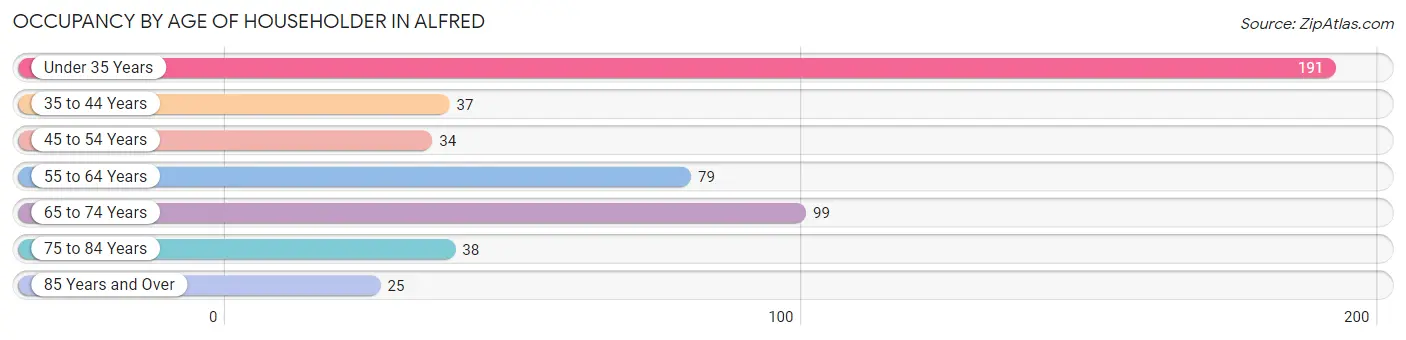
| Age Bracket | # Households | % Households |
| Under 35 Years | 191 | 38.0% |
| 35 to 44 Years | 37 | 7.4% |
| 45 to 54 Years | 34 | 6.8% |
| 55 to 64 Years | 79 | 15.7% |
| 65 to 74 Years | 99 | 19.7% |
| 75 to 84 Years | 38 | 7.5% |
| 85 Years and Over | 25 | 5.0% |
| Total | 503 | 100.0% |
Housing Finances in Alfred
Median Income by Occupancy in Alfred
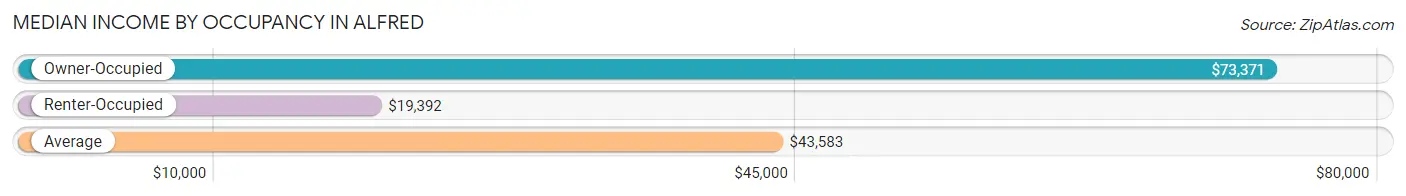
| Occupancy Type | # Households | Median Income |
| Owner-Occupied | 285 (56.7%) | $73,371 |
| Renter-Occupied | 218 (43.3%) | $19,392 |
| Average | 503 (100.0%) | $43,583 |
Occupancy by Householder Income Bracket in Alfred
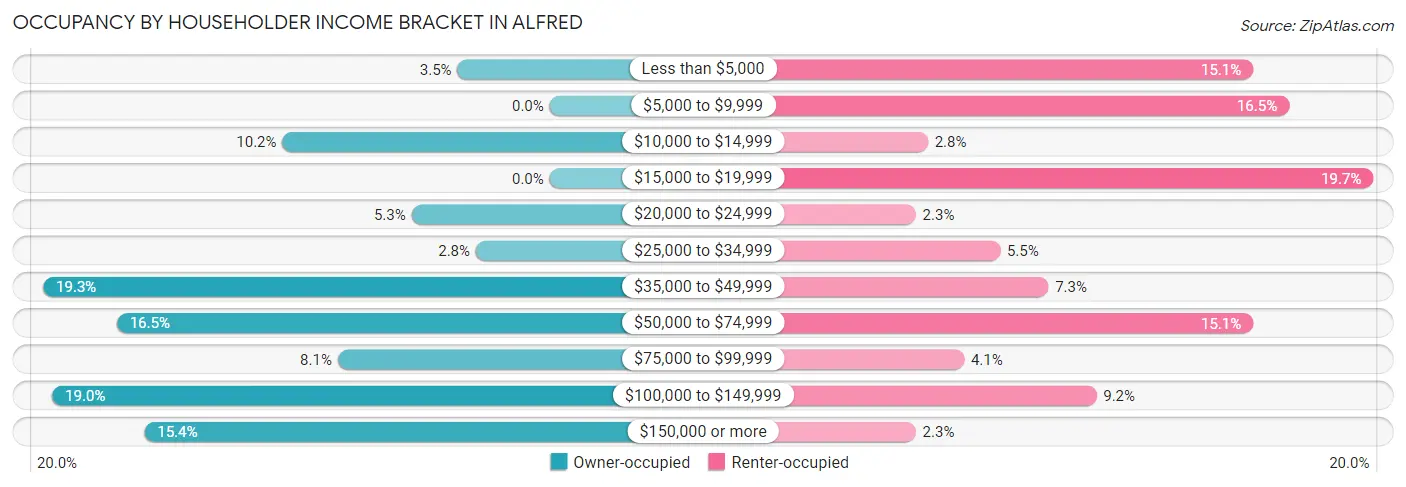
| Income Bracket | Owner-occupied | Renter-occupied |
| Less than $5,000 | 10 (3.5%) | 33 (15.1%) |
| $5,000 to $9,999 | 0 (0.0%) | 36 (16.5%) |
| $10,000 to $14,999 | 29 (10.2%) | 6 (2.8%) |
| $15,000 to $19,999 | 0 (0.0%) | 43 (19.7%) |
| $20,000 to $24,999 | 15 (5.3%) | 5 (2.3%) |
| $25,000 to $34,999 | 8 (2.8%) | 12 (5.5%) |
| $35,000 to $49,999 | 55 (19.3%) | 16 (7.3%) |
| $50,000 to $74,999 | 47 (16.5%) | 33 (15.1%) |
| $75,000 to $99,999 | 23 (8.1%) | 9 (4.1%) |
| $100,000 to $149,999 | 54 (19.0%) | 20 (9.2%) |
| $150,000 or more | 44 (15.4%) | 5 (2.3%) |
| Total | 285 (100.0%) | 218 (100.0%) |
Monthly Housing Cost Tiers in Alfred
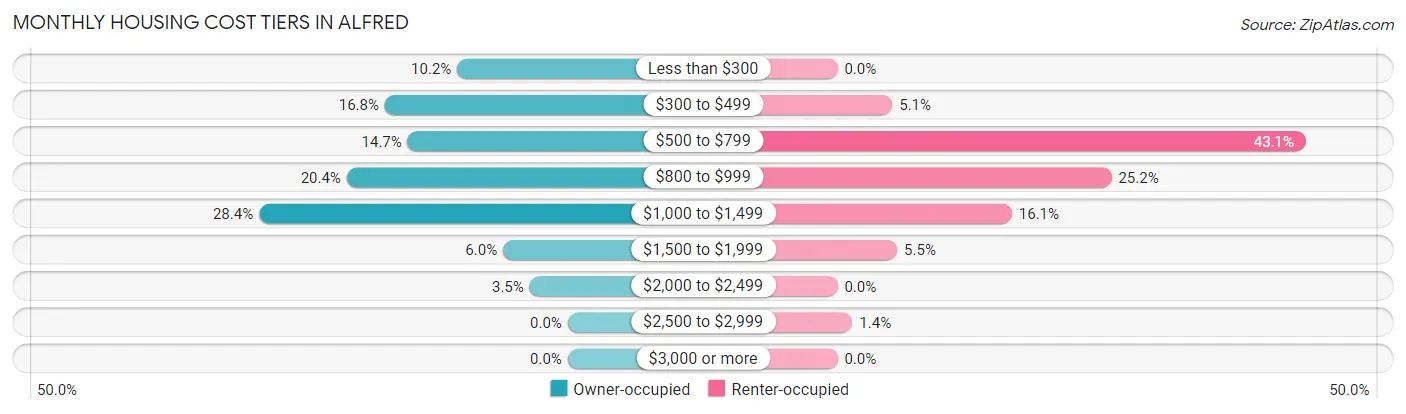
| Monthly Cost | Owner-occupied | Renter-occupied |
| Less than $300 | 29 (10.2%) | 0 (0.0%) |
| $300 to $499 | 48 (16.8%) | 11 (5.1%) |
| $500 to $799 | 42 (14.7%) | 94 (43.1%) |
| $800 to $999 | 58 (20.3%) | 55 (25.2%) |
| $1,000 to $1,499 | 81 (28.4%) | 35 (16.1%) |
| $1,500 to $1,999 | 17 (6.0%) | 12 (5.5%) |
| $2,000 to $2,499 | 10 (3.5%) | 0 (0.0%) |
| $2,500 to $2,999 | 0 (0.0%) | 3 (1.4%) |
| $3,000 or more | 0 (0.0%) | 0 (0.0%) |
| Total | 285 (100.0%) | 218 (100.0%) |
Physical Housing Characteristics in Alfred
Housing Structures in Alfred
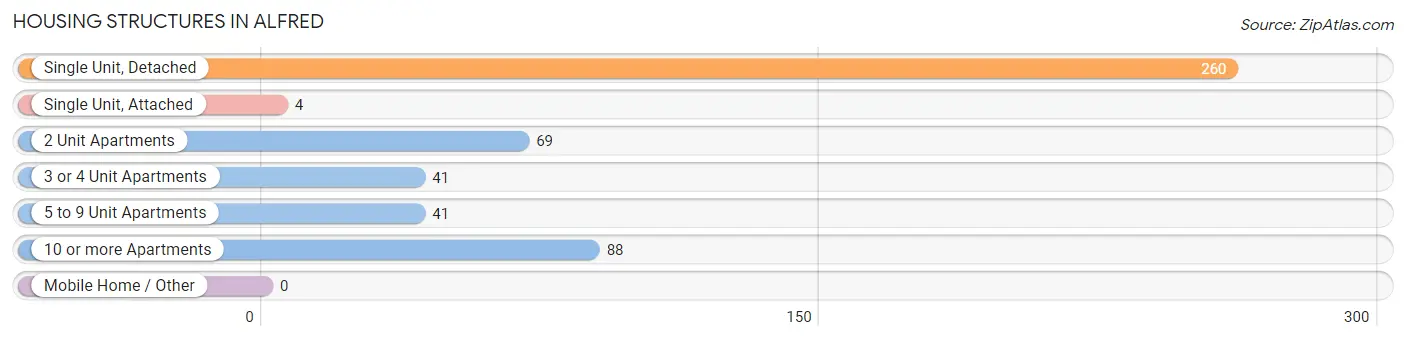
| Structure Type | # Housing Units | % Housing Units |
| Single Unit, Detached | 260 | 51.7% |
| Single Unit, Attached | 4 | 0.8% |
| 2 Unit Apartments | 69 | 13.7% |
| 3 or 4 Unit Apartments | 41 | 8.2% |
| 5 to 9 Unit Apartments | 41 | 8.2% |
| 10 or more Apartments | 88 | 17.5% |
| Mobile Home / Other | 0 | 0.0% |
| Total | 503 | 100.0% |
Housing Structures by Occupancy in Alfred
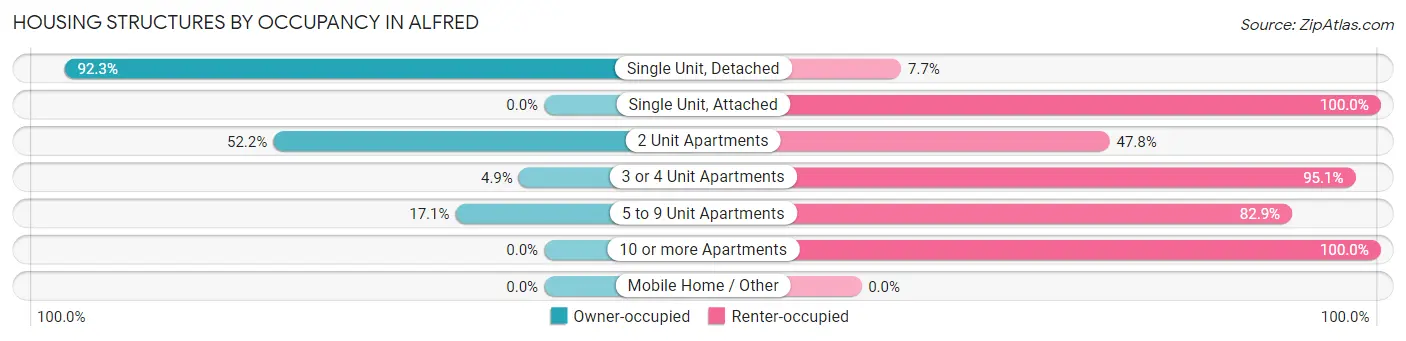
| Structure Type | Owner-occupied | Renter-occupied |
| Single Unit, Detached | 240 (92.3%) | 20 (7.7%) |
| Single Unit, Attached | 0 (0.0%) | 4 (100.0%) |
| 2 Unit Apartments | 36 (52.2%) | 33 (47.8%) |
| 3 or 4 Unit Apartments | 2 (4.9%) | 39 (95.1%) |
| 5 to 9 Unit Apartments | 7 (17.1%) | 34 (82.9%) |
| 10 or more Apartments | 0 (0.0%) | 88 (100.0%) |
| Mobile Home / Other | 0 (0.0%) | 0 (0.0%) |
| Total | 285 (56.7%) | 218 (43.3%) |
Housing Structures by Number of Rooms in Alfred
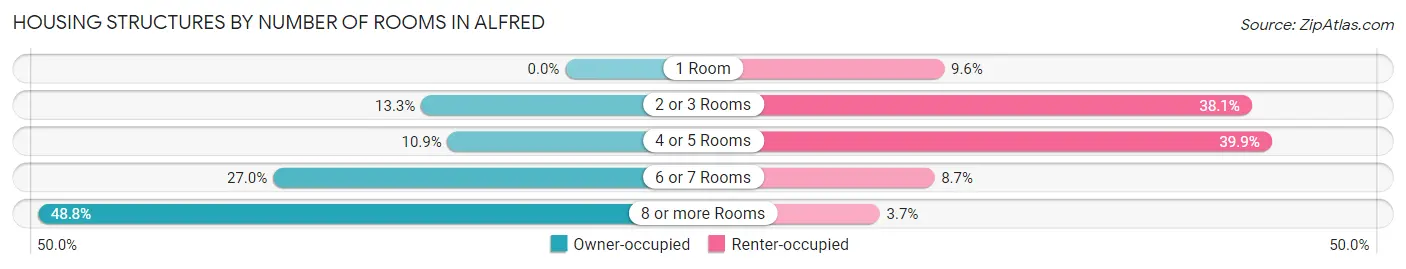
| Number of Rooms | Owner-occupied | Renter-occupied |
| 1 Room | 0 (0.0%) | 21 (9.6%) |
| 2 or 3 Rooms | 38 (13.3%) | 83 (38.1%) |
| 4 or 5 Rooms | 31 (10.9%) | 87 (39.9%) |
| 6 or 7 Rooms | 77 (27.0%) | 19 (8.7%) |
| 8 or more Rooms | 139 (48.8%) | 8 (3.7%) |
| Total | 285 (100.0%) | 218 (100.0%) |
Housing Structure by Heating Type in Alfred
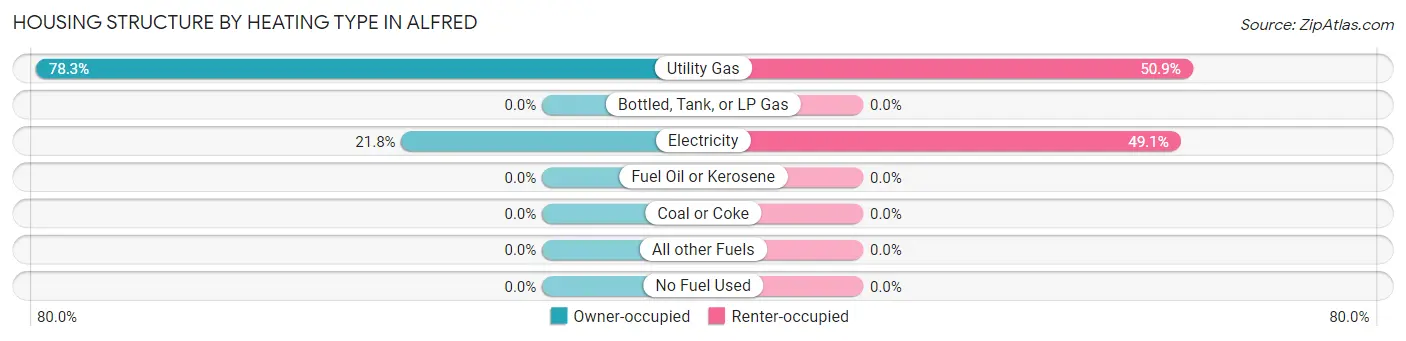
| Heating Type | Owner-occupied | Renter-occupied |
| Utility Gas | 223 (78.2%) | 111 (50.9%) |
| Bottled, Tank, or LP Gas | 0 (0.0%) | 0 (0.0%) |
| Electricity | 62 (21.7%) | 107 (49.1%) |
| Fuel Oil or Kerosene | 0 (0.0%) | 0 (0.0%) |
| Coal or Coke | 0 (0.0%) | 0 (0.0%) |
| All other Fuels | 0 (0.0%) | 0 (0.0%) |
| No Fuel Used | 0 (0.0%) | 0 (0.0%) |
| Total | 285 (100.0%) | 218 (100.0%) |
Household Vehicle Usage in Alfred
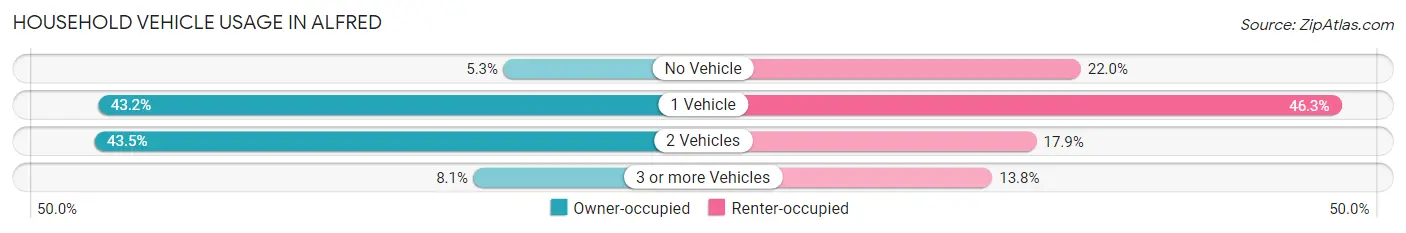
| Vehicles per Household | Owner-occupied | Renter-occupied |
| No Vehicle | 15 (5.3%) | 48 (22.0%) |
| 1 Vehicle | 123 (43.2%) | 101 (46.3%) |
| 2 Vehicles | 124 (43.5%) | 39 (17.9%) |
| 3 or more Vehicles | 23 (8.1%) | 30 (13.8%) |
| Total | 285 (100.0%) | 218 (100.0%) |
Real Estate & Mortgages in Alfred
Real Estate and Mortgage Overview in Alfred
| Characteristic | Without Mortgage | With Mortgage |
| Housing Units | 174 | 111 |
| Median Property Value | $130,800 | $144,100 |
| Median Household Income | $72,593 | $17 |
| Monthly Housing Costs | $632 | $0 |
| Real Estate Taxes | $4,813 | $9 |
Property Value by Mortgage Status in Alfred
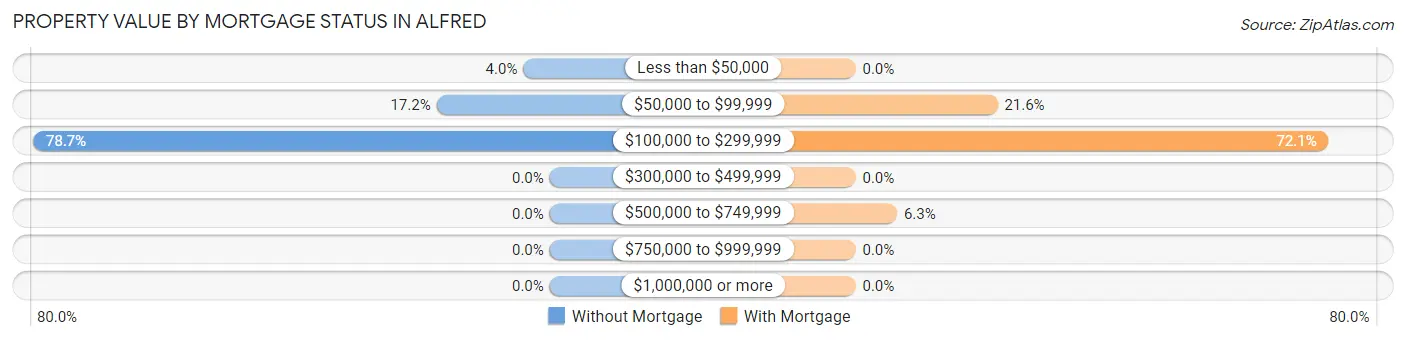
| Property Value | Without Mortgage | With Mortgage |
| Less than $50,000 | 7 (4.0%) | 0 (0.0%) |
| $50,000 to $99,999 | 30 (17.2%) | 24 (21.6%) |
| $100,000 to $299,999 | 137 (78.7%) | 80 (72.1%) |
| $300,000 to $499,999 | 0 (0.0%) | 0 (0.0%) |
| $500,000 to $749,999 | 0 (0.0%) | 7 (6.3%) |
| $750,000 to $999,999 | 0 (0.0%) | 0 (0.0%) |
| $1,000,000 or more | 0 (0.0%) | 0 (0.0%) |
| Total | 174 (100.0%) | 111 (100.0%) |
Household Income by Mortgage Status in Alfred
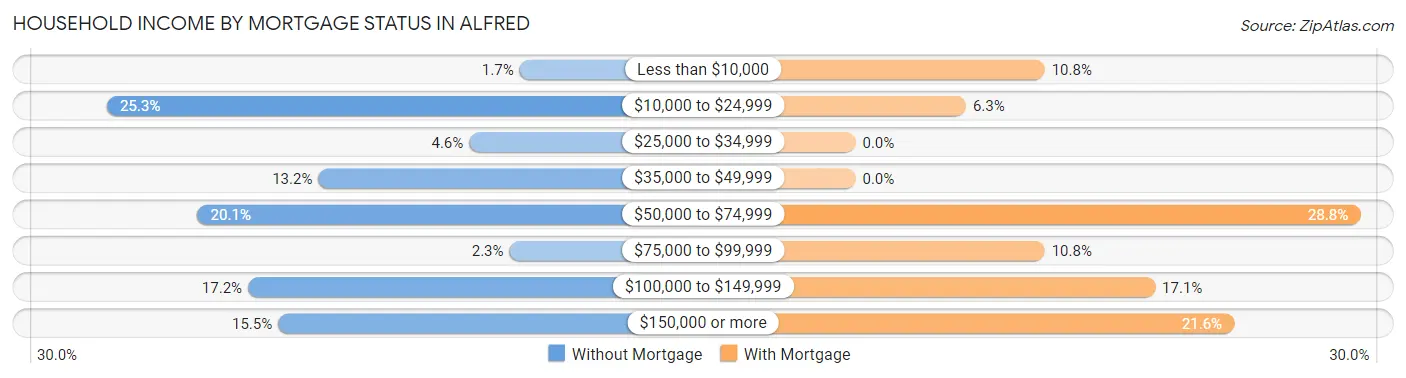
| Household Income | Without Mortgage | With Mortgage |
| Less than $10,000 | 3 (1.7%) | 12 (10.8%) |
| $10,000 to $24,999 | 44 (25.3%) | 7 (6.3%) |
| $25,000 to $34,999 | 8 (4.6%) | 0 (0.0%) |
| $35,000 to $49,999 | 23 (13.2%) | 0 (0.0%) |
| $50,000 to $74,999 | 35 (20.1%) | 32 (28.8%) |
| $75,000 to $99,999 | 4 (2.3%) | 12 (10.8%) |
| $100,000 to $149,999 | 30 (17.2%) | 19 (17.1%) |
| $150,000 or more | 27 (15.5%) | 24 (21.6%) |
| Total | 174 (100.0%) | 111 (100.0%) |
Property Value to Household Income Ratio in Alfred
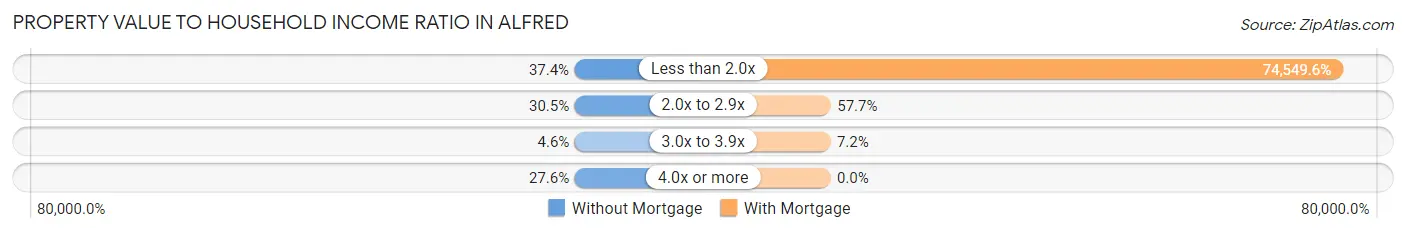
| Value-to-Income Ratio | Without Mortgage | With Mortgage |
| Less than 2.0x | 65 (37.4%) | 82,750 (74,549.5%) |
| 2.0x to 2.9x | 53 (30.5%) | 64 (57.7%) |
| 3.0x to 3.9x | 8 (4.6%) | 8 (7.2%) |
| 4.0x or more | 48 (27.6%) | 0 (0.0%) |
| Total | 174 (100.0%) | 111 (100.0%) |
Real Estate Taxes by Mortgage Status in Alfred
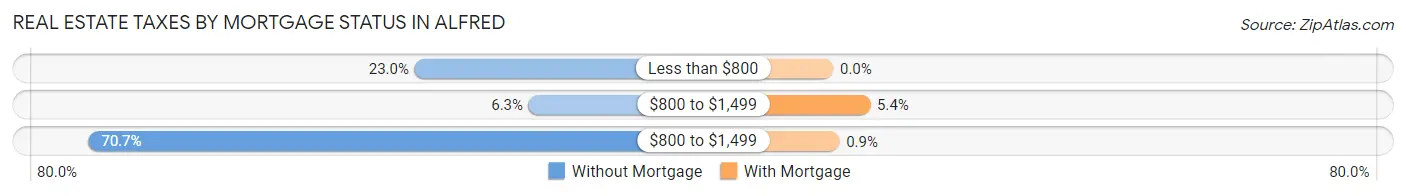
| Property Taxes | Without Mortgage | With Mortgage |
| Less than $800 | 40 (23.0%) | 0 (0.0%) |
| $800 to $1,499 | 11 (6.3%) | 6 (5.4%) |
| $800 to $1,499 | 123 (70.7%) | 1 (0.9%) |
| Total | 174 (100.0%) | 111 (100.0%) |
Health & Disability in Alfred
Health Insurance Coverage by Age in Alfred
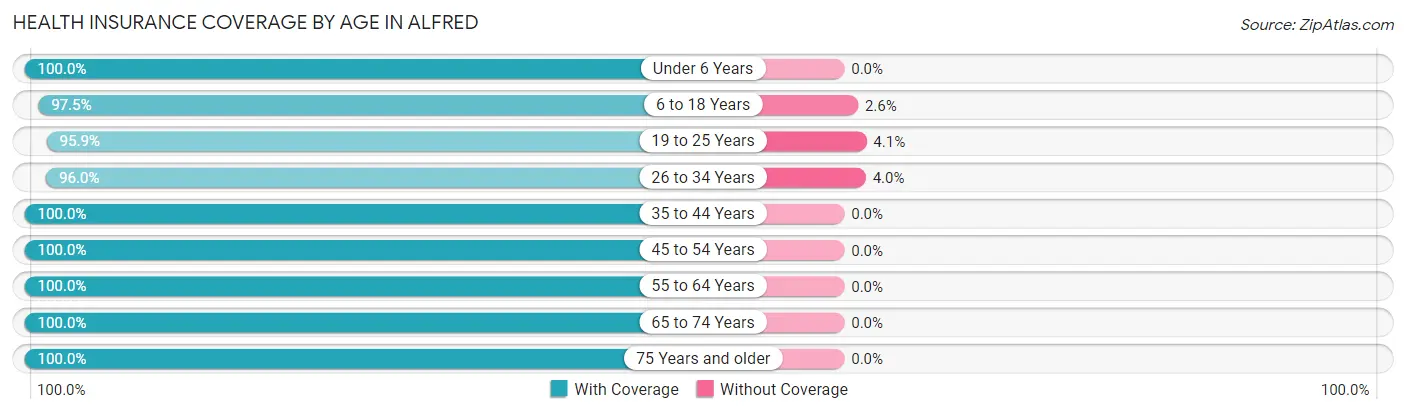
| Age Bracket | With Coverage | Without Coverage |
| Under 6 Years | 24 (100.0%) | 0 (0.0%) |
| 6 to 18 Years | 1,224 (97.5%) | 32 (2.5%) |
| 19 to 25 Years | 2,557 (95.9%) | 110 (4.1%) |
| 26 to 34 Years | 120 (96.0%) | 5 (4.0%) |
| 35 to 44 Years | 58 (100.0%) | 0 (0.0%) |
| 45 to 54 Years | 71 (100.0%) | 0 (0.0%) |
| 55 to 64 Years | 139 (100.0%) | 0 (0.0%) |
| 65 to 74 Years | 150 (100.0%) | 0 (0.0%) |
| 75 Years and older | 87 (100.0%) | 0 (0.0%) |
| Total | 4,430 (96.8%) | 147 (3.2%) |
Health Insurance Coverage by Citizenship Status in Alfred
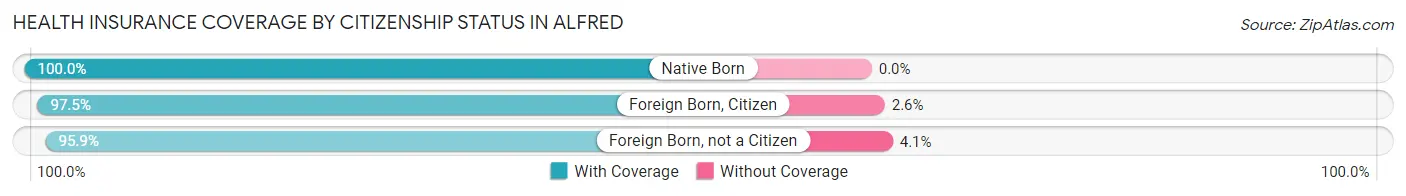
| Citizenship Status | With Coverage | Without Coverage |
| Native Born | 24 (100.0%) | 0 (0.0%) |
| Foreign Born, Citizen | 1,224 (97.5%) | 32 (2.5%) |
| Foreign Born, not a Citizen | 2,557 (95.9%) | 110 (4.1%) |
Health Insurance Coverage by Household Income in Alfred
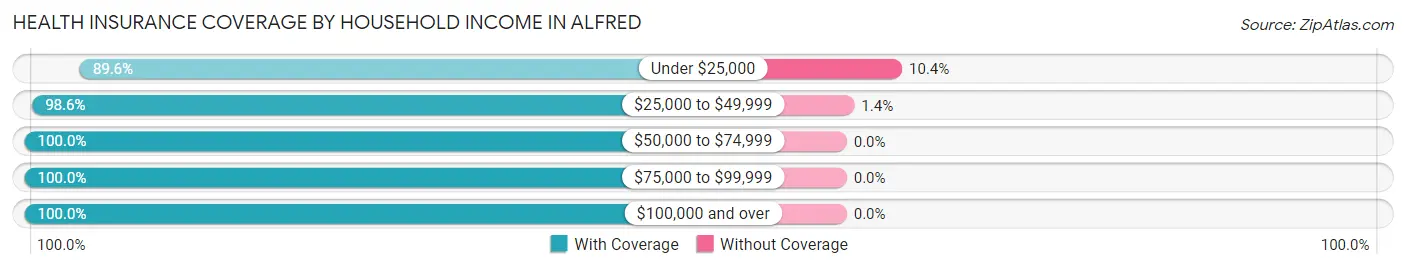
| Household Income | With Coverage | Without Coverage |
| Under $25,000 | 251 (89.6%) | 29 (10.4%) |
| $25,000 to $49,999 | 344 (98.6%) | 5 (1.4%) |
| $50,000 to $74,999 | 152 (100.0%) | 0 (0.0%) |
| $75,000 to $99,999 | 107 (100.0%) | 0 (0.0%) |
| $100,000 and over | 323 (100.0%) | 0 (0.0%) |
Public vs Private Health Insurance Coverage by Age in Alfred
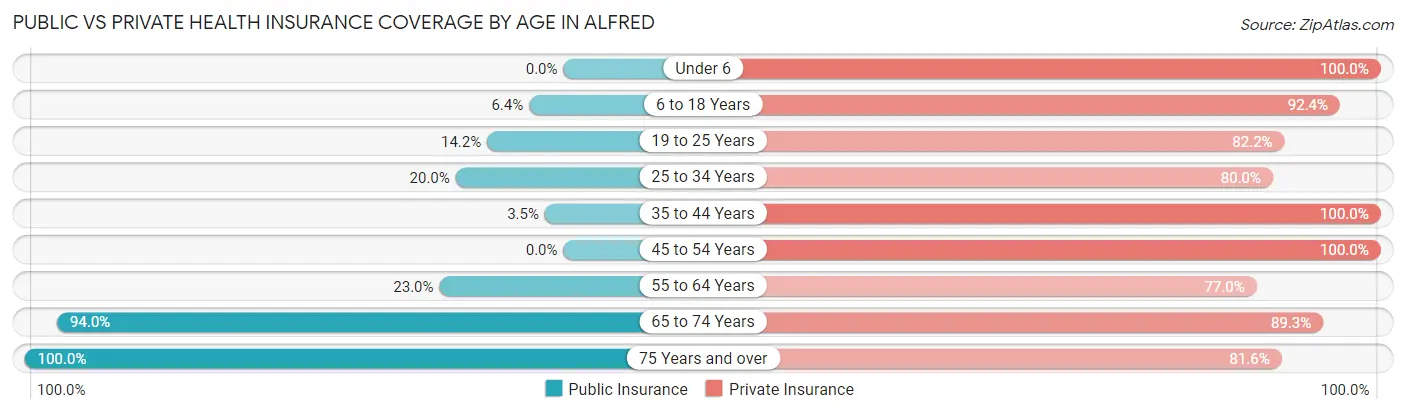
| Age Bracket | Public Insurance | Private Insurance |
| Under 6 | 0 (0.0%) | 24 (100.0%) |
| 6 to 18 Years | 80 (6.4%) | 1,161 (92.4%) |
| 19 to 25 Years | 378 (14.2%) | 2,191 (82.2%) |
| 25 to 34 Years | 25 (20.0%) | 100 (80.0%) |
| 35 to 44 Years | 2 (3.5%) | 58 (100.0%) |
| 45 to 54 Years | 0 (0.0%) | 71 (100.0%) |
| 55 to 64 Years | 32 (23.0%) | 107 (77.0%) |
| 65 to 74 Years | 141 (94.0%) | 134 (89.3%) |
| 75 Years and over | 87 (100.0%) | 71 (81.6%) |
| Total | 745 (16.3%) | 3,917 (85.6%) |
Disability Status by Sex by Age in Alfred
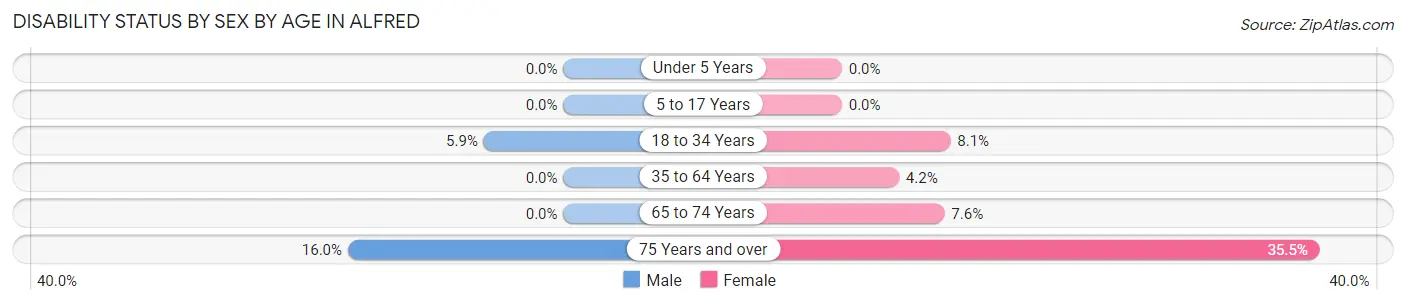
| Age Bracket | Male | Female |
| Under 5 Years | 0 (0.0%) | 0 (0.0%) |
| 5 to 17 Years | 0 (0.0%) | 0 (0.0%) |
| 18 to 34 Years | 130 (5.9%) | 139 (8.1%) |
| 35 to 64 Years | 0 (0.0%) | 5 (4.2%) |
| 65 to 74 Years | 0 (0.0%) | 8 (7.6%) |
| 75 Years and over | 4 (16.0%) | 22 (35.5%) |
Disability Class by Sex by Age in Alfred
Disability Class: Hearing Difficulty
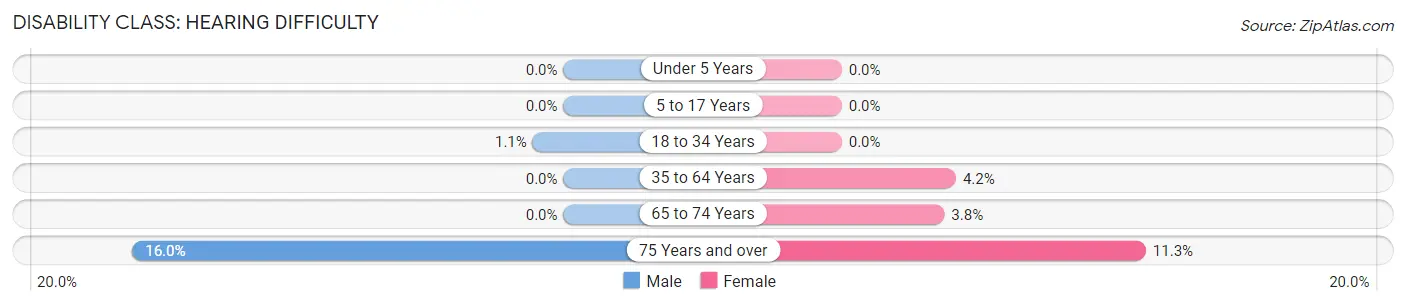
| Age Bracket | Male | Female |
| Under 5 Years | 0 (0.0%) | 0 (0.0%) |
| 5 to 17 Years | 0 (0.0%) | 0 (0.0%) |
| 18 to 34 Years | 25 (1.1%) | 0 (0.0%) |
| 35 to 64 Years | 0 (0.0%) | 5 (4.2%) |
| 65 to 74 Years | 0 (0.0%) | 4 (3.8%) |
| 75 Years and over | 4 (16.0%) | 7 (11.3%) |
Disability Class: Vision Difficulty
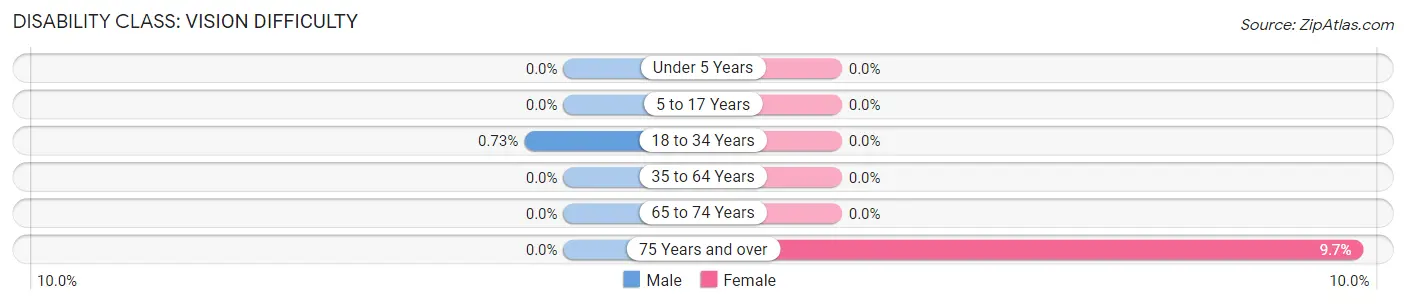
| Age Bracket | Male | Female |
| Under 5 Years | 0 (0.0%) | 0 (0.0%) |
| 5 to 17 Years | 0 (0.0%) | 0 (0.0%) |
| 18 to 34 Years | 16 (0.7%) | 0 (0.0%) |
| 35 to 64 Years | 0 (0.0%) | 0 (0.0%) |
| 65 to 74 Years | 0 (0.0%) | 0 (0.0%) |
| 75 Years and over | 0 (0.0%) | 6 (9.7%) |
Disability Class: Cognitive Difficulty
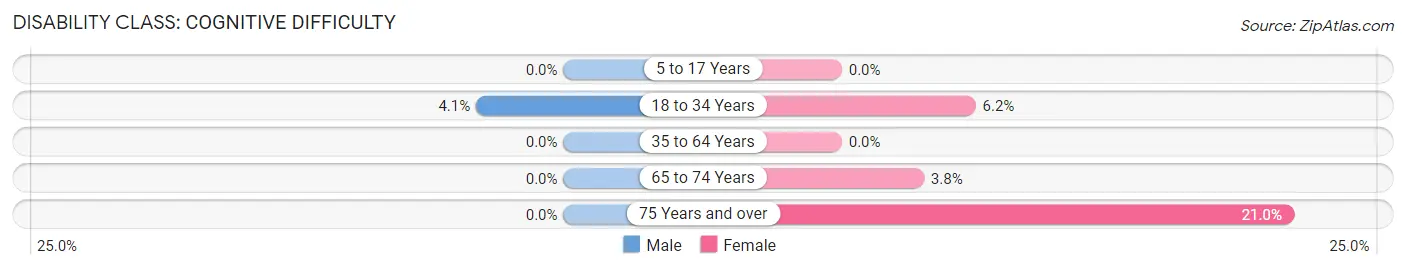
| Age Bracket | Male | Female |
| 5 to 17 Years | 0 (0.0%) | 0 (0.0%) |
| 18 to 34 Years | 89 (4.1%) | 107 (6.2%) |
| 35 to 64 Years | 0 (0.0%) | 0 (0.0%) |
| 65 to 74 Years | 0 (0.0%) | 4 (3.8%) |
| 75 Years and over | 0 (0.0%) | 13 (21.0%) |
Disability Class: Ambulatory Difficulty
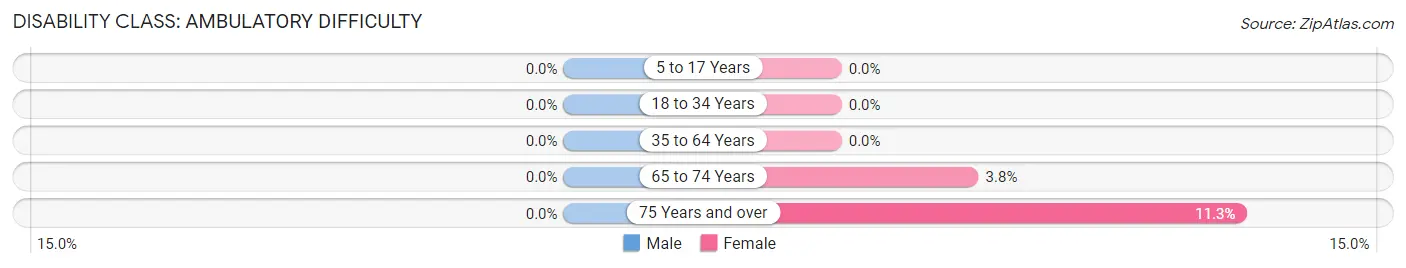
| Age Bracket | Male | Female |
| 5 to 17 Years | 0 (0.0%) | 0 (0.0%) |
| 18 to 34 Years | 0 (0.0%) | 0 (0.0%) |
| 35 to 64 Years | 0 (0.0%) | 0 (0.0%) |
| 65 to 74 Years | 0 (0.0%) | 4 (3.8%) |
| 75 Years and over | 0 (0.0%) | 7 (11.3%) |
Disability Class: Self-Care Difficulty
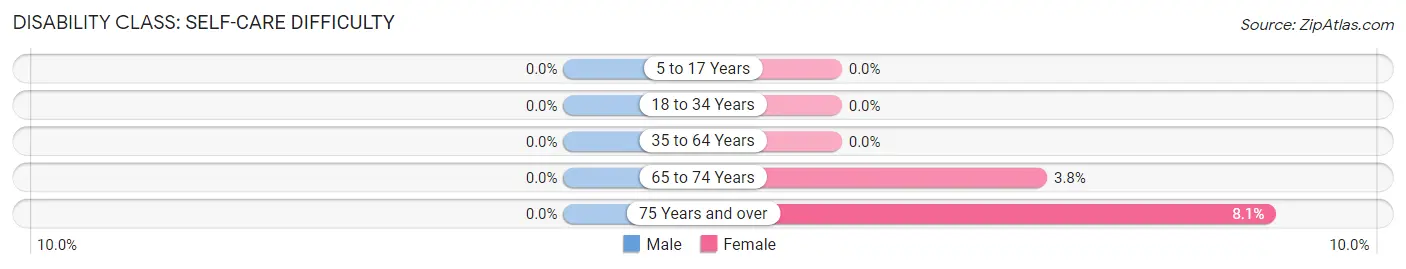
| Age Bracket | Male | Female |
| 5 to 17 Years | 0 (0.0%) | 0 (0.0%) |
| 18 to 34 Years | 0 (0.0%) | 0 (0.0%) |
| 35 to 64 Years | 0 (0.0%) | 0 (0.0%) |
| 65 to 74 Years | 0 (0.0%) | 4 (3.8%) |
| 75 Years and over | 0 (0.0%) | 5 (8.1%) |
Technology Access in Alfred
Computing Device Access in Alfred
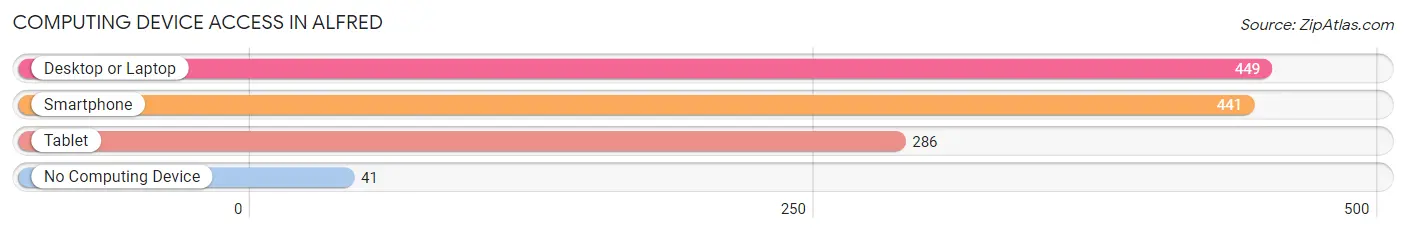
| Device Type | # Households | % Households |
| Desktop or Laptop | 449 | 89.3% |
| Smartphone | 441 | 87.7% |
| Tablet | 286 | 56.9% |
| No Computing Device | 41 | 8.2% |
| Total | 503 | 100.0% |
Internet Access in Alfred
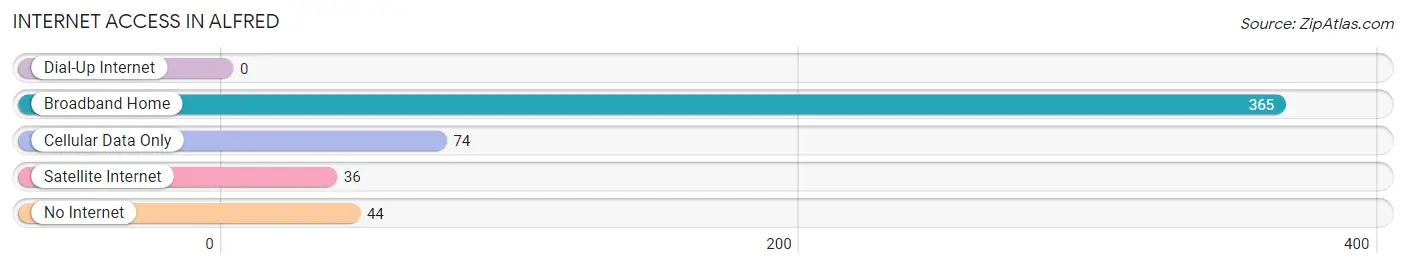
| Internet Type | # Households | % Households |
| Dial-Up Internet | 0 | 0.0% |
| Broadband Home | 365 | 72.6% |
| Cellular Data Only | 74 | 14.7% |
| Satellite Internet | 36 | 7.2% |
| No Internet | 44 | 8.7% |
| Total | 503 | 100.0% |
Alfred Summary
Alfred, New York is a small town located in Allegany County in the southwestern part of the state. It is situated in the foothills of the Allegheny Mountains and is home to a population of approximately 5,000 people. The town was founded in 1808 and has a rich history of industry, agriculture, and education.
Geography
Alfred is located in the foothills of the Allegheny Mountains, which are part of the Appalachian Mountains. The town is situated in the Finger Lakes region of New York, and is bordered by the towns of Amity, Andover, and Wellsville. The town is located at an elevation of 1,400 feet above sea level and has a total area of 8.2 square miles. The terrain is mostly hilly and wooded, with some open fields and meadows. The town is home to several small streams, including the Canacadea Creek, which flows through the center of town.
Economy
Alfred has a diverse economy, with a mix of manufacturing, agriculture, and services. The town is home to several small businesses, including a furniture store, a hardware store, and a variety of restaurants. The town is also home to Alfred University, which provides a variety of educational and cultural opportunities. The university is a major employer in the area, and provides a significant economic boost to the town.
Agriculture is also an important part of the local economy. The town is home to several farms, which produce a variety of crops, including corn, soybeans, and hay. The town is also home to several wineries, which produce a variety of wines.
Demographics
As of the 2010 census, Alfred had a population of 5,081 people. The racial makeup of the town was 95.3% White, 1.2% African American, 0.3% Native American, 0.7% Asian, 0.1% Pacific Islander, and 1.4% from two or more races. Hispanic or Latino of any race were 2.2% of the population.
The median household income in Alfred was $41,944, and the median family income was $50,917. The per capita income for the town was $20,945. About 11.2% of families and 15.2% of the population were below the poverty line, including 22.2% of those under age 18 and 8.2% of those age 65 or over.
Conclusion
Alfred, New York is a small town located in Allegany County in the southwestern part of the state. It is situated in the foothills of the Allegheny Mountains and is home to a population of approximately 5,000 people. The town has a rich history of industry, agriculture, and education, and has a diverse economy with a mix of manufacturing, agriculture, and services. The town has a population that is mostly White, with a small percentage of African American, Native American, Asian, and Pacific Islander residents. The median household income in Alfred is $41,944, and the per capita income is $20,945.
Common Questions
What is Per Capita Income in Alfred?
Per Capita income in Alfred is $11,618.
What is the Median Family Income in Alfred?
Median Family Income in Alfred is $105,938.
What is the Median Household income in Alfred?
Median Household Income in Alfred is $43,583.
What is Income or Wage Gap in Alfred?
Income or Wage Gap in Alfred is 39.0%.
Women in Alfred earn 61.0 cents for every dollar earned by a man.
What is Inequality or Gini Index in Alfred?
Inequality or Gini Index in Alfred is 0.50.
What is the Total Population of Alfred?
Total Population of Alfred is 4,577.
What is the Total Male Population of Alfred?
Total Male Population of Alfred is 2,519.
What is the Total Female Population of Alfred?
Total Female Population of Alfred is 2,058.
What is the Ratio of Males per 100 Females in Alfred?
There are 122.40 Males per 100 Females in Alfred.
What is the Ratio of Females per 100 Males in Alfred?
There are 81.70 Females per 100 Males in Alfred.
What is the Median Population Age in Alfred?
Median Population Age in Alfred is 20.2 Years.
What is the Average Family Size in Alfred
Average Family Size in Alfred is 2.9 People.
What is the Average Household Size in Alfred
Average Household Size in Alfred is 2.4 People.
How Large is the Labor Force in Alfred?
There are 1,814 People in the Labor Forcein in Alfred.
What is the Percentage of People in the Labor Force in Alfred?
40.5% of People are in the Labor Force in Alfred.
What is the Unemployment Rate in Alfred?
Unemployment Rate in Alfred is 16.4%.