New Britain borough, PA Map & Demographics
New Britain borough Overview
$40,258
PER CAPITA INCOME
$147,361
AVG FAMILY INCOME
$120,294
AVG HOUSEHOLD INCOME
65.3%
WAGE / INCOME GAP [ % ]
34.7¢/ $1
WAGE / INCOME GAP [ $ ]
0.41
INEQUALITY / GINI INDEX
2,846
TOTAL POPULATION
1,392
MALE POPULATION
1,454
FEMALE POPULATION
95.74
MALES / 100 FEMALES
104.45
FEMALES / 100 MALES
26.3
MEDIAN AGE
3.3
AVG FAMILY SIZE
2.6
AVG HOUSEHOLD SIZE
1,561
LABOR FORCE [ PEOPLE ]
62.1%
PERCENT IN LABOR FORCE
3.6%
UNEMPLOYMENT RATE
Income in New Britain borough
Income Overview in New Britain borough
Per Capita Income in New Britain borough is $40,258, while median incomes of families and households are $147,361 and $120,294 respectively.
| Characteristic | Number | Measure |
| Per Capita Income | 2,846 | $40,258 |
| Median Family Income | 520 | $147,361 |
| Mean Family Income | 520 | $173,205 |
| Median Household Income | 784 | $120,294 |
| Mean Household Income | 784 | $139,458 |
| Income Deficit | 520 | $0 |
| Wage / Income Gap (%) | 2,846 | 65.31% |
| Wage / Income Gap ($) | 2,846 | 34.69¢ per $1 |
| Gini / Inequality Index | 2,846 | 0.41 |
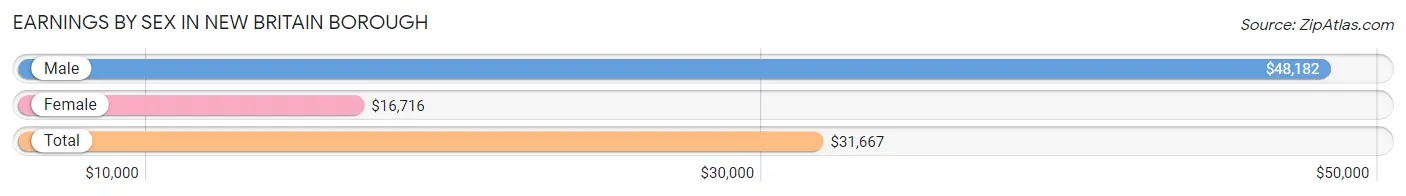
Earnings by Sex in New Britain borough
Average Earnings in New Britain borough are $31,667, $48,182 for men and $16,716 for women, a difference of 65.3%.
| Sex | Number | Average Earnings |
| Male | 836 (45.6%) | $48,182 |
| Female | 998 (54.4%) | $16,716 |
| Total | 1,834 (100.0%) | $31,667 |
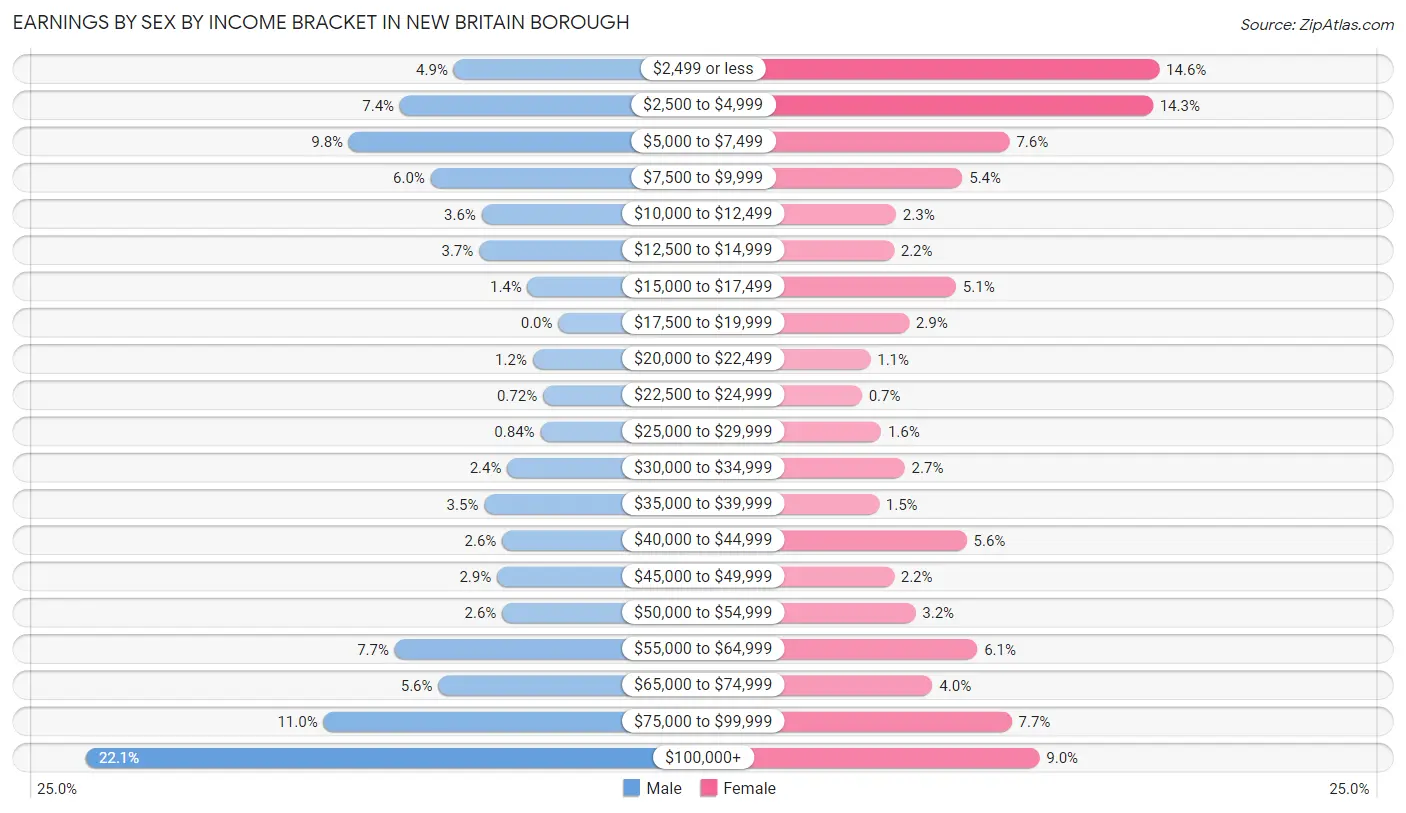
Earnings by Sex by Income Bracket in New Britain borough
The most common earnings brackets in New Britain borough are $100,000+ for men (185 | 22.1%) and $2,499 or less for women (146 | 14.6%).
| Income | Male | Female |
| $2,499 or less | 41 (4.9%) | 146 (14.6%) |
| $2,500 to $4,999 | 62 (7.4%) | 143 (14.3%) |
| $5,000 to $7,499 | 82 (9.8%) | 76 (7.6%) |
| $7,500 to $9,999 | 50 (6.0%) | 54 (5.4%) |
| $10,000 to $12,499 | 30 (3.6%) | 23 (2.3%) |
| $12,500 to $14,999 | 31 (3.7%) | 22 (2.2%) |
| $15,000 to $17,499 | 12 (1.4%) | 51 (5.1%) |
| $17,500 to $19,999 | 0 (0.0%) | 29 (2.9%) |
| $20,000 to $22,499 | 10 (1.2%) | 11 (1.1%) |
| $22,500 to $24,999 | 6 (0.7%) | 7 (0.7%) |
| $25,000 to $29,999 | 7 (0.8%) | 16 (1.6%) |
| $30,000 to $34,999 | 20 (2.4%) | 27 (2.7%) |
| $35,000 to $39,999 | 29 (3.5%) | 15 (1.5%) |
| $40,000 to $44,999 | 22 (2.6%) | 56 (5.6%) |
| $45,000 to $49,999 | 24 (2.9%) | 22 (2.2%) |
| $50,000 to $54,999 | 22 (2.6%) | 32 (3.2%) |
| $55,000 to $64,999 | 64 (7.7%) | 61 (6.1%) |
| $65,000 to $74,999 | 47 (5.6%) | 40 (4.0%) |
| $75,000 to $99,999 | 92 (11.0%) | 77 (7.7%) |
| $100,000+ | 185 (22.1%) | 90 (9.0%) |
| Total | 836 (100.0%) | 998 (100.0%) |
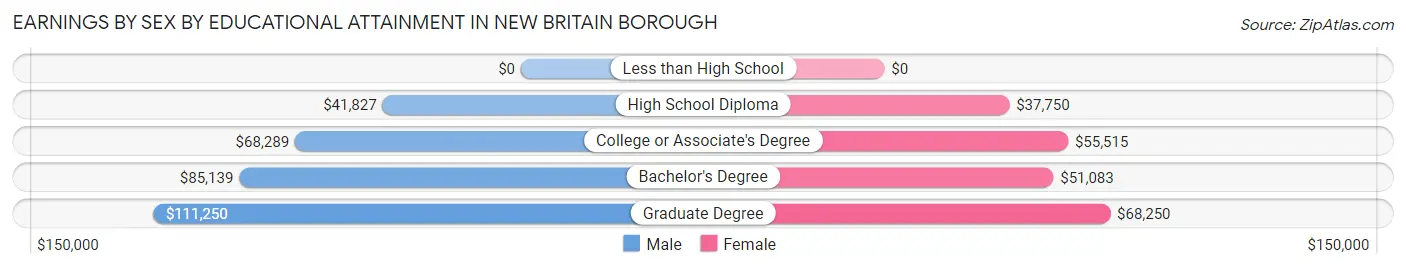
Earnings by Sex by Educational Attainment in New Britain borough
Average earnings in New Britain borough are $69,737 for men and $50,781 for women, a difference of 27.2%. Men with an educational attainment of graduate degree enjoy the highest average annual earnings of $111,250, while those with high school diploma education earn the least with $41,827. Women with an educational attainment of graduate degree earn the most with the average annual earnings of $68,250, while those with high school diploma education have the smallest earnings of $37,750.
| Educational Attainment | Male Income | Female Income |
| Less than High School | - | - |
| High School Diploma | $41,827 | $37,750 |
| College or Associate's Degree | $68,289 | $55,515 |
| Bachelor's Degree | $85,139 | $51,083 |
| Graduate Degree | $111,250 | $68,250 |
| Total | $69,737 | $50,781 |
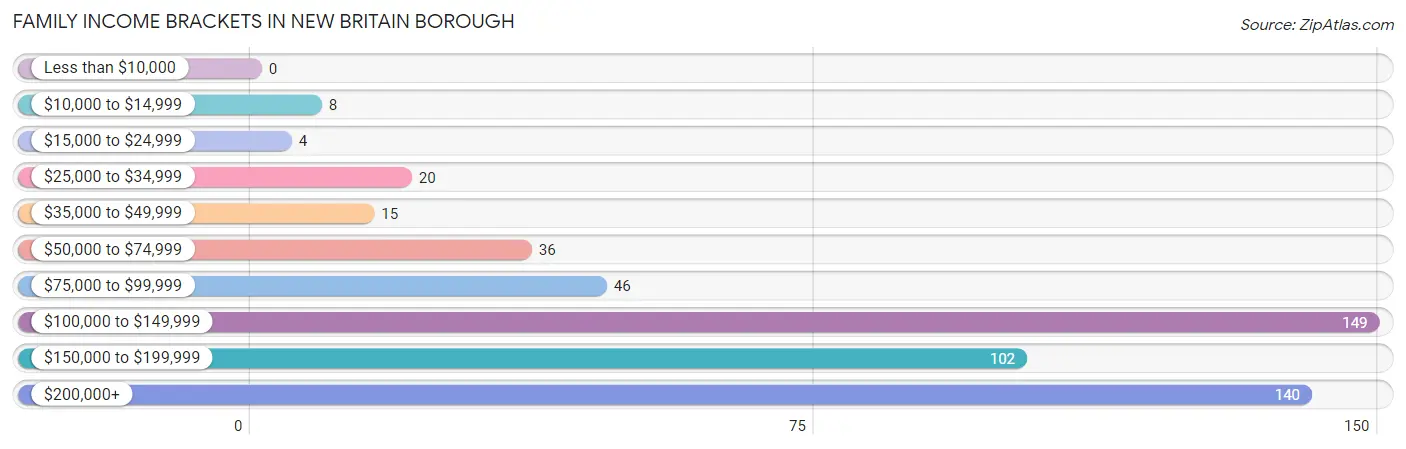
Family Income in New Britain borough
Family Income Brackets in New Britain borough
According to the New Britain borough family income data, there are 149 families falling into the $100,000 to $149,999 income range, which is the most common income bracket and makes up 28.6% of all families.
| Income Bracket | # Families | % Families |
| Less than $10,000 | 0 | 0.0% |
| $10,000 to $14,999 | 8 | 1.5% |
| $15,000 to $24,999 | 4 | 0.8% |
| $25,000 to $34,999 | 20 | 3.8% |
| $35,000 to $49,999 | 15 | 2.9% |
| $50,000 to $74,999 | 36 | 6.9% |
| $75,000 to $99,999 | 46 | 8.8% |
| $100,000 to $149,999 | 149 | 28.7% |
| $150,000 to $199,999 | 102 | 19.6% |
| $200,000+ | 140 | 26.9% |
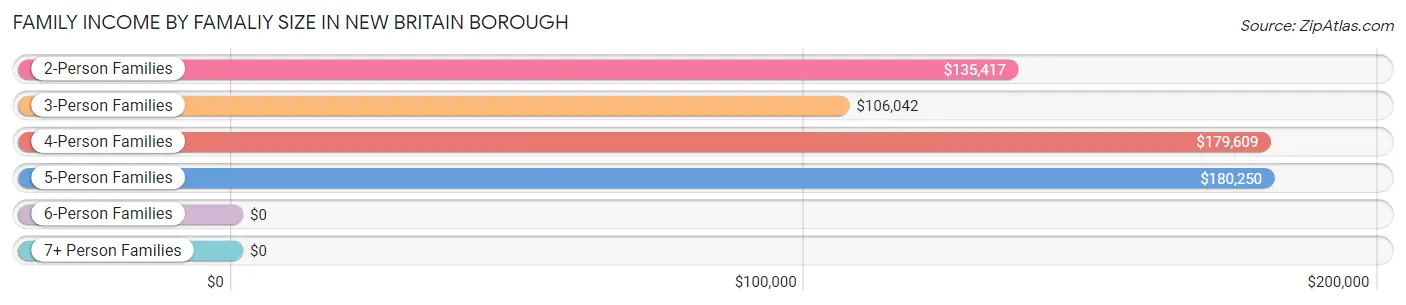
Family Income by Famaliy Size in New Britain borough
5-person families (67 | 12.9%) account for the highest median family income in New Britain borough with $180,250 per family, while 2-person families (271 | 52.1%) have the highest median income of $67,708 per family member.
| Income Bracket | # Families | Median Income |
| 2-Person Families | 271 (52.1%) | $135,417 |
| 3-Person Families | 59 (11.4%) | $106,042 |
| 4-Person Families | 109 (21.0%) | $179,609 |
| 5-Person Families | 67 (12.9%) | $180,250 |
| 6-Person Families | 2 (0.4%) | $0 |
| 7+ Person Families | 12 (2.3%) | $0 |
| Total | 520 (100.0%) | $147,361 |
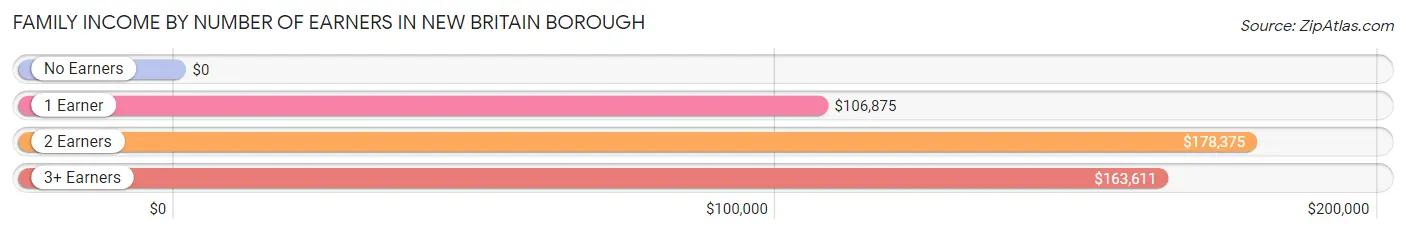
Family Income by Number of Earners in New Britain borough
| Number of Earners | # Families | Median Income |
| No Earners | 29 (5.6%) | $0 |
| 1 Earner | 143 (27.5%) | $106,875 |
| 2 Earners | 258 (49.6%) | $178,375 |
| 3+ Earners | 90 (17.3%) | $163,611 |
| Total | 520 (100.0%) | $147,361 |
Household Income in New Britain borough
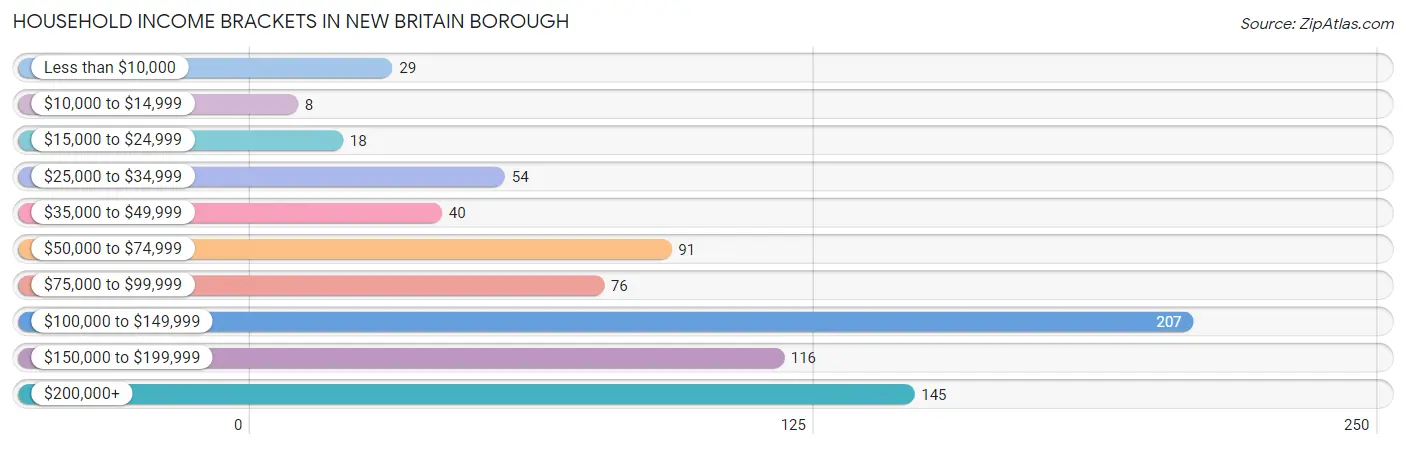
Household Income Brackets in New Britain borough
With 207 households falling in the category, the $100,000 to $149,999 income range is the most frequent in New Britain borough, accounting for 26.4% of all households. In contrast, only 8 households (1.0%) fall into the $10,000 to $14,999 income bracket, making it the least populous group.
| Income Bracket | # Households | % Households |
| Less than $10,000 | 29 | 3.7% |
| $10,000 to $14,999 | 8 | 1.0% |
| $15,000 to $24,999 | 18 | 2.3% |
| $25,000 to $34,999 | 54 | 6.9% |
| $35,000 to $49,999 | 40 | 5.1% |
| $50,000 to $74,999 | 91 | 11.6% |
| $75,000 to $99,999 | 76 | 9.7% |
| $100,000 to $149,999 | 207 | 26.4% |
| $150,000 to $199,999 | 116 | 14.8% |
| $200,000+ | 145 | 18.5% |
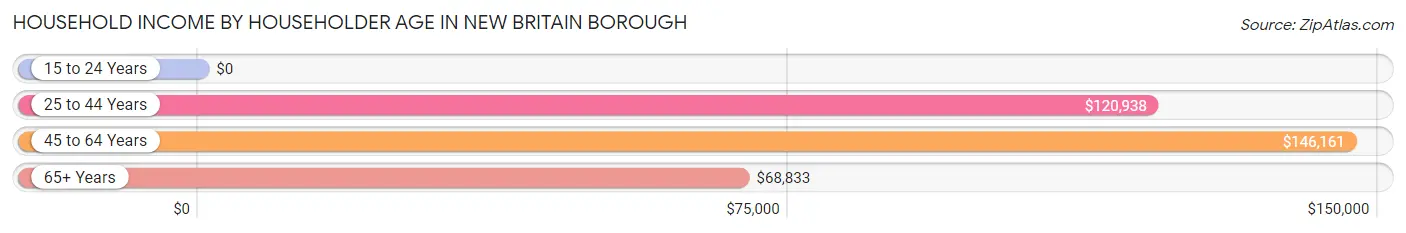
Household Income by Householder Age in New Britain borough
The median household income in New Britain borough is $120,294, with the highest median household income of $146,161 found in the 45 to 64 years age bracket for the primary householder. A total of 307 households (39.2%) fall into this category. Meanwhile, the 15 to 24 years age bracket for the primary householder has the lowest median household income of $0, with 6 households (0.8%) in this group.
| Income Bracket | # Households | Median Income |
| 15 to 24 Years | 6 (0.8%) | $0 |
| 25 to 44 Years | 199 (25.4%) | $120,938 |
| 45 to 64 Years | 307 (39.2%) | $146,161 |
| 65+ Years | 272 (34.7%) | $68,833 |
| Total | 784 (100.0%) | $120,294 |
Poverty in New Britain borough
Income Below Poverty by Sex and Age in New Britain borough
With 3.2% poverty level for males and 3.2% for females among the residents of New Britain borough, 65 to 74 year old males and 15 year old females are the most vulnerable to poverty, with 17 males (13.9%) and 2 females (25.0%) in their respective age groups living below the poverty level.
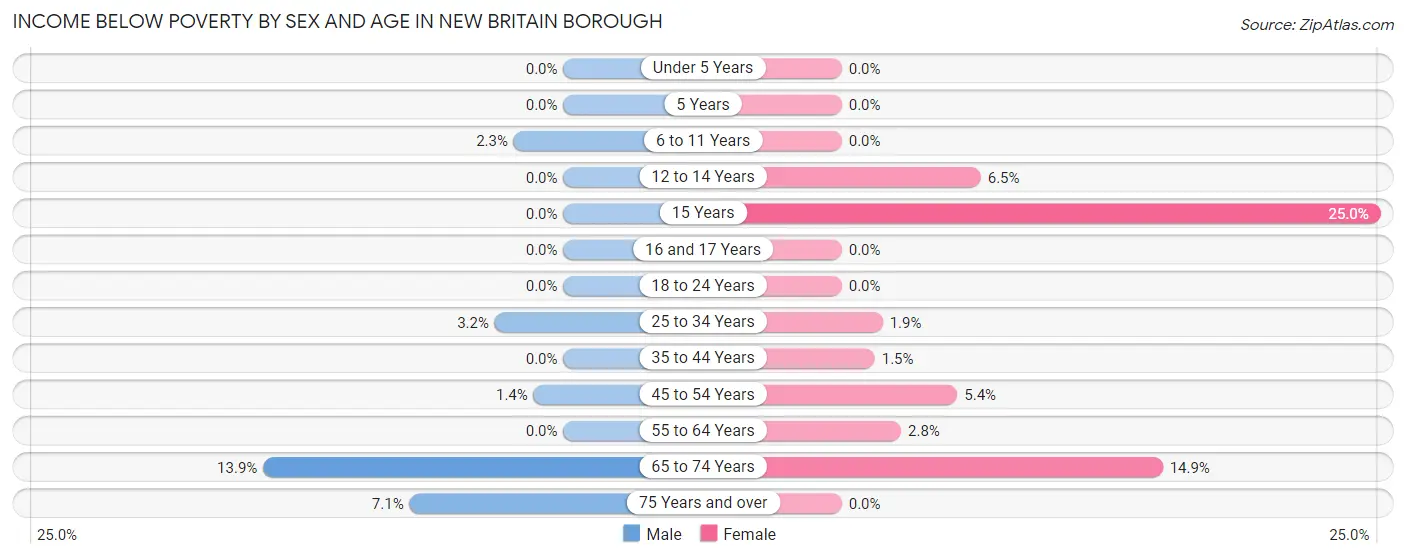
| Age Bracket | Male | Female |
| Under 5 Years | 0 (0.0%) | 0 (0.0%) |
| 5 Years | 0 (0.0%) | 0 (0.0%) |
| 6 to 11 Years | 2 (2.3%) | 0 (0.0%) |
| 12 to 14 Years | 0 (0.0%) | 2 (6.5%) |
| 15 Years | 0 (0.0%) | 2 (25.0%) |
| 16 and 17 Years | 0 (0.0%) | 0 (0.0%) |
| 18 to 24 Years | 0 (0.0%) | 0 (0.0%) |
| 25 to 34 Years | 5 (3.2%) | 2 (1.9%) |
| 35 to 44 Years | 0 (0.0%) | 2 (1.5%) |
| 45 to 54 Years | 2 (1.4%) | 6 (5.4%) |
| 55 to 64 Years | 0 (0.0%) | 6 (2.8%) |
| 65 to 74 Years | 17 (13.9%) | 14 (14.9%) |
| 75 Years and over | 6 (7.1%) | 0 (0.0%) |
| Total | 32 (3.2%) | 34 (3.2%) |
Income Above Poverty by Sex and Age in New Britain borough
According to the poverty statistics in New Britain borough, males aged under 5 years and females aged under 5 years are the age groups that are most secure financially, with 100.0% of males and 100.0% of females in these age groups living above the poverty line.
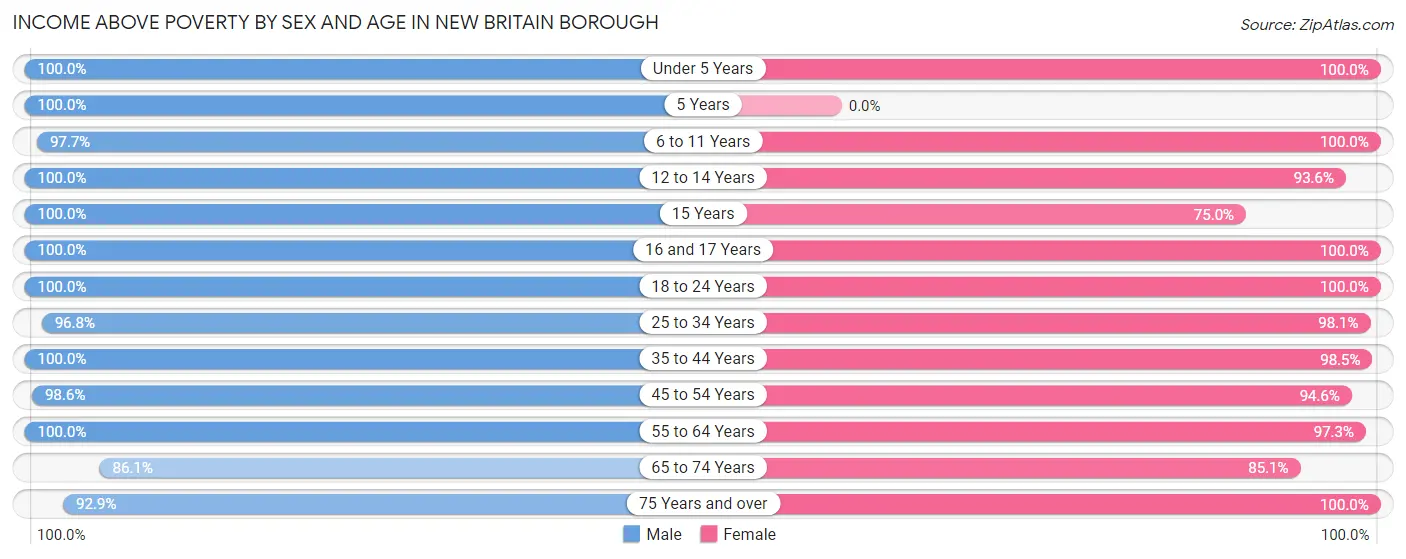
| Age Bracket | Male | Female |
| Under 5 Years | 17 (100.0%) | 47 (100.0%) |
| 5 Years | 7 (100.0%) | 0 (0.0%) |
| 6 to 11 Years | 85 (97.7%) | 86 (100.0%) |
| 12 to 14 Years | 27 (100.0%) | 29 (93.5%) |
| 15 Years | 23 (100.0%) | 6 (75.0%) |
| 16 and 17 Years | 27 (100.0%) | 112 (100.0%) |
| 18 to 24 Years | 68 (100.0%) | 56 (100.0%) |
| 25 to 34 Years | 152 (96.8%) | 103 (98.1%) |
| 35 to 44 Years | 121 (100.0%) | 129 (98.5%) |
| 45 to 54 Years | 143 (98.6%) | 106 (94.6%) |
| 55 to 64 Years | 110 (100.0%) | 212 (97.3%) |
| 65 to 74 Years | 105 (86.1%) | 80 (85.1%) |
| 75 Years and over | 78 (92.9%) | 74 (100.0%) |
| Total | 963 (96.8%) | 1,040 (96.8%) |
Income Below Poverty Among Married-Couple Families in New Britain borough
The poverty statistics for married-couple families in New Britain borough show that 1.4% or 6 of the total 417 families live below the poverty line. Families with 3 or 4 children have the highest poverty rate of 9.1%, comprising of 2 families. On the other hand, families with 1 or 2 children have the lowest poverty rate of 0.0%, which includes 0 families.
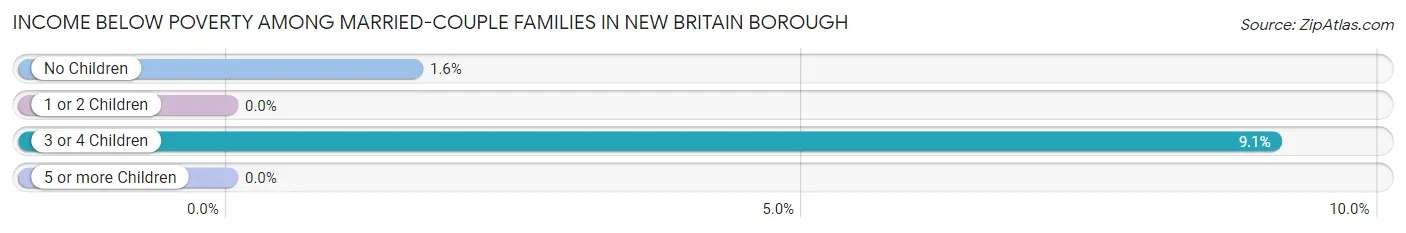
| Children | Above Poverty | Below Poverty |
| No Children | 244 (98.4%) | 4 (1.6%) |
| 1 or 2 Children | 147 (100.0%) | 0 (0.0%) |
| 3 or 4 Children | 20 (90.9%) | 2 (9.1%) |
| 5 or more Children | 0 (0.0%) | 0 (0.0%) |
| Total | 411 (98.6%) | 6 (1.4%) |
Income Below Poverty Among Single-Parent Households in New Britain borough
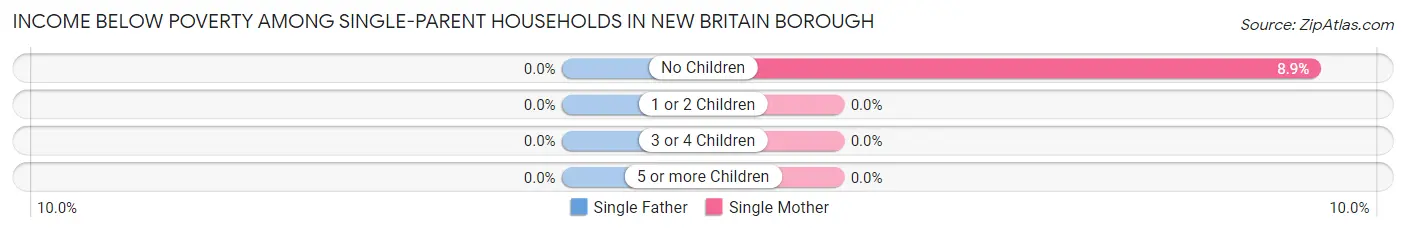
| Children | Single Father | Single Mother |
| No Children | 0 (0.0%) | 4 (8.9%) |
| 1 or 2 Children | 0 (0.0%) | 0 (0.0%) |
| 3 or 4 Children | 0 (0.0%) | 0 (0.0%) |
| 5 or more Children | 0 (0.0%) | 0 (0.0%) |
| Total | 0 (0.0%) | 4 (5.3%) |
Income Below Poverty Among Married-Couple vs Single-Parent Households in New Britain borough
The poverty data for New Britain borough shows that 6 of the married-couple family households (1.4%) and 4 of the single-parent households (3.9%) are living below the poverty level. Within the married-couple family households, those with 3 or 4 children have the highest poverty rate, with 2 households (9.1%) falling below the poverty line. Among the single-parent households, those with no children have the highest poverty rate, with 4 household (7.1%) living below poverty.
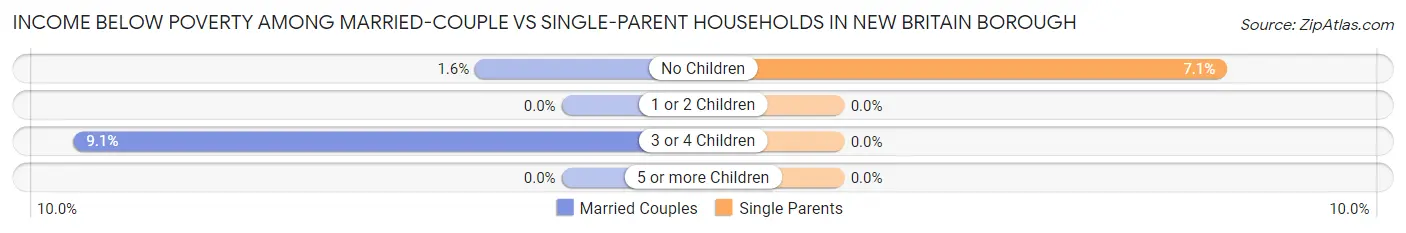
| Children | Married-Couple Families | Single-Parent Households |
| No Children | 4 (1.6%) | 4 (7.1%) |
| 1 or 2 Children | 0 (0.0%) | 0 (0.0%) |
| 3 or 4 Children | 2 (9.1%) | 0 (0.0%) |
| 5 or more Children | 0 (0.0%) | 0 (0.0%) |
| Total | 6 (1.4%) | 4 (3.9%) |
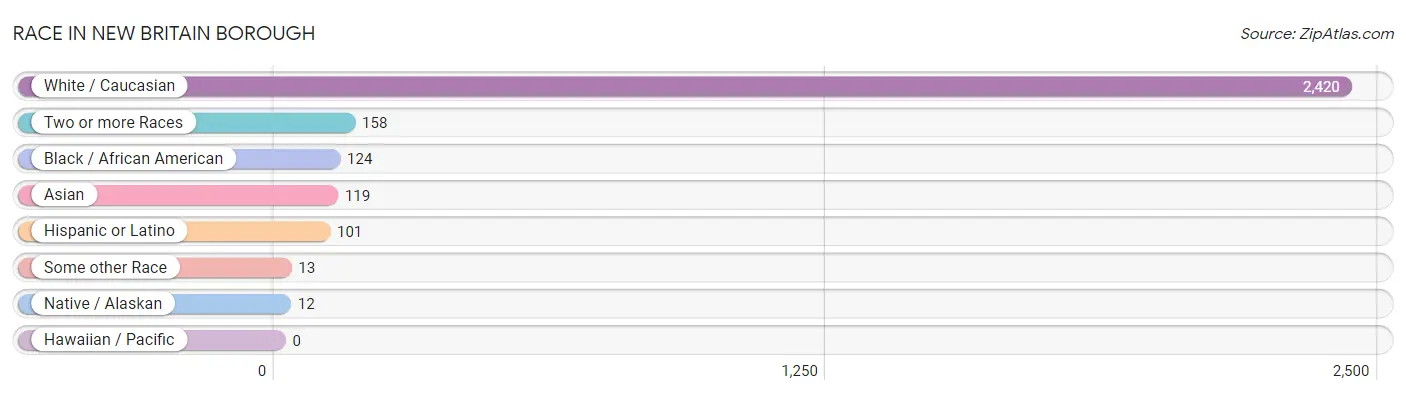
Race in New Britain borough
The most populous races in New Britain borough are White / Caucasian (2,420 | 85.0%), Two or more Races (158 | 5.6%), and Black / African American (124 | 4.4%).
| Race | # Population | % Population |
| Asian | 119 | 4.2% |
| Black / African American | 124 | 4.4% |
| Hawaiian / Pacific | 0 | 0.0% |
| Hispanic or Latino | 101 | 3.5% |
| Native / Alaskan | 12 | 0.4% |
| White / Caucasian | 2,420 | 85.0% |
| Two or more Races | 158 | 5.6% |
| Some other Race | 13 | 0.5% |
| Total | 2,846 | 100.0% |
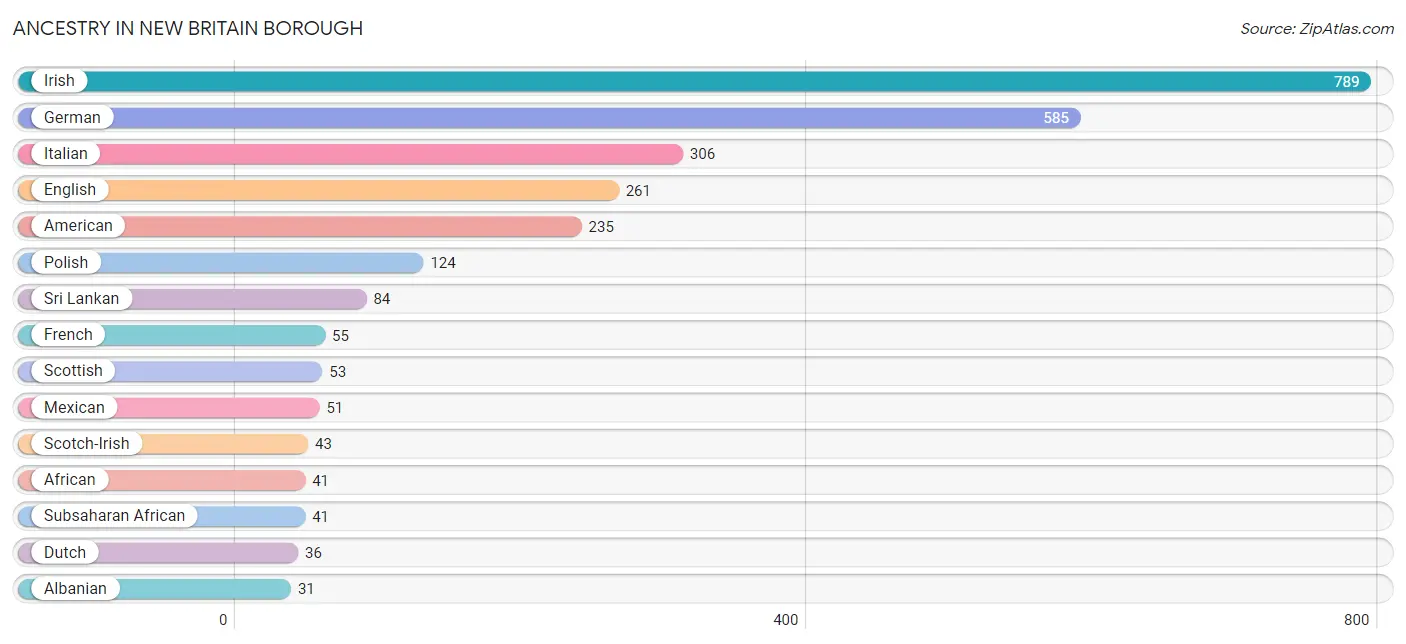
Ancestry in New Britain borough
The most populous ancestries reported in New Britain borough are Irish (789 | 27.7%), German (585 | 20.6%), Italian (306 | 10.7%), English (261 | 9.2%), and American (235 | 8.3%), together accounting for 76.5% of all New Britain borough residents.
| Ancestry | # Population | % Population |
| African | 41 | 1.4% |
| Albanian | 31 | 1.1% |
| American | 235 | 8.3% |
| Arab | 17 | 0.6% |
| Armenian | 9 | 0.3% |
| Austrian | 13 | 0.5% |
| British | 7 | 0.3% |
| Burmese | 8 | 0.3% |
| Central American | 5 | 0.2% |
| Cuban | 5 | 0.2% |
| Czech | 24 | 0.8% |
| Dutch | 36 | 1.3% |
| Eastern European | 9 | 0.3% |
| English | 261 | 9.2% |
| European | 26 | 0.9% |
| French | 55 | 1.9% |
| German | 585 | 20.6% |
| Greek | 4 | 0.1% |
| Honduran | 5 | 0.2% |
| Hungarian | 12 | 0.4% |
| Indian (Asian) | 22 | 0.8% |
| Irish | 789 | 27.7% |
| Italian | 306 | 10.7% |
| Jamaican | 2 | 0.1% |
| Korean | 30 | 1.1% |
| Lebanese | 7 | 0.3% |
| Lithuanian | 4 | 0.1% |
| Mexican | 51 | 1.8% |
| Norwegian | 4 | 0.1% |
| Pakistani | 19 | 0.7% |
| Pennsylvania German | 10 | 0.4% |
| Peruvian | 28 | 1.0% |
| Polish | 124 | 4.4% |
| Puerto Rican | 6 | 0.2% |
| Romanian | 26 | 0.9% |
| Russian | 13 | 0.5% |
| Scotch-Irish | 43 | 1.5% |
| Scottish | 53 | 1.9% |
| Slavic | 4 | 0.1% |
| Slovak | 4 | 0.1% |
| South American | 28 | 1.0% |
| Sri Lankan | 84 | 2.9% |
| Subsaharan African | 41 | 1.4% |
| Swedish | 11 | 0.4% |
| Swiss | 17 | 0.6% |
| Syrian | 10 | 0.4% |
| Ukrainian | 4 | 0.1% | View All 47 Rows |
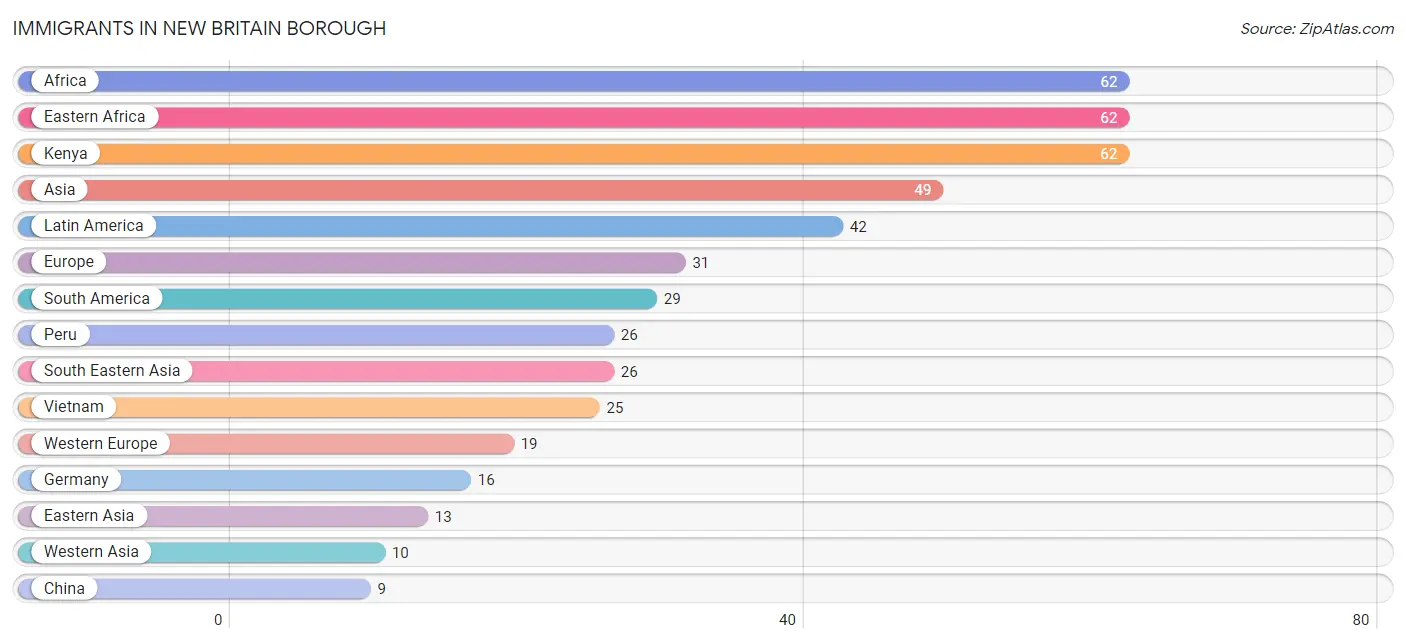
Immigrants in New Britain borough
The most numerous immigrant groups reported in New Britain borough came from Africa (62 | 2.2%), Eastern Africa (62 | 2.2%), Kenya (62 | 2.2%), Asia (49 | 1.7%), and Latin America (42 | 1.5%), together accounting for 9.7% of all New Britain borough residents.
| Immigration Origin | # Population | % Population |
| Africa | 62 | 2.2% |
| Argentina | 3 | 0.1% |
| Asia | 49 | 1.7% |
| Canada | 3 | 0.1% |
| Caribbean | 5 | 0.2% |
| Central America | 8 | 0.3% |
| China | 9 | 0.3% |
| Cuba | 5 | 0.2% |
| Eastern Africa | 62 | 2.2% |
| Eastern Asia | 13 | 0.5% |
| Eastern Europe | 8 | 0.3% |
| Europe | 31 | 1.1% |
| France | 3 | 0.1% |
| Germany | 16 | 0.6% |
| Kenya | 62 | 2.2% |
| Korea | 4 | 0.1% |
| Kuwait | 6 | 0.2% |
| Latin America | 42 | 1.5% |
| Mexico | 8 | 0.3% |
| Northern Europe | 4 | 0.1% |
| Peru | 26 | 0.9% |
| Romania | 8 | 0.3% |
| Scotland | 4 | 0.1% |
| Singapore | 1 | 0.0% |
| South America | 29 | 1.0% |
| South Eastern Asia | 26 | 0.9% |
| Syria | 4 | 0.1% |
| Vietnam | 25 | 0.9% |
| Western Asia | 10 | 0.4% |
| Western Europe | 19 | 0.7% | View All 30 Rows |
Sex and Age in New Britain borough
Sex and Age in New Britain borough
The most populous age groups in New Britain borough are 20 to 24 Years (313 | 22.5%) for men and 15 to 19 Years (292 | 20.1%) for women.
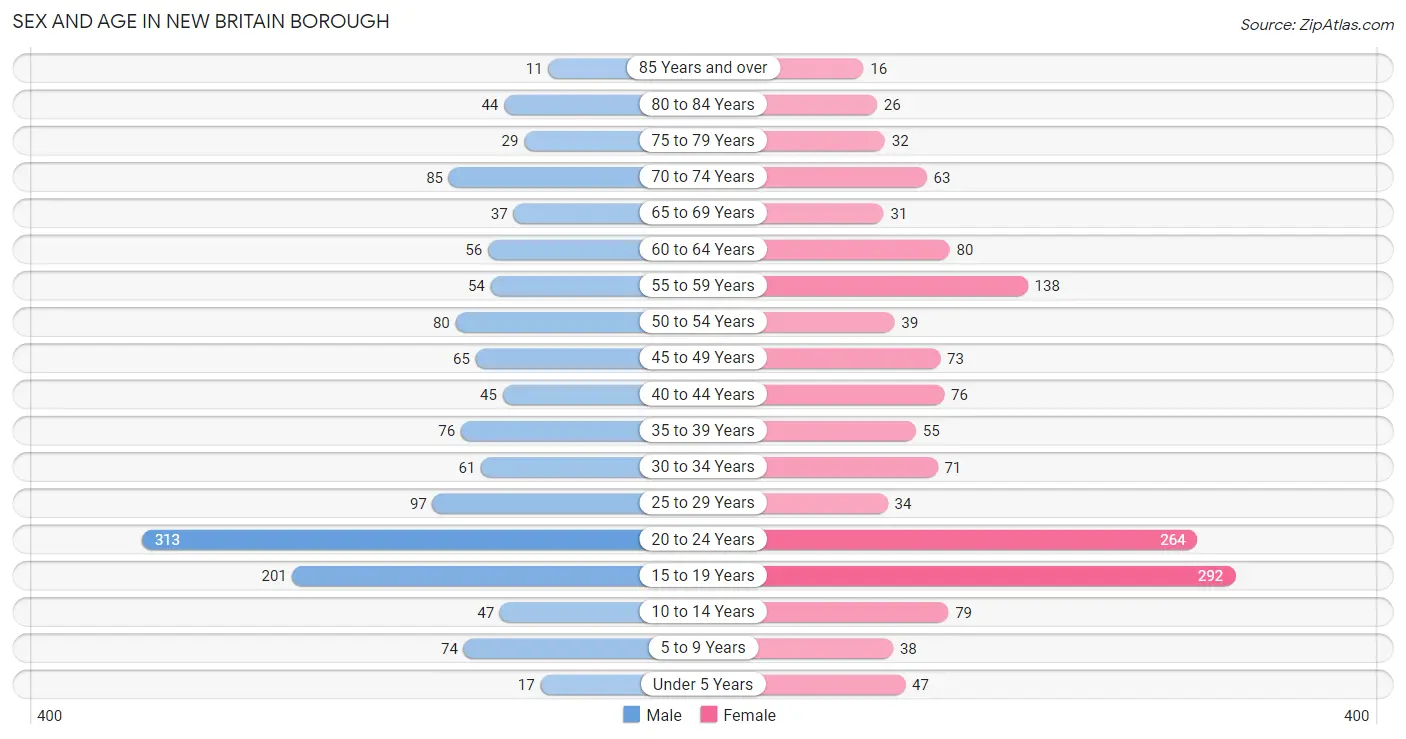
| Age Bracket | Male | Female |
| Under 5 Years | 17 (1.2%) | 47 (3.2%) |
| 5 to 9 Years | 74 (5.3%) | 38 (2.6%) |
| 10 to 14 Years | 47 (3.4%) | 79 (5.4%) |
| 15 to 19 Years | 201 (14.4%) | 292 (20.1%) |
| 20 to 24 Years | 313 (22.5%) | 264 (18.2%) |
| 25 to 29 Years | 97 (7.0%) | 34 (2.3%) |
| 30 to 34 Years | 61 (4.4%) | 71 (4.9%) |
| 35 to 39 Years | 76 (5.5%) | 55 (3.8%) |
| 40 to 44 Years | 45 (3.2%) | 76 (5.2%) |
| 45 to 49 Years | 65 (4.7%) | 73 (5.0%) |
| 50 to 54 Years | 80 (5.8%) | 39 (2.7%) |
| 55 to 59 Years | 54 (3.9%) | 138 (9.5%) |
| 60 to 64 Years | 56 (4.0%) | 80 (5.5%) |
| 65 to 69 Years | 37 (2.7%) | 31 (2.1%) |
| 70 to 74 Years | 85 (6.1%) | 63 (4.3%) |
| 75 to 79 Years | 29 (2.1%) | 32 (2.2%) |
| 80 to 84 Years | 44 (3.2%) | 26 (1.8%) |
| 85 Years and over | 11 (0.8%) | 16 (1.1%) |
| Total | 1,392 (100.0%) | 1,454 (100.0%) |
Families and Households in New Britain borough
Median Family Size in New Britain borough
The median family size in New Britain borough is 3.33 persons per family, with single female/mother families (75 | 14.4%) accounting for the largest median family size of 4.44 persons per family. On the other hand, single male/father families (28 | 5.4%) represent the smallest median family size with 2.32 persons per family.
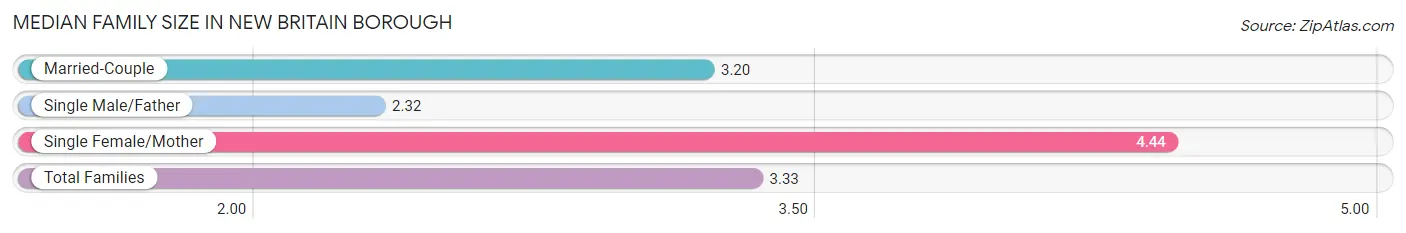
| Family Type | # Families | Family Size |
| Married-Couple | 417 (80.2%) | 3.20 |
| Single Male/Father | 28 (5.4%) | 2.32 |
| Single Female/Mother | 75 (14.4%) | 4.44 |
| Total Families | 520 (100.0%) | 3.33 |
Median Household Size in New Britain borough
The median household size in New Britain borough is 2.62 persons per household, with single female/mother households (75 | 9.6%) accounting for the largest median household size of 4.51 persons per household. non-family households (264 | 33.7%) represent the smallest median household size with 1.17 persons per household.
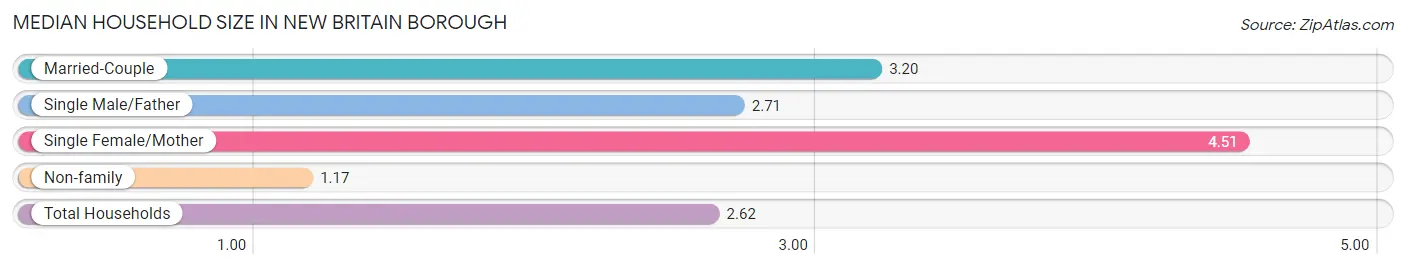
| Household Type | # Households | Household Size |
| Married-Couple | 417 (53.2%) | 3.20 |
| Single Male/Father | 28 (3.6%) | 2.71 |
| Single Female/Mother | 75 (9.6%) | 4.51 |
| Non-family | 264 (33.7%) | 1.17 |
| Total Households | 784 (100.0%) | 2.62 |
Household Size by Marriage Status in New Britain borough
Out of a total of 784 households in New Britain borough, 520 (66.3%) are family households, while 264 (33.7%) are nonfamily households. The most numerous type of family households are 2-person households, comprising 256, and the most common type of nonfamily households are 1-person households, comprising 221.
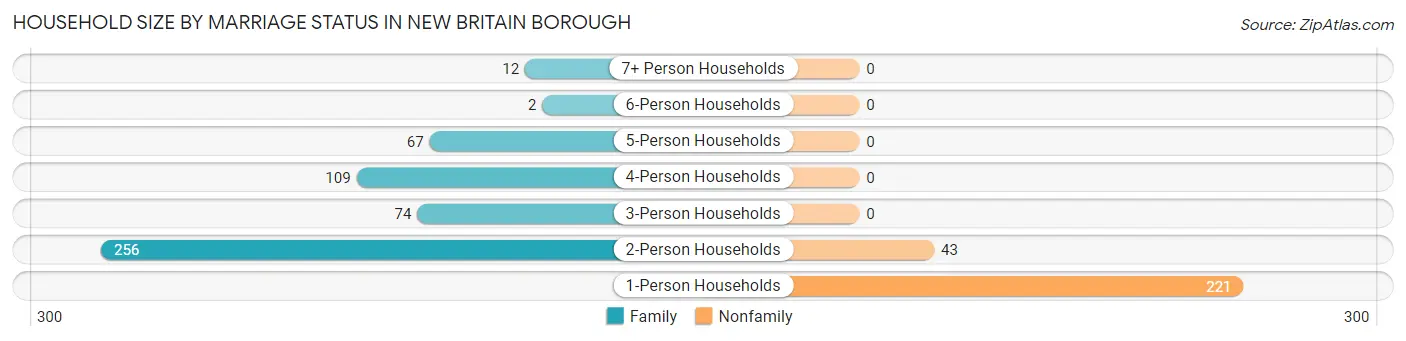
| Household Size | Family Households | Nonfamily Households |
| 1-Person Households | - | 221 (28.2%) |
| 2-Person Households | 256 (32.7%) | 43 (5.5%) |
| 3-Person Households | 74 (9.4%) | 0 (0.0%) |
| 4-Person Households | 109 (13.9%) | 0 (0.0%) |
| 5-Person Households | 67 (8.6%) | 0 (0.0%) |
| 6-Person Households | 2 (0.3%) | 0 (0.0%) |
| 7+ Person Households | 12 (1.5%) | 0 (0.0%) |
| Total | 520 (66.3%) | 264 (33.7%) |
Female Fertility in New Britain borough
Fertility by Age in New Britain borough
Average fertility rate in New Britain borough is 23.0 births per 1,000 women. Women in the age bracket of 20 to 34 years have the highest fertility rate with 49.0 births per 1,000 women. Women in the age bracket of 20 to 34 years acount for 90.0% of all women with births.
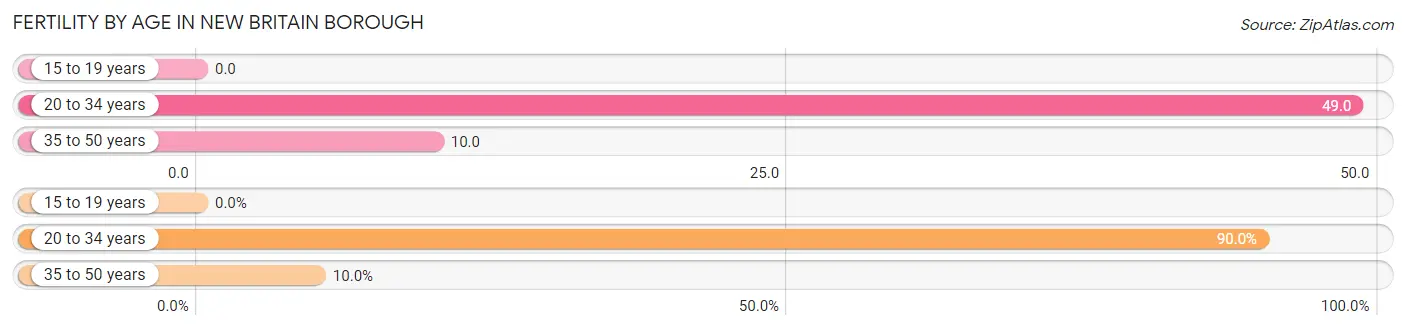
| Age Bracket | Women with Births | Births / 1,000 Women |
| 15 to 19 years | 0 (0.0%) | 0.0 |
| 20 to 34 years | 18 (90.0%) | 49.0 |
| 35 to 50 years | 2 (10.0%) | 10.0 |
| Total | 20 (100.0%) | 23.0 |
Fertility by Age by Marriage Status in New Britain borough
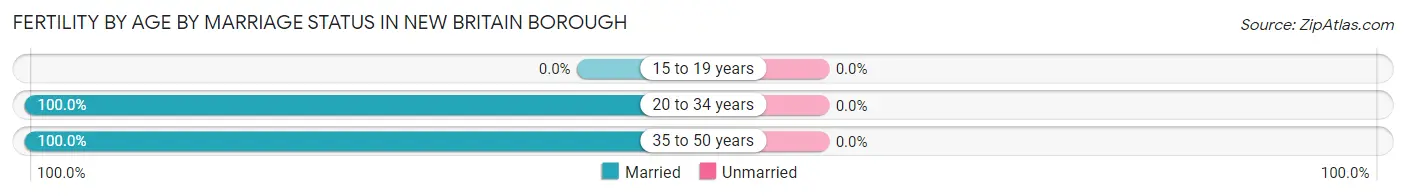
| Age Bracket | Married | Unmarried |
| 15 to 19 years | 0 (0.0%) | 0 (0.0%) |
| 20 to 34 years | 18 (100.0%) | 0 (0.0%) |
| 35 to 50 years | 2 (100.0%) | 0 (0.0%) |
| Total | 20 (100.0%) | 0 (0.0%) |
Fertility by Education in New Britain borough
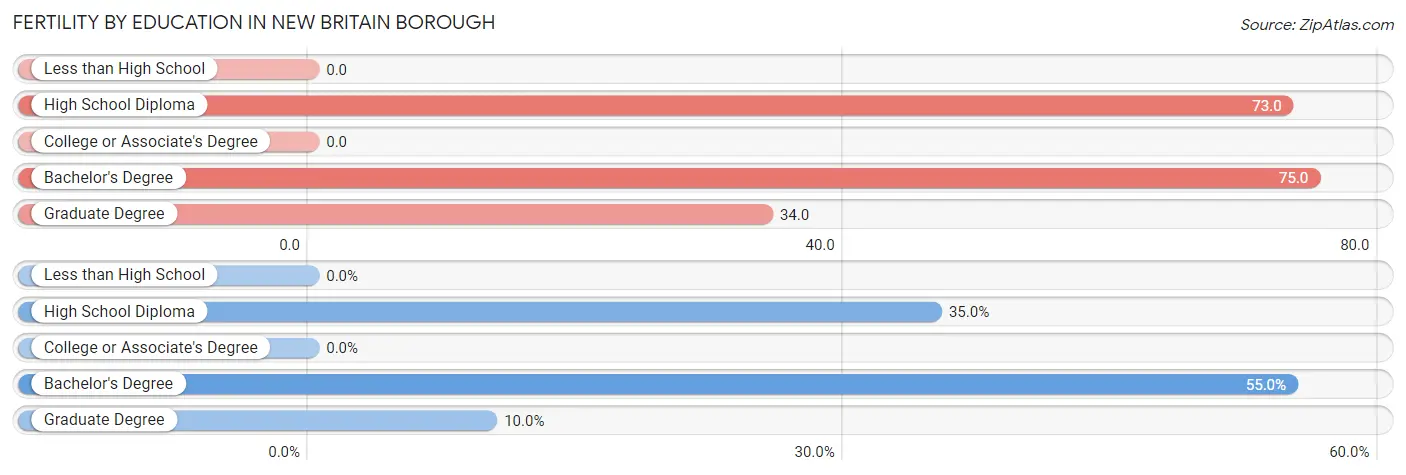
| Educational Attainment | Women with Births | Births / 1,000 Women |
| Less than High School | 0 (0.0%) | 0.0 |
| High School Diploma | 7 (35.0%) | 73.0 |
| College or Associate's Degree | 0 (0.0%) | 0.0 |
| Bachelor's Degree | 11 (55.0%) | 75.0 |
| Graduate Degree | 2 (10.0%) | 34.0 |
| Total | 20 (100.0%) | 23.0 |
Fertility by Education by Marriage Status in New Britain borough
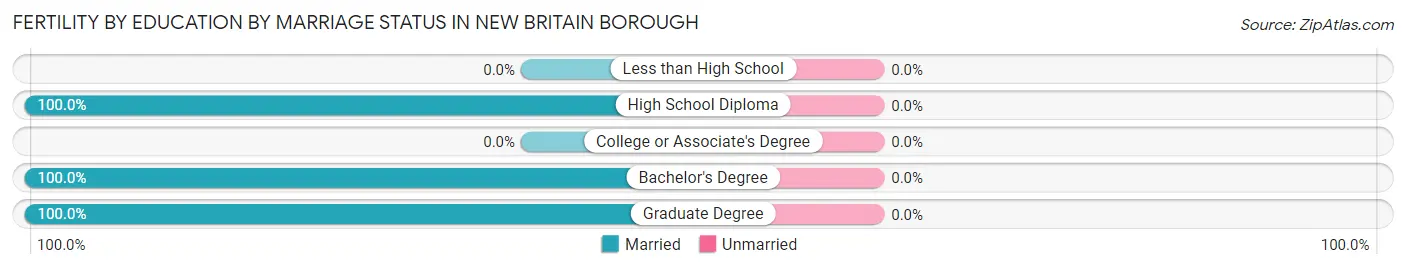
| Educational Attainment | Married | Unmarried |
| Less than High School | 0 (0.0%) | 0 (0.0%) |
| High School Diploma | 7 (100.0%) | 0 (0.0%) |
| College or Associate's Degree | 0 (0.0%) | 0 (0.0%) |
| Bachelor's Degree | 11 (100.0%) | 0 (0.0%) |
| Graduate Degree | 2 (100.0%) | 0 (0.0%) |
| Total | 20 (100.0%) | 0 (0.0%) |
Employment Characteristics in New Britain borough
Employment by Class of Employer in New Britain borough
Among the 1,400 employed individuals in New Britain borough, private company employees (1,028 | 73.4%), not-for-profit organizations (121 | 8.6%), and self-employed (not incorporated) (114 | 8.1%) make up the most common classes of employment.
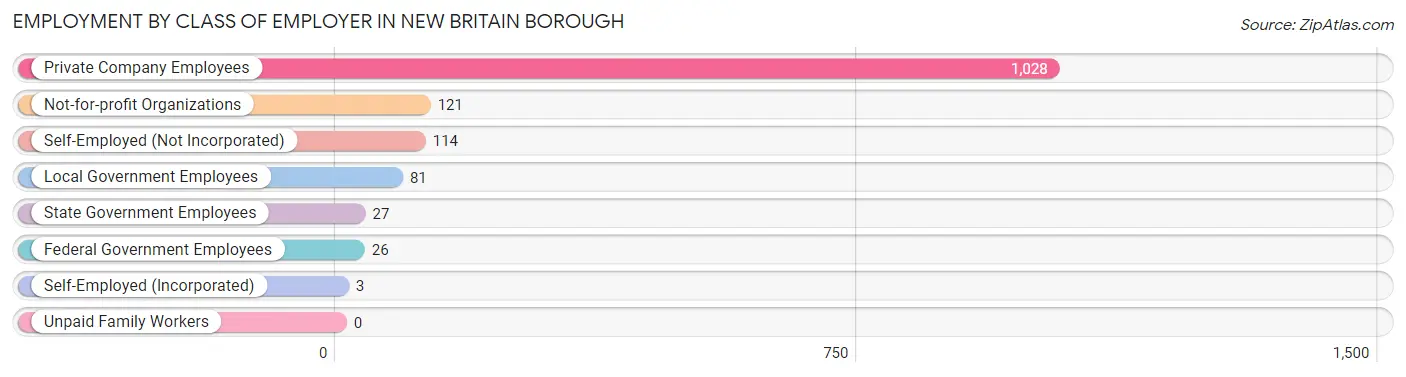
| Employer Class | # Employees | % Employees |
| Private Company Employees | 1,028 | 73.4% |
| Self-Employed (Incorporated) | 3 | 0.2% |
| Self-Employed (Not Incorporated) | 114 | 8.1% |
| Not-for-profit Organizations | 121 | 8.6% |
| Local Government Employees | 81 | 5.8% |
| State Government Employees | 27 | 1.9% |
| Federal Government Employees | 26 | 1.9% |
| Unpaid Family Workers | 0 | 0.0% |
| Total | 1,400 | 100.0% |
Employment Status by Age in New Britain borough
According to the labor force statistics for New Britain borough, out of the total population over 16 years of age (2,513), 62.1% or 1,561 individuals are in the labor force, with 3.6% or 56 of them unemployed. The age group with the highest labor force participation rate is 25 to 29 years, with 99.2% or 130 individuals in the labor force. Within the labor force, the 16 to 19 years age range has the highest percentage of unemployed individuals, with 10.6% or 17 of them being unemployed.
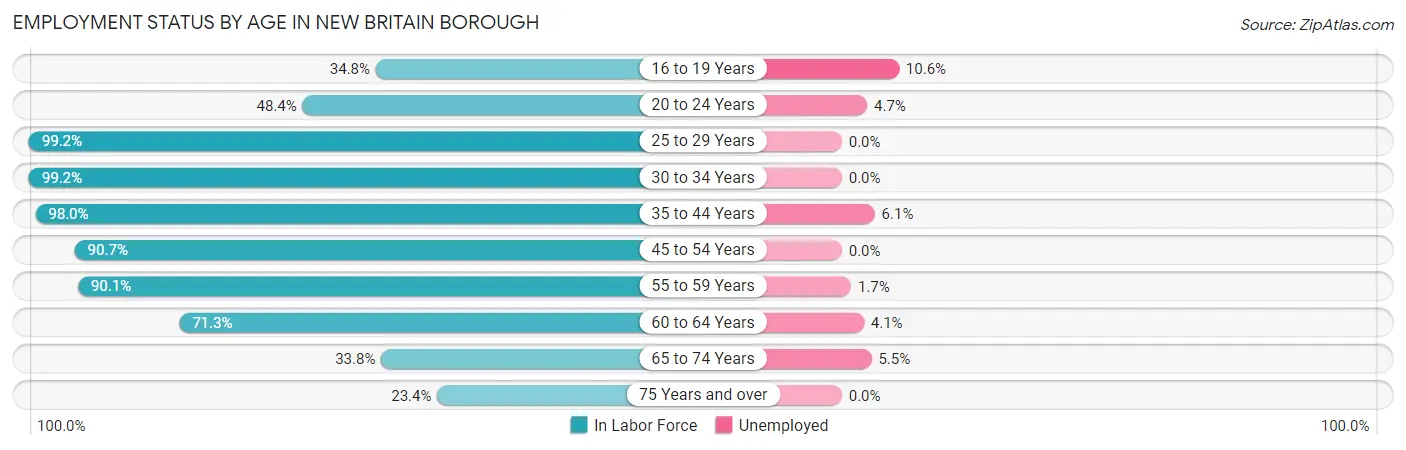
| Age Bracket | In Labor Force | Unemployed |
| 16 to 19 Years | 161 (34.8%) | 17 (10.6%) |
| 20 to 24 Years | 279 (48.4%) | 13 (4.7%) |
| 25 to 29 Years | 130 (99.2%) | 0 (0.0%) |
| 30 to 34 Years | 131 (99.2%) | 0 (0.0%) |
| 35 to 44 Years | 247 (98.0%) | 15 (6.1%) |
| 45 to 54 Years | 233 (90.7%) | 0 (0.0%) |
| 55 to 59 Years | 173 (90.1%) | 3 (1.7%) |
| 60 to 64 Years | 97 (71.3%) | 4 (4.1%) |
| 65 to 74 Years | 73 (33.8%) | 4 (5.5%) |
| 75 Years and over | 37 (23.4%) | 0 (0.0%) |
| Total | 1,561 (62.1%) | 56 (3.6%) |
Employment Status by Educational Attainment in New Britain borough
According to labor force statistics for New Britain borough, 91.9% of individuals (1,011) out of the total population between 25 and 64 years of age (1,100) are in the labor force, with 2.2% or 22 of them being unemployed. The group with the highest labor force participation rate are those with the educational attainment of bachelor's degree or higher, with 94.2% or 557 individuals in the labor force. Within the labor force, individuals with less than high school education have the highest percentage of unemployment, with 45.8% or 11 of them being unemployed.
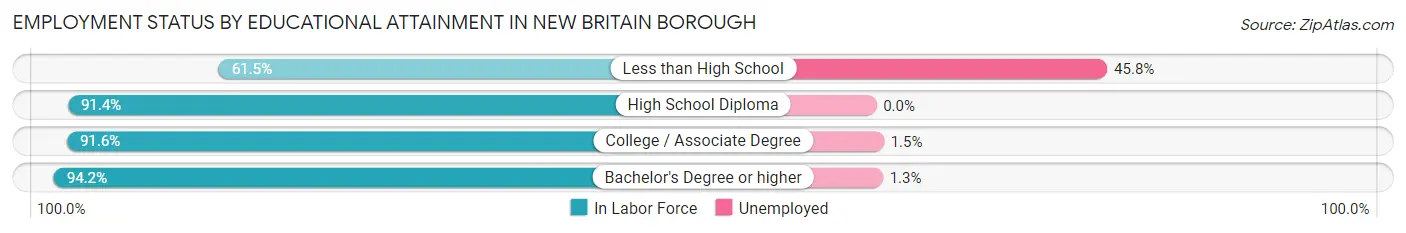
| Educational Attainment | In Labor Force | Unemployed |
| Less than High School | 24 (61.5%) | 18 (45.8%) |
| High School Diploma | 169 (91.4%) | 0 (0.0%) |
| College / Associate Degree | 261 (91.6%) | 4 (1.5%) |
| Bachelor's Degree or higher | 557 (94.2%) | 8 (1.3%) |
| Total | 1,011 (91.9%) | 24 (2.2%) |
Employment Occupations by Sex in New Britain borough
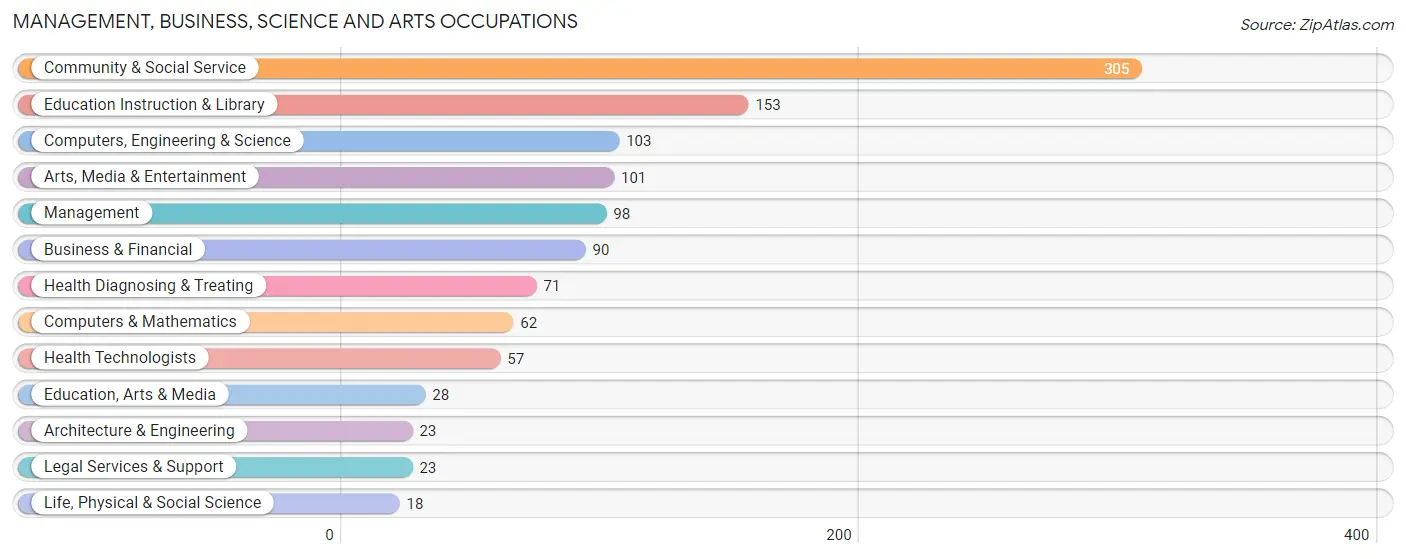
Management, Business, Science and Arts Occupations
The most common Management, Business, Science and Arts occupations in New Britain borough are Community & Social Service (305 | 20.3%), Education Instruction & Library (153 | 10.2%), Computers, Engineering & Science (103 | 6.8%), Arts, Media & Entertainment (101 | 6.7%), and Management (98 | 6.5%).
Management, Business, Science and Arts Occupations by Sex
Within the Management, Business, Science and Arts occupations in New Britain borough, the most male-oriented occupations are Architecture & Engineering (87.0%), Computers, Engineering & Science (78.6%), and Computers & Mathematics (77.4%), while the most female-oriented occupations are Education Instruction & Library (97.4%), Health Diagnosing & Treating (88.7%), and Health Technologists (86.0%).
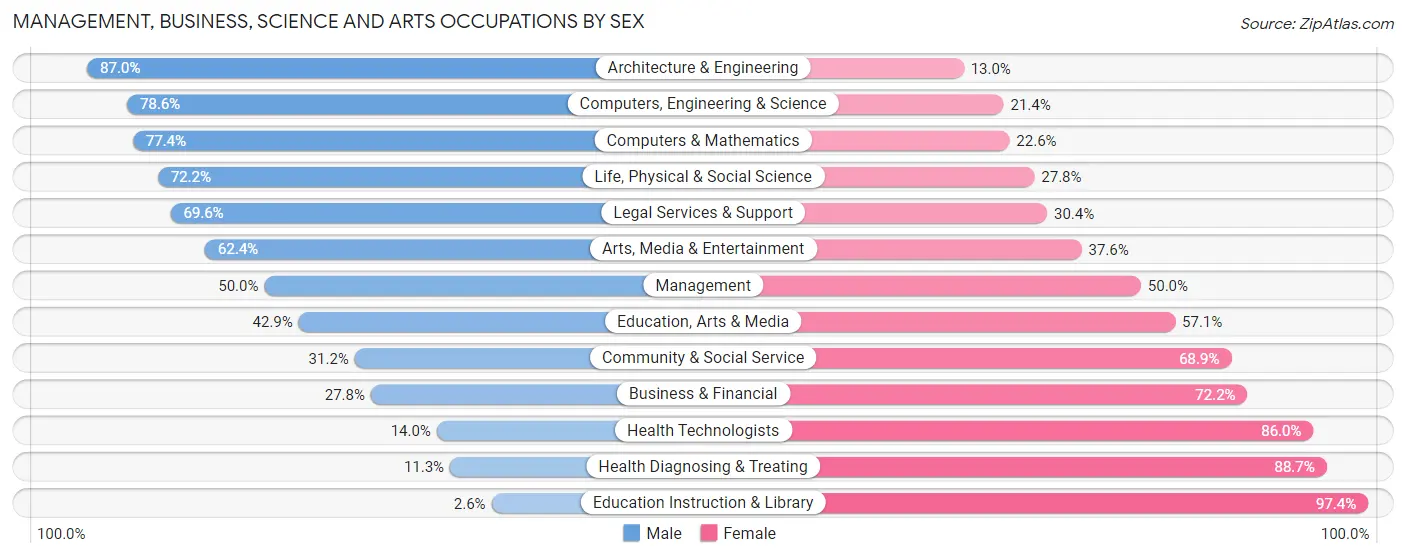
| Occupation | Male | Female |
| Management | 49 (50.0%) | 49 (50.0%) |
| Business & Financial | 25 (27.8%) | 65 (72.2%) |
| Computers, Engineering & Science | 81 (78.6%) | 22 (21.4%) |
| Computers & Mathematics | 48 (77.4%) | 14 (22.6%) |
| Architecture & Engineering | 20 (87.0%) | 3 (13.0%) |
| Life, Physical & Social Science | 13 (72.2%) | 5 (27.8%) |
| Community & Social Service | 95 (31.1%) | 210 (68.9%) |
| Education, Arts & Media | 12 (42.9%) | 16 (57.1%) |
| Legal Services & Support | 16 (69.6%) | 7 (30.4%) |
| Education Instruction & Library | 4 (2.6%) | 149 (97.4%) |
| Arts, Media & Entertainment | 63 (62.4%) | 38 (37.6%) |
| Health Diagnosing & Treating | 8 (11.3%) | 63 (88.7%) |
| Health Technologists | 8 (14.0%) | 49 (86.0%) |
| Total (Category) | 258 (38.7%) | 409 (61.3%) |
| Total (Overall) | 663 (44.1%) | 842 (55.9%) |
Services Occupations
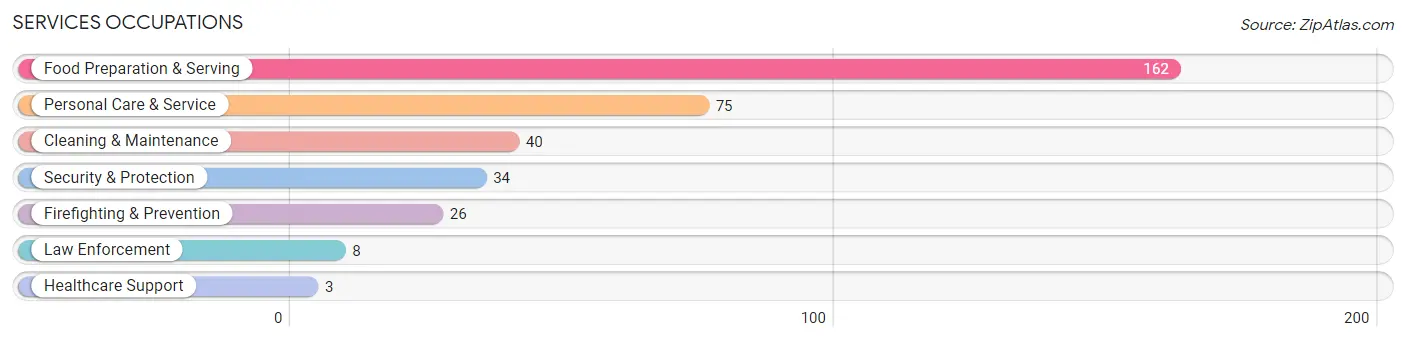
The most common Services occupations in New Britain borough are Food Preparation & Serving (162 | 10.8%), Personal Care & Service (75 | 5.0%), Cleaning & Maintenance (40 | 2.7%), Security & Protection (34 | 2.3%), and Firefighting & Prevention (26 | 1.7%).
Services Occupations by Sex
Within the Services occupations in New Britain borough, the most male-oriented occupations are Firefighting & Prevention (96.2%), Security & Protection (82.4%), and Law Enforcement (37.5%), while the most female-oriented occupations are Healthcare Support (100.0%), Food Preparation & Serving (82.1%), and Personal Care & Service (76.0%).
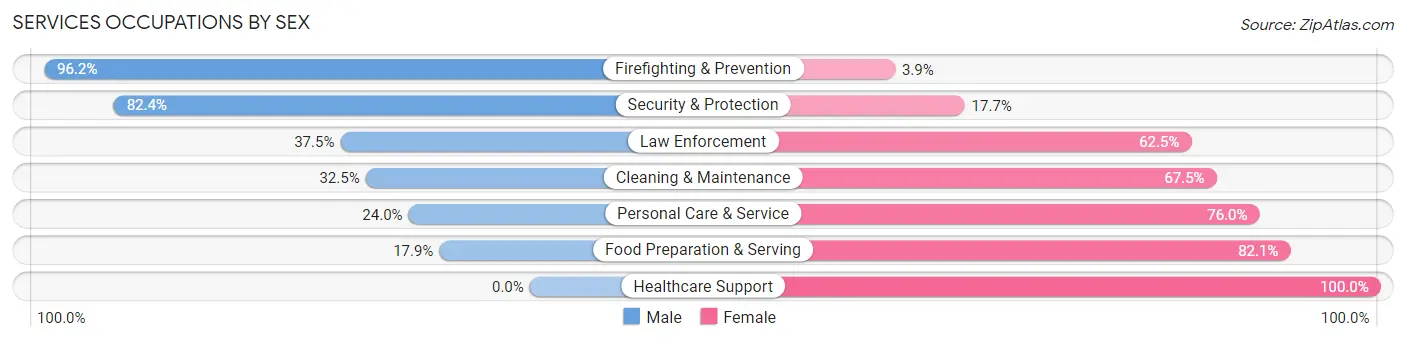
| Occupation | Male | Female |
| Healthcare Support | 0 (0.0%) | 3 (100.0%) |
| Security & Protection | 28 (82.4%) | 6 (17.6%) |
| Firefighting & Prevention | 25 (96.2%) | 1 (3.8%) |
| Law Enforcement | 3 (37.5%) | 5 (62.5%) |
| Food Preparation & Serving | 29 (17.9%) | 133 (82.1%) |
| Cleaning & Maintenance | 13 (32.5%) | 27 (67.5%) |
| Personal Care & Service | 18 (24.0%) | 57 (76.0%) |
| Total (Category) | 88 (28.0%) | 226 (72.0%) |
| Total (Overall) | 663 (44.1%) | 842 (55.9%) |
Sales and Office Occupations
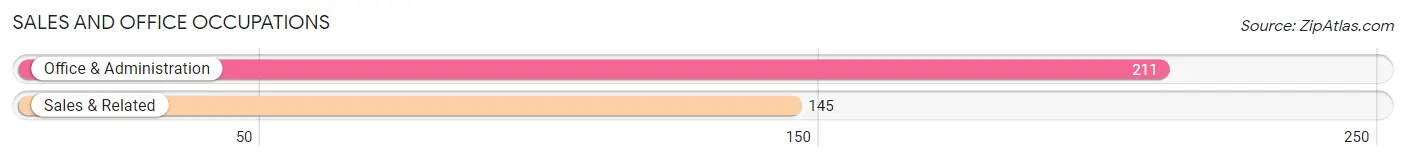
The most common Sales and Office occupations in New Britain borough are Office & Administration (211 | 14.0%), and Sales & Related (145 | 9.6%).
Sales and Office Occupations by Sex

| Occupation | Male | Female |
| Sales & Related | 100 (69.0%) | 45 (31.0%) |
| Office & Administration | 74 (35.1%) | 137 (64.9%) |
| Total (Category) | 174 (48.9%) | 182 (51.1%) |
| Total (Overall) | 663 (44.1%) | 842 (55.9%) |
Natural Resources, Construction and Maintenance Occupations
The most common Natural Resources, Construction and Maintenance occupations in New Britain borough are Construction & Extraction (27 | 1.8%), and Installation, Maintenance & Repair (16 | 1.1%).
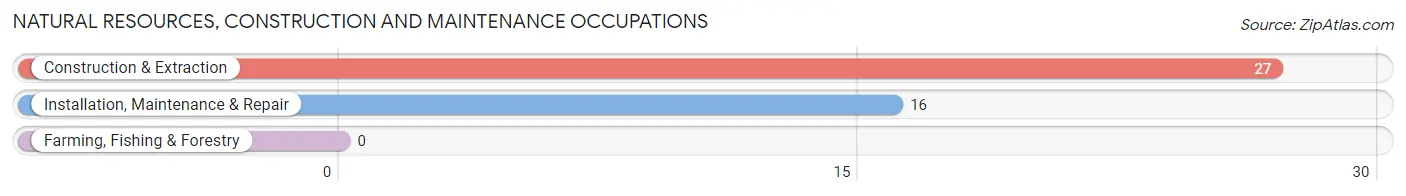
Natural Resources, Construction and Maintenance Occupations by Sex
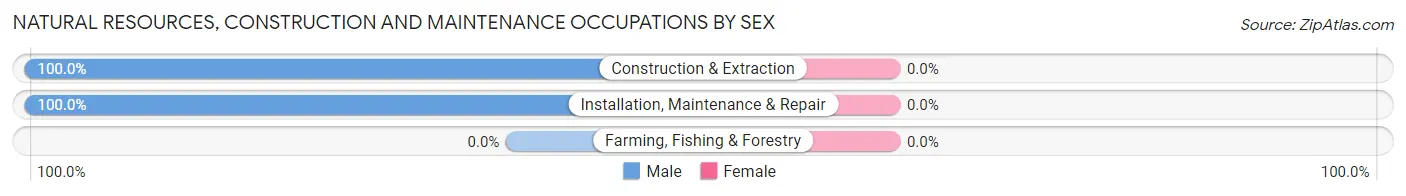
| Occupation | Male | Female |
| Farming, Fishing & Forestry | 0 (0.0%) | 0 (0.0%) |
| Construction & Extraction | 27 (100.0%) | 0 (0.0%) |
| Installation, Maintenance & Repair | 16 (100.0%) | 0 (0.0%) |
| Total (Category) | 43 (100.0%) | 0 (0.0%) |
| Total (Overall) | 663 (44.1%) | 842 (55.9%) |
Production, Transportation and Moving Occupations
The most common Production, Transportation and Moving occupations in New Britain borough are Production (59 | 3.9%), Material Moving (37 | 2.5%), and Transportation (29 | 1.9%).
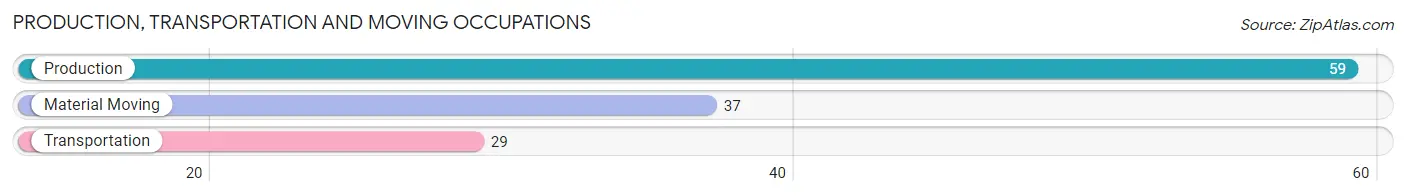
Production, Transportation and Moving Occupations by Sex
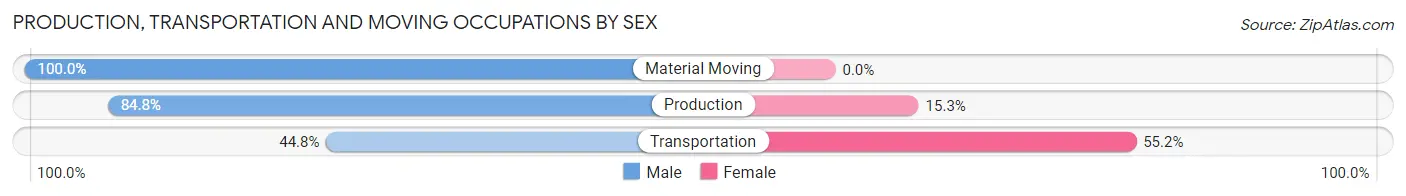
| Occupation | Male | Female |
| Production | 50 (84.8%) | 9 (15.2%) |
| Transportation | 13 (44.8%) | 16 (55.2%) |
| Material Moving | 37 (100.0%) | 0 (0.0%) |
| Total (Category) | 100 (80.0%) | 25 (20.0%) |
| Total (Overall) | 663 (44.1%) | 842 (55.9%) |
Employment Industries by Sex in New Britain borough
Employment Industries in New Britain borough
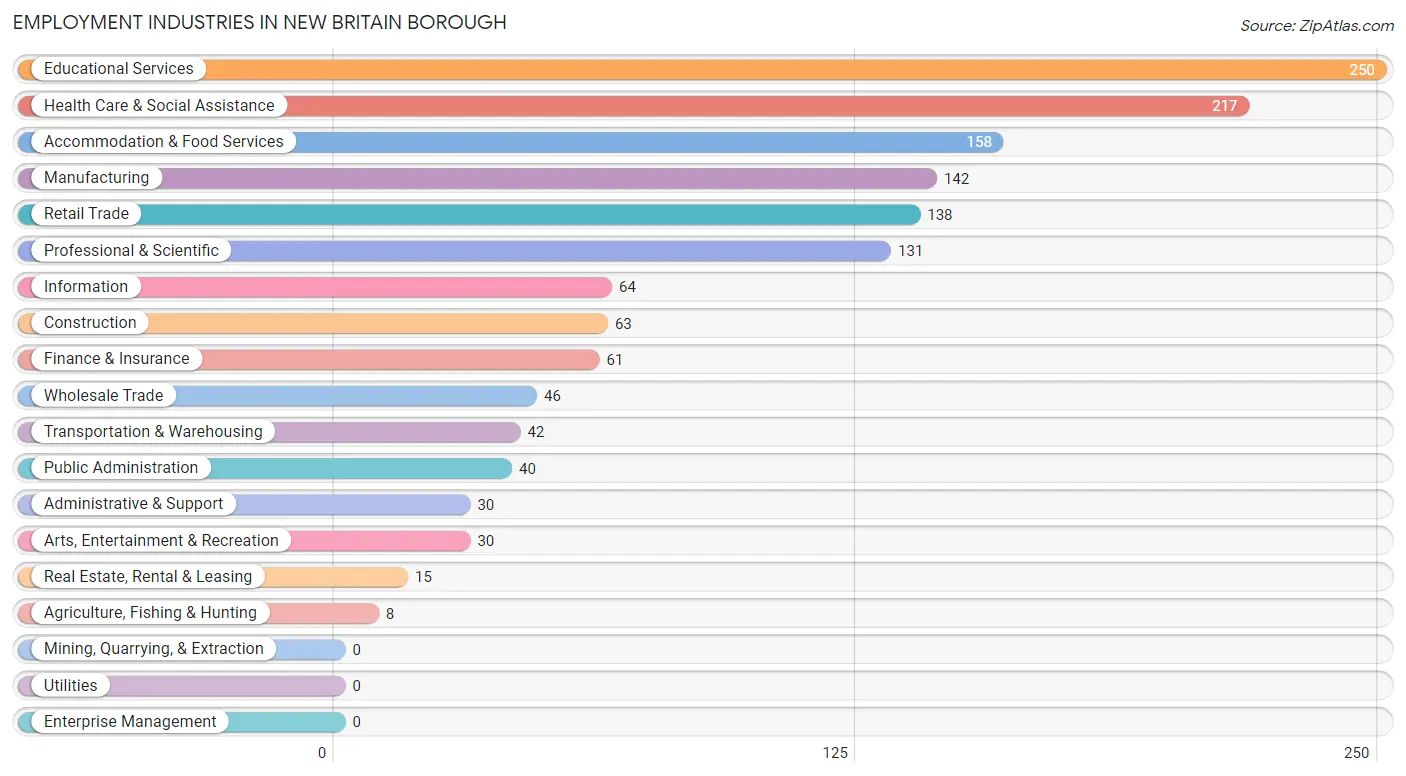
The major employment industries in New Britain borough include Educational Services (250 | 16.6%), Health Care & Social Assistance (217 | 14.4%), Accommodation & Food Services (158 | 10.5%), Manufacturing (142 | 9.4%), and Retail Trade (138 | 9.2%).
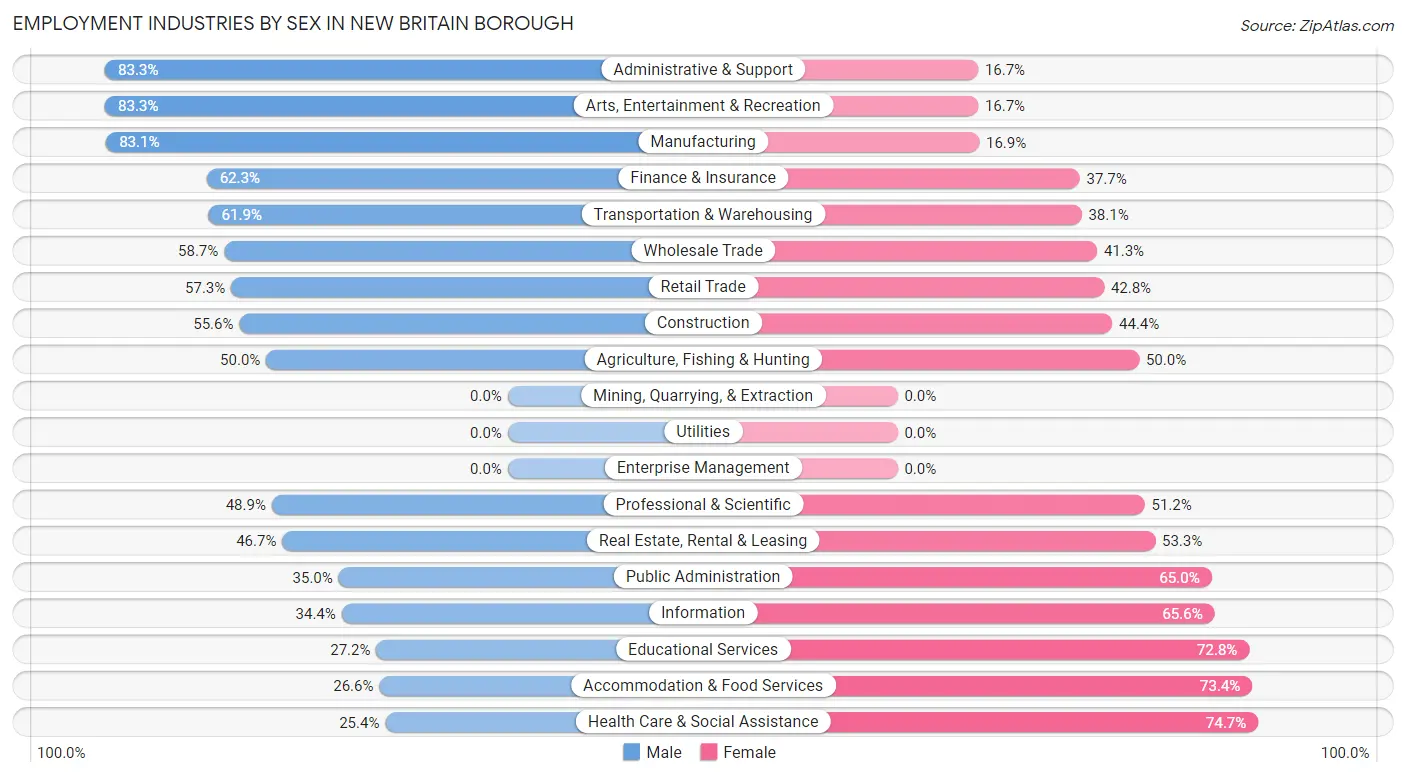
Employment Industries by Sex in New Britain borough
The New Britain borough industries that see more men than women are Administrative & Support (83.3%), Arts, Entertainment & Recreation (83.3%), and Manufacturing (83.1%), whereas the industries that tend to have a higher number of women are Health Care & Social Assistance (74.7%), Accommodation & Food Services (73.4%), and Educational Services (72.8%).
| Industry | Male | Female |
| Agriculture, Fishing & Hunting | 4 (50.0%) | 4 (50.0%) |
| Mining, Quarrying, & Extraction | 0 (0.0%) | 0 (0.0%) |
| Construction | 35 (55.6%) | 28 (44.4%) |
| Manufacturing | 118 (83.1%) | 24 (16.9%) |
| Wholesale Trade | 27 (58.7%) | 19 (41.3%) |
| Retail Trade | 79 (57.3%) | 59 (42.7%) |
| Transportation & Warehousing | 26 (61.9%) | 16 (38.1%) |
| Utilities | 0 (0.0%) | 0 (0.0%) |
| Information | 22 (34.4%) | 42 (65.6%) |
| Finance & Insurance | 38 (62.3%) | 23 (37.7%) |
| Real Estate, Rental & Leasing | 7 (46.7%) | 8 (53.3%) |
| Professional & Scientific | 64 (48.8%) | 67 (51.1%) |
| Enterprise Management | 0 (0.0%) | 0 (0.0%) |
| Administrative & Support | 25 (83.3%) | 5 (16.7%) |
| Educational Services | 68 (27.2%) | 182 (72.8%) |
| Health Care & Social Assistance | 55 (25.4%) | 162 (74.7%) |
| Arts, Entertainment & Recreation | 25 (83.3%) | 5 (16.7%) |
| Accommodation & Food Services | 42 (26.6%) | 116 (73.4%) |
| Public Administration | 14 (35.0%) | 26 (65.0%) |
| Total | 663 (44.1%) | 842 (55.9%) |
Education in New Britain borough
School Enrollment in New Britain borough
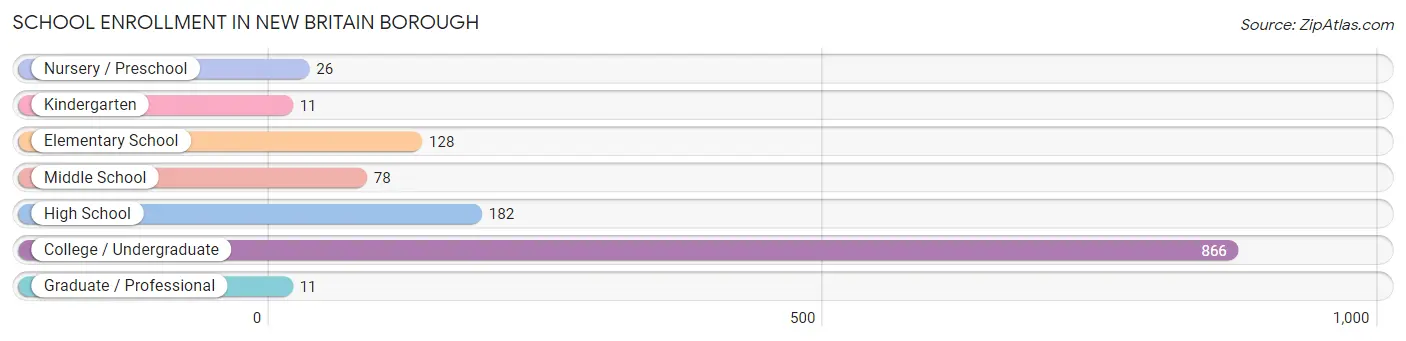
The most common levels of schooling among the 1,302 students in New Britain borough are college / undergraduate (866 | 66.5%), high school (182 | 14.0%), and elementary school (128 | 9.8%).
| School Level | # Students | % Students |
| Nursery / Preschool | 26 | 2.0% |
| Kindergarten | 11 | 0.8% |
| Elementary School | 128 | 9.8% |
| Middle School | 78 | 6.0% |
| High School | 182 | 14.0% |
| College / Undergraduate | 866 | 66.5% |
| Graduate / Professional | 11 | 0.8% |
| Total | 1,302 | 100.0% |
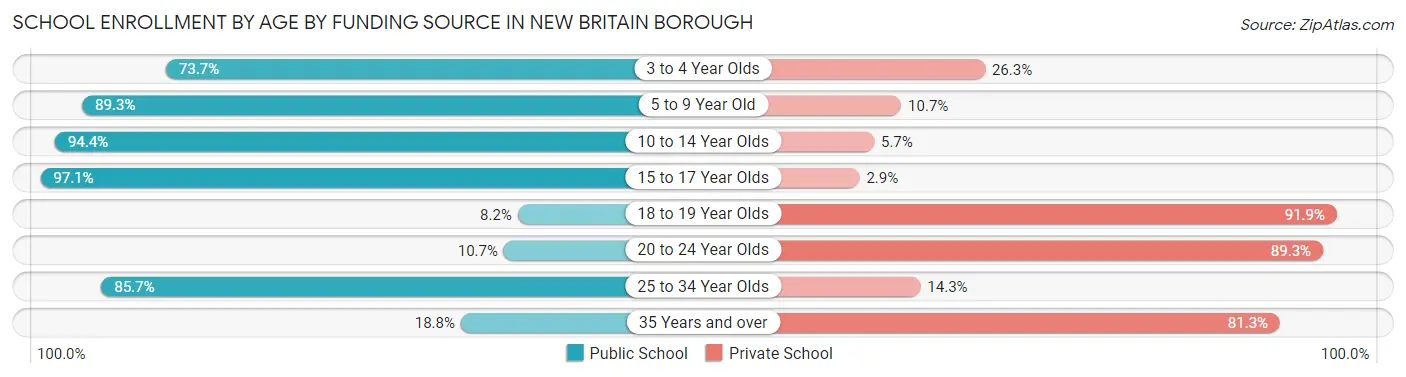
School Enrollment by Age by Funding Source in New Britain borough
Out of a total of 1,302 students who are enrolled in schools in New Britain borough, 811 (62.3%) attend a private institution, while the remaining 491 (37.7%) are enrolled in public schools. The age group of 18 to 19 year olds has the highest likelihood of being enrolled in private schools, with 293 (91.8% in the age bracket) enrolled. Conversely, the age group of 15 to 17 year olds has the lowest likelihood of being enrolled in a private school, with 165 (97.1% in the age bracket) attending a public institution.
| Age Bracket | Public School | Private School |
| 3 to 4 Year Olds | 14 (73.7%) | 5 (26.3%) |
| 5 to 9 Year Old | 100 (89.3%) | 12 (10.7%) |
| 10 to 14 Year Olds | 117 (94.4%) | 7 (5.7%) |
| 15 to 17 Year Olds | 165 (97.1%) | 5 (2.9%) |
| 18 to 19 Year Olds | 26 (8.2%) | 293 (91.8%) |
| 20 to 24 Year Olds | 54 (10.7%) | 449 (89.3%) |
| 25 to 34 Year Olds | 6 (85.7%) | 1 (14.3%) |
| 35 Years and over | 9 (18.8%) | 39 (81.2%) |
| Total | 491 (37.7%) | 811 (62.3%) |
Educational Attainment by Field of Study in New Britain borough
Business (161 | 19.4%), education (141 | 17.0%), science & technology (103 | 12.4%), bio, nature & agricultural (85 | 10.2%), and communications (61 | 7.3%) are the most common fields of study among 830 individuals in New Britain borough who have obtained a bachelor's degree or higher.
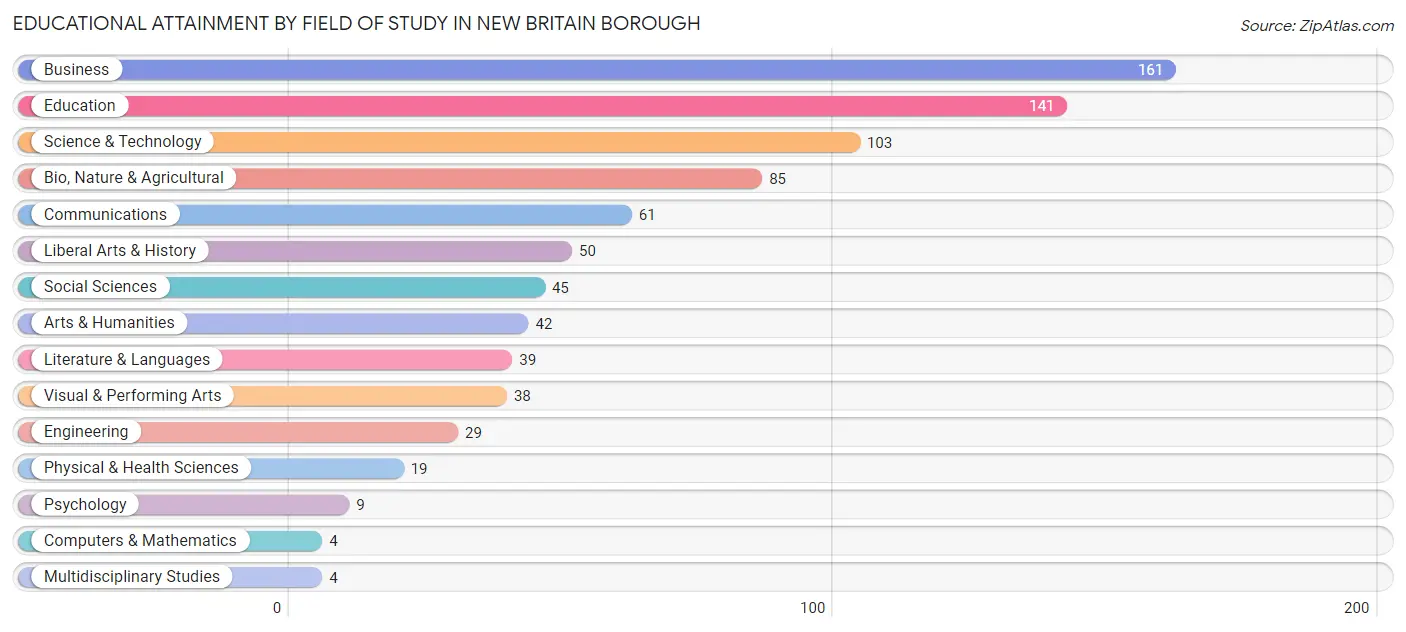
| Field of Study | # Graduates | % Graduates |
| Computers & Mathematics | 4 | 0.5% |
| Bio, Nature & Agricultural | 85 | 10.2% |
| Physical & Health Sciences | 19 | 2.3% |
| Psychology | 9 | 1.1% |
| Social Sciences | 45 | 5.4% |
| Engineering | 29 | 3.5% |
| Multidisciplinary Studies | 4 | 0.5% |
| Science & Technology | 103 | 12.4% |
| Business | 161 | 19.4% |
| Education | 141 | 17.0% |
| Literature & Languages | 39 | 4.7% |
| Liberal Arts & History | 50 | 6.0% |
| Visual & Performing Arts | 38 | 4.6% |
| Communications | 61 | 7.3% |
| Arts & Humanities | 42 | 5.1% |
| Total | 830 | 100.0% |
Transportation & Commute in New Britain borough
Vehicle Availability by Sex in New Britain borough
The most prevalent vehicle ownership categories in New Britain borough are males with 2 vehicles (286, accounting for 49.2%) and females with 2 vehicles (209, making up 42.7%).
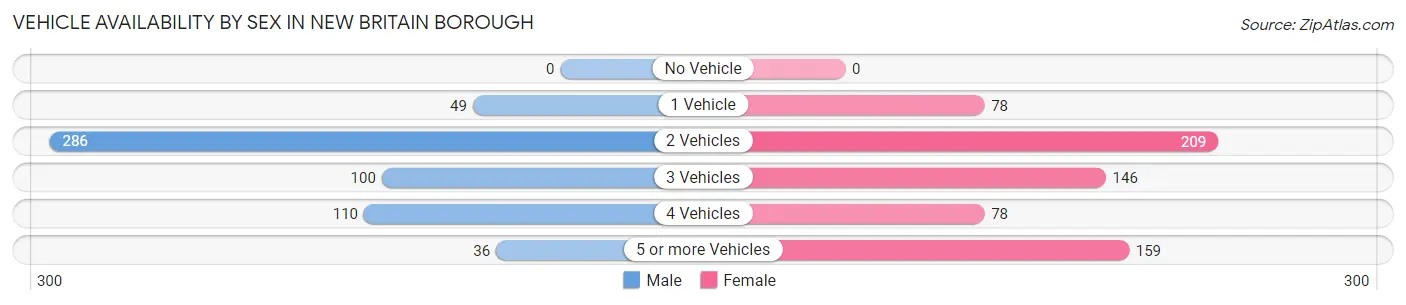
| Vehicles Available | Male | Female |
| No Vehicle | 0 (0.0%) | 0 (0.0%) |
| 1 Vehicle | 49 (8.4%) | 78 (11.6%) |
| 2 Vehicles | 286 (49.2%) | 209 (31.2%) |
| 3 Vehicles | 100 (17.2%) | 146 (21.8%) |
| 4 Vehicles | 110 (18.9%) | 78 (11.6%) |
| 5 or more Vehicles | 36 (6.2%) | 159 (23.7%) |
| Total | 581 (100.0%) | 670 (100.0%) |
Commute Time in New Britain borough
The most frequently occuring commute durations in New Britain borough are 10 to 14 minutes (211 commuters, 17.4%), 30 to 34 minutes (204 commuters, 16.9%), and less than 5 minutes (171 commuters, 14.1%).
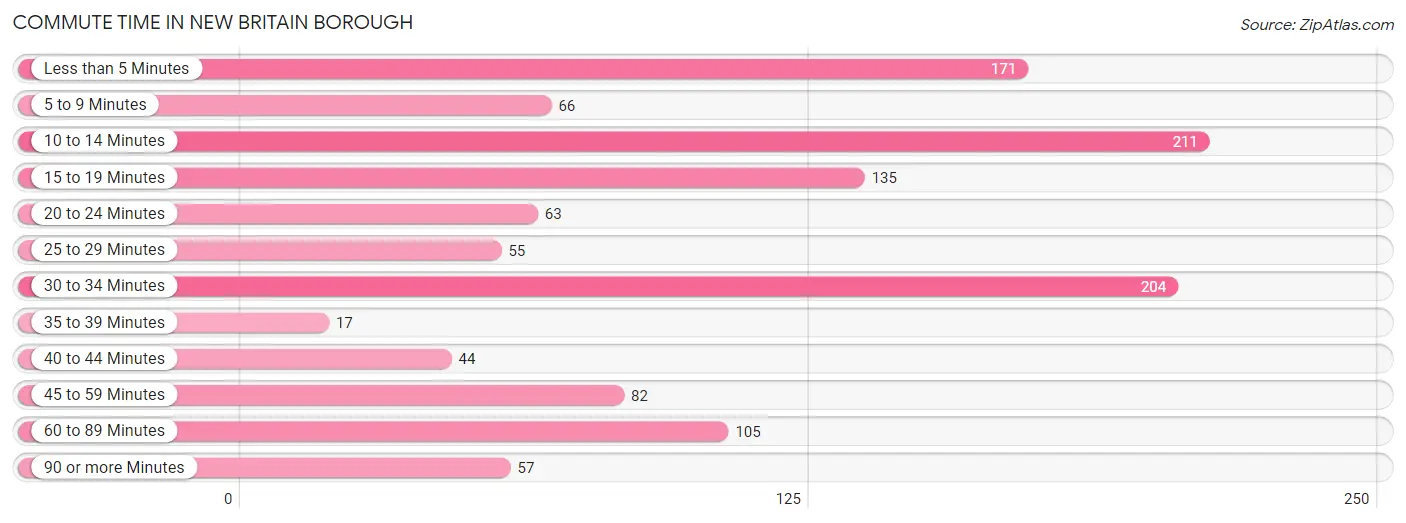
| Commute Time | # Commuters | % Commuters |
| Less than 5 Minutes | 171 | 14.1% |
| 5 to 9 Minutes | 66 | 5.4% |
| 10 to 14 Minutes | 211 | 17.4% |
| 15 to 19 Minutes | 135 | 11.2% |
| 20 to 24 Minutes | 63 | 5.2% |
| 25 to 29 Minutes | 55 | 4.5% |
| 30 to 34 Minutes | 204 | 16.9% |
| 35 to 39 Minutes | 17 | 1.4% |
| 40 to 44 Minutes | 44 | 3.6% |
| 45 to 59 Minutes | 82 | 6.8% |
| 60 to 89 Minutes | 105 | 8.7% |
| 90 or more Minutes | 57 | 4.7% |
Commute Time by Sex in New Britain borough
The most common commute times in New Britain borough are 10 to 14 minutes (106 commuters, 19.7%) for males and less than 5 minutes (107 commuters, 16.0%) for females.
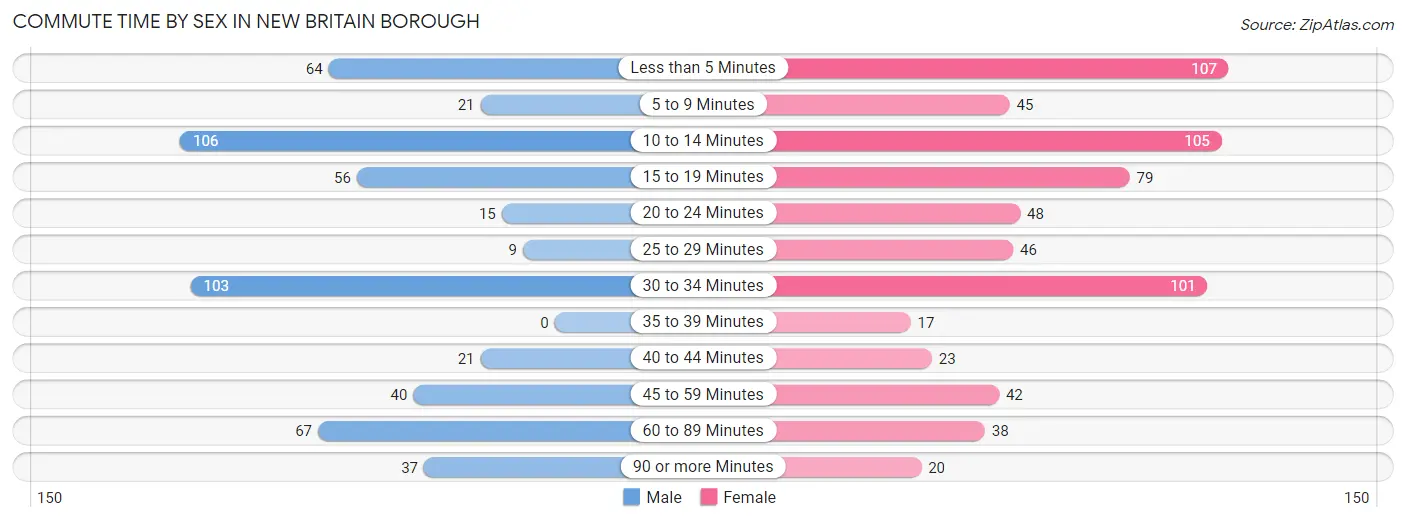
| Commute Time | Male | Female |
| Less than 5 Minutes | 64 (11.9%) | 107 (16.0%) |
| 5 to 9 Minutes | 21 (3.9%) | 45 (6.7%) |
| 10 to 14 Minutes | 106 (19.7%) | 105 (15.7%) |
| 15 to 19 Minutes | 56 (10.4%) | 79 (11.8%) |
| 20 to 24 Minutes | 15 (2.8%) | 48 (7.1%) |
| 25 to 29 Minutes | 9 (1.7%) | 46 (6.9%) |
| 30 to 34 Minutes | 103 (19.1%) | 101 (15.0%) |
| 35 to 39 Minutes | 0 (0.0%) | 17 (2.5%) |
| 40 to 44 Minutes | 21 (3.9%) | 23 (3.4%) |
| 45 to 59 Minutes | 40 (7.4%) | 42 (6.3%) |
| 60 to 89 Minutes | 67 (12.4%) | 38 (5.7%) |
| 90 or more Minutes | 37 (6.9%) | 20 (3.0%) |
Time of Departure to Work by Sex in New Britain borough
The most frequent times of departure to work in New Britain borough are 9:00 AM to 9:59 AM (99, 18.4%) for males and 6:00 AM to 6:29 AM (145, 21.6%) for females.
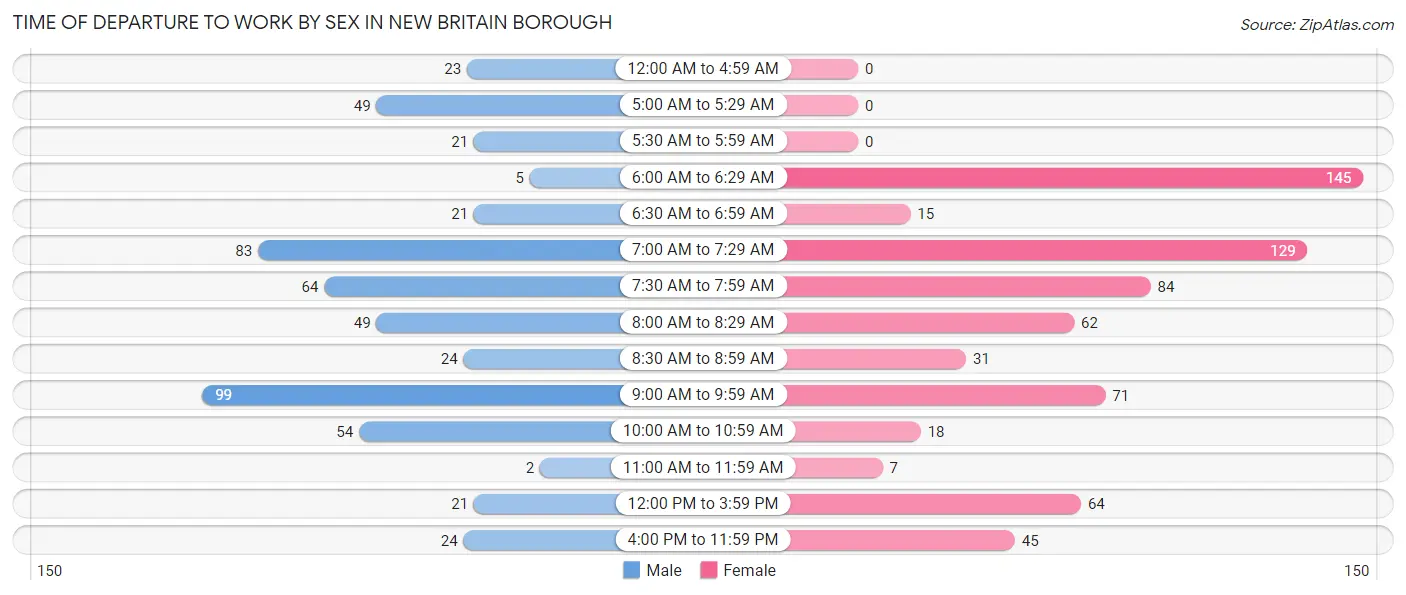
| Time of Departure | Male | Female |
| 12:00 AM to 4:59 AM | 23 (4.3%) | 0 (0.0%) |
| 5:00 AM to 5:29 AM | 49 (9.1%) | 0 (0.0%) |
| 5:30 AM to 5:59 AM | 21 (3.9%) | 0 (0.0%) |
| 6:00 AM to 6:29 AM | 5 (0.9%) | 145 (21.6%) |
| 6:30 AM to 6:59 AM | 21 (3.9%) | 15 (2.2%) |
| 7:00 AM to 7:29 AM | 83 (15.4%) | 129 (19.2%) |
| 7:30 AM to 7:59 AM | 64 (11.9%) | 84 (12.5%) |
| 8:00 AM to 8:29 AM | 49 (9.1%) | 62 (9.2%) |
| 8:30 AM to 8:59 AM | 24 (4.4%) | 31 (4.6%) |
| 9:00 AM to 9:59 AM | 99 (18.4%) | 71 (10.6%) |
| 10:00 AM to 10:59 AM | 54 (10.0%) | 18 (2.7%) |
| 11:00 AM to 11:59 AM | 2 (0.4%) | 7 (1.0%) |
| 12:00 PM to 3:59 PM | 21 (3.9%) | 64 (9.5%) |
| 4:00 PM to 11:59 PM | 24 (4.4%) | 45 (6.7%) |
| Total | 539 (100.0%) | 671 (100.0%) |
Housing Occupancy in New Britain borough
Occupancy by Ownership in New Britain borough
Of the total 784 dwellings in New Britain borough, owner-occupied units account for 730 (93.1%), while renter-occupied units make up 54 (6.9%).
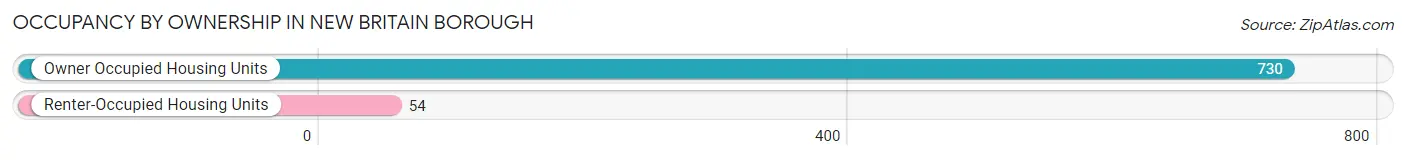
| Occupancy | # Housing Units | % Housing Units |
| Owner Occupied Housing Units | 730 | 93.1% |
| Renter-Occupied Housing Units | 54 | 6.9% |
| Total Occupied Housing Units | 784 | 100.0% |
Occupancy by Household Size in New Britain borough
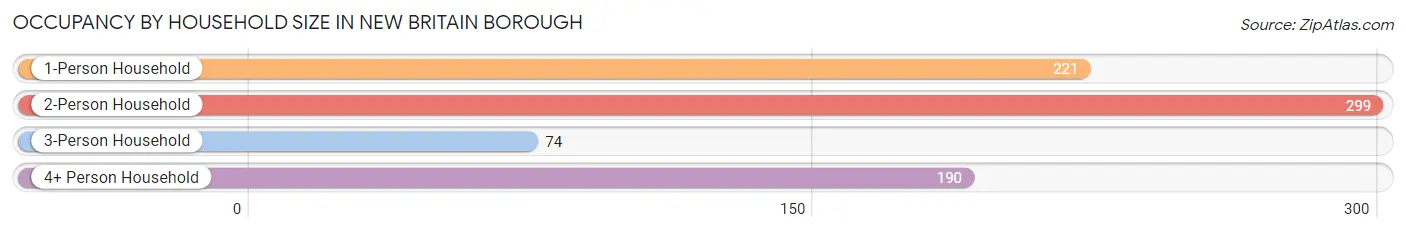
| Household Size | # Housing Units | % Housing Units |
| 1-Person Household | 221 | 28.2% |
| 2-Person Household | 299 | 38.1% |
| 3-Person Household | 74 | 9.4% |
| 4+ Person Household | 190 | 24.2% |
| Total Housing Units | 784 | 100.0% |
Occupancy by Ownership by Household Size in New Britain borough
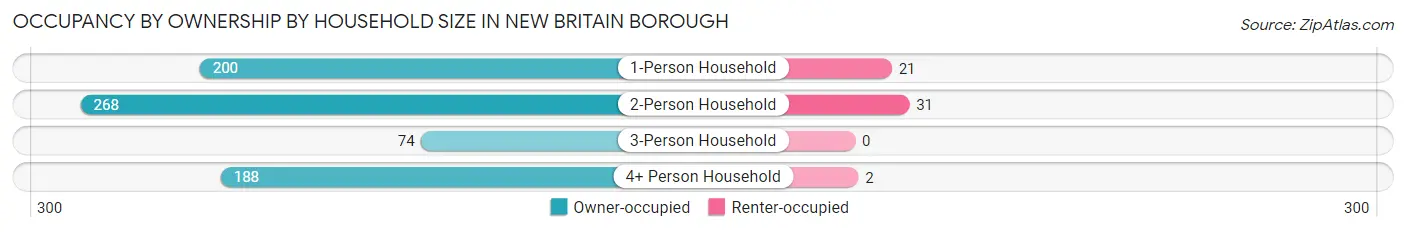
| Household Size | Owner-occupied | Renter-occupied |
| 1-Person Household | 200 (90.5%) | 21 (9.5%) |
| 2-Person Household | 268 (89.6%) | 31 (10.4%) |
| 3-Person Household | 74 (100.0%) | 0 (0.0%) |
| 4+ Person Household | 188 (99.0%) | 2 (1.1%) |
| Total Housing Units | 730 (93.1%) | 54 (6.9%) |
Occupancy by Educational Attainment in New Britain borough
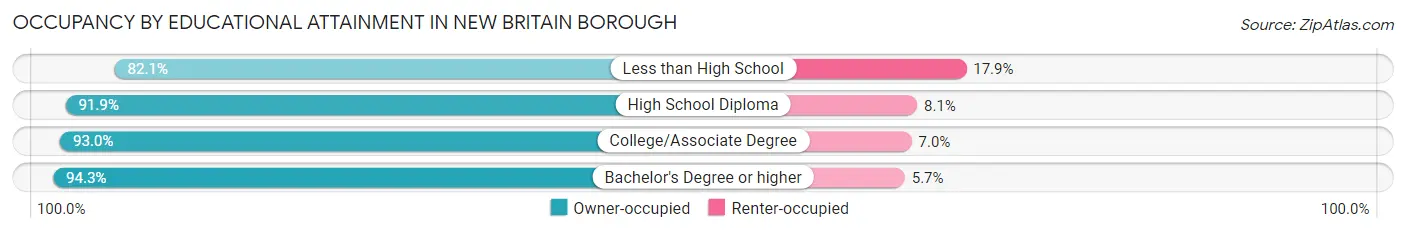
| Household Size | Owner-occupied | Renter-occupied |
| Less than High School | 23 (82.1%) | 5 (17.9%) |
| High School Diploma | 136 (91.9%) | 12 (8.1%) |
| College/Associate Degree | 172 (93.0%) | 13 (7.0%) |
| Bachelor's Degree or higher | 399 (94.3%) | 24 (5.7%) |
Occupancy by Age of Householder in New Britain borough
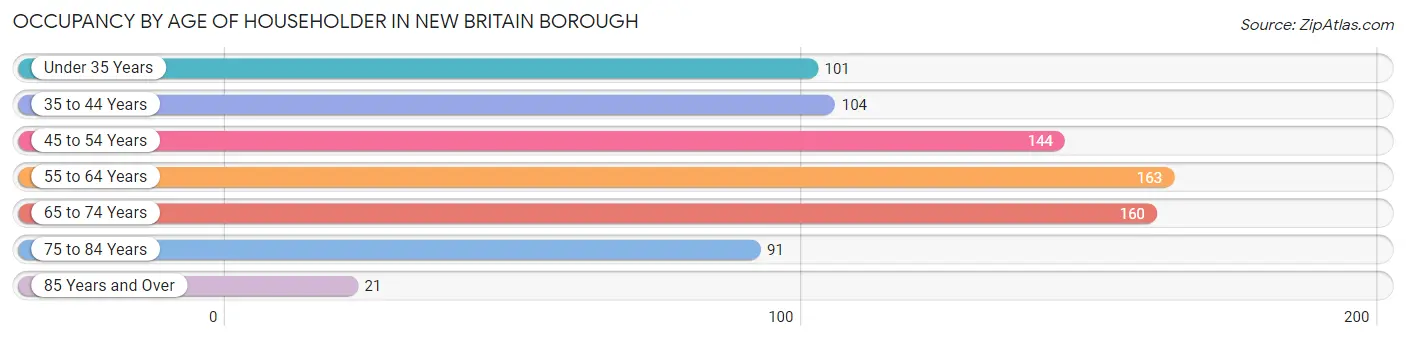
| Age Bracket | # Households | % Households |
| Under 35 Years | 101 | 12.9% |
| 35 to 44 Years | 104 | 13.3% |
| 45 to 54 Years | 144 | 18.4% |
| 55 to 64 Years | 163 | 20.8% |
| 65 to 74 Years | 160 | 20.4% |
| 75 to 84 Years | 91 | 11.6% |
| 85 Years and Over | 21 | 2.7% |
| Total | 784 | 100.0% |
Housing Finances in New Britain borough
Median Income by Occupancy in New Britain borough
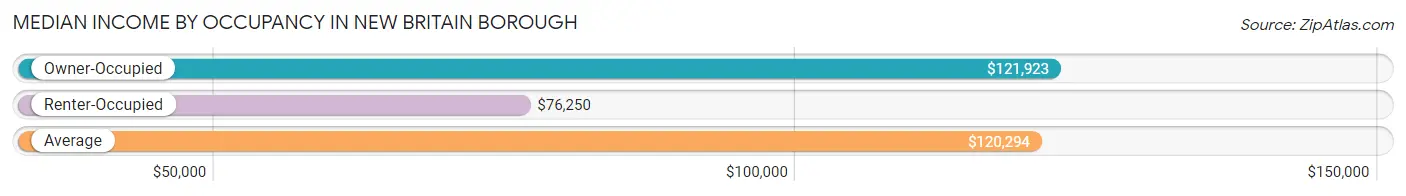
| Occupancy Type | # Households | Median Income |
| Owner-Occupied | 730 (93.1%) | $121,923 |
| Renter-Occupied | 54 (6.9%) | $76,250 |
| Average | 784 (100.0%) | $120,294 |
Occupancy by Householder Income Bracket in New Britain borough
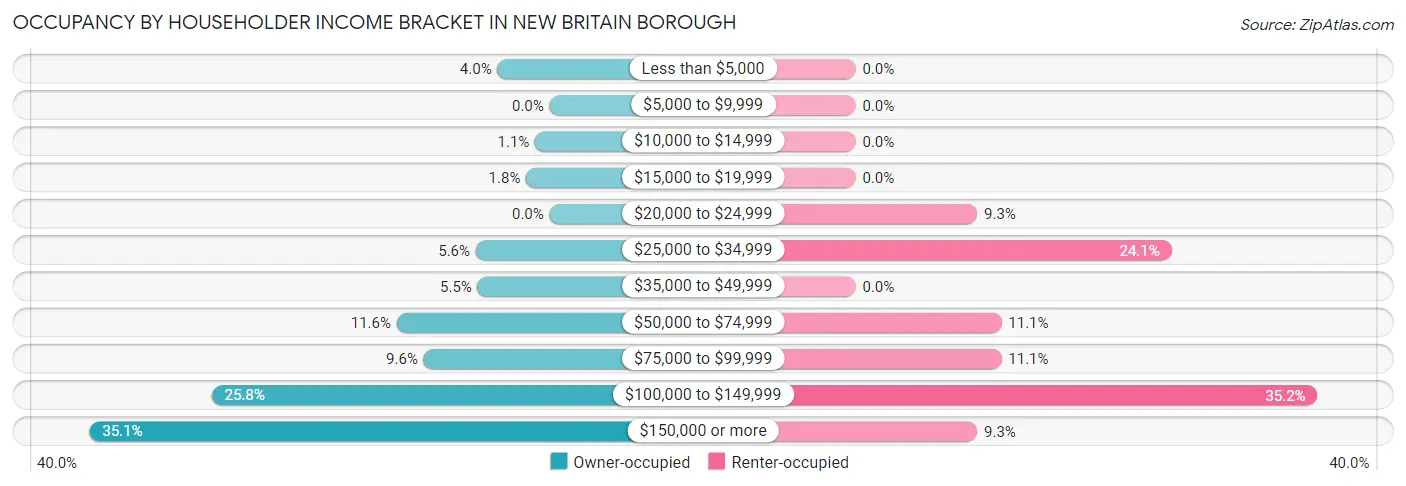
| Income Bracket | Owner-occupied | Renter-occupied |
| Less than $5,000 | 29 (4.0%) | 0 (0.0%) |
| $5,000 to $9,999 | 0 (0.0%) | 0 (0.0%) |
| $10,000 to $14,999 | 8 (1.1%) | 0 (0.0%) |
| $15,000 to $19,999 | 13 (1.8%) | 0 (0.0%) |
| $20,000 to $24,999 | 0 (0.0%) | 5 (9.3%) |
| $25,000 to $34,999 | 41 (5.6%) | 13 (24.1%) |
| $35,000 to $49,999 | 40 (5.5%) | 0 (0.0%) |
| $50,000 to $74,999 | 85 (11.6%) | 6 (11.1%) |
| $75,000 to $99,999 | 70 (9.6%) | 6 (11.1%) |
| $100,000 to $149,999 | 188 (25.8%) | 19 (35.2%) |
| $150,000 or more | 256 (35.1%) | 5 (9.3%) |
| Total | 730 (100.0%) | 54 (100.0%) |
Monthly Housing Cost Tiers in New Britain borough
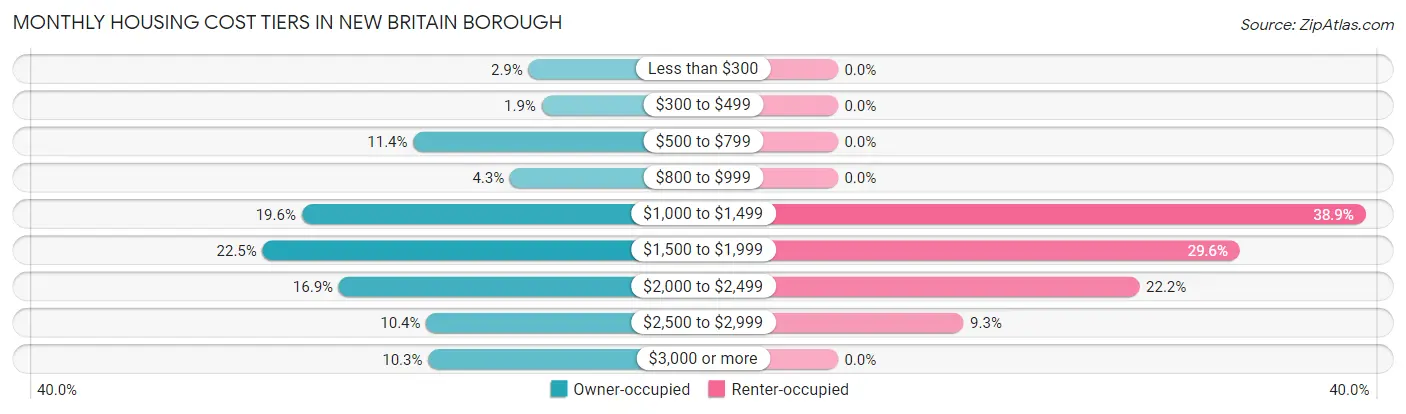
| Monthly Cost | Owner-occupied | Renter-occupied |
| Less than $300 | 21 (2.9%) | 0 (0.0%) |
| $300 to $499 | 14 (1.9%) | 0 (0.0%) |
| $500 to $799 | 83 (11.4%) | 0 (0.0%) |
| $800 to $999 | 31 (4.3%) | 0 (0.0%) |
| $1,000 to $1,499 | 143 (19.6%) | 21 (38.9%) |
| $1,500 to $1,999 | 164 (22.5%) | 16 (29.6%) |
| $2,000 to $2,499 | 123 (16.9%) | 12 (22.2%) |
| $2,500 to $2,999 | 76 (10.4%) | 5 (9.3%) |
| $3,000 or more | 75 (10.3%) | 0 (0.0%) |
| Total | 730 (100.0%) | 54 (100.0%) |
Physical Housing Characteristics in New Britain borough
Housing Structures in New Britain borough
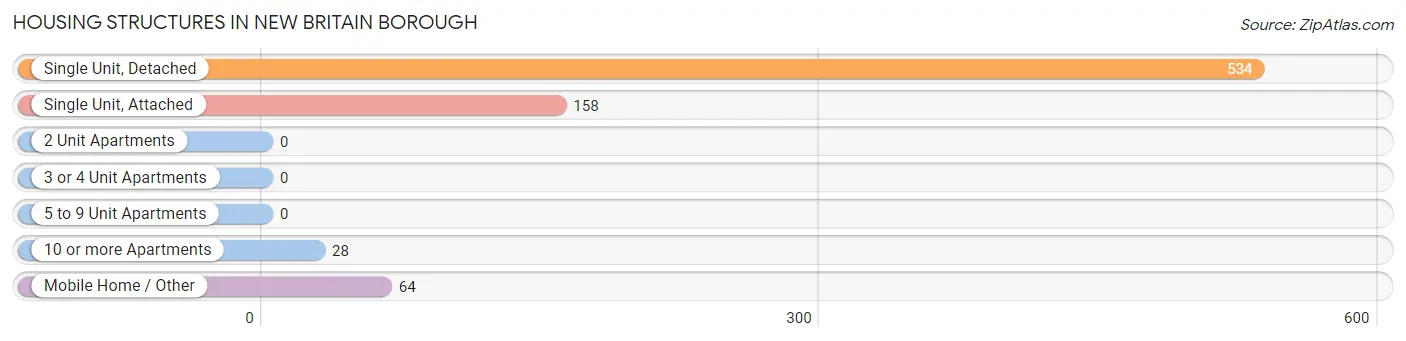
| Structure Type | # Housing Units | % Housing Units |
| Single Unit, Detached | 534 | 68.1% |
| Single Unit, Attached | 158 | 20.2% |
| 2 Unit Apartments | 0 | 0.0% |
| 3 or 4 Unit Apartments | 0 | 0.0% |
| 5 to 9 Unit Apartments | 0 | 0.0% |
| 10 or more Apartments | 28 | 3.6% |
| Mobile Home / Other | 64 | 8.2% |
| Total | 784 | 100.0% |
Housing Structures by Occupancy in New Britain borough
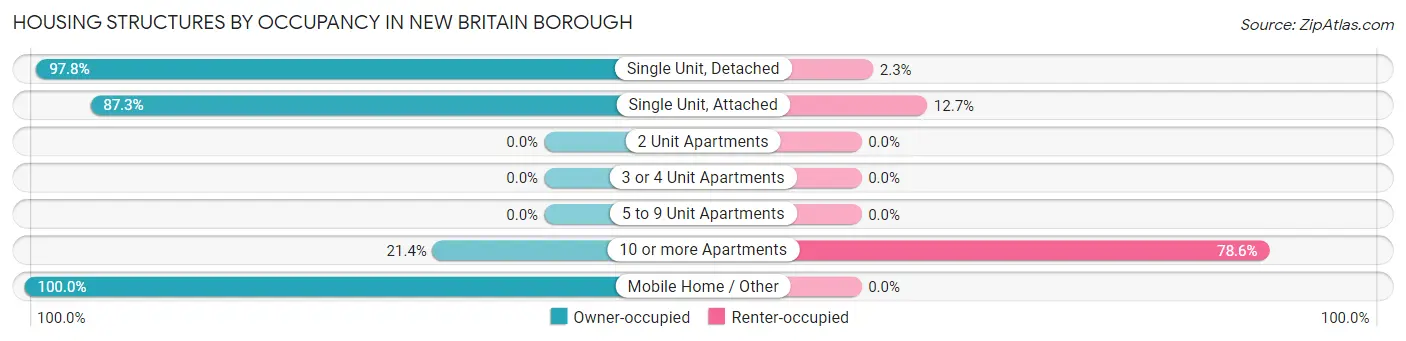
| Structure Type | Owner-occupied | Renter-occupied |
| Single Unit, Detached | 522 (97.8%) | 12 (2.2%) |
| Single Unit, Attached | 138 (87.3%) | 20 (12.7%) |
| 2 Unit Apartments | 0 (0.0%) | 0 (0.0%) |
| 3 or 4 Unit Apartments | 0 (0.0%) | 0 (0.0%) |
| 5 to 9 Unit Apartments | 0 (0.0%) | 0 (0.0%) |
| 10 or more Apartments | 6 (21.4%) | 22 (78.6%) |
| Mobile Home / Other | 64 (100.0%) | 0 (0.0%) |
| Total | 730 (93.1%) | 54 (6.9%) |
Housing Structures by Number of Rooms in New Britain borough
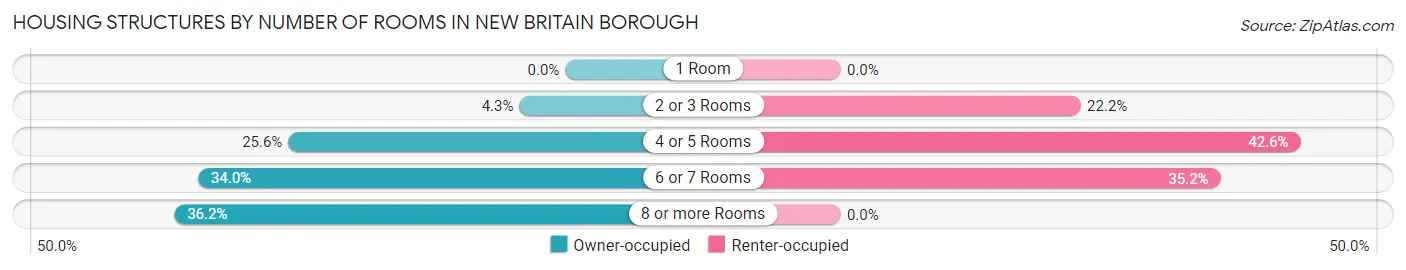
| Number of Rooms | Owner-occupied | Renter-occupied |
| 1 Room | 0 (0.0%) | 0 (0.0%) |
| 2 or 3 Rooms | 31 (4.3%) | 12 (22.2%) |
| 4 or 5 Rooms | 187 (25.6%) | 23 (42.6%) |
| 6 or 7 Rooms | 248 (34.0%) | 19 (35.2%) |
| 8 or more Rooms | 264 (36.2%) | 0 (0.0%) |
| Total | 730 (100.0%) | 54 (100.0%) |
Housing Structure by Heating Type in New Britain borough
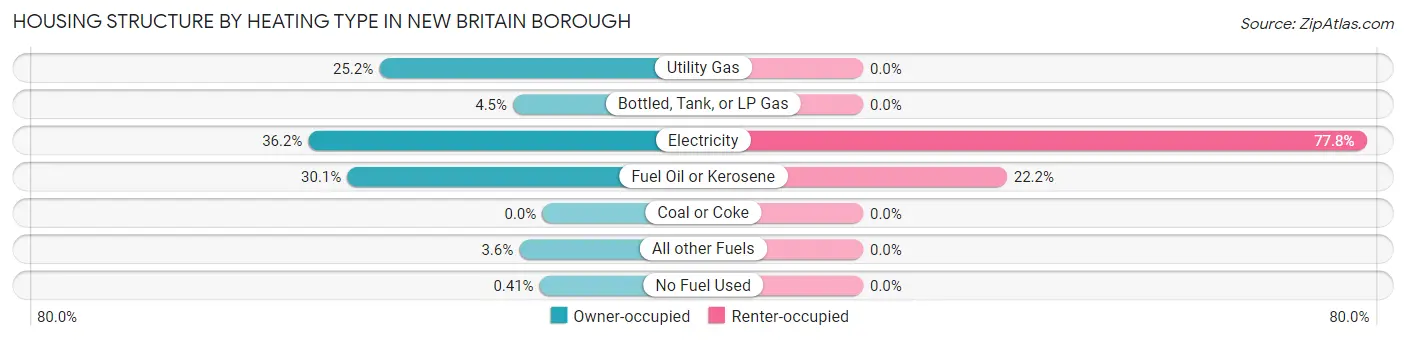
| Heating Type | Owner-occupied | Renter-occupied |
| Utility Gas | 184 (25.2%) | 0 (0.0%) |
| Bottled, Tank, or LP Gas | 33 (4.5%) | 0 (0.0%) |
| Electricity | 264 (36.2%) | 42 (77.8%) |
| Fuel Oil or Kerosene | 220 (30.1%) | 12 (22.2%) |
| Coal or Coke | 0 (0.0%) | 0 (0.0%) |
| All other Fuels | 26 (3.6%) | 0 (0.0%) |
| No Fuel Used | 3 (0.4%) | 0 (0.0%) |
| Total | 730 (100.0%) | 54 (100.0%) |
Household Vehicle Usage in New Britain borough
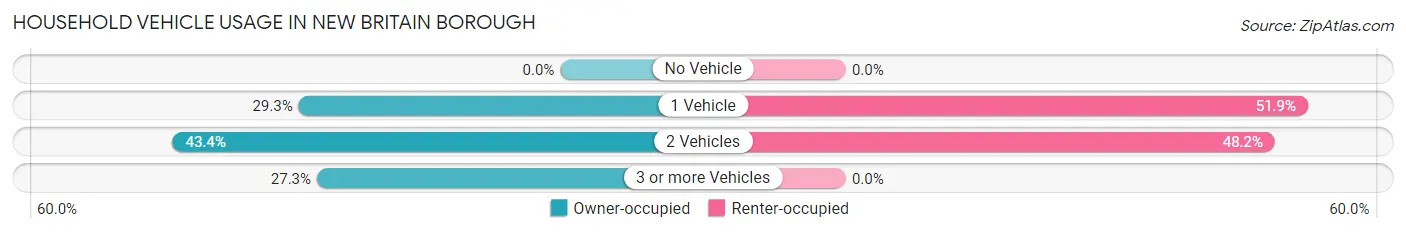
| Vehicles per Household | Owner-occupied | Renter-occupied |
| No Vehicle | 0 (0.0%) | 0 (0.0%) |
| 1 Vehicle | 214 (29.3%) | 28 (51.8%) |
| 2 Vehicles | 317 (43.4%) | 26 (48.1%) |
| 3 or more Vehicles | 199 (27.3%) | 0 (0.0%) |
| Total | 730 (100.0%) | 54 (100.0%) |
Real Estate & Mortgages in New Britain borough
Real Estate and Mortgage Overview in New Britain borough
| Characteristic | Without Mortgage | With Mortgage |
| Housing Units | 234 | 496 |
| Median Property Value | $325,400 | $369,600 |
| Median Household Income | $106,250 | $205 |
| Monthly Housing Costs | $850 | $75 |
| Real Estate Taxes | $4,221 | $0 |
Property Value by Mortgage Status in New Britain borough
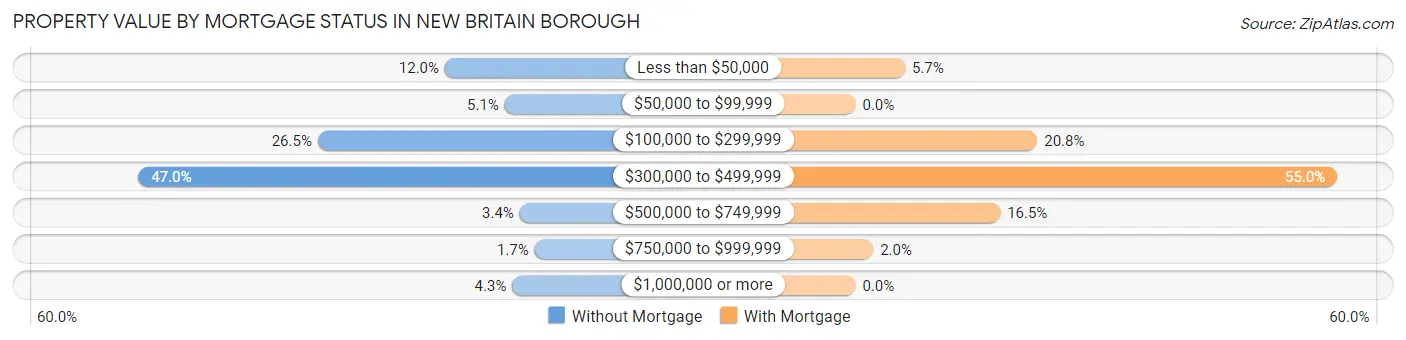
| Property Value | Without Mortgage | With Mortgage |
| Less than $50,000 | 28 (12.0%) | 28 (5.7%) |
| $50,000 to $99,999 | 12 (5.1%) | 0 (0.0%) |
| $100,000 to $299,999 | 62 (26.5%) | 103 (20.8%) |
| $300,000 to $499,999 | 110 (47.0%) | 273 (55.0%) |
| $500,000 to $749,999 | 8 (3.4%) | 82 (16.5%) |
| $750,000 to $999,999 | 4 (1.7%) | 10 (2.0%) |
| $1,000,000 or more | 10 (4.3%) | 0 (0.0%) |
| Total | 234 (100.0%) | 496 (100.0%) |
Household Income by Mortgage Status in New Britain borough
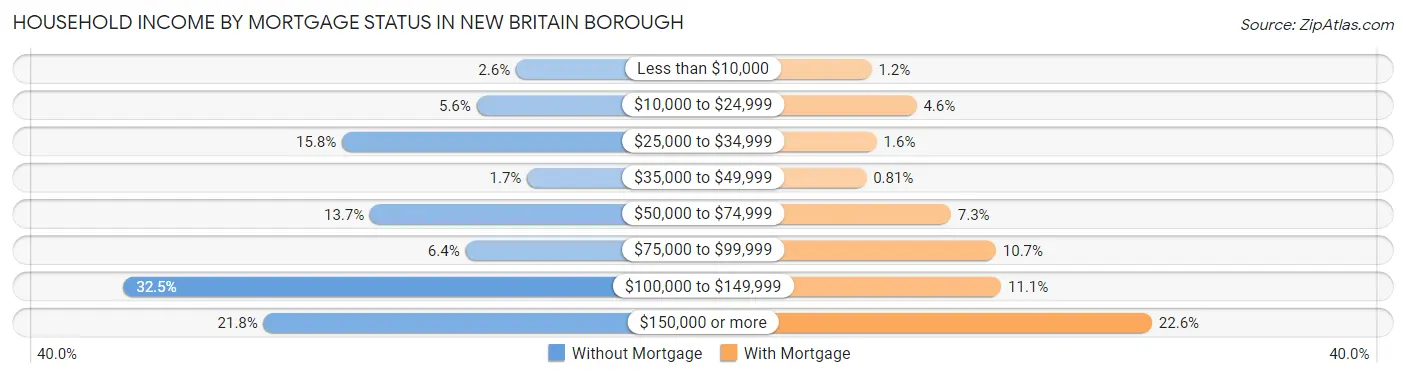
| Household Income | Without Mortgage | With Mortgage |
| Less than $10,000 | 6 (2.6%) | 6 (1.2%) |
| $10,000 to $24,999 | 13 (5.6%) | 23 (4.6%) |
| $25,000 to $34,999 | 37 (15.8%) | 8 (1.6%) |
| $35,000 to $49,999 | 4 (1.7%) | 4 (0.8%) |
| $50,000 to $74,999 | 32 (13.7%) | 36 (7.3%) |
| $75,000 to $99,999 | 15 (6.4%) | 53 (10.7%) |
| $100,000 to $149,999 | 76 (32.5%) | 55 (11.1%) |
| $150,000 or more | 51 (21.8%) | 112 (22.6%) |
| Total | 234 (100.0%) | 496 (100.0%) |
Property Value to Household Income Ratio in New Britain borough
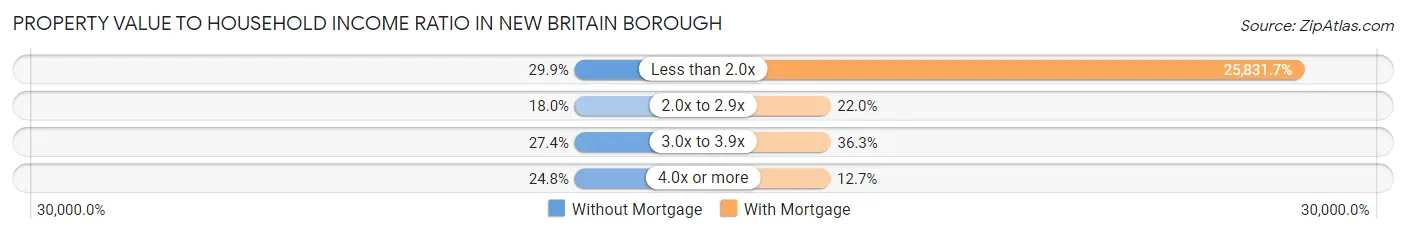
| Value-to-Income Ratio | Without Mortgage | With Mortgage |
| Less than 2.0x | 70 (29.9%) | 128,125 (25,831.7%) |
| 2.0x to 2.9x | 42 (17.9%) | 109 (22.0%) |
| 3.0x to 3.9x | 64 (27.4%) | 180 (36.3%) |
| 4.0x or more | 58 (24.8%) | 63 (12.7%) |
| Total | 234 (100.0%) | 496 (100.0%) |
Real Estate Taxes by Mortgage Status in New Britain borough
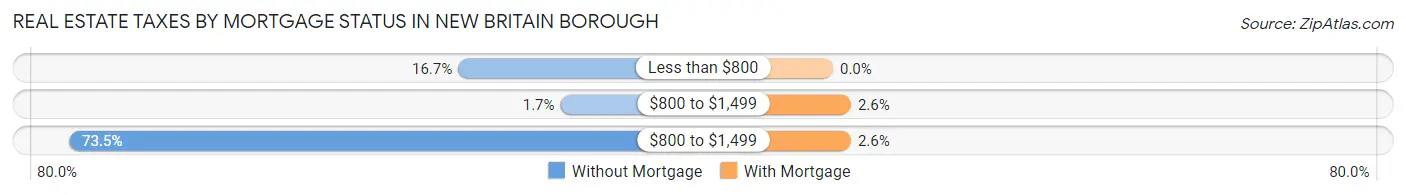
| Property Taxes | Without Mortgage | With Mortgage |
| Less than $800 | 39 (16.7%) | 0 (0.0%) |
| $800 to $1,499 | 4 (1.7%) | 13 (2.6%) |
| $800 to $1,499 | 172 (73.5%) | 13 (2.6%) |
| Total | 234 (100.0%) | 496 (100.0%) |
Health & Disability in New Britain borough
Health Insurance Coverage by Age in New Britain borough
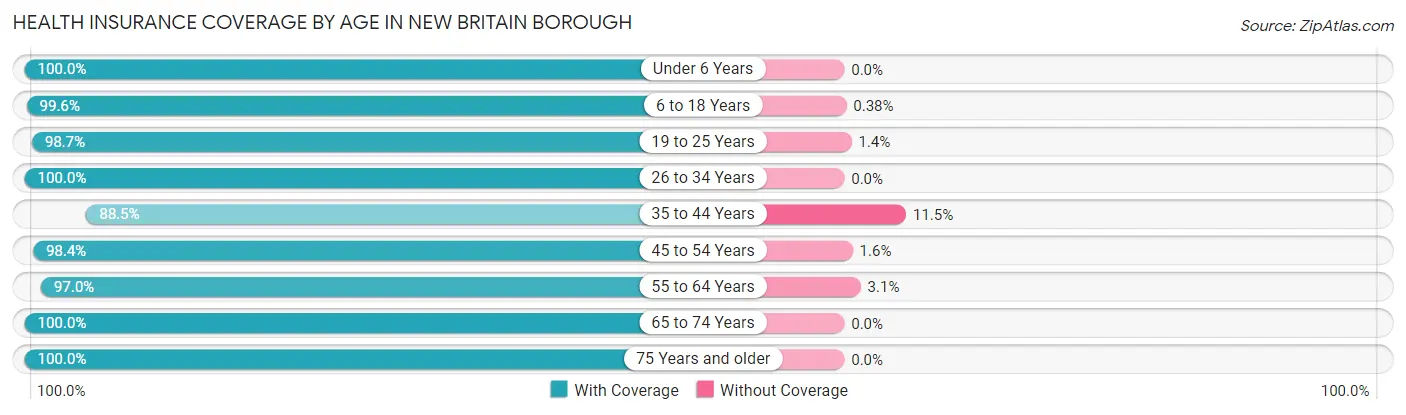
| Age Bracket | With Coverage | Without Coverage |
| Under 6 Years | 71 (100.0%) | 0 (0.0%) |
| 6 to 18 Years | 525 (99.6%) | 2 (0.4%) |
| 19 to 25 Years | 804 (98.7%) | 11 (1.3%) |
| 26 to 34 Years | 222 (100.0%) | 0 (0.0%) |
| 35 to 44 Years | 223 (88.5%) | 29 (11.5%) |
| 45 to 54 Years | 253 (98.4%) | 4 (1.6%) |
| 55 to 64 Years | 318 (97.0%) | 10 (3.0%) |
| 65 to 74 Years | 216 (100.0%) | 0 (0.0%) |
| 75 Years and older | 158 (100.0%) | 0 (0.0%) |
| Total | 2,790 (98.0%) | 56 (2.0%) |
Health Insurance Coverage by Citizenship Status in New Britain borough
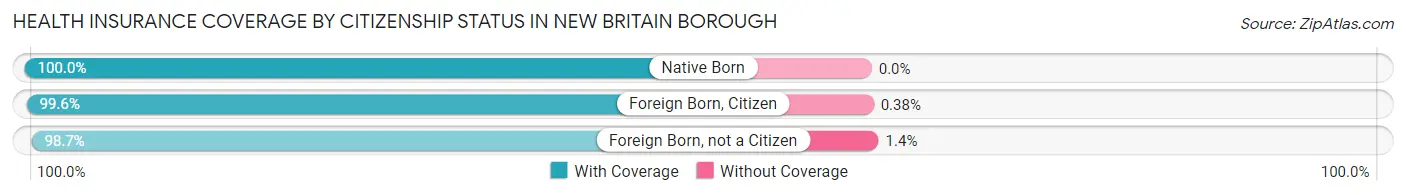
| Citizenship Status | With Coverage | Without Coverage |
| Native Born | 71 (100.0%) | 0 (0.0%) |
| Foreign Born, Citizen | 525 (99.6%) | 2 (0.4%) |
| Foreign Born, not a Citizen | 804 (98.7%) | 11 (1.3%) |
Health Insurance Coverage by Household Income in New Britain borough
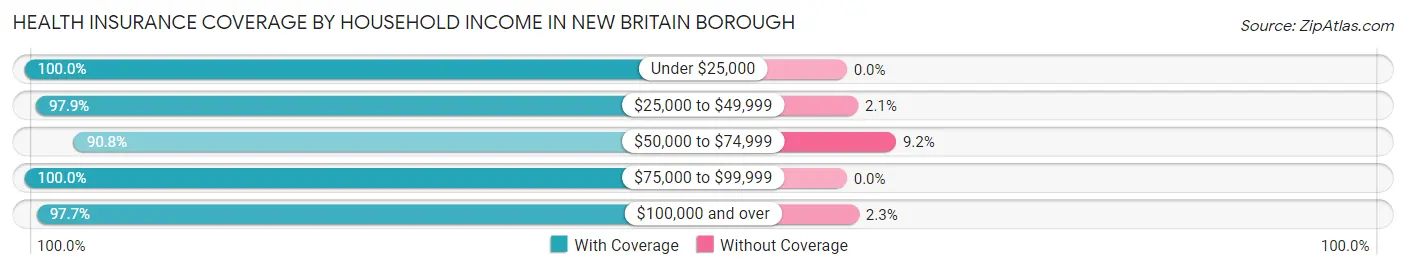
| Household Income | With Coverage | Without Coverage |
| Under $25,000 | 64 (100.0%) | 0 (0.0%) |
| $25,000 to $49,999 | 184 (97.9%) | 4 (2.1%) |
| $50,000 to $74,999 | 128 (90.8%) | 13 (9.2%) |
| $75,000 to $99,999 | 166 (100.0%) | 0 (0.0%) |
| $100,000 and over | 1,464 (97.7%) | 34 (2.3%) |
Public vs Private Health Insurance Coverage by Age in New Britain borough
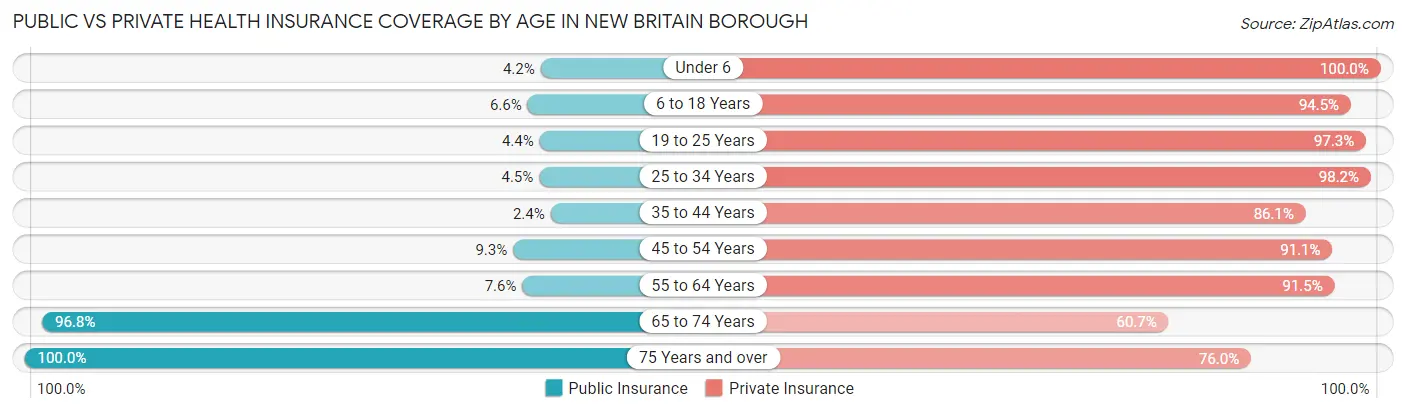
| Age Bracket | Public Insurance | Private Insurance |
| Under 6 | 3 (4.2%) | 71 (100.0%) |
| 6 to 18 Years | 35 (6.6%) | 498 (94.5%) |
| 19 to 25 Years | 36 (4.4%) | 793 (97.3%) |
| 25 to 34 Years | 10 (4.5%) | 218 (98.2%) |
| 35 to 44 Years | 6 (2.4%) | 217 (86.1%) |
| 45 to 54 Years | 24 (9.3%) | 234 (91.0%) |
| 55 to 64 Years | 25 (7.6%) | 300 (91.5%) |
| 65 to 74 Years | 209 (96.8%) | 131 (60.7%) |
| 75 Years and over | 158 (100.0%) | 120 (75.9%) |
| Total | 506 (17.8%) | 2,582 (90.7%) |
Disability Status by Sex by Age in New Britain borough
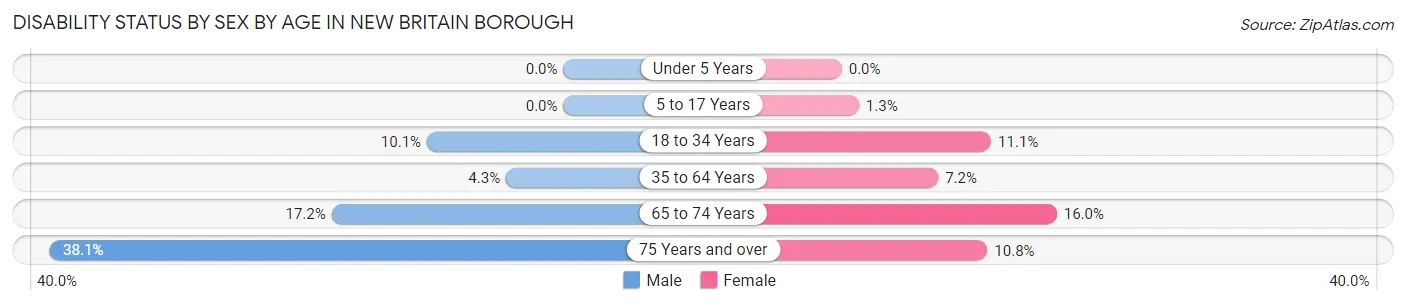
| Age Bracket | Male | Female |
| Under 5 Years | 0 (0.0%) | 0 (0.0%) |
| 5 to 17 Years | 0 (0.0%) | 3 (1.3%) |
| 18 to 34 Years | 63 (10.1%) | 60 (11.1%) |
| 35 to 64 Years | 16 (4.3%) | 33 (7.2%) |
| 65 to 74 Years | 21 (17.2%) | 15 (16.0%) |
| 75 Years and over | 32 (38.1%) | 8 (10.8%) |
Disability Class by Sex by Age in New Britain borough
Disability Class: Hearing Difficulty
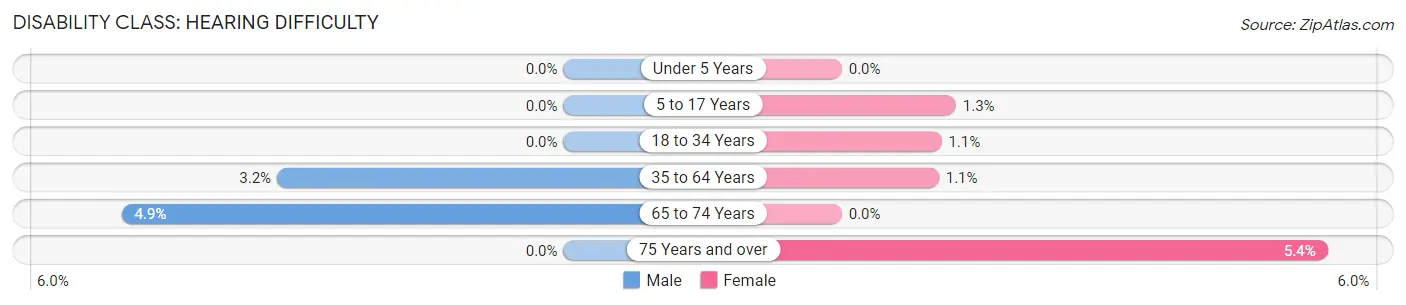
| Age Bracket | Male | Female |
| Under 5 Years | 0 (0.0%) | 0 (0.0%) |
| 5 to 17 Years | 0 (0.0%) | 3 (1.3%) |
| 18 to 34 Years | 0 (0.0%) | 6 (1.1%) |
| 35 to 64 Years | 12 (3.2%) | 5 (1.1%) |
| 65 to 74 Years | 6 (4.9%) | 0 (0.0%) |
| 75 Years and over | 0 (0.0%) | 4 (5.4%) |
Disability Class: Vision Difficulty
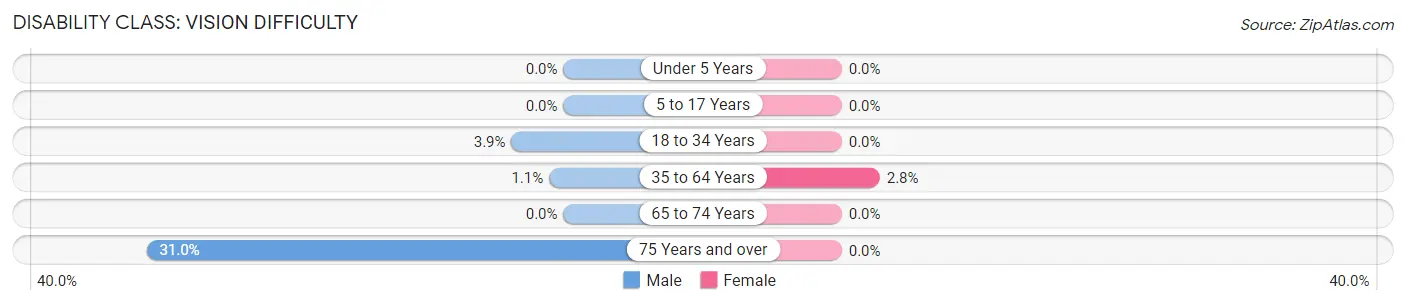
| Age Bracket | Male | Female |
| Under 5 Years | 0 (0.0%) | 0 (0.0%) |
| 5 to 17 Years | 0 (0.0%) | 0 (0.0%) |
| 18 to 34 Years | 24 (3.9%) | 0 (0.0%) |
| 35 to 64 Years | 4 (1.1%) | 13 (2.8%) |
| 65 to 74 Years | 0 (0.0%) | 0 (0.0%) |
| 75 Years and over | 26 (30.9%) | 0 (0.0%) |
Disability Class: Cognitive Difficulty
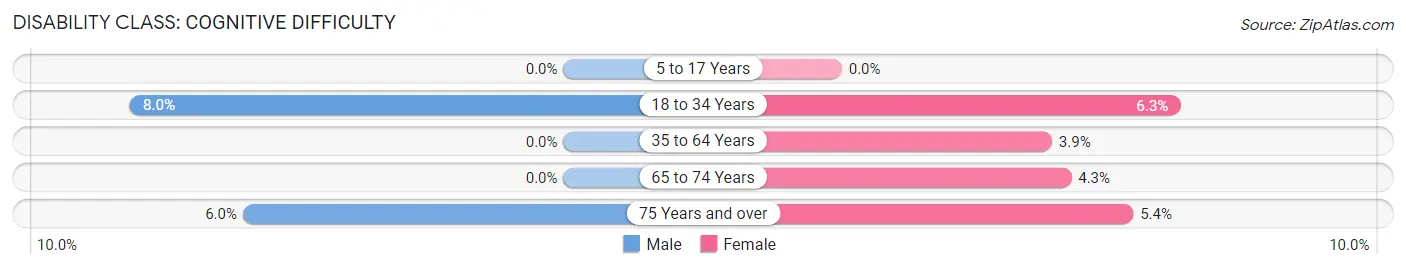
| Age Bracket | Male | Female |
| 5 to 17 Years | 0 (0.0%) | 0 (0.0%) |
| 18 to 34 Years | 50 (8.0%) | 34 (6.3%) |
| 35 to 64 Years | 0 (0.0%) | 18 (3.9%) |
| 65 to 74 Years | 0 (0.0%) | 4 (4.3%) |
| 75 Years and over | 5 (5.9%) | 4 (5.4%) |
Disability Class: Ambulatory Difficulty
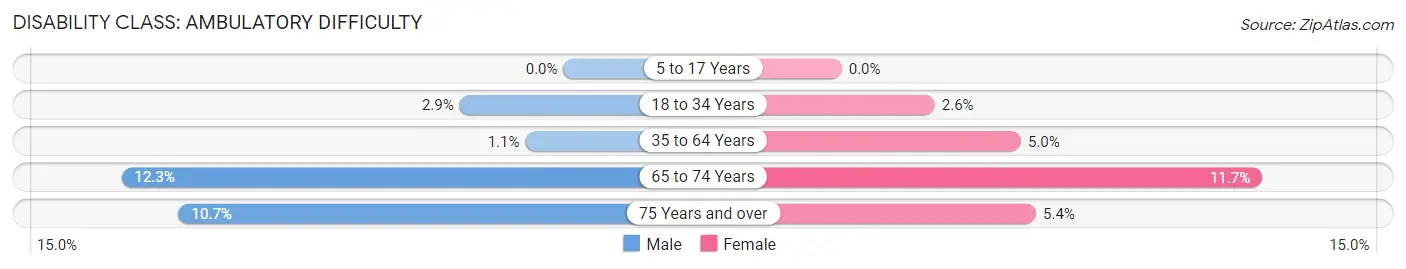
| Age Bracket | Male | Female |
| 5 to 17 Years | 0 (0.0%) | 0 (0.0%) |
| 18 to 34 Years | 18 (2.9%) | 14 (2.6%) |
| 35 to 64 Years | 4 (1.1%) | 23 (5.0%) |
| 65 to 74 Years | 15 (12.3%) | 11 (11.7%) |
| 75 Years and over | 9 (10.7%) | 4 (5.4%) |
Disability Class: Self-Care Difficulty
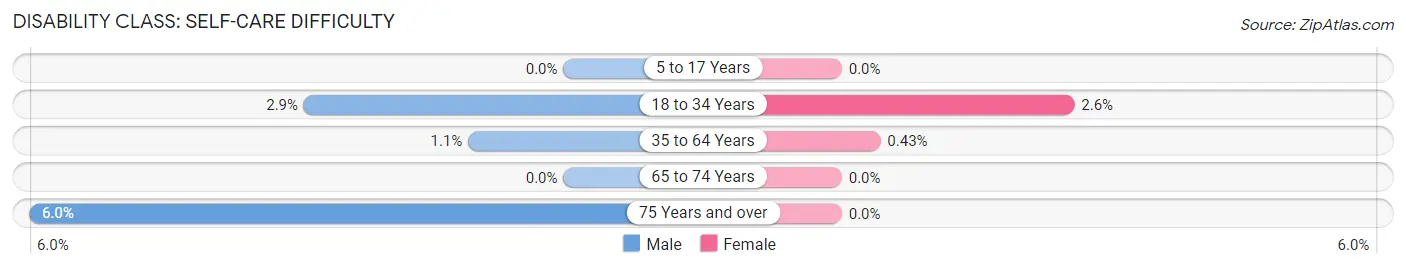
| Age Bracket | Male | Female |
| 5 to 17 Years | 0 (0.0%) | 0 (0.0%) |
| 18 to 34 Years | 18 (2.9%) | 14 (2.6%) |
| 35 to 64 Years | 4 (1.1%) | 2 (0.4%) |
| 65 to 74 Years | 0 (0.0%) | 0 (0.0%) |
| 75 Years and over | 5 (5.9%) | 0 (0.0%) |
Technology Access in New Britain borough
Computing Device Access in New Britain borough
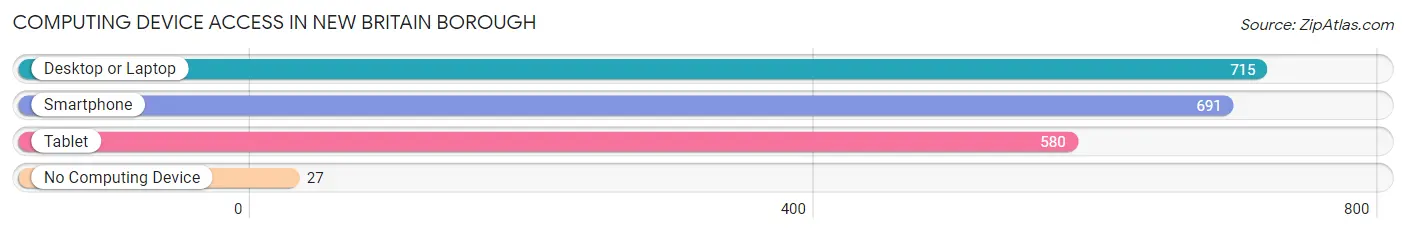
| Device Type | # Households | % Households |
| Desktop or Laptop | 715 | 91.2% |
| Smartphone | 691 | 88.1% |
| Tablet | 580 | 74.0% |
| No Computing Device | 27 | 3.4% |
| Total | 784 | 100.0% |
Internet Access in New Britain borough
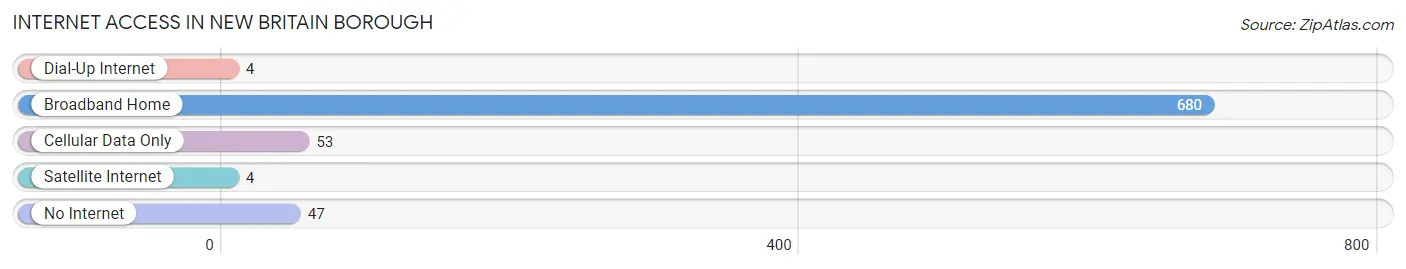
| Internet Type | # Households | % Households |
| Dial-Up Internet | 4 | 0.5% |
| Broadband Home | 680 | 86.7% |
| Cellular Data Only | 53 | 6.8% |
| Satellite Internet | 4 | 0.5% |
| No Internet | 47 | 6.0% |
| Total | 784 | 100.0% |
New Britain borough Summary
New Britain Borough is a small borough located in Bucks County, Pennsylvania. It is situated in the southeastern corner of the county, just north of Philadelphia. The borough is home to approximately 2,500 people and covers an area of 1.2 square miles.
History
New Britain Borough was founded in 1737 by a group of Quakers from England. The borough was originally known as New Britain Township, and was part of Philadelphia County until Bucks County was formed in 1752. The borough was officially incorporated in 1876.
The borough was named after the town of New Britain in England, which was the hometown of many of the original settlers. The borough was originally a farming community, and the main crops grown were wheat, corn, and oats.
In the late 19th century, the borough began to experience a period of growth and development. The railroad was extended to the borough in 1876, and this allowed for the development of industry and commerce. The borough also became a popular summer resort destination, and many wealthy Philadelphians built summer homes in the area.
Geography
New Britain Borough is located in southeastern Bucks County, just north of Philadelphia. The borough is situated on the banks of the Delaware River, and is bordered by the boroughs of Chalfont, Hilltown, and Silverdale. The borough is located in the Delaware Valley, and is part of the Philadelphia metropolitan area.
The borough is mostly flat, with some rolling hills in the northern part of the borough. The borough is located in a temperate climate zone, and the average annual temperature is around 50 degrees Fahrenheit. The average annual precipitation is around 40 inches.
Economy
The economy of New Britain Borough is largely based on the service industry. The borough is home to a number of small businesses, including restaurants, retail stores, and professional services. The borough is also home to a number of manufacturing companies, including a paper mill and a plastics factory.
The borough is also home to a number of educational institutions, including a community college and a technical school. The borough is also home to a number of parks and recreational facilities, including a golf course and a public pool.
Demographics
As of the 2010 census, the population of New Britain Borough was 2,521. The racial makeup of the borough was 94.3% White, 2.2% African American, 0.3% Native American, 0.9% Asian, 0.1% Pacific Islander, and 1.2% from other races. Hispanic or Latino of any race were 2.7% of the population.
The median household income in the borough was $60,938, and the median family income was $71,250. The per capita income in the borough was $27,945. About 4.3% of families and 5.7% of the population were below the poverty line.
New Britain Borough is a small borough with a rich history and a diverse economy. The borough is home to a number of small businesses, educational institutions, and recreational facilities. The borough is also home to a diverse population, with a variety of racial and ethnic backgrounds.
Common Questions
What is Per Capita Income in New Britain borough?
Per Capita income in New Britain borough is $40,258.
What is the Median Family Income in New Britain borough?
Median Family Income in New Britain borough is $147,361.
What is the Median Household income in New Britain borough?
Median Household Income in New Britain borough is $120,294.
What is Income or Wage Gap in New Britain borough?
Income or Wage Gap in New Britain borough is 65.3%.
Women in New Britain borough earn 34.7 cents for every dollar earned by a man.
What is Inequality or Gini Index in New Britain borough?
Inequality or Gini Index in New Britain borough is 0.41.
What is the Total Population of New Britain borough?
Total Population of New Britain borough is 2,846.
What is the Total Male Population of New Britain borough?
Total Male Population of New Britain borough is 1,392.
What is the Total Female Population of New Britain borough?
Total Female Population of New Britain borough is 1,454.
What is the Ratio of Males per 100 Females in New Britain borough?
There are 95.74 Males per 100 Females in New Britain borough.
What is the Ratio of Females per 100 Males in New Britain borough?
There are 104.45 Females per 100 Males in New Britain borough.
What is the Median Population Age in New Britain borough?
Median Population Age in New Britain borough is 26.3 Years.
What is the Average Family Size in New Britain borough
Average Family Size in New Britain borough is 3.3 People.
What is the Average Household Size in New Britain borough
Average Household Size in New Britain borough is 2.6 People.
How Large is the Labor Force in New Britain borough?
There are 1,561 People in the Labor Forcein in New Britain borough.
What is the Percentage of People in the Labor Force in New Britain borough?
62.1% of People are in the Labor Force in New Britain borough.
What is the Unemployment Rate in New Britain borough?
Unemployment Rate in New Britain borough is 3.6%.