Clarksburg, MD Map & Demographics
Clarksburg Map
Clarksburg Overview
$56,045
PER CAPITA INCOME
$177,700
AVG FAMILY INCOME
$165,551
AVG HOUSEHOLD INCOME
25.7%
WAGE / INCOME GAP [ % ]
74.3¢/ $1
WAGE / INCOME GAP [ $ ]
0.35
INEQUALITY / GINI INDEX
28,337
TOTAL POPULATION
13,782
MALE POPULATION
14,555
FEMALE POPULATION
94.69
MALES / 100 FEMALES
105.61
FEMALES / 100 MALES
37.7
MEDIAN AGE
3.5
AVG FAMILY SIZE
3.2
AVG HOUSEHOLD SIZE
15,155
LABOR FORCE [ PEOPLE ]
73.9%
PERCENT IN LABOR FORCE
4.7%
UNEMPLOYMENT RATE
Clarksburg Zip Codes
Income in Clarksburg
Income Overview in Clarksburg
Per Capita Income in Clarksburg is $56,045, while median incomes of families and households are $177,700 and $165,551 respectively.
| Characteristic | Number | Measure |
| Per Capita Income | 28,337 | $56,045 |
| Median Family Income | 7,467 | $177,700 |
| Mean Family Income | 7,467 | $188,208 |
| Median Household Income | 8,746 | $165,551 |
| Mean Household Income | 8,746 | $177,839 |
| Income Deficit | 7,467 | $0 |
| Wage / Income Gap (%) | 28,337 | 25.70% |
| Wage / Income Gap ($) | 28,337 | 74.30¢ per $1 |
| Gini / Inequality Index | 28,337 | 0.35 |
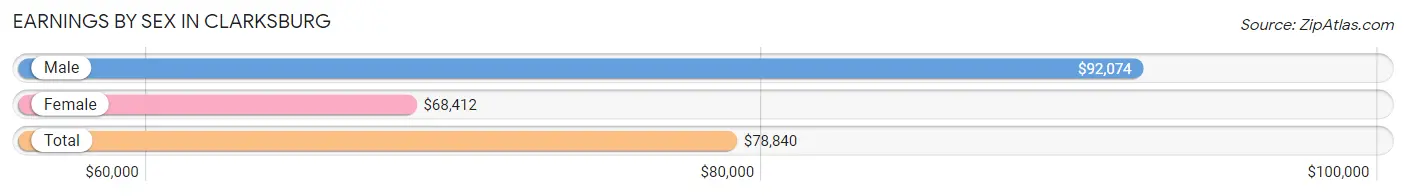
Earnings by Sex in Clarksburg
Average Earnings in Clarksburg are $78,840, $92,074 for men and $68,412 for women, a difference of 25.7%.
| Sex | Number | Average Earnings |
| Male | 7,751 (49.6%) | $92,074 |
| Female | 7,866 (50.4%) | $68,412 |
| Total | 15,617 (100.0%) | $78,840 |
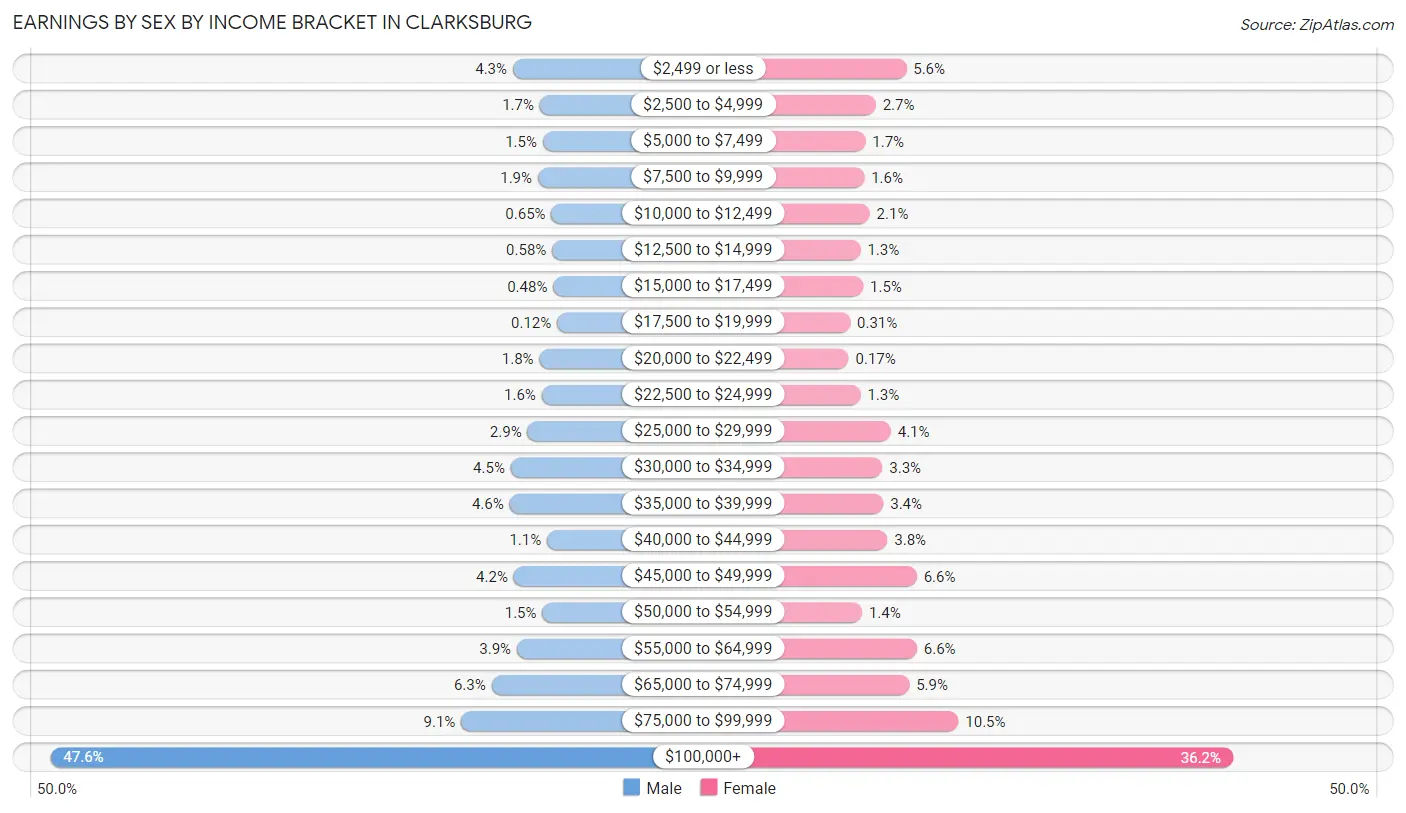
Earnings by Sex by Income Bracket in Clarksburg
The most common earnings brackets in Clarksburg are $100,000+ for men (3,688 | 47.6%) and $100,000+ for women (2,844 | 36.2%).
| Income | Male | Female |
| $2,499 or less | 330 (4.3%) | 438 (5.6%) |
| $2,500 to $4,999 | 135 (1.7%) | 213 (2.7%) |
| $5,000 to $7,499 | 113 (1.5%) | 137 (1.7%) |
| $7,500 to $9,999 | 149 (1.9%) | 128 (1.6%) |
| $10,000 to $12,499 | 50 (0.6%) | 168 (2.1%) |
| $12,500 to $14,999 | 45 (0.6%) | 101 (1.3%) |
| $15,000 to $17,499 | 37 (0.5%) | 120 (1.5%) |
| $17,500 to $19,999 | 9 (0.1%) | 24 (0.3%) |
| $20,000 to $22,499 | 137 (1.8%) | 13 (0.2%) |
| $22,500 to $24,999 | 121 (1.6%) | 101 (1.3%) |
| $25,000 to $29,999 | 224 (2.9%) | 324 (4.1%) |
| $30,000 to $34,999 | 346 (4.5%) | 262 (3.3%) |
| $35,000 to $39,999 | 354 (4.6%) | 269 (3.4%) |
| $40,000 to $44,999 | 82 (1.1%) | 299 (3.8%) |
| $45,000 to $49,999 | 324 (4.2%) | 515 (6.6%) |
| $50,000 to $54,999 | 116 (1.5%) | 112 (1.4%) |
| $55,000 to $64,999 | 301 (3.9%) | 516 (6.6%) |
| $65,000 to $74,999 | 485 (6.3%) | 460 (5.9%) |
| $75,000 to $99,999 | 705 (9.1%) | 822 (10.4%) |
| $100,000+ | 3,688 (47.6%) | 2,844 (36.2%) |
| Total | 7,751 (100.0%) | 7,866 (100.0%) |
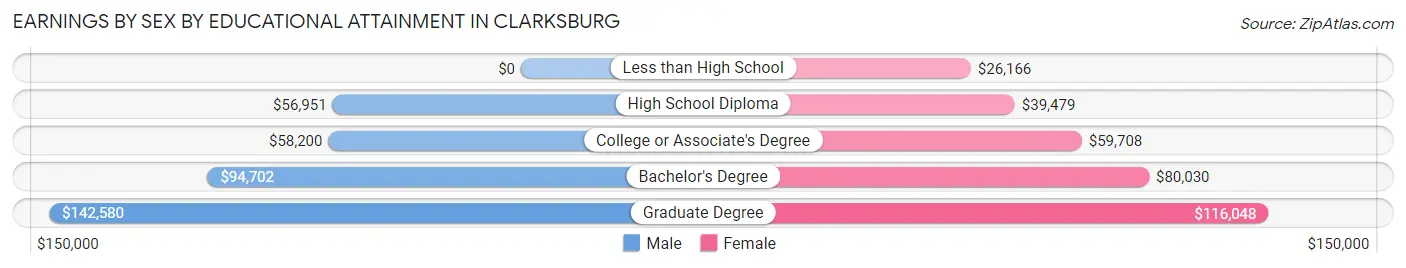
Earnings by Sex by Educational Attainment in Clarksburg
Average earnings in Clarksburg are $101,763 for men and $74,775 for women, a difference of 26.5%. Men with an educational attainment of graduate degree enjoy the highest average annual earnings of $142,580, while those with high school diploma education earn the least with $56,951. Women with an educational attainment of graduate degree earn the most with the average annual earnings of $116,048, while those with less than high school education have the smallest earnings of $26,166.
| Educational Attainment | Male Income | Female Income |
| Less than High School | - | - |
| High School Diploma | $56,951 | $39,479 |
| College or Associate's Degree | $58,200 | $59,708 |
| Bachelor's Degree | $94,702 | $80,030 |
| Graduate Degree | $142,580 | $116,048 |
| Total | $101,763 | $74,775 |
Family Income in Clarksburg
Family Income Brackets in Clarksburg
According to the Clarksburg family income data, there are 2,942 families falling into the $200,000+ income range, which is the most common income bracket and makes up 39.4% of all families. Conversely, the $10,000 to $14,999 income bracket is the least frequent group with only 45 families (0.6%) belonging to this category.
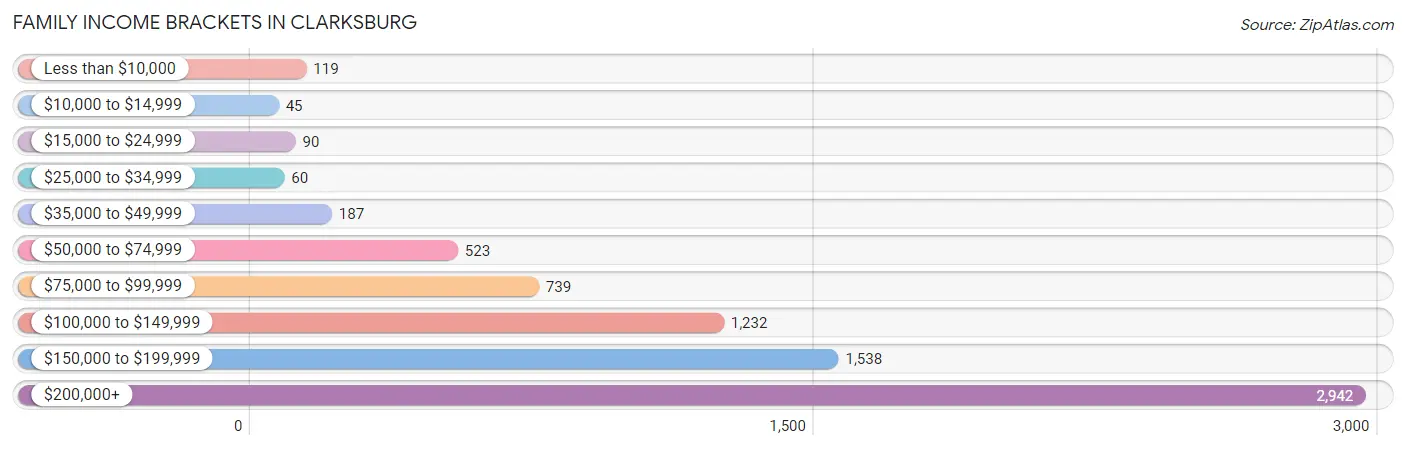
| Income Bracket | # Families | % Families |
| Less than $10,000 | 119 | 1.6% |
| $10,000 to $14,999 | 45 | 0.6% |
| $15,000 to $24,999 | 90 | 1.2% |
| $25,000 to $34,999 | 60 | 0.8% |
| $35,000 to $49,999 | 187 | 2.5% |
| $50,000 to $74,999 | 523 | 7.0% |
| $75,000 to $99,999 | 739 | 9.9% |
| $100,000 to $149,999 | 1,232 | 16.5% |
| $150,000 to $199,999 | 1,538 | 20.6% |
| $200,000+ | 2,942 | 39.4% |
Family Income by Famaliy Size in Clarksburg
6-person families (233 | 3.1%) account for the highest median family income in Clarksburg with $217,411 per family, while 2-person families (1,948 | 26.1%) have the highest median income of $73,360 per family member.
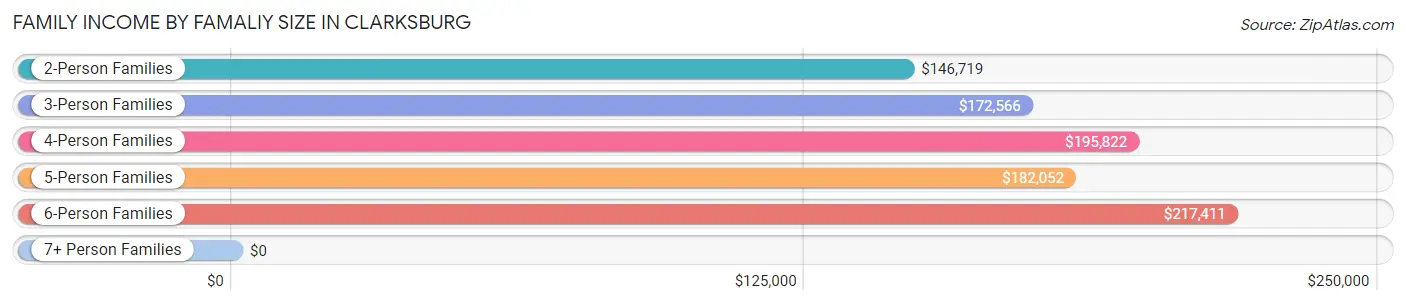
| Income Bracket | # Families | Median Income |
| 2-Person Families | 1,948 (26.1%) | $146,719 |
| 3-Person Families | 2,057 (27.6%) | $172,566 |
| 4-Person Families | 2,231 (29.9%) | $195,822 |
| 5-Person Families | 981 (13.1%) | $182,052 |
| 6-Person Families | 233 (3.1%) | $217,411 |
| 7+ Person Families | 17 (0.2%) | $0 |
| Total | 7,467 (100.0%) | $177,700 |
Family Income by Number of Earners in Clarksburg
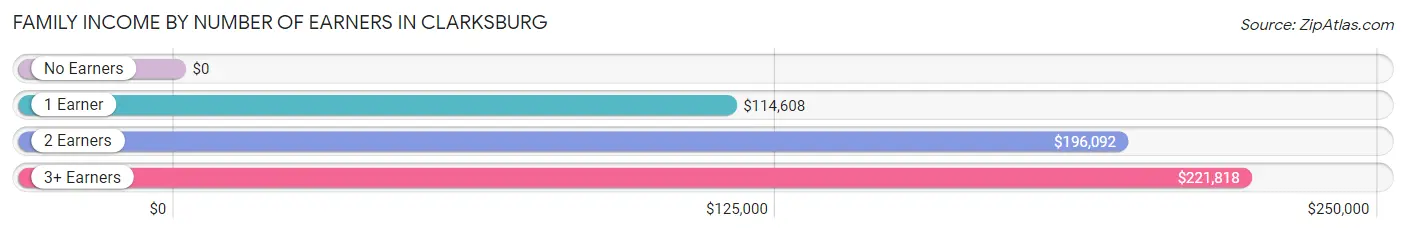
| Number of Earners | # Families | Median Income |
| No Earners | 321 (4.3%) | $0 |
| 1 Earner | 1,719 (23.0%) | $114,608 |
| 2 Earners | 4,365 (58.5%) | $196,092 |
| 3+ Earners | 1,062 (14.2%) | $221,818 |
| Total | 7,467 (100.0%) | $177,700 |
Household Income in Clarksburg
Household Income Brackets in Clarksburg
With 3,096 households falling in the category, the $200,000+ income range is the most frequent in Clarksburg, accounting for 35.4% of all households. In contrast, only 131 households (1.5%) fall into the $10,000 to $14,999 income bracket, making it the least populous group.
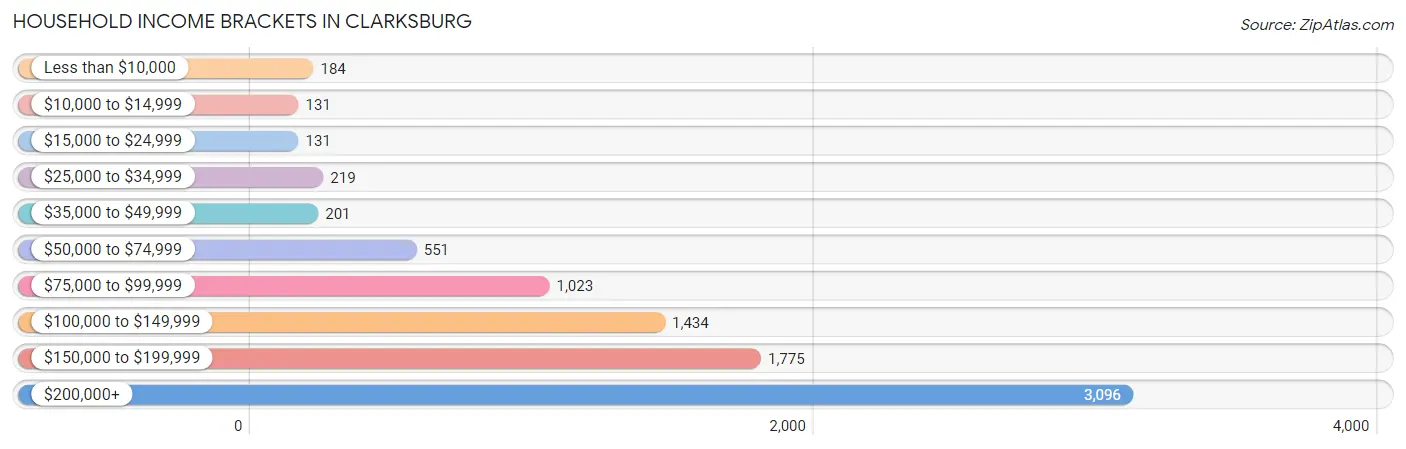
| Income Bracket | # Households | % Households |
| Less than $10,000 | 184 | 2.1% |
| $10,000 to $14,999 | 131 | 1.5% |
| $15,000 to $24,999 | 131 | 1.5% |
| $25,000 to $34,999 | 219 | 2.5% |
| $35,000 to $49,999 | 201 | 2.3% |
| $50,000 to $74,999 | 551 | 6.3% |
| $75,000 to $99,999 | 1,023 | 11.7% |
| $100,000 to $149,999 | 1,434 | 16.4% |
| $150,000 to $199,999 | 1,775 | 20.3% |
| $200,000+ | 3,096 | 35.4% |
Household Income by Householder Age in Clarksburg
The median household income in Clarksburg is $165,551, with the highest median household income of $178,824 found in the 45 to 64 years age bracket for the primary householder. A total of 3,947 households (45.1%) fall into this category. Meanwhile, the 15 to 24 years age bracket for the primary householder has the lowest median household income of $61,724, with 190 households (2.2%) in this group.
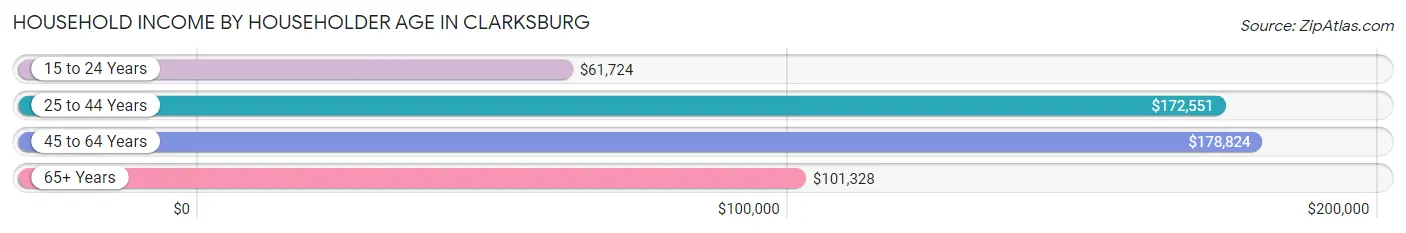
| Income Bracket | # Households | Median Income |
| 15 to 24 Years | 190 (2.2%) | $61,724 |
| 25 to 44 Years | 3,652 (41.8%) | $172,551 |
| 45 to 64 Years | 3,947 (45.1%) | $178,824 |
| 65+ Years | 957 (10.9%) | $101,328 |
| Total | 8,746 (100.0%) | $165,551 |
Poverty in Clarksburg
Income Below Poverty by Sex and Age in Clarksburg
With 3.6% poverty level for males and 4.5% for females among the residents of Clarksburg, 75 year old and over males and 16 and 17 year old females are the most vulnerable to poverty, with 28 males (13.9%) and 120 females (25.4%) in their respective age groups living below the poverty level.
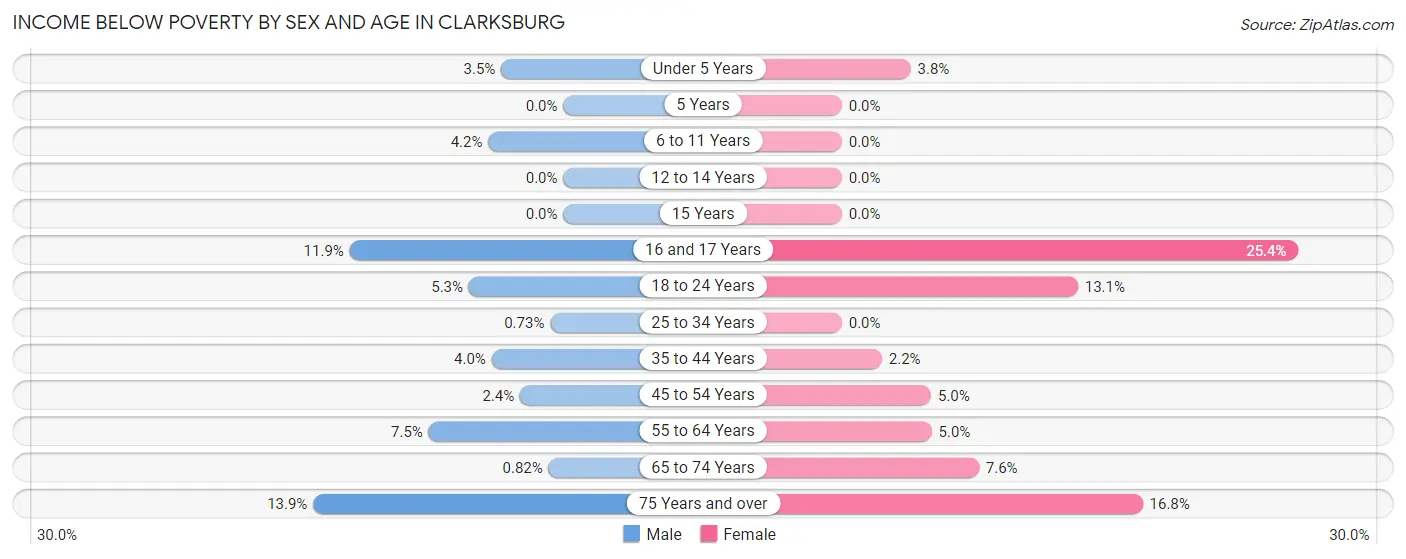
| Age Bracket | Male | Female |
| Under 5 Years | 47 (3.5%) | 35 (3.8%) |
| 5 Years | 0 (0.0%) | 0 (0.0%) |
| 6 to 11 Years | 65 (4.2%) | 0 (0.0%) |
| 12 to 14 Years | 0 (0.0%) | 0 (0.0%) |
| 15 Years | 0 (0.0%) | 0 (0.0%) |
| 16 and 17 Years | 45 (11.9%) | 120 (25.4%) |
| 18 to 24 Years | 35 (5.3%) | 79 (13.1%) |
| 25 to 34 Years | 9 (0.7%) | 0 (0.0%) |
| 35 to 44 Years | 109 (4.0%) | 63 (2.2%) |
| 45 to 54 Years | 55 (2.4%) | 107 (5.0%) |
| 55 to 64 Years | 92 (7.5%) | 93 (5.0%) |
| 65 to 74 Years | 7 (0.8%) | 65 (7.6%) |
| 75 Years and over | 28 (13.9%) | 99 (16.8%) |
| Total | 492 (3.6%) | 661 (4.5%) |
Income Above Poverty by Sex and Age in Clarksburg
According to the poverty statistics in Clarksburg, males aged 5 years and females aged 5 years are the age groups that are most secure financially, with 100.0% of males and 100.0% of females in these age groups living above the poverty line.
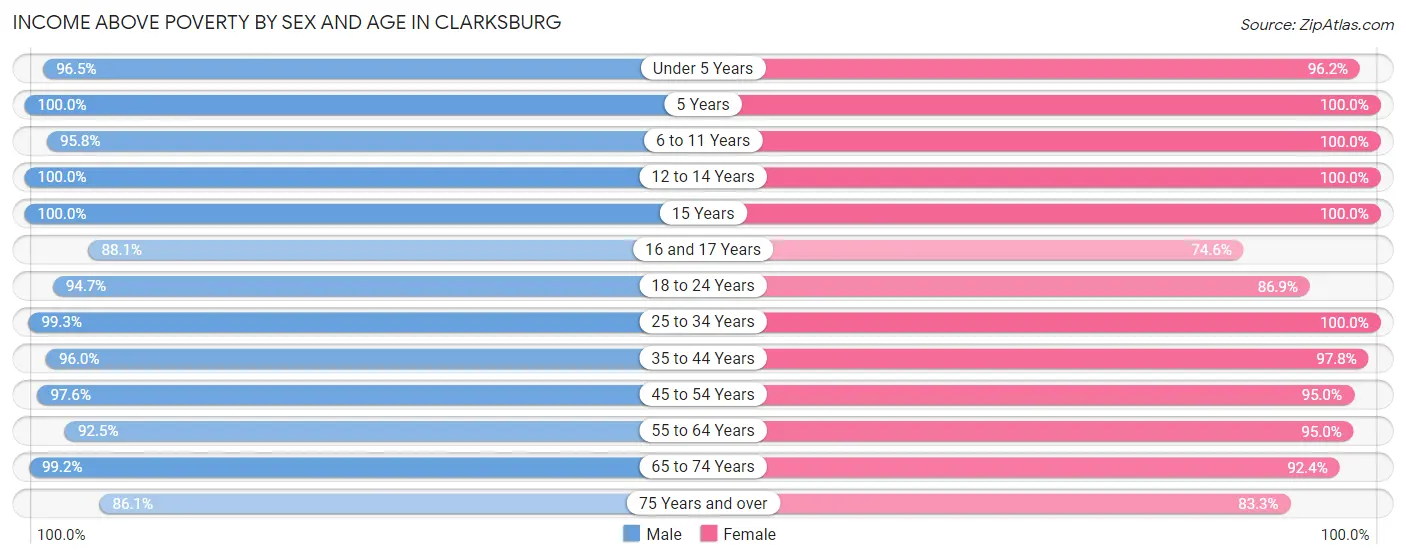
| Age Bracket | Male | Female |
| Under 5 Years | 1,313 (96.5%) | 879 (96.2%) |
| 5 Years | 102 (100.0%) | 249 (100.0%) |
| 6 to 11 Years | 1,489 (95.8%) | 1,470 (100.0%) |
| 12 to 14 Years | 915 (100.0%) | 811 (100.0%) |
| 15 Years | 225 (100.0%) | 161 (100.0%) |
| 16 and 17 Years | 333 (88.1%) | 352 (74.6%) |
| 18 to 24 Years | 630 (94.7%) | 522 (86.9%) |
| 25 to 34 Years | 1,232 (99.3%) | 1,570 (100.0%) |
| 35 to 44 Years | 2,623 (96.0%) | 2,762 (97.8%) |
| 45 to 54 Years | 2,224 (97.6%) | 2,048 (95.0%) |
| 55 to 64 Years | 1,135 (92.5%) | 1,767 (95.0%) |
| 65 to 74 Years | 849 (99.2%) | 787 (92.4%) |
| 75 Years and over | 173 (86.1%) | 492 (83.3%) |
| Total | 13,243 (96.4%) | 13,870 (95.5%) |
Income Below Poverty Among Married-Couple Families in Clarksburg
The poverty statistics for married-couple families in Clarksburg show that 1.5% or 88 of the total 6,074 families live below the poverty line. Families with no children have the highest poverty rate of 1.9%, comprising of 44 families. On the other hand, families with 3 or 4 children have the lowest poverty rate of 0.0%, which includes 0 families.
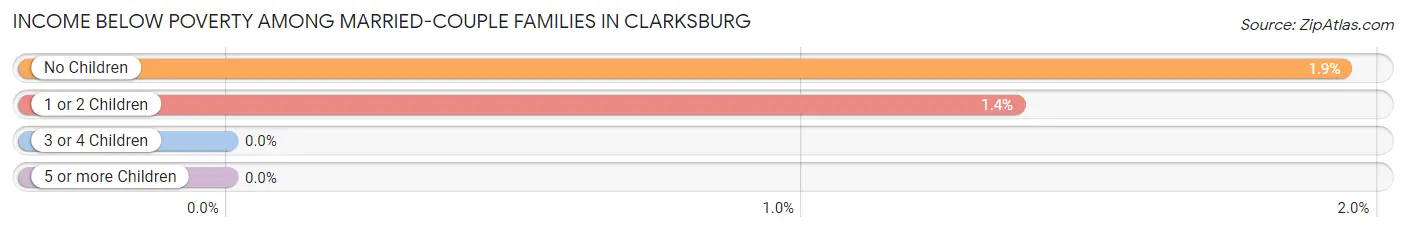
| Children | Above Poverty | Below Poverty |
| No Children | 2,226 (98.1%) | 44 (1.9%) |
| 1 or 2 Children | 3,179 (98.6%) | 44 (1.4%) |
| 3 or 4 Children | 581 (100.0%) | 0 (0.0%) |
| 5 or more Children | 0 (0.0%) | 0 (0.0%) |
| Total | 5,986 (98.6%) | 88 (1.5%) |
Income Below Poverty Among Single-Parent Households in Clarksburg
According to the poverty data in Clarksburg, 4.7% or 9 single-father households and 9.7% or 117 single-mother households are living below the poverty line. Among single-father households, those with 1 or 2 children have the highest poverty rate, with 9 households (7.4%) experiencing poverty. Likewise, among single-mother households, those with 1 or 2 children have the highest poverty rate, with 117 households (20.0%) falling below the poverty line.
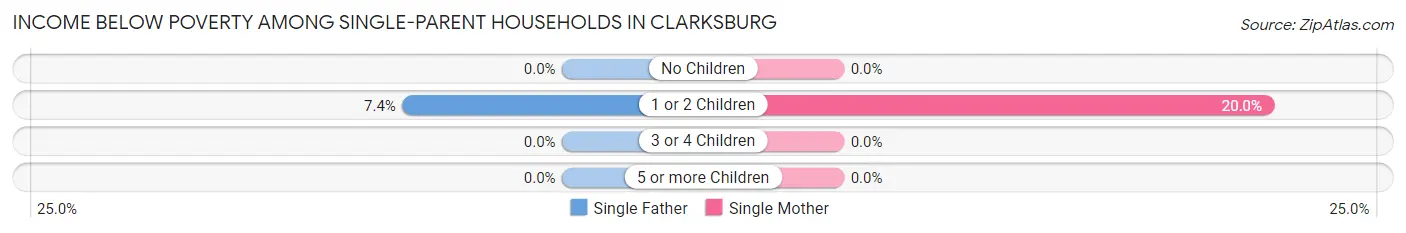
| Children | Single Father | Single Mother |
| No Children | 0 (0.0%) | 0 (0.0%) |
| 1 or 2 Children | 9 (7.4%) | 117 (20.0%) |
| 3 or 4 Children | 0 (0.0%) | 0 (0.0%) |
| 5 or more Children | 0 (0.0%) | 0 (0.0%) |
| Total | 9 (4.7%) | 117 (9.7%) |
Income Below Poverty Among Married-Couple vs Single-Parent Households in Clarksburg
The poverty data for Clarksburg shows that 88 of the married-couple family households (1.5%) and 126 of the single-parent households (9.0%) are living below the poverty level. Within the married-couple family households, those with no children have the highest poverty rate, with 44 households (1.9%) falling below the poverty line. Among the single-parent households, those with 1 or 2 children have the highest poverty rate, with 126 household (17.9%) living below poverty.
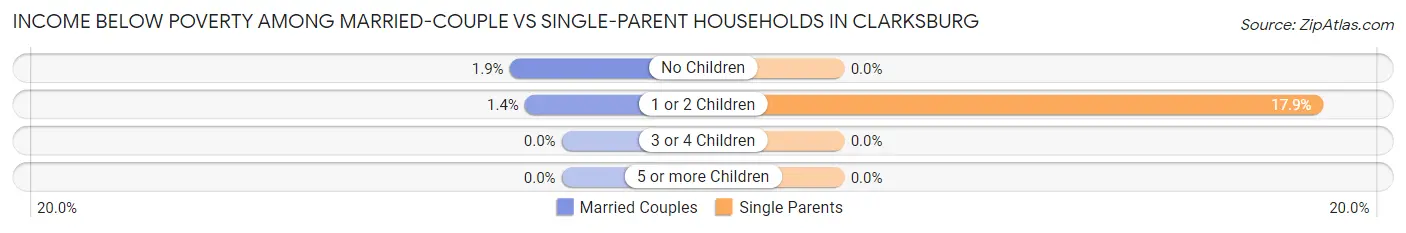
| Children | Married-Couple Families | Single-Parent Households |
| No Children | 44 (1.9%) | 0 (0.0%) |
| 1 or 2 Children | 44 (1.4%) | 126 (17.9%) |
| 3 or 4 Children | 0 (0.0%) | 0 (0.0%) |
| 5 or more Children | 0 (0.0%) | 0 (0.0%) |
| Total | 88 (1.5%) | 126 (9.0%) |
Race in Clarksburg
The most populous races in Clarksburg are Asian (11,329 | 40.0%), White / Caucasian (8,590 | 30.3%), and Black / African American (4,687 | 16.5%).
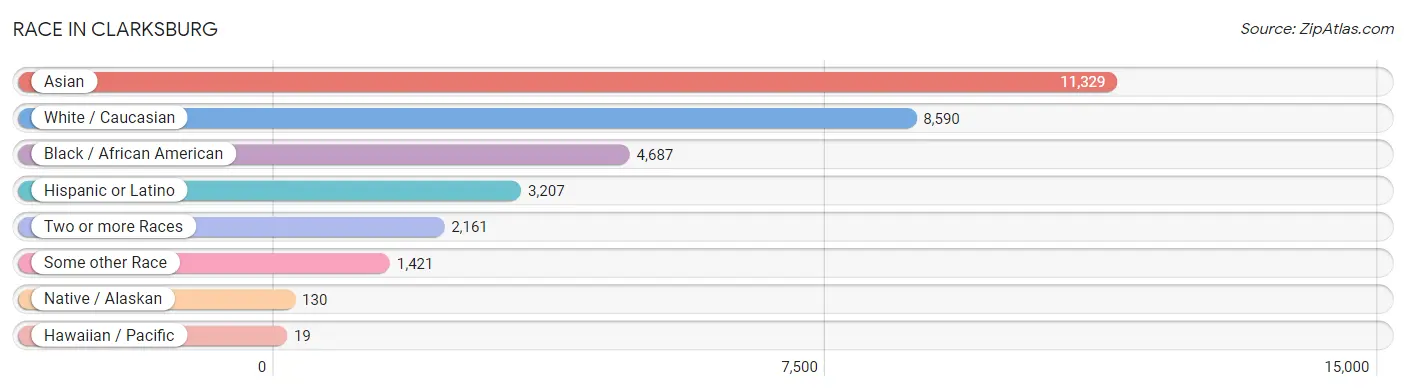
| Race | # Population | % Population |
| Asian | 11,329 | 40.0% |
| Black / African American | 4,687 | 16.5% |
| Hawaiian / Pacific | 19 | 0.1% |
| Hispanic or Latino | 3,207 | 11.3% |
| Native / Alaskan | 130 | 0.5% |
| White / Caucasian | 8,590 | 30.3% |
| Two or more Races | 2,161 | 7.6% |
| Some other Race | 1,421 | 5.0% |
| Total | 28,337 | 100.0% |
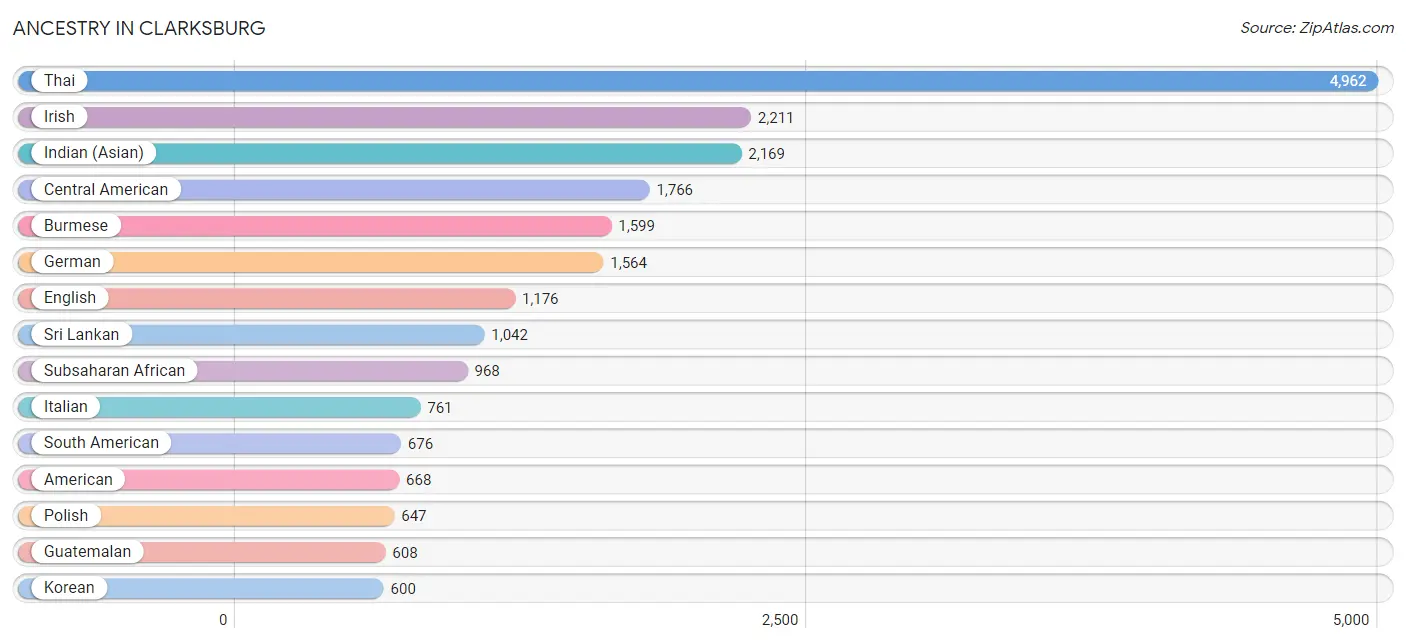
Ancestry in Clarksburg
The most populous ancestries reported in Clarksburg are Thai (4,962 | 17.5%), Irish (2,211 | 7.8%), Indian (Asian) (2,169 | 7.6%), Central American (1,766 | 6.2%), and Burmese (1,599 | 5.6%), together accounting for 44.8% of all Clarksburg residents.
| Ancestry | # Population | % Population |
| Afghan | 23 | 0.1% |
| African | 351 | 1.2% |
| American | 668 | 2.4% |
| Arab | 325 | 1.1% |
| Argentinean | 58 | 0.2% |
| Austrian | 41 | 0.1% |
| Belgian | 15 | 0.1% |
| Bhutanese | 53 | 0.2% |
| Bolivian | 104 | 0.4% |
| Brazilian | 84 | 0.3% |
| British | 39 | 0.1% |
| Bulgarian | 9 | 0.0% |
| Burmese | 1,599 | 5.6% |
| Canadian | 31 | 0.1% |
| Central American | 1,766 | 6.2% |
| Cherokee | 3 | 0.0% |
| Colombian | 310 | 1.1% |
| Cuban | 62 | 0.2% |
| Czech | 19 | 0.1% |
| Czechoslovakian | 3 | 0.0% |
| Dominican | 6 | 0.0% |
| Dutch | 108 | 0.4% |
| Eastern European | 96 | 0.3% |
| Ecuadorian | 35 | 0.1% |
| English | 1,176 | 4.2% |
| Estonian | 11 | 0.0% |
| Ethiopian | 75 | 0.3% |
| European | 253 | 0.9% |
| Filipino | 214 | 0.8% |
| French | 213 | 0.7% |
| French Canadian | 163 | 0.6% |
| German | 1,564 | 5.5% |
| Ghanaian | 73 | 0.3% |
| Greek | 42 | 0.2% |
| Guamanian / Chamorro | 105 | 0.4% |
| Guatemalan | 608 | 2.1% |
| Guyanese | 88 | 0.3% |
| Haitian | 38 | 0.1% |
| Honduran | 163 | 0.6% |
| Hungarian | 90 | 0.3% |
| Indian (Asian) | 2,169 | 7.6% |
| Iranian | 51 | 0.2% |
| Irish | 2,211 | 7.8% |
| Israeli | 14 | 0.1% |
| Italian | 761 | 2.7% |
| Jamaican | 45 | 0.2% |
| Japanese | 16 | 0.1% |
| Korean | 600 | 2.1% |
| Laotian | 23 | 0.1% |
| Lebanese | 31 | 0.1% |
| Lithuanian | 122 | 0.4% |
| Lumbee | 31 | 0.1% |
| Mexican | 69 | 0.2% |
| Mexican American Indian | 7 | 0.0% |
| Native Hawaiian | 70 | 0.3% |
| Nicaraguan | 396 | 1.4% |
| Nigerian | 189 | 0.7% |
| Northern European | 18 | 0.1% |
| Norwegian | 60 | 0.2% |
| Osage | 71 | 0.3% |
| Pakistani | 103 | 0.4% |
| Palestinian | 105 | 0.4% |
| Peruvian | 43 | 0.2% |
| Polish | 647 | 2.3% |
| Puerto Rican | 227 | 0.8% |
| Russian | 218 | 0.8% |
| Salvadoran | 599 | 2.1% |
| Scandinavian | 41 | 0.1% |
| Scotch-Irish | 18 | 0.1% |
| Scottish | 442 | 1.6% |
| Serbian | 14 | 0.1% |
| Somali | 24 | 0.1% |
| South American | 676 | 2.4% |
| Spaniard | 63 | 0.2% |
| Sri Lankan | 1,042 | 3.7% |
| Subsaharan African | 968 | 3.4% |
| Swedish | 23 | 0.1% |
| Syrian | 58 | 0.2% |
| Thai | 4,962 | 17.5% |
| Ukrainian | 62 | 0.2% |
| Venezuelan | 126 | 0.4% |
| Welsh | 151 | 0.5% | View All 82 Rows |
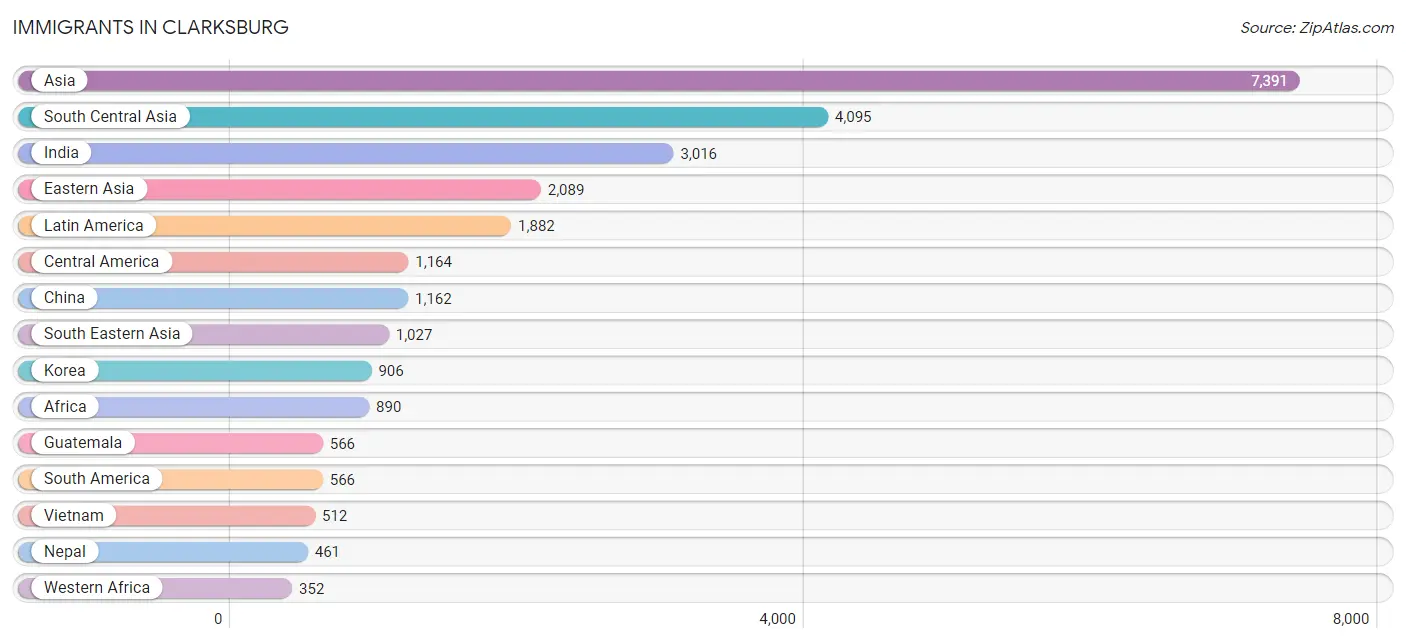
Immigrants in Clarksburg
The most numerous immigrant groups reported in Clarksburg came from Asia (7,391 | 26.1%), South Central Asia (4,095 | 14.4%), India (3,016 | 10.6%), Eastern Asia (2,089 | 7.4%), and Latin America (1,882 | 6.6%), together accounting for 65.2% of all Clarksburg residents.
| Immigration Origin | # Population | % Population |
| Afghanistan | 23 | 0.1% |
| Africa | 890 | 3.1% |
| Argentina | 24 | 0.1% |
| Asia | 7,391 | 26.1% |
| Bangladesh | 23 | 0.1% |
| Belgium | 9 | 0.0% |
| Bolivia | 17 | 0.1% |
| Brazil | 84 | 0.3% |
| Bulgaria | 9 | 0.0% |
| Cambodia | 16 | 0.1% |
| Cameroon | 266 | 0.9% |
| Canada | 113 | 0.4% |
| Caribbean | 152 | 0.5% |
| Central America | 1,164 | 4.1% |
| China | 1,162 | 4.1% |
| Colombia | 160 | 0.6% |
| Eastern Africa | 95 | 0.3% |
| Eastern Asia | 2,089 | 7.4% |
| Eastern Europe | 153 | 0.5% |
| Ecuador | 73 | 0.3% |
| El Salvador | 305 | 1.1% |
| England | 47 | 0.2% |
| Ethiopia | 75 | 0.3% |
| Europe | 255 | 0.9% |
| France | 11 | 0.0% |
| Germany | 20 | 0.1% |
| Ghana | 38 | 0.1% |
| Guatemala | 566 | 2.0% |
| Guyana | 41 | 0.1% |
| Honduras | 163 | 0.6% |
| Hong Kong | 74 | 0.3% |
| India | 3,016 | 10.6% |
| Indonesia | 52 | 0.2% |
| Iran | 67 | 0.2% |
| Israel | 39 | 0.1% |
| Japan | 21 | 0.1% |
| Jordan | 20 | 0.1% |
| Kenya | 8 | 0.0% |
| Korea | 906 | 3.2% |
| Kuwait | 105 | 0.4% |
| Latin America | 1,882 | 6.6% |
| Liberia | 51 | 0.2% |
| Malaysia | 43 | 0.2% |
| Mexico | 27 | 0.1% |
| Middle Africa | 335 | 1.2% |
| Nepal | 461 | 1.6% |
| Netherlands | 15 | 0.1% |
| Nicaragua | 103 | 0.4% |
| Nigeria | 134 | 0.5% |
| Northern Europe | 47 | 0.2% |
| Pakistan | 159 | 0.6% |
| Peru | 78 | 0.3% |
| Philippines | 345 | 1.2% |
| Russia | 123 | 0.4% |
| Senegal | 6 | 0.0% |
| Serbia | 5 | 0.0% |
| Sierra Leone | 43 | 0.2% |
| Somalia | 12 | 0.0% |
| South America | 566 | 2.0% |
| South Central Asia | 4,095 | 14.4% |
| South Eastern Asia | 1,027 | 3.6% |
| Sri Lanka | 346 | 1.2% |
| Taiwan | 176 | 0.6% |
| Thailand | 59 | 0.2% |
| Trinidad and Tobago | 152 | 0.5% |
| Ukraine | 16 | 0.1% |
| Venezuela | 89 | 0.3% |
| Vietnam | 512 | 1.8% |
| Western Africa | 352 | 1.2% |
| Western Asia | 173 | 0.6% |
| Western Europe | 55 | 0.2% |
| Zaire | 69 | 0.2% | View All 72 Rows |
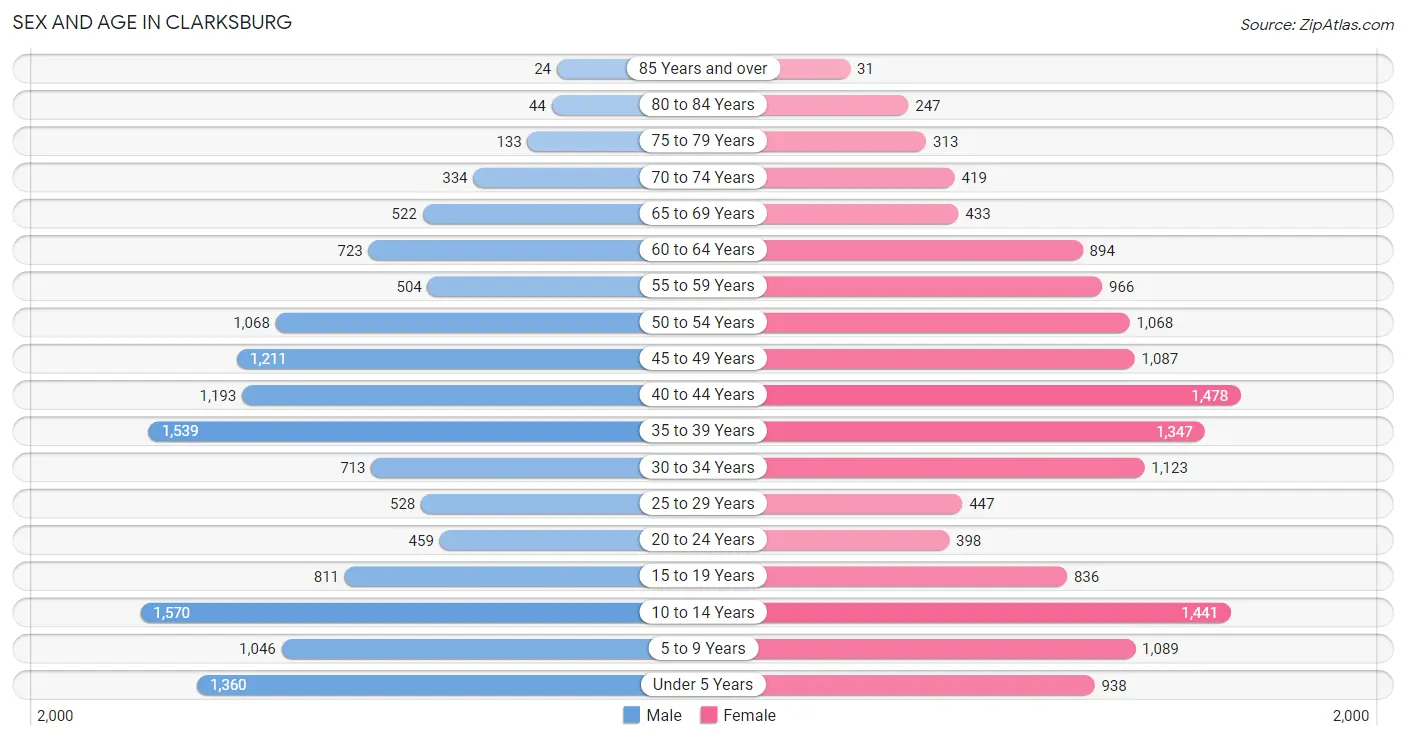
Sex and Age in Clarksburg
Sex and Age in Clarksburg
The most populous age groups in Clarksburg are 10 to 14 Years (1,570 | 11.4%) for men and 40 to 44 Years (1,478 | 10.2%) for women.
| Age Bracket | Male | Female |
| Under 5 Years | 1,360 (9.9%) | 938 (6.4%) |
| 5 to 9 Years | 1,046 (7.6%) | 1,089 (7.5%) |
| 10 to 14 Years | 1,570 (11.4%) | 1,441 (9.9%) |
| 15 to 19 Years | 811 (5.9%) | 836 (5.7%) |
| 20 to 24 Years | 459 (3.3%) | 398 (2.7%) |
| 25 to 29 Years | 528 (3.8%) | 447 (3.1%) |
| 30 to 34 Years | 713 (5.2%) | 1,123 (7.7%) |
| 35 to 39 Years | 1,539 (11.2%) | 1,347 (9.2%) |
| 40 to 44 Years | 1,193 (8.7%) | 1,478 (10.2%) |
| 45 to 49 Years | 1,211 (8.8%) | 1,087 (7.5%) |
| 50 to 54 Years | 1,068 (7.7%) | 1,068 (7.3%) |
| 55 to 59 Years | 504 (3.7%) | 966 (6.6%) |
| 60 to 64 Years | 723 (5.2%) | 894 (6.1%) |
| 65 to 69 Years | 522 (3.8%) | 433 (3.0%) |
| 70 to 74 Years | 334 (2.4%) | 419 (2.9%) |
| 75 to 79 Years | 133 (1.0%) | 313 (2.1%) |
| 80 to 84 Years | 44 (0.3%) | 247 (1.7%) |
| 85 Years and over | 24 (0.2%) | 31 (0.2%) |
| Total | 13,782 (100.0%) | 14,555 (100.0%) |
Families and Households in Clarksburg
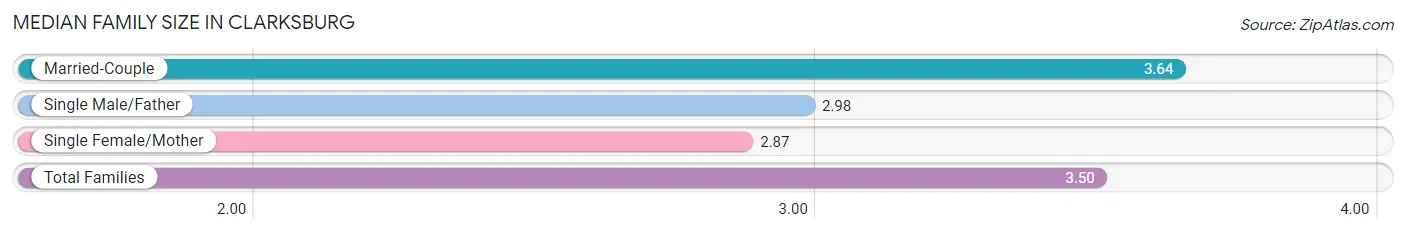
Median Family Size in Clarksburg
The median family size in Clarksburg is 3.50 persons per family, with married-couple families (6,074 | 81.3%) accounting for the largest median family size of 3.64 persons per family. On the other hand, single female/mother families (1,202 | 16.1%) represent the smallest median family size with 2.87 persons per family.
| Family Type | # Families | Family Size |
| Married-Couple | 6,074 (81.3%) | 3.64 |
| Single Male/Father | 191 (2.6%) | 2.98 |
| Single Female/Mother | 1,202 (16.1%) | 2.87 |
| Total Families | 7,467 (100.0%) | 3.50 |
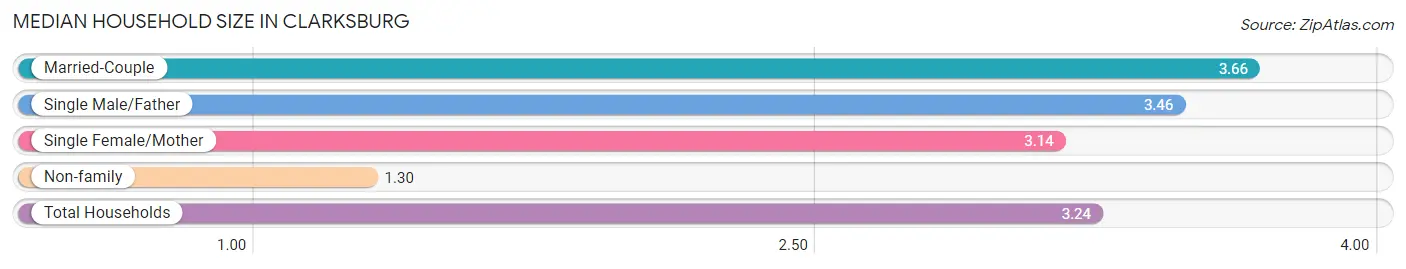
Median Household Size in Clarksburg
The median household size in Clarksburg is 3.24 persons per household, with married-couple households (6,074 | 69.5%) accounting for the largest median household size of 3.66 persons per household. non-family households (1,279 | 14.6%) represent the smallest median household size with 1.30 persons per household.
| Household Type | # Households | Household Size |
| Married-Couple | 6,074 (69.5%) | 3.66 |
| Single Male/Father | 191 (2.2%) | 3.46 |
| Single Female/Mother | 1,202 (13.7%) | 3.14 |
| Non-family | 1,279 (14.6%) | 1.30 |
| Total Households | 8,746 (100.0%) | 3.24 |
Household Size by Marriage Status in Clarksburg
Out of a total of 8,746 households in Clarksburg, 7,467 (85.4%) are family households, while 1,279 (14.6%) are nonfamily households. The most numerous type of family households are 4-person households, comprising 2,354, and the most common type of nonfamily households are 1-person households, comprising 1,013.
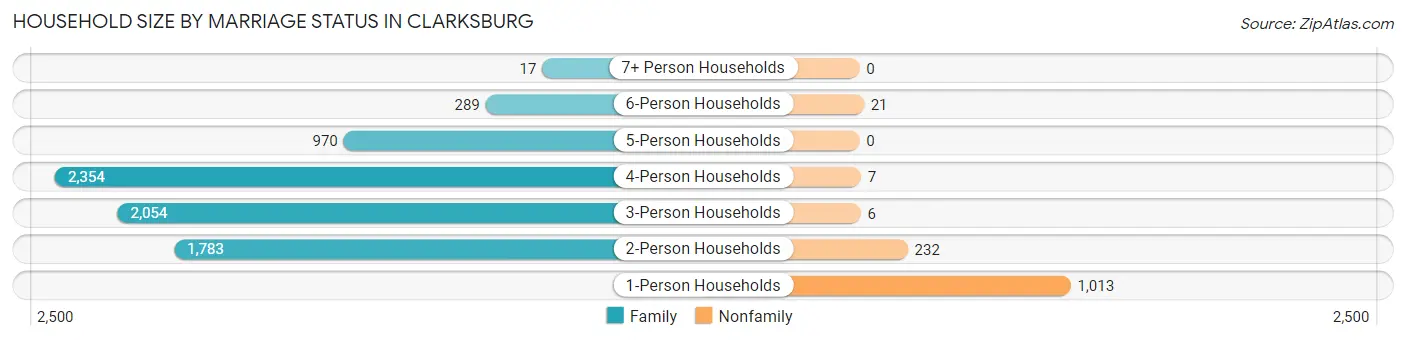
| Household Size | Family Households | Nonfamily Households |
| 1-Person Households | - | 1,013 (11.6%) |
| 2-Person Households | 1,783 (20.4%) | 232 (2.6%) |
| 3-Person Households | 2,054 (23.5%) | 6 (0.1%) |
| 4-Person Households | 2,354 (26.9%) | 7 (0.1%) |
| 5-Person Households | 970 (11.1%) | 0 (0.0%) |
| 6-Person Households | 289 (3.3%) | 21 (0.2%) |
| 7+ Person Households | 17 (0.2%) | 0 (0.0%) |
| Total | 7,467 (85.4%) | 1,279 (14.6%) |
Female Fertility in Clarksburg
Fertility by Age in Clarksburg
Average fertility rate in Clarksburg is 73.0 births per 1,000 women. Women in the age bracket of 20 to 34 years have the highest fertility rate with 153.0 births per 1,000 women. Women in the age bracket of 20 to 34 years acount for 60.4% of all women with births.
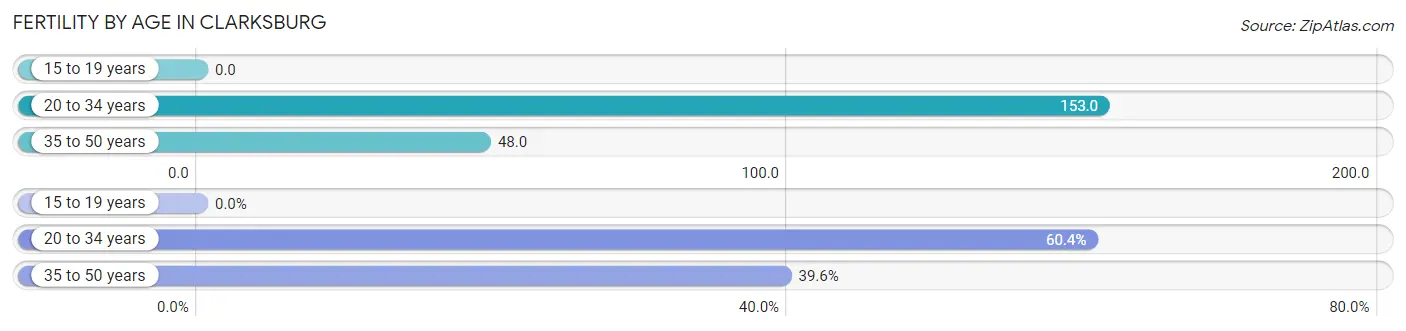
| Age Bracket | Women with Births | Births / 1,000 Women |
| 15 to 19 years | 0 (0.0%) | 0.0 |
| 20 to 34 years | 302 (60.4%) | 153.0 |
| 35 to 50 years | 198 (39.6%) | 48.0 |
| Total | 500 (100.0%) | 73.0 |
Fertility by Age by Marriage Status in Clarksburg
84.2% of women with births (500) in Clarksburg are married. The highest percentage of unmarried women with births falls into 35 to 50 years age bracket with 28.3% of them unmarried at the time of birth, while the lowest percentage of unmarried women with births belong to 20 to 34 years age bracket with 7.6% of them unmarried.
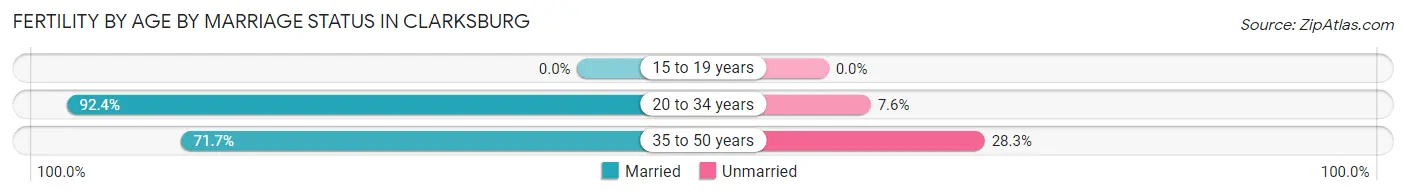
| Age Bracket | Married | Unmarried |
| 15 to 19 years | 0 (0.0%) | 0 (0.0%) |
| 20 to 34 years | 279 (92.4%) | 23 (7.6%) |
| 35 to 50 years | 142 (71.7%) | 56 (28.3%) |
| Total | 421 (84.2%) | 79 (15.8%) |
Fertility by Education in Clarksburg
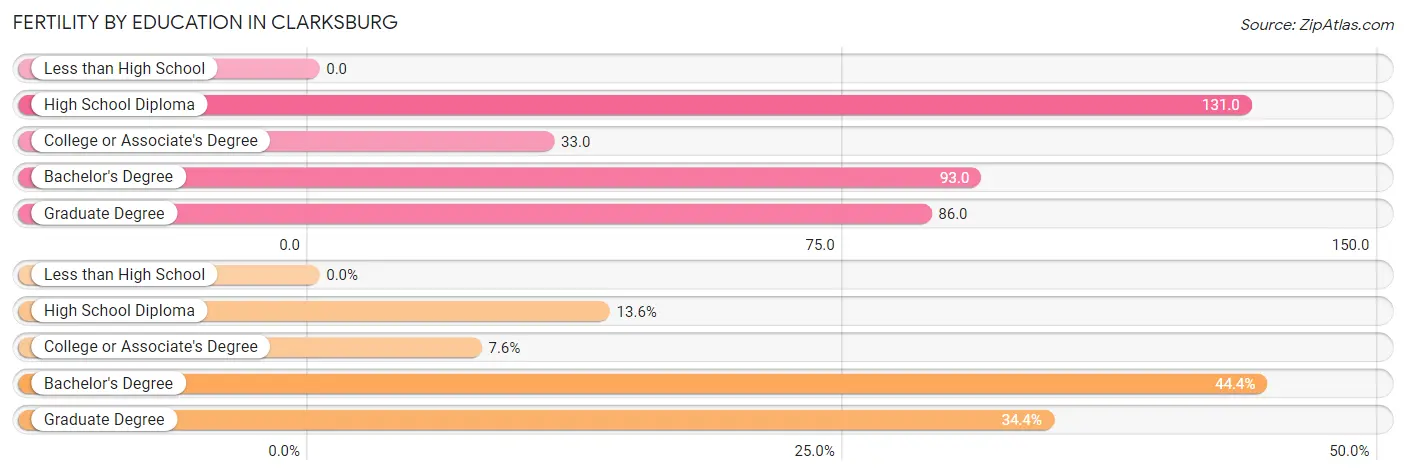
| Educational Attainment | Women with Births | Births / 1,000 Women |
| Less than High School | 0 (0.0%) | 0.0 |
| High School Diploma | 68 (13.6%) | 131.0 |
| College or Associate's Degree | 38 (7.6%) | 33.0 |
| Bachelor's Degree | 222 (44.4%) | 93.0 |
| Graduate Degree | 172 (34.4%) | 86.0 |
| Total | 500 (100.0%) | 73.0 |
Fertility by Education by Marriage Status in Clarksburg
15.8% of women with births in Clarksburg are unmarried. Women with the educational attainment of college or associate's degree are most likely to be married with 100.0% of them married at childbirth, while women with the educational attainment of high school diploma are least likely to be married with 33.8% of them unmarried at childbirth.
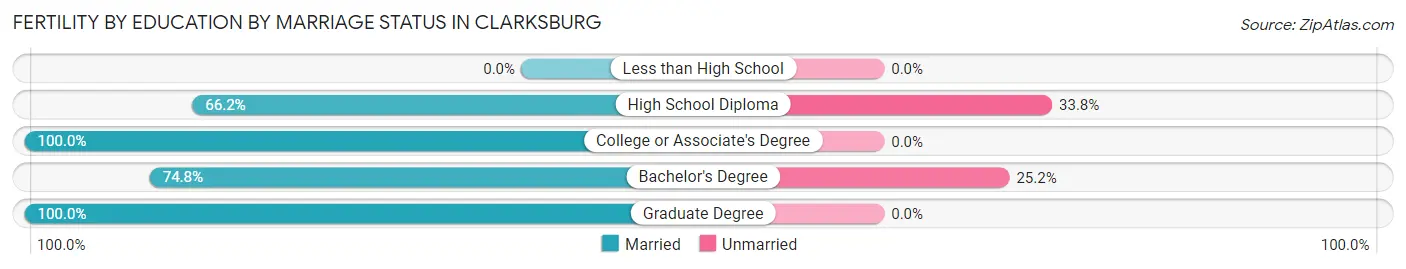
| Educational Attainment | Married | Unmarried |
| Less than High School | 0 (0.0%) | 0 (0.0%) |
| High School Diploma | 45 (66.2%) | 23 (33.8%) |
| College or Associate's Degree | 38 (100.0%) | 0 (0.0%) |
| Bachelor's Degree | 166 (74.8%) | 56 (25.2%) |
| Graduate Degree | 172 (100.0%) | 0 (0.0%) |
| Total | 421 (84.2%) | 79 (15.8%) |
Employment Characteristics in Clarksburg
Employment by Class of Employer in Clarksburg
Among the 14,255 employed individuals in Clarksburg, private company employees (8,488 | 59.5%), federal government employees (1,770 | 12.4%), and not-for-profit organizations (1,199 | 8.4%) make up the most common classes of employment.
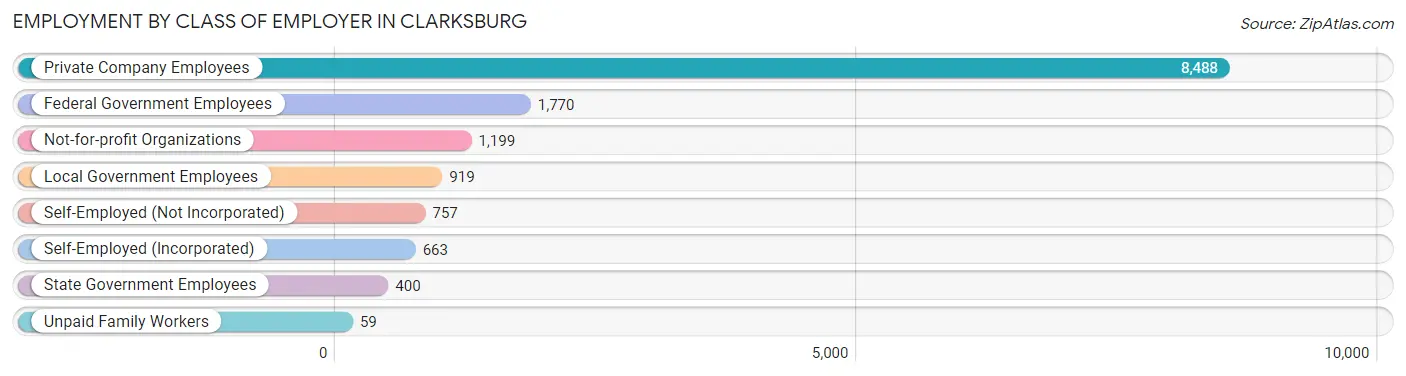
| Employer Class | # Employees | % Employees |
| Private Company Employees | 8,488 | 59.5% |
| Self-Employed (Incorporated) | 663 | 4.6% |
| Self-Employed (Not Incorporated) | 757 | 5.3% |
| Not-for-profit Organizations | 1,199 | 8.4% |
| Local Government Employees | 919 | 6.5% |
| State Government Employees | 400 | 2.8% |
| Federal Government Employees | 1,770 | 12.4% |
| Unpaid Family Workers | 59 | 0.4% |
| Total | 14,255 | 100.0% |
Employment Status by Age in Clarksburg
According to the labor force statistics for Clarksburg, out of the total population over 16 years of age (20,507), 73.9% or 15,155 individuals are in the labor force, with 4.7% or 712 of them unemployed. The age group with the highest labor force participation rate is 35 to 44 years, with 90.7% or 5,040 individuals in the labor force. Within the labor force, the 16 to 19 years age range has the highest percentage of unemployed individuals, with 10.2% or 29 of them being unemployed.
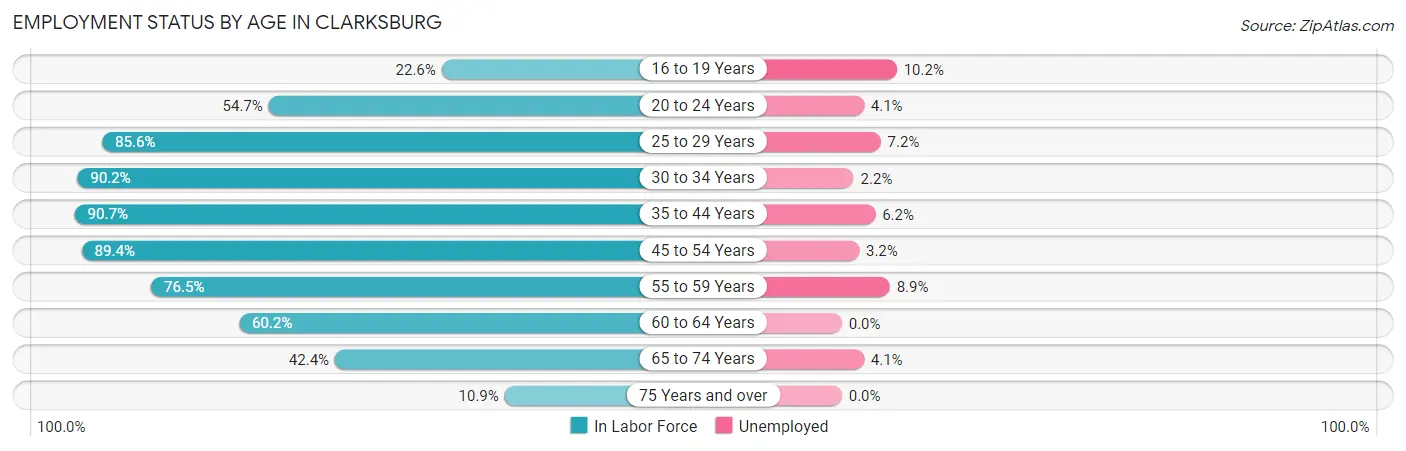
| Age Bracket | In Labor Force | Unemployed |
| 16 to 19 Years | 285 (22.6%) | 29 (10.2%) |
| 20 to 24 Years | 469 (54.7%) | 19 (4.1%) |
| 25 to 29 Years | 835 (85.6%) | 60 (7.2%) |
| 30 to 34 Years | 1,656 (90.2%) | 36 (2.2%) |
| 35 to 44 Years | 5,040 (90.7%) | 312 (6.2%) |
| 45 to 54 Years | 3,964 (89.4%) | 127 (3.2%) |
| 55 to 59 Years | 1,125 (76.5%) | 100 (8.9%) |
| 60 to 64 Years | 973 (60.2%) | 0 (0.0%) |
| 65 to 74 Years | 724 (42.4%) | 30 (4.1%) |
| 75 Years and over | 86 (10.9%) | 0 (0.0%) |
| Total | 15,155 (73.9%) | 712 (4.7%) |
Employment Status by Educational Attainment in Clarksburg
According to labor force statistics for Clarksburg, 85.5% of individuals (13,585) out of the total population between 25 and 64 years of age (15,889) are in the labor force, with 4.7% or 638 of them being unemployed. The group with the highest labor force participation rate are those with the educational attainment of college / associate degree, with 87.9% or 2,325 individuals in the labor force. Within the labor force, individuals with college / associate degree education have the highest percentage of unemployment, with 12.6% or 293 of them being unemployed.
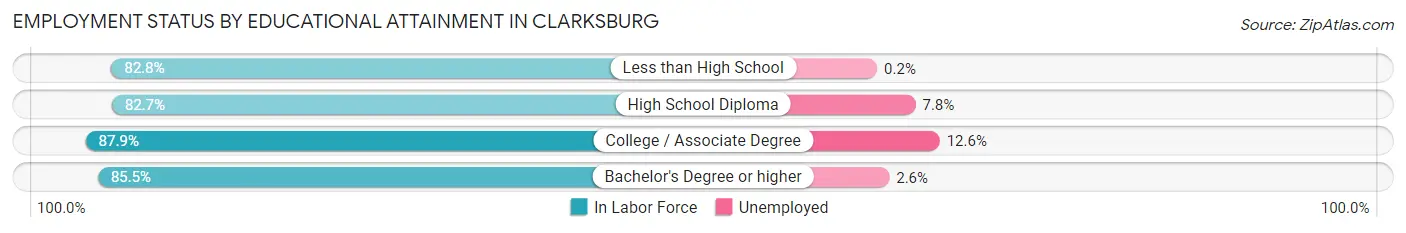
| Educational Attainment | In Labor Force | Unemployed |
| Less than High School | 449 (82.8%) | 1 (0.2%) |
| High School Diploma | 1,219 (82.7%) | 115 (7.8%) |
| College / Associate Degree | 2,325 (87.9%) | 333 (12.6%) |
| Bachelor's Degree or higher | 9,600 (85.5%) | 292 (2.6%) |
| Total | 13,585 (85.5%) | 747 (4.7%) |
Employment Occupations by Sex in Clarksburg
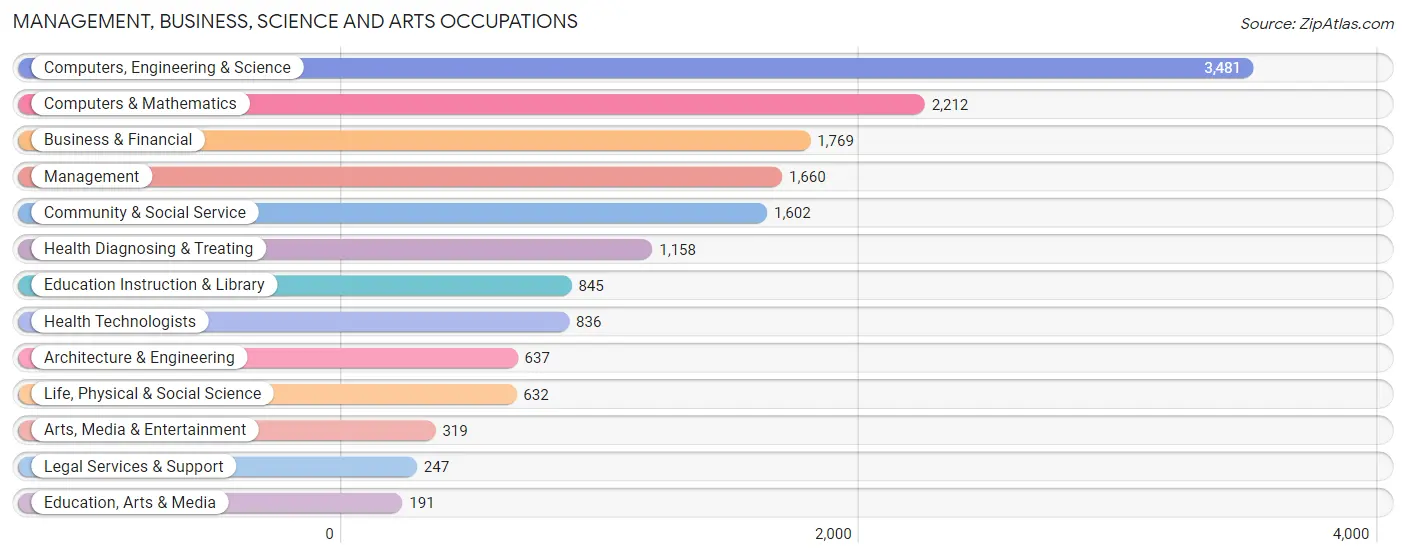
Management, Business, Science and Arts Occupations
The most common Management, Business, Science and Arts occupations in Clarksburg are Computers, Engineering & Science (3,481 | 24.1%), Computers & Mathematics (2,212 | 15.3%), Business & Financial (1,769 | 12.3%), Management (1,660 | 11.5%), and Community & Social Service (1,602 | 11.1%).
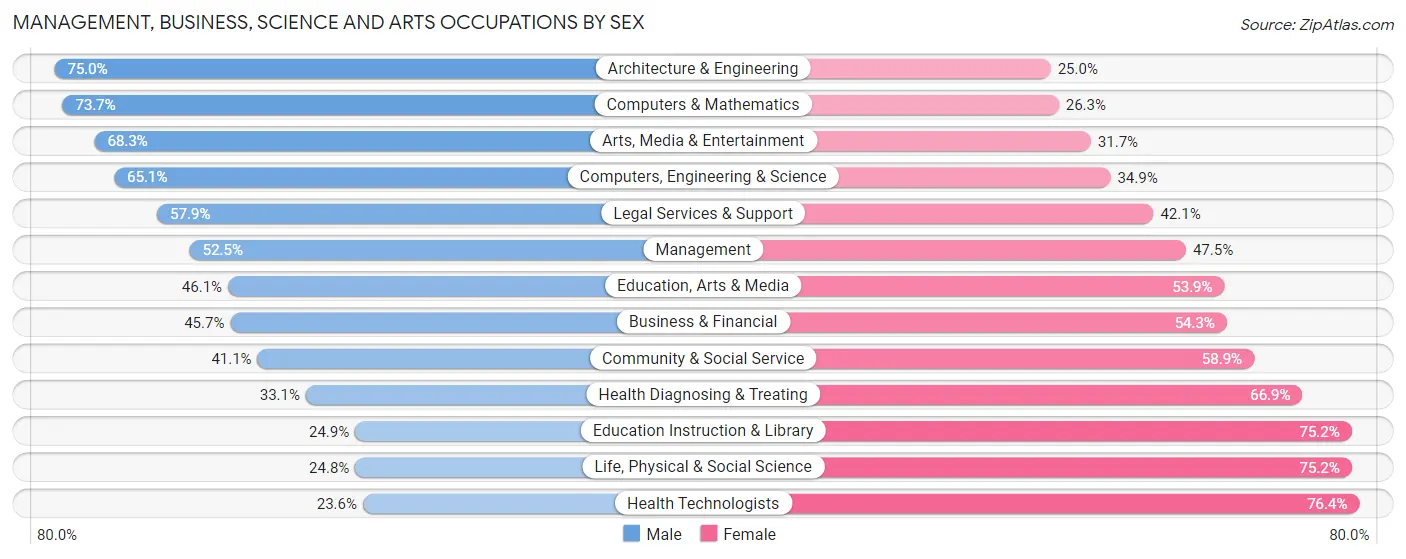
Management, Business, Science and Arts Occupations by Sex
Within the Management, Business, Science and Arts occupations in Clarksburg, the most male-oriented occupations are Architecture & Engineering (75.0%), Computers & Mathematics (73.7%), and Arts, Media & Entertainment (68.3%), while the most female-oriented occupations are Health Technologists (76.4%), Life, Physical & Social Science (75.2%), and Education Instruction & Library (75.1%).
| Occupation | Male | Female |
| Management | 871 (52.5%) | 789 (47.5%) |
| Business & Financial | 808 (45.7%) | 961 (54.3%) |
| Computers, Engineering & Science | 2,265 (65.1%) | 1,216 (34.9%) |
| Computers & Mathematics | 1,630 (73.7%) | 582 (26.3%) |
| Architecture & Engineering | 478 (75.0%) | 159 (25.0%) |
| Life, Physical & Social Science | 157 (24.8%) | 475 (75.2%) |
| Community & Social Service | 659 (41.1%) | 943 (58.9%) |
| Education, Arts & Media | 88 (46.1%) | 103 (53.9%) |
| Legal Services & Support | 143 (57.9%) | 104 (42.1%) |
| Education Instruction & Library | 210 (24.8%) | 635 (75.1%) |
| Arts, Media & Entertainment | 218 (68.3%) | 101 (31.7%) |
| Health Diagnosing & Treating | 383 (33.1%) | 775 (66.9%) |
| Health Technologists | 197 (23.6%) | 639 (76.4%) |
| Total (Category) | 4,986 (51.6%) | 4,684 (48.4%) |
| Total (Overall) | 7,402 (51.3%) | 7,013 (48.6%) |
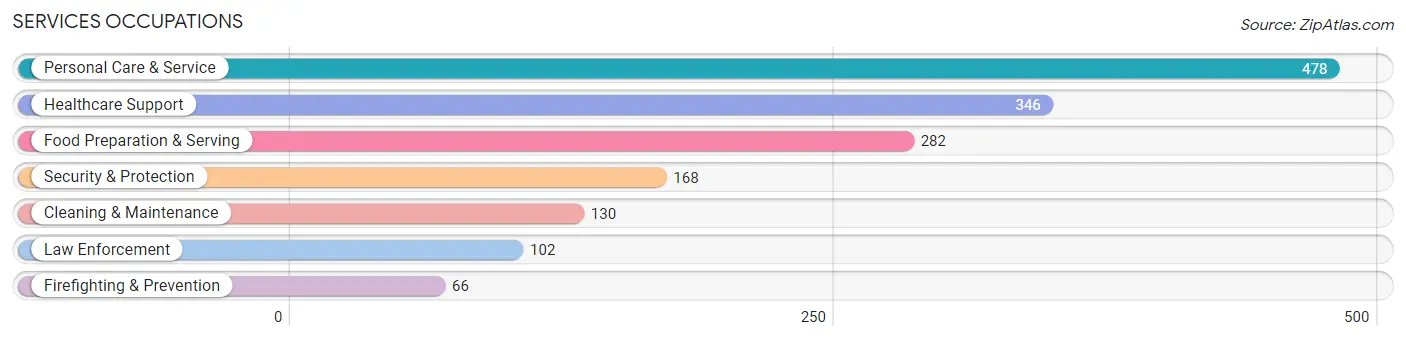
Services Occupations
The most common Services occupations in Clarksburg are Personal Care & Service (478 | 3.3%), Healthcare Support (346 | 2.4%), Food Preparation & Serving (282 | 2.0%), Security & Protection (168 | 1.2%), and Cleaning & Maintenance (130 | 0.9%).
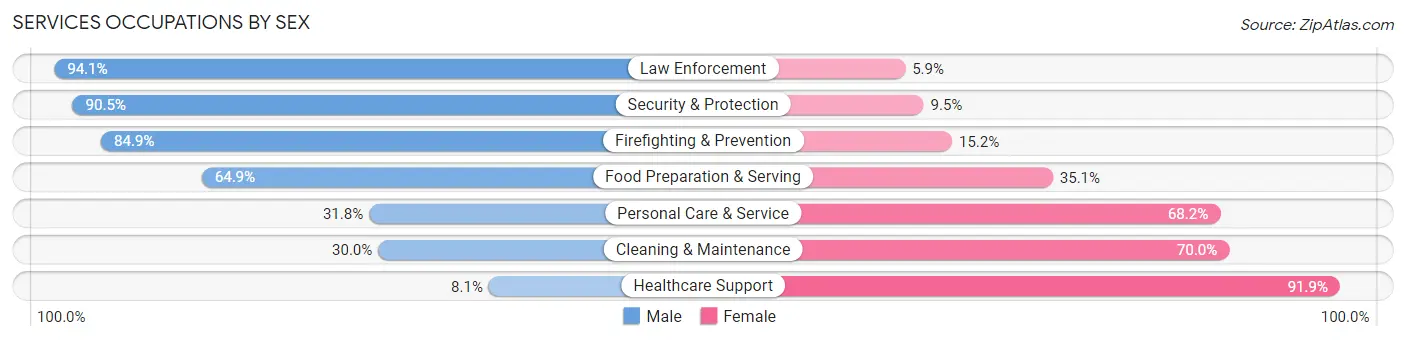
Services Occupations by Sex
Within the Services occupations in Clarksburg, the most male-oriented occupations are Law Enforcement (94.1%), Security & Protection (90.5%), and Firefighting & Prevention (84.9%), while the most female-oriented occupations are Healthcare Support (91.9%), Cleaning & Maintenance (70.0%), and Personal Care & Service (68.2%).
| Occupation | Male | Female |
| Healthcare Support | 28 (8.1%) | 318 (91.9%) |
| Security & Protection | 152 (90.5%) | 16 (9.5%) |
| Firefighting & Prevention | 56 (84.9%) | 10 (15.1%) |
| Law Enforcement | 96 (94.1%) | 6 (5.9%) |
| Food Preparation & Serving | 183 (64.9%) | 99 (35.1%) |
| Cleaning & Maintenance | 39 (30.0%) | 91 (70.0%) |
| Personal Care & Service | 152 (31.8%) | 326 (68.2%) |
| Total (Category) | 554 (39.5%) | 850 (60.5%) |
| Total (Overall) | 7,402 (51.3%) | 7,013 (48.6%) |
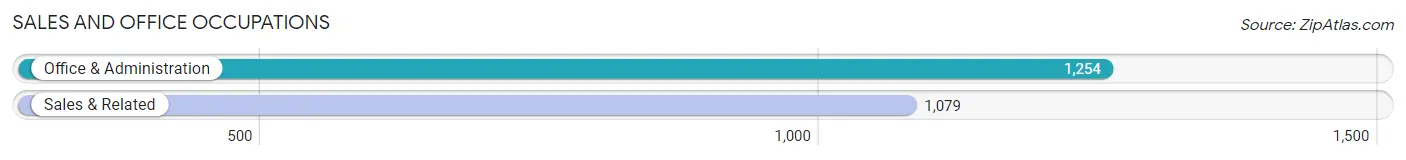
Sales and Office Occupations
The most common Sales and Office occupations in Clarksburg are Office & Administration (1,254 | 8.7%), and Sales & Related (1,079 | 7.5%).
Sales and Office Occupations by Sex
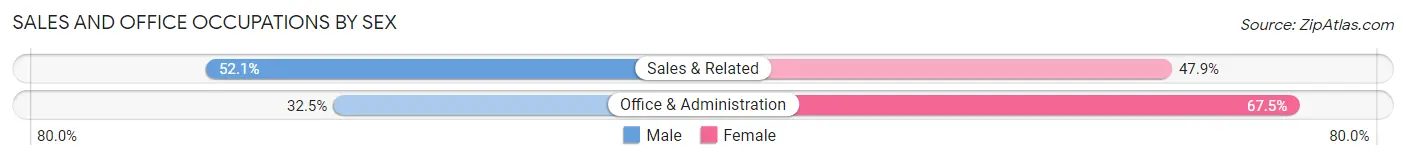
| Occupation | Male | Female |
| Sales & Related | 562 (52.1%) | 517 (47.9%) |
| Office & Administration | 408 (32.5%) | 846 (67.5%) |
| Total (Category) | 970 (41.6%) | 1,363 (58.4%) |
| Total (Overall) | 7,402 (51.3%) | 7,013 (48.6%) |
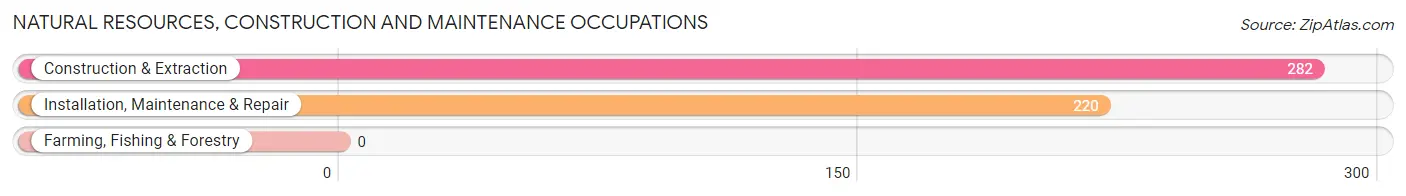
Natural Resources, Construction and Maintenance Occupations
The most common Natural Resources, Construction and Maintenance occupations in Clarksburg are Construction & Extraction (282 | 2.0%), and Installation, Maintenance & Repair (220 | 1.5%).
Natural Resources, Construction and Maintenance Occupations by Sex
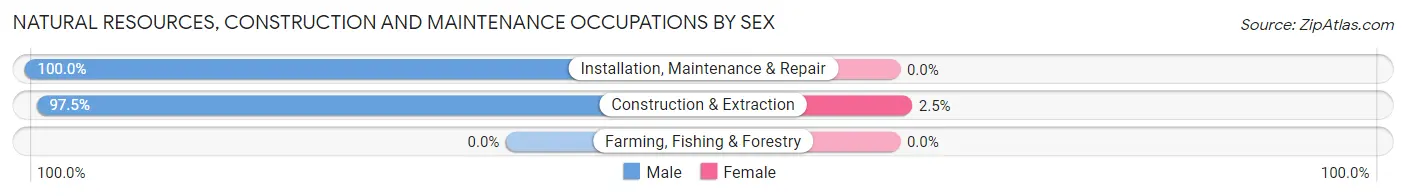
| Occupation | Male | Female |
| Farming, Fishing & Forestry | 0 (0.0%) | 0 (0.0%) |
| Construction & Extraction | 275 (97.5%) | 7 (2.5%) |
| Installation, Maintenance & Repair | 220 (100.0%) | 0 (0.0%) |
| Total (Category) | 495 (98.6%) | 7 (1.4%) |
| Total (Overall) | 7,402 (51.3%) | 7,013 (48.6%) |
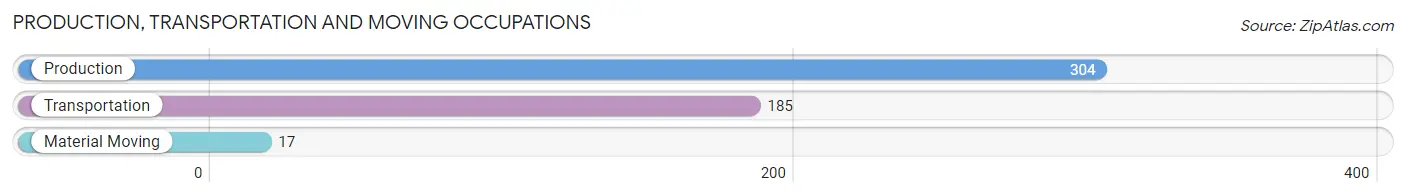
Production, Transportation and Moving Occupations
The most common Production, Transportation and Moving occupations in Clarksburg are Production (304 | 2.1%), Transportation (185 | 1.3%), and Material Moving (17 | 0.1%).
Production, Transportation and Moving Occupations by Sex
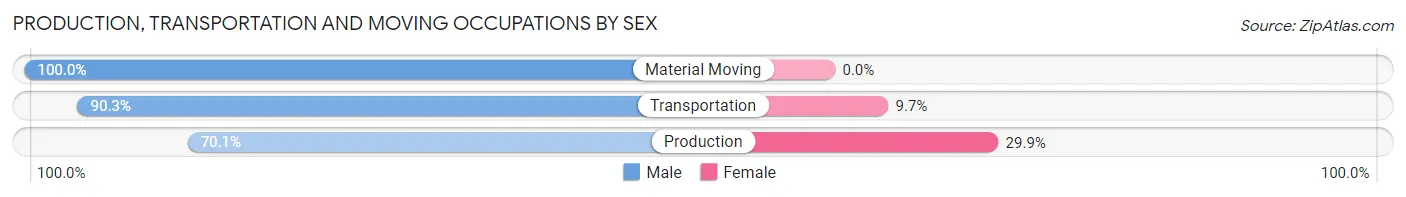
| Occupation | Male | Female |
| Production | 213 (70.1%) | 91 (29.9%) |
| Transportation | 167 (90.3%) | 18 (9.7%) |
| Material Moving | 17 (100.0%) | 0 (0.0%) |
| Total (Category) | 397 (78.5%) | 109 (21.5%) |
| Total (Overall) | 7,402 (51.3%) | 7,013 (48.6%) |
Employment Industries by Sex in Clarksburg
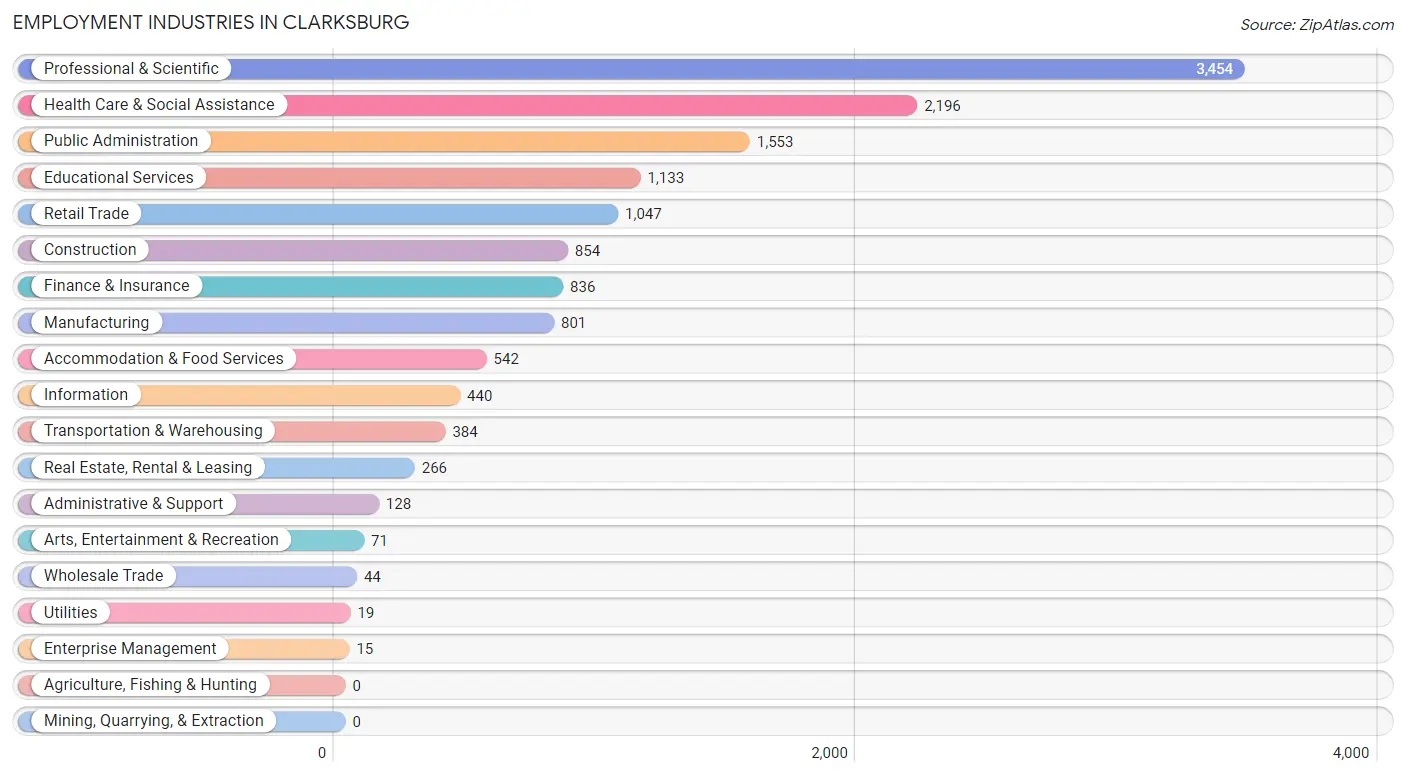
Employment Industries in Clarksburg
The major employment industries in Clarksburg include Professional & Scientific (3,454 | 24.0%), Health Care & Social Assistance (2,196 | 15.2%), Public Administration (1,553 | 10.8%), Educational Services (1,133 | 7.9%), and Retail Trade (1,047 | 7.3%).
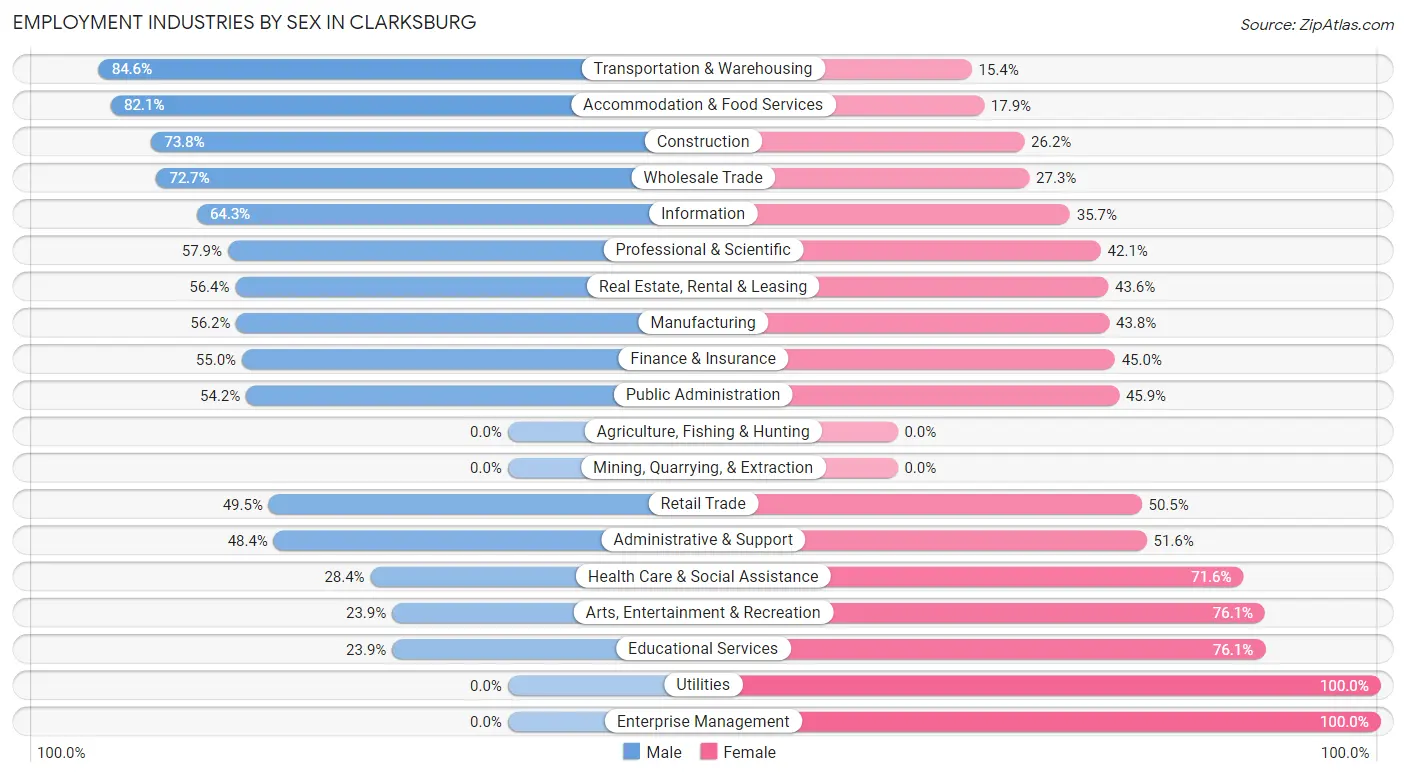
Employment Industries by Sex in Clarksburg
The Clarksburg industries that see more men than women are Transportation & Warehousing (84.6%), Accommodation & Food Services (82.1%), and Construction (73.8%), whereas the industries that tend to have a higher number of women are Utilities (100.0%), Enterprise Management (100.0%), and Educational Services (76.1%).
| Industry | Male | Female |
| Agriculture, Fishing & Hunting | 0 (0.0%) | 0 (0.0%) |
| Mining, Quarrying, & Extraction | 0 (0.0%) | 0 (0.0%) |
| Construction | 630 (73.8%) | 224 (26.2%) |
| Manufacturing | 450 (56.2%) | 351 (43.8%) |
| Wholesale Trade | 32 (72.7%) | 12 (27.3%) |
| Retail Trade | 518 (49.5%) | 529 (50.5%) |
| Transportation & Warehousing | 325 (84.6%) | 59 (15.4%) |
| Utilities | 0 (0.0%) | 19 (100.0%) |
| Information | 283 (64.3%) | 157 (35.7%) |
| Finance & Insurance | 460 (55.0%) | 376 (45.0%) |
| Real Estate, Rental & Leasing | 150 (56.4%) | 116 (43.6%) |
| Professional & Scientific | 2,001 (57.9%) | 1,453 (42.1%) |
| Enterprise Management | 0 (0.0%) | 15 (100.0%) |
| Administrative & Support | 62 (48.4%) | 66 (51.6%) |
| Educational Services | 271 (23.9%) | 862 (76.1%) |
| Health Care & Social Assistance | 624 (28.4%) | 1,572 (71.6%) |
| Arts, Entertainment & Recreation | 17 (23.9%) | 54 (76.1%) |
| Accommodation & Food Services | 445 (82.1%) | 97 (17.9%) |
| Public Administration | 841 (54.1%) | 712 (45.9%) |
| Total | 7,402 (51.3%) | 7,013 (48.6%) |
Education in Clarksburg
School Enrollment in Clarksburg
The most common levels of schooling among the 8,243 students in Clarksburg are middle school (2,554 | 31.0%), elementary school (1,793 | 21.7%), and high school (1,490 | 18.1%).
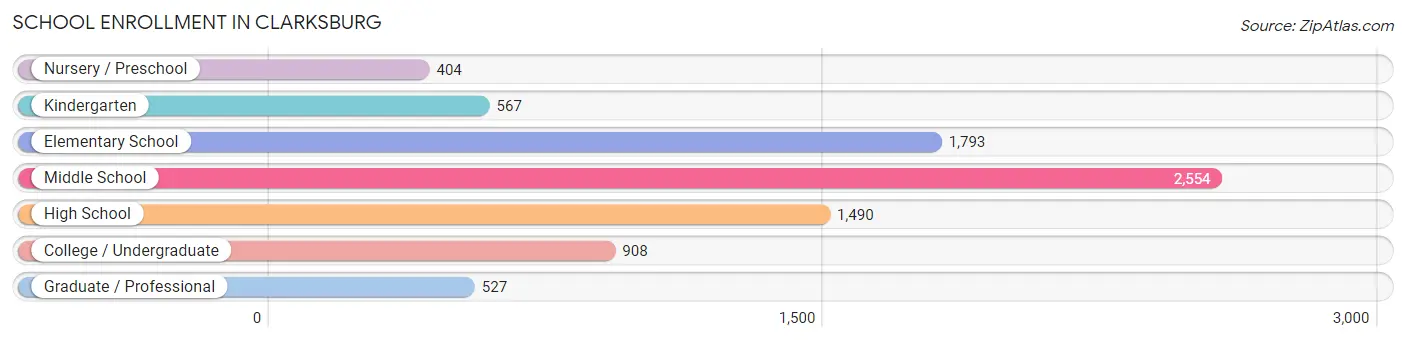
| School Level | # Students | % Students |
| Nursery / Preschool | 404 | 4.9% |
| Kindergarten | 567 | 6.9% |
| Elementary School | 1,793 | 21.7% |
| Middle School | 2,554 | 31.0% |
| High School | 1,490 | 18.1% |
| College / Undergraduate | 908 | 11.0% |
| Graduate / Professional | 527 | 6.4% |
| Total | 8,243 | 100.0% |
School Enrollment by Age by Funding Source in Clarksburg
Out of a total of 8,243 students who are enrolled in schools in Clarksburg, 1,665 (20.2%) attend a private institution, while the remaining 6,578 (79.8%) are enrolled in public schools. The age group of 3 to 4 year olds has the highest likelihood of being enrolled in private schools, with 217 (67.0% in the age bracket) enrolled. Conversely, the age group of 15 to 17 year olds has the lowest likelihood of being enrolled in a private school, with 1,148 (94.6% in the age bracket) attending a public institution.
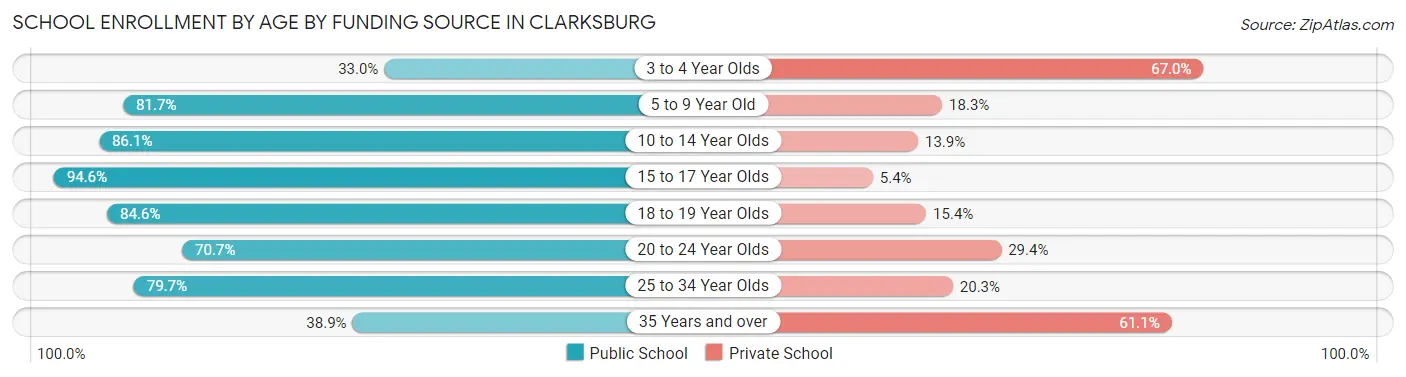
| Age Bracket | Public School | Private School |
| 3 to 4 Year Olds | 107 (33.0%) | 217 (67.0%) |
| 5 to 9 Year Old | 1,688 (81.7%) | 379 (18.3%) |
| 10 to 14 Year Olds | 2,573 (86.1%) | 414 (13.9%) |
| 15 to 17 Year Olds | 1,148 (94.6%) | 66 (5.4%) |
| 18 to 19 Year Olds | 314 (84.6%) | 57 (15.4%) |
| 20 to 24 Year Olds | 284 (70.7%) | 118 (29.3%) |
| 25 to 34 Year Olds | 235 (79.7%) | 60 (20.3%) |
| 35 Years and over | 227 (38.9%) | 356 (61.1%) |
| Total | 6,578 (79.8%) | 1,665 (20.2%) |
Educational Attainment by Field of Study in Clarksburg
Business (1,980 | 14.9%), engineering (1,777 | 13.4%), computers & mathematics (1,647 | 12.4%), bio, nature & agricultural (1,488 | 11.2%), and science & technology (1,314 | 9.9%) are the most common fields of study among 13,290 individuals in Clarksburg who have obtained a bachelor's degree or higher.
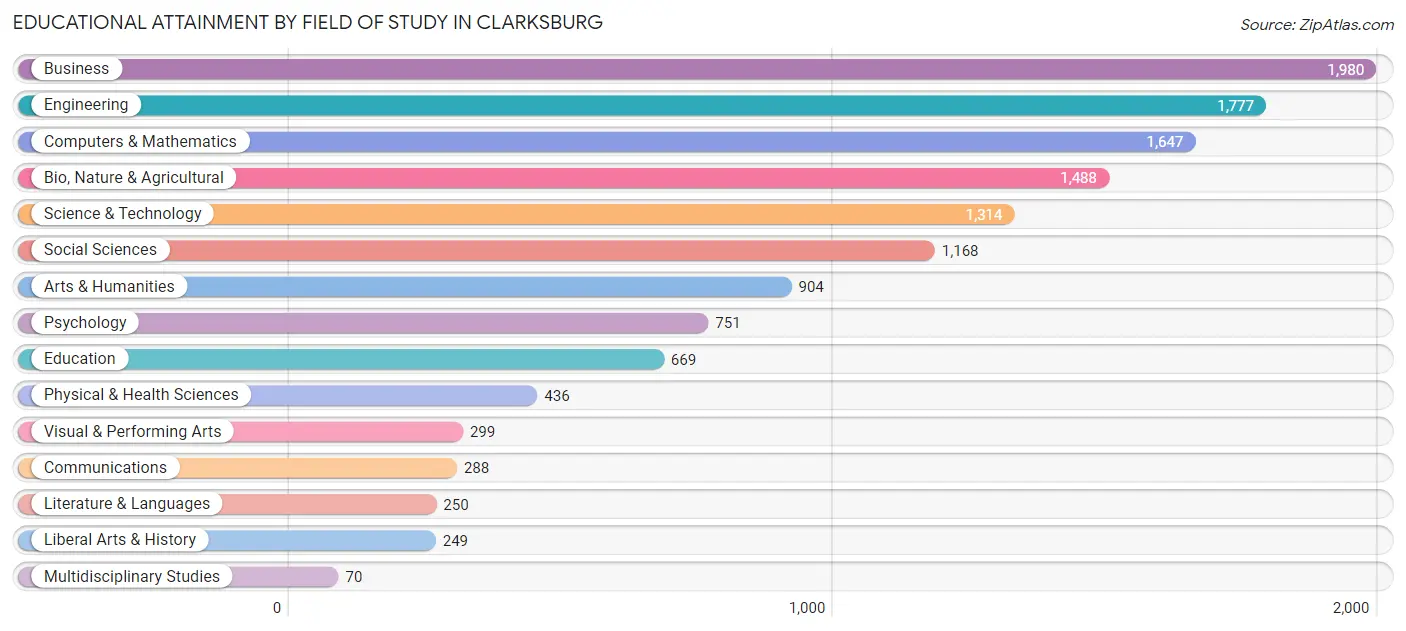
| Field of Study | # Graduates | % Graduates |
| Computers & Mathematics | 1,647 | 12.4% |
| Bio, Nature & Agricultural | 1,488 | 11.2% |
| Physical & Health Sciences | 436 | 3.3% |
| Psychology | 751 | 5.7% |
| Social Sciences | 1,168 | 8.8% |
| Engineering | 1,777 | 13.4% |
| Multidisciplinary Studies | 70 | 0.5% |
| Science & Technology | 1,314 | 9.9% |
| Business | 1,980 | 14.9% |
| Education | 669 | 5.0% |
| Literature & Languages | 250 | 1.9% |
| Liberal Arts & History | 249 | 1.9% |
| Visual & Performing Arts | 299 | 2.2% |
| Communications | 288 | 2.2% |
| Arts & Humanities | 904 | 6.8% |
| Total | 13,290 | 100.0% |
Transportation & Commute in Clarksburg
Vehicle Availability by Sex in Clarksburg
The most prevalent vehicle ownership categories in Clarksburg are males with 2 vehicles (3,906, accounting for 53.0%) and females with 2 vehicles (3,341, making up 56.8%).
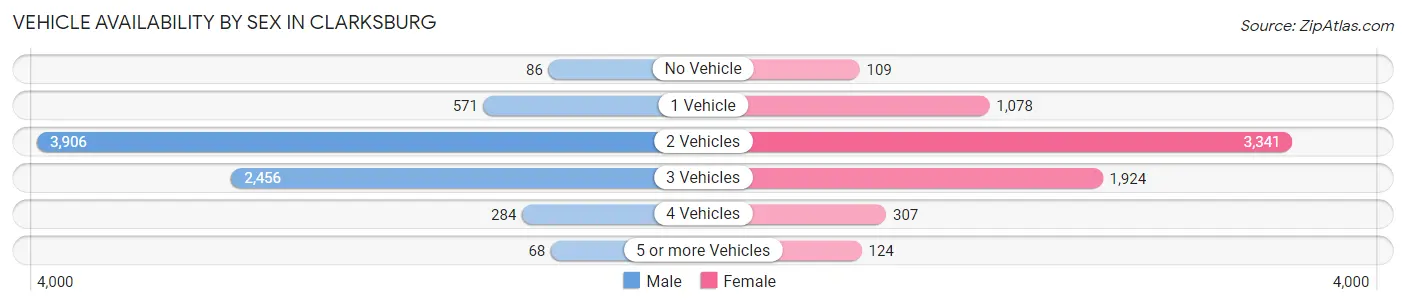
| Vehicles Available | Male | Female |
| No Vehicle | 86 (1.2%) | 109 (1.6%) |
| 1 Vehicle | 571 (7.7%) | 1,078 (15.7%) |
| 2 Vehicles | 3,906 (53.0%) | 3,341 (48.5%) |
| 3 Vehicles | 2,456 (33.3%) | 1,924 (28.0%) |
| 4 Vehicles | 284 (3.8%) | 307 (4.5%) |
| 5 or more Vehicles | 68 (0.9%) | 124 (1.8%) |
| Total | 7,371 (100.0%) | 6,883 (100.0%) |
Commute Time in Clarksburg
The most frequently occuring commute durations in Clarksburg are 30 to 34 minutes (1,958 commuters, 17.9%), 20 to 24 minutes (1,444 commuters, 13.2%), and 60 to 89 minutes (1,150 commuters, 10.5%).
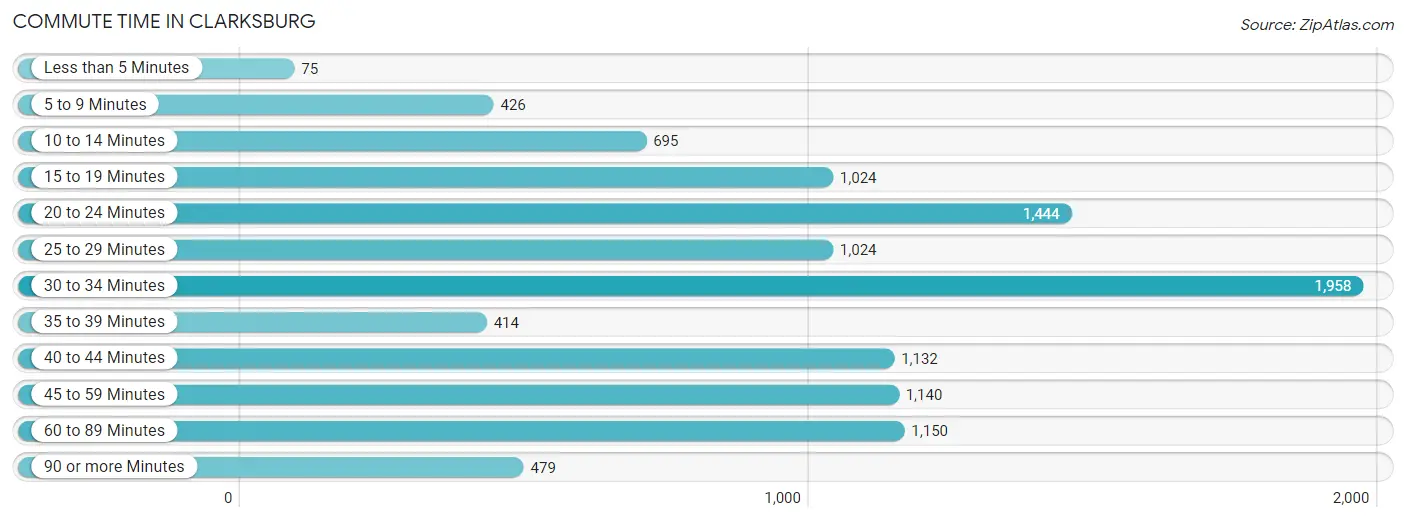
| Commute Time | # Commuters | % Commuters |
| Less than 5 Minutes | 75 | 0.7% |
| 5 to 9 Minutes | 426 | 3.9% |
| 10 to 14 Minutes | 695 | 6.3% |
| 15 to 19 Minutes | 1,024 | 9.3% |
| 20 to 24 Minutes | 1,444 | 13.2% |
| 25 to 29 Minutes | 1,024 | 9.3% |
| 30 to 34 Minutes | 1,958 | 17.9% |
| 35 to 39 Minutes | 414 | 3.8% |
| 40 to 44 Minutes | 1,132 | 10.3% |
| 45 to 59 Minutes | 1,140 | 10.4% |
| 60 to 89 Minutes | 1,150 | 10.5% |
| 90 or more Minutes | 479 | 4.4% |
Commute Time by Sex in Clarksburg
The most common commute times in Clarksburg are 30 to 34 minutes (1,244 commuters, 21.2%) for males and 30 to 34 minutes (714 commuters, 14.0%) for females.
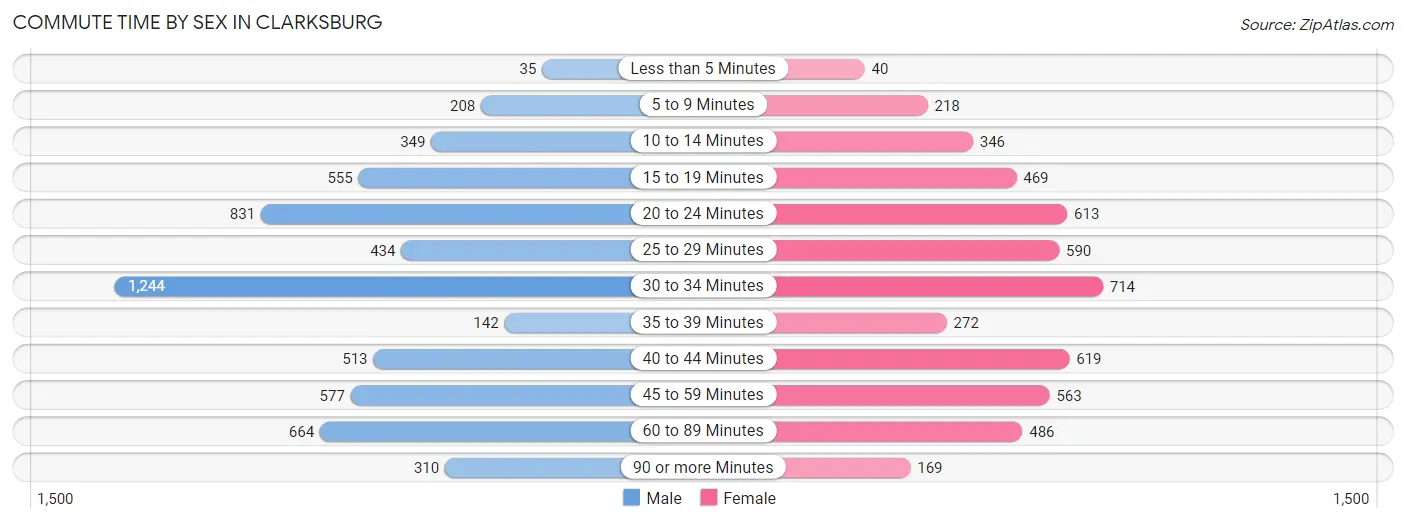
| Commute Time | Male | Female |
| Less than 5 Minutes | 35 (0.6%) | 40 (0.8%) |
| 5 to 9 Minutes | 208 (3.5%) | 218 (4.3%) |
| 10 to 14 Minutes | 349 (5.9%) | 346 (6.8%) |
| 15 to 19 Minutes | 555 (9.5%) | 469 (9.2%) |
| 20 to 24 Minutes | 831 (14.2%) | 613 (12.0%) |
| 25 to 29 Minutes | 434 (7.4%) | 590 (11.6%) |
| 30 to 34 Minutes | 1,244 (21.2%) | 714 (14.0%) |
| 35 to 39 Minutes | 142 (2.4%) | 272 (5.3%) |
| 40 to 44 Minutes | 513 (8.7%) | 619 (12.1%) |
| 45 to 59 Minutes | 577 (9.8%) | 563 (11.0%) |
| 60 to 89 Minutes | 664 (11.3%) | 486 (9.5%) |
| 90 or more Minutes | 310 (5.3%) | 169 (3.3%) |
Time of Departure to Work by Sex in Clarksburg
The most frequent times of departure to work in Clarksburg are 9:00 AM to 9:59 AM (1,026, 17.5%) for males and 7:30 AM to 7:59 AM (734, 14.4%) for females.
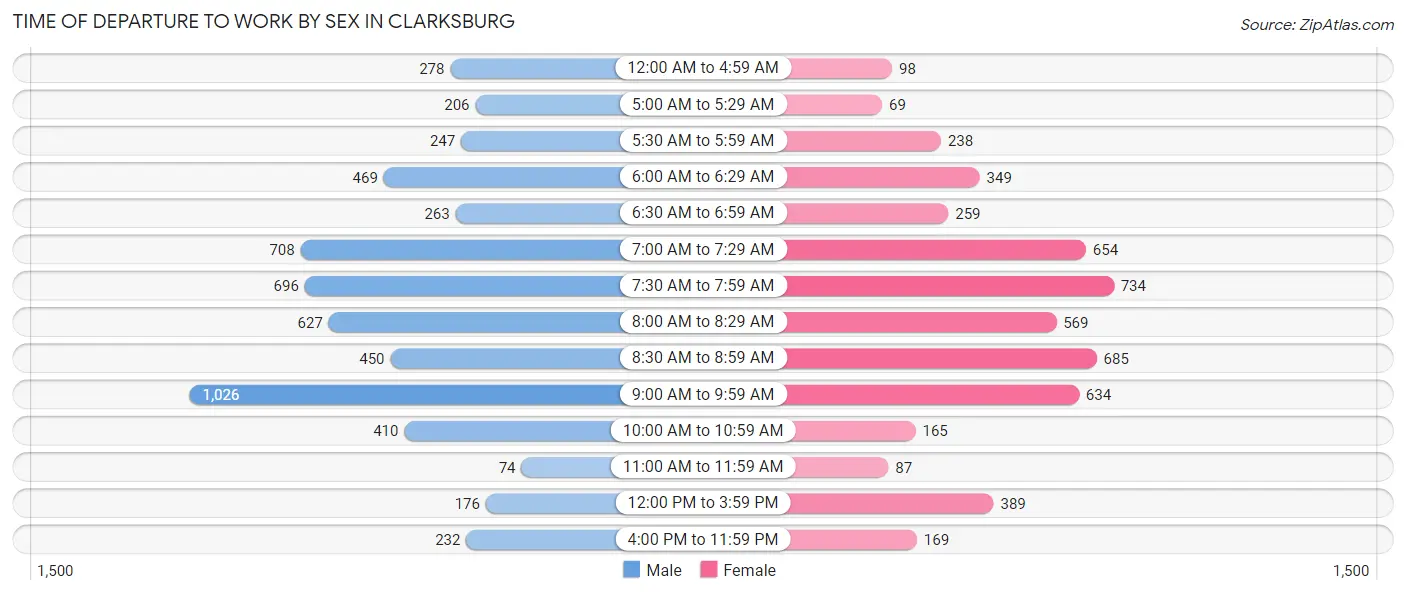
| Time of Departure | Male | Female |
| 12:00 AM to 4:59 AM | 278 (4.7%) | 98 (1.9%) |
| 5:00 AM to 5:29 AM | 206 (3.5%) | 69 (1.3%) |
| 5:30 AM to 5:59 AM | 247 (4.2%) | 238 (4.7%) |
| 6:00 AM to 6:29 AM | 469 (8.0%) | 349 (6.8%) |
| 6:30 AM to 6:59 AM | 263 (4.5%) | 259 (5.1%) |
| 7:00 AM to 7:29 AM | 708 (12.1%) | 654 (12.8%) |
| 7:30 AM to 7:59 AM | 696 (11.9%) | 734 (14.4%) |
| 8:00 AM to 8:29 AM | 627 (10.7%) | 569 (11.2%) |
| 8:30 AM to 8:59 AM | 450 (7.7%) | 685 (13.4%) |
| 9:00 AM to 9:59 AM | 1,026 (17.5%) | 634 (12.4%) |
| 10:00 AM to 10:59 AM | 410 (7.0%) | 165 (3.2%) |
| 11:00 AM to 11:59 AM | 74 (1.3%) | 87 (1.7%) |
| 12:00 PM to 3:59 PM | 176 (3.0%) | 389 (7.6%) |
| 4:00 PM to 11:59 PM | 232 (4.0%) | 169 (3.3%) |
| Total | 5,862 (100.0%) | 5,099 (100.0%) |
Housing Occupancy in Clarksburg
Occupancy by Ownership in Clarksburg
Of the total 8,746 dwellings in Clarksburg, owner-occupied units account for 7,753 (88.6%), while renter-occupied units make up 993 (11.4%).
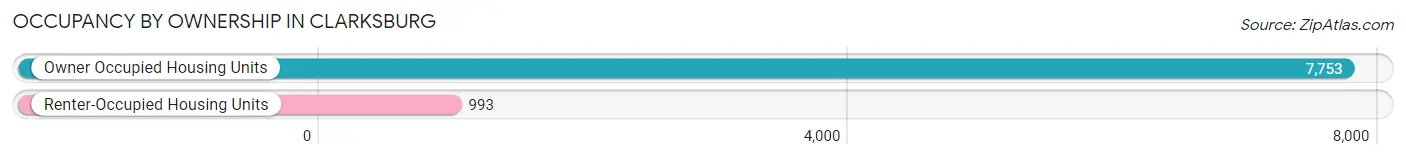
| Occupancy | # Housing Units | % Housing Units |
| Owner Occupied Housing Units | 7,753 | 88.6% |
| Renter-Occupied Housing Units | 993 | 11.4% |
| Total Occupied Housing Units | 8,746 | 100.0% |
Occupancy by Household Size in Clarksburg
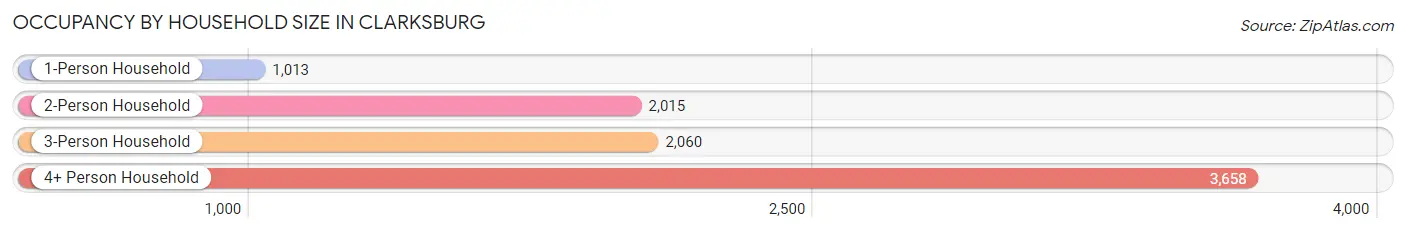
| Household Size | # Housing Units | % Housing Units |
| 1-Person Household | 1,013 | 11.6% |
| 2-Person Household | 2,015 | 23.0% |
| 3-Person Household | 2,060 | 23.5% |
| 4+ Person Household | 3,658 | 41.8% |
| Total Housing Units | 8,746 | 100.0% |
Occupancy by Ownership by Household Size in Clarksburg
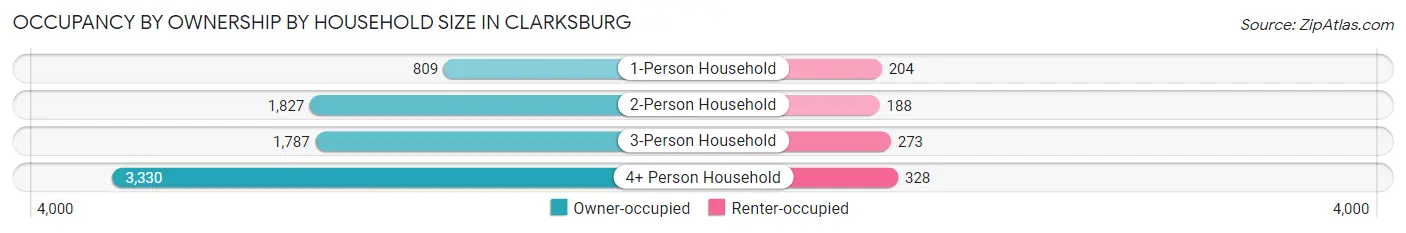
| Household Size | Owner-occupied | Renter-occupied |
| 1-Person Household | 809 (79.9%) | 204 (20.1%) |
| 2-Person Household | 1,827 (90.7%) | 188 (9.3%) |
| 3-Person Household | 1,787 (86.8%) | 273 (13.3%) |
| 4+ Person Household | 3,330 (91.0%) | 328 (9.0%) |
| Total Housing Units | 7,753 (88.6%) | 993 (11.4%) |
Occupancy by Educational Attainment in Clarksburg
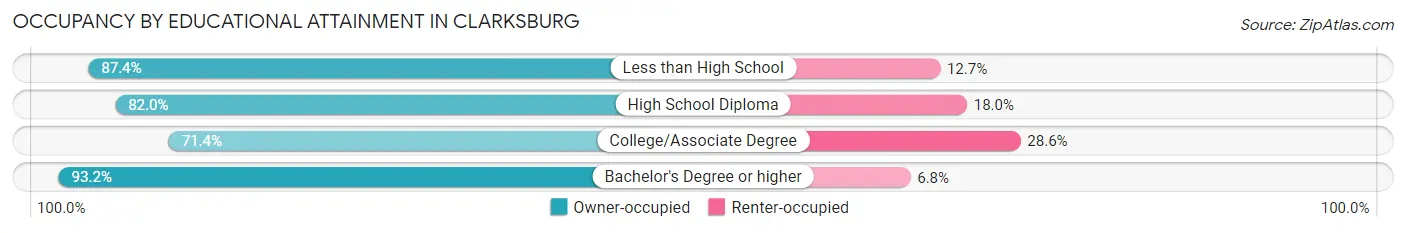
| Household Size | Owner-occupied | Renter-occupied |
| Less than High School | 290 (87.4%) | 42 (12.7%) |
| High School Diploma | 703 (82.0%) | 154 (18.0%) |
| College/Associate Degree | 936 (71.4%) | 375 (28.6%) |
| Bachelor's Degree or higher | 5,824 (93.2%) | 422 (6.8%) |
Occupancy by Age of Householder in Clarksburg
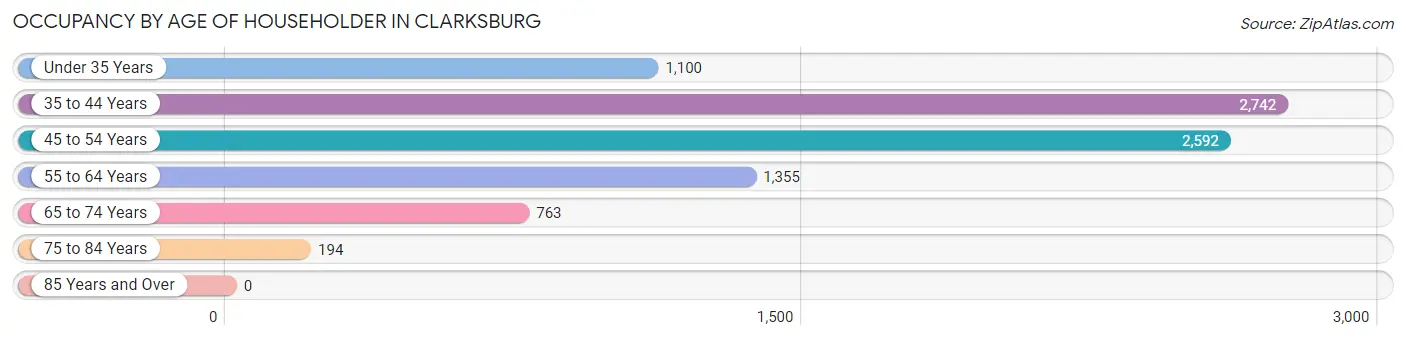
| Age Bracket | # Households | % Households |
| Under 35 Years | 1,100 | 12.6% |
| 35 to 44 Years | 2,742 | 31.4% |
| 45 to 54 Years | 2,592 | 29.6% |
| 55 to 64 Years | 1,355 | 15.5% |
| 65 to 74 Years | 763 | 8.7% |
| 75 to 84 Years | 194 | 2.2% |
| 85 Years and Over | 0 | 0.0% |
| Total | 8,746 | 100.0% |
Housing Finances in Clarksburg
Median Income by Occupancy in Clarksburg
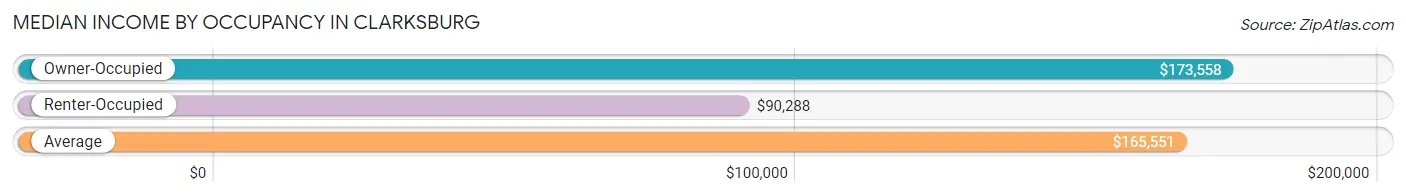
| Occupancy Type | # Households | Median Income |
| Owner-Occupied | 7,753 (88.6%) | $173,558 |
| Renter-Occupied | 993 (11.4%) | $90,288 |
| Average | 8,746 (100.0%) | $165,551 |
Occupancy by Householder Income Bracket in Clarksburg
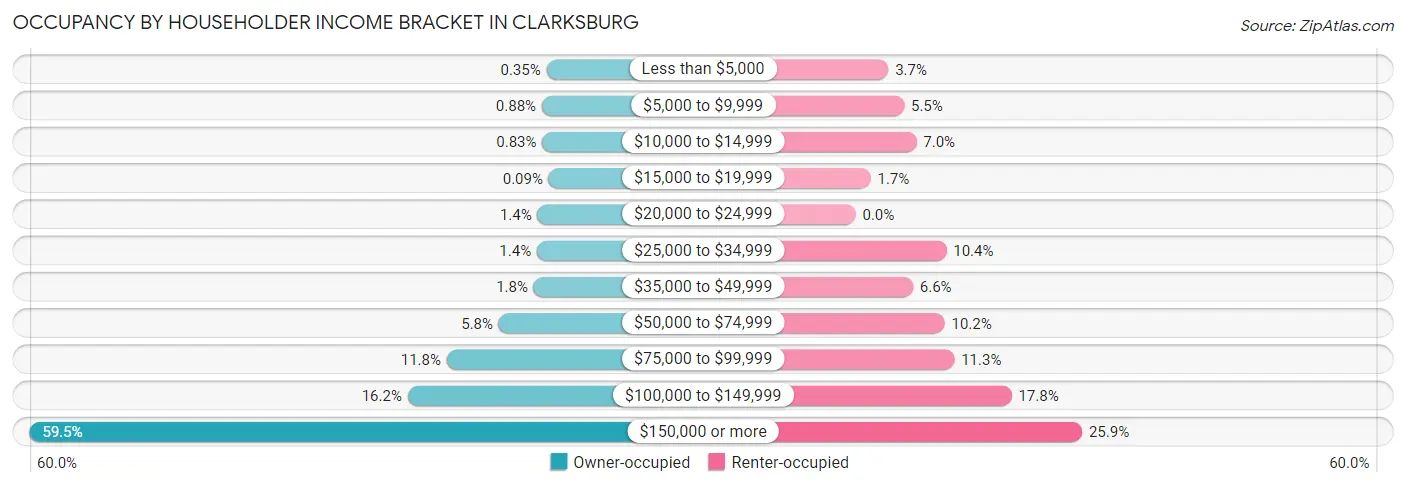
| Income Bracket | Owner-occupied | Renter-occupied |
| Less than $5,000 | 27 (0.4%) | 37 (3.7%) |
| $5,000 to $9,999 | 68 (0.9%) | 55 (5.5%) |
| $10,000 to $14,999 | 64 (0.8%) | 69 (7.0%) |
| $15,000 to $19,999 | 7 (0.1%) | 17 (1.7%) |
| $20,000 to $24,999 | 107 (1.4%) | 0 (0.0%) |
| $25,000 to $34,999 | 112 (1.4%) | 103 (10.4%) |
| $35,000 to $49,999 | 140 (1.8%) | 65 (6.6%) |
| $50,000 to $74,999 | 450 (5.8%) | 101 (10.2%) |
| $75,000 to $99,999 | 911 (11.7%) | 112 (11.3%) |
| $100,000 to $149,999 | 1,257 (16.2%) | 177 (17.8%) |
| $150,000 or more | 4,610 (59.5%) | 257 (25.9%) |
| Total | 7,753 (100.0%) | 993 (100.0%) |
Monthly Housing Cost Tiers in Clarksburg
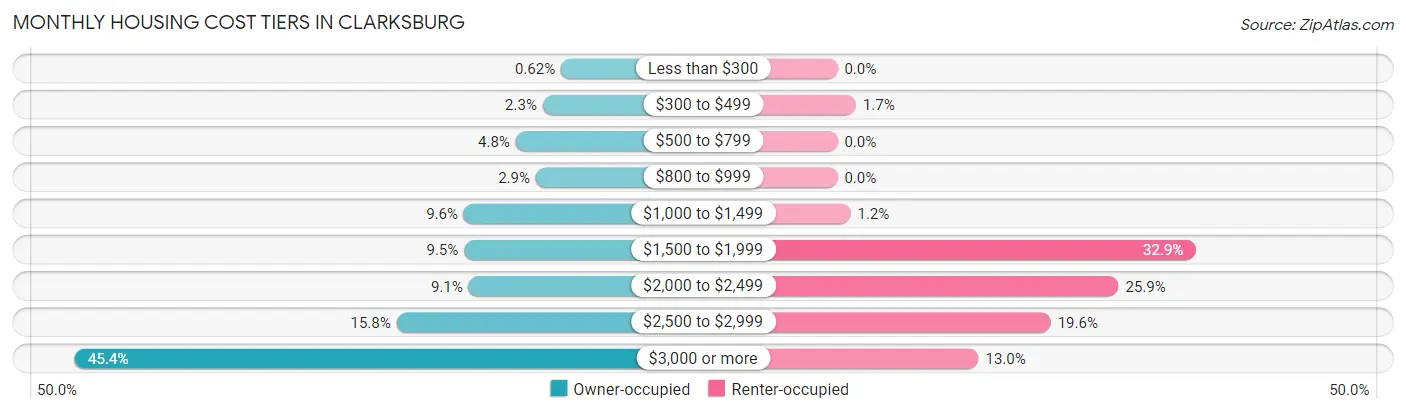
| Monthly Cost | Owner-occupied | Renter-occupied |
| Less than $300 | 48 (0.6%) | 0 (0.0%) |
| $300 to $499 | 178 (2.3%) | 17 (1.7%) |
| $500 to $799 | 371 (4.8%) | 0 (0.0%) |
| $800 to $999 | 228 (2.9%) | 0 (0.0%) |
| $1,000 to $1,499 | 741 (9.6%) | 12 (1.2%) |
| $1,500 to $1,999 | 740 (9.5%) | 327 (32.9%) |
| $2,000 to $2,499 | 708 (9.1%) | 257 (25.9%) |
| $2,500 to $2,999 | 1,222 (15.8%) | 195 (19.6%) |
| $3,000 or more | 3,517 (45.4%) | 129 (13.0%) |
| Total | 7,753 (100.0%) | 993 (100.0%) |
Physical Housing Characteristics in Clarksburg
Housing Structures in Clarksburg
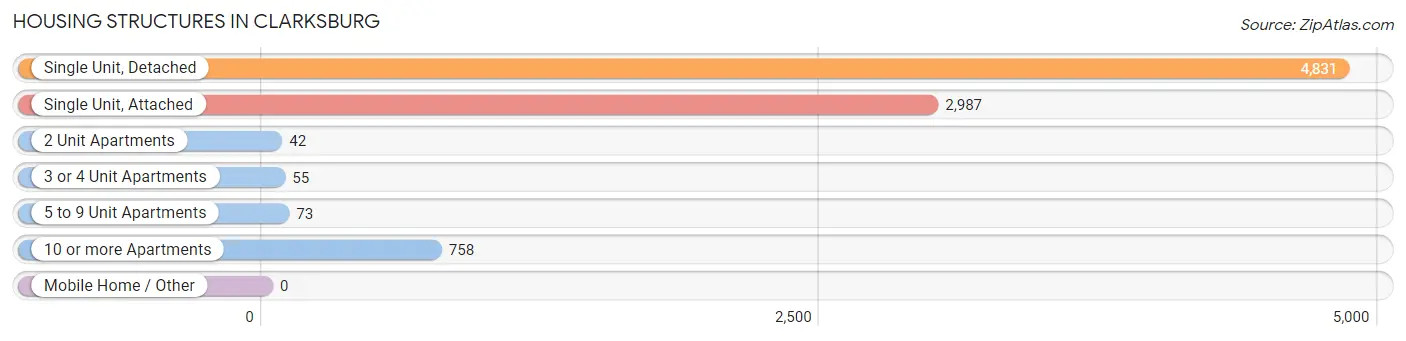
| Structure Type | # Housing Units | % Housing Units |
| Single Unit, Detached | 4,831 | 55.2% |
| Single Unit, Attached | 2,987 | 34.2% |
| 2 Unit Apartments | 42 | 0.5% |
| 3 or 4 Unit Apartments | 55 | 0.6% |
| 5 to 9 Unit Apartments | 73 | 0.8% |
| 10 or more Apartments | 758 | 8.7% |
| Mobile Home / Other | 0 | 0.0% |
| Total | 8,746 | 100.0% |
Housing Structures by Occupancy in Clarksburg
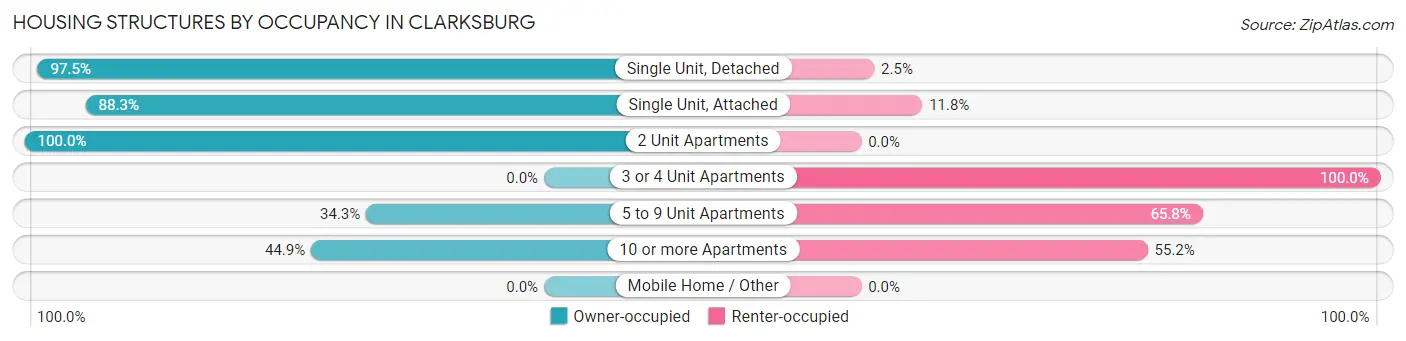
| Structure Type | Owner-occupied | Renter-occupied |
| Single Unit, Detached | 4,710 (97.5%) | 121 (2.5%) |
| Single Unit, Attached | 2,636 (88.2%) | 351 (11.7%) |
| 2 Unit Apartments | 42 (100.0%) | 0 (0.0%) |
| 3 or 4 Unit Apartments | 0 (0.0%) | 55 (100.0%) |
| 5 to 9 Unit Apartments | 25 (34.3%) | 48 (65.7%) |
| 10 or more Apartments | 340 (44.9%) | 418 (55.1%) |
| Mobile Home / Other | 0 (0.0%) | 0 (0.0%) |
| Total | 7,753 (88.6%) | 993 (11.4%) |
Housing Structures by Number of Rooms in Clarksburg
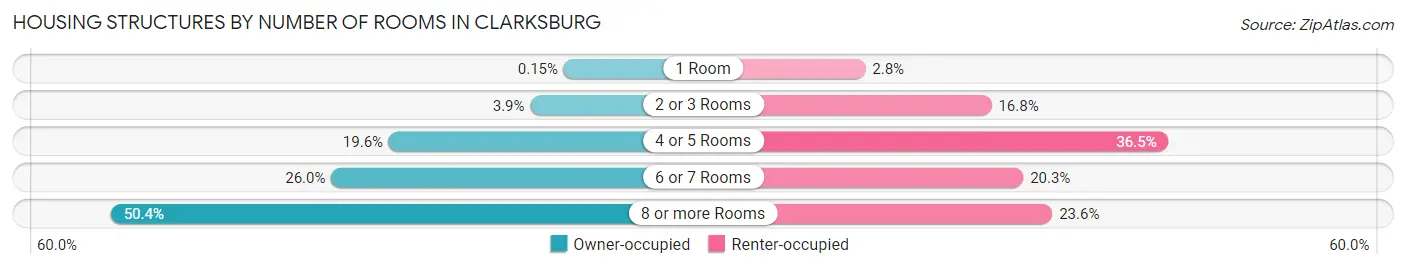
| Number of Rooms | Owner-occupied | Renter-occupied |
| 1 Room | 12 (0.2%) | 28 (2.8%) |
| 2 or 3 Rooms | 300 (3.9%) | 167 (16.8%) |
| 4 or 5 Rooms | 1,517 (19.6%) | 362 (36.5%) |
| 6 or 7 Rooms | 2,013 (26.0%) | 202 (20.3%) |
| 8 or more Rooms | 3,911 (50.4%) | 234 (23.6%) |
| Total | 7,753 (100.0%) | 993 (100.0%) |
Housing Structure by Heating Type in Clarksburg
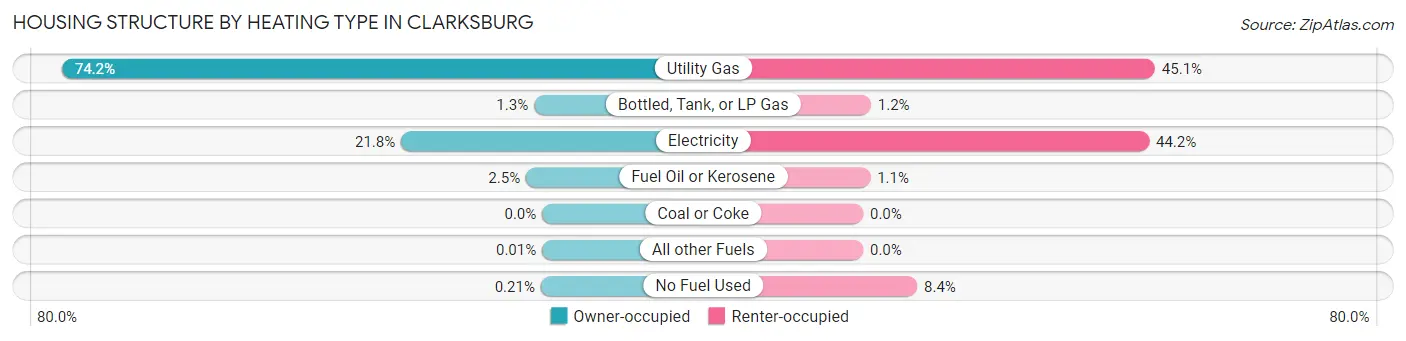
| Heating Type | Owner-occupied | Renter-occupied |
| Utility Gas | 5,756 (74.2%) | 448 (45.1%) |
| Bottled, Tank, or LP Gas | 97 (1.3%) | 12 (1.2%) |
| Electricity | 1,690 (21.8%) | 439 (44.2%) |
| Fuel Oil or Kerosene | 193 (2.5%) | 11 (1.1%) |
| Coal or Coke | 0 (0.0%) | 0 (0.0%) |
| All other Fuels | 1 (0.0%) | 0 (0.0%) |
| No Fuel Used | 16 (0.2%) | 83 (8.4%) |
| Total | 7,753 (100.0%) | 993 (100.0%) |
Household Vehicle Usage in Clarksburg
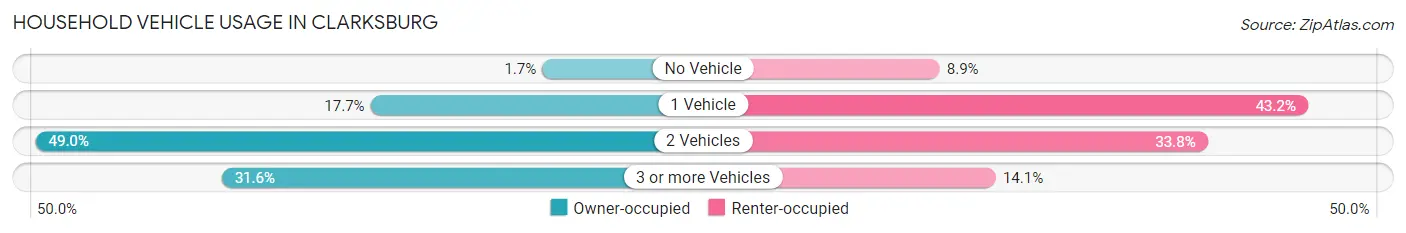
| Vehicles per Household | Owner-occupied | Renter-occupied |
| No Vehicle | 132 (1.7%) | 88 (8.9%) |
| 1 Vehicle | 1,374 (17.7%) | 429 (43.2%) |
| 2 Vehicles | 3,797 (49.0%) | 336 (33.8%) |
| 3 or more Vehicles | 2,450 (31.6%) | 140 (14.1%) |
| Total | 7,753 (100.0%) | 993 (100.0%) |
Real Estate & Mortgages in Clarksburg
Real Estate and Mortgage Overview in Clarksburg
| Characteristic | Without Mortgage | With Mortgage |
| Housing Units | 1,048 | 6,705 |
| Median Property Value | $545,400 | $613,500 |
| Median Household Income | $143,977 | $4,120 |
| Monthly Housing Costs | $807 | $3,517 |
| Real Estate Taxes | $5,472 | $245 |
Property Value by Mortgage Status in Clarksburg
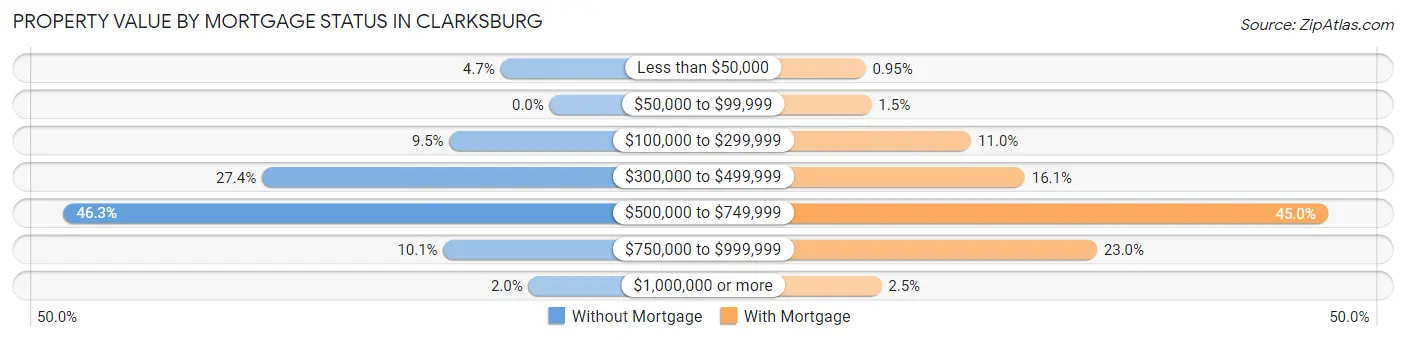
| Property Value | Without Mortgage | With Mortgage |
| Less than $50,000 | 49 (4.7%) | 64 (0.9%) |
| $50,000 to $99,999 | 0 (0.0%) | 101 (1.5%) |
| $100,000 to $299,999 | 100 (9.5%) | 738 (11.0%) |
| $300,000 to $499,999 | 287 (27.4%) | 1,081 (16.1%) |
| $500,000 to $749,999 | 485 (46.3%) | 3,015 (45.0%) |
| $750,000 to $999,999 | 106 (10.1%) | 1,541 (23.0%) |
| $1,000,000 or more | 21 (2.0%) | 165 (2.5%) |
| Total | 1,048 (100.0%) | 6,705 (100.0%) |
Household Income by Mortgage Status in Clarksburg
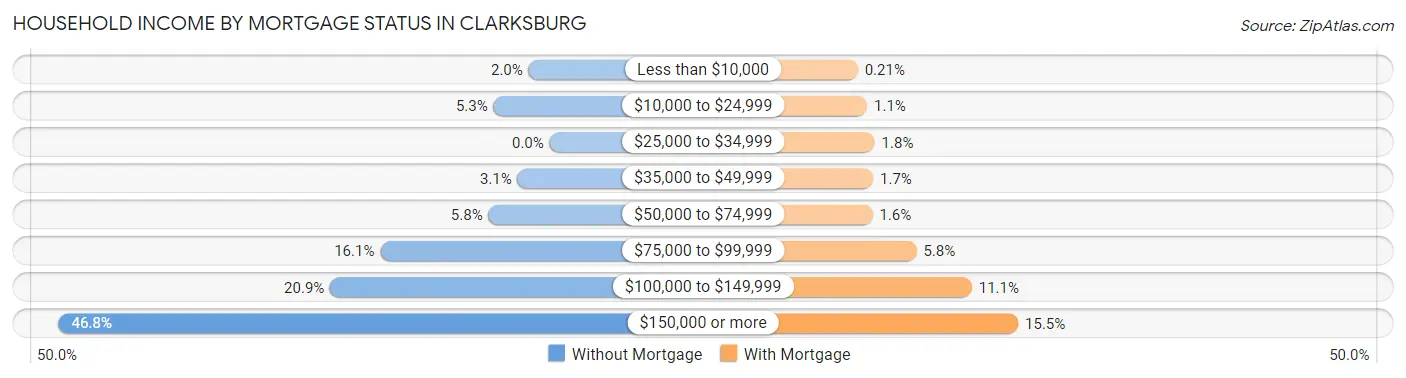
| Household Income | Without Mortgage | With Mortgage |
| Less than $10,000 | 21 (2.0%) | 14 (0.2%) |
| $10,000 to $24,999 | 56 (5.3%) | 74 (1.1%) |
| $25,000 to $34,999 | 0 (0.0%) | 122 (1.8%) |
| $35,000 to $49,999 | 32 (3.0%) | 112 (1.7%) |
| $50,000 to $74,999 | 61 (5.8%) | 108 (1.6%) |
| $75,000 to $99,999 | 169 (16.1%) | 389 (5.8%) |
| $100,000 to $149,999 | 219 (20.9%) | 742 (11.1%) |
| $150,000 or more | 490 (46.8%) | 1,038 (15.5%) |
| Total | 1,048 (100.0%) | 6,705 (100.0%) |
Property Value to Household Income Ratio in Clarksburg
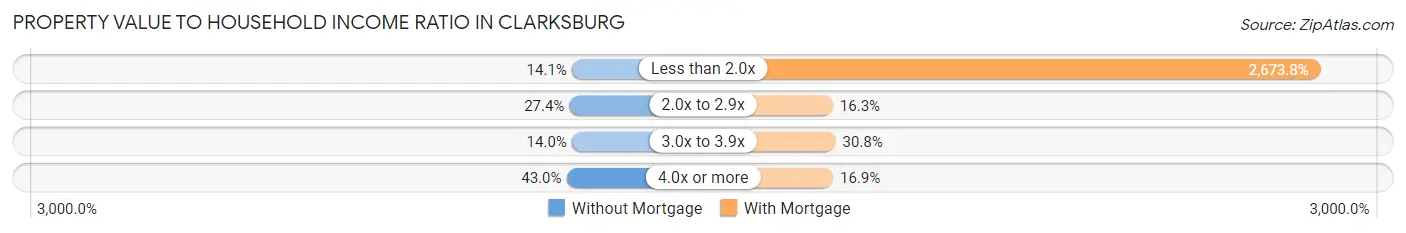
| Value-to-Income Ratio | Without Mortgage | With Mortgage |
| Less than 2.0x | 148 (14.1%) | 179,275 (2,673.8%) |
| 2.0x to 2.9x | 287 (27.4%) | 1,093 (16.3%) |
| 3.0x to 3.9x | 147 (14.0%) | 2,063 (30.8%) |
| 4.0x or more | 451 (43.0%) | 1,136 (16.9%) |
| Total | 1,048 (100.0%) | 6,705 (100.0%) |
Real Estate Taxes by Mortgage Status in Clarksburg
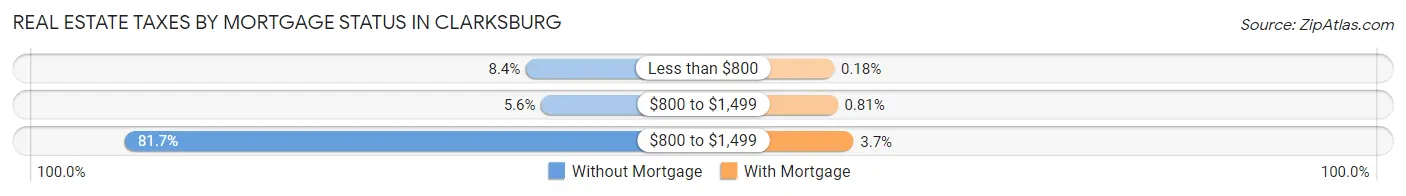
| Property Taxes | Without Mortgage | With Mortgage |
| Less than $800 | 88 (8.4%) | 12 (0.2%) |
| $800 to $1,499 | 59 (5.6%) | 54 (0.8%) |
| $800 to $1,499 | 856 (81.7%) | 249 (3.7%) |
| Total | 1,048 (100.0%) | 6,705 (100.0%) |
Health & Disability in Clarksburg
Health Insurance Coverage by Age in Clarksburg
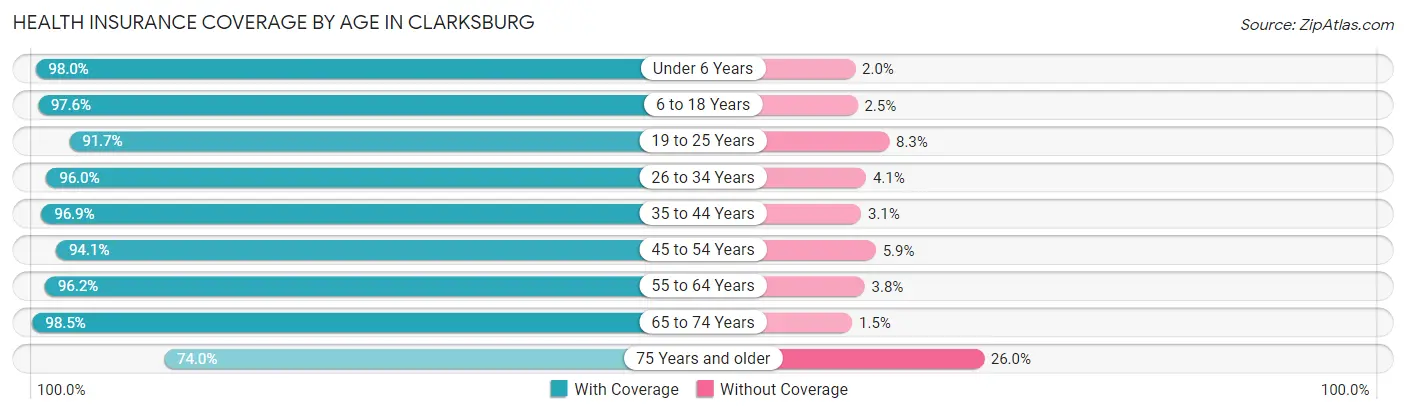
| Age Bracket | With Coverage | Without Coverage |
| Under 6 Years | 2,617 (98.0%) | 54 (2.0%) |
| 6 to 18 Years | 6,140 (97.6%) | 154 (2.5%) |
| 19 to 25 Years | 1,165 (91.7%) | 106 (8.3%) |
| 26 to 34 Years | 2,419 (96.0%) | 102 (4.1%) |
| 35 to 44 Years | 5,366 (96.9%) | 173 (3.1%) |
| 45 to 54 Years | 4,164 (94.1%) | 259 (5.9%) |
| 55 to 64 Years | 2,970 (96.2%) | 117 (3.8%) |
| 65 to 74 Years | 1,683 (98.5%) | 25 (1.5%) |
| 75 Years and older | 586 (74.0%) | 206 (26.0%) |
| Total | 27,110 (95.8%) | 1,196 (4.2%) |
Health Insurance Coverage by Citizenship Status in Clarksburg
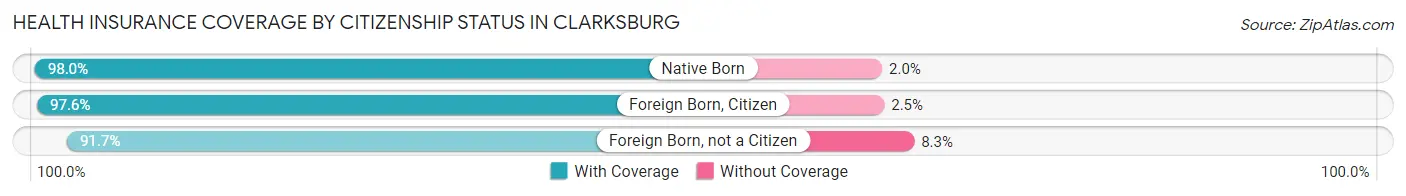
| Citizenship Status | With Coverage | Without Coverage |
| Native Born | 2,617 (98.0%) | 54 (2.0%) |
| Foreign Born, Citizen | 6,140 (97.6%) | 154 (2.5%) |
| Foreign Born, not a Citizen | 1,165 (91.7%) | 106 (8.3%) |
Health Insurance Coverage by Household Income in Clarksburg
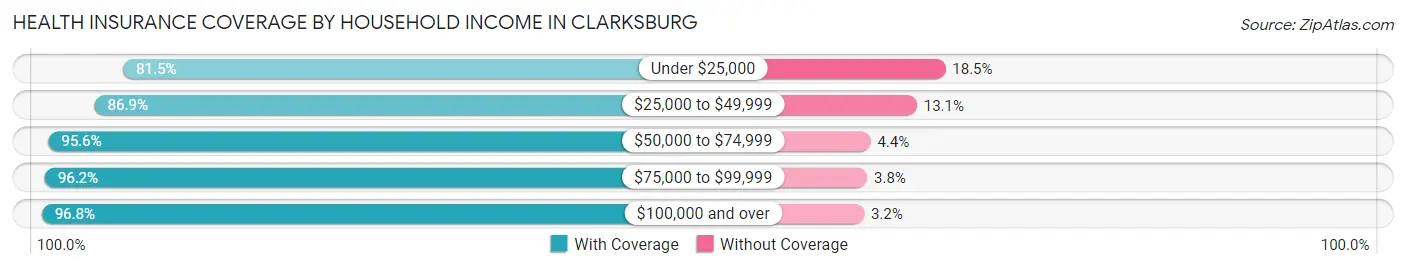
| Household Income | With Coverage | Without Coverage |
| Under $25,000 | 715 (81.5%) | 162 (18.5%) |
| $25,000 to $49,999 | 1,046 (86.9%) | 158 (13.1%) |
| $50,000 to $74,999 | 1,422 (95.6%) | 66 (4.4%) |
| $75,000 to $99,999 | 2,858 (96.2%) | 113 (3.8%) |
| $100,000 and over | 21,040 (96.8%) | 697 (3.2%) |
Public vs Private Health Insurance Coverage by Age in Clarksburg
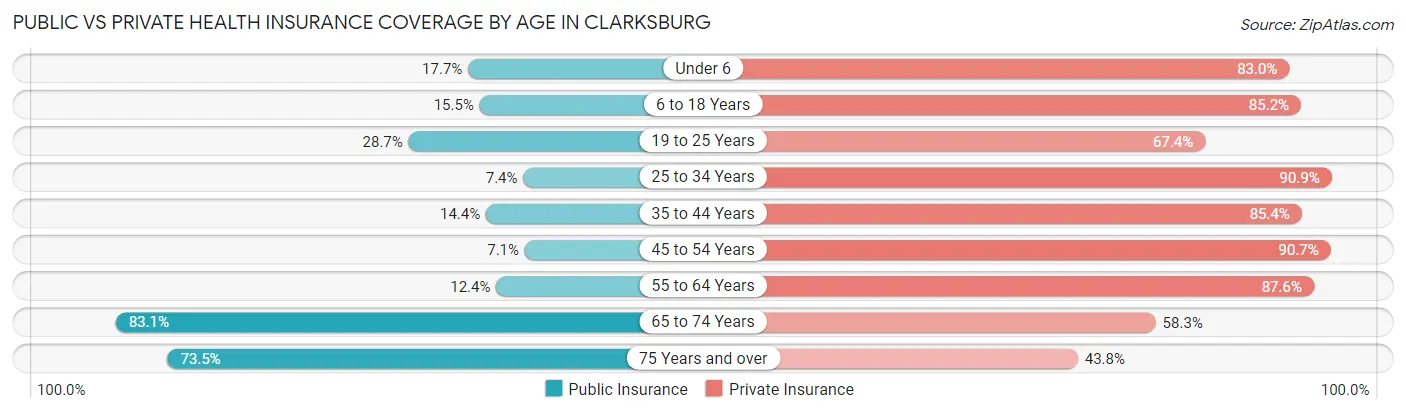
| Age Bracket | Public Insurance | Private Insurance |
| Under 6 | 472 (17.7%) | 2,218 (83.0%) |
| 6 to 18 Years | 977 (15.5%) | 5,363 (85.2%) |
| 19 to 25 Years | 365 (28.7%) | 857 (67.4%) |
| 25 to 34 Years | 187 (7.4%) | 2,292 (90.9%) |
| 35 to 44 Years | 795 (14.3%) | 4,728 (85.4%) |
| 45 to 54 Years | 316 (7.1%) | 4,013 (90.7%) |
| 55 to 64 Years | 384 (12.4%) | 2,704 (87.6%) |
| 65 to 74 Years | 1,419 (83.1%) | 995 (58.3%) |
| 75 Years and over | 582 (73.5%) | 347 (43.8%) |
| Total | 5,497 (19.4%) | 23,517 (83.1%) |
Disability Status by Sex by Age in Clarksburg
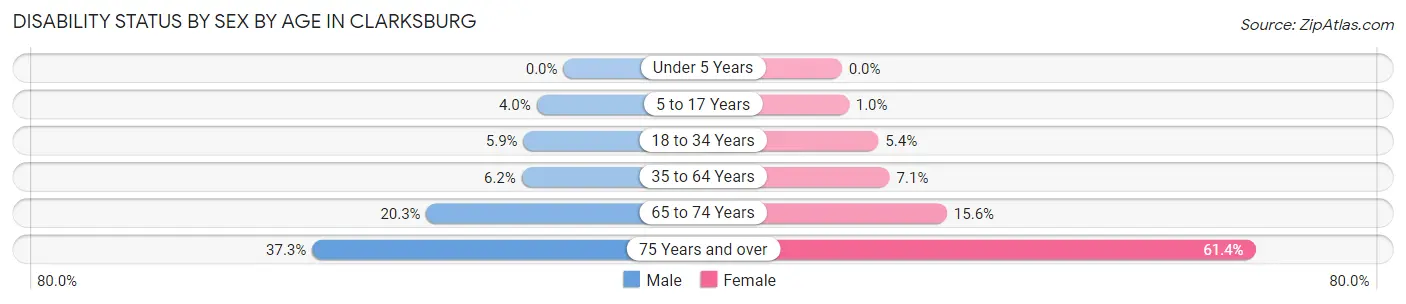
| Age Bracket | Male | Female |
| Under 5 Years | 0 (0.0%) | 0 (0.0%) |
| 5 to 17 Years | 128 (4.0%) | 33 (1.0%) |
| 18 to 34 Years | 113 (5.9%) | 118 (5.4%) |
| 35 to 64 Years | 385 (6.2%) | 486 (7.1%) |
| 65 to 74 Years | 174 (20.3%) | 133 (15.6%) |
| 75 Years and over | 75 (37.3%) | 363 (61.4%) |
Disability Class by Sex by Age in Clarksburg
Disability Class: Hearing Difficulty
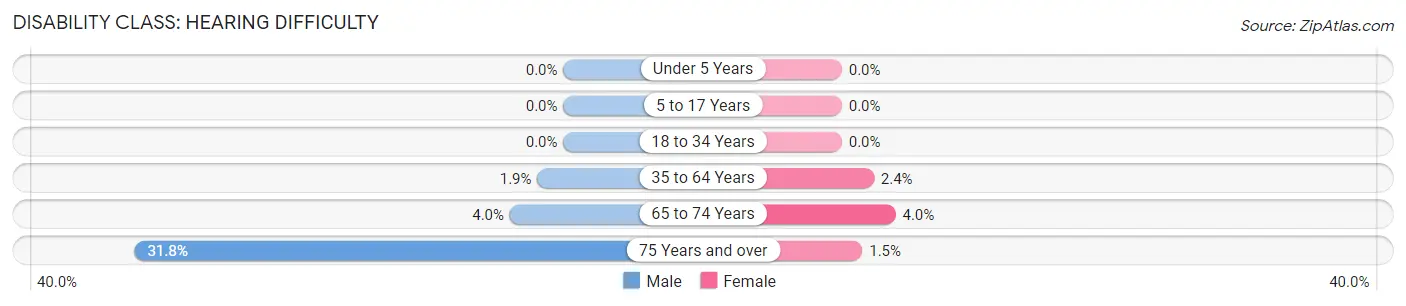
| Age Bracket | Male | Female |
| Under 5 Years | 0 (0.0%) | 0 (0.0%) |
| 5 to 17 Years | 0 (0.0%) | 0 (0.0%) |
| 18 to 34 Years | 0 (0.0%) | 0 (0.0%) |
| 35 to 64 Years | 120 (1.9%) | 163 (2.4%) |
| 65 to 74 Years | 34 (4.0%) | 34 (4.0%) |
| 75 Years and over | 64 (31.8%) | 9 (1.5%) |
Disability Class: Vision Difficulty
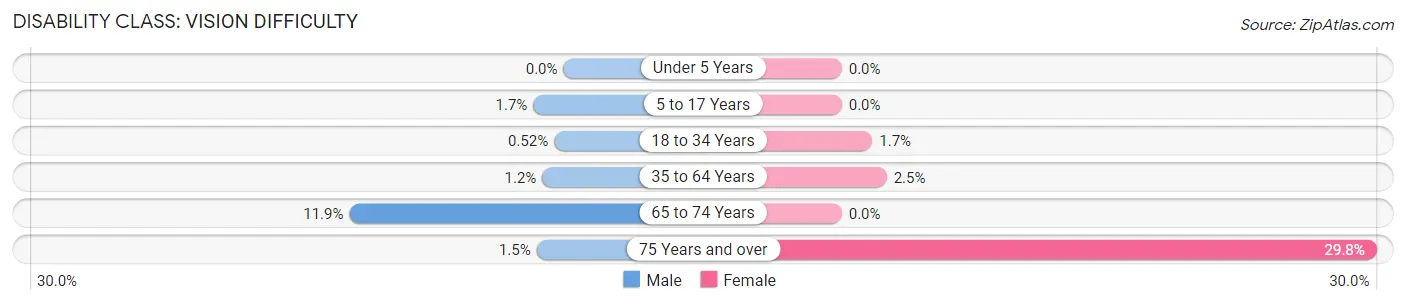
| Age Bracket | Male | Female |
| Under 5 Years | 0 (0.0%) | 0 (0.0%) |
| 5 to 17 Years | 54 (1.7%) | 0 (0.0%) |
| 18 to 34 Years | 10 (0.5%) | 37 (1.7%) |
| 35 to 64 Years | 73 (1.2%) | 171 (2.5%) |
| 65 to 74 Years | 102 (11.9%) | 0 (0.0%) |
| 75 Years and over | 3 (1.5%) | 176 (29.8%) |
Disability Class: Cognitive Difficulty
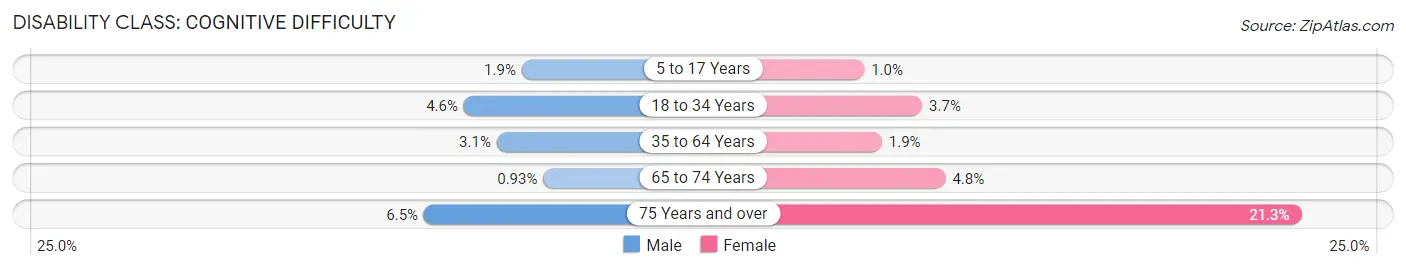
| Age Bracket | Male | Female |
| 5 to 17 Years | 62 (1.9%) | 33 (1.0%) |
| 18 to 34 Years | 88 (4.6%) | 81 (3.7%) |
| 35 to 64 Years | 192 (3.1%) | 127 (1.9%) |
| 65 to 74 Years | 8 (0.9%) | 41 (4.8%) |
| 75 Years and over | 13 (6.5%) | 126 (21.3%) |
Disability Class: Ambulatory Difficulty
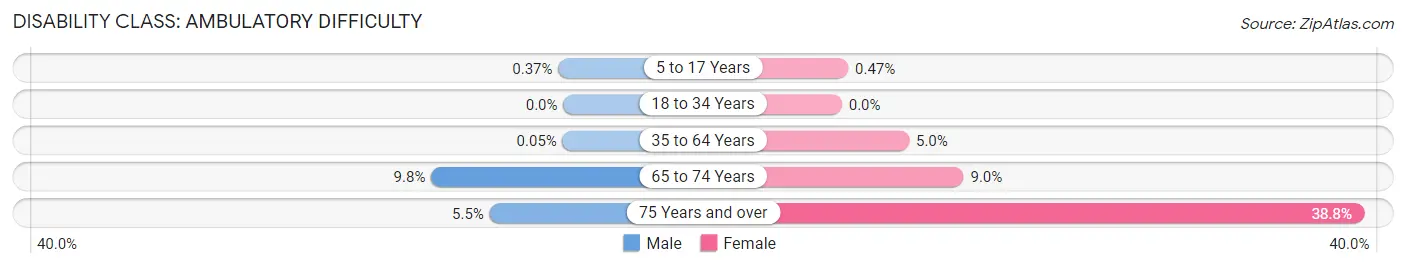
| Age Bracket | Male | Female |
| 5 to 17 Years | 12 (0.4%) | 15 (0.5%) |
| 18 to 34 Years | 0 (0.0%) | 0 (0.0%) |
| 35 to 64 Years | 3 (0.1%) | 341 (5.0%) |
| 65 to 74 Years | 84 (9.8%) | 77 (9.0%) |
| 75 Years and over | 11 (5.5%) | 229 (38.8%) |
Disability Class: Self-Care Difficulty
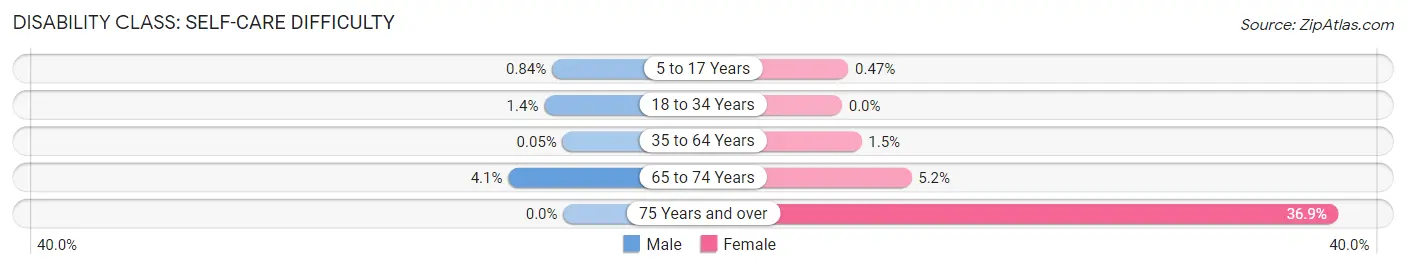
| Age Bracket | Male | Female |
| 5 to 17 Years | 27 (0.8%) | 15 (0.5%) |
| 18 to 34 Years | 27 (1.4%) | 0 (0.0%) |
| 35 to 64 Years | 3 (0.1%) | 99 (1.5%) |
| 65 to 74 Years | 35 (4.1%) | 44 (5.2%) |
| 75 Years and over | 0 (0.0%) | 218 (36.9%) |
Technology Access in Clarksburg
Computing Device Access in Clarksburg
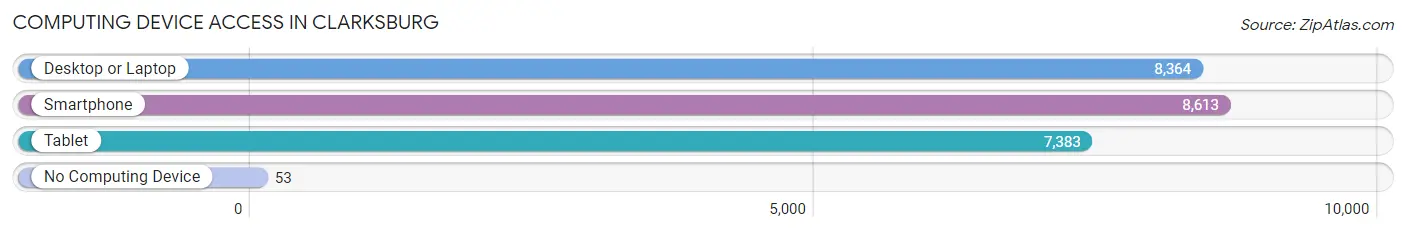
| Device Type | # Households | % Households |
| Desktop or Laptop | 8,364 | 95.6% |
| Smartphone | 8,613 | 98.5% |
| Tablet | 7,383 | 84.4% |
| No Computing Device | 53 | 0.6% |
| Total | 8,746 | 100.0% |
Internet Access in Clarksburg
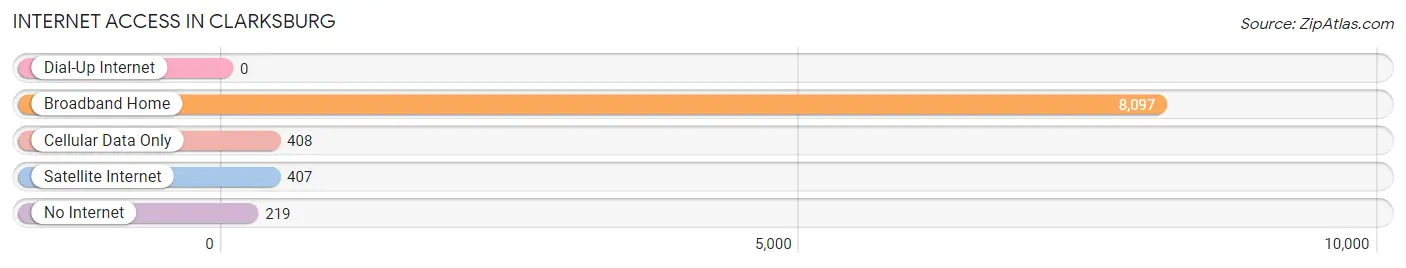
| Internet Type | # Households | % Households |
| Dial-Up Internet | 0 | 0.0% |
| Broadband Home | 8,097 | 92.6% |
| Cellular Data Only | 408 | 4.7% |
| Satellite Internet | 407 | 4.6% |
| No Internet | 219 | 2.5% |
| Total | 8,746 | 100.0% |
Clarksburg Summary
Clarksburg, Maryland is a small town located in Montgomery County, Maryland, United States. It is situated in the northern part of the county, approximately 20 miles northwest of Washington, D.C. The town is part of the Washington metropolitan area and is considered a suburb of the nation’s capital. The population of Clarksburg was estimated to be 13,766 in 2019.
History
Clarksburg was founded in 1752 by Richard Snowden, a Quaker from Pennsylvania. The town was named after his father, Thomas Clark, who had purchased the land from Lord Baltimore. The town was originally known as Clarksburgh, but the name was changed to Clarksburg in 1817.
The town was an important stop on the National Road, which was the first federally funded highway in the United States. The road was built in the early 19th century to connect the Potomac River with the Ohio River. The road was a major factor in the growth of Clarksburg, as it allowed for the transportation of goods and people to and from the town.
Clarksburg was also an important stop on the Baltimore and Ohio Railroad, which was the first railroad in the United States. The railroad was built in the 1830s and connected the town to Baltimore and Washington, D.C. The railroad was a major factor in the growth of Clarksburg, as it allowed for the transportation of goods and people to and from the town.
Geography
Clarksburg is located in northern Montgomery County, Maryland, approximately 20 miles northwest of Washington, D.C. The town is situated in the Piedmont region of Maryland, which is characterized by rolling hills and valleys. The town is bordered by the towns of Germantown to the east, Damascus to the south, and Poolesville to the west.
The town is located in the watershed of the Potomac River, which is the largest river in the Chesapeake Bay watershed. The town is also located in the watershed of the Monocacy River, which is a tributary of the Potomac River.
Economy
Clarksburg is a small town with a population of approximately 13,766 people. The town is primarily a residential community, with most of the population employed in the service sector. The town is home to several small businesses, including restaurants, retail stores, and professional services.
The town is also home to several large employers, including the National Institutes of Health, the National Institute of Standards and Technology, and the National Oceanic and Atmospheric Administration. The town is also home to several technology companies, including IBM, Lockheed Martin, and Northrop Grumman.
Demographics
As of the 2019 census, the population of Clarksburg was estimated to be 13,766. The town is predominantly white, with approximately 79.3% of the population identifying as white. The town is also home to a large Hispanic population, with approximately 11.3% of the population identifying as Hispanic or Latino.
The median household income in Clarksburg is $117,845, which is significantly higher than the national median of $61,937. The median home value in Clarksburg is $521,400, which is significantly higher than the national median of $219,700.
Conclusion
Clarksburg, Maryland is a small town located in Montgomery County, Maryland, United States. It is situated in the northern part of the county, approximately 20 miles northwest of Washington, D.C. The town is part of the Washington metropolitan area and is considered a suburb of the nation’s capital. The population of Clarksburg was estimated to be 13,766 in 2019. The town is predominantly white, with approximately 79.3% of the population identifying as white. The town is also home to a large Hispanic population, with approximately 11.3% of the population identifying as Hispanic or Latino. The median household income in Clarksburg is $117,845, which is significantly higher than the national median of $61,937. The median home value in Clarksburg is $521,400, which is significantly higher than the national median of $219,700. Clarksburg is a small town with a population of approximately 13,766 people. The town is primarily a residential community, with most of the population employed in the service sector. The town is home to several small businesses, including restaurants, retail stores, and professional services. The town is also home to several large employers, including the National Institutes of Health, the National Institute of Standards and Technology, and the National Oceanic and Atmospheric Administration.
Common Questions
What is Per Capita Income in Clarksburg?
Per Capita income in Clarksburg is $56,045.
What is the Median Family Income in Clarksburg?
Median Family Income in Clarksburg is $177,700.
What is the Median Household income in Clarksburg?
Median Household Income in Clarksburg is $165,551.
What is Income or Wage Gap in Clarksburg?
Income or Wage Gap in Clarksburg is 25.7%.
Women in Clarksburg earn 74.3 cents for every dollar earned by a man.
What is Inequality or Gini Index in Clarksburg?
Inequality or Gini Index in Clarksburg is 0.35.
What is the Total Population of Clarksburg?
Total Population of Clarksburg is 28,337.
What is the Total Male Population of Clarksburg?
Total Male Population of Clarksburg is 13,782.
What is the Total Female Population of Clarksburg?
Total Female Population of Clarksburg is 14,555.
What is the Ratio of Males per 100 Females in Clarksburg?
There are 94.69 Males per 100 Females in Clarksburg.
What is the Ratio of Females per 100 Males in Clarksburg?
There are 105.61 Females per 100 Males in Clarksburg.
What is the Median Population Age in Clarksburg?
Median Population Age in Clarksburg is 37.7 Years.
What is the Average Family Size in Clarksburg
Average Family Size in Clarksburg is 3.5 People.
What is the Average Household Size in Clarksburg
Average Household Size in Clarksburg is 3.2 People.
How Large is the Labor Force in Clarksburg?
There are 15,155 People in the Labor Forcein in Clarksburg.
What is the Percentage of People in the Labor Force in Clarksburg?
73.9% of People are in the Labor Force in Clarksburg.
What is the Unemployment Rate in Clarksburg?
Unemployment Rate in Clarksburg is 4.7%.