Morgantown, WV Map & Demographics
Morgantown Map
Morgantown Overview
$28,620
PER CAPITA INCOME
$91,118
AVG FAMILY INCOME
$41,103
AVG HOUSEHOLD INCOME
29.1%
WAGE / INCOME GAP [ % ]
70.9¢/ $1
WAGE / INCOME GAP [ $ ]
$13,249
FAMILY INCOME DEFICIT
0.55
INEQUALITY / GINI INDEX
30,220
TOTAL POPULATION
16,284
MALE POPULATION
13,936
FEMALE POPULATION
116.85
MALES / 100 FEMALES
85.58
FEMALES / 100 MALES
23.8
MEDIAN AGE
2.7
AVG FAMILY SIZE
2.1
AVG HOUSEHOLD SIZE
15,870
LABOR FORCE [ PEOPLE ]
57.9%
PERCENT IN LABOR FORCE
9.9%
UNEMPLOYMENT RATE
Income in Morgantown
Income Overview in Morgantown
Per Capita Income in Morgantown is $28,620, while median incomes of families and households are $91,118 and $41,103 respectively.
| Characteristic | Number | Measure |
| Per Capita Income | 30,220 | $28,620 |
| Median Family Income | 4,814 | $91,118 |
| Mean Family Income | 4,814 | $109,632 |
| Median Household Income | 12,035 | $41,103 |
| Mean Household Income | 12,035 | $68,197 |
| Income Deficit | 4,814 | $13,249 |
| Wage / Income Gap (%) | 30,220 | 29.12% |
| Wage / Income Gap ($) | 30,220 | 70.88¢ per $1 |
| Gini / Inequality Index | 30,220 | 0.55 |
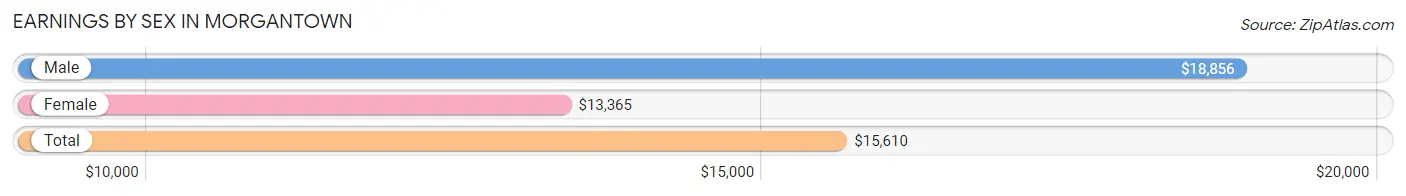
Earnings by Sex in Morgantown
Average Earnings in Morgantown are $15,610, $18,856 for men and $13,365 for women, a difference of 29.1%.
| Sex | Number | Average Earnings |
| Male | 11,001 (54.9%) | $18,856 |
| Female | 9,025 (45.1%) | $13,365 |
| Total | 20,026 (100.0%) | $15,610 |
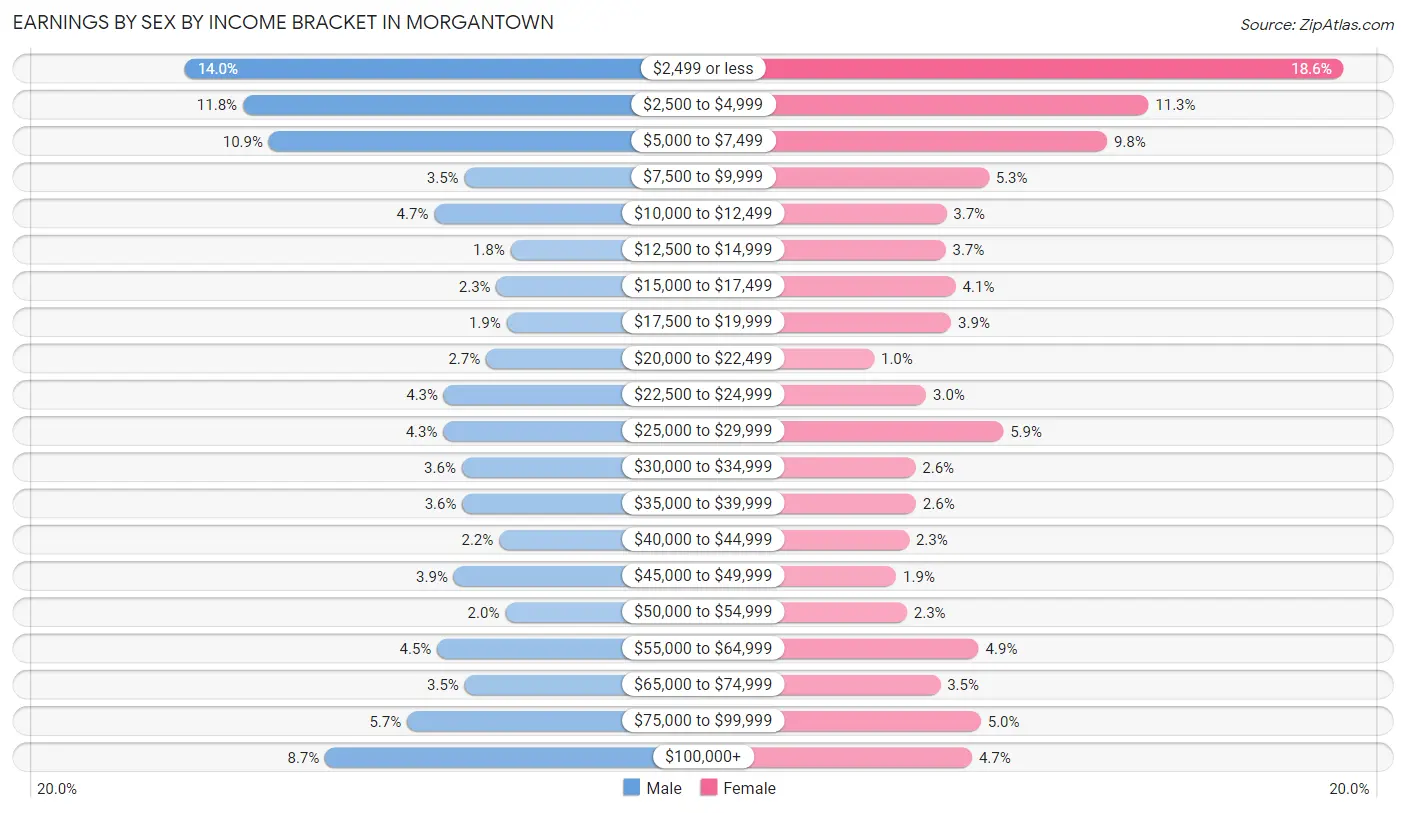
Earnings by Sex by Income Bracket in Morgantown
The most common earnings brackets in Morgantown are $2,499 or less for men (1,540 | 14.0%) and $2,499 or less for women (1,680 | 18.6%).
| Income | Male | Female |
| $2,499 or less | 1,540 (14.0%) | 1,680 (18.6%) |
| $2,500 to $4,999 | 1,300 (11.8%) | 1,020 (11.3%) |
| $5,000 to $7,499 | 1,194 (10.8%) | 880 (9.8%) |
| $7,500 to $9,999 | 387 (3.5%) | 480 (5.3%) |
| $10,000 to $12,499 | 512 (4.6%) | 337 (3.7%) |
| $12,500 to $14,999 | 197 (1.8%) | 334 (3.7%) |
| $15,000 to $17,499 | 255 (2.3%) | 368 (4.1%) |
| $17,500 to $19,999 | 213 (1.9%) | 353 (3.9%) |
| $20,000 to $22,499 | 298 (2.7%) | 92 (1.0%) |
| $22,500 to $24,999 | 472 (4.3%) | 268 (3.0%) |
| $25,000 to $29,999 | 474 (4.3%) | 529 (5.9%) |
| $30,000 to $34,999 | 398 (3.6%) | 232 (2.6%) |
| $35,000 to $39,999 | 396 (3.6%) | 234 (2.6%) |
| $40,000 to $44,999 | 244 (2.2%) | 210 (2.3%) |
| $45,000 to $49,999 | 431 (3.9%) | 167 (1.8%) |
| $50,000 to $54,999 | 219 (2.0%) | 203 (2.2%) |
| $55,000 to $64,999 | 499 (4.5%) | 446 (4.9%) |
| $65,000 to $74,999 | 386 (3.5%) | 316 (3.5%) |
| $75,000 to $99,999 | 624 (5.7%) | 453 (5.0%) |
| $100,000+ | 962 (8.7%) | 423 (4.7%) |
| Total | 11,001 (100.0%) | 9,025 (100.0%) |
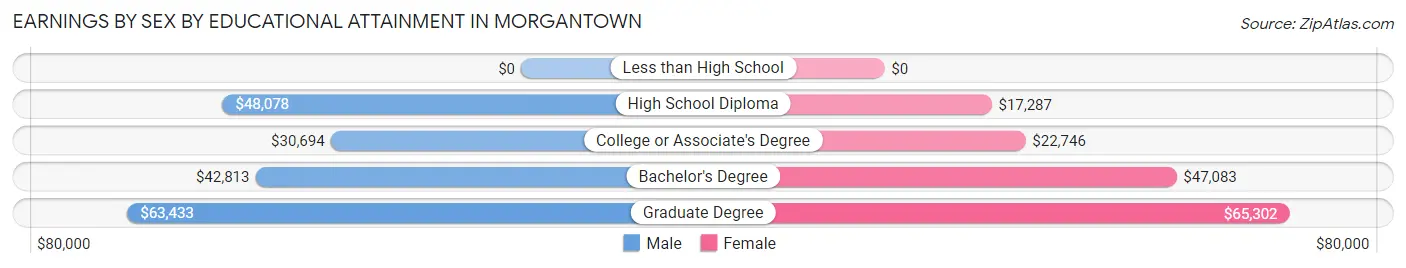
Earnings by Sex by Educational Attainment in Morgantown
Average earnings in Morgantown are $41,655 for men and $39,346 for women, a difference of 5.5%. Men with an educational attainment of graduate degree enjoy the highest average annual earnings of $63,433, while those with college or associate's degree education earn the least with $30,694. Women with an educational attainment of graduate degree earn the most with the average annual earnings of $65,302, while those with high school diploma education have the smallest earnings of $17,287.
| Educational Attainment | Male Income | Female Income |
| Less than High School | - | - |
| High School Diploma | $48,078 | $17,287 |
| College or Associate's Degree | $30,694 | $22,746 |
| Bachelor's Degree | $42,813 | $47,083 |
| Graduate Degree | $63,433 | $65,302 |
| Total | $41,655 | $39,346 |
Family Income in Morgantown
Family Income Brackets in Morgantown
According to the Morgantown family income data, there are 1,208 families falling into the $100,000 to $149,999 income range, which is the most common income bracket and makes up 25.1% of all families. Conversely, the $35,000 to $49,999 income bracket is the least frequent group with only 183 families (3.8%) belonging to this category.
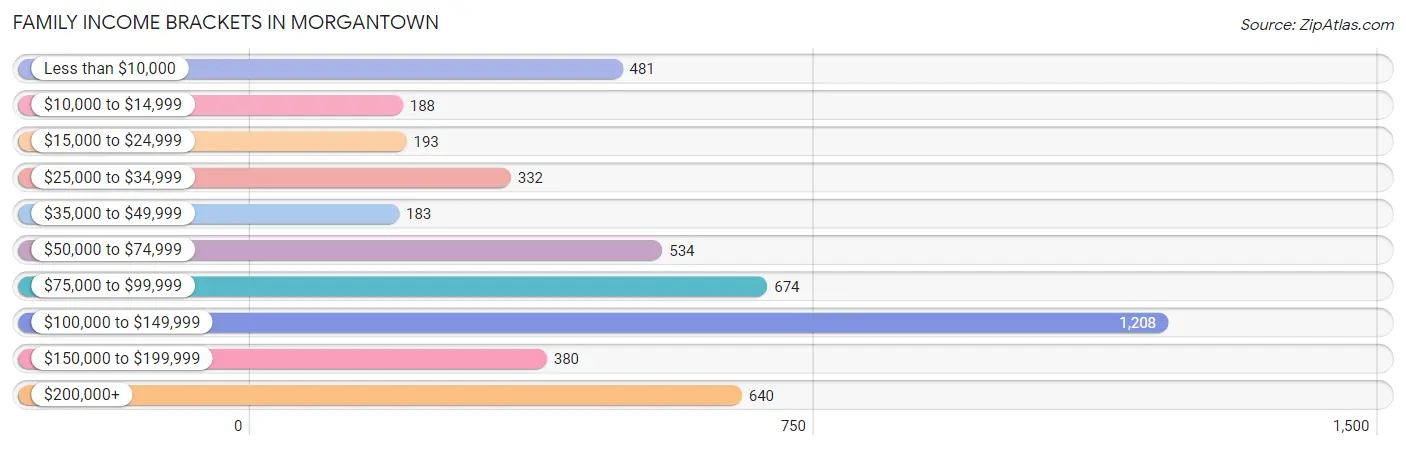
| Income Bracket | # Families | % Families |
| Less than $10,000 | 481 | 10.0% |
| $10,000 to $14,999 | 188 | 3.9% |
| $15,000 to $24,999 | 193 | 4.0% |
| $25,000 to $34,999 | 332 | 6.9% |
| $35,000 to $49,999 | 183 | 3.8% |
| $50,000 to $74,999 | 534 | 11.1% |
| $75,000 to $99,999 | 674 | 14.0% |
| $100,000 to $149,999 | 1,208 | 25.1% |
| $150,000 to $199,999 | 380 | 7.9% |
| $200,000+ | 640 | 13.3% |
Family Income by Famaliy Size in Morgantown
5-person families (209 | 4.3%) account for the highest median family income in Morgantown with $135,284 per family, while 2-person families (2,723 | 56.6%) have the highest median income of $40,262 per family member.
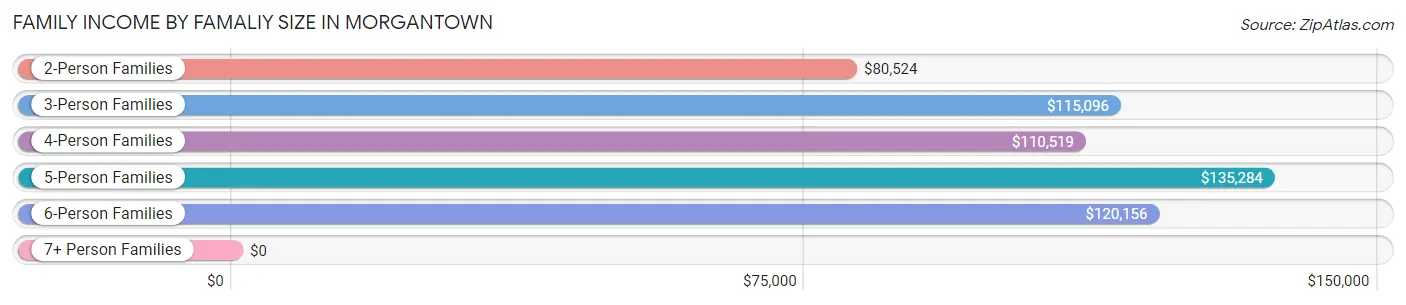
| Income Bracket | # Families | Median Income |
| 2-Person Families | 2,723 (56.6%) | $80,524 |
| 3-Person Families | 1,040 (21.6%) | $115,096 |
| 4-Person Families | 759 (15.8%) | $110,519 |
| 5-Person Families | 209 (4.3%) | $135,284 |
| 6-Person Families | 71 (1.5%) | $120,156 |
| 7+ Person Families | 12 (0.3%) | $0 |
| Total | 4,814 (100.0%) | $91,118 |
Family Income by Number of Earners in Morgantown
The median family income in Morgantown is $91,118, with families comprising 3+ earners (352) having the highest median family income of $165,595, while families with no earners (639) have the lowest median family income of $58,313, accounting for 7.3% and 13.3% of families, respectively.
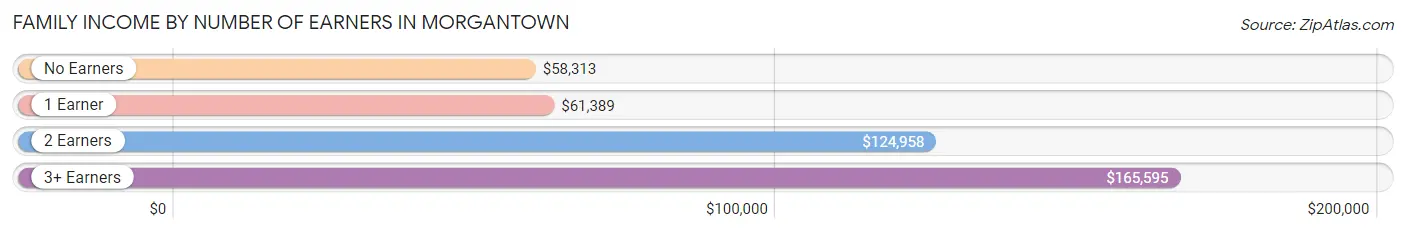
| Number of Earners | # Families | Median Income |
| No Earners | 639 (13.3%) | $58,313 |
| 1 Earner | 1,618 (33.6%) | $61,389 |
| 2 Earners | 2,205 (45.8%) | $124,958 |
| 3+ Earners | 352 (7.3%) | $165,595 |
| Total | 4,814 (100.0%) | $91,118 |
Household Income in Morgantown
Household Income Brackets in Morgantown
With 2,263 households falling in the category, the less than $10,000 income range is the most frequent in Morgantown, accounting for 18.8% of all households. In contrast, only 542 households (4.5%) fall into the $150,000 to $199,999 income bracket, making it the least populous group.
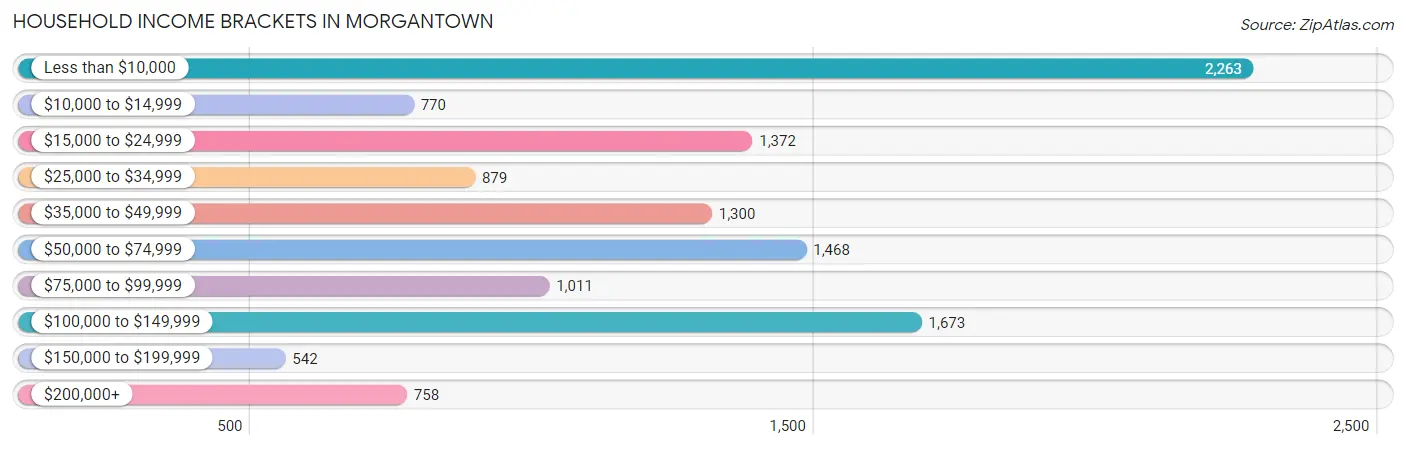
| Income Bracket | # Households | % Households |
| Less than $10,000 | 2,263 | 18.8% |
| $10,000 to $14,999 | 770 | 6.4% |
| $15,000 to $24,999 | 1,372 | 11.4% |
| $25,000 to $34,999 | 879 | 7.3% |
| $35,000 to $49,999 | 1,300 | 10.8% |
| $50,000 to $74,999 | 1,468 | 12.2% |
| $75,000 to $99,999 | 1,011 | 8.4% |
| $100,000 to $149,999 | 1,673 | 13.9% |
| $150,000 to $199,999 | 542 | 4.5% |
| $200,000+ | 758 | 6.3% |
Household Income by Householder Age in Morgantown
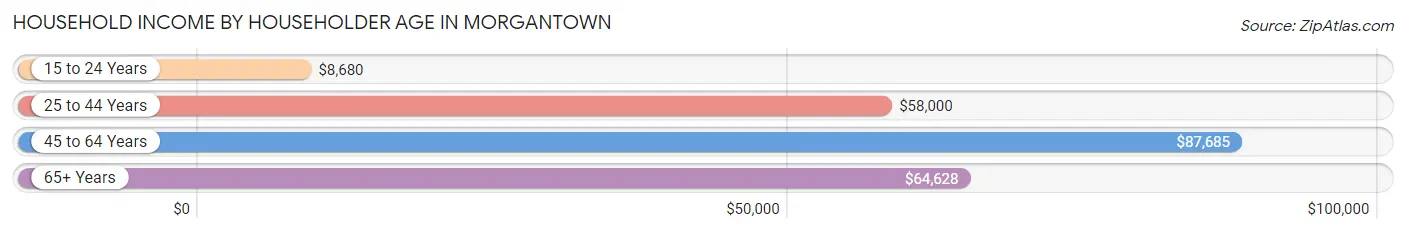
The median household income in Morgantown is $41,103, with the highest median household income of $87,685 found in the 45 to 64 years age bracket for the primary householder. A total of 2,776 households (23.1%) fall into this category. Meanwhile, the 15 to 24 years age bracket for the primary householder has the lowest median household income of $8,680, with 3,528 households (29.3%) in this group.
| Income Bracket | # Households | Median Income |
| 15 to 24 Years | 3,528 (29.3%) | $8,680 |
| 25 to 44 Years | 3,616 (30.0%) | $58,000 |
| 45 to 64 Years | 2,776 (23.1%) | $87,685 |
| 65+ Years | 2,115 (17.6%) | $64,628 |
| Total | 12,035 (100.0%) | $41,103 |
Poverty in Morgantown
Income Below Poverty by Sex and Age in Morgantown
With 34.3% poverty level for males and 34.4% for females among the residents of Morgantown, 18 to 24 year old males and 18 to 24 year old females are the most vulnerable to poverty, with 3,237 males (73.9%) and 2,550 females (70.7%) in their respective age groups living below the poverty level.
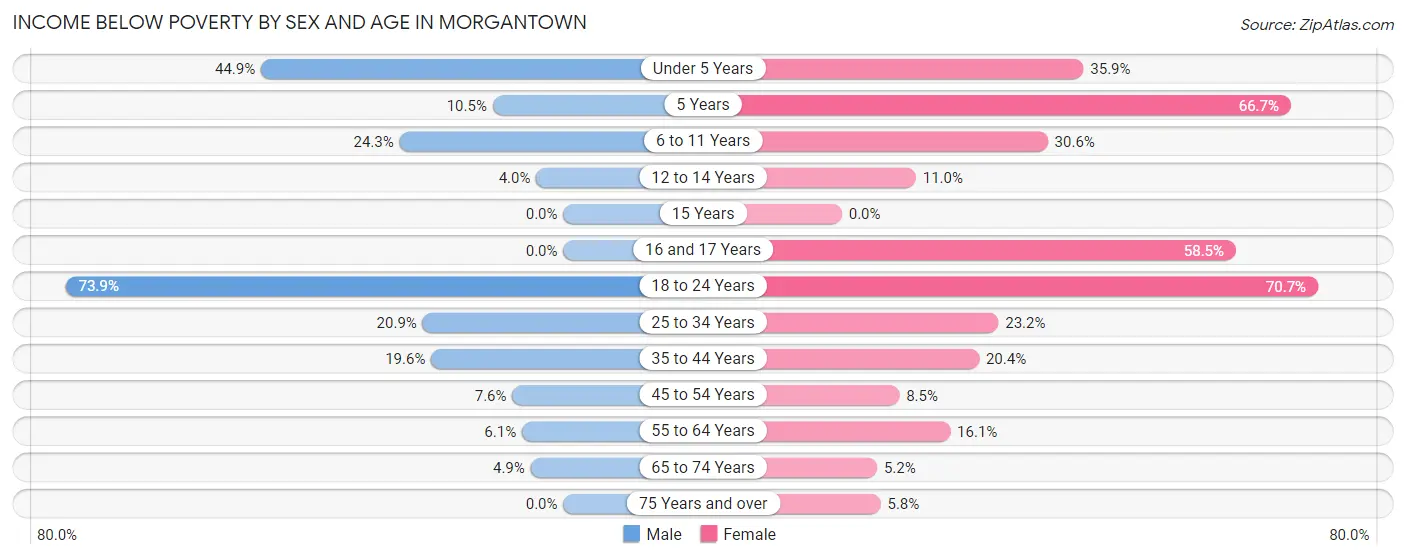
| Age Bracket | Male | Female |
| Under 5 Years | 268 (44.9%) | 151 (35.9%) |
| 5 Years | 15 (10.5%) | 30 (66.7%) |
| 6 to 11 Years | 145 (24.3%) | 144 (30.6%) |
| 12 to 14 Years | 10 (4.0%) | 21 (11.0%) |
| 15 Years | 0 (0.0%) | 0 (0.0%) |
| 16 and 17 Years | 0 (0.0%) | 55 (58.5%) |
| 18 to 24 Years | 3,237 (73.9%) | 2,550 (70.7%) |
| 25 to 34 Years | 502 (20.9%) | 432 (23.2%) |
| 35 to 44 Years | 286 (19.6%) | 212 (20.4%) |
| 45 to 54 Years | 89 (7.6%) | 83 (8.5%) |
| 55 to 64 Years | 69 (6.1%) | 214 (16.1%) |
| 65 to 74 Years | 47 (4.9%) | 49 (5.2%) |
| 75 Years and over | 0 (0.0%) | 31 (5.8%) |
| Total | 4,668 (34.3%) | 3,972 (34.4%) |
Income Above Poverty by Sex and Age in Morgantown
According to the poverty statistics in Morgantown, males aged 15 years and females aged 15 years are the age groups that are most secure financially, with 100.0% of males and 100.0% of females in these age groups living above the poverty line.
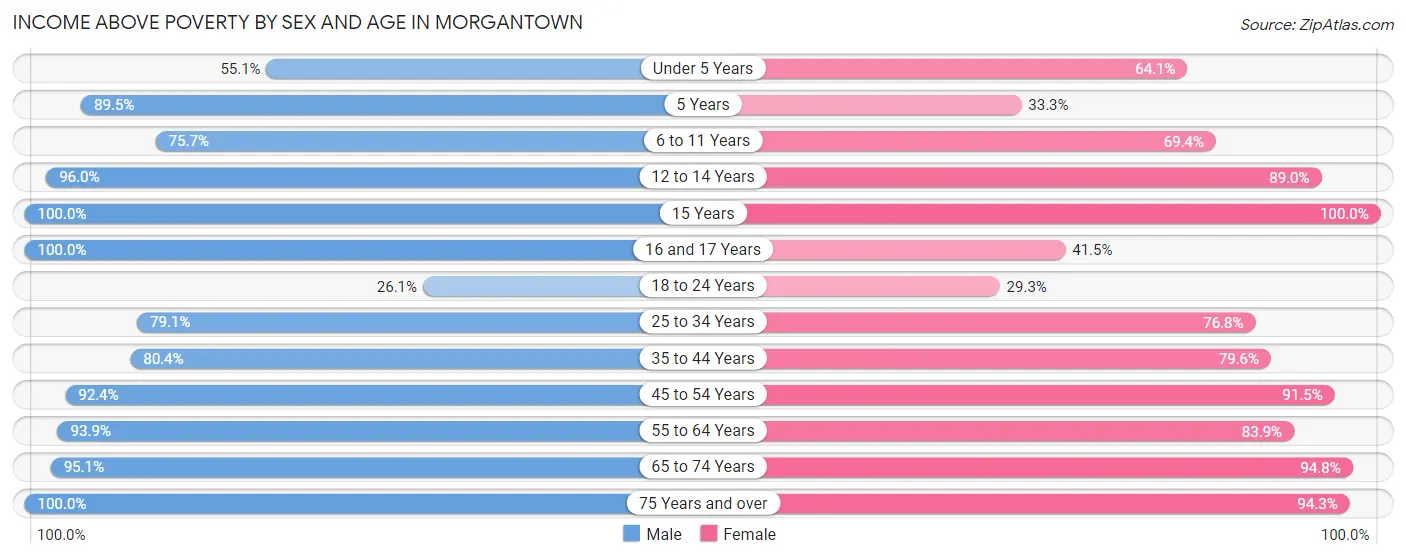
| Age Bracket | Male | Female |
| Under 5 Years | 329 (55.1%) | 270 (64.1%) |
| 5 Years | 128 (89.5%) | 15 (33.3%) |
| 6 to 11 Years | 451 (75.7%) | 327 (69.4%) |
| 12 to 14 Years | 239 (96.0%) | 170 (89.0%) |
| 15 Years | 33 (100.0%) | 30 (100.0%) |
| 16 and 17 Years | 91 (100.0%) | 39 (41.5%) |
| 18 to 24 Years | 1,142 (26.1%) | 1,057 (29.3%) |
| 25 to 34 Years | 1,901 (79.1%) | 1,427 (76.8%) |
| 35 to 44 Years | 1,172 (80.4%) | 829 (79.6%) |
| 45 to 54 Years | 1,086 (92.4%) | 890 (91.5%) |
| 55 to 64 Years | 1,055 (93.9%) | 1,116 (83.9%) |
| 65 to 74 Years | 921 (95.1%) | 889 (94.8%) |
| 75 Years and over | 381 (100.0%) | 508 (94.3%) |
| Total | 8,929 (65.7%) | 7,567 (65.6%) |
Income Below Poverty Among Married-Couple Families in Morgantown
The poverty statistics for married-couple families in Morgantown show that 4.7% or 154 of the total 3,303 families live below the poverty line. Families with 3 or 4 children have the highest poverty rate of 17.1%, comprising of 37 families. On the other hand, families with no children have the lowest poverty rate of 2.6%, which includes 58 families.
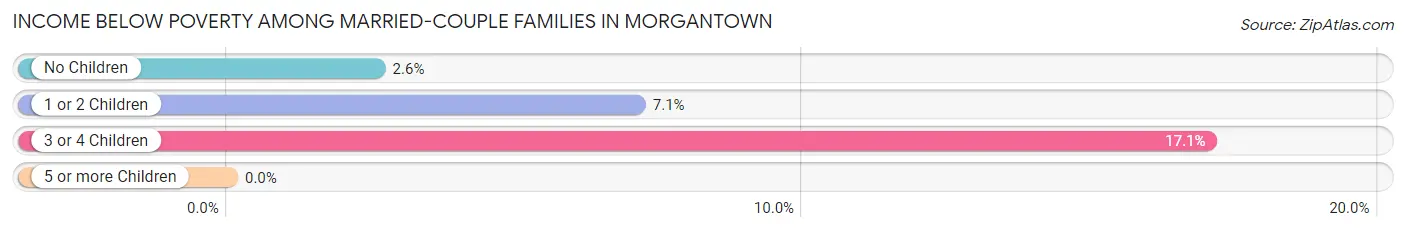
| Children | Above Poverty | Below Poverty |
| No Children | 2,197 (97.4%) | 58 (2.6%) |
| 1 or 2 Children | 772 (92.9%) | 59 (7.1%) |
| 3 or 4 Children | 180 (83.0%) | 37 (17.1%) |
| 5 or more Children | 0 (0.0%) | 0 (0.0%) |
| Total | 3,149 (95.3%) | 154 (4.7%) |
Income Below Poverty Among Single-Parent Households in Morgantown
According to the poverty data in Morgantown, 49.4% or 350 single-father households and 38.5% or 309 single-mother households are living below the poverty line. Among single-father households, those with 3 or 4 children have the highest poverty rate, with 70 households (100.0%) experiencing poverty. Likewise, among single-mother households, those with 3 or 4 children have the highest poverty rate, with 108 households (93.1%) falling below the poverty line.
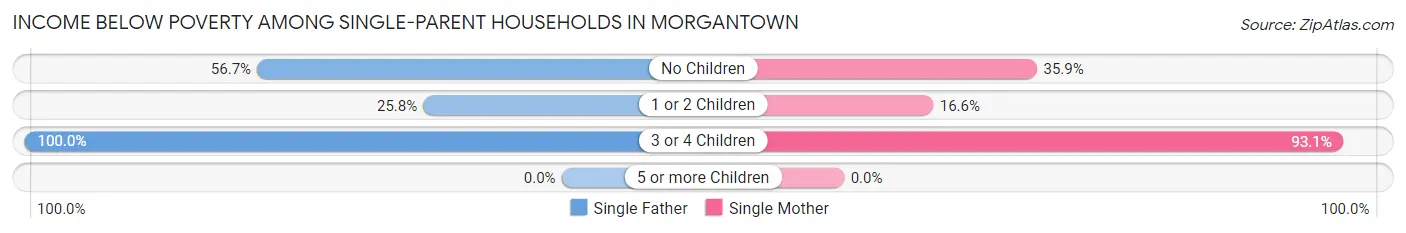
| Children | Single Father | Single Mother |
| No Children | 215 (56.7%) | 162 (35.9%) |
| 1 or 2 Children | 65 (25.8%) | 39 (16.6%) |
| 3 or 4 Children | 70 (100.0%) | 108 (93.1%) |
| 5 or more Children | 0 (0.0%) | 0 (0.0%) |
| Total | 350 (49.4%) | 309 (38.5%) |
Income Below Poverty Among Married-Couple vs Single-Parent Households in Morgantown
The poverty data for Morgantown shows that 154 of the married-couple family households (4.7%) and 659 of the single-parent households (43.6%) are living below the poverty level. Within the married-couple family households, those with 3 or 4 children have the highest poverty rate, with 37 households (17.1%) falling below the poverty line. Among the single-parent households, those with 3 or 4 children have the highest poverty rate, with 178 household (95.7%) living below poverty.
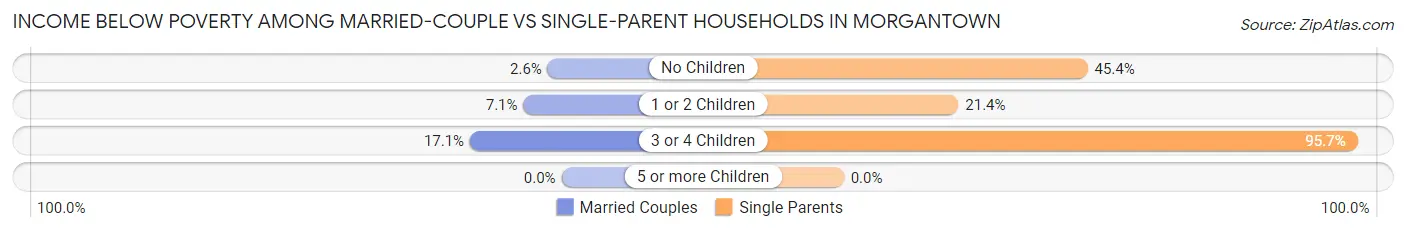
| Children | Married-Couple Families | Single-Parent Households |
| No Children | 58 (2.6%) | 377 (45.4%) |
| 1 or 2 Children | 59 (7.1%) | 104 (21.4%) |
| 3 or 4 Children | 37 (17.1%) | 178 (95.7%) |
| 5 or more Children | 0 (0.0%) | 0 (0.0%) |
| Total | 154 (4.7%) | 659 (43.6%) |
Race in Morgantown
The most populous races in Morgantown are White / Caucasian (26,175 | 86.6%), Two or more Races (1,442 | 4.8%), and Black / African American (1,257 | 4.2%).
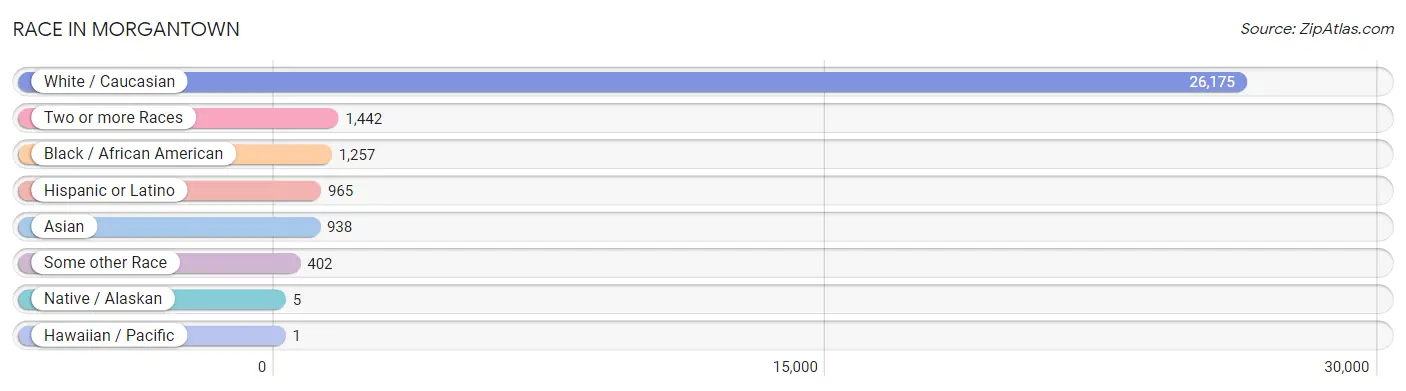
| Race | # Population | % Population |
| Asian | 938 | 3.1% |
| Black / African American | 1,257 | 4.2% |
| Hawaiian / Pacific | 1 | 0.0% |
| Hispanic or Latino | 965 | 3.2% |
| Native / Alaskan | 5 | 0.0% |
| White / Caucasian | 26,175 | 86.6% |
| Two or more Races | 1,442 | 4.8% |
| Some other Race | 402 | 1.3% |
| Total | 30,220 | 100.0% |
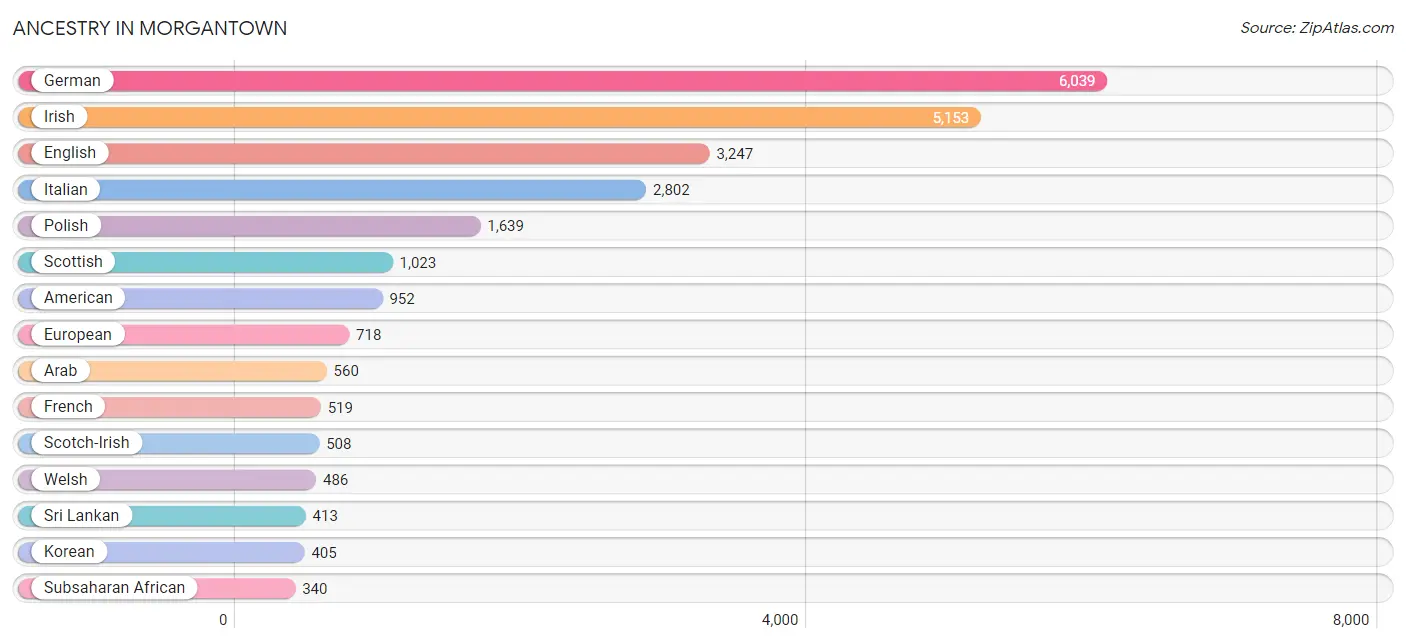
Ancestry in Morgantown
The most populous ancestries reported in Morgantown are German (6,039 | 20.0%), Irish (5,153 | 17.1%), English (3,247 | 10.7%), Italian (2,802 | 9.3%), and Polish (1,639 | 5.4%), together accounting for 62.5% of all Morgantown residents.
| Ancestry | # Population | % Population |
| African | 81 | 0.3% |
| American | 952 | 3.2% |
| Apache | 34 | 0.1% |
| Arab | 560 | 1.8% |
| Argentinean | 55 | 0.2% |
| Armenian | 21 | 0.1% |
| Austrian | 16 | 0.1% |
| Belgian | 31 | 0.1% |
| Bhutanese | 199 | 0.7% |
| Bolivian | 19 | 0.1% |
| British | 193 | 0.6% |
| Burmese | 40 | 0.1% |
| Canadian | 15 | 0.1% |
| Central American | 312 | 1.0% |
| Central American Indian | 26 | 0.1% |
| Cherokee | 67 | 0.2% |
| Colombian | 53 | 0.2% |
| Creek | 8 | 0.0% |
| Croatian | 19 | 0.1% |
| Cuban | 85 | 0.3% |
| Czech | 197 | 0.6% |
| Czechoslovakian | 23 | 0.1% |
| Danish | 62 | 0.2% |
| Dutch | 322 | 1.1% |
| Eastern European | 70 | 0.2% |
| Egyptian | 8 | 0.0% |
| English | 3,247 | 10.7% |
| European | 718 | 2.4% |
| Finnish | 147 | 0.5% |
| French | 519 | 1.7% |
| French American Indian | 15 | 0.1% |
| French Canadian | 135 | 0.4% |
| German | 6,039 | 20.0% |
| Greek | 158 | 0.5% |
| Guamanian / Chamorro | 47 | 0.2% |
| Haitian | 27 | 0.1% |
| Honduran | 124 | 0.4% |
| Hungarian | 106 | 0.4% |
| Indian (Asian) | 268 | 0.9% |
| Iranian | 147 | 0.5% |
| Irish | 5,153 | 17.1% |
| Italian | 2,802 | 9.3% |
| Jamaican | 83 | 0.3% |
| Japanese | 1 | 0.0% |
| Jordanian | 6 | 0.0% |
| Kenyan | 88 | 0.3% |
| Korean | 405 | 1.3% |
| Lebanese | 98 | 0.3% |
| Lithuanian | 100 | 0.3% |
| Lumbee | 5 | 0.0% |
| Luxembourger | 9 | 0.0% |
| Mexican | 164 | 0.5% |
| Nigerian | 125 | 0.4% |
| Northern European | 43 | 0.1% |
| Norwegian | 179 | 0.6% |
| Palestinian | 19 | 0.1% |
| Panamanian | 55 | 0.2% |
| Pennsylvania German | 12 | 0.0% |
| Peruvian | 53 | 0.2% |
| Polish | 1,639 | 5.4% |
| Portuguese | 51 | 0.2% |
| Puerto Rican | 111 | 0.4% |
| Romanian | 20 | 0.1% |
| Russian | 201 | 0.7% |
| Salvadoran | 133 | 0.4% |
| Scandinavian | 119 | 0.4% |
| Scotch-Irish | 508 | 1.7% |
| Scottish | 1,023 | 3.4% |
| Serbian | 26 | 0.1% |
| Slavic | 38 | 0.1% |
| Slovak | 191 | 0.6% |
| Slovene | 7 | 0.0% |
| South African | 42 | 0.1% |
| South American | 192 | 0.6% |
| Spaniard | 38 | 0.1% |
| Spanish | 38 | 0.1% |
| Sri Lankan | 413 | 1.4% |
| Subsaharan African | 340 | 1.1% |
| Swedish | 232 | 0.8% |
| Swiss | 103 | 0.3% |
| Syrian | 25 | 0.1% |
| Thai | 47 | 0.2% |
| Turkish | 55 | 0.2% |
| Ukrainian | 29 | 0.1% |
| Venezuelan | 12 | 0.0% |
| Welsh | 486 | 1.6% |
| Yugoslavian | 41 | 0.1% |
| Zimbabwean | 4 | 0.0% | View All 88 Rows |
Immigrants in Morgantown
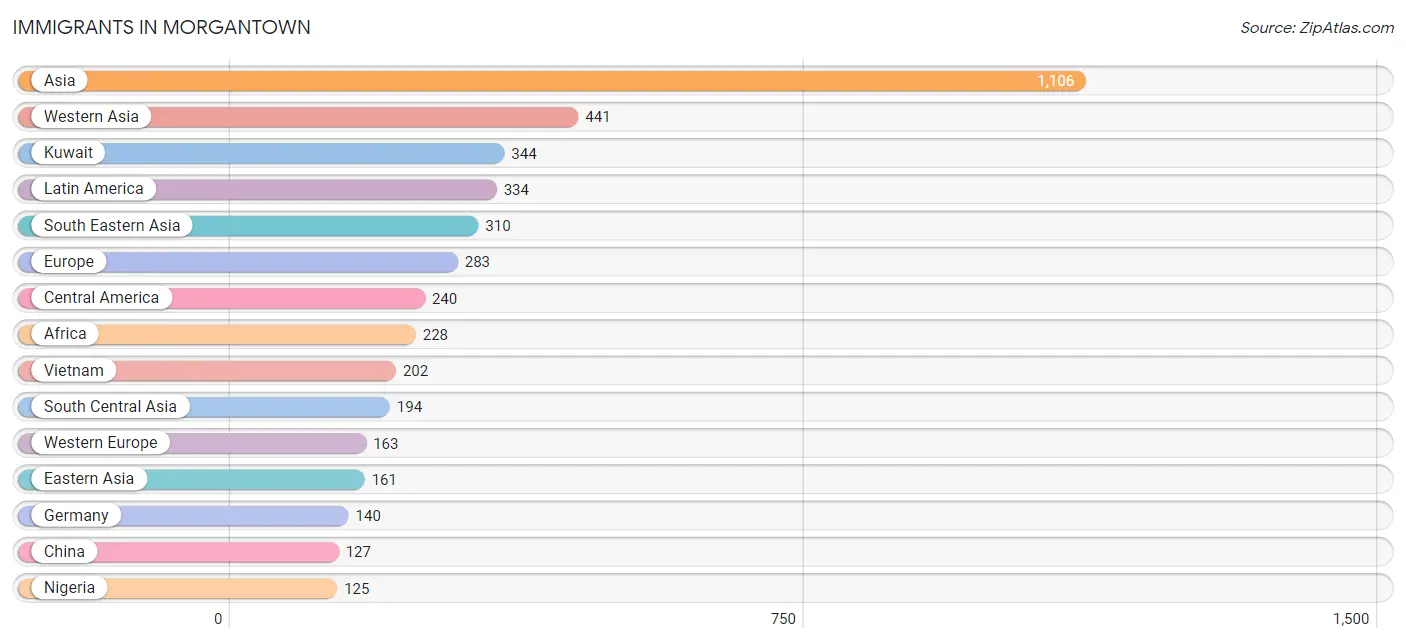
The most numerous immigrant groups reported in Morgantown came from Asia (1,106 | 3.7%), Western Asia (441 | 1.5%), Kuwait (344 | 1.1%), Latin America (334 | 1.1%), and South Eastern Asia (310 | 1.0%), together accounting for 8.4% of all Morgantown residents.
| Immigration Origin | # Population | % Population |
| Africa | 228 | 0.7% |
| Asia | 1,106 | 3.7% |
| Bolivia | 19 | 0.1% |
| Brazil | 13 | 0.0% |
| Caribbean | 1 | 0.0% |
| Central America | 240 | 0.8% |
| China | 127 | 0.4% |
| Colombia | 37 | 0.1% |
| Costa Rica | 18 | 0.1% |
| Eastern Africa | 57 | 0.2% |
| Eastern Asia | 161 | 0.5% |
| Eastern Europe | 59 | 0.2% |
| Egypt | 8 | 0.0% |
| El Salvador | 90 | 0.3% |
| Europe | 283 | 0.9% |
| France | 8 | 0.0% |
| Germany | 140 | 0.5% |
| Greece | 29 | 0.1% |
| Honduras | 105 | 0.4% |
| India | 100 | 0.3% |
| Iran | 62 | 0.2% |
| Italy | 26 | 0.1% |
| Jamaica | 1 | 0.0% |
| Japan | 34 | 0.1% |
| Jordan | 6 | 0.0% |
| Kazakhstan | 5 | 0.0% |
| Kenya | 57 | 0.2% |
| Kuwait | 344 | 1.1% |
| Latin America | 334 | 1.1% |
| Mexico | 27 | 0.1% |
| Nepal | 27 | 0.1% |
| Netherlands | 15 | 0.1% |
| Nigeria | 125 | 0.4% |
| Northern Africa | 8 | 0.0% |
| Northern Europe | 6 | 0.0% |
| Peru | 12 | 0.0% |
| Philippines | 108 | 0.4% |
| Russia | 42 | 0.1% |
| Saudi Arabia | 42 | 0.1% |
| Serbia | 17 | 0.1% |
| South Africa | 38 | 0.1% |
| South America | 93 | 0.3% |
| South Central Asia | 194 | 0.6% |
| South Eastern Asia | 310 | 1.0% |
| Southern Europe | 55 | 0.2% |
| Taiwan | 38 | 0.1% |
| Venezuela | 12 | 0.0% |
| Vietnam | 202 | 0.7% |
| Western Africa | 125 | 0.4% |
| Western Asia | 441 | 1.5% |
| Western Europe | 163 | 0.5% | View All 51 Rows |
Sex and Age in Morgantown
Sex and Age in Morgantown
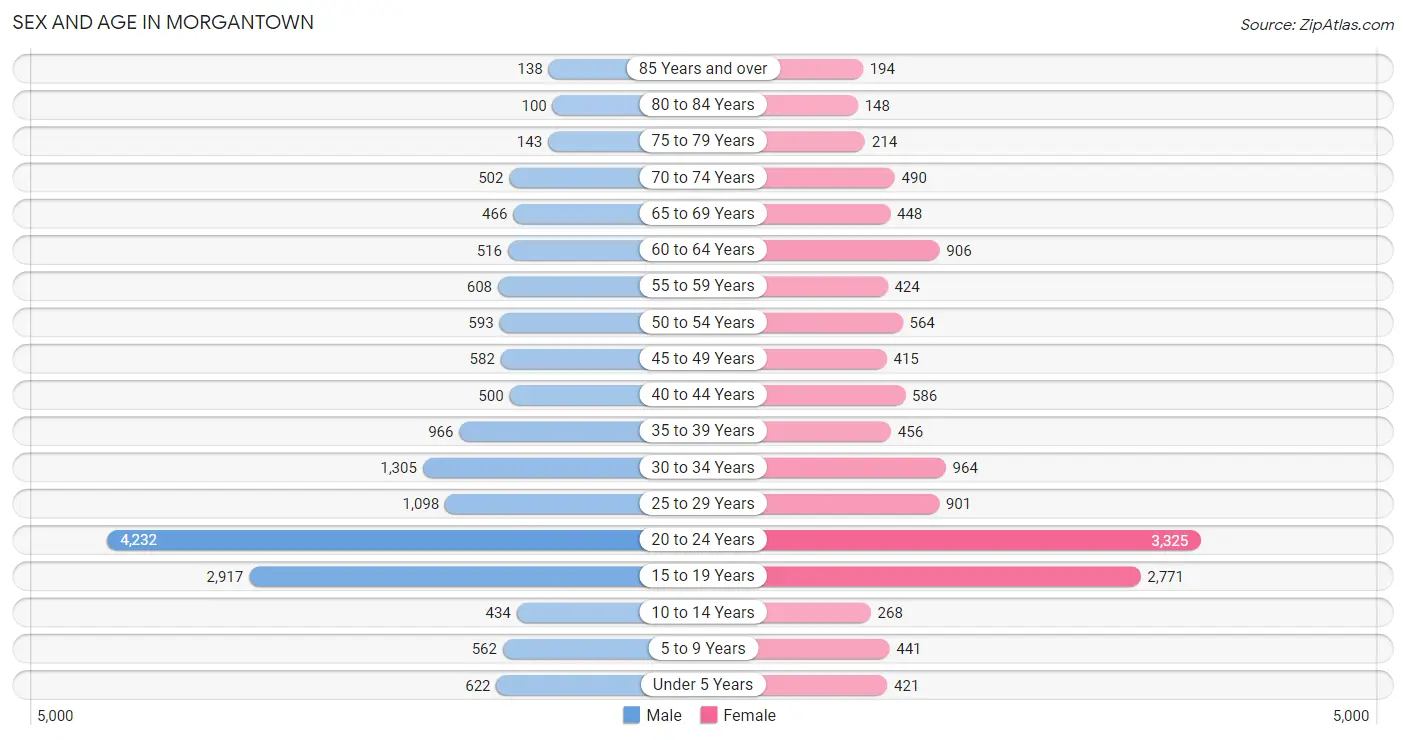
The most populous age groups in Morgantown are 20 to 24 Years (4,232 | 26.0%) for men and 20 to 24 Years (3,325 | 23.9%) for women.
| Age Bracket | Male | Female |
| Under 5 Years | 622 (3.8%) | 421 (3.0%) |
| 5 to 9 Years | 562 (3.5%) | 441 (3.2%) |
| 10 to 14 Years | 434 (2.7%) | 268 (1.9%) |
| 15 to 19 Years | 2,917 (17.9%) | 2,771 (19.9%) |
| 20 to 24 Years | 4,232 (26.0%) | 3,325 (23.9%) |
| 25 to 29 Years | 1,098 (6.7%) | 901 (6.5%) |
| 30 to 34 Years | 1,305 (8.0%) | 964 (6.9%) |
| 35 to 39 Years | 966 (5.9%) | 456 (3.3%) |
| 40 to 44 Years | 500 (3.1%) | 586 (4.2%) |
| 45 to 49 Years | 582 (3.6%) | 415 (3.0%) |
| 50 to 54 Years | 593 (3.6%) | 564 (4.1%) |
| 55 to 59 Years | 608 (3.7%) | 424 (3.0%) |
| 60 to 64 Years | 516 (3.2%) | 906 (6.5%) |
| 65 to 69 Years | 466 (2.9%) | 448 (3.2%) |
| 70 to 74 Years | 502 (3.1%) | 490 (3.5%) |
| 75 to 79 Years | 143 (0.9%) | 214 (1.5%) |
| 80 to 84 Years | 100 (0.6%) | 148 (1.1%) |
| 85 Years and over | 138 (0.9%) | 194 (1.4%) |
| Total | 16,284 (100.0%) | 13,936 (100.0%) |
Families and Households in Morgantown
Median Family Size in Morgantown
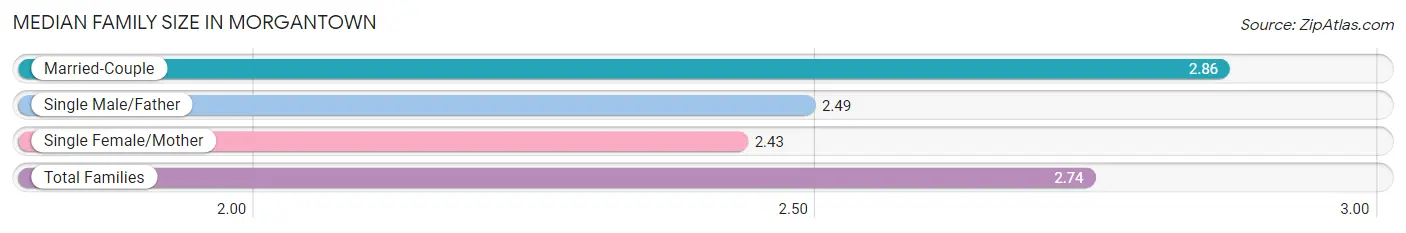
The median family size in Morgantown is 2.74 persons per family, with married-couple families (3,303 | 68.6%) accounting for the largest median family size of 2.86 persons per family. On the other hand, single female/mother families (802 | 16.7%) represent the smallest median family size with 2.43 persons per family.
| Family Type | # Families | Family Size |
| Married-Couple | 3,303 (68.6%) | 2.86 |
| Single Male/Father | 709 (14.7%) | 2.49 |
| Single Female/Mother | 802 (16.7%) | 2.43 |
| Total Families | 4,814 (100.0%) | 2.74 |
Median Household Size in Morgantown
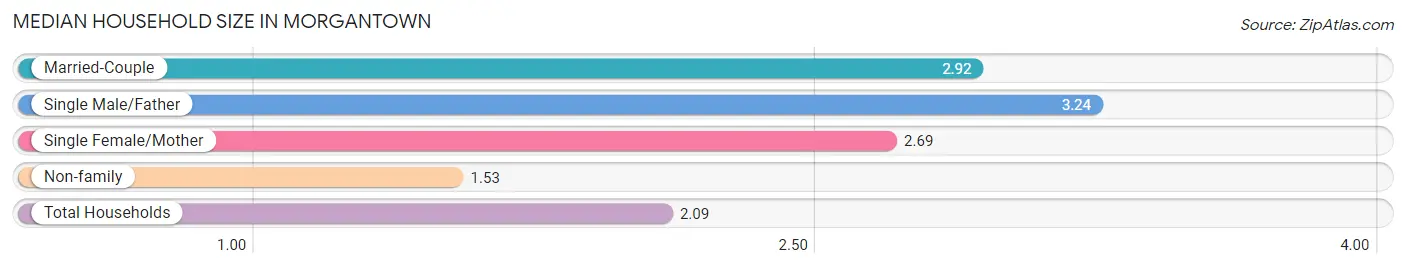
The median household size in Morgantown is 2.09 persons per household, with single male/father households (709 | 5.9%) accounting for the largest median household size of 3.24 persons per household. non-family households (7,221 | 60.0%) represent the smallest median household size with 1.53 persons per household.
| Household Type | # Households | Household Size |
| Married-Couple | 3,303 (27.4%) | 2.92 |
| Single Male/Father | 709 (5.9%) | 3.24 |
| Single Female/Mother | 802 (6.7%) | 2.69 |
| Non-family | 7,221 (60.0%) | 1.53 |
| Total Households | 12,035 (100.0%) | 2.09 |
Household Size by Marriage Status in Morgantown
Out of a total of 12,035 households in Morgantown, 4,814 (40.0%) are family households, while 7,221 (60.0%) are nonfamily households. The most numerous type of family households are 2-person households, comprising 2,237, and the most common type of nonfamily households are 1-person households, comprising 4,562.
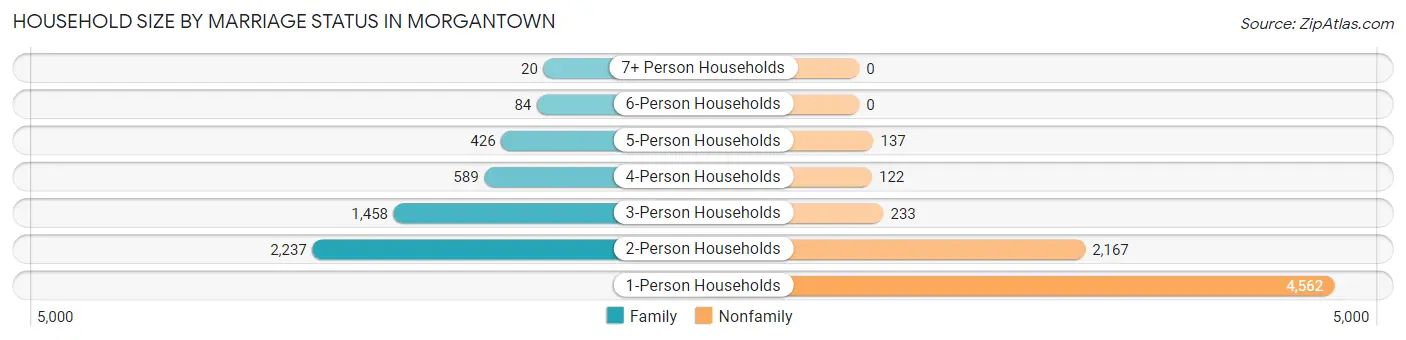
| Household Size | Family Households | Nonfamily Households |
| 1-Person Households | - | 4,562 (37.9%) |
| 2-Person Households | 2,237 (18.6%) | 2,167 (18.0%) |
| 3-Person Households | 1,458 (12.1%) | 233 (1.9%) |
| 4-Person Households | 589 (4.9%) | 122 (1.0%) |
| 5-Person Households | 426 (3.5%) | 137 (1.1%) |
| 6-Person Households | 84 (0.7%) | 0 (0.0%) |
| 7+ Person Households | 20 (0.2%) | 0 (0.0%) |
| Total | 4,814 (40.0%) | 7,221 (60.0%) |
Female Fertility in Morgantown
Fertility by Age in Morgantown
Average fertility rate in Morgantown is 39.0 births per 1,000 women. Women in the age bracket of 20 to 34 years have the highest fertility rate with 50.0 births per 1,000 women. Women in the age bracket of 20 to 34 years acount for 70.4% of all women with births.
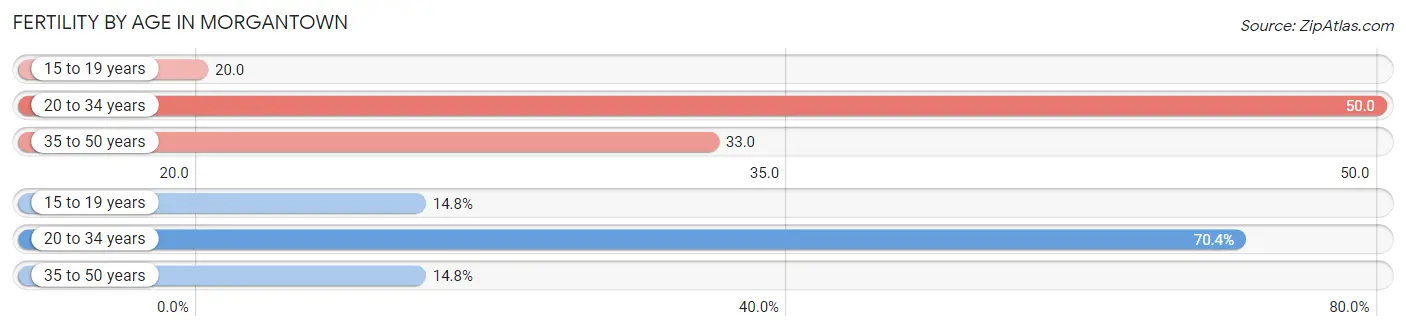
| Age Bracket | Women with Births | Births / 1,000 Women |
| 15 to 19 years | 55 (14.8%) | 20.0 |
| 20 to 34 years | 262 (70.4%) | 50.0 |
| 35 to 50 years | 55 (14.8%) | 33.0 |
| Total | 372 (100.0%) | 39.0 |
Fertility by Age by Marriage Status in Morgantown
41.4% of women with births (372) in Morgantown are married. The highest percentage of unmarried women with births falls into 15 to 19 years age bracket with 100.0% of them unmarried at the time of birth, while the lowest percentage of unmarried women with births belong to 35 to 50 years age bracket with 49.1% of them unmarried.
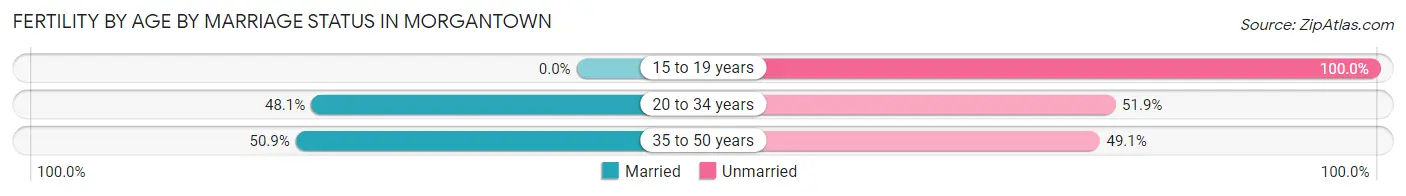
| Age Bracket | Married | Unmarried |
| 15 to 19 years | 0 (0.0%) | 55 (100.0%) |
| 20 to 34 years | 126 (48.1%) | 136 (51.9%) |
| 35 to 50 years | 28 (50.9%) | 27 (49.1%) |
| Total | 154 (41.4%) | 218 (58.6%) |
Fertility by Education in Morgantown
Average fertility rate in Morgantown is 39.0 births per 1,000 women. Women with the education attainment of less than high school have the highest fertility rate of 227.0 births per 1,000 women, while women with the education attainment of college or associate's degree have the lowest fertility at 15.0 births per 1,000 women. Women with the education attainment of bachelor's degree represent 24.7% of all women with births.
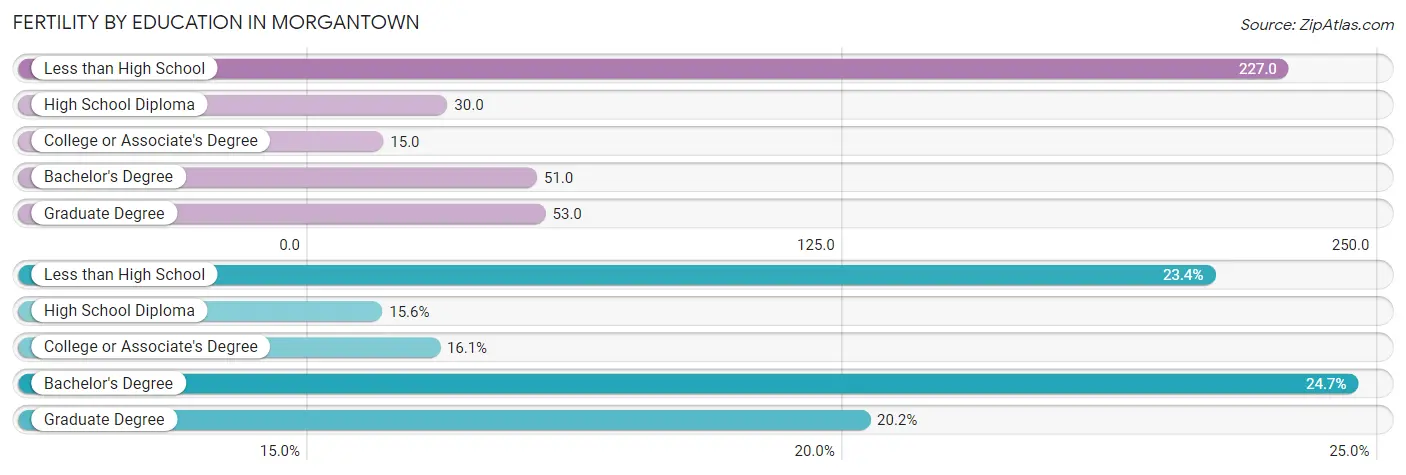
| Educational Attainment | Women with Births | Births / 1,000 Women |
| Less than High School | 87 (23.4%) | 227.0 |
| High School Diploma | 58 (15.6%) | 30.0 |
| College or Associate's Degree | 60 (16.1%) | 15.0 |
| Bachelor's Degree | 92 (24.7%) | 51.0 |
| Graduate Degree | 75 (20.2%) | 53.0 |
| Total | 372 (100.0%) | 39.0 |
Fertility by Education by Marriage Status in Morgantown
58.6% of women with births in Morgantown are unmarried. Women with the educational attainment of graduate degree are most likely to be married with 100.0% of them married at childbirth, while women with the educational attainment of less than high school are least likely to be married with 100.0% of them unmarried at childbirth.
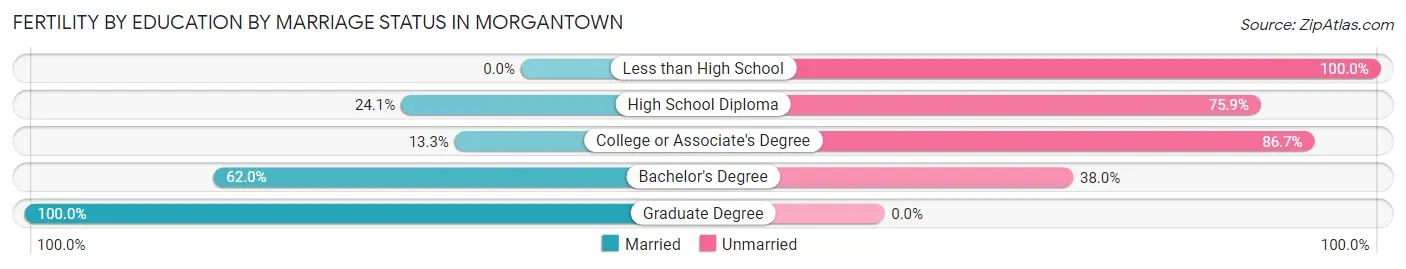
| Educational Attainment | Married | Unmarried |
| Less than High School | 0 (0.0%) | 87 (100.0%) |
| High School Diploma | 14 (24.1%) | 44 (75.9%) |
| College or Associate's Degree | 8 (13.3%) | 52 (86.7%) |
| Bachelor's Degree | 57 (62.0%) | 35 (38.0%) |
| Graduate Degree | 75 (100.0%) | 0 (0.0%) |
| Total | 154 (41.4%) | 218 (58.6%) |
Employment Characteristics in Morgantown
Employment by Class of Employer in Morgantown
Among the 14,075 employed individuals in Morgantown, private company employees (7,914 | 56.2%), state government employees (2,597 | 18.4%), and not-for-profit organizations (1,718 | 12.2%) make up the most common classes of employment.
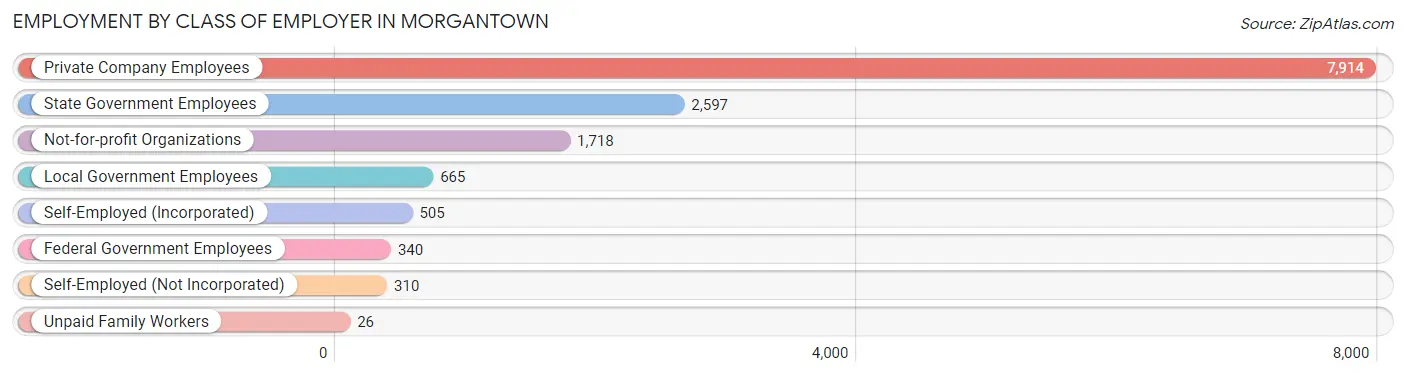
| Employer Class | # Employees | % Employees |
| Private Company Employees | 7,914 | 56.2% |
| Self-Employed (Incorporated) | 505 | 3.6% |
| Self-Employed (Not Incorporated) | 310 | 2.2% |
| Not-for-profit Organizations | 1,718 | 12.2% |
| Local Government Employees | 665 | 4.7% |
| State Government Employees | 2,597 | 18.4% |
| Federal Government Employees | 340 | 2.4% |
| Unpaid Family Workers | 26 | 0.2% |
| Total | 14,075 | 100.0% |
Employment Status by Age in Morgantown
According to the labor force statistics for Morgantown, out of the total population over 16 years of age (27,409), 57.9% or 15,870 individuals are in the labor force, with 9.9% or 1,571 of them unemployed. The age group with the highest labor force participation rate is 35 to 44 years, with 83.7% or 2,099 individuals in the labor force. Within the labor force, the 16 to 19 years age range has the highest percentage of unemployed individuals, with 40.4% or 748 of them being unemployed.
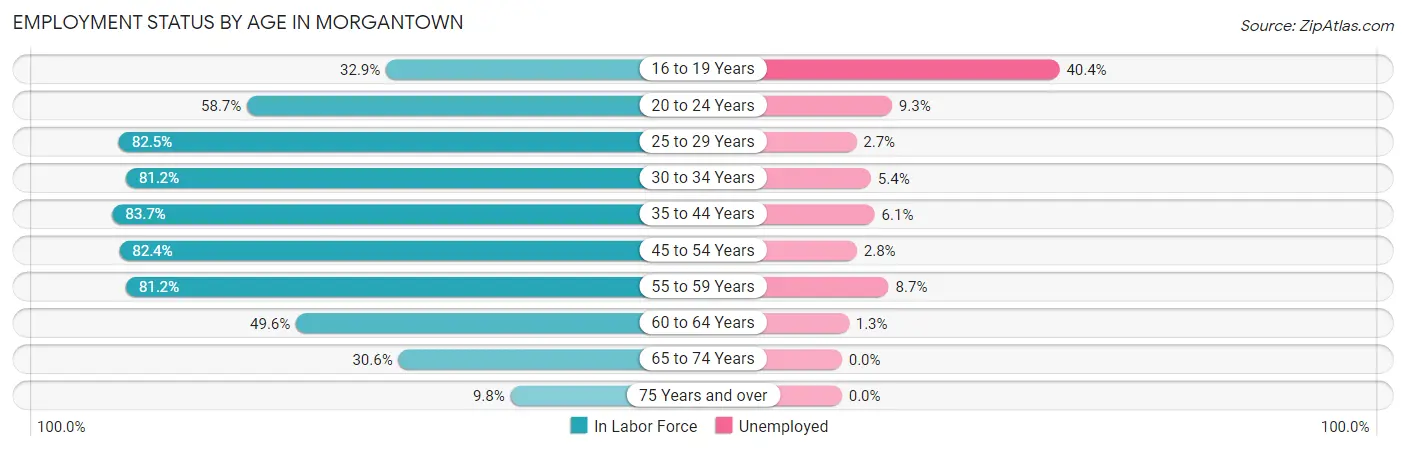
| Age Bracket | In Labor Force | Unemployed |
| 16 to 19 Years | 1,851 (32.9%) | 748 (40.4%) |
| 20 to 24 Years | 4,436 (58.7%) | 413 (9.3%) |
| 25 to 29 Years | 1,649 (82.5%) | 45 (2.7%) |
| 30 to 34 Years | 1,842 (81.2%) | 99 (5.4%) |
| 35 to 44 Years | 2,099 (83.7%) | 128 (6.1%) |
| 45 to 54 Years | 1,775 (82.4%) | 50 (2.8%) |
| 55 to 59 Years | 838 (81.2%) | 73 (8.7%) |
| 60 to 64 Years | 705 (49.6%) | 9 (1.3%) |
| 65 to 74 Years | 583 (30.6%) | 0 (0.0%) |
| 75 Years and over | 92 (9.8%) | 0 (0.0%) |
| Total | 15,870 (57.9%) | 1,571 (9.9%) |
Employment Status by Educational Attainment in Morgantown
According to labor force statistics for Morgantown, 78.3% of individuals (8,914) out of the total population between 25 and 64 years of age (11,384) are in the labor force, with 4.5% or 401 of them being unemployed. The group with the highest labor force participation rate are those with the educational attainment of bachelor's degree or higher, with 85.4% or 5,726 individuals in the labor force. Within the labor force, individuals with less than high school education have the highest percentage of unemployment, with 18.6% or 58 of them being unemployed.
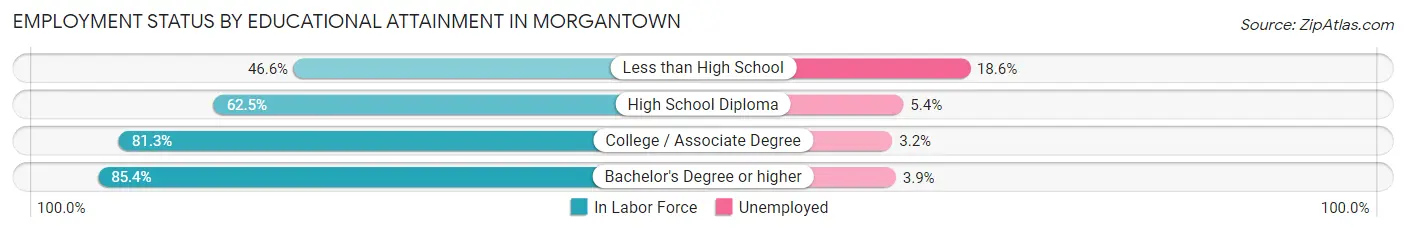
| Educational Attainment | In Labor Force | Unemployed |
| Less than High School | 311 (46.6%) | 124 (18.6%) |
| High School Diploma | 1,290 (62.5%) | 111 (5.4%) |
| College / Associate Degree | 1,583 (81.3%) | 62 (3.2%) |
| Bachelor's Degree or higher | 5,726 (85.4%) | 261 (3.9%) |
| Total | 8,914 (78.3%) | 512 (4.5%) |
Employment Occupations by Sex in Morgantown
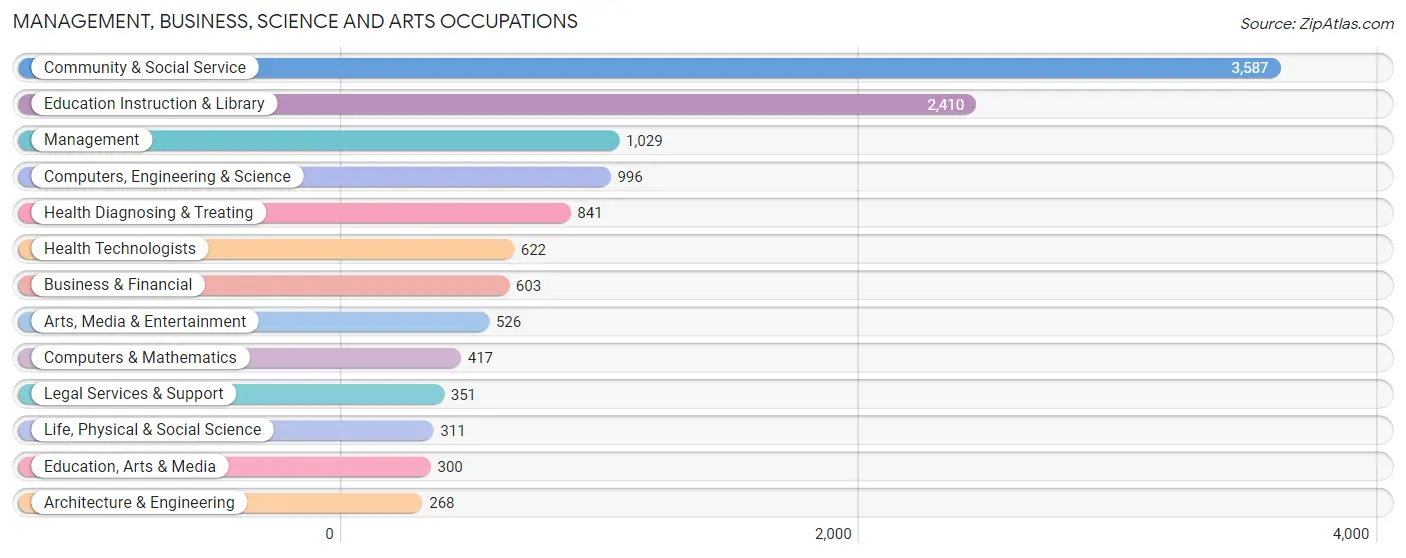
Management, Business, Science and Arts Occupations
The most common Management, Business, Science and Arts occupations in Morgantown are Community & Social Service (3,587 | 25.1%), Education Instruction & Library (2,410 | 16.9%), Management (1,029 | 7.2%), Computers, Engineering & Science (996 | 7.0%), and Health Diagnosing & Treating (841 | 5.9%).
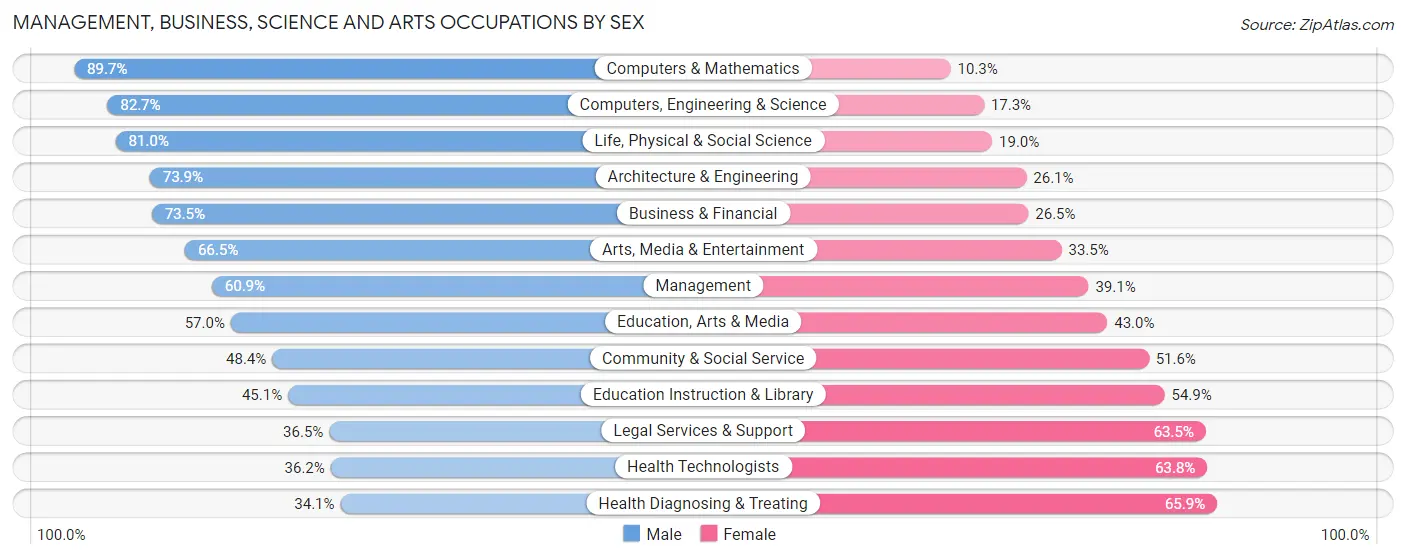
Management, Business, Science and Arts Occupations by Sex
Within the Management, Business, Science and Arts occupations in Morgantown, the most male-oriented occupations are Computers & Mathematics (89.7%), Computers, Engineering & Science (82.7%), and Life, Physical & Social Science (81.0%), while the most female-oriented occupations are Health Diagnosing & Treating (65.9%), Health Technologists (63.8%), and Legal Services & Support (63.5%).
| Occupation | Male | Female |
| Management | 627 (60.9%) | 402 (39.1%) |
| Business & Financial | 443 (73.5%) | 160 (26.5%) |
| Computers, Engineering & Science | 824 (82.7%) | 172 (17.3%) |
| Computers & Mathematics | 374 (89.7%) | 43 (10.3%) |
| Architecture & Engineering | 198 (73.9%) | 70 (26.1%) |
| Life, Physical & Social Science | 252 (81.0%) | 59 (19.0%) |
| Community & Social Service | 1,735 (48.4%) | 1,852 (51.6%) |
| Education, Arts & Media | 171 (57.0%) | 129 (43.0%) |
| Legal Services & Support | 128 (36.5%) | 223 (63.5%) |
| Education Instruction & Library | 1,086 (45.1%) | 1,324 (54.9%) |
| Arts, Media & Entertainment | 350 (66.5%) | 176 (33.5%) |
| Health Diagnosing & Treating | 287 (34.1%) | 554 (65.9%) |
| Health Technologists | 225 (36.2%) | 397 (63.8%) |
| Total (Category) | 3,916 (55.5%) | 3,140 (44.5%) |
| Total (Overall) | 7,807 (54.6%) | 6,498 (45.4%) |
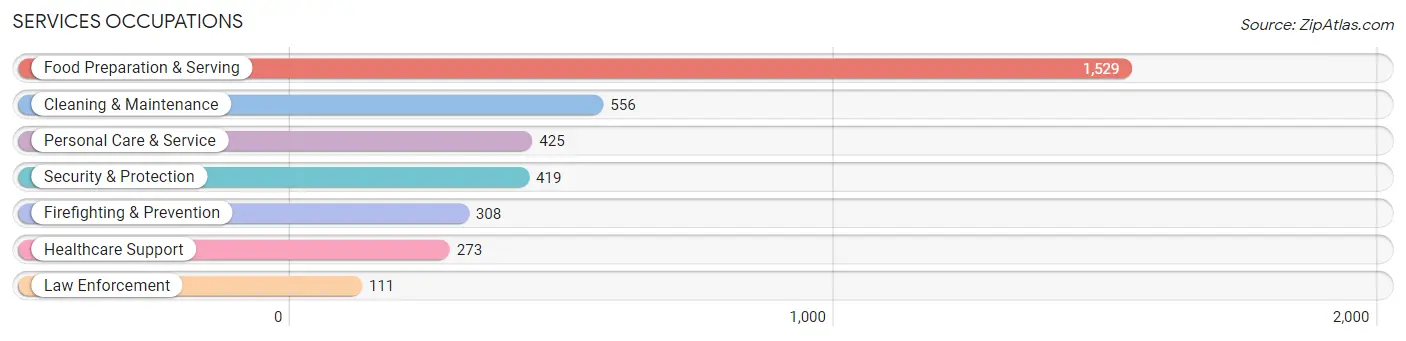
Services Occupations
The most common Services occupations in Morgantown are Food Preparation & Serving (1,529 | 10.7%), Cleaning & Maintenance (556 | 3.9%), Personal Care & Service (425 | 3.0%), Security & Protection (419 | 2.9%), and Firefighting & Prevention (308 | 2.1%).
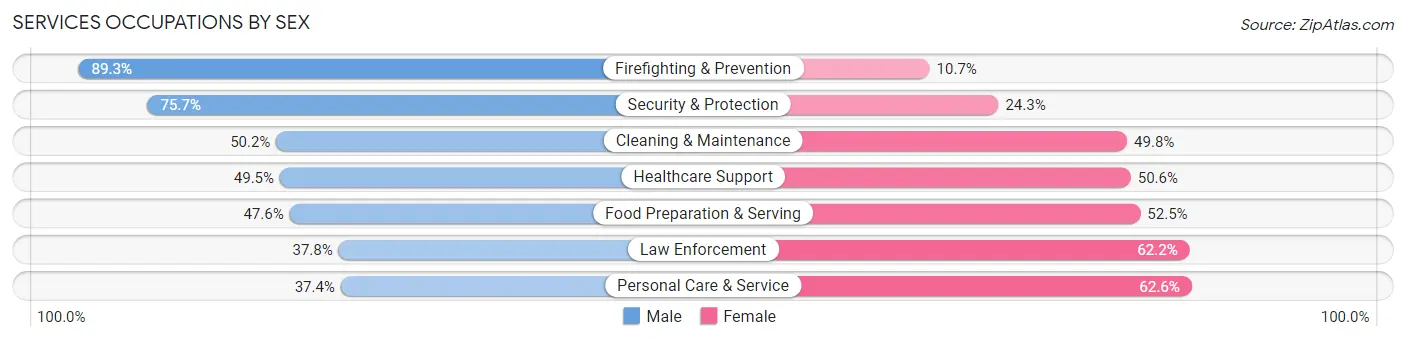
Services Occupations by Sex
Within the Services occupations in Morgantown, the most male-oriented occupations are Firefighting & Prevention (89.3%), Security & Protection (75.7%), and Cleaning & Maintenance (50.2%), while the most female-oriented occupations are Personal Care & Service (62.6%), Law Enforcement (62.2%), and Food Preparation & Serving (52.4%).
| Occupation | Male | Female |
| Healthcare Support | 135 (49.4%) | 138 (50.5%) |
| Security & Protection | 317 (75.7%) | 102 (24.3%) |
| Firefighting & Prevention | 275 (89.3%) | 33 (10.7%) |
| Law Enforcement | 42 (37.8%) | 69 (62.2%) |
| Food Preparation & Serving | 727 (47.5%) | 802 (52.4%) |
| Cleaning & Maintenance | 279 (50.2%) | 277 (49.8%) |
| Personal Care & Service | 159 (37.4%) | 266 (62.6%) |
| Total (Category) | 1,617 (50.5%) | 1,585 (49.5%) |
| Total (Overall) | 7,807 (54.6%) | 6,498 (45.4%) |
Sales and Office Occupations
The most common Sales and Office occupations in Morgantown are Office & Administration (1,424 | 10.0%), and Sales & Related (1,206 | 8.4%).
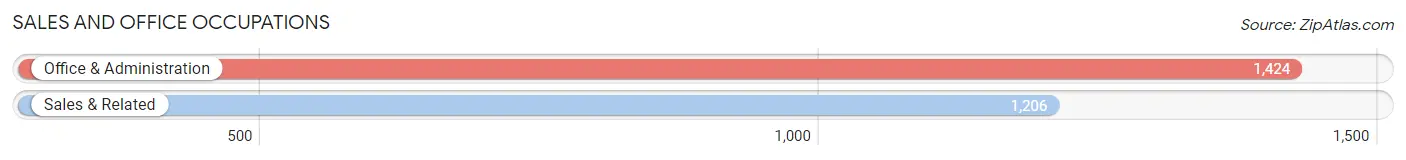
Sales and Office Occupations by Sex
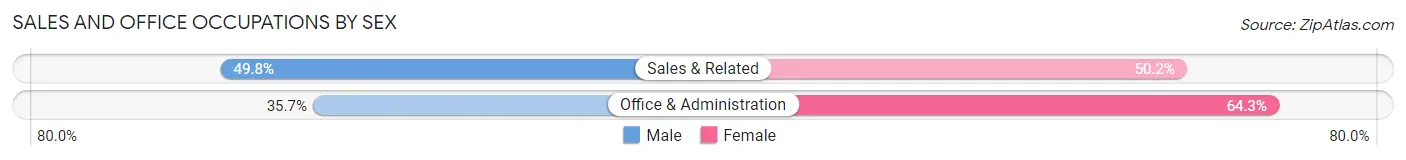
| Occupation | Male | Female |
| Sales & Related | 601 (49.8%) | 605 (50.2%) |
| Office & Administration | 508 (35.7%) | 916 (64.3%) |
| Total (Category) | 1,109 (42.2%) | 1,521 (57.8%) |
| Total (Overall) | 7,807 (54.6%) | 6,498 (45.4%) |
Natural Resources, Construction and Maintenance Occupations
The most common Natural Resources, Construction and Maintenance occupations in Morgantown are Construction & Extraction (288 | 2.0%), and Installation, Maintenance & Repair (232 | 1.6%).
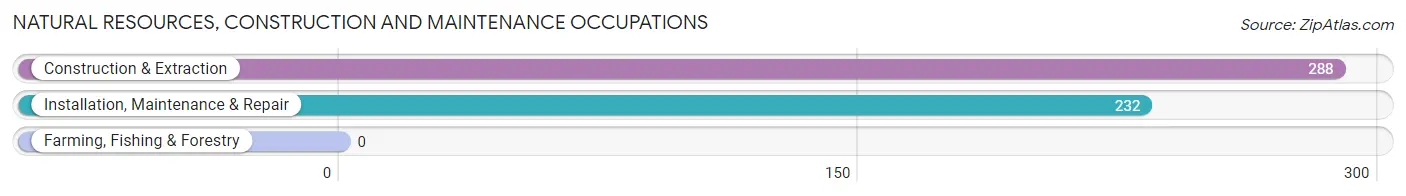
Natural Resources, Construction and Maintenance Occupations by Sex
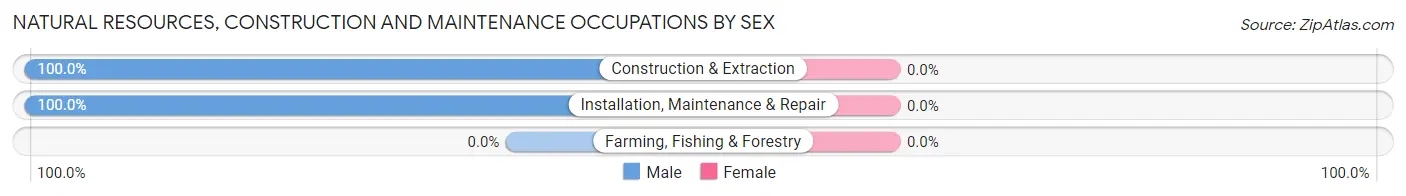
| Occupation | Male | Female |
| Farming, Fishing & Forestry | 0 (0.0%) | 0 (0.0%) |
| Construction & Extraction | 288 (100.0%) | 0 (0.0%) |
| Installation, Maintenance & Repair | 232 (100.0%) | 0 (0.0%) |
| Total (Category) | 520 (100.0%) | 0 (0.0%) |
| Total (Overall) | 7,807 (54.6%) | 6,498 (45.4%) |
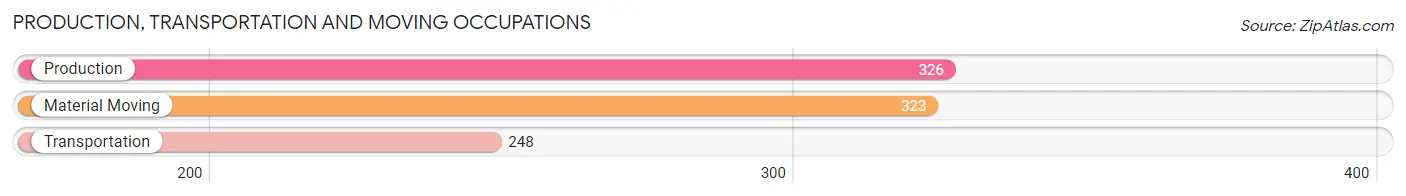
Production, Transportation and Moving Occupations
The most common Production, Transportation and Moving occupations in Morgantown are Production (326 | 2.3%), Material Moving (323 | 2.3%), and Transportation (248 | 1.7%).
Production, Transportation and Moving Occupations by Sex
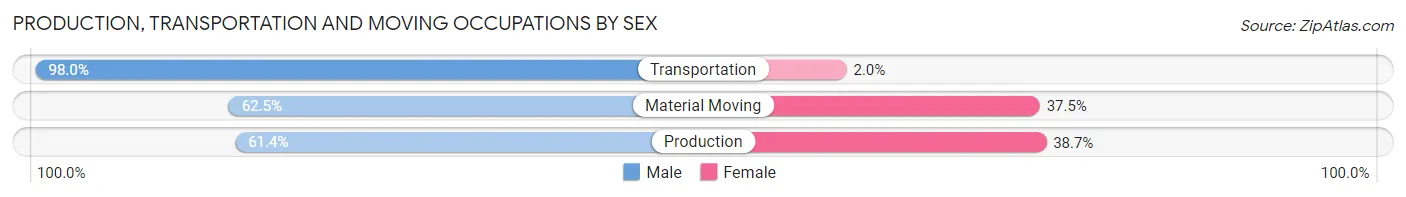
| Occupation | Male | Female |
| Production | 200 (61.4%) | 126 (38.7%) |
| Transportation | 243 (98.0%) | 5 (2.0%) |
| Material Moving | 202 (62.5%) | 121 (37.5%) |
| Total (Category) | 645 (71.9%) | 252 (28.1%) |
| Total (Overall) | 7,807 (54.6%) | 6,498 (45.4%) |
Employment Industries by Sex in Morgantown
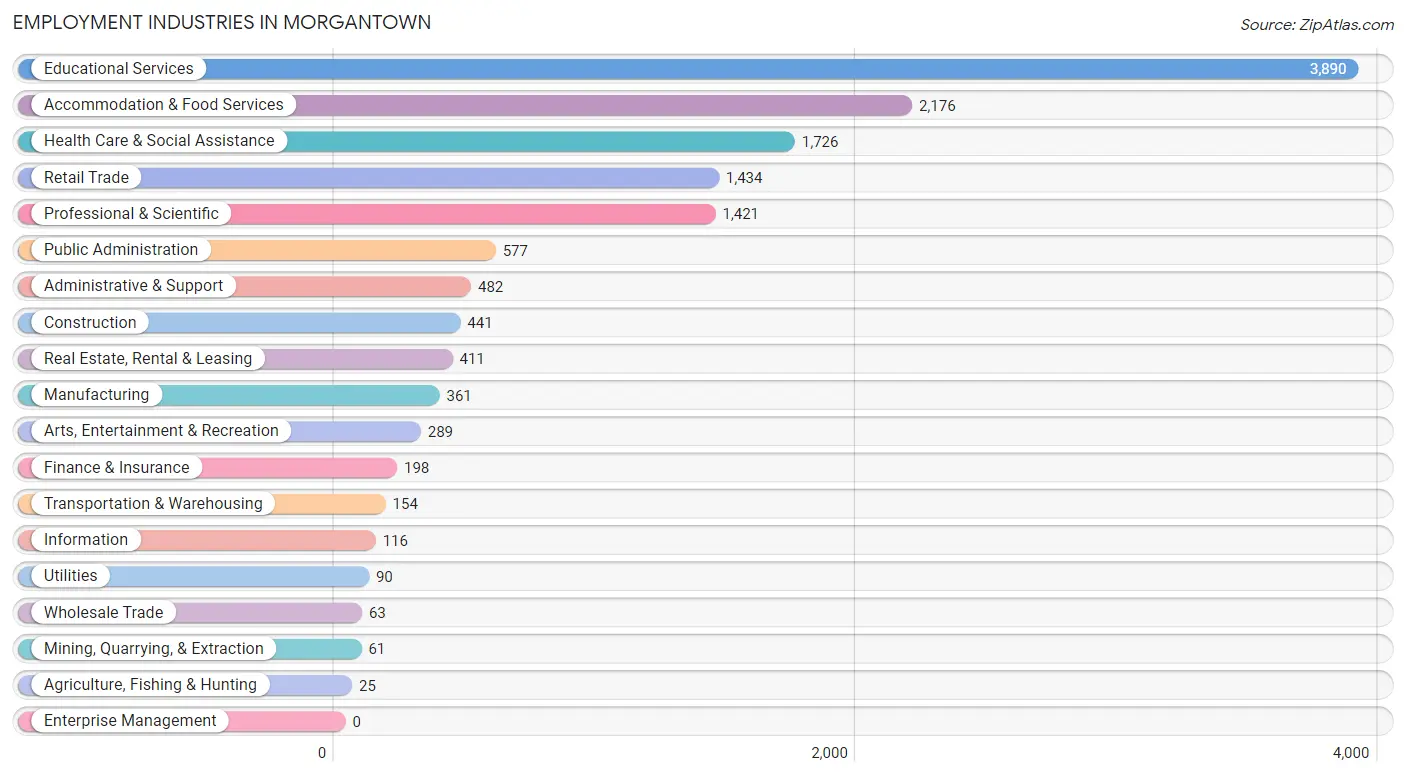
Employment Industries in Morgantown
The major employment industries in Morgantown include Educational Services (3,890 | 27.2%), Accommodation & Food Services (2,176 | 15.2%), Health Care & Social Assistance (1,726 | 12.1%), Retail Trade (1,434 | 10.0%), and Professional & Scientific (1,421 | 9.9%).
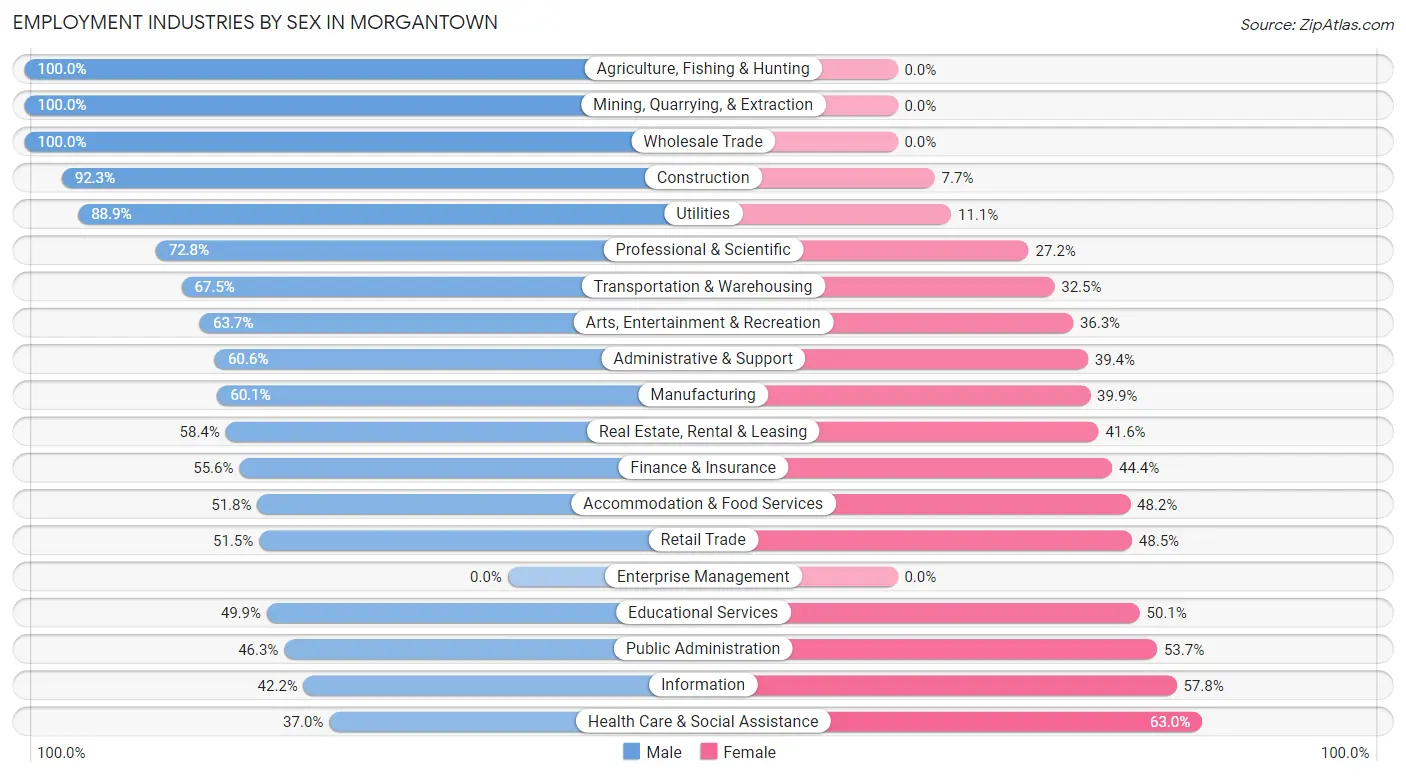
Employment Industries by Sex in Morgantown
The Morgantown industries that see more men than women are Agriculture, Fishing & Hunting (100.0%), Mining, Quarrying, & Extraction (100.0%), and Wholesale Trade (100.0%), whereas the industries that tend to have a higher number of women are Health Care & Social Assistance (63.0%), Information (57.8%), and Public Administration (53.7%).
| Industry | Male | Female |
| Agriculture, Fishing & Hunting | 25 (100.0%) | 0 (0.0%) |
| Mining, Quarrying, & Extraction | 61 (100.0%) | 0 (0.0%) |
| Construction | 407 (92.3%) | 34 (7.7%) |
| Manufacturing | 217 (60.1%) | 144 (39.9%) |
| Wholesale Trade | 63 (100.0%) | 0 (0.0%) |
| Retail Trade | 738 (51.5%) | 696 (48.5%) |
| Transportation & Warehousing | 104 (67.5%) | 50 (32.5%) |
| Utilities | 80 (88.9%) | 10 (11.1%) |
| Information | 49 (42.2%) | 67 (57.8%) |
| Finance & Insurance | 110 (55.6%) | 88 (44.4%) |
| Real Estate, Rental & Leasing | 240 (58.4%) | 171 (41.6%) |
| Professional & Scientific | 1,035 (72.8%) | 386 (27.2%) |
| Enterprise Management | 0 (0.0%) | 0 (0.0%) |
| Administrative & Support | 292 (60.6%) | 190 (39.4%) |
| Educational Services | 1,940 (49.9%) | 1,950 (50.1%) |
| Health Care & Social Assistance | 638 (37.0%) | 1,088 (63.0%) |
| Arts, Entertainment & Recreation | 184 (63.7%) | 105 (36.3%) |
| Accommodation & Food Services | 1,128 (51.8%) | 1,048 (48.2%) |
| Public Administration | 267 (46.3%) | 310 (53.7%) |
| Total | 7,807 (54.6%) | 6,498 (45.4%) |
Education in Morgantown
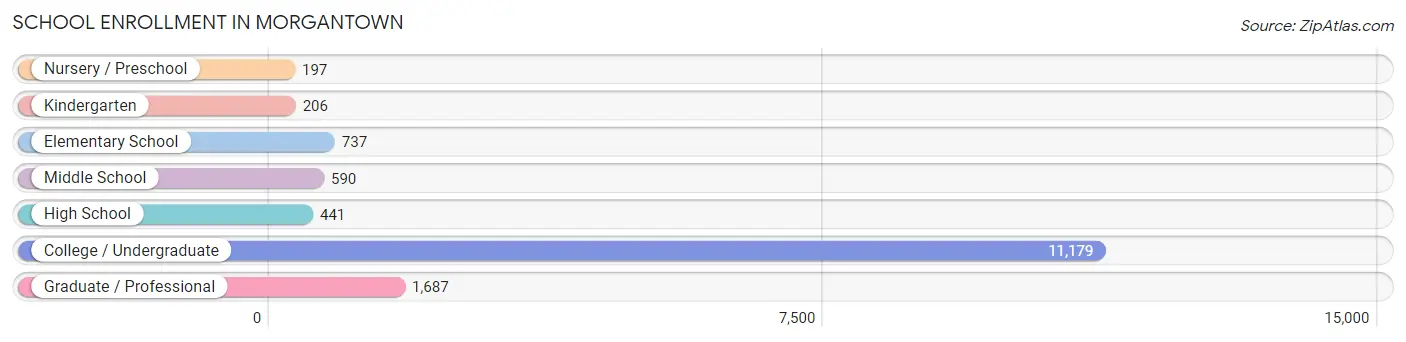
School Enrollment in Morgantown
The most common levels of schooling among the 15,037 students in Morgantown are college / undergraduate (11,179 | 74.3%), graduate / professional (1,687 | 11.2%), and elementary school (737 | 4.9%).
| School Level | # Students | % Students |
| Nursery / Preschool | 197 | 1.3% |
| Kindergarten | 206 | 1.4% |
| Elementary School | 737 | 4.9% |
| Middle School | 590 | 3.9% |
| High School | 441 | 2.9% |
| College / Undergraduate | 11,179 | 74.3% |
| Graduate / Professional | 1,687 | 11.2% |
| Total | 15,037 | 100.0% |
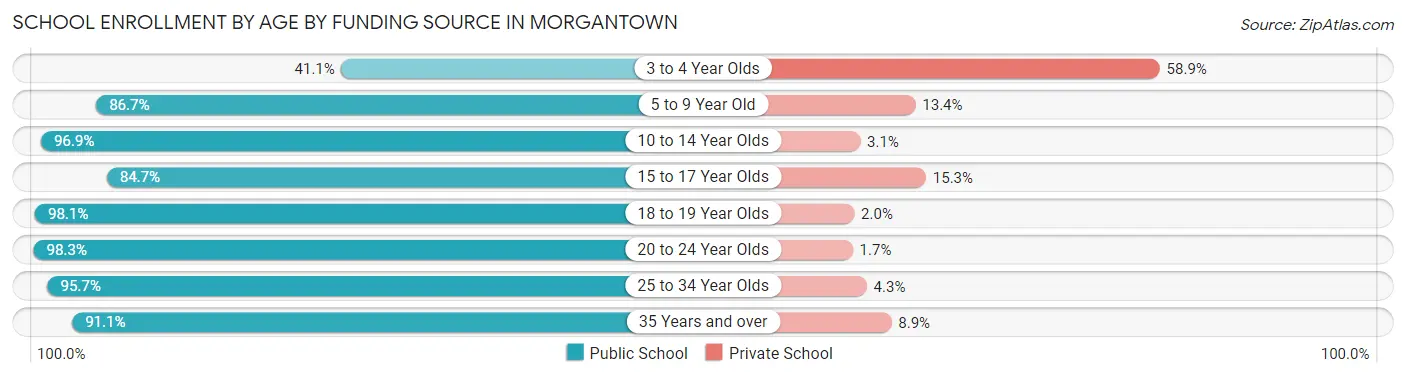
School Enrollment by Age by Funding Source in Morgantown
Out of a total of 15,037 students who are enrolled in schools in Morgantown, 571 (3.8%) attend a private institution, while the remaining 14,466 (96.2%) are enrolled in public schools. The age group of 3 to 4 year olds has the highest likelihood of being enrolled in private schools, with 93 (58.9% in the age bracket) enrolled. Conversely, the age group of 20 to 24 year olds has the lowest likelihood of being enrolled in a private school, with 6,125 (98.3% in the age bracket) attending a public institution.
| Age Bracket | Public School | Private School |
| 3 to 4 Year Olds | 65 (41.1%) | 93 (58.9%) |
| 5 to 9 Year Old | 831 (86.7%) | 128 (13.4%) |
| 10 to 14 Year Olds | 666 (96.9%) | 21 (3.1%) |
| 15 to 17 Year Olds | 271 (84.7%) | 49 (15.3%) |
| 18 to 19 Year Olds | 5,227 (98.1%) | 104 (1.9%) |
| 20 to 24 Year Olds | 6,125 (98.3%) | 104 (1.7%) |
| 25 to 34 Year Olds | 961 (95.7%) | 43 (4.3%) |
| 35 Years and over | 318 (91.1%) | 31 (8.9%) |
| Total | 14,466 (96.2%) | 571 (3.8%) |
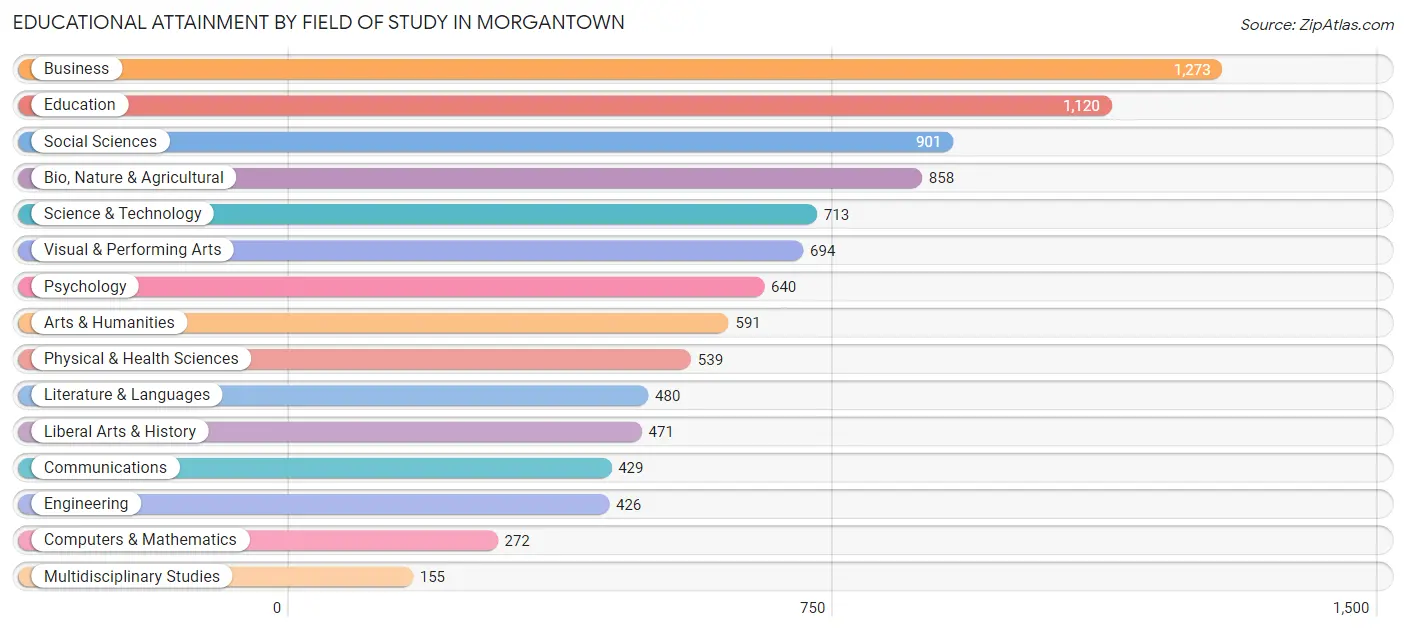
Educational Attainment by Field of Study in Morgantown
Business (1,273 | 13.3%), education (1,120 | 11.7%), social sciences (901 | 9.4%), bio, nature & agricultural (858 | 9.0%), and science & technology (713 | 7.5%) are the most common fields of study among 9,562 individuals in Morgantown who have obtained a bachelor's degree or higher.
| Field of Study | # Graduates | % Graduates |
| Computers & Mathematics | 272 | 2.8% |
| Bio, Nature & Agricultural | 858 | 9.0% |
| Physical & Health Sciences | 539 | 5.6% |
| Psychology | 640 | 6.7% |
| Social Sciences | 901 | 9.4% |
| Engineering | 426 | 4.5% |
| Multidisciplinary Studies | 155 | 1.6% |
| Science & Technology | 713 | 7.5% |
| Business | 1,273 | 13.3% |
| Education | 1,120 | 11.7% |
| Literature & Languages | 480 | 5.0% |
| Liberal Arts & History | 471 | 4.9% |
| Visual & Performing Arts | 694 | 7.3% |
| Communications | 429 | 4.5% |
| Arts & Humanities | 591 | 6.2% |
| Total | 9,562 | 100.0% |
Transportation & Commute in Morgantown
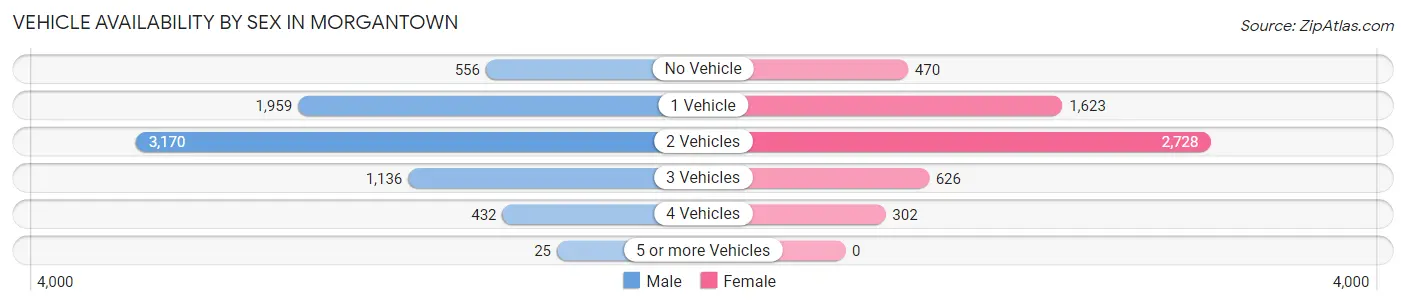
Vehicle Availability by Sex in Morgantown
The most prevalent vehicle ownership categories in Morgantown are males with 2 vehicles (3,170, accounting for 43.6%) and females with 2 vehicles (2,728, making up 55.1%).
| Vehicles Available | Male | Female |
| No Vehicle | 556 (7.6%) | 470 (8.2%) |
| 1 Vehicle | 1,959 (26.9%) | 1,623 (28.2%) |
| 2 Vehicles | 3,170 (43.6%) | 2,728 (47.4%) |
| 3 Vehicles | 1,136 (15.6%) | 626 (10.9%) |
| 4 Vehicles | 432 (5.9%) | 302 (5.2%) |
| 5 or more Vehicles | 25 (0.3%) | 0 (0.0%) |
| Total | 7,278 (100.0%) | 5,749 (100.0%) |
Commute Time in Morgantown
The most frequently occuring commute durations in Morgantown are 10 to 14 minutes (3,554 commuters, 29.0%), 15 to 19 minutes (2,291 commuters, 18.7%), and 5 to 9 minutes (2,255 commuters, 18.4%).
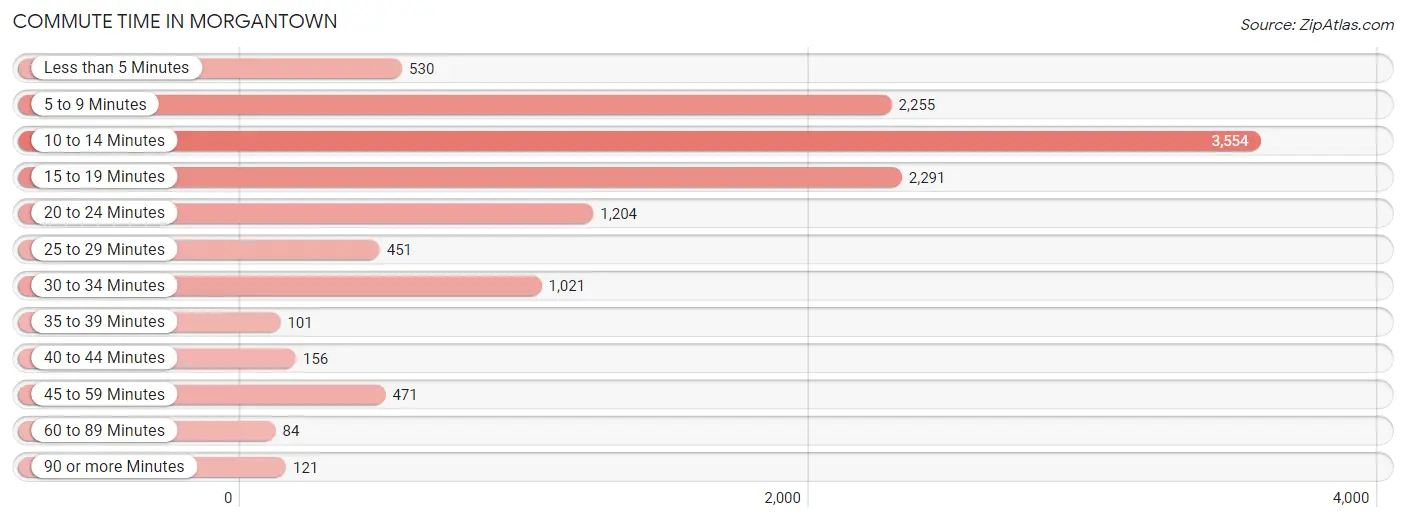
| Commute Time | # Commuters | % Commuters |
| Less than 5 Minutes | 530 | 4.3% |
| 5 to 9 Minutes | 2,255 | 18.4% |
| 10 to 14 Minutes | 3,554 | 29.0% |
| 15 to 19 Minutes | 2,291 | 18.7% |
| 20 to 24 Minutes | 1,204 | 9.8% |
| 25 to 29 Minutes | 451 | 3.7% |
| 30 to 34 Minutes | 1,021 | 8.3% |
| 35 to 39 Minutes | 101 | 0.8% |
| 40 to 44 Minutes | 156 | 1.3% |
| 45 to 59 Minutes | 471 | 3.8% |
| 60 to 89 Minutes | 84 | 0.7% |
| 90 or more Minutes | 121 | 1.0% |
Commute Time by Sex in Morgantown
The most common commute times in Morgantown are 10 to 14 minutes (1,679 commuters, 24.9%) for males and 10 to 14 minutes (1,875 commuters, 34.1%) for females.
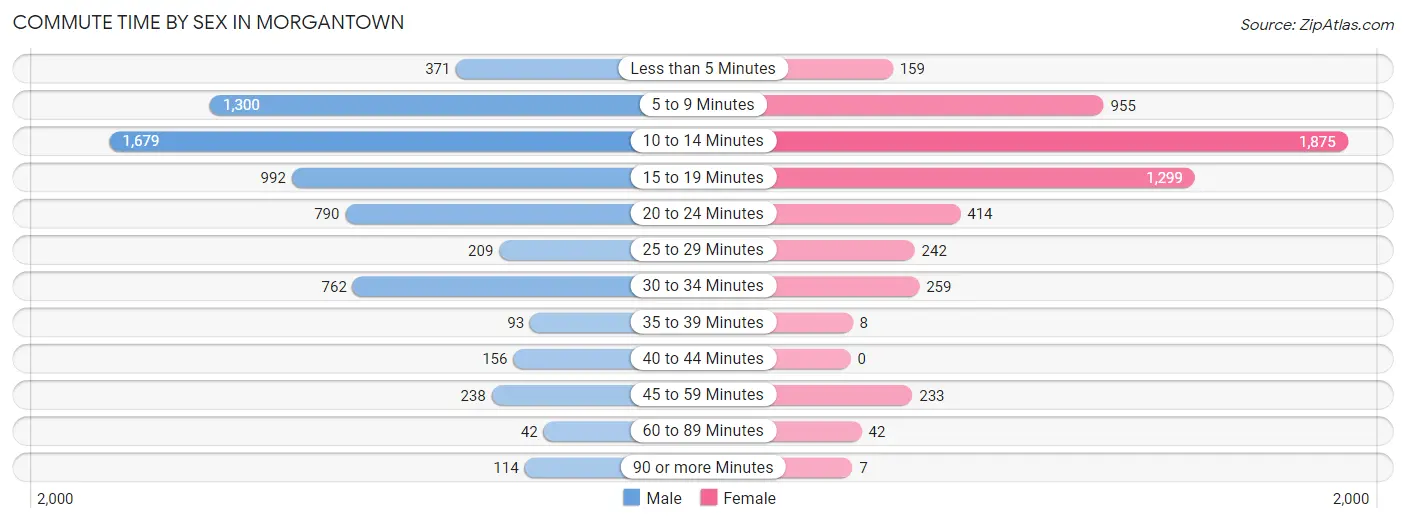
| Commute Time | Male | Female |
| Less than 5 Minutes | 371 (5.5%) | 159 (2.9%) |
| 5 to 9 Minutes | 1,300 (19.3%) | 955 (17.4%) |
| 10 to 14 Minutes | 1,679 (24.9%) | 1,875 (34.1%) |
| 15 to 19 Minutes | 992 (14.7%) | 1,299 (23.6%) |
| 20 to 24 Minutes | 790 (11.7%) | 414 (7.5%) |
| 25 to 29 Minutes | 209 (3.1%) | 242 (4.4%) |
| 30 to 34 Minutes | 762 (11.3%) | 259 (4.7%) |
| 35 to 39 Minutes | 93 (1.4%) | 8 (0.2%) |
| 40 to 44 Minutes | 156 (2.3%) | 0 (0.0%) |
| 45 to 59 Minutes | 238 (3.5%) | 233 (4.2%) |
| 60 to 89 Minutes | 42 (0.6%) | 42 (0.8%) |
| 90 or more Minutes | 114 (1.7%) | 7 (0.1%) |
Time of Departure to Work by Sex in Morgantown
The most frequent times of departure to work in Morgantown are 12:00 PM to 3:59 PM (864, 12.8%) for males and 8:00 AM to 8:29 AM (1,102, 20.1%) for females.
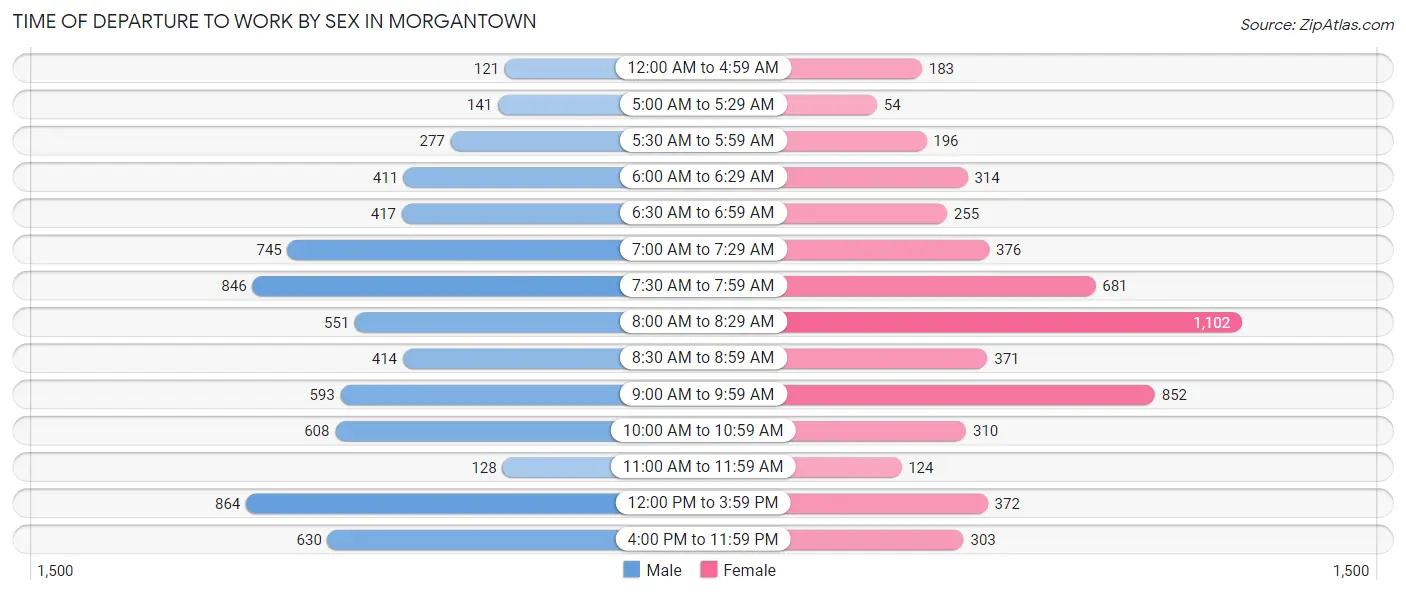
| Time of Departure | Male | Female |
| 12:00 AM to 4:59 AM | 121 (1.8%) | 183 (3.3%) |
| 5:00 AM to 5:29 AM | 141 (2.1%) | 54 (1.0%) |
| 5:30 AM to 5:59 AM | 277 (4.1%) | 196 (3.6%) |
| 6:00 AM to 6:29 AM | 411 (6.1%) | 314 (5.7%) |
| 6:30 AM to 6:59 AM | 417 (6.2%) | 255 (4.6%) |
| 7:00 AM to 7:29 AM | 745 (11.0%) | 376 (6.9%) |
| 7:30 AM to 7:59 AM | 846 (12.5%) | 681 (12.4%) |
| 8:00 AM to 8:29 AM | 551 (8.2%) | 1,102 (20.1%) |
| 8:30 AM to 8:59 AM | 414 (6.1%) | 371 (6.8%) |
| 9:00 AM to 9:59 AM | 593 (8.8%) | 852 (15.5%) |
| 10:00 AM to 10:59 AM | 608 (9.0%) | 310 (5.6%) |
| 11:00 AM to 11:59 AM | 128 (1.9%) | 124 (2.3%) |
| 12:00 PM to 3:59 PM | 864 (12.8%) | 372 (6.8%) |
| 4:00 PM to 11:59 PM | 630 (9.3%) | 303 (5.5%) |
| Total | 6,746 (100.0%) | 5,493 (100.0%) |
Housing Occupancy in Morgantown
Occupancy by Ownership in Morgantown
Of the total 12,035 dwellings in Morgantown, owner-occupied units account for 5,188 (43.1%), while renter-occupied units make up 6,847 (56.9%).
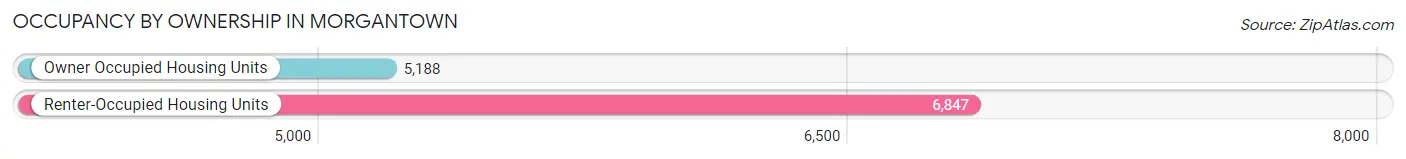
| Occupancy | # Housing Units | % Housing Units |
| Owner Occupied Housing Units | 5,188 | 43.1% |
| Renter-Occupied Housing Units | 6,847 | 56.9% |
| Total Occupied Housing Units | 12,035 | 100.0% |
Occupancy by Household Size in Morgantown
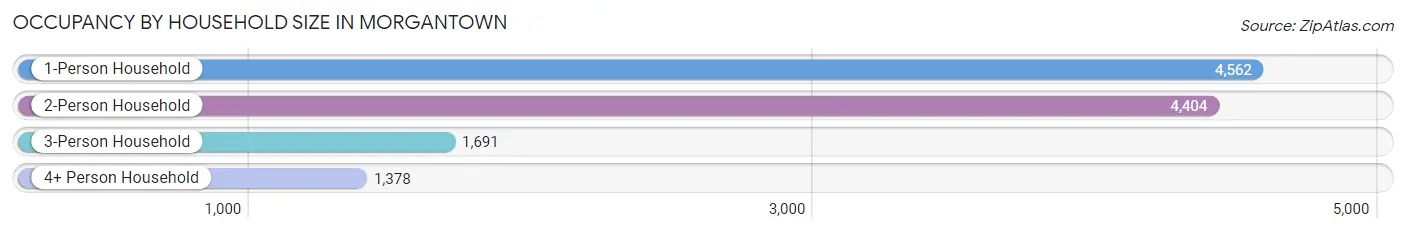
| Household Size | # Housing Units | % Housing Units |
| 1-Person Household | 4,562 | 37.9% |
| 2-Person Household | 4,404 | 36.6% |
| 3-Person Household | 1,691 | 14.1% |
| 4+ Person Household | 1,378 | 11.5% |
| Total Housing Units | 12,035 | 100.0% |
Occupancy by Ownership by Household Size in Morgantown
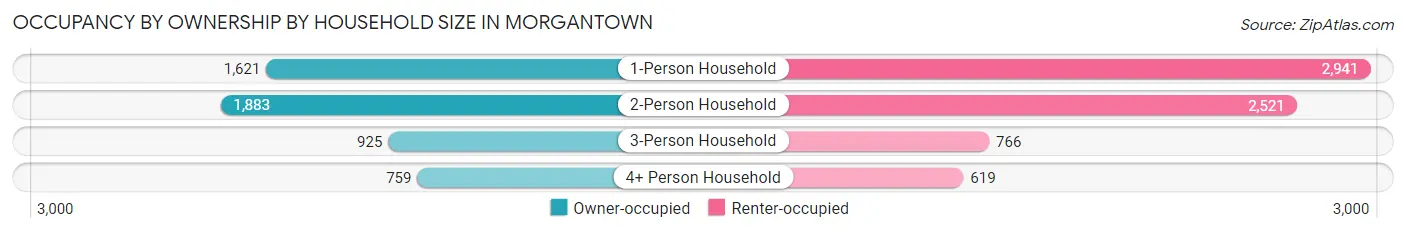
| Household Size | Owner-occupied | Renter-occupied |
| 1-Person Household | 1,621 (35.5%) | 2,941 (64.5%) |
| 2-Person Household | 1,883 (42.8%) | 2,521 (57.2%) |
| 3-Person Household | 925 (54.7%) | 766 (45.3%) |
| 4+ Person Household | 759 (55.1%) | 619 (44.9%) |
| Total Housing Units | 5,188 (43.1%) | 6,847 (56.9%) |
Occupancy by Educational Attainment in Morgantown
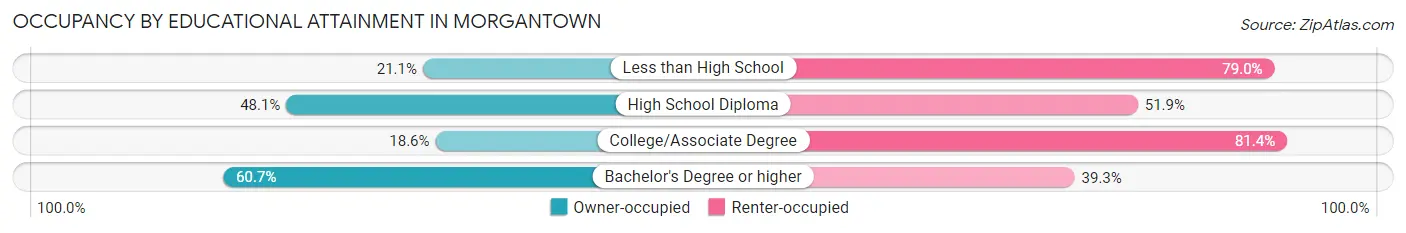
| Household Size | Owner-occupied | Renter-occupied |
| Less than High School | 116 (21.0%) | 435 (78.9%) |
| High School Diploma | 800 (48.1%) | 862 (51.9%) |
| College/Associate Degree | 743 (18.6%) | 3,261 (81.4%) |
| Bachelor's Degree or higher | 3,529 (60.7%) | 2,289 (39.3%) |
Occupancy by Age of Householder in Morgantown
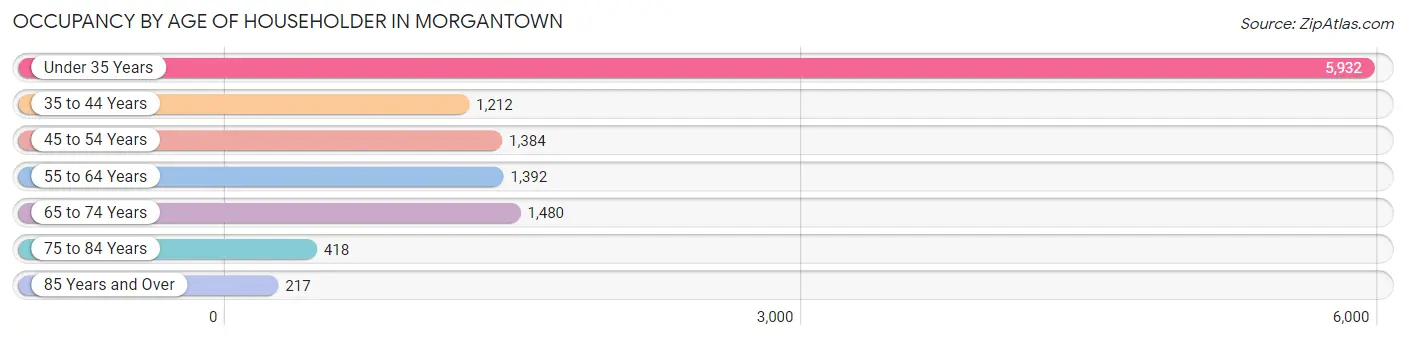
| Age Bracket | # Households | % Households |
| Under 35 Years | 5,932 | 49.3% |
| 35 to 44 Years | 1,212 | 10.1% |
| 45 to 54 Years | 1,384 | 11.5% |
| 55 to 64 Years | 1,392 | 11.6% |
| 65 to 74 Years | 1,480 | 12.3% |
| 75 to 84 Years | 418 | 3.5% |
| 85 Years and Over | 217 | 1.8% |
| Total | 12,035 | 100.0% |
Housing Finances in Morgantown
Median Income by Occupancy in Morgantown
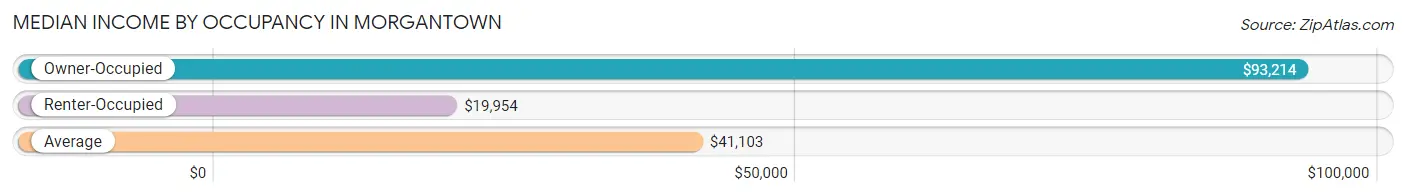
| Occupancy Type | # Households | Median Income |
| Owner-Occupied | 5,188 (43.1%) | $93,214 |
| Renter-Occupied | 6,847 (56.9%) | $19,954 |
| Average | 12,035 (100.0%) | $41,103 |
Occupancy by Householder Income Bracket in Morgantown
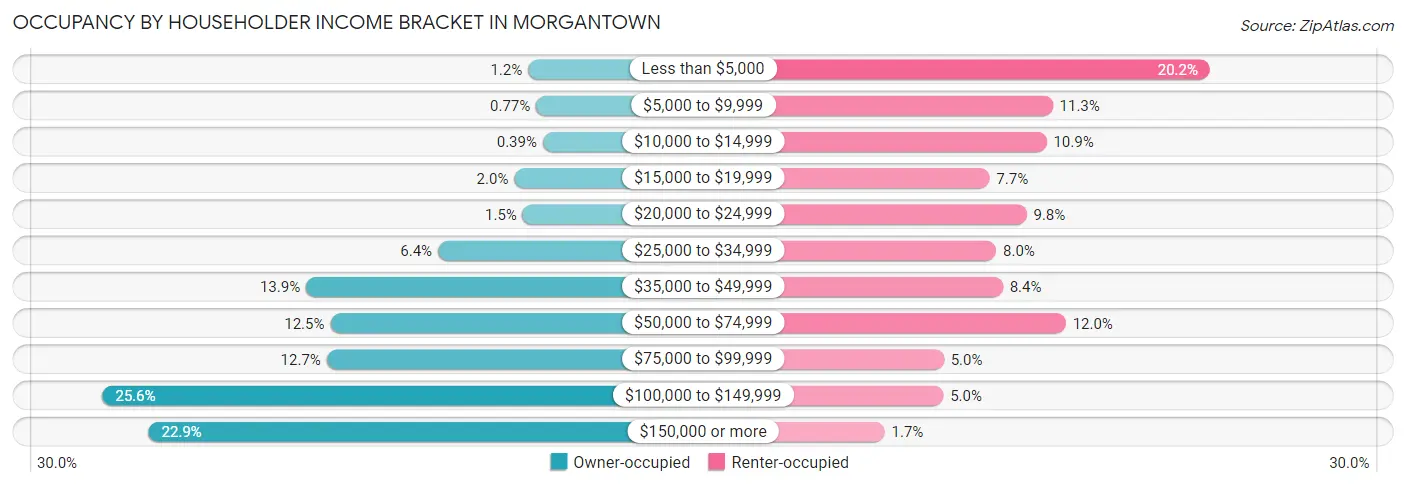
| Income Bracket | Owner-occupied | Renter-occupied |
| Less than $5,000 | 64 (1.2%) | 1,386 (20.2%) |
| $5,000 to $9,999 | 40 (0.8%) | 771 (11.3%) |
| $10,000 to $14,999 | 20 (0.4%) | 747 (10.9%) |
| $15,000 to $19,999 | 105 (2.0%) | 524 (7.6%) |
| $20,000 to $24,999 | 80 (1.5%) | 669 (9.8%) |
| $25,000 to $34,999 | 331 (6.4%) | 550 (8.0%) |
| $35,000 to $49,999 | 722 (13.9%) | 576 (8.4%) |
| $50,000 to $74,999 | 650 (12.5%) | 822 (12.0%) |
| $75,000 to $99,999 | 661 (12.7%) | 345 (5.0%) |
| $100,000 to $149,999 | 1,326 (25.6%) | 343 (5.0%) |
| $150,000 or more | 1,189 (22.9%) | 114 (1.7%) |
| Total | 5,188 (100.0%) | 6,847 (100.0%) |
Monthly Housing Cost Tiers in Morgantown
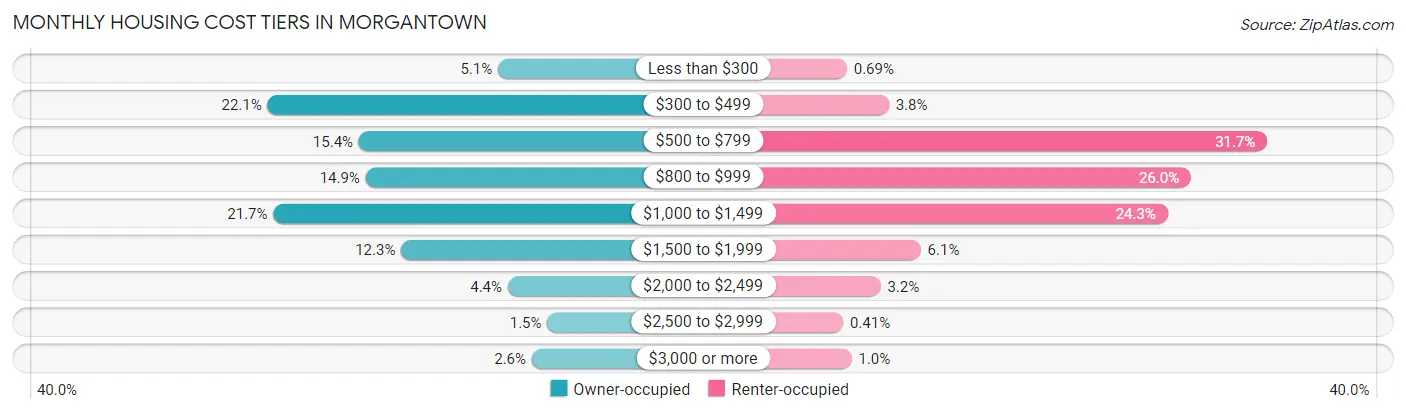
| Monthly Cost | Owner-occupied | Renter-occupied |
| Less than $300 | 266 (5.1%) | 47 (0.7%) |
| $300 to $499 | 1,147 (22.1%) | 259 (3.8%) |
| $500 to $799 | 798 (15.4%) | 2,167 (31.7%) |
| $800 to $999 | 772 (14.9%) | 1,783 (26.0%) |
| $1,000 to $1,499 | 1,125 (21.7%) | 1,665 (24.3%) |
| $1,500 to $1,999 | 636 (12.3%) | 420 (6.1%) |
| $2,000 to $2,499 | 229 (4.4%) | 217 (3.2%) |
| $2,500 to $2,999 | 78 (1.5%) | 28 (0.4%) |
| $3,000 or more | 137 (2.6%) | 71 (1.0%) |
| Total | 5,188 (100.0%) | 6,847 (100.0%) |
Physical Housing Characteristics in Morgantown
Housing Structures in Morgantown
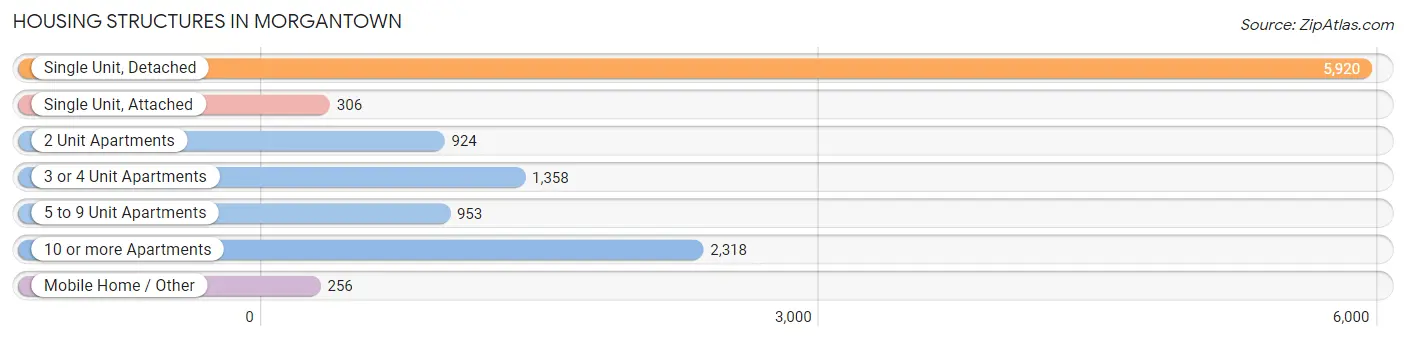
| Structure Type | # Housing Units | % Housing Units |
| Single Unit, Detached | 5,920 | 49.2% |
| Single Unit, Attached | 306 | 2.5% |
| 2 Unit Apartments | 924 | 7.7% |
| 3 or 4 Unit Apartments | 1,358 | 11.3% |
| 5 to 9 Unit Apartments | 953 | 7.9% |
| 10 or more Apartments | 2,318 | 19.3% |
| Mobile Home / Other | 256 | 2.1% |
| Total | 12,035 | 100.0% |
Housing Structures by Occupancy in Morgantown
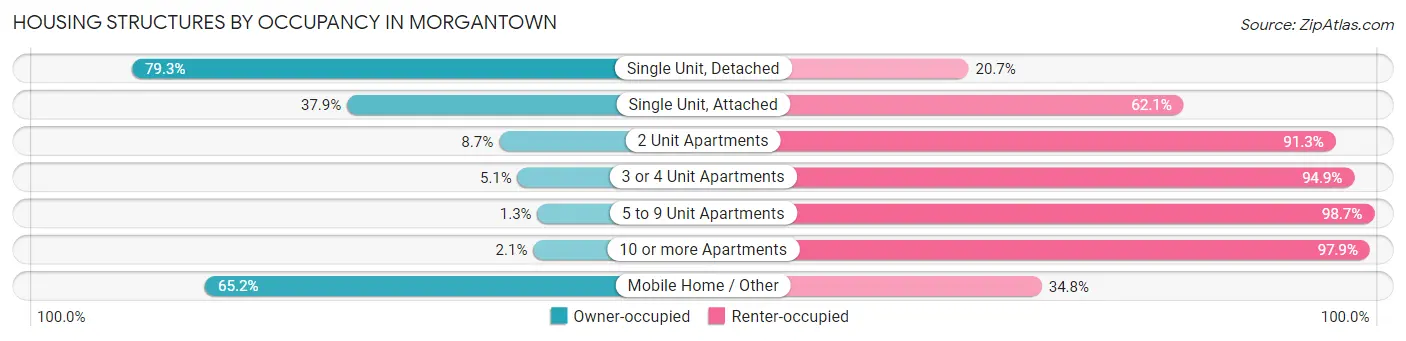
| Structure Type | Owner-occupied | Renter-occupied |
| Single Unit, Detached | 4,696 (79.3%) | 1,224 (20.7%) |
| Single Unit, Attached | 116 (37.9%) | 190 (62.1%) |
| 2 Unit Apartments | 80 (8.7%) | 844 (91.3%) |
| 3 or 4 Unit Apartments | 69 (5.1%) | 1,289 (94.9%) |
| 5 to 9 Unit Apartments | 12 (1.3%) | 941 (98.7%) |
| 10 or more Apartments | 48 (2.1%) | 2,270 (97.9%) |
| Mobile Home / Other | 167 (65.2%) | 89 (34.8%) |
| Total | 5,188 (43.1%) | 6,847 (56.9%) |
Housing Structures by Number of Rooms in Morgantown
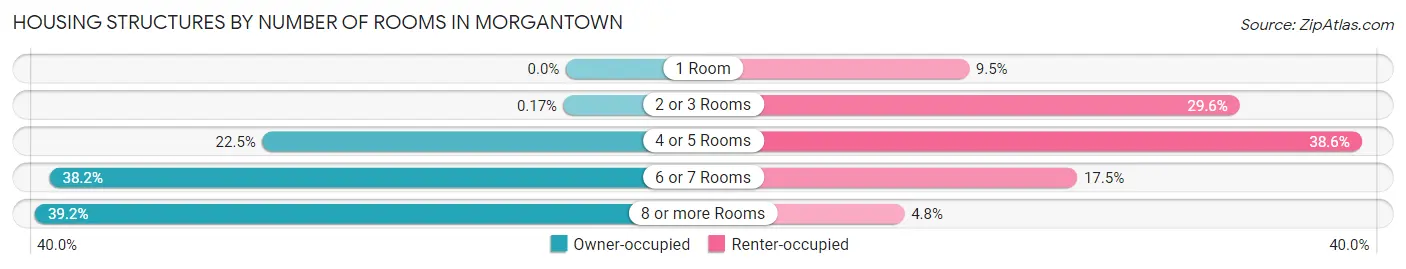
| Number of Rooms | Owner-occupied | Renter-occupied |
| 1 Room | 0 (0.0%) | 653 (9.5%) |
| 2 or 3 Rooms | 9 (0.2%) | 2,025 (29.6%) |
| 4 or 5 Rooms | 1,165 (22.5%) | 2,642 (38.6%) |
| 6 or 7 Rooms | 1,979 (38.2%) | 1,201 (17.5%) |
| 8 or more Rooms | 2,035 (39.2%) | 326 (4.8%) |
| Total | 5,188 (100.0%) | 6,847 (100.0%) |
Housing Structure by Heating Type in Morgantown
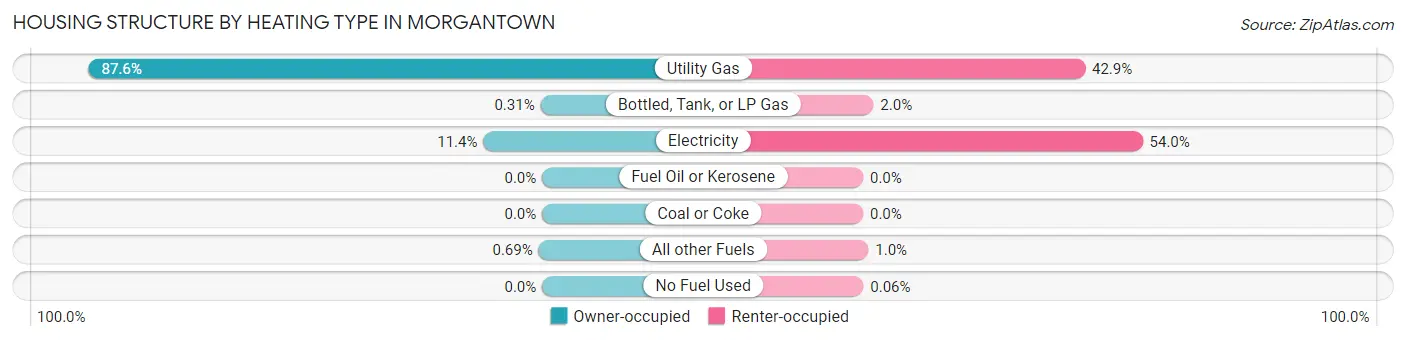
| Heating Type | Owner-occupied | Renter-occupied |
| Utility Gas | 4,546 (87.6%) | 2,937 (42.9%) |
| Bottled, Tank, or LP Gas | 16 (0.3%) | 137 (2.0%) |
| Electricity | 590 (11.4%) | 3,699 (54.0%) |
| Fuel Oil or Kerosene | 0 (0.0%) | 0 (0.0%) |
| Coal or Coke | 0 (0.0%) | 0 (0.0%) |
| All other Fuels | 36 (0.7%) | 70 (1.0%) |
| No Fuel Used | 0 (0.0%) | 4 (0.1%) |
| Total | 5,188 (100.0%) | 6,847 (100.0%) |
Household Vehicle Usage in Morgantown
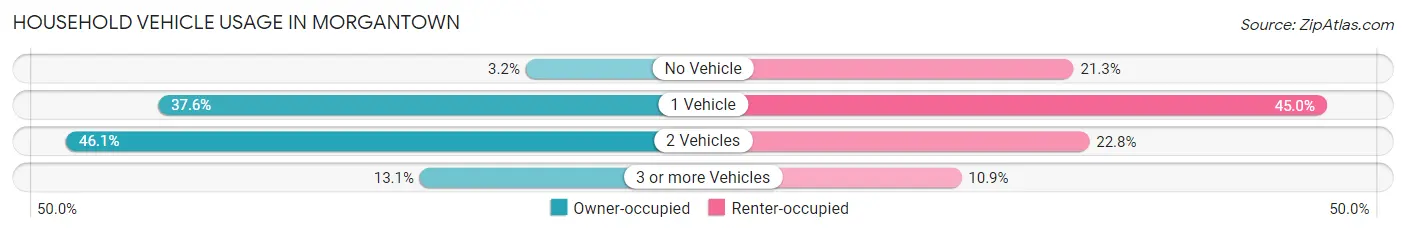
| Vehicles per Household | Owner-occupied | Renter-occupied |
| No Vehicle | 167 (3.2%) | 1,461 (21.3%) |
| 1 Vehicle | 1,948 (37.6%) | 3,080 (45.0%) |
| 2 Vehicles | 2,393 (46.1%) | 1,562 (22.8%) |
| 3 or more Vehicles | 680 (13.1%) | 744 (10.9%) |
| Total | 5,188 (100.0%) | 6,847 (100.0%) |
Real Estate & Mortgages in Morgantown
Real Estate and Mortgage Overview in Morgantown
| Characteristic | Without Mortgage | With Mortgage |
| Housing Units | 2,157 | 3,031 |
| Median Property Value | $226,000 | $233,600 |
| Median Household Income | $61,378 | $906 |
| Monthly Housing Costs | $437 | $129 |
| Real Estate Taxes | $1,079 | $51 |
Property Value by Mortgage Status in Morgantown
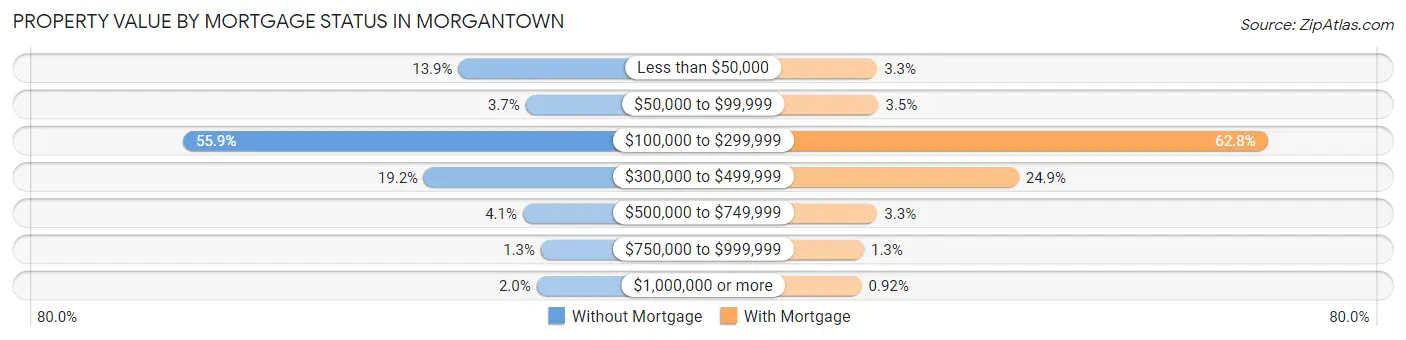
| Property Value | Without Mortgage | With Mortgage |
| Less than $50,000 | 300 (13.9%) | 100 (3.3%) |
| $50,000 to $99,999 | 79 (3.7%) | 106 (3.5%) |
| $100,000 to $299,999 | 1,205 (55.9%) | 1,903 (62.8%) |
| $300,000 to $499,999 | 413 (19.2%) | 754 (24.9%) |
| $500,000 to $749,999 | 88 (4.1%) | 101 (3.3%) |
| $750,000 to $999,999 | 29 (1.3%) | 39 (1.3%) |
| $1,000,000 or more | 43 (2.0%) | 28 (0.9%) |
| Total | 2,157 (100.0%) | 3,031 (100.0%) |
Household Income by Mortgage Status in Morgantown
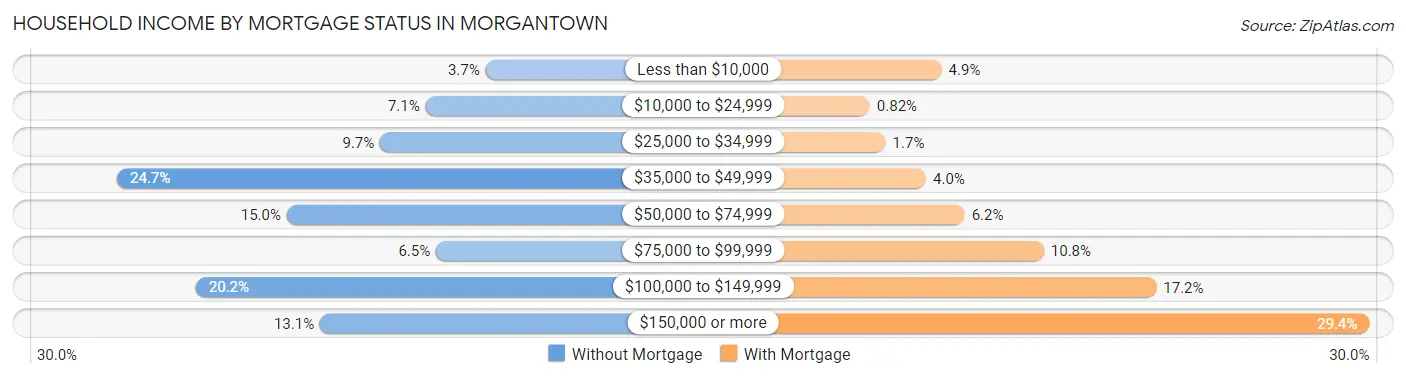
| Household Income | Without Mortgage | With Mortgage |
| Less than $10,000 | 79 (3.7%) | 149 (4.9%) |
| $10,000 to $24,999 | 153 (7.1%) | 25 (0.8%) |
| $25,000 to $34,999 | 209 (9.7%) | 52 (1.7%) |
| $35,000 to $49,999 | 533 (24.7%) | 122 (4.0%) |
| $50,000 to $74,999 | 324 (15.0%) | 189 (6.2%) |
| $75,000 to $99,999 | 140 (6.5%) | 326 (10.8%) |
| $100,000 to $149,999 | 436 (20.2%) | 521 (17.2%) |
| $150,000 or more | 283 (13.1%) | 890 (29.4%) |
| Total | 2,157 (100.0%) | 3,031 (100.0%) |
Property Value to Household Income Ratio in Morgantown
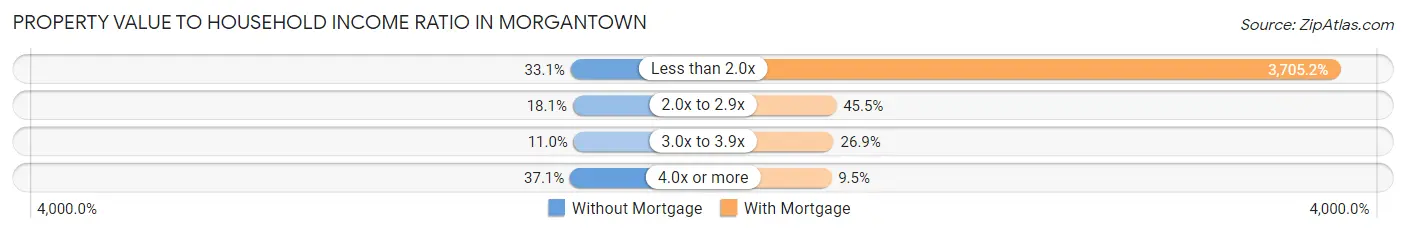
| Value-to-Income Ratio | Without Mortgage | With Mortgage |
| Less than 2.0x | 713 (33.1%) | 112,305 (3,705.2%) |
| 2.0x to 2.9x | 390 (18.1%) | 1,379 (45.5%) |
| 3.0x to 3.9x | 237 (11.0%) | 814 (26.9%) |
| 4.0x or more | 800 (37.1%) | 287 (9.5%) |
| Total | 2,157 (100.0%) | 3,031 (100.0%) |
Real Estate Taxes by Mortgage Status in Morgantown
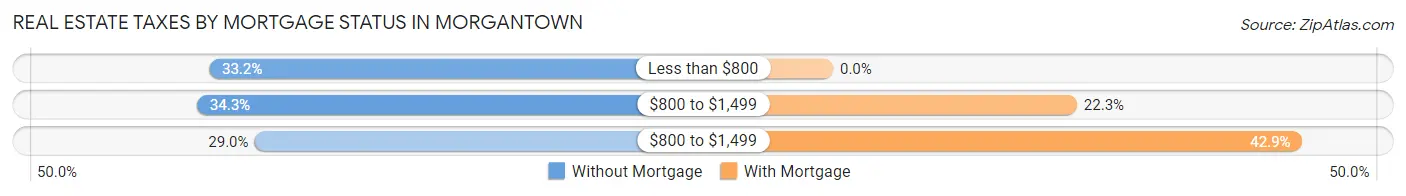
| Property Taxes | Without Mortgage | With Mortgage |
| Less than $800 | 715 (33.2%) | 0 (0.0%) |
| $800 to $1,499 | 739 (34.3%) | 675 (22.3%) |
| $800 to $1,499 | 626 (29.0%) | 1,299 (42.9%) |
| Total | 2,157 (100.0%) | 3,031 (100.0%) |
Health & Disability in Morgantown
Health Insurance Coverage by Age in Morgantown
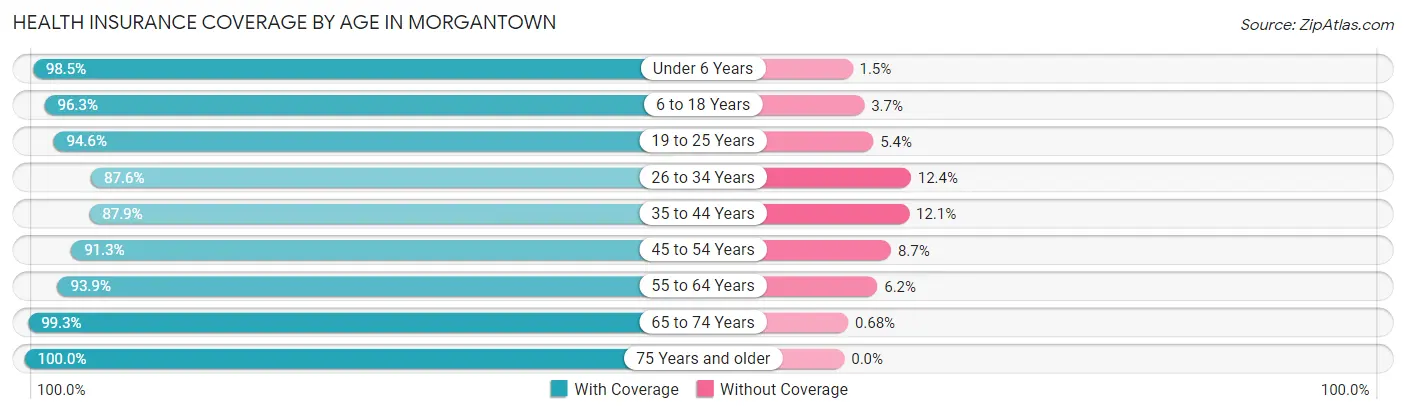
| Age Bracket | With Coverage | Without Coverage |
| Under 6 Years | 1,212 (98.5%) | 19 (1.5%) |
| 6 to 18 Years | 4,295 (96.3%) | 166 (3.7%) |
| 19 to 25 Years | 10,181 (94.6%) | 581 (5.4%) |
| 26 to 34 Years | 3,307 (87.6%) | 468 (12.4%) |
| 35 to 44 Years | 2,197 (87.9%) | 302 (12.1%) |
| 45 to 54 Years | 1,962 (91.3%) | 187 (8.7%) |
| 55 to 64 Years | 2,303 (93.9%) | 151 (6.1%) |
| 65 to 74 Years | 1,893 (99.3%) | 13 (0.7%) |
| 75 Years and older | 920 (100.0%) | 0 (0.0%) |
| Total | 28,270 (93.7%) | 1,887 (6.3%) |
Health Insurance Coverage by Citizenship Status in Morgantown
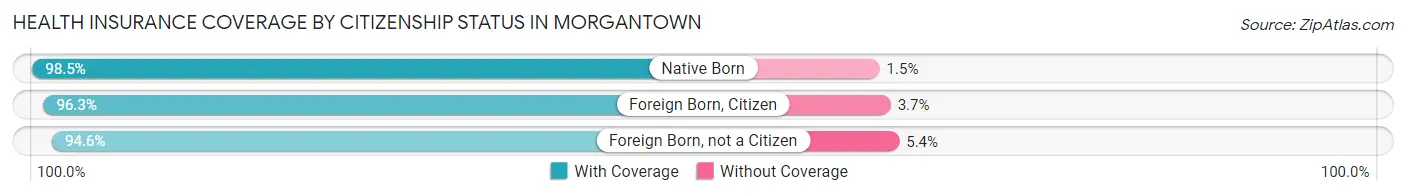
| Citizenship Status | With Coverage | Without Coverage |
| Native Born | 1,212 (98.5%) | 19 (1.5%) |
| Foreign Born, Citizen | 4,295 (96.3%) | 166 (3.7%) |
| Foreign Born, not a Citizen | 10,181 (94.6%) | 581 (5.4%) |
Health Insurance Coverage by Household Income in Morgantown
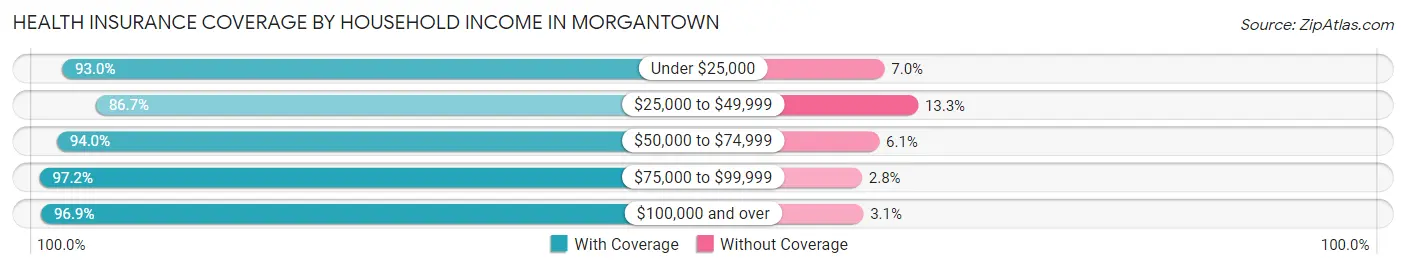
| Household Income | With Coverage | Without Coverage |
| Under $25,000 | 7,279 (93.0%) | 551 (7.0%) |
| $25,000 to $49,999 | 3,343 (86.7%) | 514 (13.3%) |
| $50,000 to $74,999 | 2,811 (94.0%) | 181 (6.0%) |
| $75,000 to $99,999 | 2,408 (97.2%) | 70 (2.8%) |
| $100,000 and over | 7,722 (96.9%) | 245 (3.1%) |
Public vs Private Health Insurance Coverage by Age in Morgantown
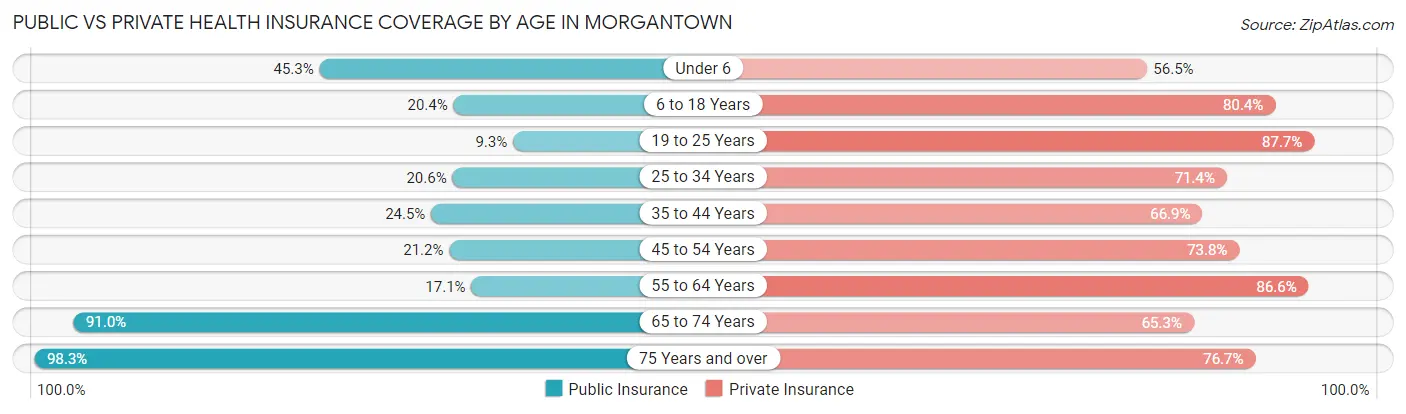
| Age Bracket | Public Insurance | Private Insurance |
| Under 6 | 557 (45.3%) | 696 (56.5%) |
| 6 to 18 Years | 909 (20.4%) | 3,588 (80.4%) |
| 19 to 25 Years | 1,004 (9.3%) | 9,434 (87.7%) |
| 25 to 34 Years | 777 (20.6%) | 2,697 (71.4%) |
| 35 to 44 Years | 613 (24.5%) | 1,672 (66.9%) |
| 45 to 54 Years | 455 (21.2%) | 1,585 (73.8%) |
| 55 to 64 Years | 419 (17.1%) | 2,126 (86.6%) |
| 65 to 74 Years | 1,735 (91.0%) | 1,245 (65.3%) |
| 75 Years and over | 904 (98.3%) | 706 (76.7%) |
| Total | 7,373 (24.4%) | 23,749 (78.7%) |
Disability Status by Sex by Age in Morgantown
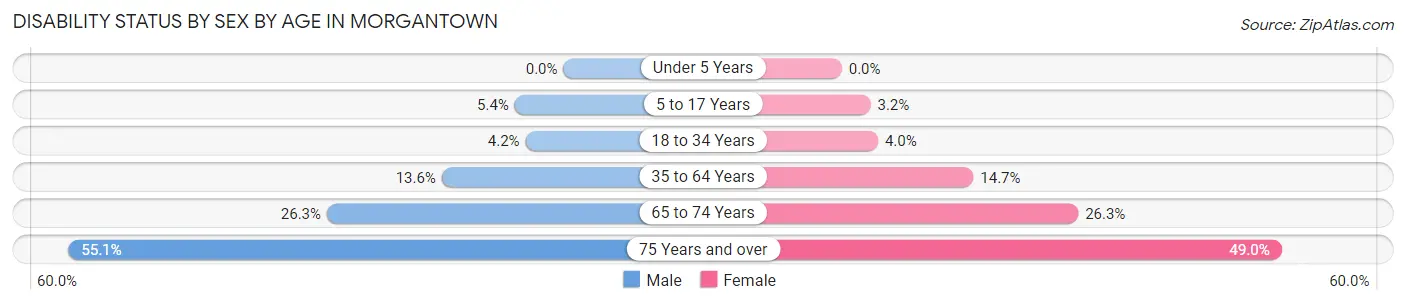
| Age Bracket | Male | Female |
| Under 5 Years | 0 (0.0%) | 0 (0.0%) |
| 5 to 17 Years | 63 (5.4%) | 27 (3.2%) |
| 18 to 34 Years | 395 (4.2%) | 315 (4.0%) |
| 35 to 64 Years | 509 (13.6%) | 490 (14.6%) |
| 65 to 74 Years | 255 (26.3%) | 247 (26.3%) |
| 75 Years and over | 210 (55.1%) | 264 (49.0%) |
Disability Class by Sex by Age in Morgantown
Disability Class: Hearing Difficulty
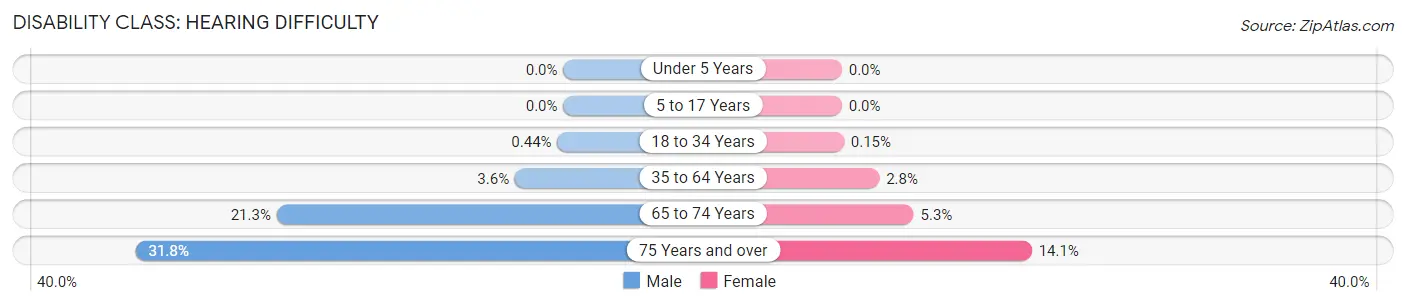
| Age Bracket | Male | Female |
| Under 5 Years | 0 (0.0%) | 0 (0.0%) |
| 5 to 17 Years | 0 (0.0%) | 0 (0.0%) |
| 18 to 34 Years | 41 (0.4%) | 12 (0.2%) |
| 35 to 64 Years | 135 (3.6%) | 93 (2.8%) |
| 65 to 74 Years | 206 (21.3%) | 50 (5.3%) |
| 75 Years and over | 121 (31.8%) | 76 (14.1%) |
Disability Class: Vision Difficulty
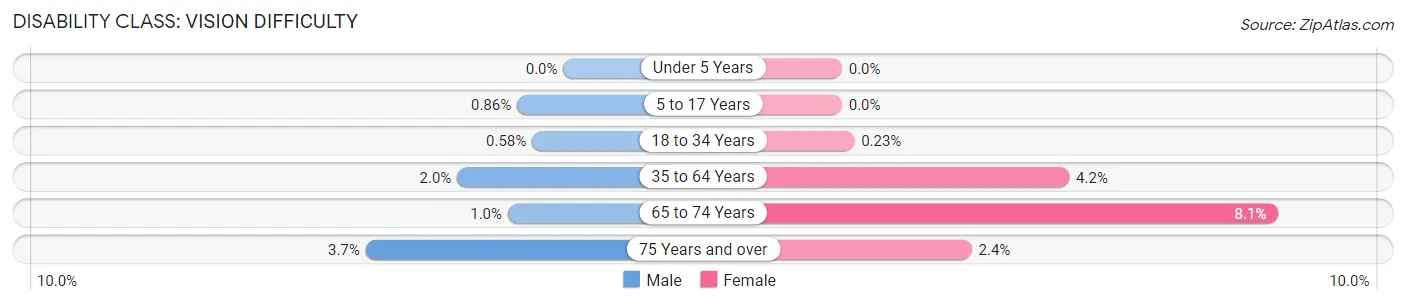
| Age Bracket | Male | Female |
| Under 5 Years | 0 (0.0%) | 0 (0.0%) |
| 5 to 17 Years | 10 (0.9%) | 0 (0.0%) |
| 18 to 34 Years | 54 (0.6%) | 18 (0.2%) |
| 35 to 64 Years | 74 (2.0%) | 141 (4.2%) |
| 65 to 74 Years | 10 (1.0%) | 76 (8.1%) |
| 75 Years and over | 14 (3.7%) | 13 (2.4%) |
Disability Class: Cognitive Difficulty
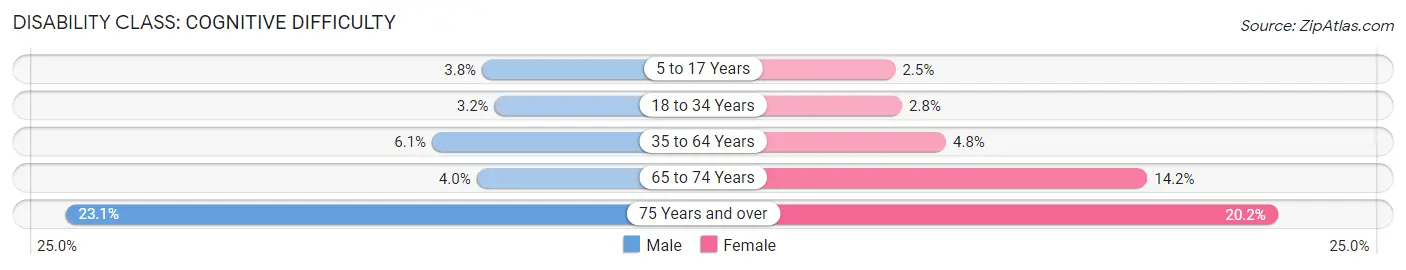
| Age Bracket | Male | Female |
| 5 to 17 Years | 44 (3.8%) | 21 (2.5%) |
| 18 to 34 Years | 300 (3.2%) | 219 (2.8%) |
| 35 to 64 Years | 229 (6.1%) | 162 (4.8%) |
| 65 to 74 Years | 39 (4.0%) | 133 (14.2%) |
| 75 Years and over | 88 (23.1%) | 109 (20.2%) |
Disability Class: Ambulatory Difficulty
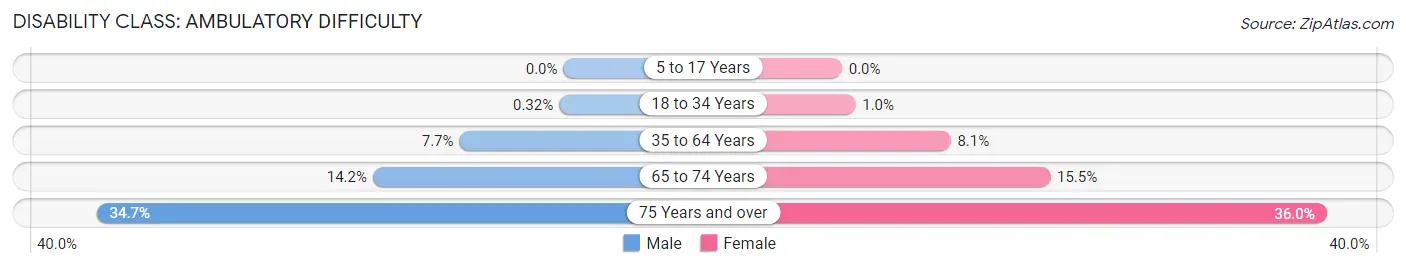
| Age Bracket | Male | Female |
| 5 to 17 Years | 0 (0.0%) | 0 (0.0%) |
| 18 to 34 Years | 30 (0.3%) | 78 (1.0%) |
| 35 to 64 Years | 290 (7.7%) | 270 (8.1%) |
| 65 to 74 Years | 137 (14.1%) | 145 (15.5%) |
| 75 Years and over | 132 (34.6%) | 194 (36.0%) |
Disability Class: Self-Care Difficulty
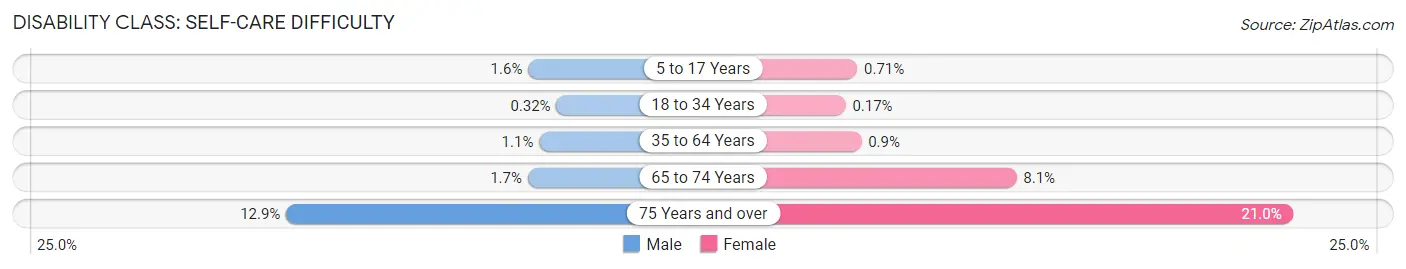
| Age Bracket | Male | Female |
| 5 to 17 Years | 19 (1.6%) | 6 (0.7%) |
| 18 to 34 Years | 30 (0.3%) | 13 (0.2%) |
| 35 to 64 Years | 42 (1.1%) | 30 (0.9%) |
| 65 to 74 Years | 16 (1.7%) | 76 (8.1%) |
| 75 Years and over | 49 (12.9%) | 113 (21.0%) |
Technology Access in Morgantown
Computing Device Access in Morgantown
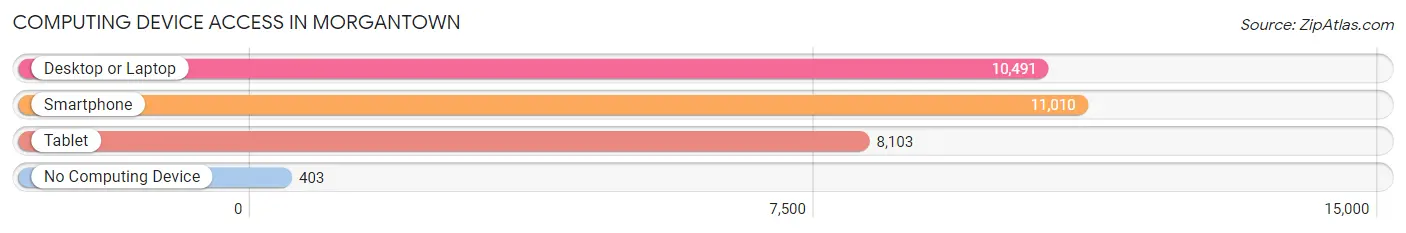
| Device Type | # Households | % Households |
| Desktop or Laptop | 10,491 | 87.2% |
| Smartphone | 11,010 | 91.5% |
| Tablet | 8,103 | 67.3% |
| No Computing Device | 403 | 3.4% |
| Total | 12,035 | 100.0% |
Internet Access in Morgantown
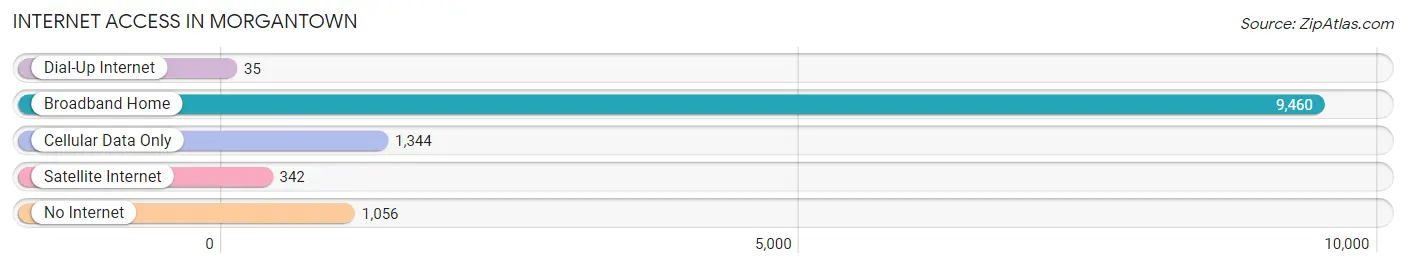
| Internet Type | # Households | % Households |
| Dial-Up Internet | 35 | 0.3% |
| Broadband Home | 9,460 | 78.6% |
| Cellular Data Only | 1,344 | 11.2% |
| Satellite Internet | 342 | 2.8% |
| No Internet | 1,056 | 8.8% |
| Total | 12,035 | 100.0% |
Morgantown Summary
Morgantown, West Virginia is a city located in Monongalia County in the north-central part of the state. It is the county seat and the largest city in the county. The city is situated along the Monongahela River and is part of the Pittsburgh metropolitan area. The city has a population of 30,817 as of the 2010 census.
History
Morgantown was founded in 1772 by Zackquill Morgan, a Revolutionary War veteran and surveyor. He named the town after himself and it quickly became a thriving settlement. The town was incorporated in 1785 and was the first town in Monongalia County. In 1858, the town was designated as the county seat.
During the Civil War, Morgantown was a major center of Union activity. The town was the site of several skirmishes and battles, including the Battle of Morgantown in 1861. After the war, the town continued to grow and by the late 19th century, it had become an important industrial center.
In 1895, the West Virginia University was founded in Morgantown. The university has grown to become one of the largest in the state and is a major economic driver for the city.
Geography
Morgantown is located in north-central West Virginia at the confluence of the Monongahela and Cheat Rivers. The city is situated in the Appalachian Plateau region of the state and is surrounded by rolling hills and mountains. The city has a total area of 10.3 square miles, of which 10.2 square miles is land and 0.1 square miles is water.
Economy
Morgantown’s economy is largely driven by West Virginia University, which is the largest employer in the city. Other major employers include the Monongalia County Board of Education, Mon Health System, Mylan Pharmaceuticals, and the United States Postal Service.
The city is also home to several major industries, including healthcare, education, manufacturing, and tourism. The city is home to several major companies, including Mylan Pharmaceuticals, Mon Health System, and the United States Postal Service.
Demographics
As of the 2010 census, there were 30,817 people, 11,945 households, and 5,945 families residing in the city. The population density was 3,000.7 people per square mile. The racial makeup of the city was 87.2% White, 6.2% African American, 0.3% Native American, 3.2% Asian, 0.1% Pacific Islander, 0.7% from other races, and 2.3% from two or more races. Hispanic or Latino of any race were 2.2% of the population.
The median income for a household in the city was $30,817, and the median income for a family was $45,817. The per capita income for the city was $19,817. About 15.2% of families and 24.2% of the population were below the poverty line, including 28.2% of those under age 18 and 11.2% of those age 65 or over.
Common Questions
What is Per Capita Income in Morgantown?
Per Capita income in Morgantown is $28,620.
What is the Median Family Income in Morgantown?
Median Family Income in Morgantown is $91,118.
What is the Median Household income in Morgantown?
Median Household Income in Morgantown is $41,103.
What is Income or Wage Gap in Morgantown?
Income or Wage Gap in Morgantown is 29.1%.
Women in Morgantown earn 70.9 cents for every dollar earned by a man.
What is Family Income Deficit in Morgantown?
Family Income Deficit in Morgantown is $13,249.
Families that are below poverty line in Morgantown earn $13,249 less on average than the poverty threshold level.
What is Inequality or Gini Index in Morgantown?
Inequality or Gini Index in Morgantown is 0.55.
What is the Total Population of Morgantown?
Total Population of Morgantown is 30,220.
What is the Total Male Population of Morgantown?
Total Male Population of Morgantown is 16,284.
What is the Total Female Population of Morgantown?
Total Female Population of Morgantown is 13,936.
What is the Ratio of Males per 100 Females in Morgantown?
There are 116.85 Males per 100 Females in Morgantown.
What is the Ratio of Females per 100 Males in Morgantown?
There are 85.58 Females per 100 Males in Morgantown.
What is the Median Population Age in Morgantown?
Median Population Age in Morgantown is 23.8 Years.
What is the Average Family Size in Morgantown
Average Family Size in Morgantown is 2.7 People.
What is the Average Household Size in Morgantown
Average Household Size in Morgantown is 2.1 People.
How Large is the Labor Force in Morgantown?
There are 15,870 People in the Labor Forcein in Morgantown.
What is the Percentage of People in the Labor Force in Morgantown?
57.9% of People are in the Labor Force in Morgantown.
What is the Unemployment Rate in Morgantown?
Unemployment Rate in Morgantown is 9.9%.