Maynard, MA Map & Demographics
Maynard Map
Maynard Overview
$59,516
PER CAPITA INCOME
$150,714
AVG FAMILY INCOME
$112,524
AVG HOUSEHOLD INCOME
28.8%
WAGE / INCOME GAP [ % ]
71.2¢/ $1
WAGE / INCOME GAP [ $ ]
0.44
INEQUALITY / GINI INDEX
10,671
TOTAL POPULATION
5,402
MALE POPULATION
5,269
FEMALE POPULATION
102.52
MALES / 100 FEMALES
97.54
FEMALES / 100 MALES
40.8
MEDIAN AGE
3.0
AVG FAMILY SIZE
2.4
AVG HOUSEHOLD SIZE
6,271
LABOR FORCE [ PEOPLE ]
74.1%
PERCENT IN LABOR FORCE
4.3%
UNEMPLOYMENT RATE
Maynard Zip Codes
Maynard Area Codes
Income in Maynard
Income Overview in Maynard
Per Capita Income in Maynard is $59,516, while median incomes of families and households are $150,714 and $112,524 respectively.
| Characteristic | Number | Measure |
| Per Capita Income | 10,671 | $59,516 |
| Median Family Income | 2,980 | $150,714 |
| Mean Family Income | 2,980 | $179,377 |
| Median Household Income | 4,416 | $112,524 |
| Mean Household Income | 4,416 | $142,373 |
| Income Deficit | 2,980 | $0 |
| Wage / Income Gap (%) | 10,671 | 28.83% |
| Wage / Income Gap ($) | 10,671 | 71.17¢ per $1 |
| Gini / Inequality Index | 10,671 | 0.44 |
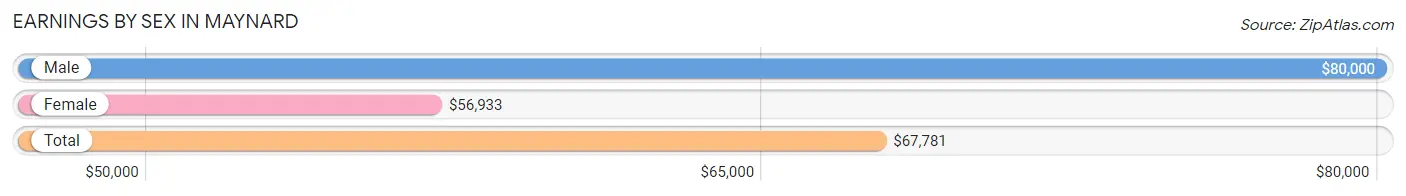
Earnings by Sex in Maynard
Average Earnings in Maynard are $67,781, $80,000 for men and $56,933 for women, a difference of 28.8%.
| Sex | Number | Average Earnings |
| Male | 3,160 (48.9%) | $80,000 |
| Female | 3,302 (51.1%) | $56,933 |
| Total | 6,462 (100.0%) | $67,781 |
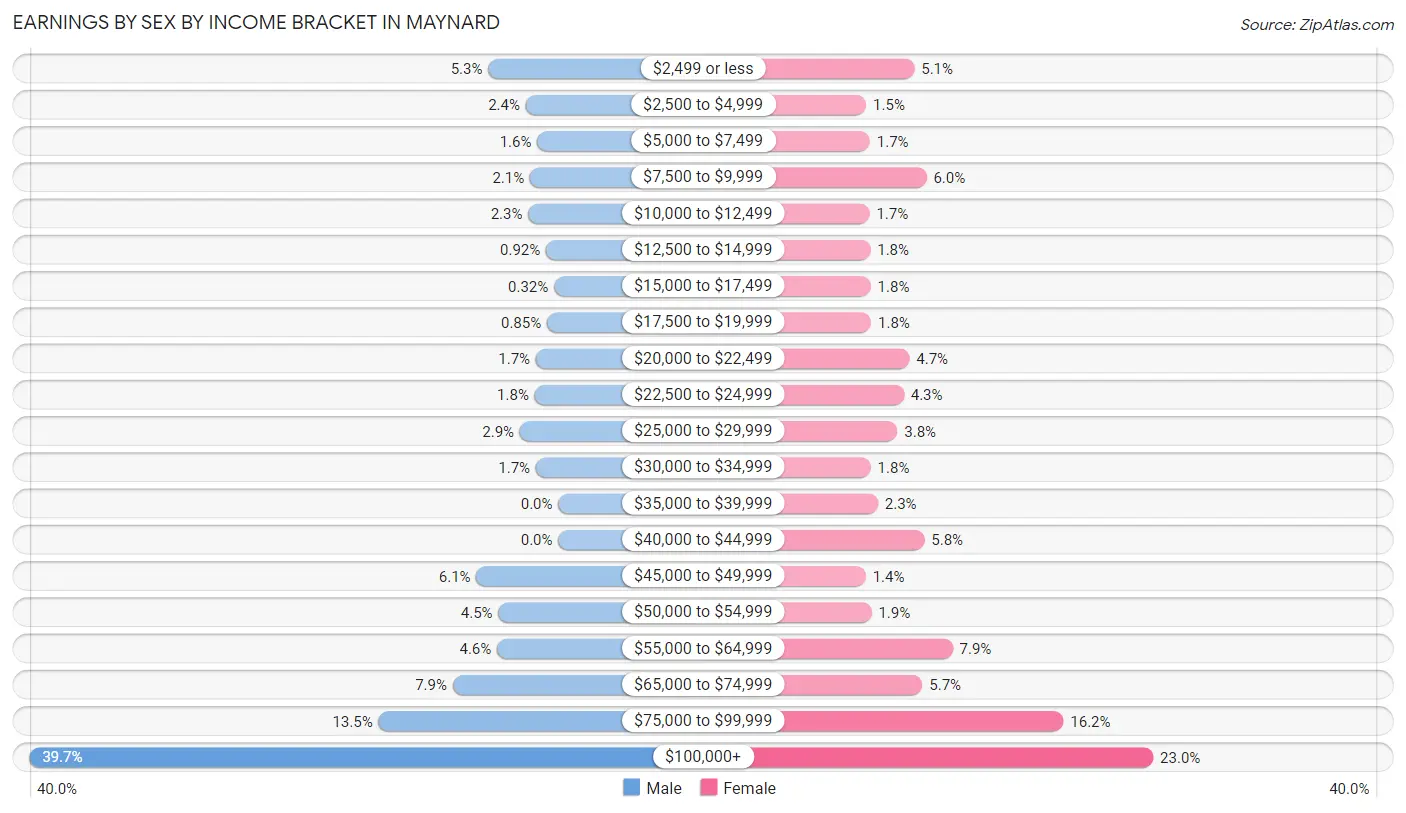
Earnings by Sex by Income Bracket in Maynard
The most common earnings brackets in Maynard are $100,000+ for men (1,253 | 39.7%) and $100,000+ for women (758 | 23.0%).
| Income | Male | Female |
| $2,499 or less | 166 (5.2%) | 167 (5.1%) |
| $2,500 to $4,999 | 77 (2.4%) | 48 (1.5%) |
| $5,000 to $7,499 | 50 (1.6%) | 57 (1.7%) |
| $7,500 to $9,999 | 67 (2.1%) | 197 (6.0%) |
| $10,000 to $12,499 | 71 (2.2%) | 56 (1.7%) |
| $12,500 to $14,999 | 29 (0.9%) | 58 (1.8%) |
| $15,000 to $17,499 | 10 (0.3%) | 59 (1.8%) |
| $17,500 to $19,999 | 27 (0.9%) | 60 (1.8%) |
| $20,000 to $22,499 | 53 (1.7%) | 155 (4.7%) |
| $22,500 to $24,999 | 56 (1.8%) | 141 (4.3%) |
| $25,000 to $29,999 | 91 (2.9%) | 125 (3.8%) |
| $30,000 to $34,999 | 53 (1.7%) | 59 (1.8%) |
| $35,000 to $39,999 | 0 (0.0%) | 77 (2.3%) |
| $40,000 to $44,999 | 0 (0.0%) | 192 (5.8%) |
| $45,000 to $49,999 | 194 (6.1%) | 47 (1.4%) |
| $50,000 to $54,999 | 142 (4.5%) | 61 (1.8%) |
| $55,000 to $64,999 | 145 (4.6%) | 262 (7.9%) |
| $65,000 to $74,999 | 250 (7.9%) | 187 (5.7%) |
| $75,000 to $99,999 | 426 (13.5%) | 536 (16.2%) |
| $100,000+ | 1,253 (39.7%) | 758 (23.0%) |
| Total | 3,160 (100.0%) | 3,302 (100.0%) |
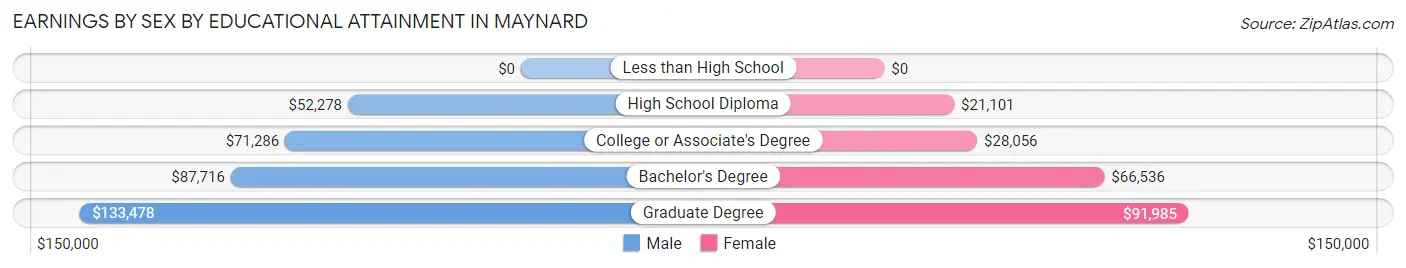
Earnings by Sex by Educational Attainment in Maynard
Average earnings in Maynard are $85,402 for men and $64,938 for women, a difference of 24.0%. Men with an educational attainment of graduate degree enjoy the highest average annual earnings of $133,478, while those with high school diploma education earn the least with $52,278. Women with an educational attainment of graduate degree earn the most with the average annual earnings of $91,985, while those with high school diploma education have the smallest earnings of $21,101.
| Educational Attainment | Male Income | Female Income |
| Less than High School | - | - |
| High School Diploma | $52,278 | $21,101 |
| College or Associate's Degree | $71,286 | $28,056 |
| Bachelor's Degree | $87,716 | $66,536 |
| Graduate Degree | $133,478 | $91,985 |
| Total | $85,402 | $64,938 |
Family Income in Maynard
Family Income Brackets in Maynard
According to the Maynard family income data, there are 1,031 families falling into the $200,000+ income range, which is the most common income bracket and makes up 34.6% of all families. Conversely, the $10,000 to $14,999 income bracket is the least frequent group with only 48 families (1.6%) belonging to this category.
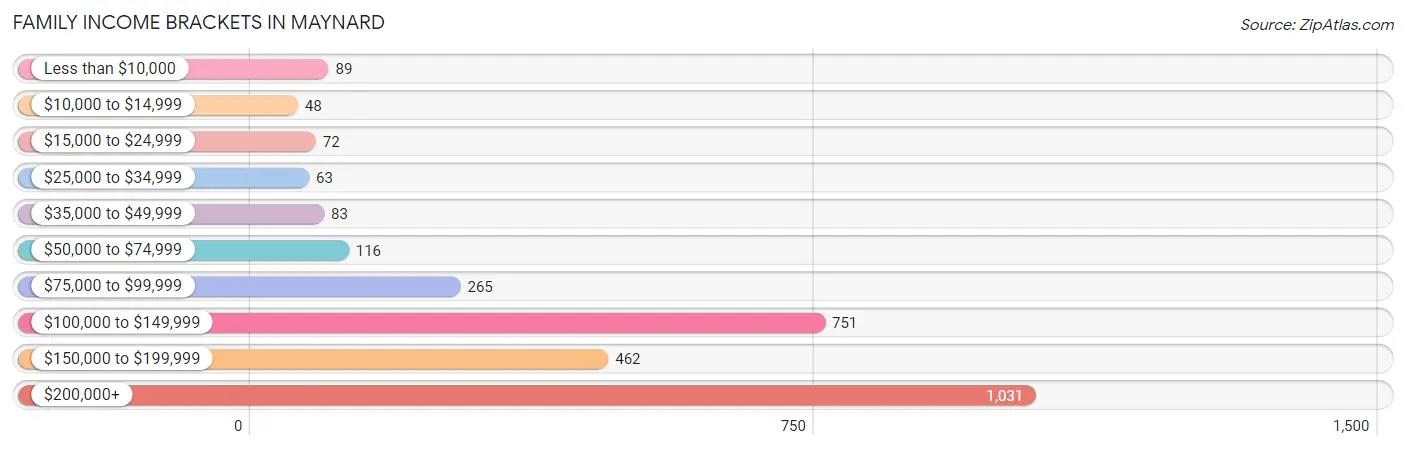
| Income Bracket | # Families | % Families |
| Less than $10,000 | 89 | 3.0% |
| $10,000 to $14,999 | 48 | 1.6% |
| $15,000 to $24,999 | 72 | 2.4% |
| $25,000 to $34,999 | 63 | 2.1% |
| $35,000 to $49,999 | 83 | 2.8% |
| $50,000 to $74,999 | 116 | 3.9% |
| $75,000 to $99,999 | 265 | 8.9% |
| $100,000 to $149,999 | 751 | 25.2% |
| $150,000 to $199,999 | 462 | 15.5% |
| $200,000+ | 1,031 | 34.6% |
Family Income by Famaliy Size in Maynard
4-person families (836 | 28.1%) account for the highest median family income in Maynard with $199,615 per family, while 2-person families (1,365 | 45.8%) have the highest median income of $65,136 per family member.
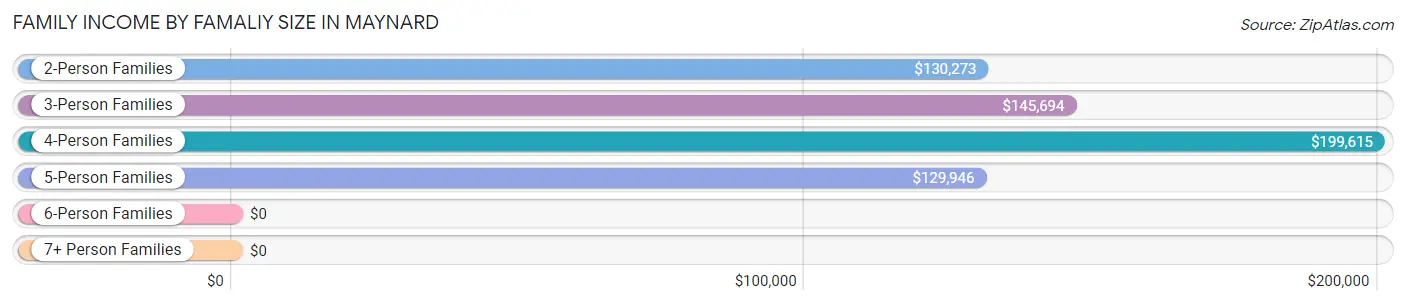
| Income Bracket | # Families | Median Income |
| 2-Person Families | 1,365 (45.8%) | $130,273 |
| 3-Person Families | 670 (22.5%) | $145,694 |
| 4-Person Families | 836 (28.1%) | $199,615 |
| 5-Person Families | 95 (3.2%) | $129,946 |
| 6-Person Families | 0 (0.0%) | $0 |
| 7+ Person Families | 14 (0.5%) | $0 |
| Total | 2,980 (100.0%) | $150,714 |
Family Income by Number of Earners in Maynard
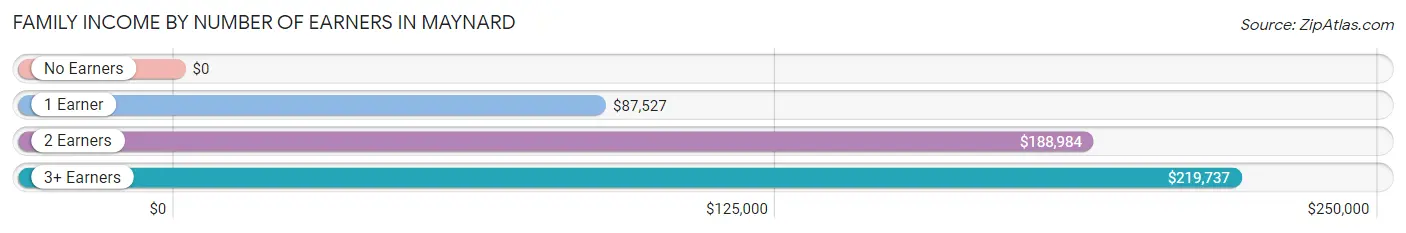
| Number of Earners | # Families | Median Income |
| No Earners | 304 (10.2%) | $0 |
| 1 Earner | 587 (19.7%) | $87,527 |
| 2 Earners | 1,743 (58.5%) | $188,984 |
| 3+ Earners | 346 (11.6%) | $219,737 |
| Total | 2,980 (100.0%) | $150,714 |
Household Income in Maynard
Household Income Brackets in Maynard
With 1,086 households falling in the category, the $200,000+ income range is the most frequent in Maynard, accounting for 24.6% of all households. In contrast, only 71 households (1.6%) fall into the $10,000 to $14,999 income bracket, making it the least populous group.
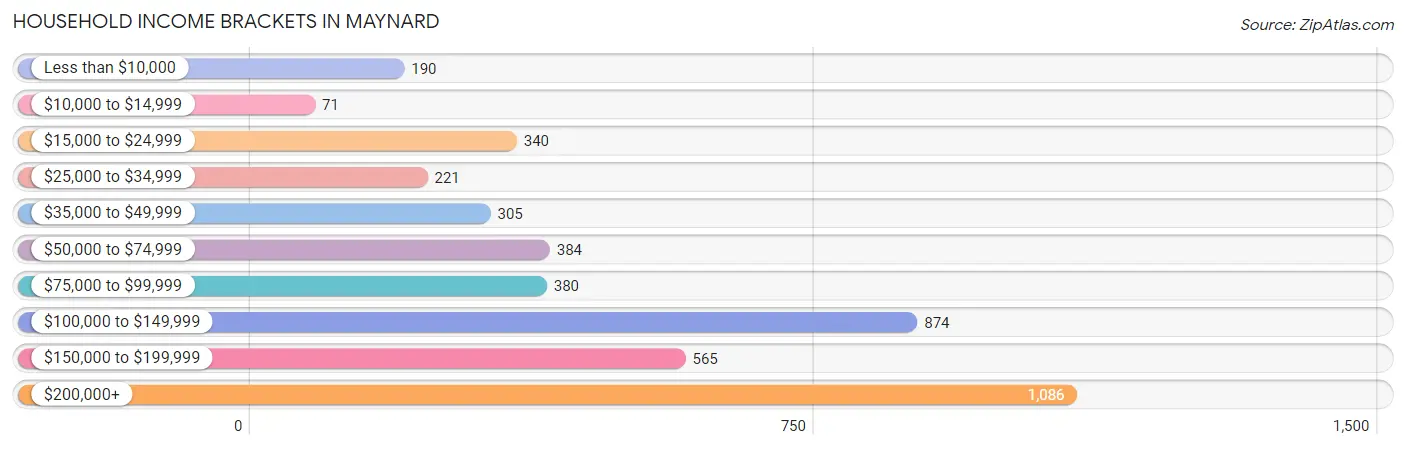
| Income Bracket | # Households | % Households |
| Less than $10,000 | 190 | 4.3% |
| $10,000 to $14,999 | 71 | 1.6% |
| $15,000 to $24,999 | 340 | 7.7% |
| $25,000 to $34,999 | 221 | 5.0% |
| $35,000 to $49,999 | 305 | 6.9% |
| $50,000 to $74,999 | 384 | 8.7% |
| $75,000 to $99,999 | 380 | 8.6% |
| $100,000 to $149,999 | 874 | 19.8% |
| $150,000 to $199,999 | 565 | 12.8% |
| $200,000+ | 1,086 | 24.6% |
Household Income by Householder Age in Maynard
The median household income in Maynard is $112,524, with the highest median household income of $141,467 found in the 45 to 64 years age bracket for the primary householder. A total of 1,747 households (39.6%) fall into this category. Meanwhile, the 65+ years age bracket for the primary householder has the lowest median household income of $43,068, with 1,032 households (23.4%) in this group.
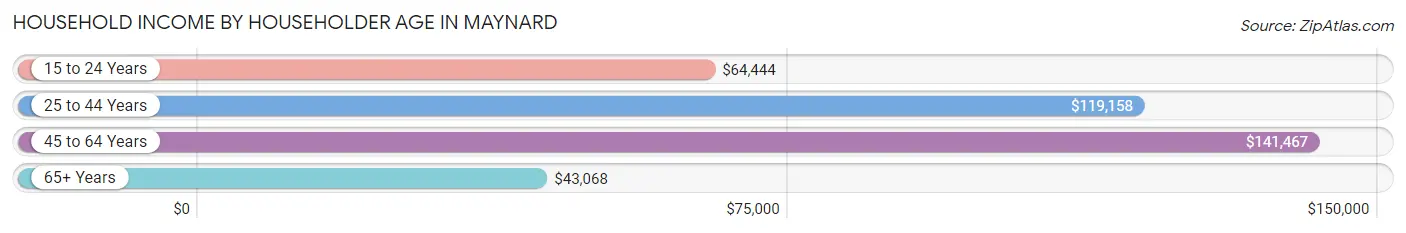
| Income Bracket | # Households | Median Income |
| 15 to 24 Years | 70 (1.6%) | $64,444 |
| 25 to 44 Years | 1,567 (35.5%) | $119,158 |
| 45 to 64 Years | 1,747 (39.6%) | $141,467 |
| 65+ Years | 1,032 (23.4%) | $43,068 |
| Total | 4,416 (100.0%) | $112,524 |
Poverty in Maynard
Income Below Poverty by Sex and Age in Maynard
With 10.1% poverty level for males and 6.3% for females among the residents of Maynard, 15 year old males and 12 to 14 year old females are the most vulnerable to poverty, with 51 males (40.8%) and 46 females (56.1%) in their respective age groups living below the poverty level.
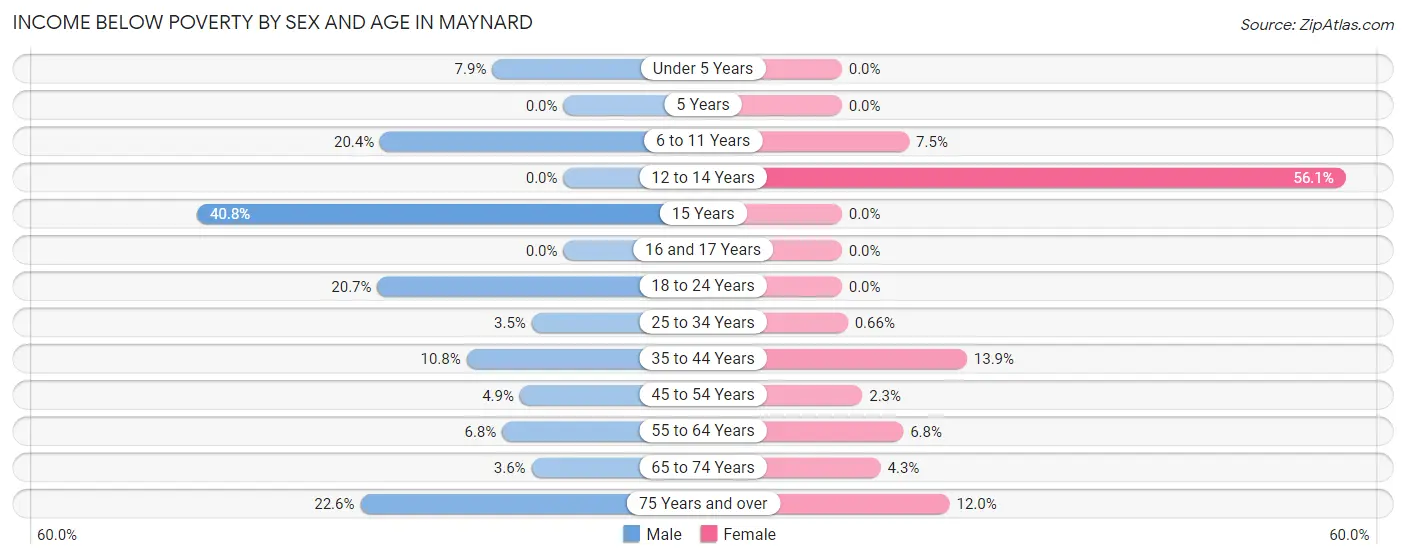
| Age Bracket | Male | Female |
| Under 5 Years | 16 (7.9%) | 0 (0.0%) |
| 5 Years | 0 (0.0%) | 0 (0.0%) |
| 6 to 11 Years | 119 (20.4%) | 21 (7.5%) |
| 12 to 14 Years | 0 (0.0%) | 46 (56.1%) |
| 15 Years | 51 (40.8%) | 0 (0.0%) |
| 16 and 17 Years | 0 (0.0%) | 0 (0.0%) |
| 18 to 24 Years | 64 (20.7%) | 0 (0.0%) |
| 25 to 34 Years | 18 (3.5%) | 4 (0.7%) |
| 35 to 44 Years | 87 (10.8%) | 130 (13.9%) |
| 45 to 54 Years | 33 (4.9%) | 18 (2.3%) |
| 55 to 64 Years | 67 (6.8%) | 50 (6.8%) |
| 65 to 74 Years | 16 (3.5%) | 16 (4.3%) |
| 75 Years and over | 71 (22.6%) | 48 (12.0%) |
| Total | 542 (10.1%) | 333 (6.3%) |
Income Above Poverty by Sex and Age in Maynard
According to the poverty statistics in Maynard, males aged 5 years and females aged under 5 years are the age groups that are most secure financially, with 100.0% of males and 100.0% of females in these age groups living above the poverty line.
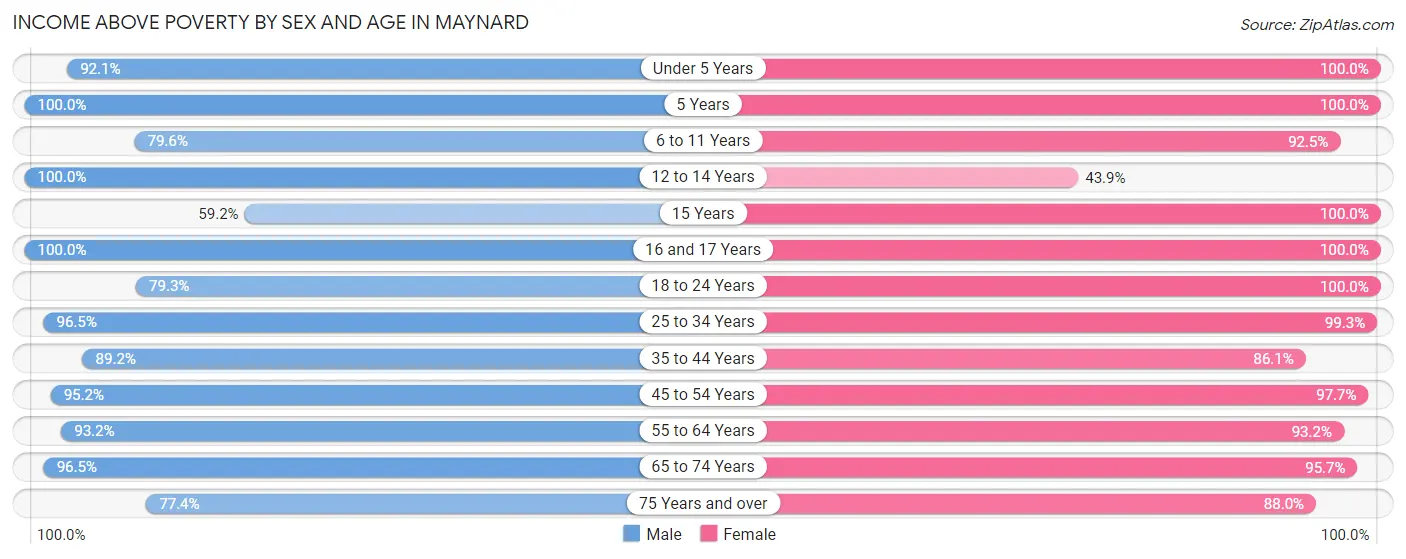
| Age Bracket | Male | Female |
| Under 5 Years | 186 (92.1%) | 357 (100.0%) |
| 5 Years | 82 (100.0%) | 241 (100.0%) |
| 6 to 11 Years | 464 (79.6%) | 259 (92.5%) |
| 12 to 14 Years | 200 (100.0%) | 36 (43.9%) |
| 15 Years | 74 (59.2%) | 33 (100.0%) |
| 16 and 17 Years | 132 (100.0%) | 64 (100.0%) |
| 18 to 24 Years | 245 (79.3%) | 378 (100.0%) |
| 25 to 34 Years | 492 (96.5%) | 605 (99.3%) |
| 35 to 44 Years | 720 (89.2%) | 803 (86.1%) |
| 45 to 54 Years | 648 (95.2%) | 773 (97.7%) |
| 55 to 64 Years | 916 (93.2%) | 681 (93.2%) |
| 65 to 74 Years | 435 (96.5%) | 354 (95.7%) |
| 75 Years and over | 243 (77.4%) | 352 (88.0%) |
| Total | 4,837 (89.9%) | 4,936 (93.7%) |
Income Below Poverty Among Married-Couple Families in Maynard
The poverty statistics for married-couple families in Maynard show that 2.0% or 47 of the total 2,339 families live below the poverty line. Families with no children have the highest poverty rate of 3.7%, comprising of 47 families. On the other hand, families with 1 or 2 children have the lowest poverty rate of 0.0%, which includes 0 families.
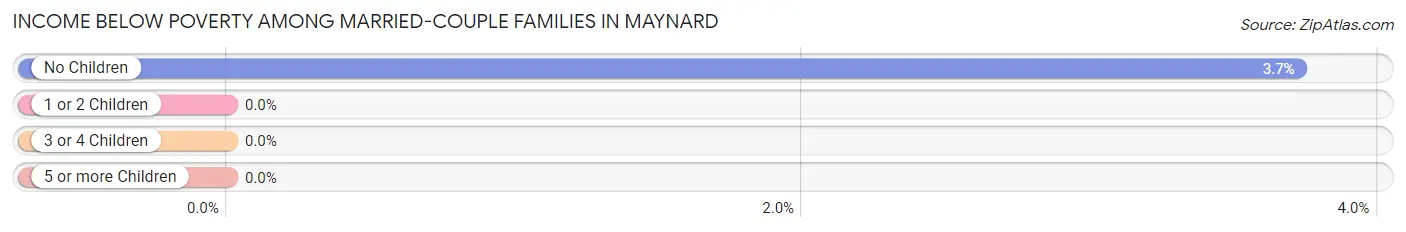
| Children | Above Poverty | Below Poverty |
| No Children | 1,218 (96.3%) | 47 (3.7%) |
| 1 or 2 Children | 1,019 (100.0%) | 0 (0.0%) |
| 3 or 4 Children | 55 (100.0%) | 0 (0.0%) |
| 5 or more Children | 0 (0.0%) | 0 (0.0%) |
| Total | 2,292 (98.0%) | 47 (2.0%) |
Income Below Poverty Among Single-Parent Households in Maynard
According to the poverty data in Maynard, 23.5% or 50 single-father households and 22.4% or 96 single-mother households are living below the poverty line. Among single-father households, those with 1 or 2 children have the highest poverty rate, with 50 households (41.3%) experiencing poverty. Likewise, among single-mother households, those with 1 or 2 children have the highest poverty rate, with 96 households (39.8%) falling below the poverty line.
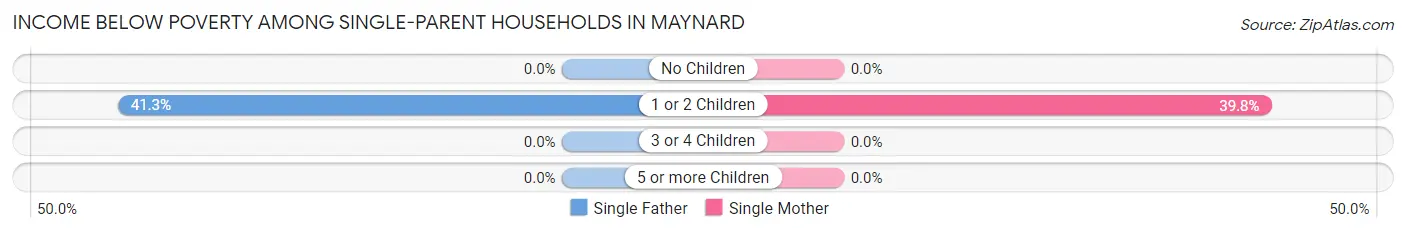
| Children | Single Father | Single Mother |
| No Children | 0 (0.0%) | 0 (0.0%) |
| 1 or 2 Children | 50 (41.3%) | 96 (39.8%) |
| 3 or 4 Children | 0 (0.0%) | 0 (0.0%) |
| 5 or more Children | 0 (0.0%) | 0 (0.0%) |
| Total | 50 (23.5%) | 96 (22.4%) |
Income Below Poverty Among Married-Couple vs Single-Parent Households in Maynard
The poverty data for Maynard shows that 47 of the married-couple family households (2.0%) and 146 of the single-parent households (22.8%) are living below the poverty level. Within the married-couple family households, those with no children have the highest poverty rate, with 47 households (3.7%) falling below the poverty line. Among the single-parent households, those with 1 or 2 children have the highest poverty rate, with 146 household (40.3%) living below poverty.
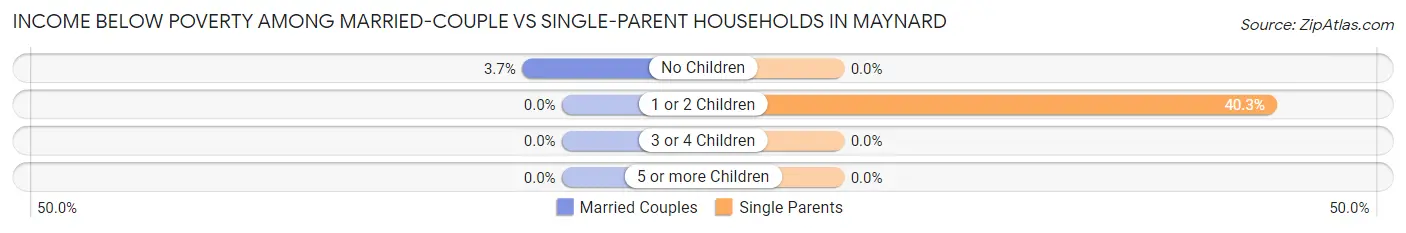
| Children | Married-Couple Families | Single-Parent Households |
| No Children | 47 (3.7%) | 0 (0.0%) |
| 1 or 2 Children | 0 (0.0%) | 146 (40.3%) |
| 3 or 4 Children | 0 (0.0%) | 0 (0.0%) |
| 5 or more Children | 0 (0.0%) | 0 (0.0%) |
| Total | 47 (2.0%) | 146 (22.8%) |
Race in Maynard
The most populous races in Maynard are White / Caucasian (9,238 | 86.6%), Two or more Races (801 | 7.5%), and Asian (460 | 4.3%).
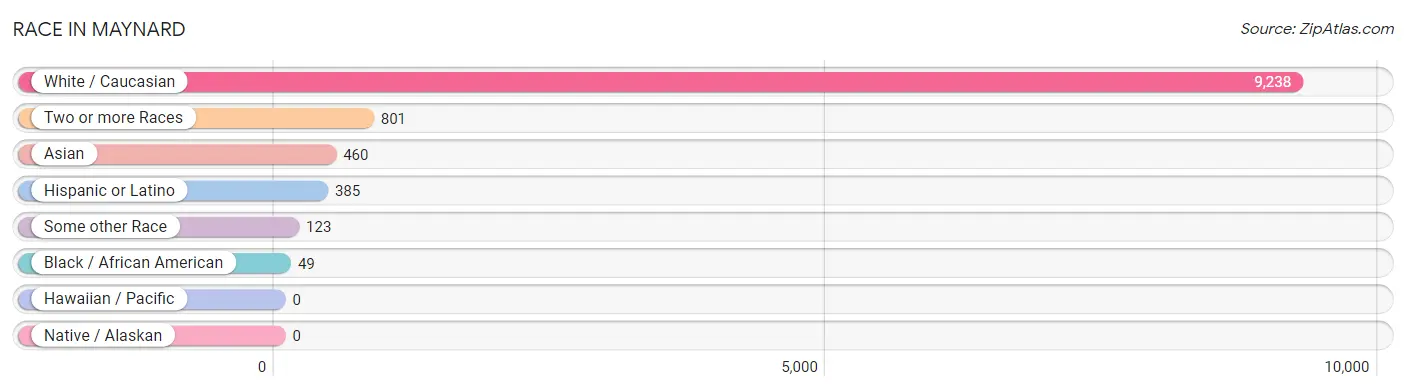
| Race | # Population | % Population |
| Asian | 460 | 4.3% |
| Black / African American | 49 | 0.5% |
| Hawaiian / Pacific | 0 | 0.0% |
| Hispanic or Latino | 385 | 3.6% |
| Native / Alaskan | 0 | 0.0% |
| White / Caucasian | 9,238 | 86.6% |
| Two or more Races | 801 | 7.5% |
| Some other Race | 123 | 1.1% |
| Total | 10,671 | 100.0% |
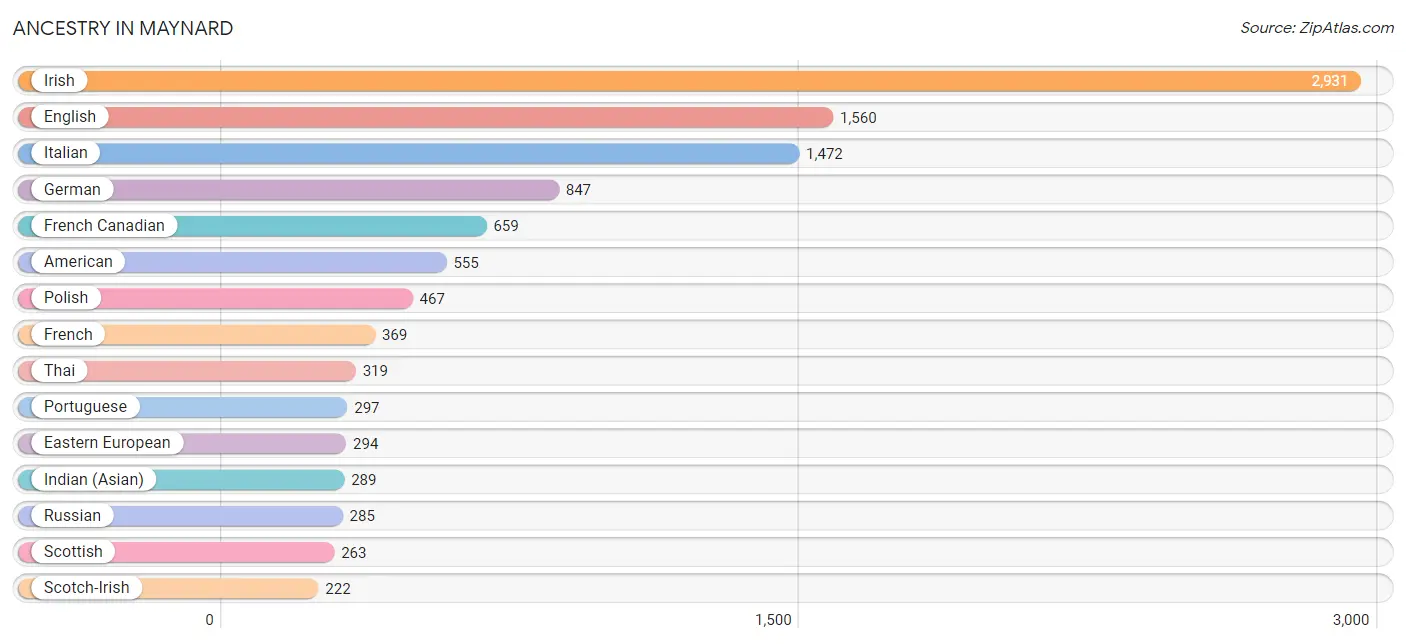
Ancestry in Maynard
The most populous ancestries reported in Maynard are Irish (2,931 | 27.5%), English (1,560 | 14.6%), Italian (1,472 | 13.8%), German (847 | 7.9%), and French Canadian (659 | 6.2%), together accounting for 70.0% of all Maynard residents.
| Ancestry | # Population | % Population |
| Albanian | 16 | 0.2% |
| American | 555 | 5.2% |
| Arab | 114 | 1.1% |
| Austrian | 10 | 0.1% |
| Belgian | 16 | 0.2% |
| Bhutanese | 41 | 0.4% |
| Brazilian | 26 | 0.2% |
| British | 35 | 0.3% |
| Canadian | 44 | 0.4% |
| Central American | 49 | 0.5% |
| Cherokee | 116 | 1.1% |
| Chippewa | 33 | 0.3% |
| Colombian | 70 | 0.7% |
| Croatian | 24 | 0.2% |
| Czech | 46 | 0.4% |
| Danish | 115 | 1.1% |
| Dominican | 17 | 0.2% |
| Dutch | 42 | 0.4% |
| Eastern European | 294 | 2.8% |
| Egyptian | 41 | 0.4% |
| English | 1,560 | 14.6% |
| European | 201 | 1.9% |
| Finnish | 115 | 1.1% |
| French | 369 | 3.5% |
| French Canadian | 659 | 6.2% |
| German | 847 | 7.9% |
| Greek | 128 | 1.2% |
| Guatemalan | 49 | 0.5% |
| Hungarian | 17 | 0.2% |
| Indian (Asian) | 289 | 2.7% |
| Irish | 2,931 | 27.5% |
| Italian | 1,472 | 13.8% |
| Korean | 19 | 0.2% |
| Lebanese | 45 | 0.4% |
| Lithuanian | 120 | 1.1% |
| Mexican | 155 | 1.5% |
| Moroccan | 28 | 0.3% |
| Northern European | 32 | 0.3% |
| Norwegian | 19 | 0.2% |
| Peruvian | 15 | 0.1% |
| Polish | 467 | 4.4% |
| Portuguese | 297 | 2.8% |
| Puerto Rican | 40 | 0.4% |
| Romanian | 41 | 0.4% |
| Russian | 285 | 2.7% |
| Scotch-Irish | 222 | 2.1% |
| Scottish | 263 | 2.5% |
| Slovak | 28 | 0.3% |
| South American | 85 | 0.8% |
| Spanish | 12 | 0.1% |
| Swedish | 135 | 1.3% |
| Swiss | 23 | 0.2% |
| Thai | 319 | 3.0% |
| Trinidadian and Tobagonian | 7 | 0.1% |
| Vietnamese | 27 | 0.3% |
| West Indian | 6 | 0.1% | View All 56 Rows |
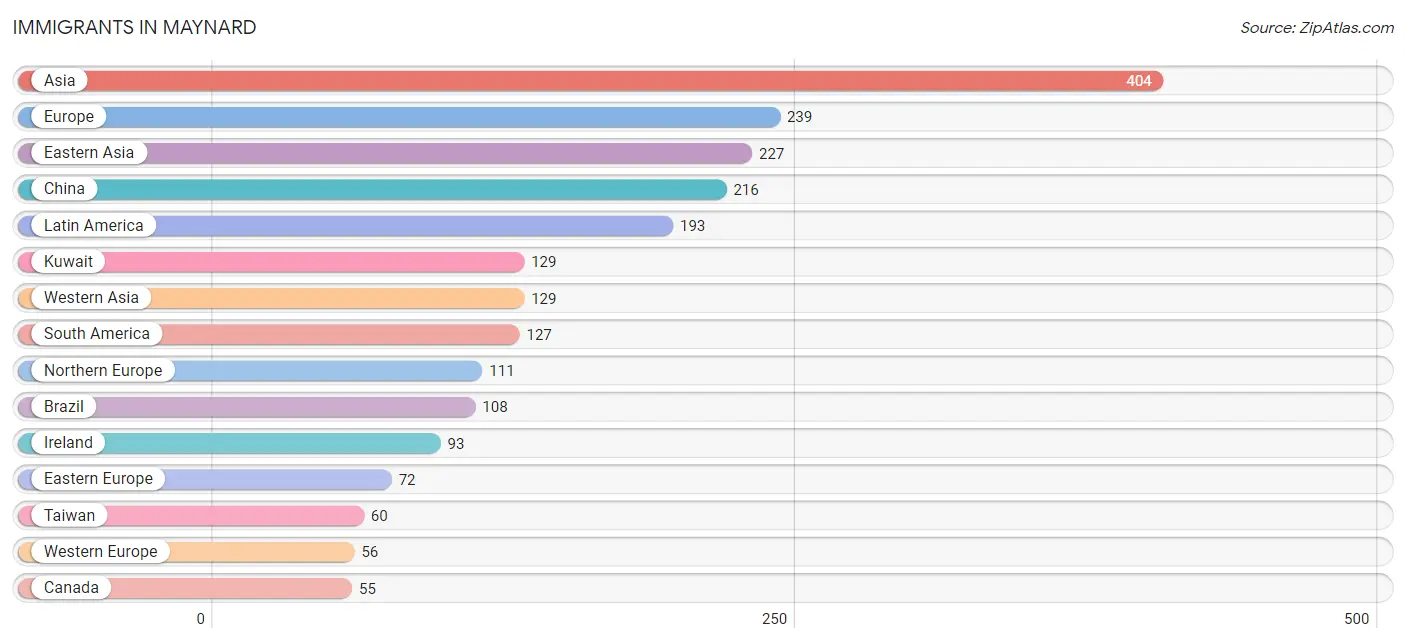
Immigrants in Maynard
The most numerous immigrant groups reported in Maynard came from Asia (404 | 3.8%), Europe (239 | 2.2%), Eastern Asia (227 | 2.1%), China (216 | 2.0%), and Latin America (193 | 1.8%), together accounting for 12.0% of all Maynard residents.
| Immigration Origin | # Population | % Population |
| Africa | 42 | 0.4% |
| Asia | 404 | 3.8% |
| Bangladesh | 27 | 0.3% |
| Brazil | 108 | 1.0% |
| Canada | 55 | 0.5% |
| Caribbean | 17 | 0.2% |
| Central America | 49 | 0.5% |
| China | 216 | 2.0% |
| Colombia | 19 | 0.2% |
| Dominican Republic | 17 | 0.2% |
| Eastern Asia | 227 | 2.1% |
| Eastern Europe | 72 | 0.7% |
| England | 18 | 0.2% |
| Europe | 239 | 2.2% |
| France | 29 | 0.3% |
| Germany | 27 | 0.3% |
| Guatemala | 49 | 0.5% |
| India | 21 | 0.2% |
| Ireland | 93 | 0.9% |
| Japan | 11 | 0.1% |
| Kuwait | 129 | 1.2% |
| Latin America | 193 | 1.8% |
| Nigeria | 42 | 0.4% |
| Northern Europe | 111 | 1.0% |
| Poland | 31 | 0.3% |
| Russia | 41 | 0.4% |
| South America | 127 | 1.2% |
| South Central Asia | 48 | 0.4% |
| Taiwan | 60 | 0.6% |
| Western Africa | 42 | 0.4% |
| Western Asia | 129 | 1.2% |
| Western Europe | 56 | 0.5% | View All 32 Rows |
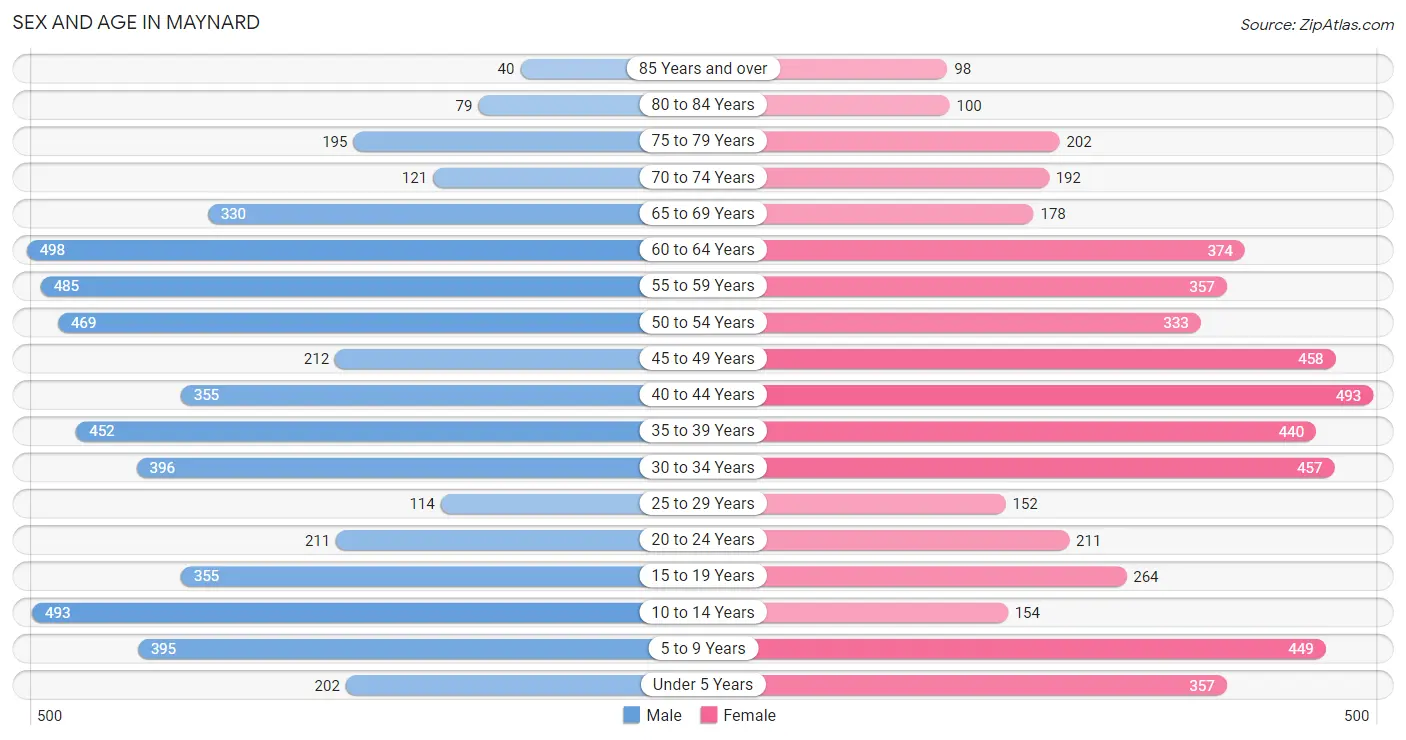
Sex and Age in Maynard
Sex and Age in Maynard
The most populous age groups in Maynard are 60 to 64 Years (498 | 9.2%) for men and 40 to 44 Years (493 | 9.4%) for women.
| Age Bracket | Male | Female |
| Under 5 Years | 202 (3.7%) | 357 (6.8%) |
| 5 to 9 Years | 395 (7.3%) | 449 (8.5%) |
| 10 to 14 Years | 493 (9.1%) | 154 (2.9%) |
| 15 to 19 Years | 355 (6.6%) | 264 (5.0%) |
| 20 to 24 Years | 211 (3.9%) | 211 (4.0%) |
| 25 to 29 Years | 114 (2.1%) | 152 (2.9%) |
| 30 to 34 Years | 396 (7.3%) | 457 (8.7%) |
| 35 to 39 Years | 452 (8.4%) | 440 (8.4%) |
| 40 to 44 Years | 355 (6.6%) | 493 (9.4%) |
| 45 to 49 Years | 212 (3.9%) | 458 (8.7%) |
| 50 to 54 Years | 469 (8.7%) | 333 (6.3%) |
| 55 to 59 Years | 485 (9.0%) | 357 (6.8%) |
| 60 to 64 Years | 498 (9.2%) | 374 (7.1%) |
| 65 to 69 Years | 330 (6.1%) | 178 (3.4%) |
| 70 to 74 Years | 121 (2.2%) | 192 (3.6%) |
| 75 to 79 Years | 195 (3.6%) | 202 (3.8%) |
| 80 to 84 Years | 79 (1.5%) | 100 (1.9%) |
| 85 Years and over | 40 (0.7%) | 98 (1.9%) |
| Total | 5,402 (100.0%) | 5,269 (100.0%) |
Families and Households in Maynard
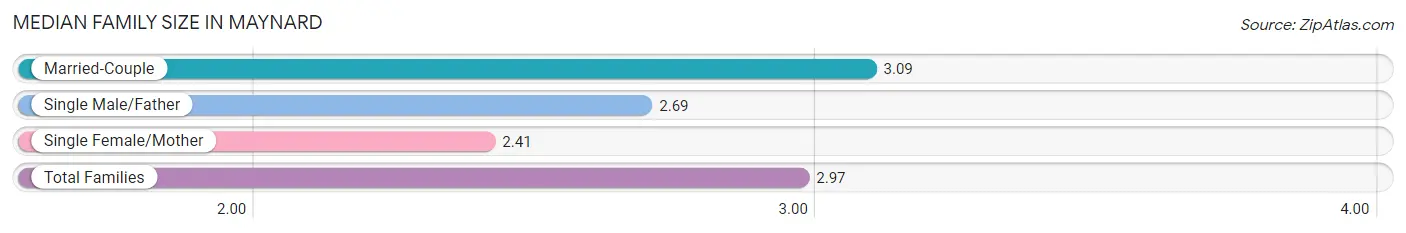
Median Family Size in Maynard
The median family size in Maynard is 2.97 persons per family, with married-couple families (2,339 | 78.5%) accounting for the largest median family size of 3.09 persons per family. On the other hand, single female/mother families (428 | 14.4%) represent the smallest median family size with 2.41 persons per family.
| Family Type | # Families | Family Size |
| Married-Couple | 2,339 (78.5%) | 3.09 |
| Single Male/Father | 213 (7.1%) | 2.69 |
| Single Female/Mother | 428 (14.4%) | 2.41 |
| Total Families | 2,980 (100.0%) | 2.97 |
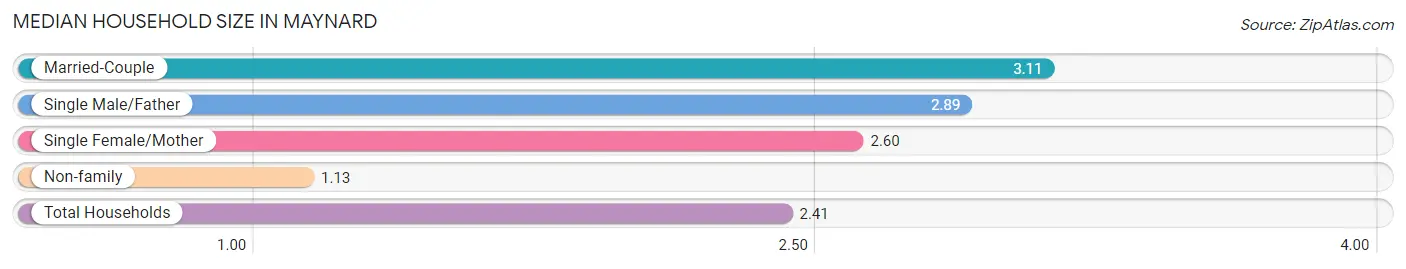
Median Household Size in Maynard
The median household size in Maynard is 2.41 persons per household, with married-couple households (2,339 | 53.0%) accounting for the largest median household size of 3.11 persons per household. non-family households (1,436 | 32.5%) represent the smallest median household size with 1.13 persons per household.
| Household Type | # Households | Household Size |
| Married-Couple | 2,339 (53.0%) | 3.11 |
| Single Male/Father | 213 (4.8%) | 2.89 |
| Single Female/Mother | 428 (9.7%) | 2.60 |
| Non-family | 1,436 (32.5%) | 1.13 |
| Total Households | 4,416 (100.0%) | 2.41 |
Household Size by Marriage Status in Maynard
Out of a total of 4,416 households in Maynard, 2,980 (67.5%) are family households, while 1,436 (32.5%) are nonfamily households. The most numerous type of family households are 2-person households, comprising 1,310, and the most common type of nonfamily households are 1-person households, comprising 1,250.
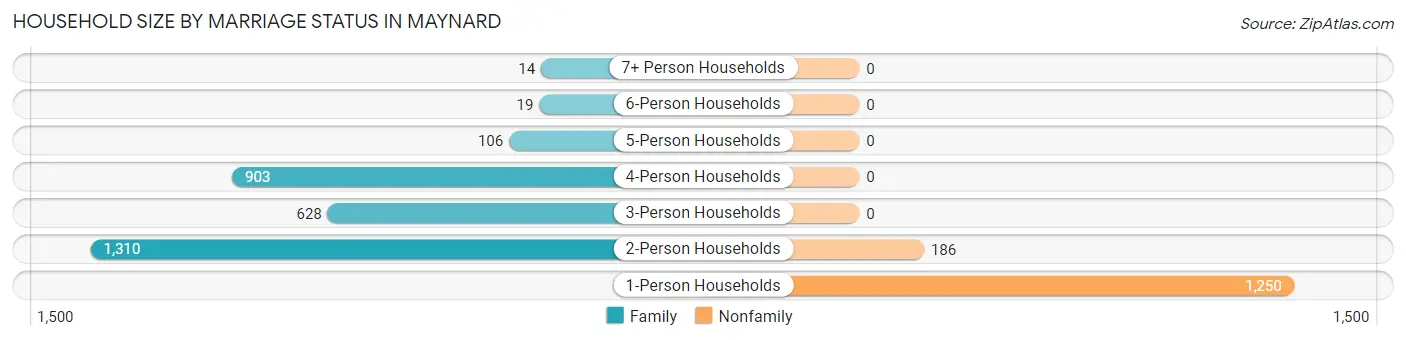
| Household Size | Family Households | Nonfamily Households |
| 1-Person Households | - | 1,250 (28.3%) |
| 2-Person Households | 1,310 (29.7%) | 186 (4.2%) |
| 3-Person Households | 628 (14.2%) | 0 (0.0%) |
| 4-Person Households | 903 (20.4%) | 0 (0.0%) |
| 5-Person Households | 106 (2.4%) | 0 (0.0%) |
| 6-Person Households | 19 (0.4%) | 0 (0.0%) |
| 7+ Person Households | 14 (0.3%) | 0 (0.0%) |
| Total | 2,980 (67.5%) | 1,436 (32.5%) |
Female Fertility in Maynard
Fertility by Age in Maynard
Average fertility rate in Maynard is 13.0 births per 1,000 women. Women in the age bracket of 20 to 34 years have the highest fertility rate with 18.0 births per 1,000 women. Women in the age bracket of 35 to 50 years acount for 54.5% of all women with births.
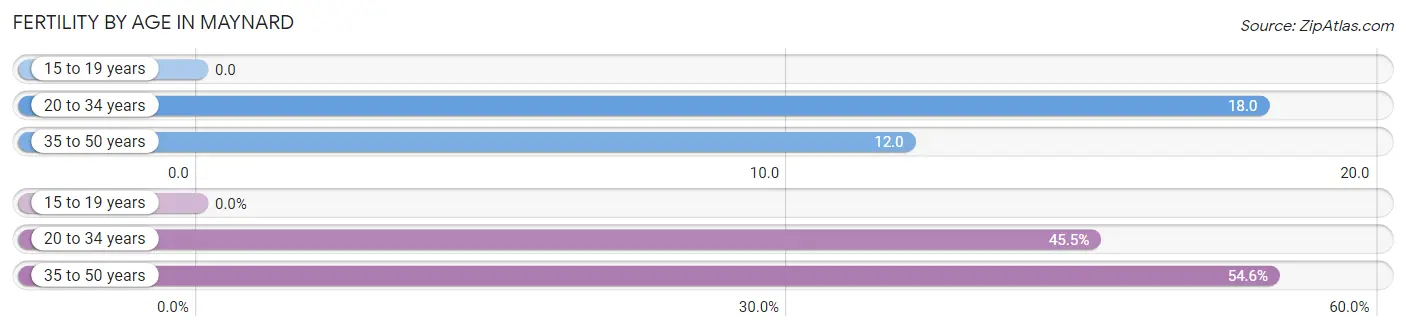
| Age Bracket | Women with Births | Births / 1,000 Women |
| 15 to 19 years | 0 (0.0%) | 0.0 |
| 20 to 34 years | 15 (45.5%) | 18.0 |
| 35 to 50 years | 18 (54.5%) | 12.0 |
| Total | 33 (100.0%) | 13.0 |
Fertility by Age by Marriage Status in Maynard
45.5% of women with births (33) in Maynard are married. The highest percentage of unmarried women with births falls into 35 to 50 years age bracket with 100.0% of them unmarried at the time of birth, while the lowest percentage of unmarried women with births belong to 20 to 34 years age bracket with 0.0% of them unmarried.
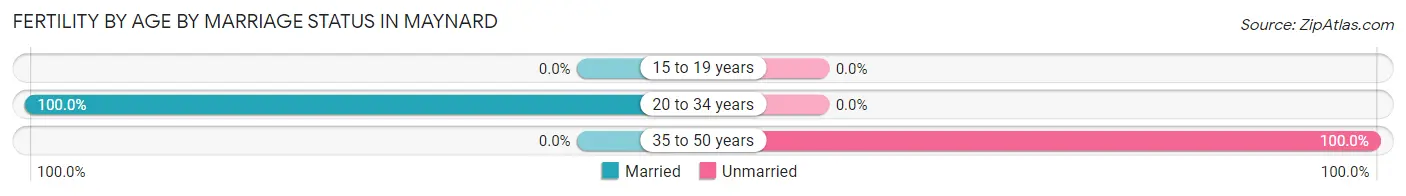
| Age Bracket | Married | Unmarried |
| 15 to 19 years | 0 (0.0%) | 0 (0.0%) |
| 20 to 34 years | 15 (100.0%) | 0 (0.0%) |
| 35 to 50 years | 0 (0.0%) | 18 (100.0%) |
| Total | 15 (45.5%) | 18 (54.5%) |
Fertility by Education in Maynard
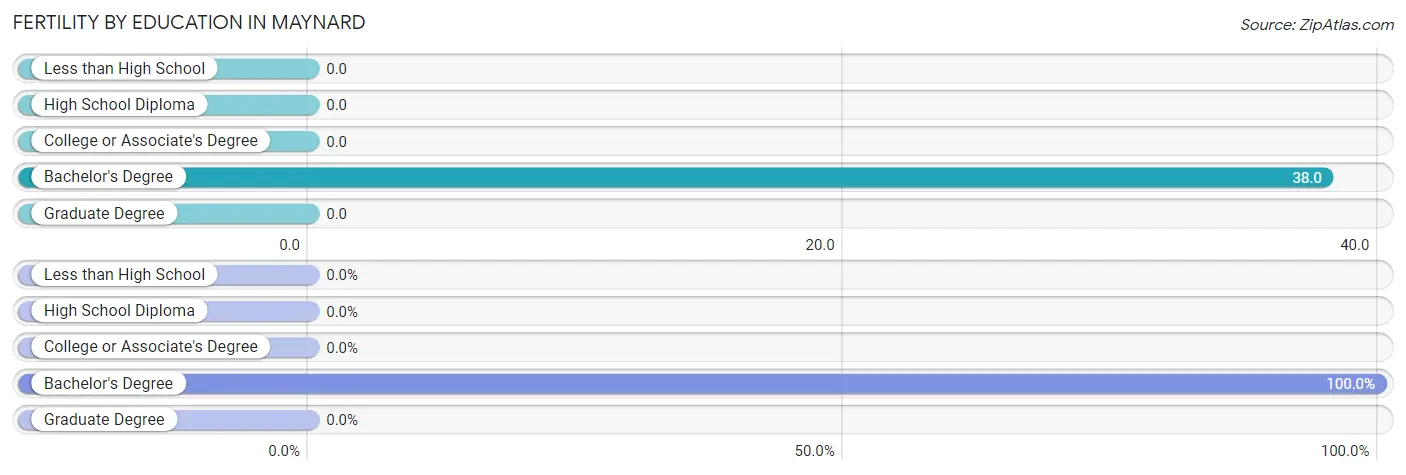
| Educational Attainment | Women with Births | Births / 1,000 Women |
| Less than High School | 0 (0.0%) | 0.0 |
| High School Diploma | 0 (0.0%) | 0.0 |
| College or Associate's Degree | 0 (0.0%) | 0.0 |
| Bachelor's Degree | 33 (100.0%) | 38.0 |
| Graduate Degree | 0 (0.0%) | 0.0 |
| Total | 33 (100.0%) | 13.0 |
Fertility by Education by Marriage Status in Maynard
54.5% of women with births in Maynard are unmarried. Women with the educational attainment of bachelor's degree are most likely to be married with 45.5% of them married at childbirth, while women with the educational attainment of bachelor's degree are least likely to be married with 54.5% of them unmarried at childbirth.
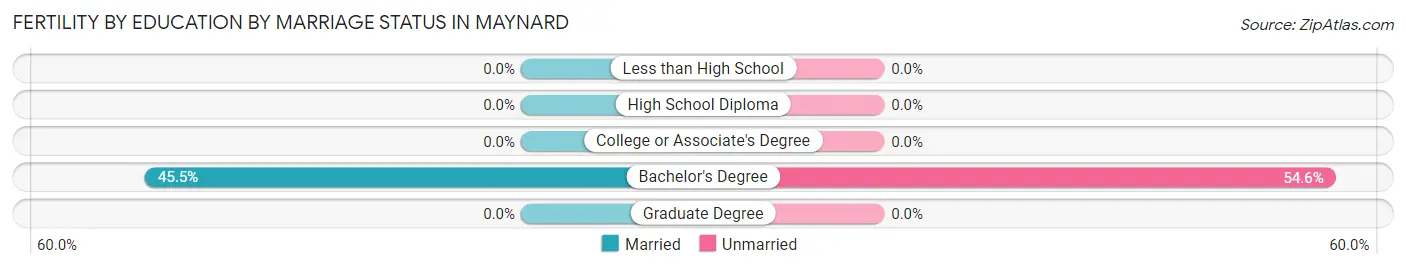
| Educational Attainment | Married | Unmarried |
| Less than High School | 0 (0.0%) | 0 (0.0%) |
| High School Diploma | 0 (0.0%) | 0 (0.0%) |
| College or Associate's Degree | 0 (0.0%) | 0 (0.0%) |
| Bachelor's Degree | 15 (45.5%) | 18 (54.5%) |
| Graduate Degree | 0 (0.0%) | 0 (0.0%) |
| Total | 15 (45.5%) | 18 (54.5%) |
Employment Characteristics in Maynard
Employment by Class of Employer in Maynard
Among the 5,839 employed individuals in Maynard, private company employees (3,798 | 65.0%), local government employees (612 | 10.5%), and self-employed (not incorporated) (551 | 9.4%) make up the most common classes of employment.
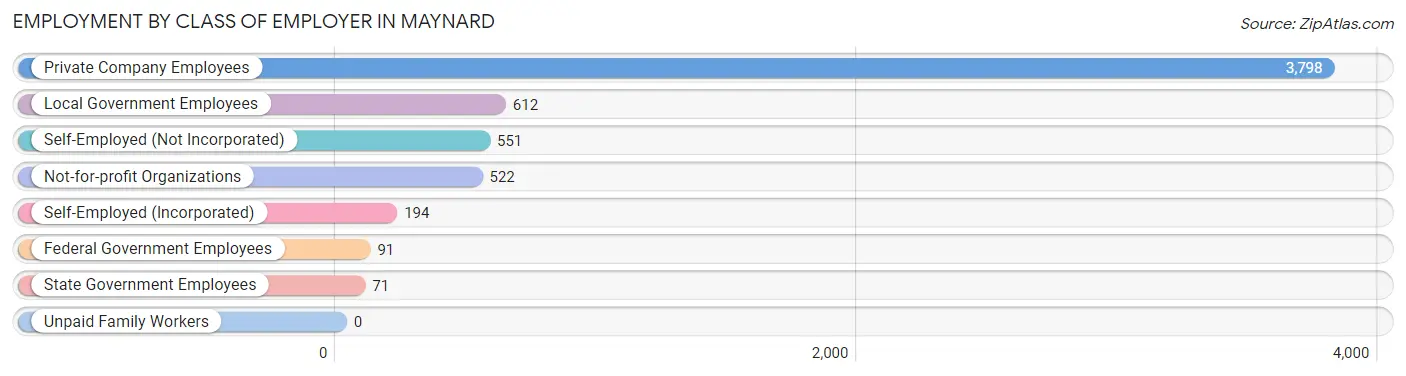
| Employer Class | # Employees | % Employees |
| Private Company Employees | 3,798 | 65.0% |
| Self-Employed (Incorporated) | 194 | 3.3% |
| Self-Employed (Not Incorporated) | 551 | 9.4% |
| Not-for-profit Organizations | 522 | 8.9% |
| Local Government Employees | 612 | 10.5% |
| State Government Employees | 71 | 1.2% |
| Federal Government Employees | 91 | 1.6% |
| Unpaid Family Workers | 0 | 0.0% |
| Total | 5,839 | 100.0% |
Employment Status by Age in Maynard
According to the labor force statistics for Maynard, out of the total population over 16 years of age (8,463), 74.1% or 6,271 individuals are in the labor force, with 4.3% or 270 of them unemployed. The age group with the highest labor force participation rate is 25 to 29 years, with 100.0% or 266 individuals in the labor force. Within the labor force, the 75 years and over age range has the highest percentage of unemployed individuals, with 36.8% or 14 of them being unemployed.
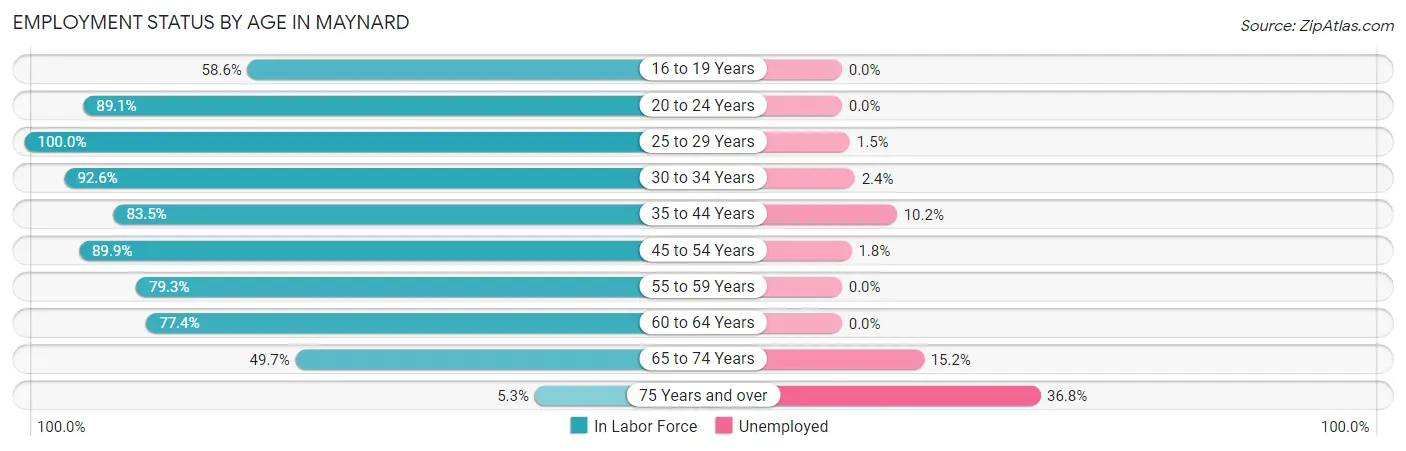
| Age Bracket | In Labor Force | Unemployed |
| 16 to 19 Years | 270 (58.6%) | 0 (0.0%) |
| 20 to 24 Years | 376 (89.1%) | 0 (0.0%) |
| 25 to 29 Years | 266 (100.0%) | 4 (1.5%) |
| 30 to 34 Years | 790 (92.6%) | 19 (2.4%) |
| 35 to 44 Years | 1,453 (83.5%) | 148 (10.2%) |
| 45 to 54 Years | 1,323 (89.9%) | 24 (1.8%) |
| 55 to 59 Years | 668 (79.3%) | 0 (0.0%) |
| 60 to 64 Years | 675 (77.4%) | 0 (0.0%) |
| 65 to 74 Years | 408 (49.7%) | 62 (15.2%) |
| 75 Years and over | 38 (5.3%) | 14 (36.8%) |
| Total | 6,271 (74.1%) | 270 (4.3%) |
Employment Status by Educational Attainment in Maynard
According to labor force statistics for Maynard, 85.6% of individuals (5,175) out of the total population between 25 and 64 years of age (6,045) are in the labor force, with 3.8% or 197 of them being unemployed. The group with the highest labor force participation rate are those with the educational attainment of bachelor's degree or higher, with 94.6% or 3,788 individuals in the labor force. Within the labor force, individuals with less than high school education have the highest percentage of unemployment, with 14.8% or 9 of them being unemployed.
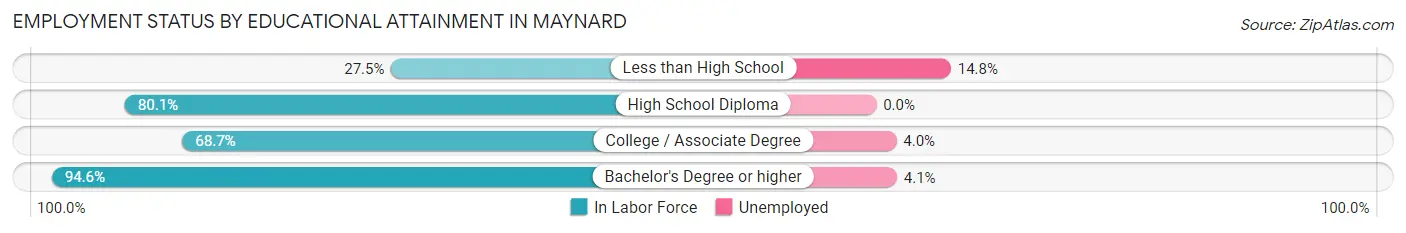
| Educational Attainment | In Labor Force | Unemployed |
| Less than High School | 61 (27.5%) | 33 (14.8%) |
| High School Diploma | 545 (80.1%) | 0 (0.0%) |
| College / Associate Degree | 782 (68.7%) | 46 (4.0%) |
| Bachelor's Degree or higher | 3,788 (94.6%) | 164 (4.1%) |
| Total | 5,175 (85.6%) | 230 (3.8%) |
Employment Occupations by Sex in Maynard
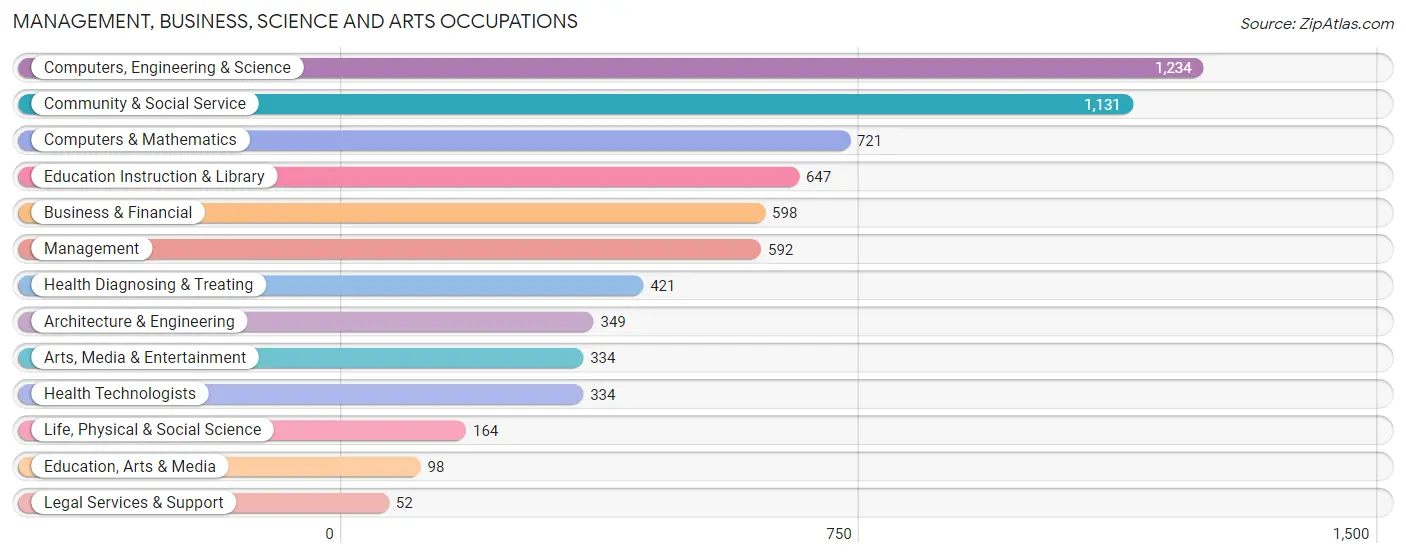
Management, Business, Science and Arts Occupations
The most common Management, Business, Science and Arts occupations in Maynard are Computers, Engineering & Science (1,234 | 20.6%), Community & Social Service (1,131 | 18.9%), Computers & Mathematics (721 | 12.0%), Education Instruction & Library (647 | 10.8%), and Business & Financial (598 | 10.0%).
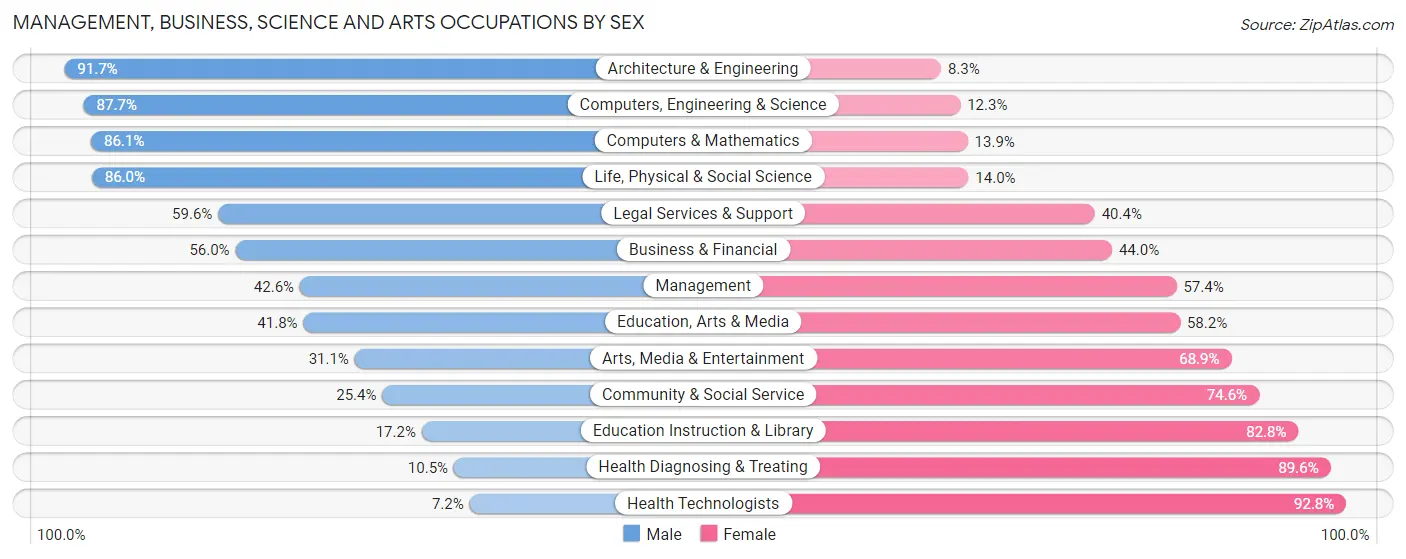
Management, Business, Science and Arts Occupations by Sex
Within the Management, Business, Science and Arts occupations in Maynard, the most male-oriented occupations are Architecture & Engineering (91.7%), Computers, Engineering & Science (87.7%), and Computers & Mathematics (86.1%), while the most female-oriented occupations are Health Technologists (92.8%), Health Diagnosing & Treating (89.5%), and Education Instruction & Library (82.8%).
| Occupation | Male | Female |
| Management | 252 (42.6%) | 340 (57.4%) |
| Business & Financial | 335 (56.0%) | 263 (44.0%) |
| Computers, Engineering & Science | 1,082 (87.7%) | 152 (12.3%) |
| Computers & Mathematics | 621 (86.1%) | 100 (13.9%) |
| Architecture & Engineering | 320 (91.7%) | 29 (8.3%) |
| Life, Physical & Social Science | 141 (86.0%) | 23 (14.0%) |
| Community & Social Service | 287 (25.4%) | 844 (74.6%) |
| Education, Arts & Media | 41 (41.8%) | 57 (58.2%) |
| Legal Services & Support | 31 (59.6%) | 21 (40.4%) |
| Education Instruction & Library | 111 (17.2%) | 536 (82.8%) |
| Arts, Media & Entertainment | 104 (31.1%) | 230 (68.9%) |
| Health Diagnosing & Treating | 44 (10.4%) | 377 (89.5%) |
| Health Technologists | 24 (7.2%) | 310 (92.8%) |
| Total (Category) | 2,000 (50.3%) | 1,976 (49.7%) |
| Total (Overall) | 3,014 (50.3%) | 2,982 (49.7%) |
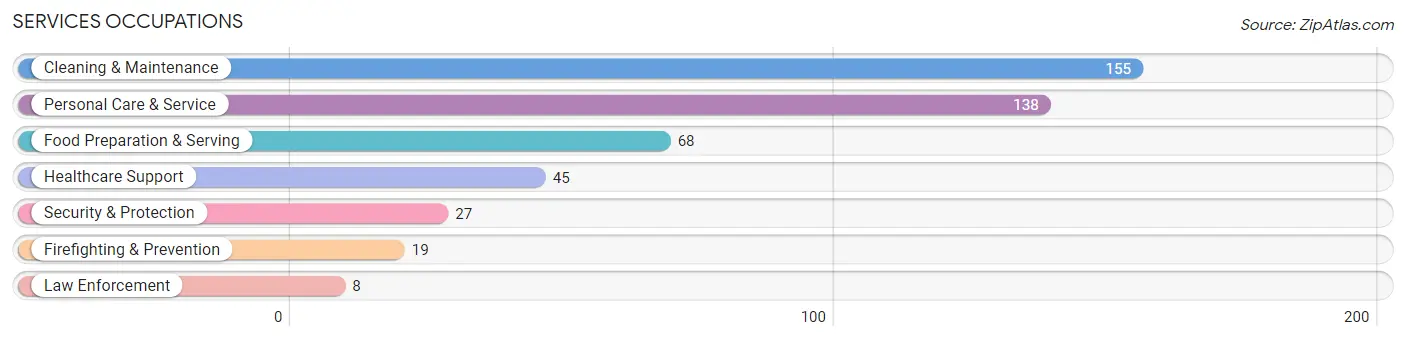
Services Occupations
The most common Services occupations in Maynard are Cleaning & Maintenance (155 | 2.6%), Personal Care & Service (138 | 2.3%), Food Preparation & Serving (68 | 1.1%), Healthcare Support (45 | 0.7%), and Security & Protection (27 | 0.4%).
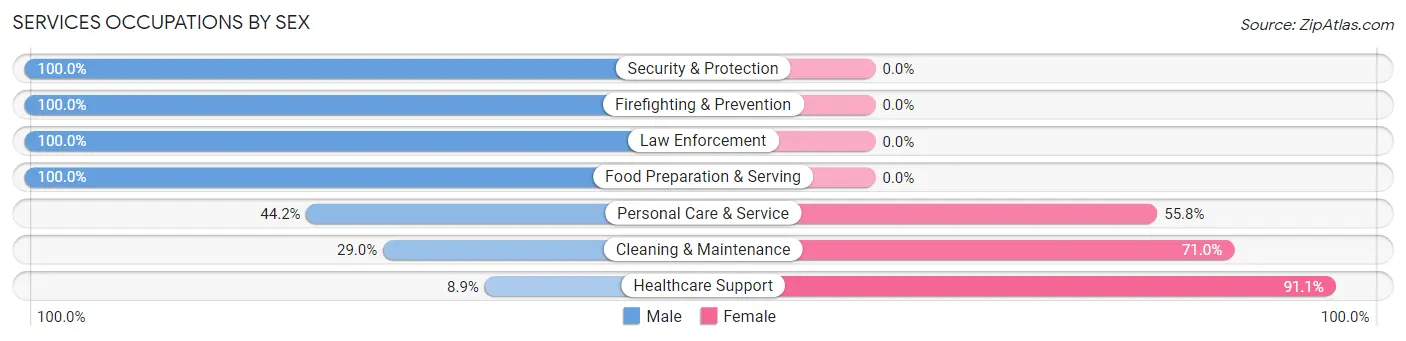
Services Occupations by Sex
Within the Services occupations in Maynard, the most male-oriented occupations are Security & Protection (100.0%), Firefighting & Prevention (100.0%), and Law Enforcement (100.0%), while the most female-oriented occupations are Healthcare Support (91.1%), Cleaning & Maintenance (71.0%), and Personal Care & Service (55.8%).
| Occupation | Male | Female |
| Healthcare Support | 4 (8.9%) | 41 (91.1%) |
| Security & Protection | 27 (100.0%) | 0 (0.0%) |
| Firefighting & Prevention | 19 (100.0%) | 0 (0.0%) |
| Law Enforcement | 8 (100.0%) | 0 (0.0%) |
| Food Preparation & Serving | 68 (100.0%) | 0 (0.0%) |
| Cleaning & Maintenance | 45 (29.0%) | 110 (71.0%) |
| Personal Care & Service | 61 (44.2%) | 77 (55.8%) |
| Total (Category) | 205 (47.3%) | 228 (52.7%) |
| Total (Overall) | 3,014 (50.3%) | 2,982 (49.7%) |
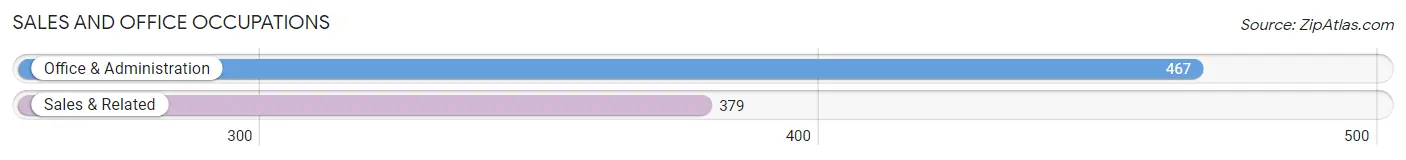
Sales and Office Occupations
The most common Sales and Office occupations in Maynard are Office & Administration (467 | 7.8%), and Sales & Related (379 | 6.3%).
Sales and Office Occupations by Sex
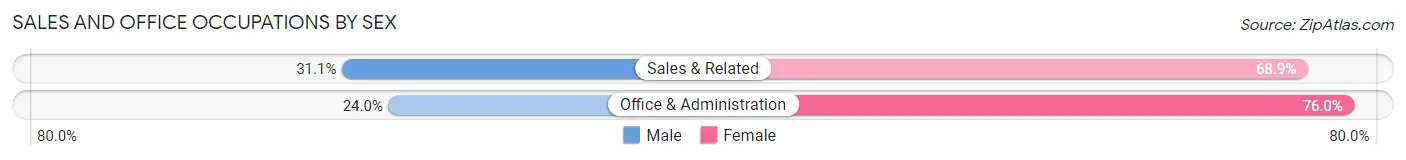
| Occupation | Male | Female |
| Sales & Related | 118 (31.1%) | 261 (68.9%) |
| Office & Administration | 112 (24.0%) | 355 (76.0%) |
| Total (Category) | 230 (27.2%) | 616 (72.8%) |
| Total (Overall) | 3,014 (50.3%) | 2,982 (49.7%) |
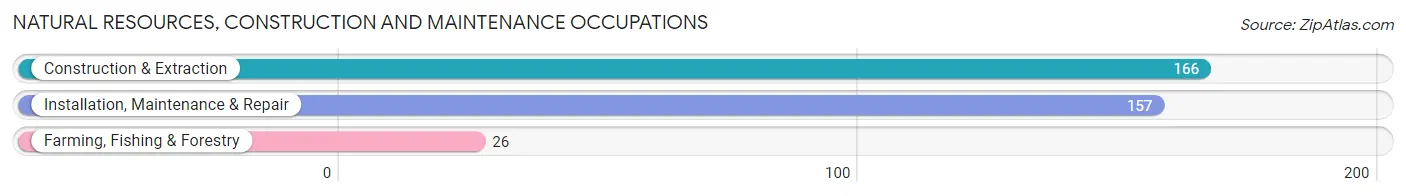
Natural Resources, Construction and Maintenance Occupations
The most common Natural Resources, Construction and Maintenance occupations in Maynard are Construction & Extraction (166 | 2.8%), Installation, Maintenance & Repair (157 | 2.6%), and Farming, Fishing & Forestry (26 | 0.4%).
Natural Resources, Construction and Maintenance Occupations by Sex
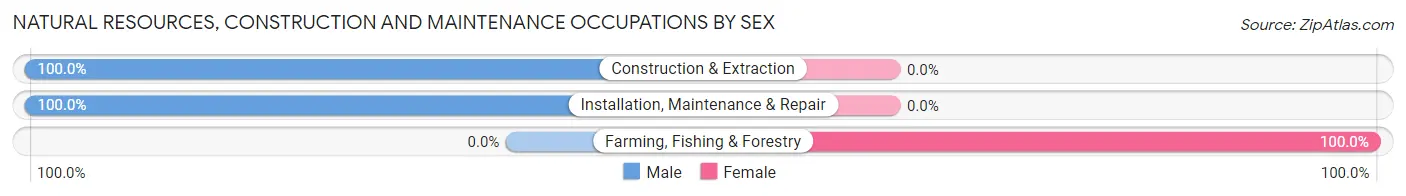
| Occupation | Male | Female |
| Farming, Fishing & Forestry | 0 (0.0%) | 26 (100.0%) |
| Construction & Extraction | 166 (100.0%) | 0 (0.0%) |
| Installation, Maintenance & Repair | 157 (100.0%) | 0 (0.0%) |
| Total (Category) | 323 (92.5%) | 26 (7.4%) |
| Total (Overall) | 3,014 (50.3%) | 2,982 (49.7%) |
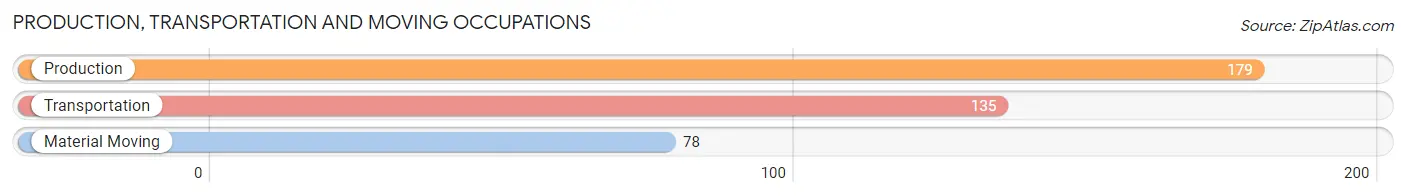
Production, Transportation and Moving Occupations
The most common Production, Transportation and Moving occupations in Maynard are Production (179 | 3.0%), Transportation (135 | 2.2%), and Material Moving (78 | 1.3%).
Production, Transportation and Moving Occupations by Sex
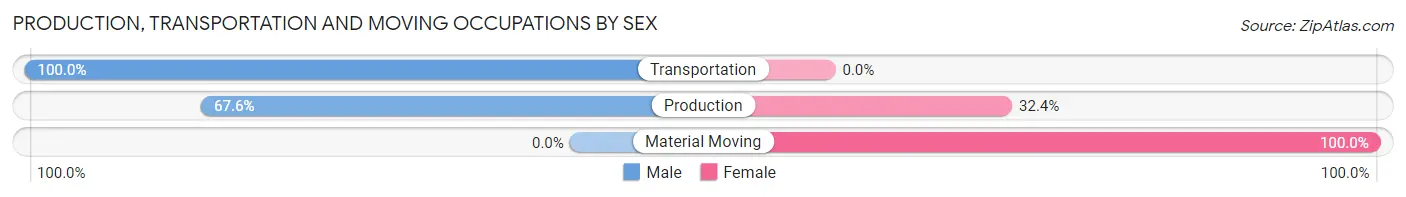
| Occupation | Male | Female |
| Production | 121 (67.6%) | 58 (32.4%) |
| Transportation | 135 (100.0%) | 0 (0.0%) |
| Material Moving | 0 (0.0%) | 78 (100.0%) |
| Total (Category) | 256 (65.3%) | 136 (34.7%) |
| Total (Overall) | 3,014 (50.3%) | 2,982 (49.7%) |
Employment Industries by Sex in Maynard
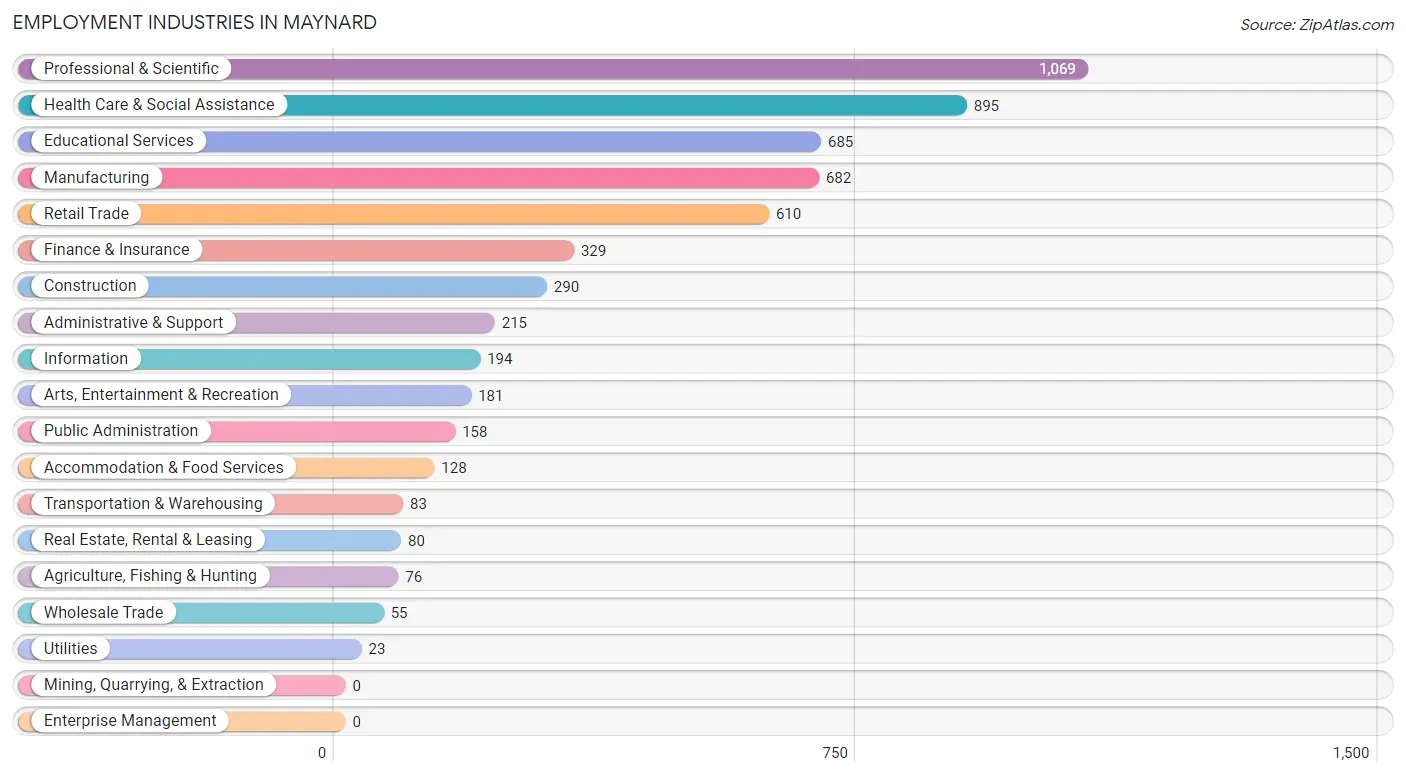
Employment Industries in Maynard
The major employment industries in Maynard include Professional & Scientific (1,069 | 17.8%), Health Care & Social Assistance (895 | 14.9%), Educational Services (685 | 11.4%), Manufacturing (682 | 11.4%), and Retail Trade (610 | 10.2%).
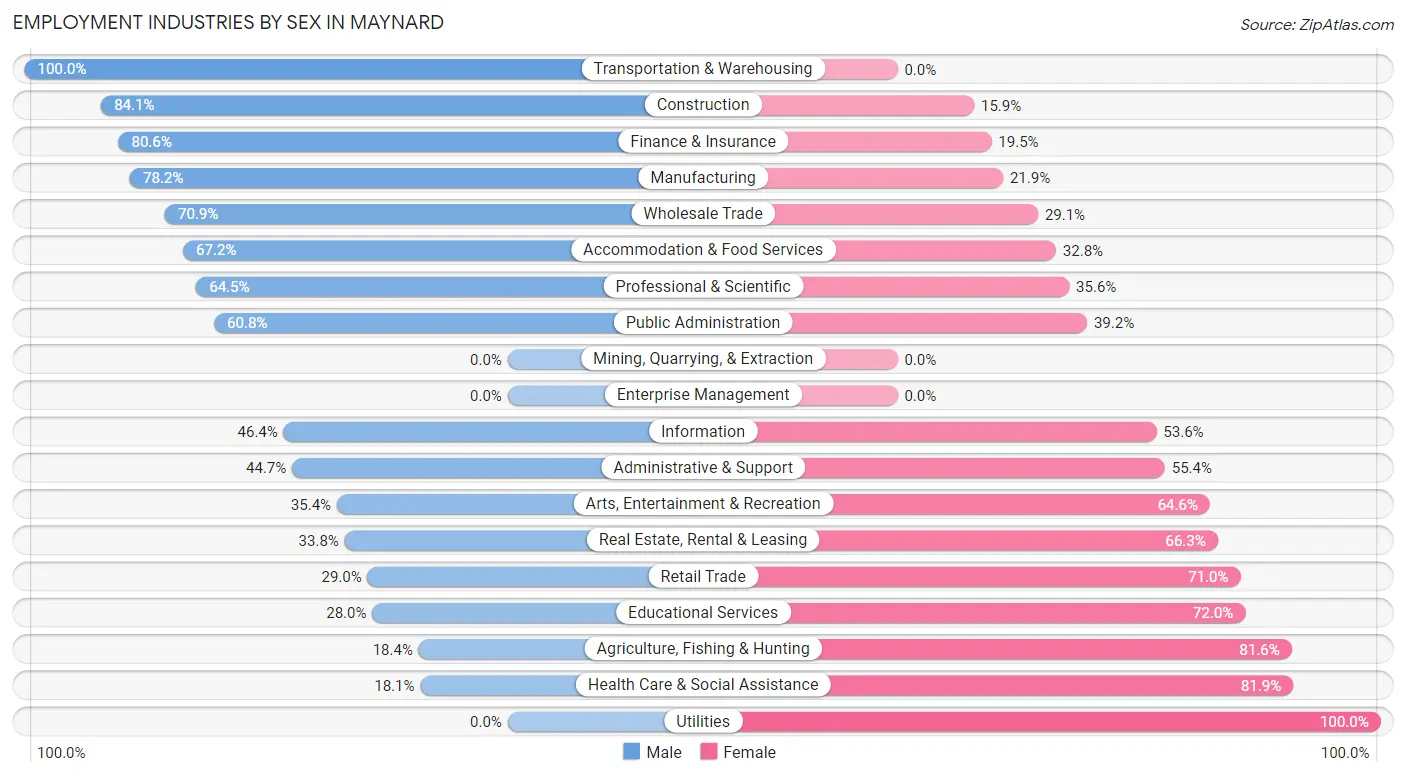
Employment Industries by Sex in Maynard
The Maynard industries that see more men than women are Transportation & Warehousing (100.0%), Construction (84.1%), and Finance & Insurance (80.5%), whereas the industries that tend to have a higher number of women are Utilities (100.0%), Health Care & Social Assistance (81.9%), and Agriculture, Fishing & Hunting (81.6%).
| Industry | Male | Female |
| Agriculture, Fishing & Hunting | 14 (18.4%) | 62 (81.6%) |
| Mining, Quarrying, & Extraction | 0 (0.0%) | 0 (0.0%) |
| Construction | 244 (84.1%) | 46 (15.9%) |
| Manufacturing | 533 (78.1%) | 149 (21.8%) |
| Wholesale Trade | 39 (70.9%) | 16 (29.1%) |
| Retail Trade | 177 (29.0%) | 433 (71.0%) |
| Transportation & Warehousing | 83 (100.0%) | 0 (0.0%) |
| Utilities | 0 (0.0%) | 23 (100.0%) |
| Information | 90 (46.4%) | 104 (53.6%) |
| Finance & Insurance | 265 (80.5%) | 64 (19.5%) |
| Real Estate, Rental & Leasing | 27 (33.8%) | 53 (66.2%) |
| Professional & Scientific | 689 (64.4%) | 380 (35.5%) |
| Enterprise Management | 0 (0.0%) | 0 (0.0%) |
| Administrative & Support | 96 (44.7%) | 119 (55.3%) |
| Educational Services | 192 (28.0%) | 493 (72.0%) |
| Health Care & Social Assistance | 162 (18.1%) | 733 (81.9%) |
| Arts, Entertainment & Recreation | 64 (35.4%) | 117 (64.6%) |
| Accommodation & Food Services | 86 (67.2%) | 42 (32.8%) |
| Public Administration | 96 (60.8%) | 62 (39.2%) |
| Total | 3,014 (50.3%) | 2,982 (49.7%) |
Education in Maynard
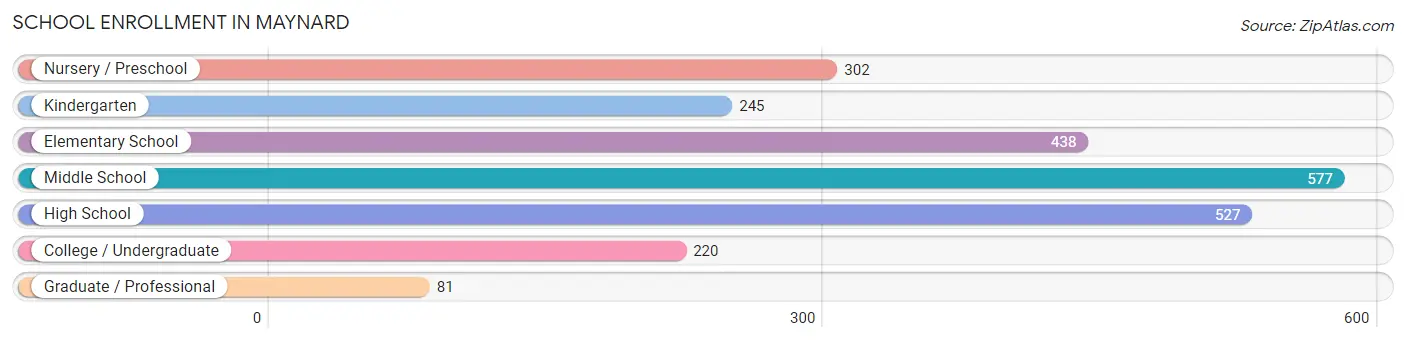
School Enrollment in Maynard
The most common levels of schooling among the 2,390 students in Maynard are middle school (577 | 24.1%), high school (527 | 22.1%), and elementary school (438 | 18.3%).
| School Level | # Students | % Students |
| Nursery / Preschool | 302 | 12.6% |
| Kindergarten | 245 | 10.2% |
| Elementary School | 438 | 18.3% |
| Middle School | 577 | 24.1% |
| High School | 527 | 22.1% |
| College / Undergraduate | 220 | 9.2% |
| Graduate / Professional | 81 | 3.4% |
| Total | 2,390 | 100.0% |
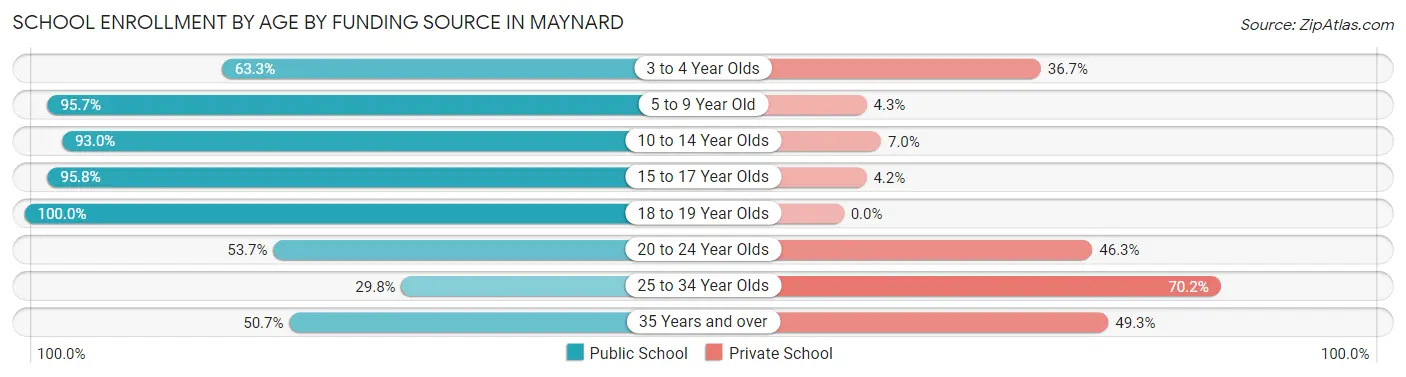
School Enrollment by Age by Funding Source in Maynard
Out of a total of 2,390 students who are enrolled in schools in Maynard, 251 (10.5%) attend a private institution, while the remaining 2,139 (89.5%) are enrolled in public schools. The age group of 25 to 34 year olds has the highest likelihood of being enrolled in private schools, with 40 (70.2% in the age bracket) enrolled. Conversely, the age group of 18 to 19 year olds has the lowest likelihood of being enrolled in a private school, with 224 (100.0% in the age bracket) attending a public institution.
| Age Bracket | Public School | Private School |
| 3 to 4 Year Olds | 62 (63.3%) | 36 (36.7%) |
| 5 to 9 Year Old | 808 (95.7%) | 36 (4.3%) |
| 10 to 14 Year Olds | 602 (93.0%) | 45 (7.0%) |
| 15 to 17 Year Olds | 339 (95.8%) | 15 (4.2%) |
| 18 to 19 Year Olds | 224 (100.0%) | 0 (0.0%) |
| 20 to 24 Year Olds | 51 (53.7%) | 44 (46.3%) |
| 25 to 34 Year Olds | 17 (29.8%) | 40 (70.2%) |
| 35 Years and over | 36 (50.7%) | 35 (49.3%) |
| Total | 2,139 (89.5%) | 251 (10.5%) |
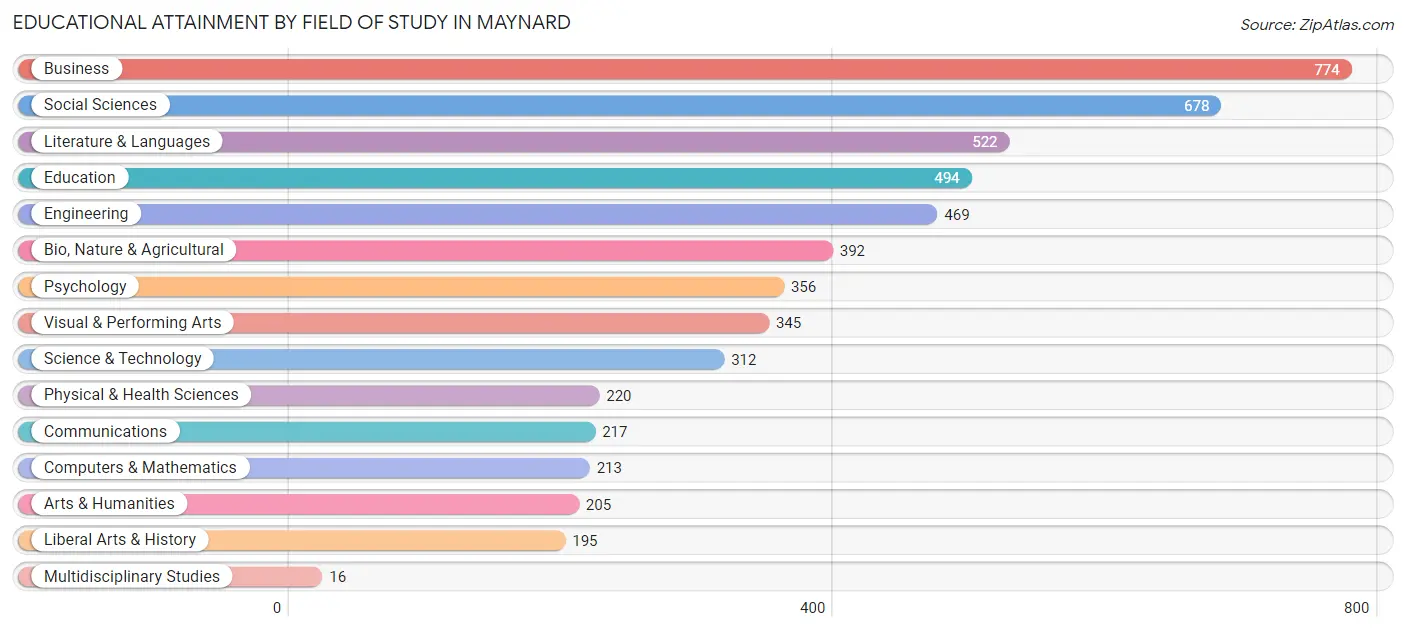
Educational Attainment by Field of Study in Maynard
Business (774 | 14.3%), social sciences (678 | 12.5%), literature & languages (522 | 9.7%), education (494 | 9.1%), and engineering (469 | 8.7%) are the most common fields of study among 5,408 individuals in Maynard who have obtained a bachelor's degree or higher.
| Field of Study | # Graduates | % Graduates |
| Computers & Mathematics | 213 | 3.9% |
| Bio, Nature & Agricultural | 392 | 7.2% |
| Physical & Health Sciences | 220 | 4.1% |
| Psychology | 356 | 6.6% |
| Social Sciences | 678 | 12.5% |
| Engineering | 469 | 8.7% |
| Multidisciplinary Studies | 16 | 0.3% |
| Science & Technology | 312 | 5.8% |
| Business | 774 | 14.3% |
| Education | 494 | 9.1% |
| Literature & Languages | 522 | 9.7% |
| Liberal Arts & History | 195 | 3.6% |
| Visual & Performing Arts | 345 | 6.4% |
| Communications | 217 | 4.0% |
| Arts & Humanities | 205 | 3.8% |
| Total | 5,408 | 100.0% |
Transportation & Commute in Maynard
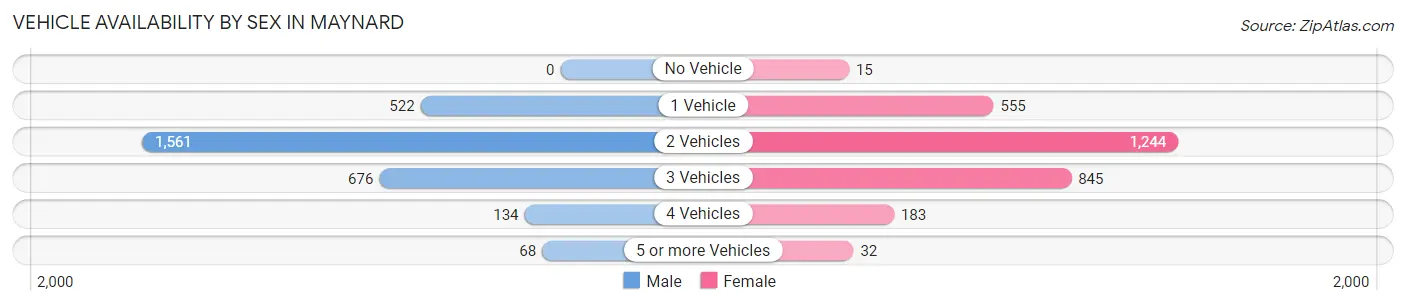
Vehicle Availability by Sex in Maynard
The most prevalent vehicle ownership categories in Maynard are males with 2 vehicles (1,561, accounting for 52.7%) and females with 2 vehicles (1,244, making up 54.3%).
| Vehicles Available | Male | Female |
| No Vehicle | 0 (0.0%) | 15 (0.5%) |
| 1 Vehicle | 522 (17.6%) | 555 (19.3%) |
| 2 Vehicles | 1,561 (52.7%) | 1,244 (43.3%) |
| 3 Vehicles | 676 (22.8%) | 845 (29.4%) |
| 4 Vehicles | 134 (4.5%) | 183 (6.4%) |
| 5 or more Vehicles | 68 (2.3%) | 32 (1.1%) |
| Total | 2,961 (100.0%) | 2,874 (100.0%) |
Commute Time in Maynard
The most frequently occuring commute durations in Maynard are 30 to 34 minutes (1,038 commuters, 22.1%), 25 to 29 minutes (508 commuters, 10.8%), and 45 to 59 minutes (476 commuters, 10.2%).
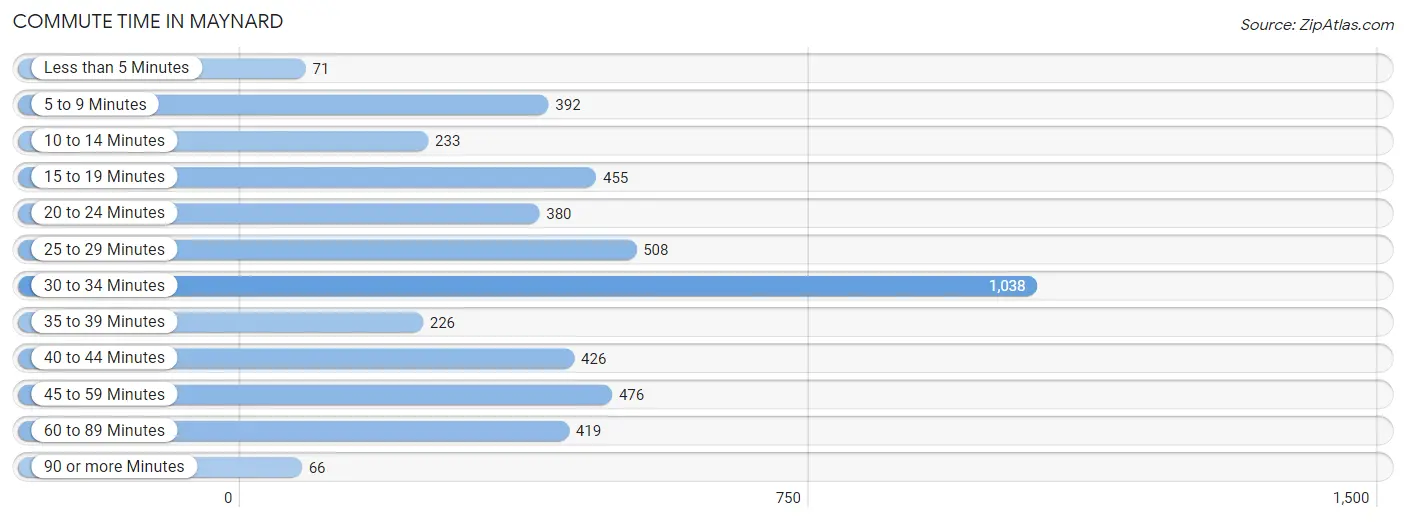
| Commute Time | # Commuters | % Commuters |
| Less than 5 Minutes | 71 | 1.5% |
| 5 to 9 Minutes | 392 | 8.4% |
| 10 to 14 Minutes | 233 | 5.0% |
| 15 to 19 Minutes | 455 | 9.7% |
| 20 to 24 Minutes | 380 | 8.1% |
| 25 to 29 Minutes | 508 | 10.8% |
| 30 to 34 Minutes | 1,038 | 22.1% |
| 35 to 39 Minutes | 226 | 4.8% |
| 40 to 44 Minutes | 426 | 9.1% |
| 45 to 59 Minutes | 476 | 10.2% |
| 60 to 89 Minutes | 419 | 8.9% |
| 90 or more Minutes | 66 | 1.4% |
Commute Time by Sex in Maynard
The most common commute times in Maynard are 30 to 34 minutes (536 commuters, 22.5%) for males and 30 to 34 minutes (502 commuters, 21.7%) for females.
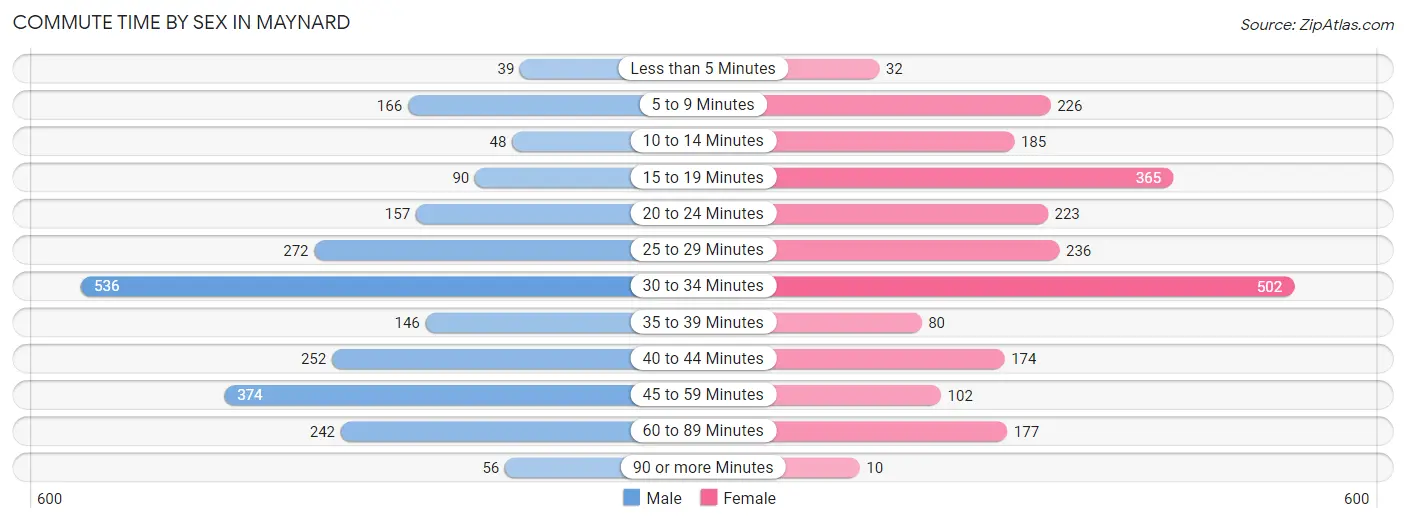
| Commute Time | Male | Female |
| Less than 5 Minutes | 39 (1.6%) | 32 (1.4%) |
| 5 to 9 Minutes | 166 (7.0%) | 226 (9.8%) |
| 10 to 14 Minutes | 48 (2.0%) | 185 (8.0%) |
| 15 to 19 Minutes | 90 (3.8%) | 365 (15.8%) |
| 20 to 24 Minutes | 157 (6.6%) | 223 (9.7%) |
| 25 to 29 Minutes | 272 (11.4%) | 236 (10.2%) |
| 30 to 34 Minutes | 536 (22.5%) | 502 (21.7%) |
| 35 to 39 Minutes | 146 (6.1%) | 80 (3.5%) |
| 40 to 44 Minutes | 252 (10.6%) | 174 (7.5%) |
| 45 to 59 Minutes | 374 (15.7%) | 102 (4.4%) |
| 60 to 89 Minutes | 242 (10.2%) | 177 (7.7%) |
| 90 or more Minutes | 56 (2.4%) | 10 (0.4%) |
Time of Departure to Work by Sex in Maynard
The most frequent times of departure to work in Maynard are 6:00 AM to 6:29 AM (467, 19.6%) for males and 8:00 AM to 8:29 AM (493, 21.3%) for females.
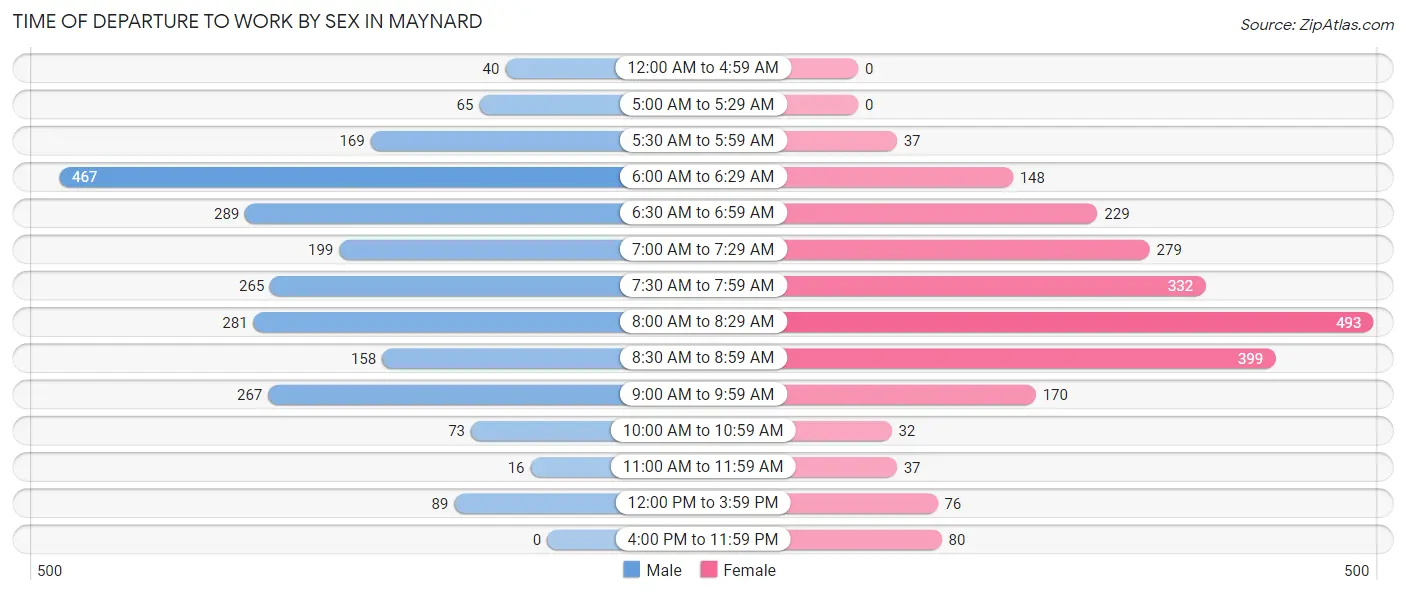
| Time of Departure | Male | Female |
| 12:00 AM to 4:59 AM | 40 (1.7%) | 0 (0.0%) |
| 5:00 AM to 5:29 AM | 65 (2.7%) | 0 (0.0%) |
| 5:30 AM to 5:59 AM | 169 (7.1%) | 37 (1.6%) |
| 6:00 AM to 6:29 AM | 467 (19.6%) | 148 (6.4%) |
| 6:30 AM to 6:59 AM | 289 (12.1%) | 229 (9.9%) |
| 7:00 AM to 7:29 AM | 199 (8.4%) | 279 (12.1%) |
| 7:30 AM to 7:59 AM | 265 (11.1%) | 332 (14.4%) |
| 8:00 AM to 8:29 AM | 281 (11.8%) | 493 (21.3%) |
| 8:30 AM to 8:59 AM | 158 (6.6%) | 399 (17.3%) |
| 9:00 AM to 9:59 AM | 267 (11.2%) | 170 (7.3%) |
| 10:00 AM to 10:59 AM | 73 (3.1%) | 32 (1.4%) |
| 11:00 AM to 11:59 AM | 16 (0.7%) | 37 (1.6%) |
| 12:00 PM to 3:59 PM | 89 (3.7%) | 76 (3.3%) |
| 4:00 PM to 11:59 PM | 0 (0.0%) | 80 (3.5%) |
| Total | 2,378 (100.0%) | 2,312 (100.0%) |
Housing Occupancy in Maynard
Occupancy by Ownership in Maynard
Of the total 4,416 dwellings in Maynard, owner-occupied units account for 3,439 (77.9%), while renter-occupied units make up 977 (22.1%).
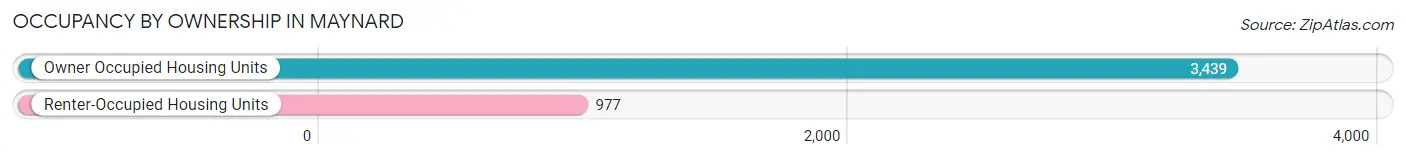
| Occupancy | # Housing Units | % Housing Units |
| Owner Occupied Housing Units | 3,439 | 77.9% |
| Renter-Occupied Housing Units | 977 | 22.1% |
| Total Occupied Housing Units | 4,416 | 100.0% |
Occupancy by Household Size in Maynard
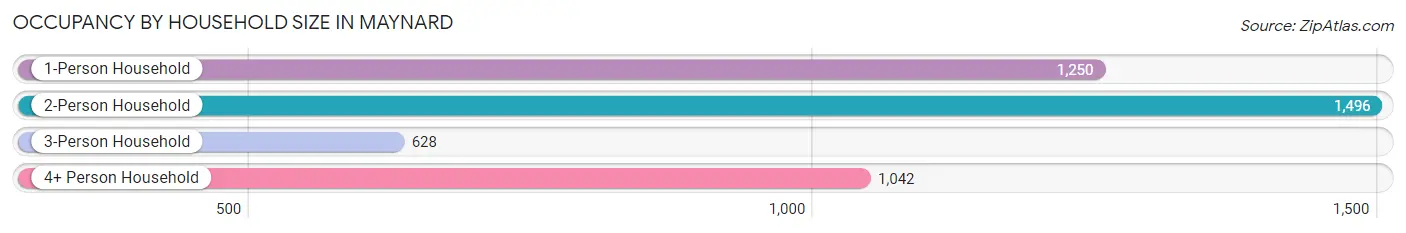
| Household Size | # Housing Units | % Housing Units |
| 1-Person Household | 1,250 | 28.3% |
| 2-Person Household | 1,496 | 33.9% |
| 3-Person Household | 628 | 14.2% |
| 4+ Person Household | 1,042 | 23.6% |
| Total Housing Units | 4,416 | 100.0% |
Occupancy by Ownership by Household Size in Maynard
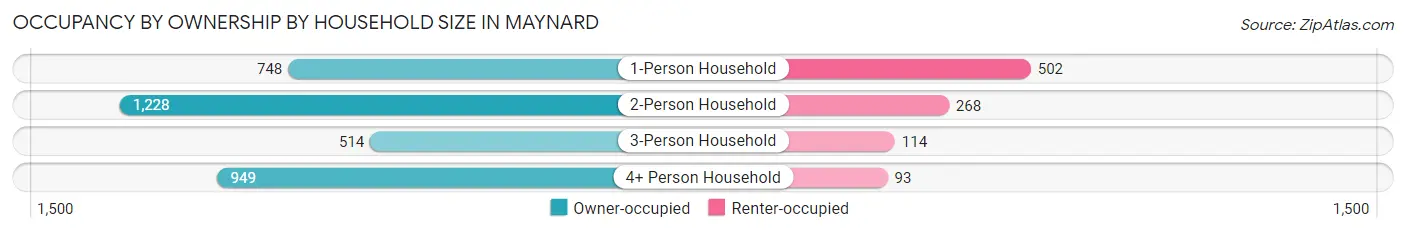
| Household Size | Owner-occupied | Renter-occupied |
| 1-Person Household | 748 (59.8%) | 502 (40.2%) |
| 2-Person Household | 1,228 (82.1%) | 268 (17.9%) |
| 3-Person Household | 514 (81.9%) | 114 (18.1%) |
| 4+ Person Household | 949 (91.1%) | 93 (8.9%) |
| Total Housing Units | 3,439 (77.9%) | 977 (22.1%) |
Occupancy by Educational Attainment in Maynard
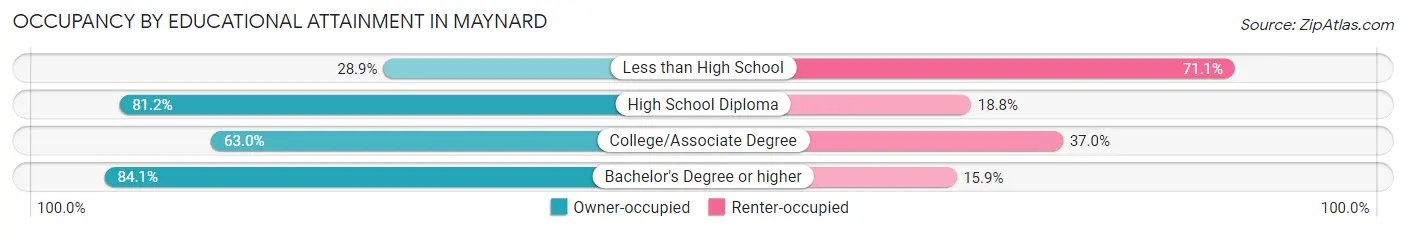
| Household Size | Owner-occupied | Renter-occupied |
| Less than High School | 52 (28.9%) | 128 (71.1%) |
| High School Diploma | 424 (81.2%) | 98 (18.8%) |
| College/Associate Degree | 482 (63.0%) | 283 (37.0%) |
| Bachelor's Degree or higher | 2,481 (84.1%) | 468 (15.9%) |
Occupancy by Age of Householder in Maynard
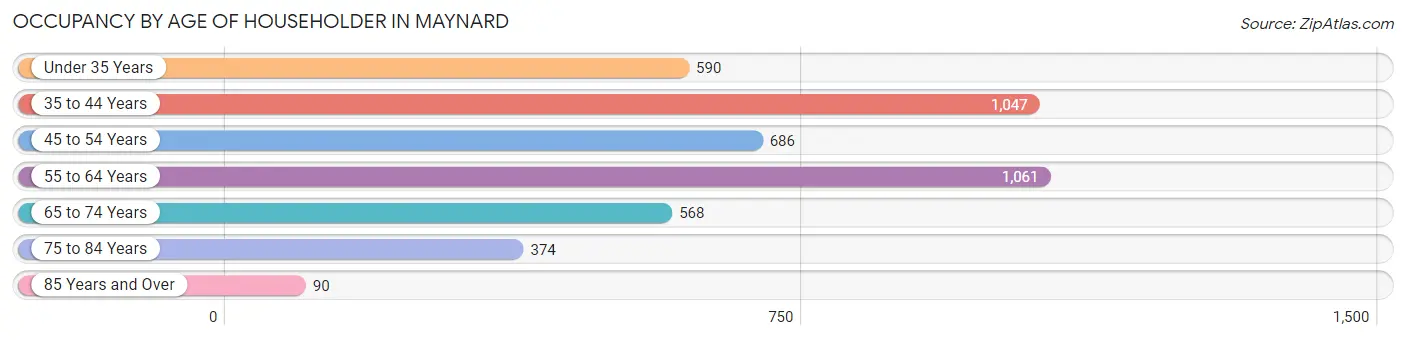
| Age Bracket | # Households | % Households |
| Under 35 Years | 590 | 13.4% |
| 35 to 44 Years | 1,047 | 23.7% |
| 45 to 54 Years | 686 | 15.5% |
| 55 to 64 Years | 1,061 | 24.0% |
| 65 to 74 Years | 568 | 12.9% |
| 75 to 84 Years | 374 | 8.5% |
| 85 Years and Over | 90 | 2.0% |
| Total | 4,416 | 100.0% |
Housing Finances in Maynard
Median Income by Occupancy in Maynard
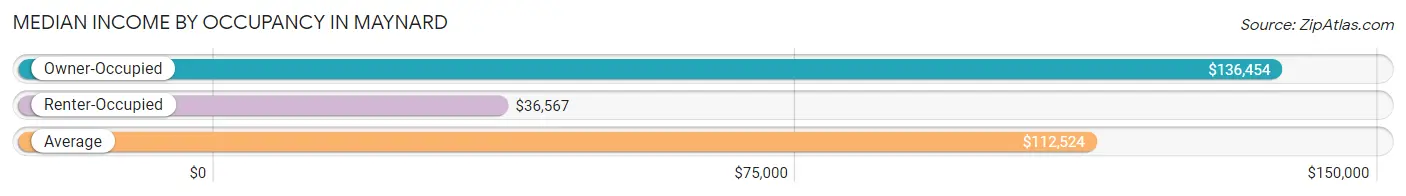
| Occupancy Type | # Households | Median Income |
| Owner-Occupied | 3,439 (77.9%) | $136,454 |
| Renter-Occupied | 977 (22.1%) | $36,567 |
| Average | 4,416 (100.0%) | $112,524 |
Occupancy by Householder Income Bracket in Maynard
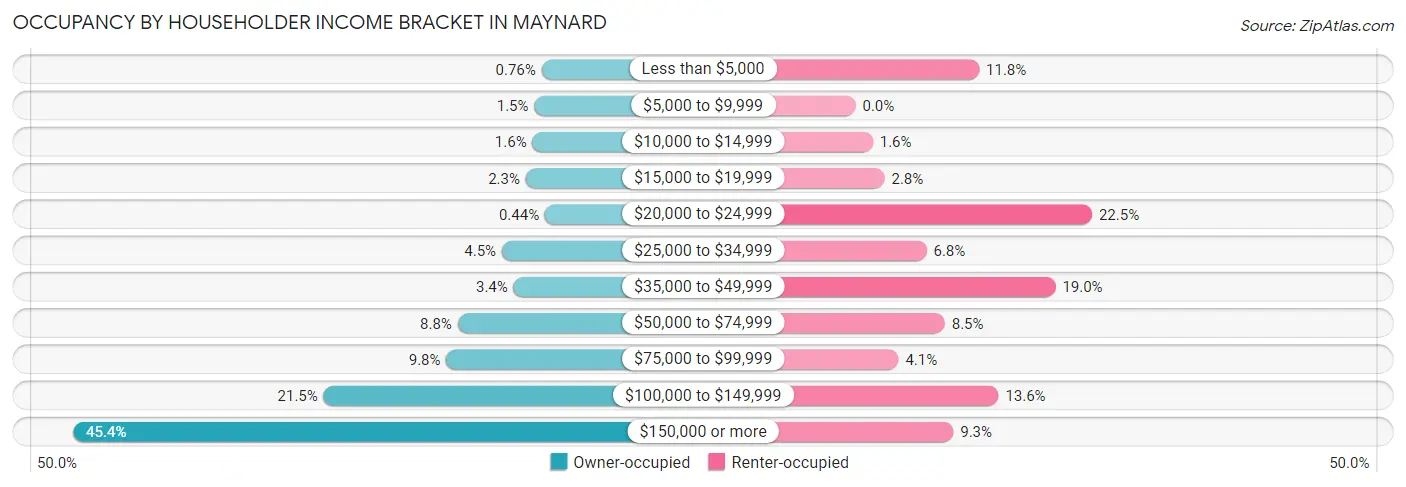
| Income Bracket | Owner-occupied | Renter-occupied |
| Less than $5,000 | 26 (0.8%) | 115 (11.8%) |
| $5,000 to $9,999 | 50 (1.5%) | 0 (0.0%) |
| $10,000 to $14,999 | 56 (1.6%) | 16 (1.6%) |
| $15,000 to $19,999 | 78 (2.3%) | 27 (2.8%) |
| $20,000 to $24,999 | 15 (0.4%) | 220 (22.5%) |
| $25,000 to $34,999 | 156 (4.5%) | 66 (6.8%) |
| $35,000 to $49,999 | 118 (3.4%) | 186 (19.0%) |
| $50,000 to $74,999 | 301 (8.7%) | 83 (8.5%) |
| $75,000 to $99,999 | 338 (9.8%) | 40 (4.1%) |
| $100,000 to $149,999 | 740 (21.5%) | 133 (13.6%) |
| $150,000 or more | 1,561 (45.4%) | 91 (9.3%) |
| Total | 3,439 (100.0%) | 977 (100.0%) |
Monthly Housing Cost Tiers in Maynard
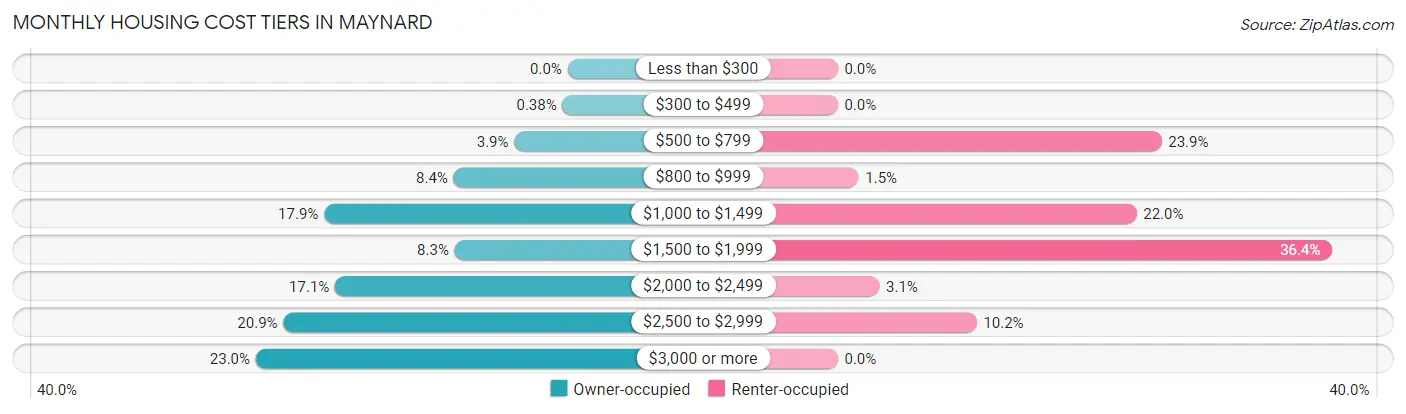
| Monthly Cost | Owner-occupied | Renter-occupied |
| Less than $300 | 0 (0.0%) | 0 (0.0%) |
| $300 to $499 | 13 (0.4%) | 0 (0.0%) |
| $500 to $799 | 135 (3.9%) | 233 (23.8%) |
| $800 to $999 | 289 (8.4%) | 15 (1.5%) |
| $1,000 to $1,499 | 617 (17.9%) | 215 (22.0%) |
| $1,500 to $1,999 | 286 (8.3%) | 356 (36.4%) |
| $2,000 to $2,499 | 589 (17.1%) | 30 (3.1%) |
| $2,500 to $2,999 | 720 (20.9%) | 100 (10.2%) |
| $3,000 or more | 790 (23.0%) | 0 (0.0%) |
| Total | 3,439 (100.0%) | 977 (100.0%) |
Physical Housing Characteristics in Maynard
Housing Structures in Maynard
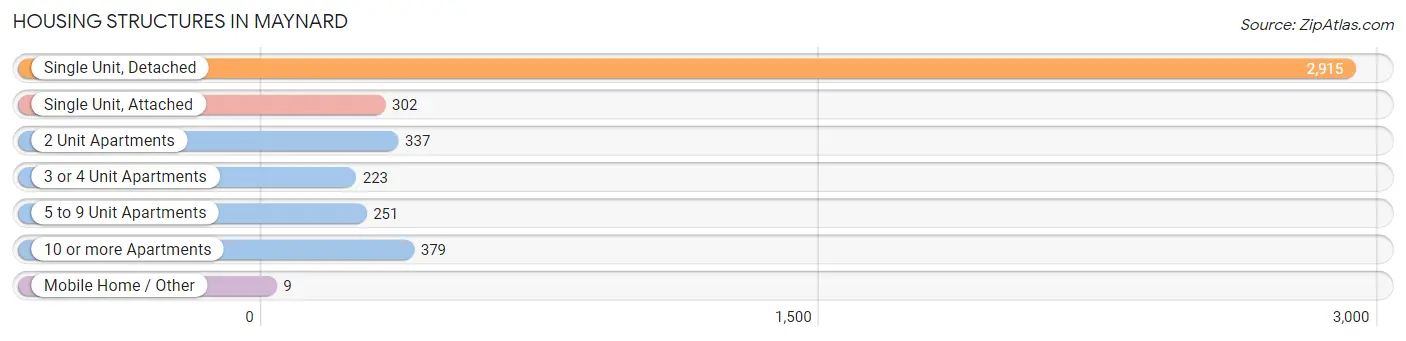
| Structure Type | # Housing Units | % Housing Units |
| Single Unit, Detached | 2,915 | 66.0% |
| Single Unit, Attached | 302 | 6.8% |
| 2 Unit Apartments | 337 | 7.6% |
| 3 or 4 Unit Apartments | 223 | 5.1% |
| 5 to 9 Unit Apartments | 251 | 5.7% |
| 10 or more Apartments | 379 | 8.6% |
| Mobile Home / Other | 9 | 0.2% |
| Total | 4,416 | 100.0% |
Housing Structures by Occupancy in Maynard
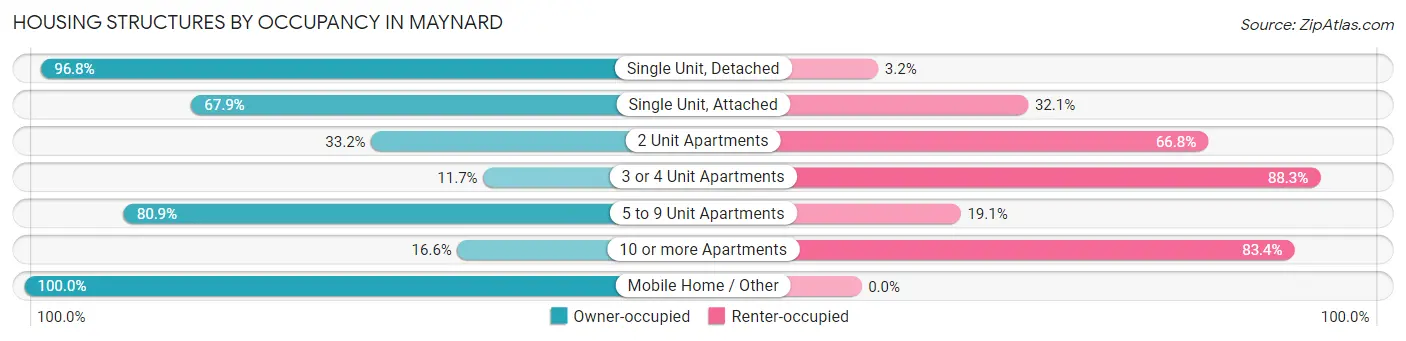
| Structure Type | Owner-occupied | Renter-occupied |
| Single Unit, Detached | 2,821 (96.8%) | 94 (3.2%) |
| Single Unit, Attached | 205 (67.9%) | 97 (32.1%) |
| 2 Unit Apartments | 112 (33.2%) | 225 (66.8%) |
| 3 or 4 Unit Apartments | 26 (11.7%) | 197 (88.3%) |
| 5 to 9 Unit Apartments | 203 (80.9%) | 48 (19.1%) |
| 10 or more Apartments | 63 (16.6%) | 316 (83.4%) |
| Mobile Home / Other | 9 (100.0%) | 0 (0.0%) |
| Total | 3,439 (77.9%) | 977 (22.1%) |
Housing Structures by Number of Rooms in Maynard
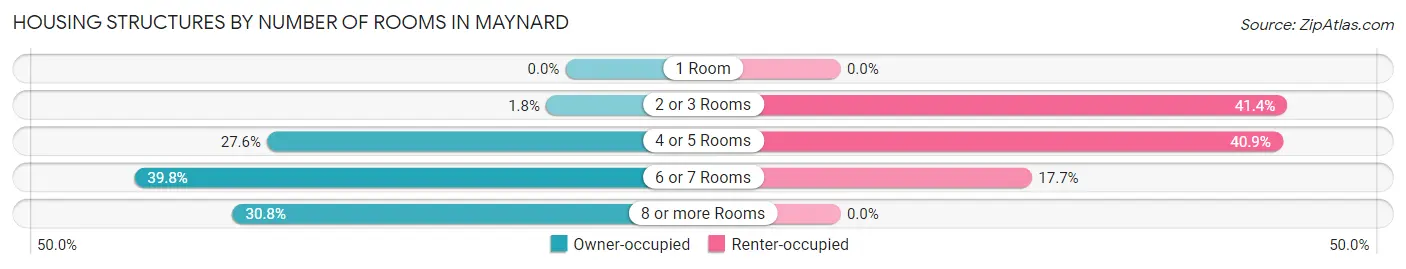
| Number of Rooms | Owner-occupied | Renter-occupied |
| 1 Room | 0 (0.0%) | 0 (0.0%) |
| 2 or 3 Rooms | 62 (1.8%) | 404 (41.3%) |
| 4 or 5 Rooms | 949 (27.6%) | 400 (40.9%) |
| 6 or 7 Rooms | 1,370 (39.8%) | 173 (17.7%) |
| 8 or more Rooms | 1,058 (30.8%) | 0 (0.0%) |
| Total | 3,439 (100.0%) | 977 (100.0%) |
Housing Structure by Heating Type in Maynard
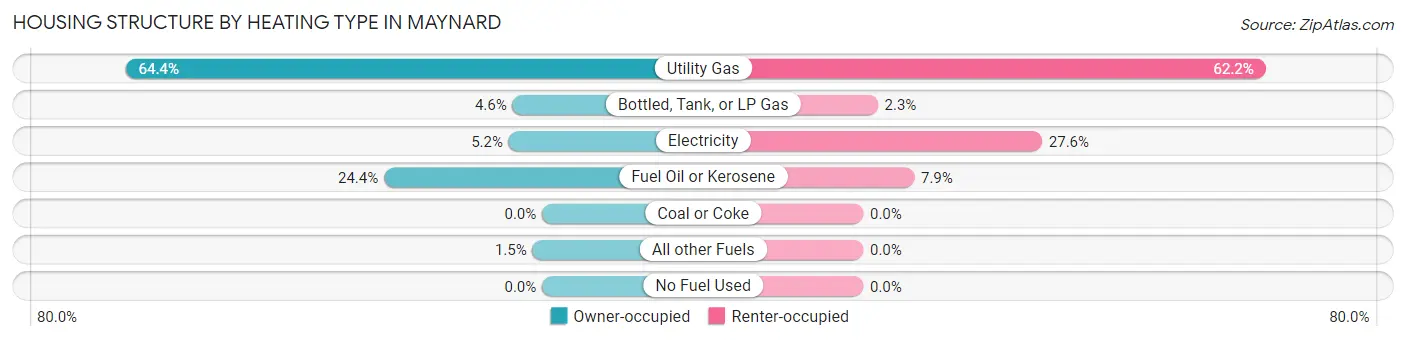
| Heating Type | Owner-occupied | Renter-occupied |
| Utility Gas | 2,214 (64.4%) | 608 (62.2%) |
| Bottled, Tank, or LP Gas | 157 (4.6%) | 22 (2.2%) |
| Electricity | 177 (5.1%) | 270 (27.6%) |
| Fuel Oil or Kerosene | 840 (24.4%) | 77 (7.9%) |
| Coal or Coke | 0 (0.0%) | 0 (0.0%) |
| All other Fuels | 51 (1.5%) | 0 (0.0%) |
| No Fuel Used | 0 (0.0%) | 0 (0.0%) |
| Total | 3,439 (100.0%) | 977 (100.0%) |
Household Vehicle Usage in Maynard
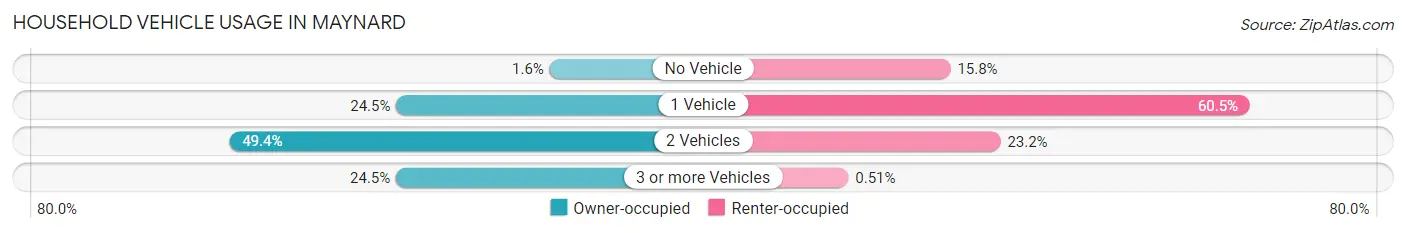
| Vehicles per Household | Owner-occupied | Renter-occupied |
| No Vehicle | 54 (1.6%) | 154 (15.8%) |
| 1 Vehicle | 842 (24.5%) | 591 (60.5%) |
| 2 Vehicles | 1,700 (49.4%) | 227 (23.2%) |
| 3 or more Vehicles | 843 (24.5%) | 5 (0.5%) |
| Total | 3,439 (100.0%) | 977 (100.0%) |
Real Estate & Mortgages in Maynard
Real Estate and Mortgage Overview in Maynard
| Characteristic | Without Mortgage | With Mortgage |
| Housing Units | 1,127 | 2,312 |
| Median Property Value | $417,500 | $483,300 |
| Median Household Income | $98,713 | $1,140 |
| Monthly Housing Costs | $1,167 | $774 |
| Real Estate Taxes | $7,555 | $41 |
Property Value by Mortgage Status in Maynard
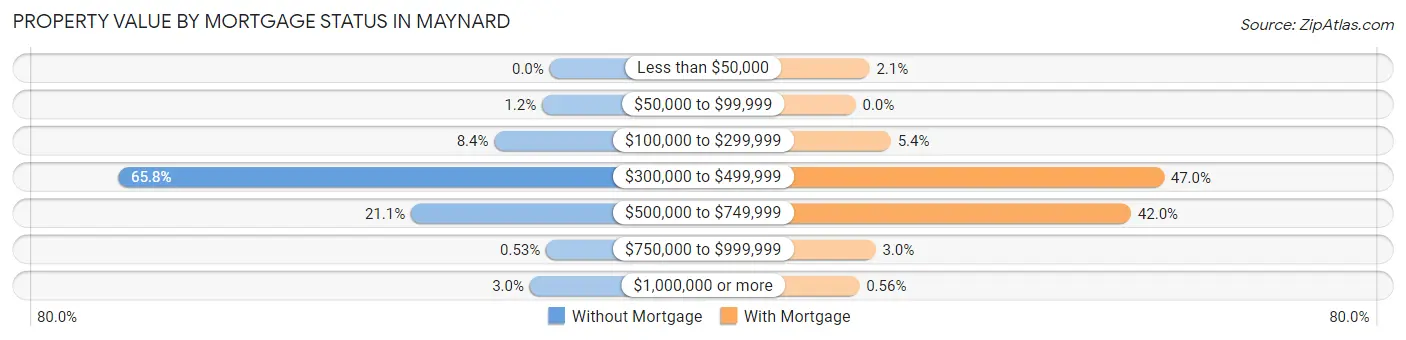
| Property Value | Without Mortgage | With Mortgage |
| Less than $50,000 | 0 (0.0%) | 49 (2.1%) |
| $50,000 to $99,999 | 13 (1.1%) | 0 (0.0%) |
| $100,000 to $299,999 | 95 (8.4%) | 124 (5.4%) |
| $300,000 to $499,999 | 741 (65.7%) | 1,086 (47.0%) |
| $500,000 to $749,999 | 238 (21.1%) | 970 (42.0%) |
| $750,000 to $999,999 | 6 (0.5%) | 70 (3.0%) |
| $1,000,000 or more | 34 (3.0%) | 13 (0.6%) |
| Total | 1,127 (100.0%) | 2,312 (100.0%) |
Household Income by Mortgage Status in Maynard
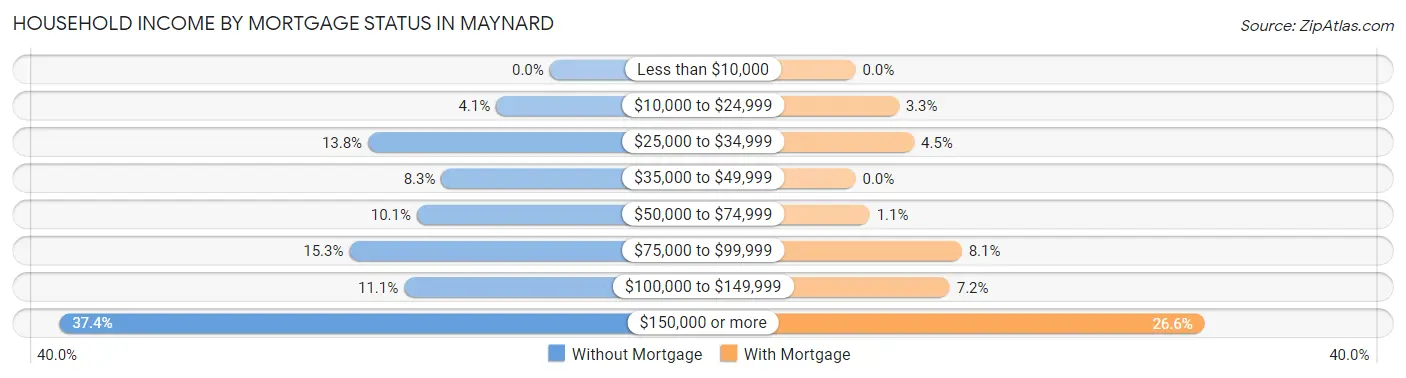
| Household Income | Without Mortgage | With Mortgage |
| Less than $10,000 | 0 (0.0%) | 0 (0.0%) |
| $10,000 to $24,999 | 46 (4.1%) | 76 (3.3%) |
| $25,000 to $34,999 | 156 (13.8%) | 103 (4.5%) |
| $35,000 to $49,999 | 93 (8.3%) | 0 (0.0%) |
| $50,000 to $74,999 | 114 (10.1%) | 25 (1.1%) |
| $75,000 to $99,999 | 172 (15.3%) | 187 (8.1%) |
| $100,000 to $149,999 | 125 (11.1%) | 166 (7.2%) |
| $150,000 or more | 421 (37.4%) | 615 (26.6%) |
| Total | 1,127 (100.0%) | 2,312 (100.0%) |
Property Value to Household Income Ratio in Maynard
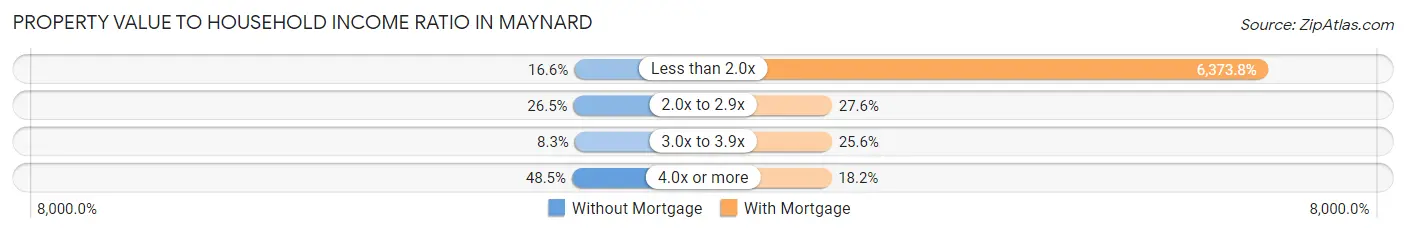
| Value-to-Income Ratio | Without Mortgage | With Mortgage |
| Less than 2.0x | 187 (16.6%) | 147,361 (6,373.7%) |
| 2.0x to 2.9x | 299 (26.5%) | 639 (27.6%) |
| 3.0x to 3.9x | 94 (8.3%) | 591 (25.6%) |
| 4.0x or more | 547 (48.5%) | 420 (18.2%) |
| Total | 1,127 (100.0%) | 2,312 (100.0%) |
Real Estate Taxes by Mortgage Status in Maynard
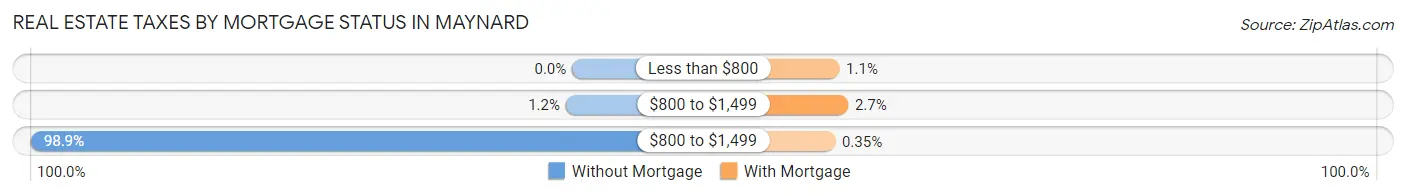
| Property Taxes | Without Mortgage | With Mortgage |
| Less than $800 | 0 (0.0%) | 26 (1.1%) |
| $800 to $1,499 | 13 (1.1%) | 63 (2.7%) |
| $800 to $1,499 | 1,114 (98.9%) | 8 (0.4%) |
| Total | 1,127 (100.0%) | 2,312 (100.0%) |
Health & Disability in Maynard
Health Insurance Coverage by Age in Maynard
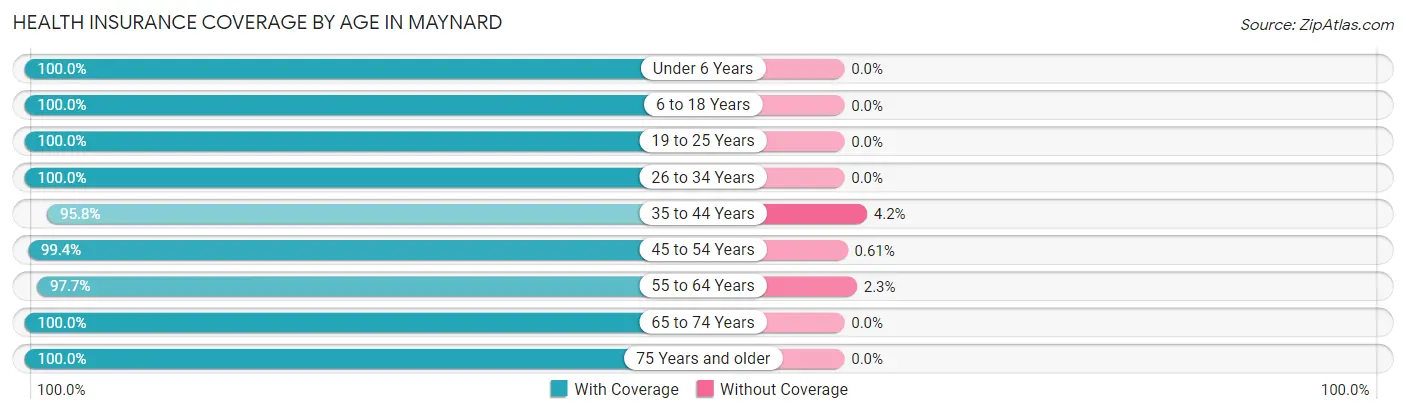
| Age Bracket | With Coverage | Without Coverage |
| Under 6 Years | 882 (100.0%) | 0 (0.0%) |
| 6 to 18 Years | 1,677 (100.0%) | 0 (0.0%) |
| 19 to 25 Years | 572 (100.0%) | 0 (0.0%) |
| 26 to 34 Years | 1,079 (100.0%) | 0 (0.0%) |
| 35 to 44 Years | 1,667 (95.8%) | 73 (4.2%) |
| 45 to 54 Years | 1,463 (99.4%) | 9 (0.6%) |
| 55 to 64 Years | 1,674 (97.7%) | 40 (2.3%) |
| 65 to 74 Years | 821 (100.0%) | 0 (0.0%) |
| 75 Years and older | 714 (100.0%) | 0 (0.0%) |
| Total | 10,549 (98.9%) | 122 (1.1%) |
Health Insurance Coverage by Citizenship Status in Maynard
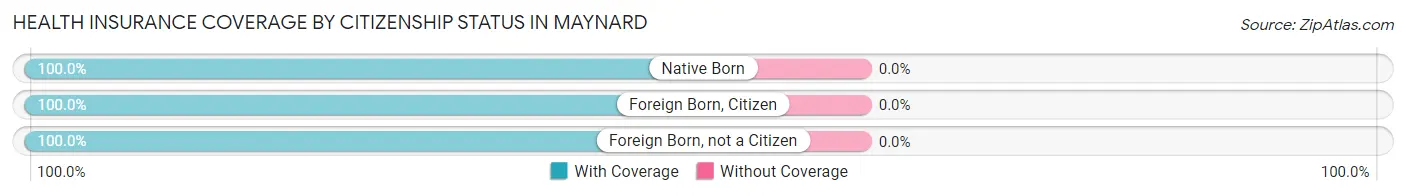
| Citizenship Status | With Coverage | Without Coverage |
| Native Born | 882 (100.0%) | 0 (0.0%) |
| Foreign Born, Citizen | 1,677 (100.0%) | 0 (0.0%) |
| Foreign Born, not a Citizen | 572 (100.0%) | 0 (0.0%) |
Health Insurance Coverage by Household Income in Maynard
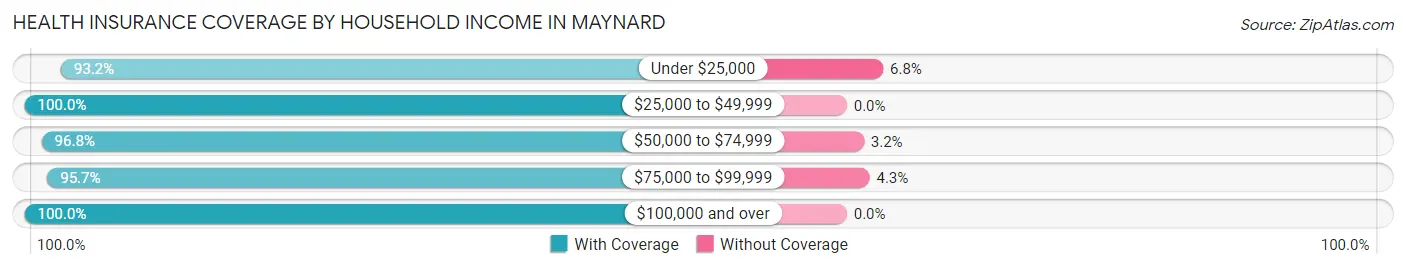
| Household Income | With Coverage | Without Coverage |
| Under $25,000 | 946 (93.2%) | 69 (6.8%) |
| $25,000 to $49,999 | 729 (100.0%) | 0 (0.0%) |
| $50,000 to $74,999 | 574 (96.8%) | 19 (3.2%) |
| $75,000 to $99,999 | 675 (95.7%) | 30 (4.3%) |
| $100,000 and over | 7,596 (100.0%) | 0 (0.0%) |
Public vs Private Health Insurance Coverage by Age in Maynard
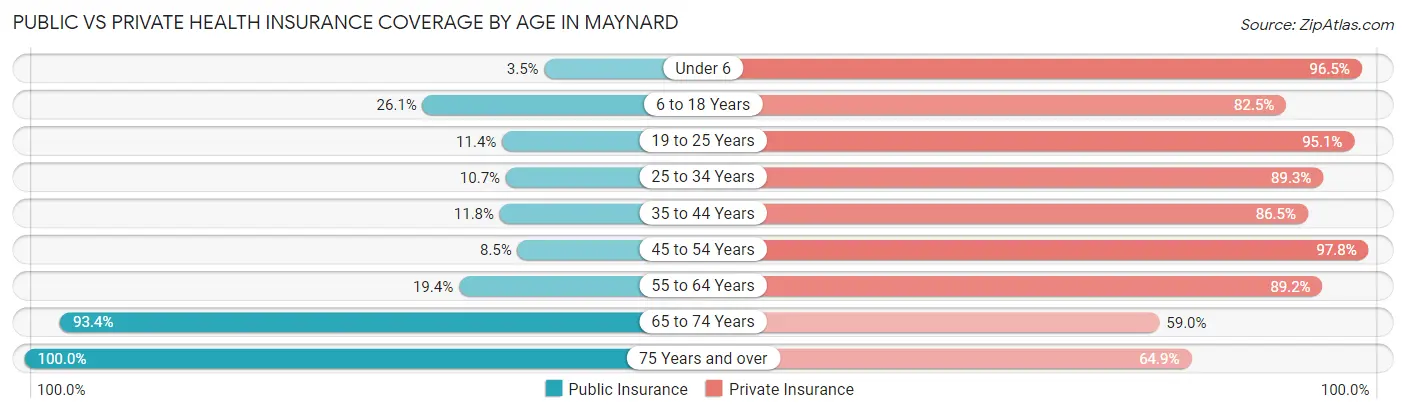
| Age Bracket | Public Insurance | Private Insurance |
| Under 6 | 31 (3.5%) | 851 (96.5%) |
| 6 to 18 Years | 438 (26.1%) | 1,383 (82.5%) |
| 19 to 25 Years | 65 (11.4%) | 544 (95.1%) |
| 25 to 34 Years | 115 (10.7%) | 964 (89.3%) |
| 35 to 44 Years | 205 (11.8%) | 1,505 (86.5%) |
| 45 to 54 Years | 125 (8.5%) | 1,439 (97.8%) |
| 55 to 64 Years | 332 (19.4%) | 1,529 (89.2%) |
| 65 to 74 Years | 767 (93.4%) | 484 (59.0%) |
| 75 Years and over | 714 (100.0%) | 463 (64.8%) |
| Total | 2,792 (26.2%) | 9,162 (85.9%) |
Disability Status by Sex by Age in Maynard
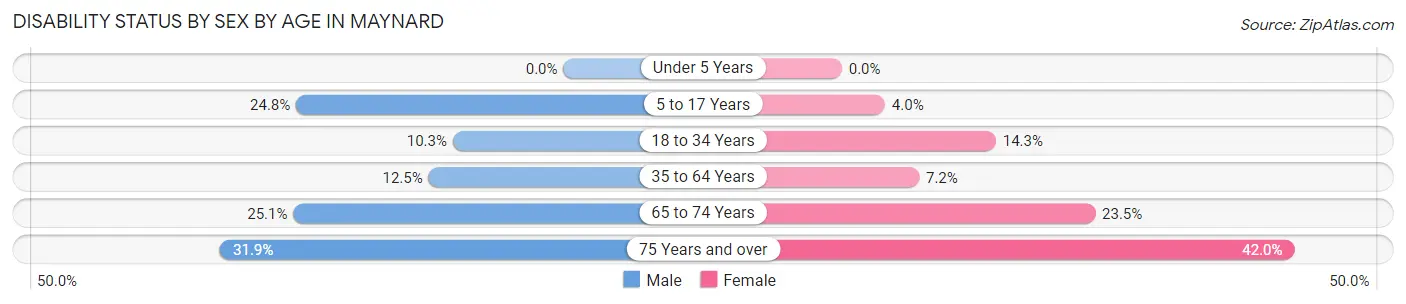
| Age Bracket | Male | Female |
| Under 5 Years | 0 (0.0%) | 0 (0.0%) |
| 5 to 17 Years | 284 (24.8%) | 28 (4.0%) |
| 18 to 34 Years | 84 (10.3%) | 141 (14.3%) |
| 35 to 64 Years | 309 (12.5%) | 176 (7.2%) |
| 65 to 74 Years | 113 (25.1%) | 87 (23.5%) |
| 75 Years and over | 100 (31.9%) | 168 (42.0%) |
Disability Class by Sex by Age in Maynard
Disability Class: Hearing Difficulty
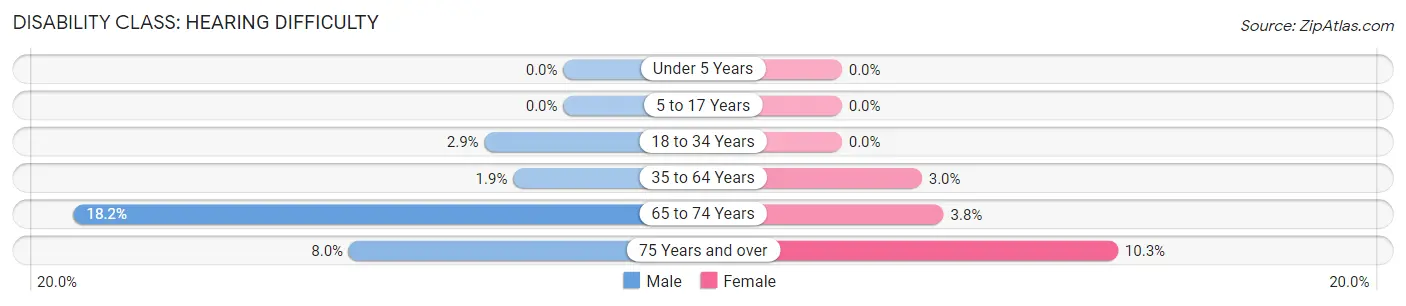
| Age Bracket | Male | Female |
| Under 5 Years | 0 (0.0%) | 0 (0.0%) |
| 5 to 17 Years | 0 (0.0%) | 0 (0.0%) |
| 18 to 34 Years | 24 (2.9%) | 0 (0.0%) |
| 35 to 64 Years | 46 (1.9%) | 73 (3.0%) |
| 65 to 74 Years | 82 (18.2%) | 14 (3.8%) |
| 75 Years and over | 25 (8.0%) | 41 (10.2%) |
Disability Class: Vision Difficulty
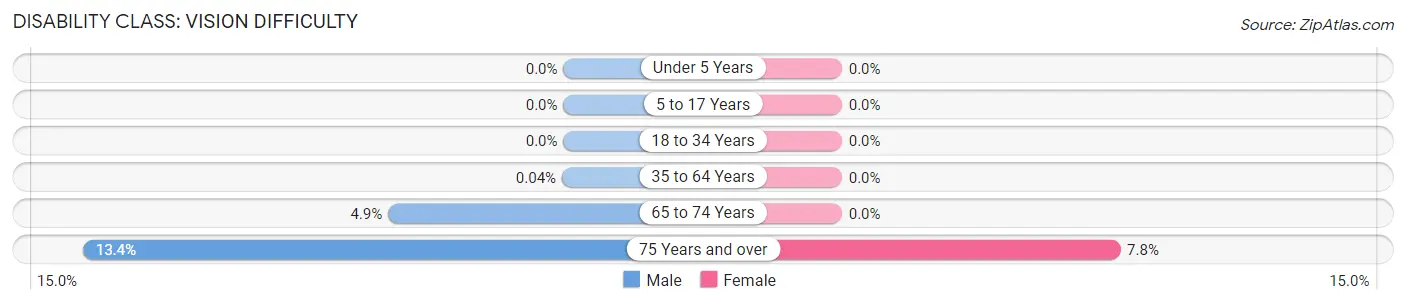
| Age Bracket | Male | Female |
| Under 5 Years | 0 (0.0%) | 0 (0.0%) |
| 5 to 17 Years | 0 (0.0%) | 0 (0.0%) |
| 18 to 34 Years | 0 (0.0%) | 0 (0.0%) |
| 35 to 64 Years | 1 (0.0%) | 0 (0.0%) |
| 65 to 74 Years | 22 (4.9%) | 0 (0.0%) |
| 75 Years and over | 42 (13.4%) | 31 (7.7%) |
Disability Class: Cognitive Difficulty
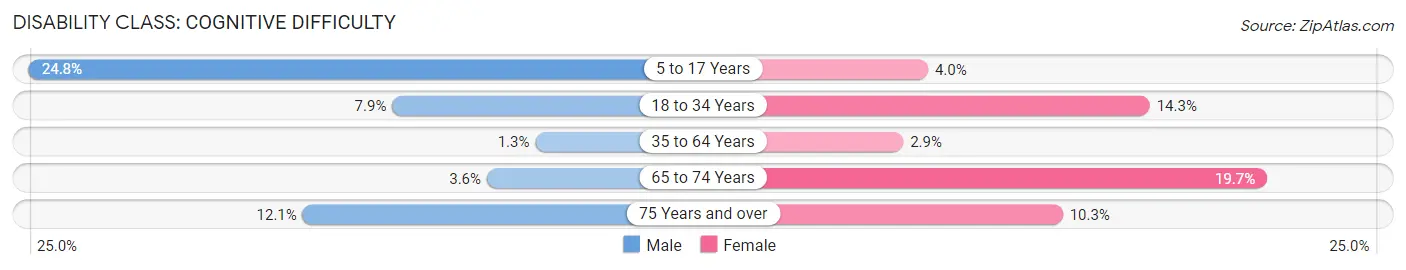
| Age Bracket | Male | Female |
| 5 to 17 Years | 284 (24.8%) | 28 (4.0%) |
| 18 to 34 Years | 65 (7.9%) | 141 (14.3%) |
| 35 to 64 Years | 32 (1.3%) | 70 (2.9%) |
| 65 to 74 Years | 16 (3.5%) | 73 (19.7%) |
| 75 Years and over | 38 (12.1%) | 41 (10.2%) |
Disability Class: Ambulatory Difficulty
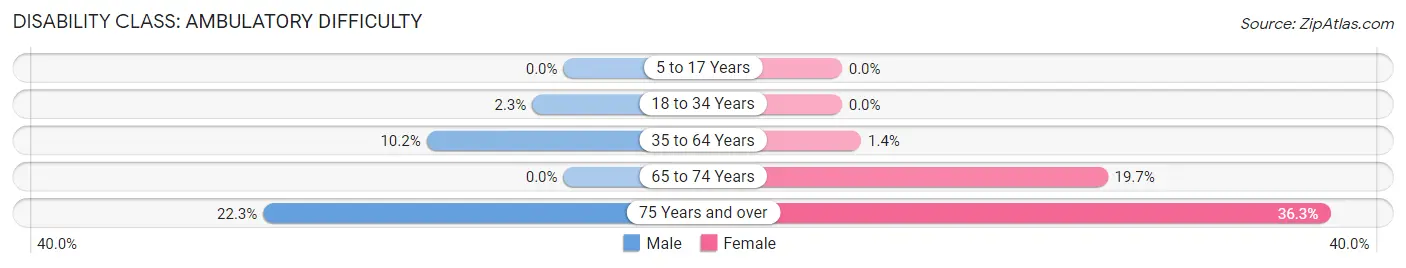
| Age Bracket | Male | Female |
| 5 to 17 Years | 0 (0.0%) | 0 (0.0%) |
| 18 to 34 Years | 19 (2.3%) | 0 (0.0%) |
| 35 to 64 Years | 251 (10.2%) | 35 (1.4%) |
| 65 to 74 Years | 0 (0.0%) | 73 (19.7%) |
| 75 Years and over | 70 (22.3%) | 145 (36.2%) |
Disability Class: Self-Care Difficulty
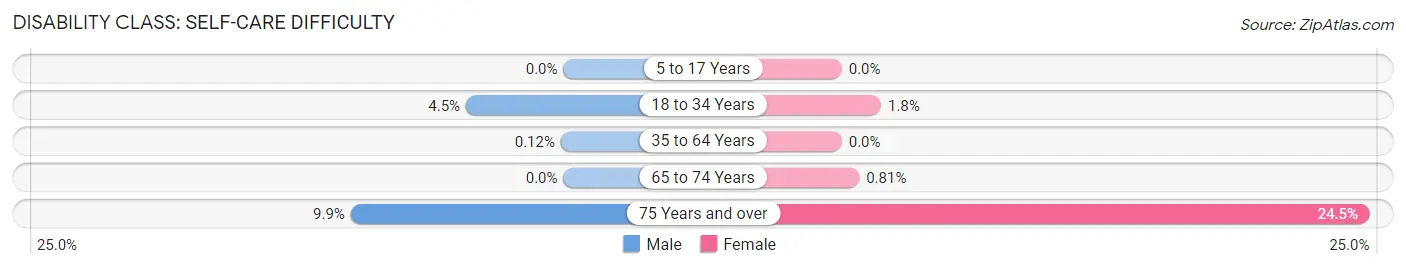
| Age Bracket | Male | Female |
| 5 to 17 Years | 0 (0.0%) | 0 (0.0%) |
| 18 to 34 Years | 37 (4.5%) | 18 (1.8%) |
| 35 to 64 Years | 3 (0.1%) | 0 (0.0%) |
| 65 to 74 Years | 0 (0.0%) | 3 (0.8%) |
| 75 Years and over | 31 (9.9%) | 98 (24.5%) |
Technology Access in Maynard
Computing Device Access in Maynard
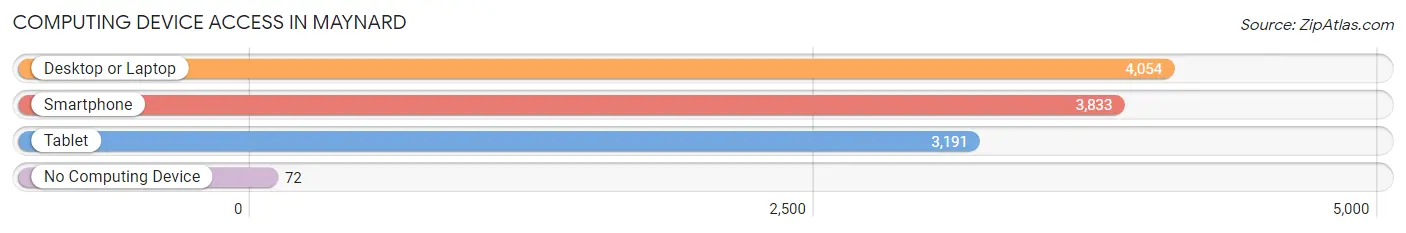
| Device Type | # Households | % Households |
| Desktop or Laptop | 4,054 | 91.8% |
| Smartphone | 3,833 | 86.8% |
| Tablet | 3,191 | 72.3% |
| No Computing Device | 72 | 1.6% |
| Total | 4,416 | 100.0% |
Internet Access in Maynard
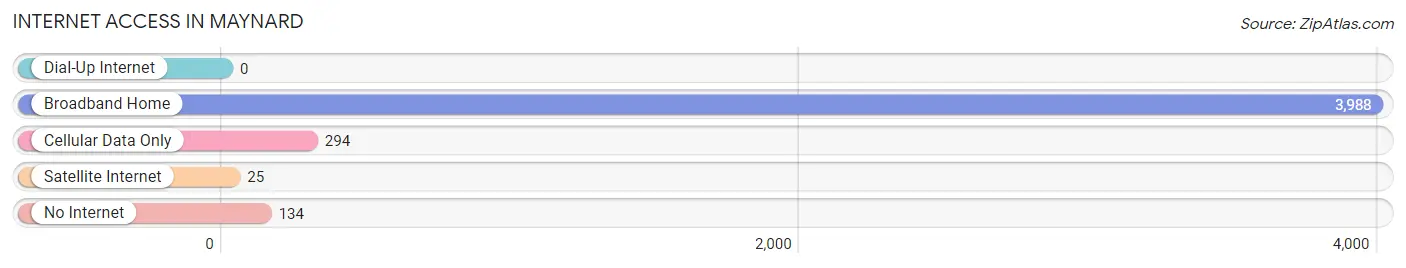
| Internet Type | # Households | % Households |
| Dial-Up Internet | 0 | 0.0% |
| Broadband Home | 3,988 | 90.3% |
| Cellular Data Only | 294 | 6.7% |
| Satellite Internet | 25 | 0.6% |
| No Internet | 134 | 3.0% |
| Total | 4,416 | 100.0% |
Maynard Summary
Maynard, Massachusetts is a small town located in Middlesex County, about 25 miles west of Boston. It is bordered by the towns of Stow, Sudbury, Acton, Concord, and Littleton. The town has a population of 10,106 as of the 2010 census, and is part of the Greater Boston metropolitan area.
History
Maynard was first settled in 1638 by settlers from Watertown, and was originally part of the town of Sudbury. It was officially incorporated as a town in 1871, and was named after Amory Maynard, a prominent local businessman.
In the late 19th century, Maynard was a major center of the industrial revolution, with several factories producing textiles, paper, and other goods. The most famous of these was the American Woolen Company, which was founded in 1889 and was the largest woolen mill in the world at the time. The company was the largest employer in town, and its success helped to make Maynard one of the wealthiest towns in the state.
In the late 20th century, the town underwent a major transformation when the American Woolen Company closed in 1957. The town was left with a large industrial park, and the townspeople began to look for new ways to make use of the space. In the late 1960s, the town began to attract high-tech companies, and the industrial park was transformed into a technology center. Today, the town is home to several major technology companies, including Oracle, EMC, and Akamai Technologies.
Geography
Maynard is located in eastern Massachusetts, about 25 miles west of Boston. It is bordered by the towns of Stow, Sudbury, Acton, Concord, and Littleton. The town is situated on the Assabet River, and is part of the Assabet River National Wildlife Refuge. The town is mostly flat, with some hills in the northern part of town.
The town has a total area of 8.2 square miles, of which 8.1 square miles is land and 0.1 square miles is water. The town is located in the Assabet River Valley, and is part of the Nashoba Valley region.
Economy
Maynard is a largely residential town, with a small but vibrant business community. The town is home to several major technology companies, including Oracle, EMC, and Akamai Technologies. The town is also home to several small businesses, including restaurants, retail stores, and professional services.
The town is also home to the Assabet River National Wildlife Refuge, which is a popular destination for outdoor recreation. The refuge is home to a variety of wildlife, including beavers, otters, and bald eagles.
Demographics
As of the 2010 census, the town had a population of 10,106. The racial makeup of the town was 87.3% White, 4.3% African American, 0.3% Native American, 4.7% Asian, 0.1% Pacific Islander, 1.3% from other races, and 2.0% from two or more races. Hispanic or Latino of any race were 3.7% of the population.
The median household income in the town was $76,837, and the median family income was $90,945. The per capita income in the town was $35,945. About 4.3% of families and 5.7% of the population were below the poverty line, including 6.3% of those under age 18 and 4.2% of those age 65 or over.
Common Questions
What is Per Capita Income in Maynard?
Per Capita income in Maynard is $59,516.
What is the Median Family Income in Maynard?
Median Family Income in Maynard is $150,714.
What is the Median Household income in Maynard?
Median Household Income in Maynard is $112,524.
What is Income or Wage Gap in Maynard?
Income or Wage Gap in Maynard is 28.8%.
Women in Maynard earn 71.2 cents for every dollar earned by a man.
What is Inequality or Gini Index in Maynard?
Inequality or Gini Index in Maynard is 0.44.
What is the Total Population of Maynard?
Total Population of Maynard is 10,671.
What is the Total Male Population of Maynard?
Total Male Population of Maynard is 5,402.
What is the Total Female Population of Maynard?
Total Female Population of Maynard is 5,269.
What is the Ratio of Males per 100 Females in Maynard?
There are 102.52 Males per 100 Females in Maynard.
What is the Ratio of Females per 100 Males in Maynard?
There are 97.54 Females per 100 Males in Maynard.
What is the Median Population Age in Maynard?
Median Population Age in Maynard is 40.8 Years.
What is the Average Family Size in Maynard
Average Family Size in Maynard is 3.0 People.
What is the Average Household Size in Maynard
Average Household Size in Maynard is 2.4 People.
How Large is the Labor Force in Maynard?
There are 6,271 People in the Labor Forcein in Maynard.
What is the Percentage of People in the Labor Force in Maynard?
74.1% of People are in the Labor Force in Maynard.
What is the Unemployment Rate in Maynard?
Unemployment Rate in Maynard is 4.3%.