Oviedo, FL Map & Demographics
Oviedo Map
Oviedo Overview
$46,456
PER CAPITA INCOME
$120,478
AVG FAMILY INCOME
$116,764
AVG HOUSEHOLD INCOME
23.1%
WAGE / INCOME GAP [ % ]
76.9¢/ $1
WAGE / INCOME GAP [ $ ]
0.39
INEQUALITY / GINI INDEX
39,552
TOTAL POPULATION
19,321
MALE POPULATION
20,231
FEMALE POPULATION
95.50
MALES / 100 FEMALES
104.71
FEMALES / 100 MALES
36.9
MEDIAN AGE
3.3
AVG FAMILY SIZE
3.0
AVG HOUSEHOLD SIZE
21,648
LABOR FORCE [ PEOPLE ]
70.1%
PERCENT IN LABOR FORCE
4.2%
UNEMPLOYMENT RATE
Income in Oviedo
Income Overview in Oviedo
Per Capita Income in Oviedo is $46,456, while median incomes of families and households are $120,478 and $116,764 respectively.
| Characteristic | Number | Measure |
| Per Capita Income | 39,552 | $46,456 |
| Median Family Income | 10,786 | $120,478 |
| Mean Family Income | 10,786 | $146,163 |
| Median Household Income | 12,925 | $116,764 |
| Mean Household Income | 12,925 | $140,211 |
| Income Deficit | 10,786 | $0 |
| Wage / Income Gap (%) | 39,552 | 23.10% |
| Wage / Income Gap ($) | 39,552 | 76.90¢ per $1 |
| Gini / Inequality Index | 39,552 | 0.39 |
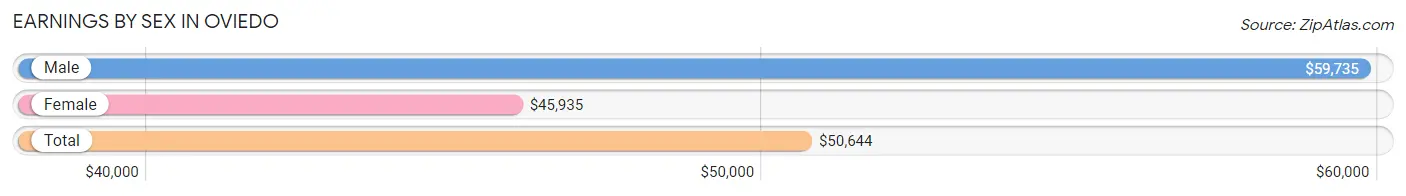
Earnings by Sex in Oviedo
Average Earnings in Oviedo are $50,644, $59,735 for men and $45,935 for women, a difference of 23.1%.
| Sex | Number | Average Earnings |
| Male | 11,607 (52.9%) | $59,735 |
| Female | 10,319 (47.1%) | $45,935 |
| Total | 21,926 (100.0%) | $50,644 |
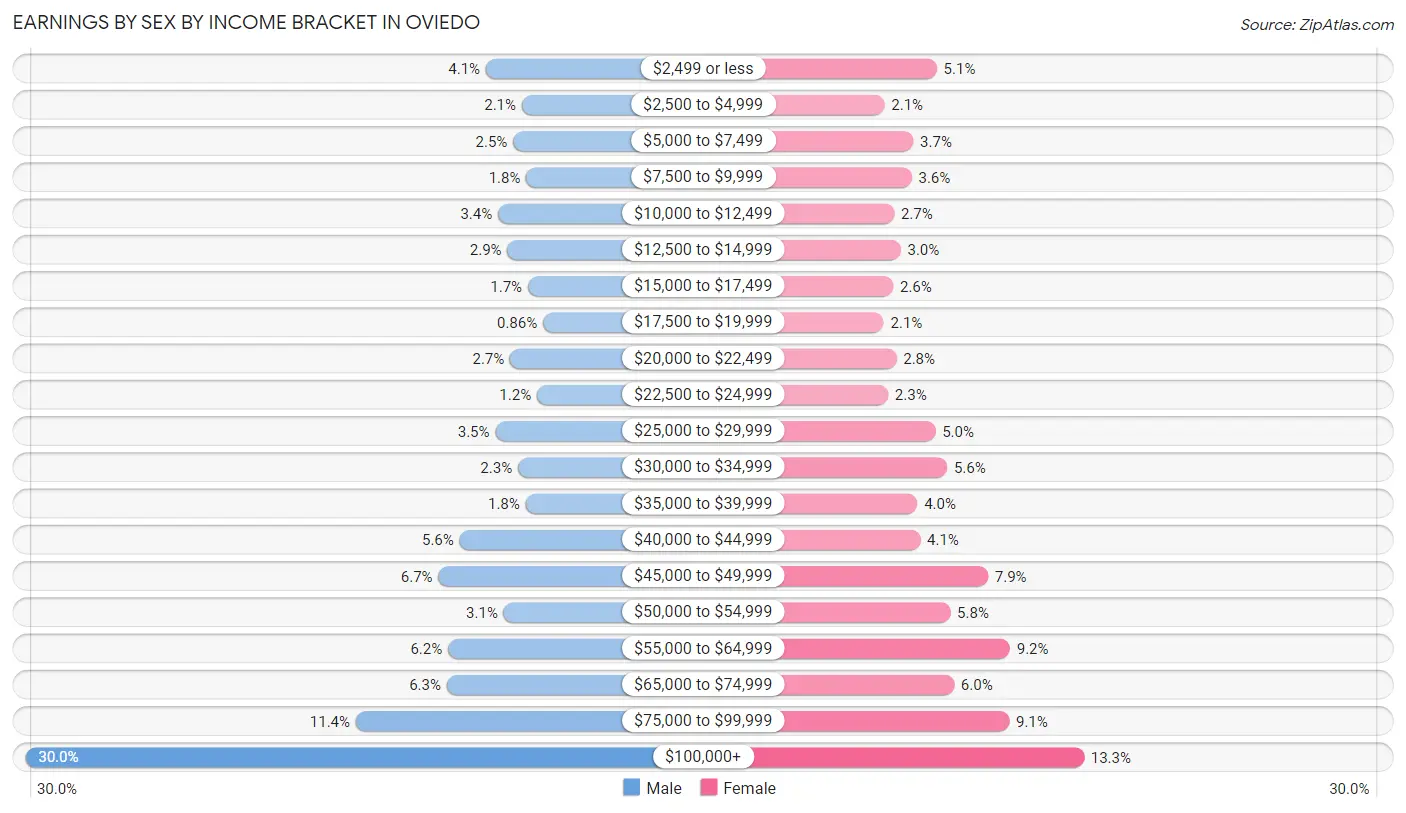
Earnings by Sex by Income Bracket in Oviedo
The most common earnings brackets in Oviedo are $100,000+ for men (3,477 | 30.0%) and $100,000+ for women (1,374 | 13.3%).
| Income | Male | Female |
| $2,499 or less | 472 (4.1%) | 521 (5.1%) |
| $2,500 to $4,999 | 238 (2.1%) | 218 (2.1%) |
| $5,000 to $7,499 | 295 (2.5%) | 385 (3.7%) |
| $7,500 to $9,999 | 209 (1.8%) | 376 (3.6%) |
| $10,000 to $12,499 | 393 (3.4%) | 273 (2.6%) |
| $12,500 to $14,999 | 332 (2.9%) | 312 (3.0%) |
| $15,000 to $17,499 | 198 (1.7%) | 268 (2.6%) |
| $17,500 to $19,999 | 100 (0.9%) | 214 (2.1%) |
| $20,000 to $22,499 | 315 (2.7%) | 287 (2.8%) |
| $22,500 to $24,999 | 139 (1.2%) | 238 (2.3%) |
| $25,000 to $29,999 | 411 (3.5%) | 513 (5.0%) |
| $30,000 to $34,999 | 263 (2.3%) | 581 (5.6%) |
| $35,000 to $39,999 | 214 (1.8%) | 409 (4.0%) |
| $40,000 to $44,999 | 644 (5.6%) | 425 (4.1%) |
| $45,000 to $49,999 | 782 (6.7%) | 818 (7.9%) |
| $50,000 to $54,999 | 356 (3.1%) | 600 (5.8%) |
| $55,000 to $64,999 | 720 (6.2%) | 945 (9.2%) |
| $65,000 to $74,999 | 728 (6.3%) | 621 (6.0%) |
| $75,000 to $99,999 | 1,321 (11.4%) | 941 (9.1%) |
| $100,000+ | 3,477 (30.0%) | 1,374 (13.3%) |
| Total | 11,607 (100.0%) | 10,319 (100.0%) |
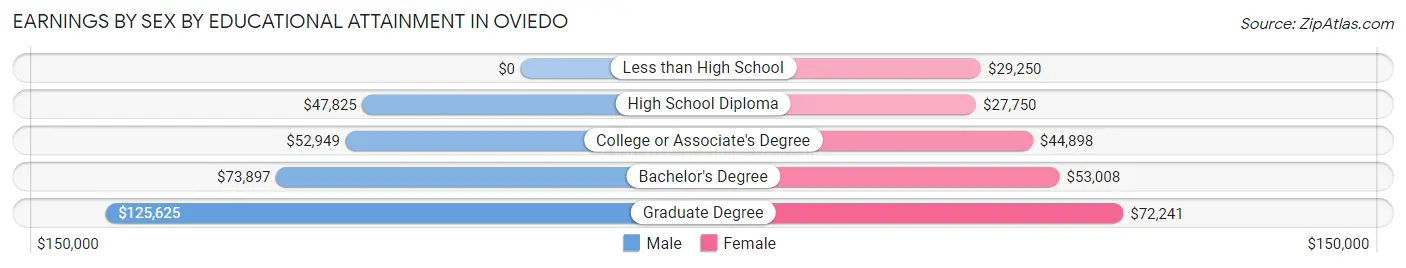
Earnings by Sex by Educational Attainment in Oviedo
Average earnings in Oviedo are $68,208 for men and $50,561 for women, a difference of 25.9%. Men with an educational attainment of graduate degree enjoy the highest average annual earnings of $125,625, while those with high school diploma education earn the least with $47,825. Women with an educational attainment of graduate degree earn the most with the average annual earnings of $72,241, while those with high school diploma education have the smallest earnings of $27,750.
| Educational Attainment | Male Income | Female Income |
| Less than High School | - | - |
| High School Diploma | $47,825 | $27,750 |
| College or Associate's Degree | $52,949 | $44,898 |
| Bachelor's Degree | $73,897 | $53,008 |
| Graduate Degree | $125,625 | $72,241 |
| Total | $68,208 | $50,561 |
Family Income in Oviedo
Family Income Brackets in Oviedo
According to the Oviedo family income data, there are 2,804 families falling into the $100,000 to $149,999 income range, which is the most common income bracket and makes up 26.0% of all families. Conversely, the $10,000 to $14,999 income bracket is the least frequent group with only 76 families (0.7%) belonging to this category.
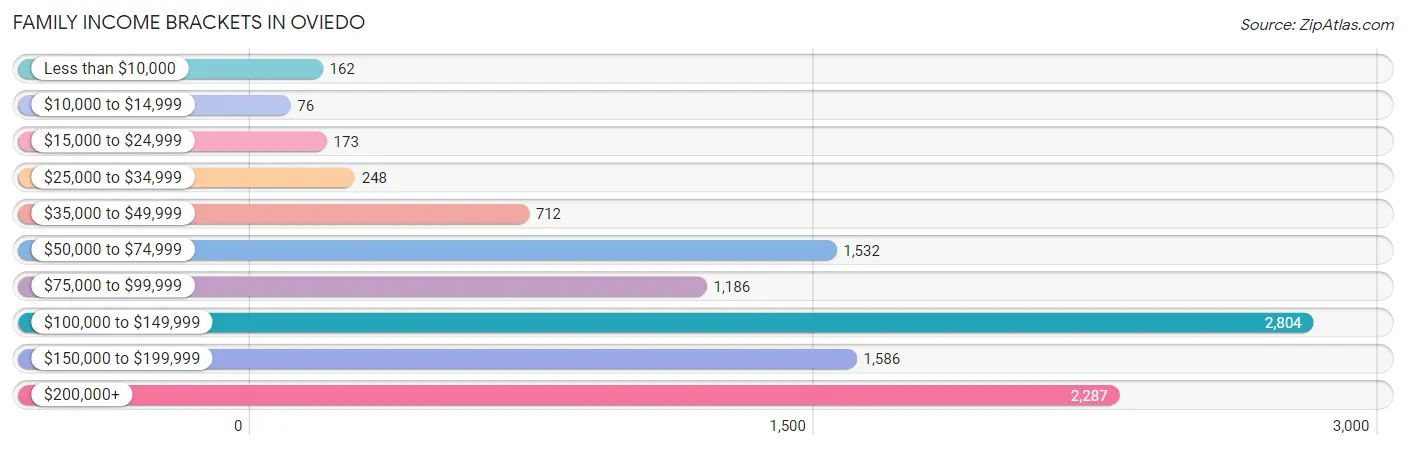
| Income Bracket | # Families | % Families |
| Less than $10,000 | 162 | 1.5% |
| $10,000 to $14,999 | 76 | 0.7% |
| $15,000 to $24,999 | 173 | 1.6% |
| $25,000 to $34,999 | 248 | 2.3% |
| $35,000 to $49,999 | 712 | 6.6% |
| $50,000 to $74,999 | 1,532 | 14.2% |
| $75,000 to $99,999 | 1,186 | 11.0% |
| $100,000 to $149,999 | 2,804 | 26.0% |
| $150,000 to $199,999 | 1,586 | 14.7% |
| $200,000+ | 2,287 | 21.2% |
Family Income by Famaliy Size in Oviedo
6-person families (269 | 2.5%) account for the highest median family income in Oviedo with $157,250 per family, while 2-person families (3,561 | 33.0%) have the highest median income of $55,347 per family member.
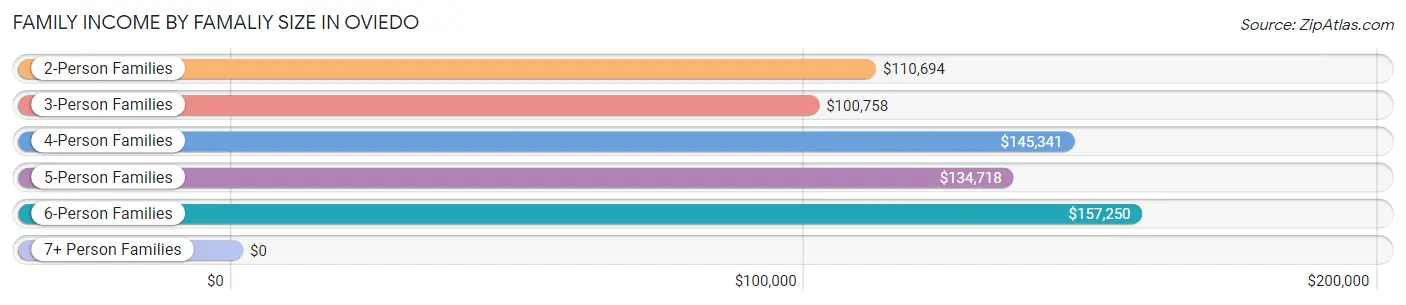
| Income Bracket | # Families | Median Income |
| 2-Person Families | 3,561 (33.0%) | $110,694 |
| 3-Person Families | 3,127 (29.0%) | $100,758 |
| 4-Person Families | 2,692 (25.0%) | $145,341 |
| 5-Person Families | 1,067 (9.9%) | $134,718 |
| 6-Person Families | 269 (2.5%) | $157,250 |
| 7+ Person Families | 70 (0.6%) | $0 |
| Total | 10,786 (100.0%) | $120,478 |
Family Income by Number of Earners in Oviedo
The median family income in Oviedo is $120,478, with families comprising 3+ earners (1,523) having the highest median family income of $139,291, while families with no earners (868) have the lowest median family income of $44,808, accounting for 14.1% and 8.1% of families, respectively.
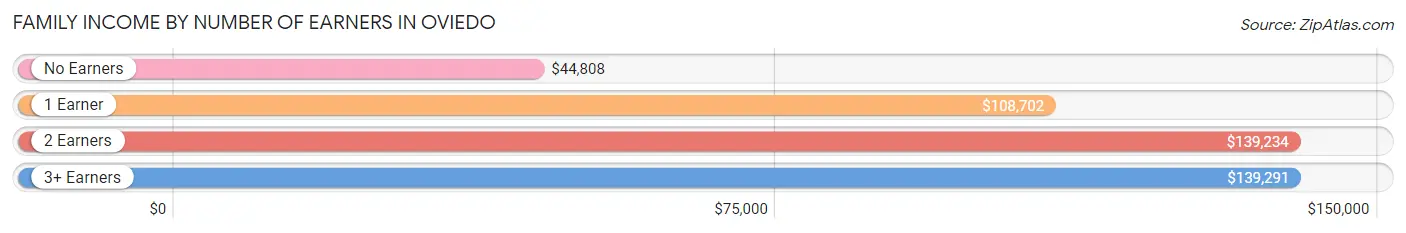
| Number of Earners | # Families | Median Income |
| No Earners | 868 (8.1%) | $44,808 |
| 1 Earner | 3,067 (28.4%) | $108,702 |
| 2 Earners | 5,328 (49.4%) | $139,234 |
| 3+ Earners | 1,523 (14.1%) | $139,291 |
| Total | 10,786 (100.0%) | $120,478 |
Household Income in Oviedo
Household Income Brackets in Oviedo
With 2,908 households falling in the category, the $100,000 to $149,999 income range is the most frequent in Oviedo, accounting for 22.5% of all households. In contrast, only 155 households (1.2%) fall into the $10,000 to $14,999 income bracket, making it the least populous group.
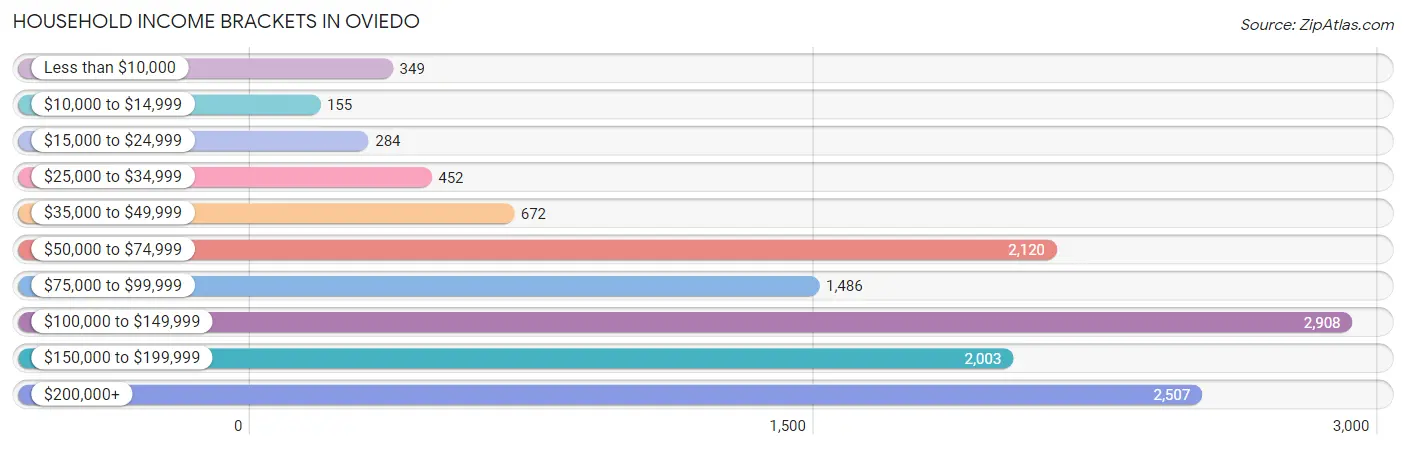
| Income Bracket | # Households | % Households |
| Less than $10,000 | 349 | 2.7% |
| $10,000 to $14,999 | 155 | 1.2% |
| $15,000 to $24,999 | 284 | 2.2% |
| $25,000 to $34,999 | 452 | 3.5% |
| $35,000 to $49,999 | 672 | 5.2% |
| $50,000 to $74,999 | 2,120 | 16.4% |
| $75,000 to $99,999 | 1,486 | 11.5% |
| $100,000 to $149,999 | 2,908 | 22.5% |
| $150,000 to $199,999 | 2,003 | 15.5% |
| $200,000+ | 2,507 | 19.4% |
Household Income by Householder Age in Oviedo
The median household income in Oviedo is $116,764, with the highest median household income of $131,649 found in the 45 to 64 years age bracket for the primary householder. A total of 6,082 households (47.1%) fall into this category. Meanwhile, the 15 to 24 years age bracket for the primary householder has the lowest median household income of $35,724, with 327 households (2.5%) in this group.
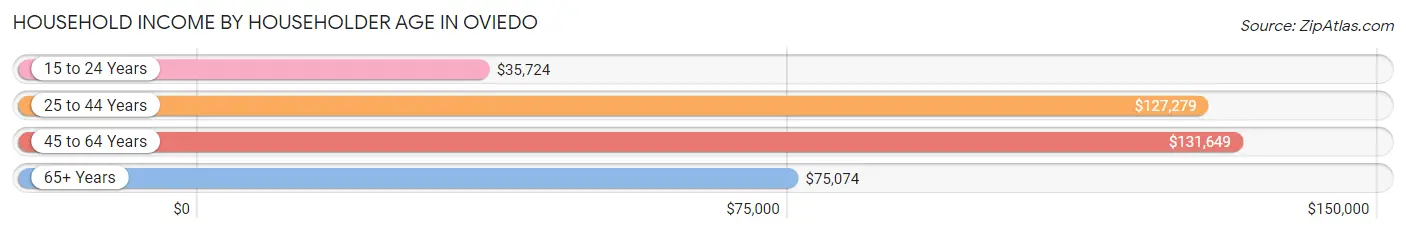
| Income Bracket | # Households | Median Income |
| 15 to 24 Years | 327 (2.5%) | $35,724 |
| 25 to 44 Years | 4,584 (35.5%) | $127,279 |
| 45 to 64 Years | 6,082 (47.1%) | $131,649 |
| 65+ Years | 1,932 (14.9%) | $75,074 |
| Total | 12,925 (100.0%) | $116,764 |
Poverty in Oviedo
Income Below Poverty by Sex and Age in Oviedo
With 4.4% poverty level for males and 6.2% for females among the residents of Oviedo, 15 year old males and 15 year old females are the most vulnerable to poverty, with 79 males (26.7%) and 35 females (12.8%) in their respective age groups living below the poverty level.
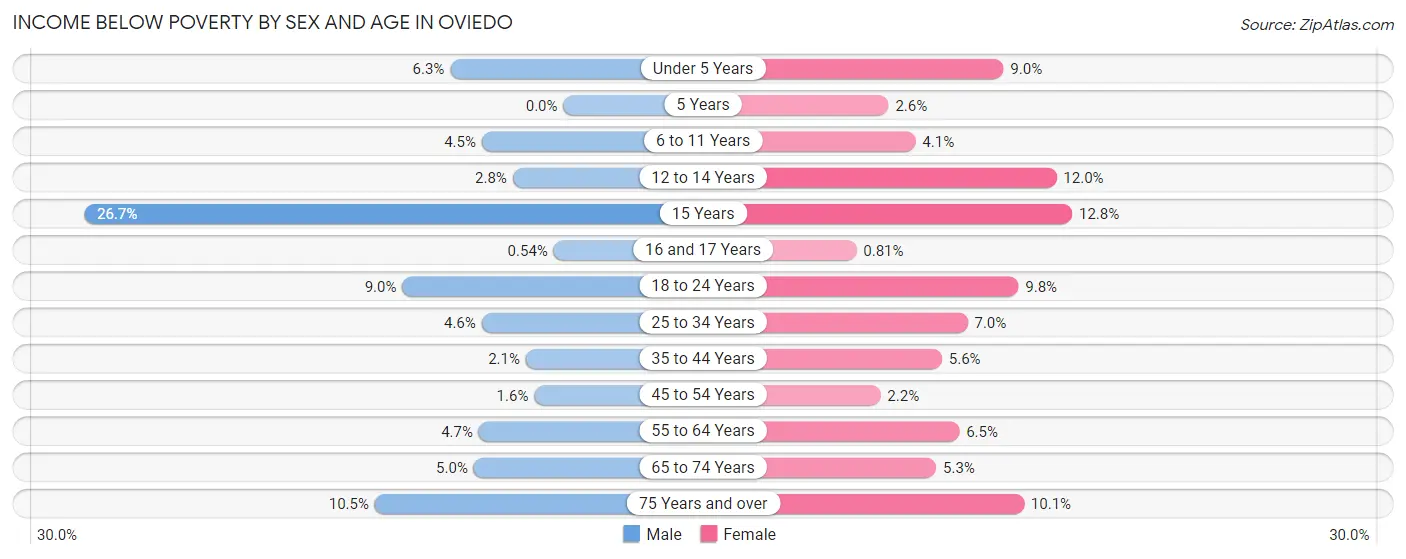
| Age Bracket | Male | Female |
| Under 5 Years | 68 (6.3%) | 100 (9.0%) |
| 5 Years | 0 (0.0%) | 5 (2.6%) |
| 6 to 11 Years | 73 (4.5%) | 74 (4.1%) |
| 12 to 14 Years | 28 (2.8%) | 115 (11.9%) |
| 15 Years | 79 (26.7%) | 35 (12.8%) |
| 16 and 17 Years | 5 (0.5%) | 5 (0.8%) |
| 18 to 24 Years | 131 (9.0%) | 172 (9.8%) |
| 25 to 34 Years | 124 (4.5%) | 185 (7.0%) |
| 35 to 44 Years | 57 (2.1%) | 163 (5.6%) |
| 45 to 54 Years | 44 (1.6%) | 66 (2.1%) |
| 55 to 64 Years | 134 (4.7%) | 164 (6.5%) |
| 65 to 74 Years | 56 (5.0%) | 71 (5.2%) |
| 75 Years and over | 50 (10.5%) | 90 (10.1%) |
| Total | 849 (4.4%) | 1,245 (6.2%) |
Income Above Poverty by Sex and Age in Oviedo
According to the poverty statistics in Oviedo, males aged 5 years and females aged 16 and 17 years are the age groups that are most secure financially, with 100.0% of males and 99.2% of females in these age groups living above the poverty line.
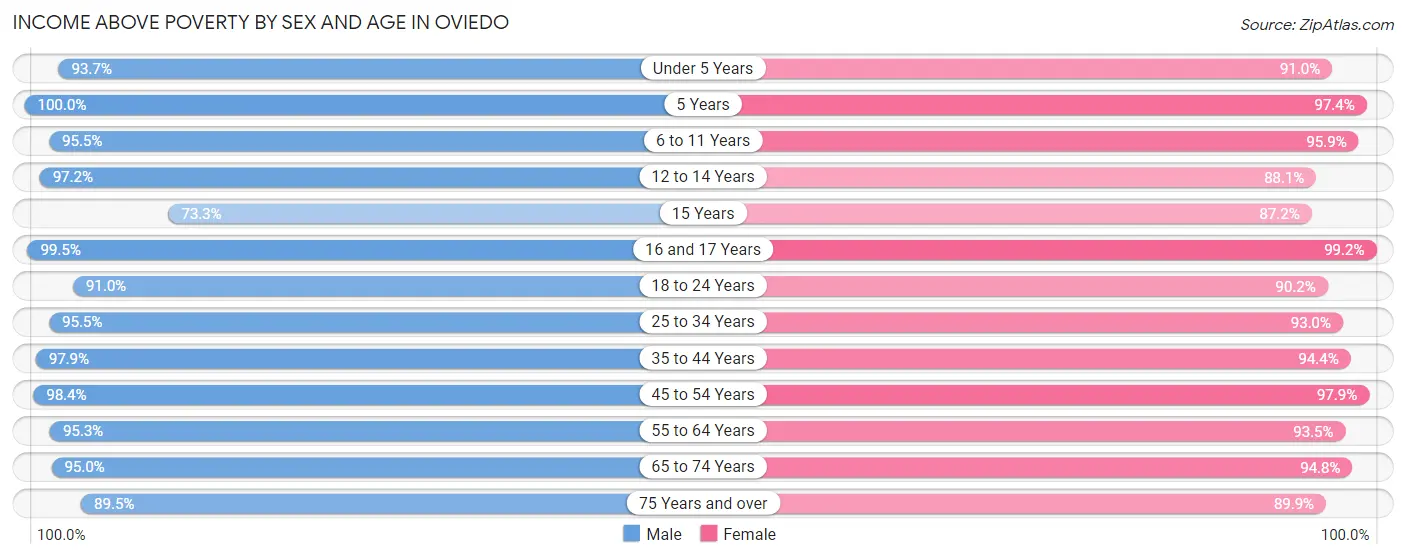
| Age Bracket | Male | Female |
| Under 5 Years | 1,012 (93.7%) | 1,011 (91.0%) |
| 5 Years | 259 (100.0%) | 187 (97.4%) |
| 6 to 11 Years | 1,535 (95.5%) | 1,730 (95.9%) |
| 12 to 14 Years | 965 (97.2%) | 847 (88.0%) |
| 15 Years | 217 (73.3%) | 238 (87.2%) |
| 16 and 17 Years | 917 (99.5%) | 616 (99.2%) |
| 18 to 24 Years | 1,330 (91.0%) | 1,577 (90.2%) |
| 25 to 34 Years | 2,604 (95.5%) | 2,458 (93.0%) |
| 35 to 44 Years | 2,665 (97.9%) | 2,761 (94.4%) |
| 45 to 54 Years | 2,675 (98.4%) | 3,010 (97.9%) |
| 55 to 64 Years | 2,711 (95.3%) | 2,345 (93.5%) |
| 65 to 74 Years | 1,067 (95.0%) | 1,282 (94.8%) |
| 75 Years and over | 426 (89.5%) | 798 (89.9%) |
| Total | 18,383 (95.6%) | 18,860 (93.8%) |
Income Below Poverty Among Married-Couple Families in Oviedo
The poverty statistics for married-couple families in Oviedo show that 2.3% or 197 of the total 8,645 families live below the poverty line. Families with 1 or 2 children have the highest poverty rate of 2.5%, comprising of 96 families. On the other hand, families with 5 or more children have the lowest poverty rate of 0.0%, which includes 0 families.
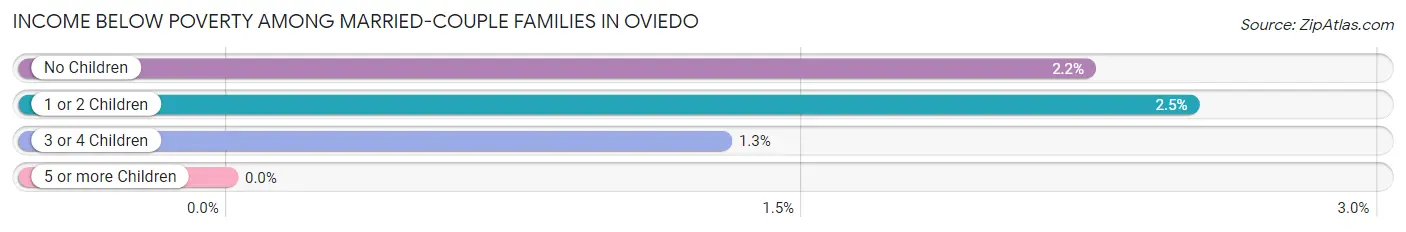
| Children | Above Poverty | Below Poverty |
| No Children | 4,024 (97.8%) | 92 (2.2%) |
| 1 or 2 Children | 3,732 (97.5%) | 96 (2.5%) |
| 3 or 4 Children | 687 (98.7%) | 9 (1.3%) |
| 5 or more Children | 5 (100.0%) | 0 (0.0%) |
| Total | 8,448 (97.7%) | 197 (2.3%) |
Income Below Poverty Among Single-Parent Households in Oviedo
According to the poverty data in Oviedo, 2.1% or 12 single-father households and 11.8% or 186 single-mother households are living below the poverty line. Among single-father households, those with no children have the highest poverty rate, with 12 households (5.8%) experiencing poverty. Likewise, among single-mother households, those with 3 or 4 children have the highest poverty rate, with 31 households (44.3%) falling below the poverty line.
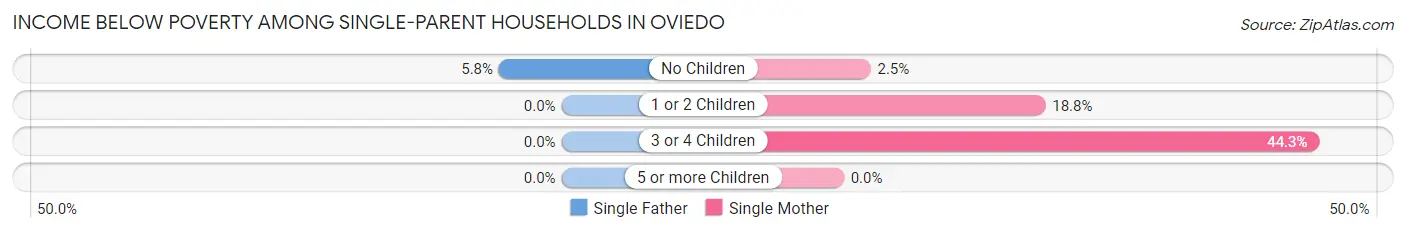
| Children | Single Father | Single Mother |
| No Children | 12 (5.8%) | 19 (2.5%) |
| 1 or 2 Children | 0 (0.0%) | 136 (18.8%) |
| 3 or 4 Children | 0 (0.0%) | 31 (44.3%) |
| 5 or more Children | 0 (0.0%) | 0 (0.0%) |
| Total | 12 (2.1%) | 186 (11.8%) |
Income Below Poverty Among Married-Couple vs Single-Parent Households in Oviedo
The poverty data for Oviedo shows that 197 of the married-couple family households (2.3%) and 198 of the single-parent households (9.2%) are living below the poverty level. Within the married-couple family households, those with 1 or 2 children have the highest poverty rate, with 96 households (2.5%) falling below the poverty line. Among the single-parent households, those with 3 or 4 children have the highest poverty rate, with 31 household (29.2%) living below poverty.
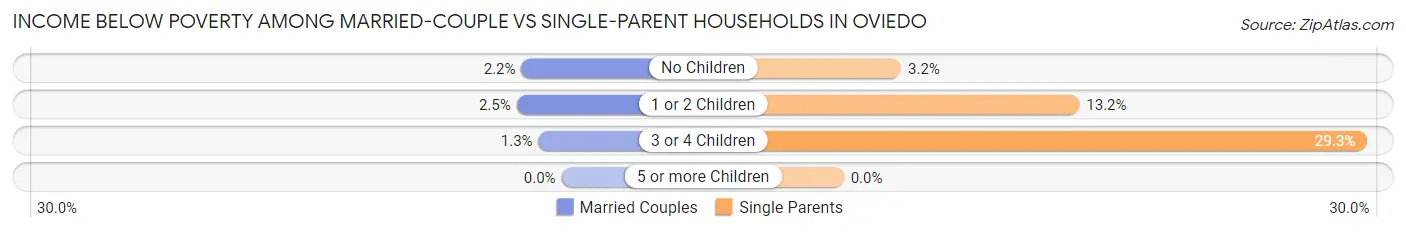
| Children | Married-Couple Families | Single-Parent Households |
| No Children | 92 (2.2%) | 31 (3.2%) |
| 1 or 2 Children | 96 (2.5%) | 136 (13.2%) |
| 3 or 4 Children | 9 (1.3%) | 31 (29.2%) |
| 5 or more Children | 0 (0.0%) | 0 (0.0%) |
| Total | 197 (2.3%) | 198 (9.2%) |
Race in Oviedo
The most populous races in Oviedo are White / Caucasian (27,748 | 70.2%), Hispanic or Latino (8,820 | 22.3%), and Two or more Races (4,691 | 11.9%).
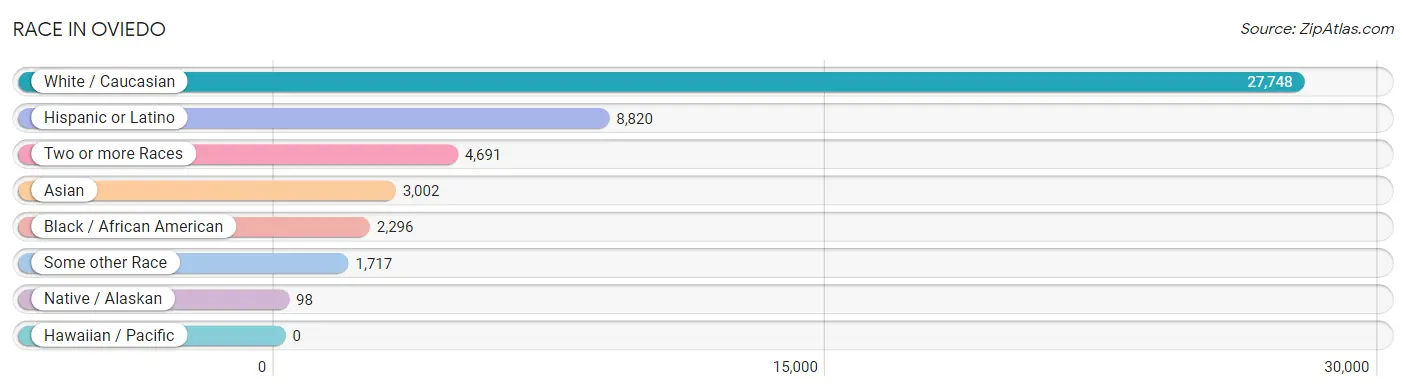
| Race | # Population | % Population |
| Asian | 3,002 | 7.6% |
| Black / African American | 2,296 | 5.8% |
| Hawaiian / Pacific | 0 | 0.0% |
| Hispanic or Latino | 8,820 | 22.3% |
| Native / Alaskan | 98 | 0.3% |
| White / Caucasian | 27,748 | 70.2% |
| Two or more Races | 4,691 | 11.9% |
| Some other Race | 1,717 | 4.3% |
| Total | 39,552 | 100.0% |
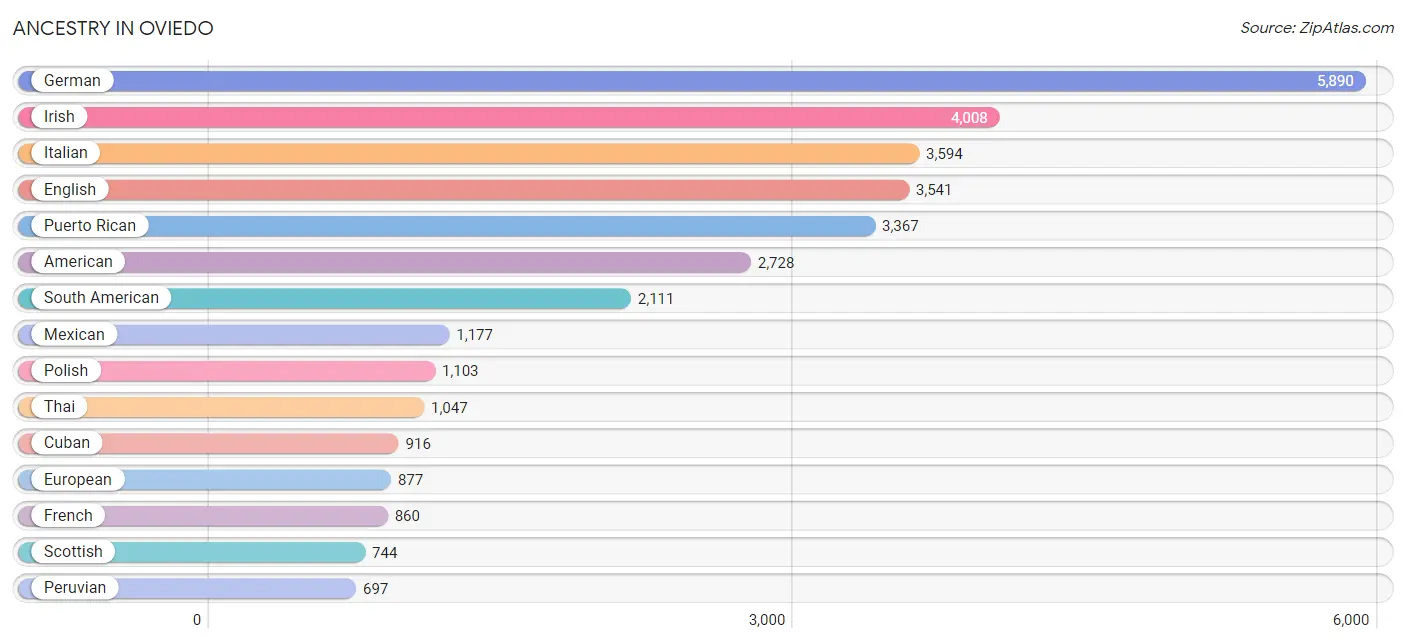
Ancestry in Oviedo
The most populous ancestries reported in Oviedo are German (5,890 | 14.9%), Irish (4,008 | 10.1%), Italian (3,594 | 9.1%), English (3,541 | 8.9%), and Puerto Rican (3,367 | 8.5%), together accounting for 51.6% of all Oviedo residents.
| Ancestry | # Population | % Population |
| African | 109 | 0.3% |
| Albanian | 36 | 0.1% |
| American | 2,728 | 6.9% |
| Arab | 686 | 1.7% |
| Argentinean | 156 | 0.4% |
| Armenian | 9 | 0.0% |
| Austrian | 60 | 0.2% |
| Bahamian | 12 | 0.0% |
| Belgian | 27 | 0.1% |
| Belizean | 51 | 0.1% |
| Bhutanese | 156 | 0.4% |
| Bolivian | 157 | 0.4% |
| Brazilian | 121 | 0.3% |
| British | 456 | 1.1% |
| British West Indian | 47 | 0.1% |
| Bulgarian | 14 | 0.0% |
| Burmese | 210 | 0.5% |
| Canadian | 95 | 0.2% |
| Celtic | 21 | 0.1% |
| Central American | 606 | 1.5% |
| Central American Indian | 96 | 0.2% |
| Cherokee | 21 | 0.1% |
| Chilean | 65 | 0.2% |
| Chippewa | 14 | 0.0% |
| Choctaw | 11 | 0.0% |
| Colombian | 231 | 0.6% |
| Costa Rican | 25 | 0.1% |
| Croatian | 55 | 0.1% |
| Cuban | 916 | 2.3% |
| Czech | 71 | 0.2% |
| Czechoslovakian | 57 | 0.1% |
| Danish | 183 | 0.5% |
| Dominican | 332 | 0.8% |
| Dutch | 312 | 0.8% |
| Eastern European | 135 | 0.3% |
| Ecuadorian | 434 | 1.1% |
| Egyptian | 228 | 0.6% |
| English | 3,541 | 8.9% |
| Ethiopian | 7 | 0.0% |
| European | 877 | 2.2% |
| Filipino | 407 | 1.0% |
| Finnish | 82 | 0.2% |
| French | 860 | 2.2% |
| French Canadian | 256 | 0.6% |
| German | 5,890 | 14.9% |
| Greek | 204 | 0.5% |
| Guatemalan | 5 | 0.0% |
| Guyanese | 56 | 0.1% |
| Haitian | 65 | 0.2% |
| Honduran | 78 | 0.2% |
| Hungarian | 174 | 0.4% |
| Indian (Asian) | 557 | 1.4% |
| Iranian | 93 | 0.2% |
| Irish | 4,008 | 10.1% |
| Italian | 3,594 | 9.1% |
| Jamaican | 371 | 0.9% |
| Jordanian | 25 | 0.1% |
| Korean | 607 | 1.5% |
| Laotian | 8 | 0.0% |
| Lebanese | 198 | 0.5% |
| Lithuanian | 117 | 0.3% |
| Mexican | 1,177 | 3.0% |
| Mexican American Indian | 8 | 0.0% |
| Native Hawaiian | 4 | 0.0% |
| Nicaraguan | 73 | 0.2% |
| Northern European | 93 | 0.2% |
| Norwegian | 417 | 1.1% |
| Pakistani | 69 | 0.2% |
| Panamanian | 101 | 0.3% |
| Pennsylvania German | 7 | 0.0% |
| Peruvian | 697 | 1.8% |
| Polish | 1,103 | 2.8% |
| Portuguese | 212 | 0.5% |
| Puerto Rican | 3,367 | 8.5% |
| Romanian | 139 | 0.4% |
| Russian | 213 | 0.5% |
| Salvadoran | 239 | 0.6% |
| Scandinavian | 21 | 0.1% |
| Scotch-Irish | 370 | 0.9% |
| Scottish | 744 | 1.9% |
| Slavic | 18 | 0.1% |
| Slovak | 91 | 0.2% |
| South African | 57 | 0.1% |
| South American | 2,111 | 5.3% |
| South American Indian | 153 | 0.4% |
| Spaniard | 92 | 0.2% |
| Spanish | 63 | 0.2% |
| Sri Lankan | 207 | 0.5% |
| Subsaharan African | 173 | 0.4% |
| Swedish | 200 | 0.5% |
| Swiss | 260 | 0.7% |
| Syrian | 24 | 0.1% |
| Thai | 1,047 | 2.6% |
| Trinidadian and Tobagonian | 92 | 0.2% |
| Turkish | 47 | 0.1% |
| Ukrainian | 95 | 0.2% |
| Uruguayan | 74 | 0.2% |
| Venezuelan | 297 | 0.7% |
| Welsh | 102 | 0.3% |
| West Indian | 118 | 0.3% |
| Yugoslavian | 70 | 0.2% | View All 101 Rows |
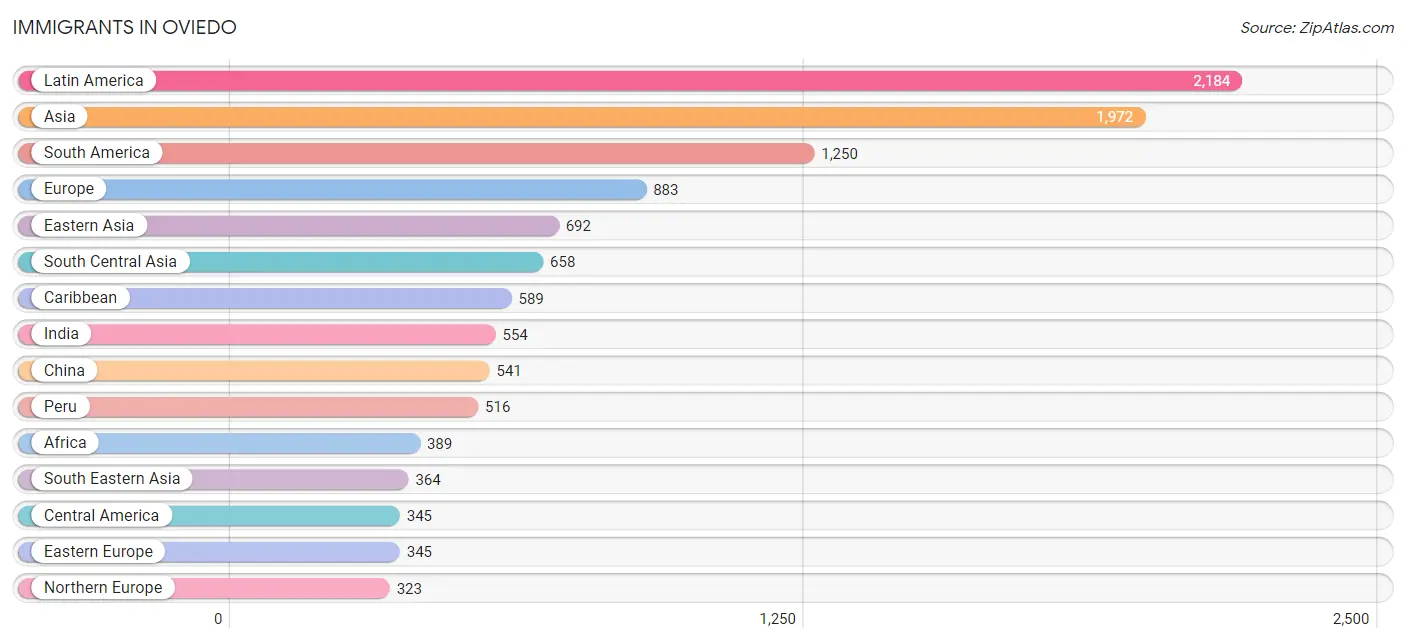
Immigrants in Oviedo
The most numerous immigrant groups reported in Oviedo came from Latin America (2,184 | 5.5%), Asia (1,972 | 5.0%), South America (1,250 | 3.2%), Europe (883 | 2.2%), and Eastern Asia (692 | 1.8%), together accounting for 17.6% of all Oviedo residents.
| Immigration Origin | # Population | % Population |
| Africa | 389 | 1.0% |
| Albania | 39 | 0.1% |
| Argentina | 55 | 0.1% |
| Asia | 1,972 | 5.0% |
| Bahamas | 70 | 0.2% |
| Bangladesh | 21 | 0.1% |
| Belgium | 27 | 0.1% |
| Belize | 18 | 0.1% |
| Bosnia and Herzegovina | 4 | 0.0% |
| Brazil | 52 | 0.1% |
| Canada | 131 | 0.3% |
| Caribbean | 589 | 1.5% |
| Central America | 345 | 0.9% |
| Chile | 19 | 0.1% |
| China | 541 | 1.4% |
| Colombia | 177 | 0.4% |
| Costa Rica | 16 | 0.0% |
| Cuba | 166 | 0.4% |
| Czechoslovakia | 61 | 0.2% |
| Dominican Republic | 44 | 0.1% |
| Eastern Africa | 79 | 0.2% |
| Eastern Asia | 692 | 1.8% |
| Eastern Europe | 345 | 0.9% |
| Ecuador | 189 | 0.5% |
| Egypt | 164 | 0.4% |
| El Salvador | 77 | 0.2% |
| England | 46 | 0.1% |
| Ethiopia | 7 | 0.0% |
| Europe | 883 | 2.2% |
| France | 10 | 0.0% |
| Germany | 104 | 0.3% |
| Ghana | 29 | 0.1% |
| Greece | 25 | 0.1% |
| Guatemala | 5 | 0.0% |
| Guyana | 40 | 0.1% |
| Haiti | 20 | 0.1% |
| Honduras | 9 | 0.0% |
| India | 554 | 1.4% |
| Indonesia | 8 | 0.0% |
| Iran | 63 | 0.2% |
| Ireland | 4 | 0.0% |
| Jamaica | 196 | 0.5% |
| Japan | 14 | 0.0% |
| Jordan | 46 | 0.1% |
| Korea | 137 | 0.4% |
| Kuwait | 98 | 0.3% |
| Latin America | 2,184 | 5.5% |
| Lebanon | 65 | 0.2% |
| Lithuania | 13 | 0.0% |
| Mexico | 177 | 0.4% |
| Moldova | 24 | 0.1% |
| Nicaragua | 27 | 0.1% |
| Northern Africa | 187 | 0.5% |
| Northern Europe | 323 | 0.8% |
| Oceania | 150 | 0.4% |
| Panama | 16 | 0.0% |
| Peru | 516 | 1.3% |
| Philippines | 206 | 0.5% |
| Poland | 142 | 0.4% |
| Romania | 46 | 0.1% |
| Russia | 16 | 0.0% |
| Saudi Arabia | 15 | 0.0% |
| Scotland | 14 | 0.0% |
| South Africa | 81 | 0.2% |
| South America | 1,250 | 3.2% |
| South Central Asia | 658 | 1.7% |
| South Eastern Asia | 364 | 0.9% |
| Southern Europe | 58 | 0.2% |
| Spain | 33 | 0.1% |
| St. Vincent and the Grenadines | 10 | 0.0% |
| Switzerland | 16 | 0.0% |
| Taiwan | 261 | 0.7% |
| Thailand | 7 | 0.0% |
| Trinidad and Tobago | 42 | 0.1% |
| Turkey | 25 | 0.1% |
| Uruguay | 30 | 0.1% |
| Venezuela | 172 | 0.4% |
| Vietnam | 143 | 0.4% |
| West Indies | 23 | 0.1% |
| Western Africa | 29 | 0.1% |
| Western Asia | 249 | 0.6% |
| Western Europe | 157 | 0.4% |
| Zimbabwe | 13 | 0.0% | View All 83 Rows |
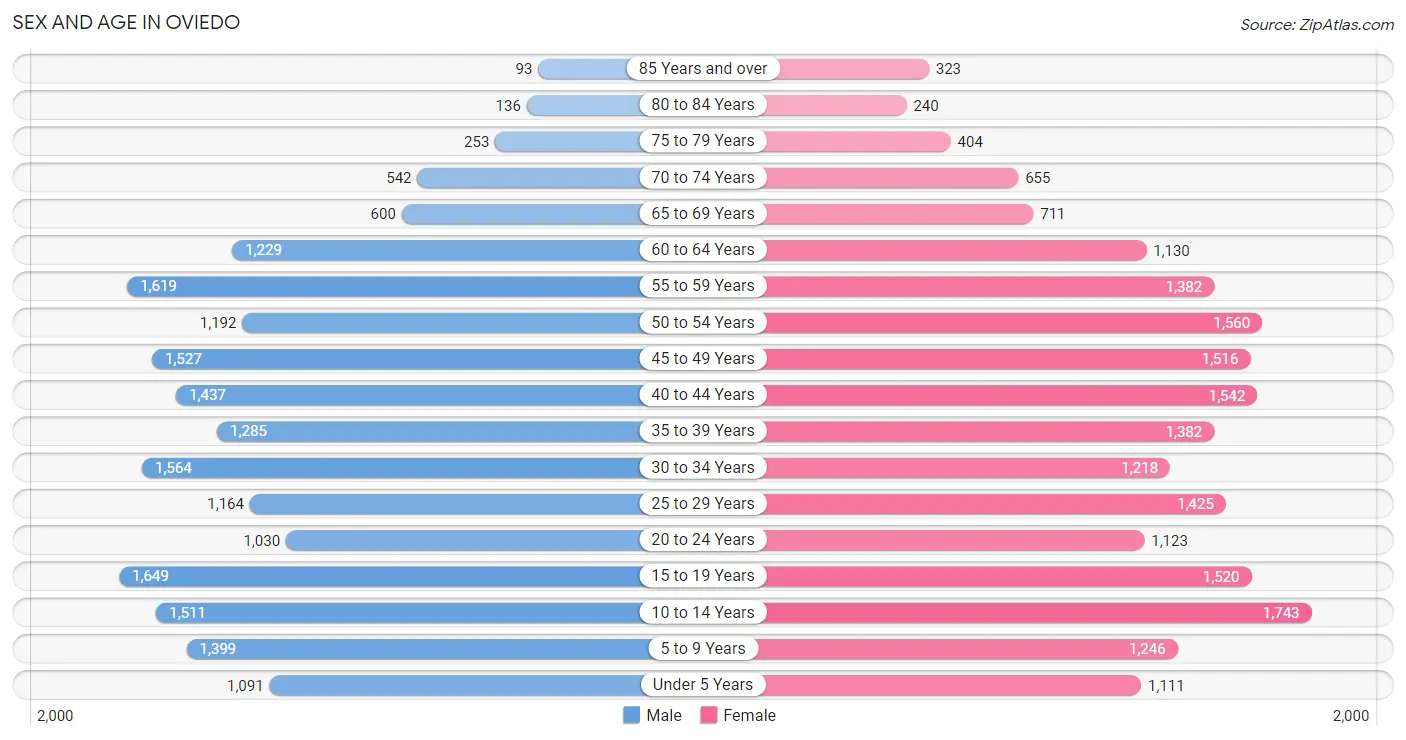
Sex and Age in Oviedo
Sex and Age in Oviedo
The most populous age groups in Oviedo are 15 to 19 Years (1,649 | 8.5%) for men and 10 to 14 Years (1,743 | 8.6%) for women.
| Age Bracket | Male | Female |
| Under 5 Years | 1,091 (5.7%) | 1,111 (5.5%) |
| 5 to 9 Years | 1,399 (7.2%) | 1,246 (6.2%) |
| 10 to 14 Years | 1,511 (7.8%) | 1,743 (8.6%) |
| 15 to 19 Years | 1,649 (8.5%) | 1,520 (7.5%) |
| 20 to 24 Years | 1,030 (5.3%) | 1,123 (5.6%) |
| 25 to 29 Years | 1,164 (6.0%) | 1,425 (7.0%) |
| 30 to 34 Years | 1,564 (8.1%) | 1,218 (6.0%) |
| 35 to 39 Years | 1,285 (6.7%) | 1,382 (6.8%) |
| 40 to 44 Years | 1,437 (7.4%) | 1,542 (7.6%) |
| 45 to 49 Years | 1,527 (7.9%) | 1,516 (7.5%) |
| 50 to 54 Years | 1,192 (6.2%) | 1,560 (7.7%) |
| 55 to 59 Years | 1,619 (8.4%) | 1,382 (6.8%) |
| 60 to 64 Years | 1,229 (6.4%) | 1,130 (5.6%) |
| 65 to 69 Years | 600 (3.1%) | 711 (3.5%) |
| 70 to 74 Years | 542 (2.8%) | 655 (3.2%) |
| 75 to 79 Years | 253 (1.3%) | 404 (2.0%) |
| 80 to 84 Years | 136 (0.7%) | 240 (1.2%) |
| 85 Years and over | 93 (0.5%) | 323 (1.6%) |
| Total | 19,321 (100.0%) | 20,231 (100.0%) |
Families and Households in Oviedo
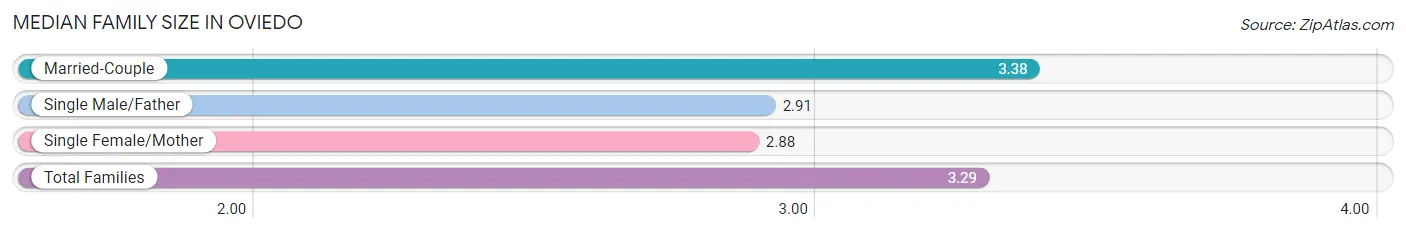
Median Family Size in Oviedo
The median family size in Oviedo is 3.29 persons per family, with married-couple families (8,645 | 80.1%) accounting for the largest median family size of 3.38 persons per family. On the other hand, single female/mother families (1,581 | 14.7%) represent the smallest median family size with 2.88 persons per family.
| Family Type | # Families | Family Size |
| Married-Couple | 8,645 (80.1%) | 3.38 |
| Single Male/Father | 560 (5.2%) | 2.91 |
| Single Female/Mother | 1,581 (14.7%) | 2.88 |
| Total Families | 10,786 (100.0%) | 3.29 |
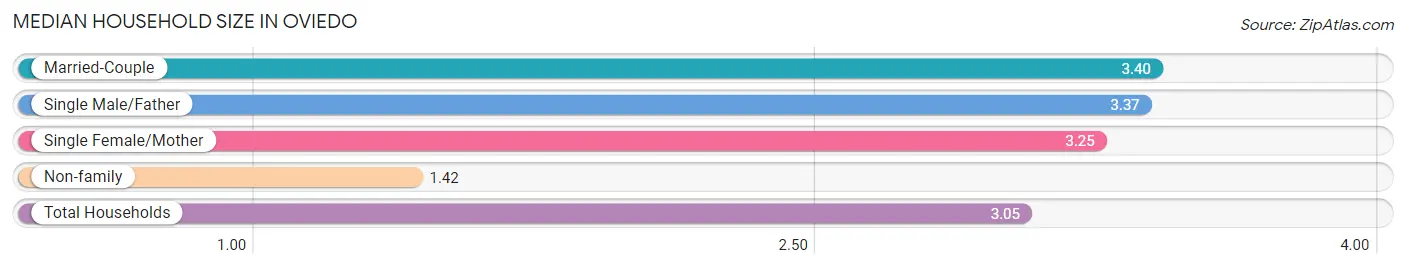
Median Household Size in Oviedo
The median household size in Oviedo is 3.05 persons per household, with married-couple households (8,645 | 66.9%) accounting for the largest median household size of 3.4 persons per household. non-family households (2,139 | 16.6%) represent the smallest median household size with 1.42 persons per household.
| Household Type | # Households | Household Size |
| Married-Couple | 8,645 (66.9%) | 3.40 |
| Single Male/Father | 560 (4.3%) | 3.37 |
| Single Female/Mother | 1,581 (12.2%) | 3.25 |
| Non-family | 2,139 (16.6%) | 1.42 |
| Total Households | 12,925 (100.0%) | 3.05 |
Household Size by Marriage Status in Oviedo
Out of a total of 12,925 households in Oviedo, 10,786 (83.5%) are family households, while 2,139 (16.6%) are nonfamily households. The most numerous type of family households are 2-person households, comprising 3,223, and the most common type of nonfamily households are 1-person households, comprising 1,506.
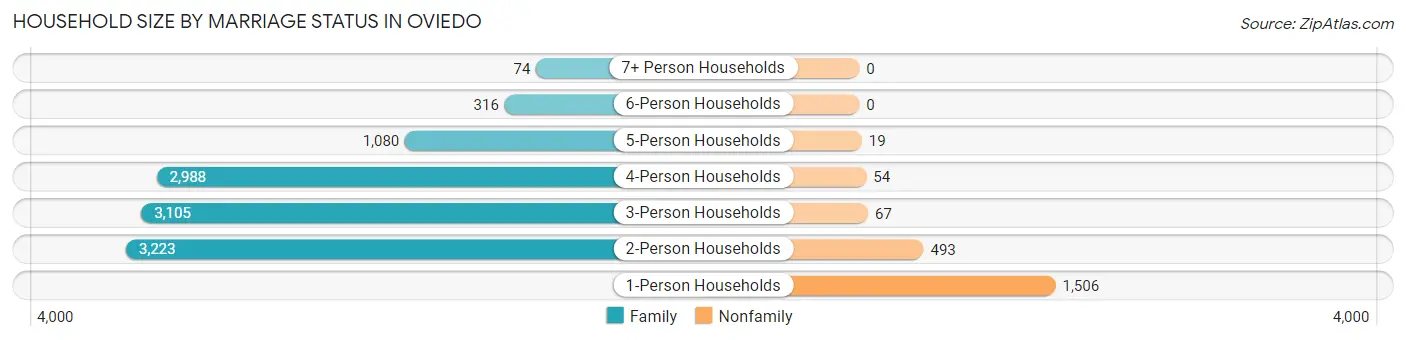
| Household Size | Family Households | Nonfamily Households |
| 1-Person Households | - | 1,506 (11.7%) |
| 2-Person Households | 3,223 (24.9%) | 493 (3.8%) |
| 3-Person Households | 3,105 (24.0%) | 67 (0.5%) |
| 4-Person Households | 2,988 (23.1%) | 54 (0.4%) |
| 5-Person Households | 1,080 (8.4%) | 19 (0.2%) |
| 6-Person Households | 316 (2.4%) | 0 (0.0%) |
| 7+ Person Households | 74 (0.6%) | 0 (0.0%) |
| Total | 10,786 (83.5%) | 2,139 (16.6%) |
Female Fertility in Oviedo
Fertility by Age in Oviedo
Average fertility rate in Oviedo is 59.0 births per 1,000 women. Women in the age bracket of 20 to 34 years have the highest fertility rate with 87.0 births per 1,000 women. Women in the age bracket of 20 to 34 years acount for 55.3% of all women with births.
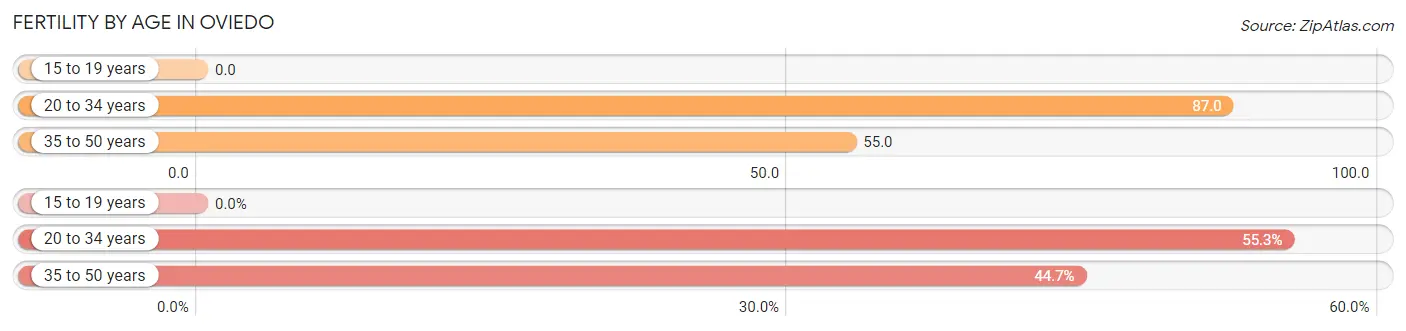
| Age Bracket | Women with Births | Births / 1,000 Women |
| 15 to 19 years | 0 (0.0%) | 0.0 |
| 20 to 34 years | 329 (55.3%) | 87.0 |
| 35 to 50 years | 266 (44.7%) | 55.0 |
| Total | 595 (100.0%) | 59.0 |
Fertility by Age by Marriage Status in Oviedo
96.5% of women with births (595) in Oviedo are married. The highest percentage of unmarried women with births falls into 20 to 34 years age bracket with 6.4% of them unmarried at the time of birth, while the lowest percentage of unmarried women with births belong to 35 to 50 years age bracket with 0.0% of them unmarried.
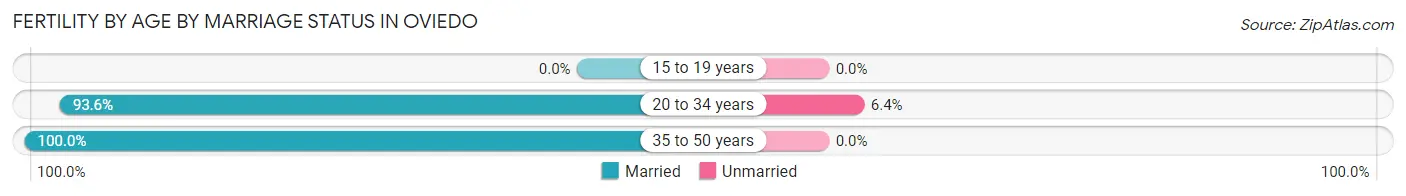
| Age Bracket | Married | Unmarried |
| 15 to 19 years | 0 (0.0%) | 0 (0.0%) |
| 20 to 34 years | 308 (93.6%) | 21 (6.4%) |
| 35 to 50 years | 266 (100.0%) | 0 (0.0%) |
| Total | 574 (96.5%) | 21 (3.5%) |
Fertility by Education in Oviedo
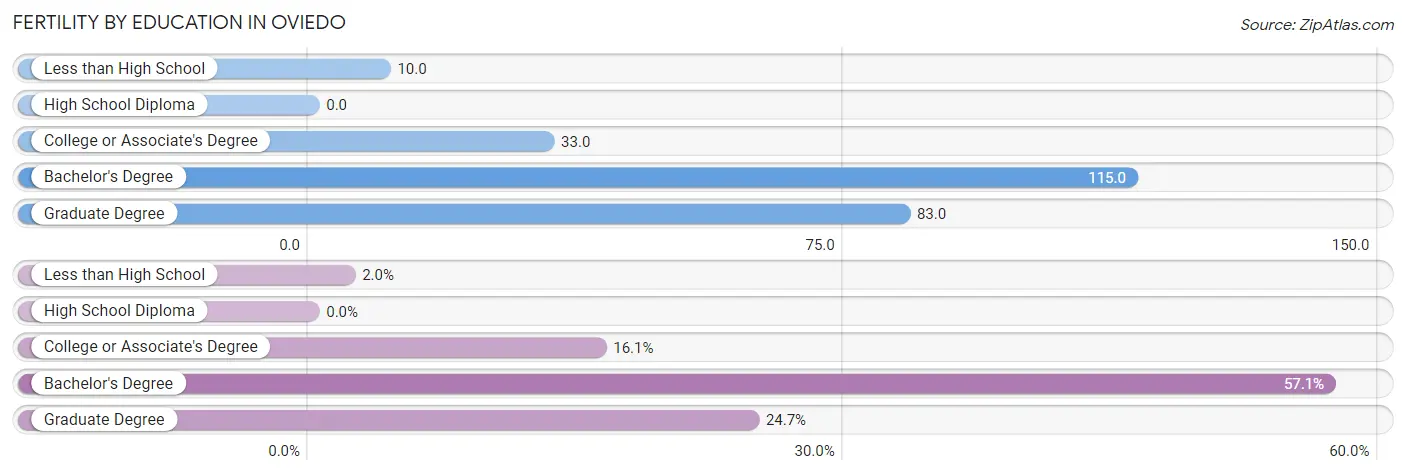
| Educational Attainment | Women with Births | Births / 1,000 Women |
| Less than High School | 12 (2.0%) | 10.0 |
| High School Diploma | 0 (0.0%) | 0.0 |
| College or Associate's Degree | 96 (16.1%) | 33.0 |
| Bachelor's Degree | 340 (57.1%) | 115.0 |
| Graduate Degree | 147 (24.7%) | 83.0 |
| Total | 595 (100.0%) | 59.0 |
Fertility by Education by Marriage Status in Oviedo
3.5% of women with births in Oviedo are unmarried. Women with the educational attainment of less than high school are most likely to be married with 100.0% of them married at childbirth, while women with the educational attainment of college or associate's degree are least likely to be married with 21.9% of them unmarried at childbirth.
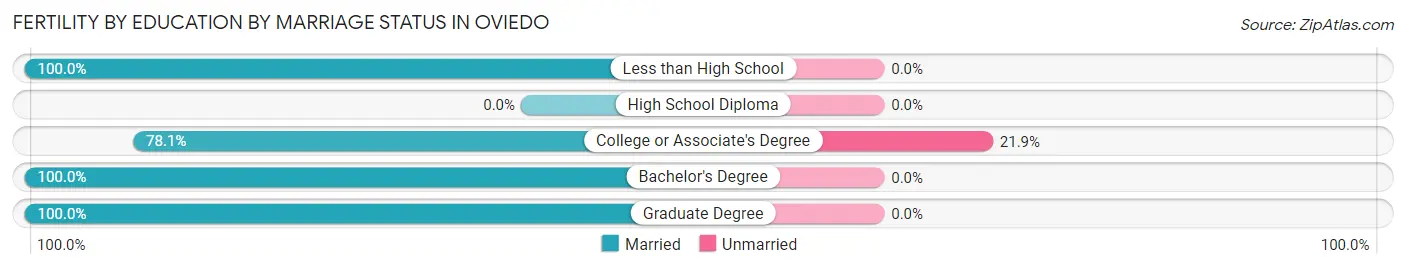
| Educational Attainment | Married | Unmarried |
| Less than High School | 12 (100.0%) | 0 (0.0%) |
| High School Diploma | 0 (0.0%) | 0 (0.0%) |
| College or Associate's Degree | 75 (78.1%) | 21 (21.9%) |
| Bachelor's Degree | 340 (100.0%) | 0 (0.0%) |
| Graduate Degree | 147 (100.0%) | 0 (0.0%) |
| Total | 574 (96.5%) | 21 (3.5%) |
Employment Characteristics in Oviedo
Employment by Class of Employer in Oviedo
Among the 20,399 employed individuals in Oviedo, private company employees (13,778 | 67.5%), local government employees (1,739 | 8.5%), and not-for-profit organizations (1,478 | 7.2%) make up the most common classes of employment.
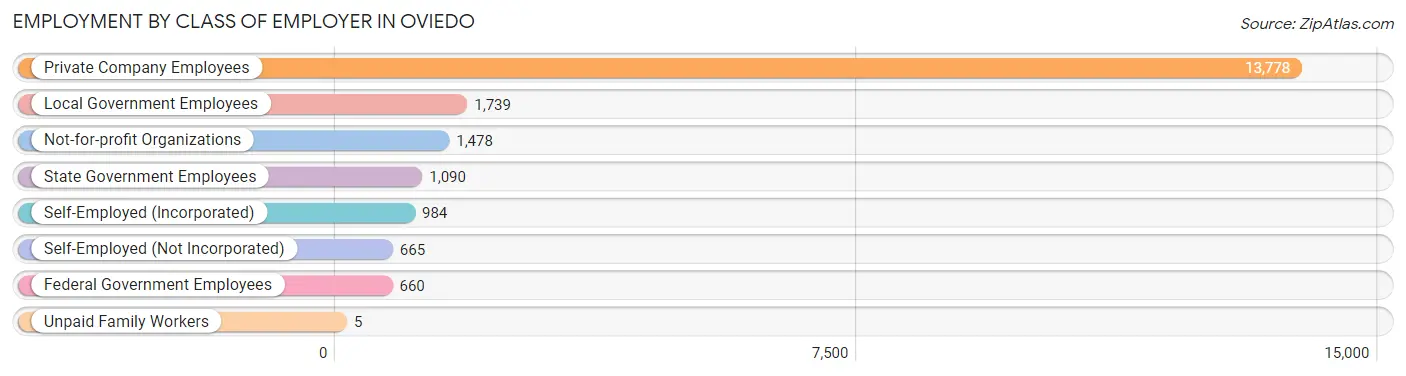
| Employer Class | # Employees | % Employees |
| Private Company Employees | 13,778 | 67.5% |
| Self-Employed (Incorporated) | 984 | 4.8% |
| Self-Employed (Not Incorporated) | 665 | 3.3% |
| Not-for-profit Organizations | 1,478 | 7.2% |
| Local Government Employees | 1,739 | 8.5% |
| State Government Employees | 1,090 | 5.3% |
| Federal Government Employees | 660 | 3.2% |
| Unpaid Family Workers | 5 | 0.0% |
| Total | 20,399 | 100.0% |
Employment Status by Age in Oviedo
According to the labor force statistics for Oviedo, out of the total population over 16 years of age (30,882), 70.1% or 21,648 individuals are in the labor force, with 4.2% or 909 of them unemployed. The age group with the highest labor force participation rate is 25 to 29 years, with 87.1% or 2,255 individuals in the labor force. Within the labor force, the 75 years and over age range has the highest percentage of unemployed individuals, with 38.0% or 30 of them being unemployed.
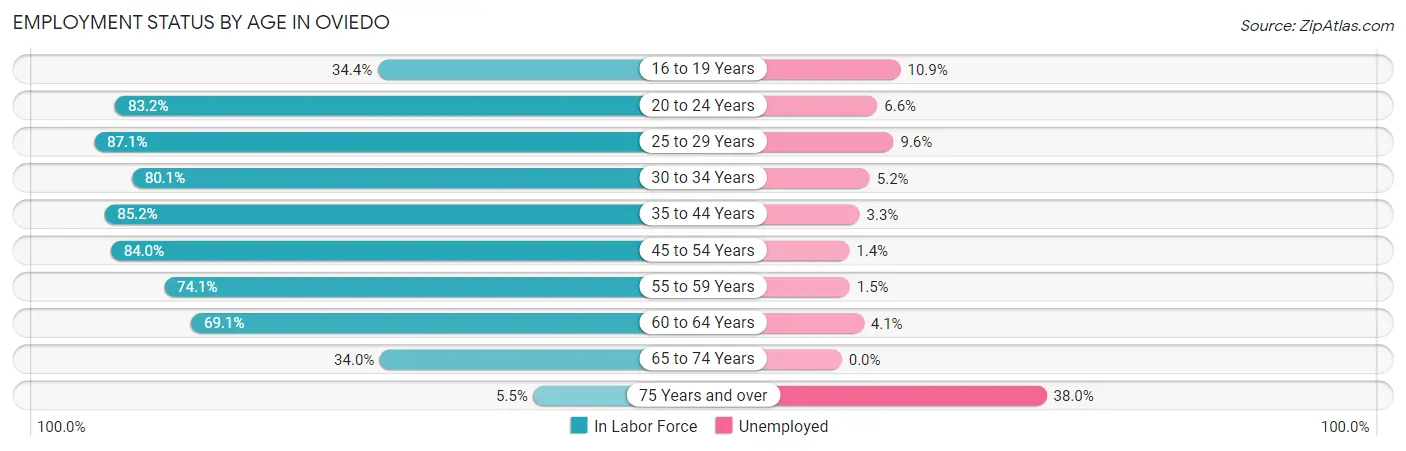
| Age Bracket | In Labor Force | Unemployed |
| 16 to 19 Years | 894 (34.4%) | 97 (10.9%) |
| 20 to 24 Years | 1,791 (83.2%) | 118 (6.6%) |
| 25 to 29 Years | 2,255 (87.1%) | 216 (9.6%) |
| 30 to 34 Years | 2,228 (80.1%) | 116 (5.2%) |
| 35 to 44 Years | 4,810 (85.2%) | 159 (3.3%) |
| 45 to 54 Years | 4,868 (84.0%) | 68 (1.4%) |
| 55 to 59 Years | 2,224 (74.1%) | 33 (1.5%) |
| 60 to 64 Years | 1,630 (69.1%) | 67 (4.1%) |
| 65 to 74 Years | 853 (34.0%) | 0 (0.0%) |
| 75 Years and over | 80 (5.5%) | 30 (38.0%) |
| Total | 21,648 (70.1%) | 909 (4.2%) |
Employment Status by Educational Attainment in Oviedo
According to labor force statistics for Oviedo, 81.3% of individuals (18,026) out of the total population between 25 and 64 years of age (22,172) are in the labor force, with 3.7% or 667 of them being unemployed. The group with the highest labor force participation rate are those with the educational attainment of college / associate degree, with 85.4% or 5,135 individuals in the labor force. Within the labor force, individuals with less than high school education have the highest percentage of unemployment, with 17.2% or 53 of them being unemployed.
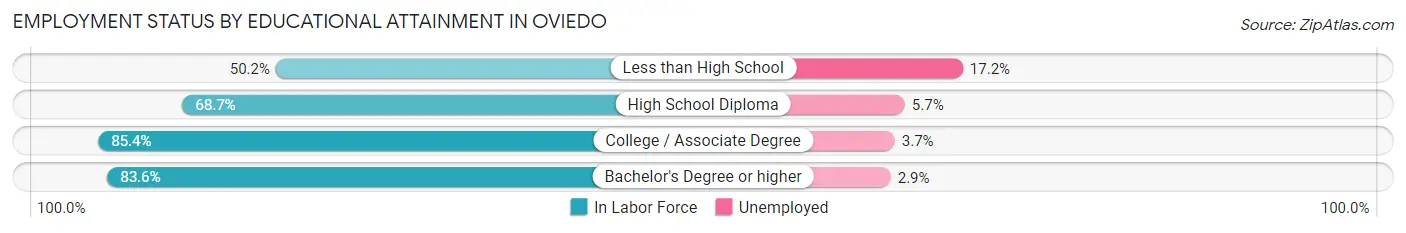
| Educational Attainment | In Labor Force | Unemployed |
| Less than High School | 309 (50.2%) | 106 (17.2%) |
| High School Diploma | 1,962 (68.7%) | 163 (5.7%) |
| College / Associate Degree | 5,135 (85.4%) | 222 (3.7%) |
| Bachelor's Degree or higher | 10,606 (83.6%) | 368 (2.9%) |
| Total | 18,026 (81.3%) | 820 (3.7%) |
Employment Occupations by Sex in Oviedo
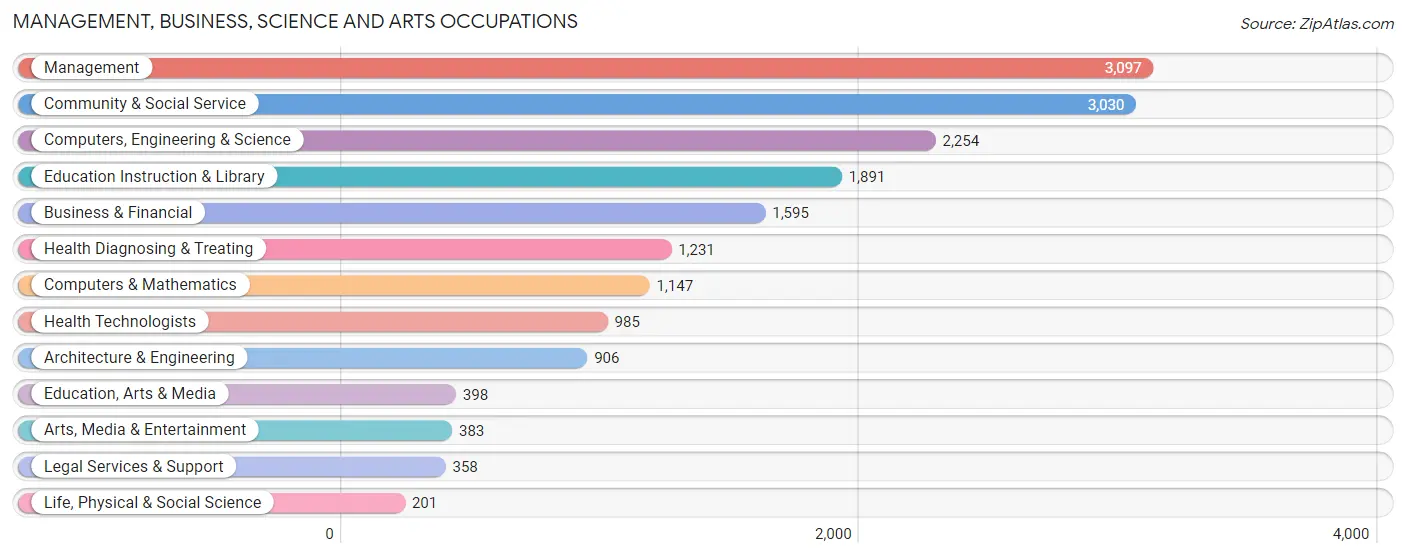
Management, Business, Science and Arts Occupations
The most common Management, Business, Science and Arts occupations in Oviedo are Management (3,097 | 15.0%), Community & Social Service (3,030 | 14.7%), Computers, Engineering & Science (2,254 | 10.9%), Education Instruction & Library (1,891 | 9.1%), and Business & Financial (1,595 | 7.7%).
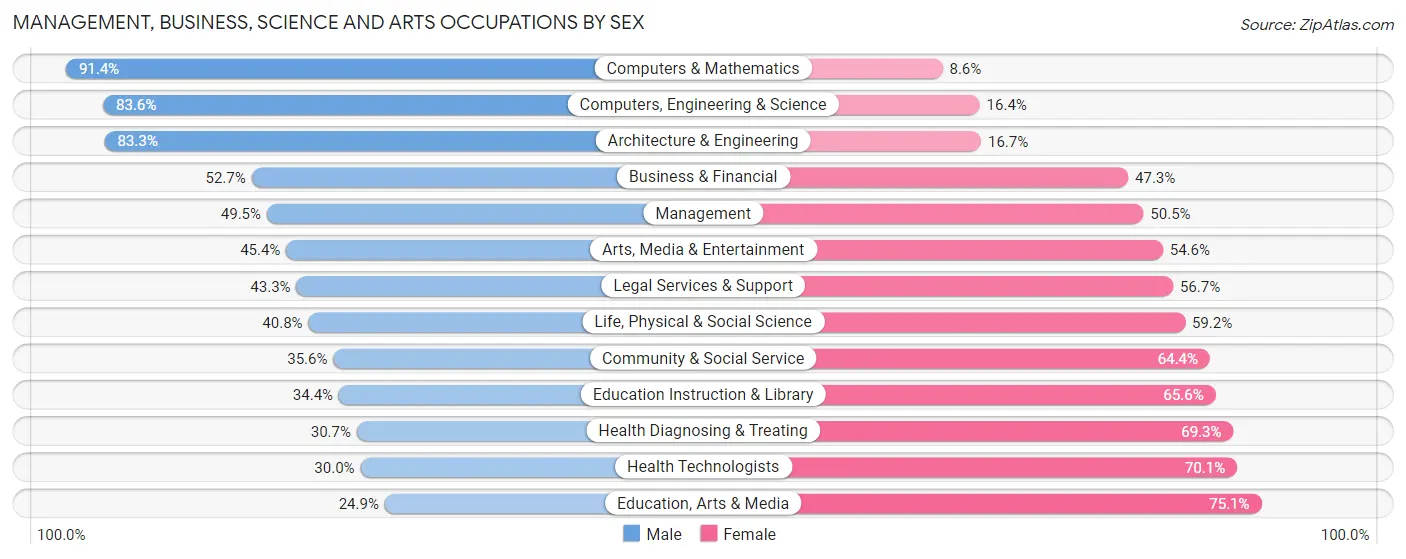
Management, Business, Science and Arts Occupations by Sex
Within the Management, Business, Science and Arts occupations in Oviedo, the most male-oriented occupations are Computers & Mathematics (91.4%), Computers, Engineering & Science (83.6%), and Architecture & Engineering (83.3%), while the most female-oriented occupations are Education, Arts & Media (75.1%), Health Technologists (70.1%), and Health Diagnosing & Treating (69.3%).
| Occupation | Male | Female |
| Management | 1,532 (49.5%) | 1,565 (50.5%) |
| Business & Financial | 840 (52.7%) | 755 (47.3%) |
| Computers, Engineering & Science | 1,885 (83.6%) | 369 (16.4%) |
| Computers & Mathematics | 1,048 (91.4%) | 99 (8.6%) |
| Architecture & Engineering | 755 (83.3%) | 151 (16.7%) |
| Life, Physical & Social Science | 82 (40.8%) | 119 (59.2%) |
| Community & Social Service | 1,079 (35.6%) | 1,951 (64.4%) |
| Education, Arts & Media | 99 (24.9%) | 299 (75.1%) |
| Legal Services & Support | 155 (43.3%) | 203 (56.7%) |
| Education Instruction & Library | 651 (34.4%) | 1,240 (65.6%) |
| Arts, Media & Entertainment | 174 (45.4%) | 209 (54.6%) |
| Health Diagnosing & Treating | 378 (30.7%) | 853 (69.3%) |
| Health Technologists | 295 (29.9%) | 690 (70.1%) |
| Total (Category) | 5,714 (51.0%) | 5,493 (49.0%) |
| Total (Overall) | 10,950 (53.0%) | 9,725 (47.0%) |
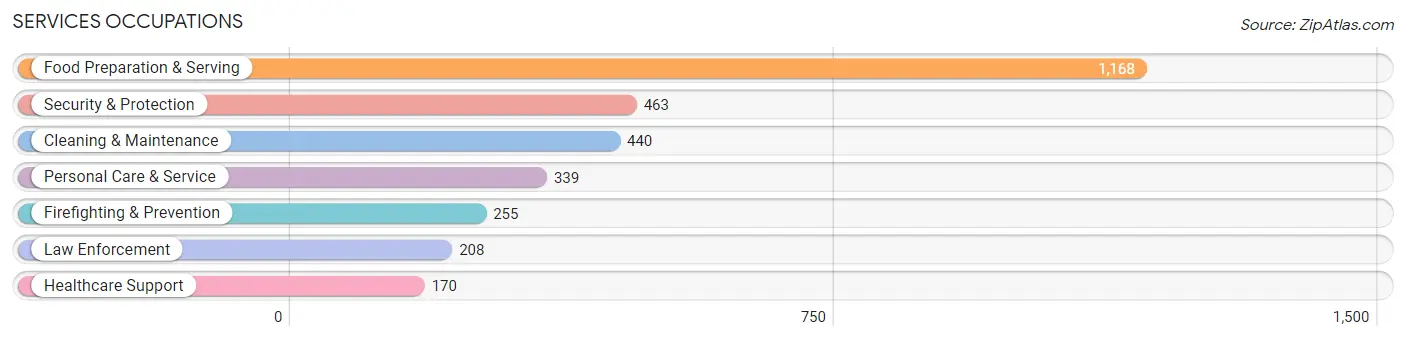
Services Occupations
The most common Services occupations in Oviedo are Food Preparation & Serving (1,168 | 5.7%), Security & Protection (463 | 2.2%), Cleaning & Maintenance (440 | 2.1%), Personal Care & Service (339 | 1.6%), and Firefighting & Prevention (255 | 1.2%).
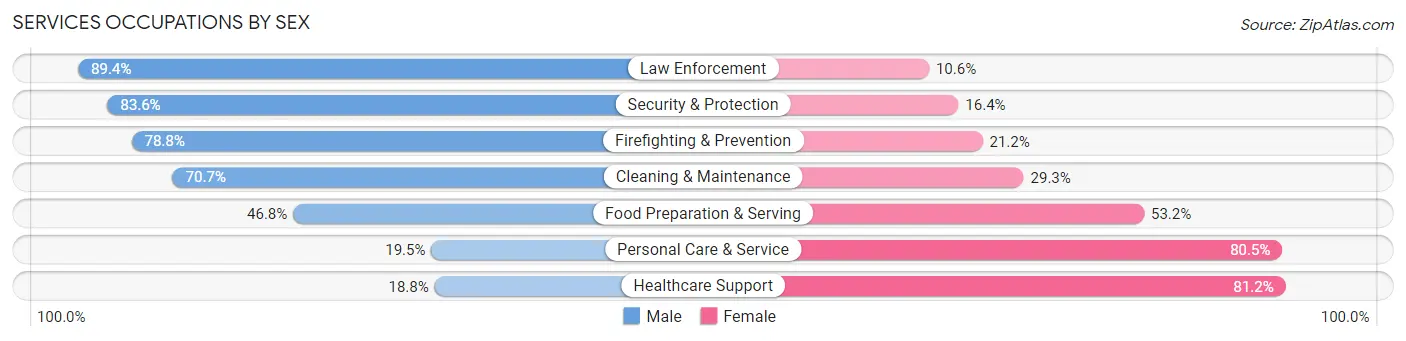
Services Occupations by Sex
Within the Services occupations in Oviedo, the most male-oriented occupations are Law Enforcement (89.4%), Security & Protection (83.6%), and Firefighting & Prevention (78.8%), while the most female-oriented occupations are Healthcare Support (81.2%), Personal Care & Service (80.5%), and Food Preparation & Serving (53.2%).
| Occupation | Male | Female |
| Healthcare Support | 32 (18.8%) | 138 (81.2%) |
| Security & Protection | 387 (83.6%) | 76 (16.4%) |
| Firefighting & Prevention | 201 (78.8%) | 54 (21.2%) |
| Law Enforcement | 186 (89.4%) | 22 (10.6%) |
| Food Preparation & Serving | 547 (46.8%) | 621 (53.2%) |
| Cleaning & Maintenance | 311 (70.7%) | 129 (29.3%) |
| Personal Care & Service | 66 (19.5%) | 273 (80.5%) |
| Total (Category) | 1,343 (52.0%) | 1,237 (47.9%) |
| Total (Overall) | 10,950 (53.0%) | 9,725 (47.0%) |
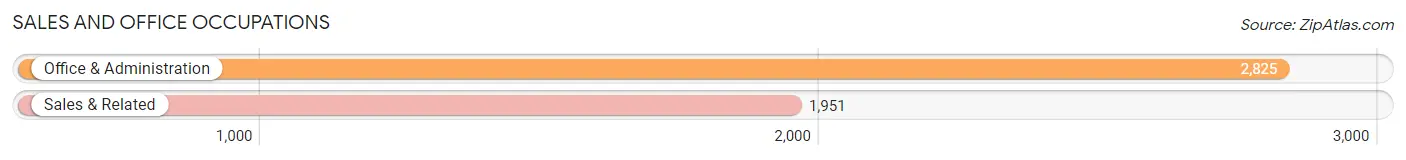
Sales and Office Occupations
The most common Sales and Office occupations in Oviedo are Office & Administration (2,825 | 13.7%), and Sales & Related (1,951 | 9.4%).
Sales and Office Occupations by Sex
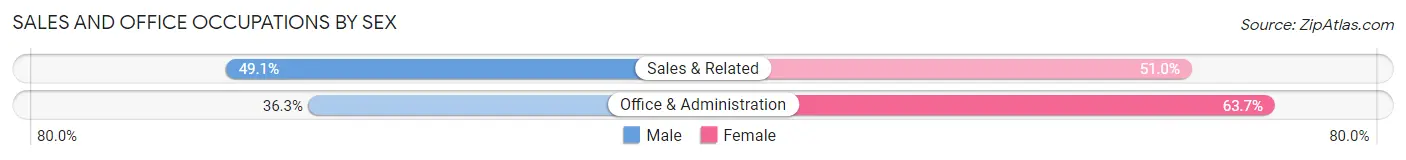
| Occupation | Male | Female |
| Sales & Related | 957 (49.0%) | 994 (50.9%) |
| Office & Administration | 1,025 (36.3%) | 1,800 (63.7%) |
| Total (Category) | 1,982 (41.5%) | 2,794 (58.5%) |
| Total (Overall) | 10,950 (53.0%) | 9,725 (47.0%) |
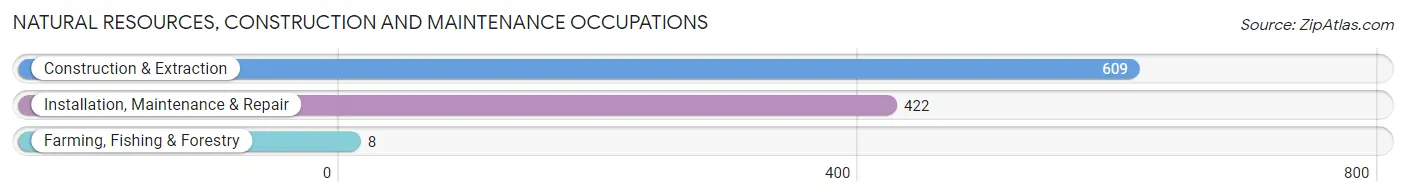
Natural Resources, Construction and Maintenance Occupations
The most common Natural Resources, Construction and Maintenance occupations in Oviedo are Construction & Extraction (609 | 2.9%), Installation, Maintenance & Repair (422 | 2.0%), and Farming, Fishing & Forestry (8 | 0.0%).
Natural Resources, Construction and Maintenance Occupations by Sex
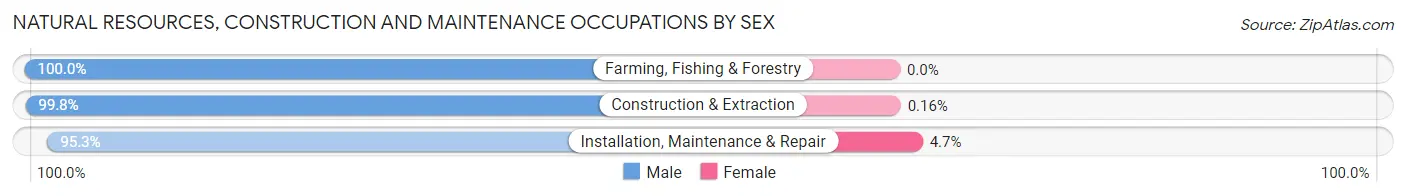
| Occupation | Male | Female |
| Farming, Fishing & Forestry | 8 (100.0%) | 0 (0.0%) |
| Construction & Extraction | 608 (99.8%) | 1 (0.2%) |
| Installation, Maintenance & Repair | 402 (95.3%) | 20 (4.7%) |
| Total (Category) | 1,018 (98.0%) | 21 (2.0%) |
| Total (Overall) | 10,950 (53.0%) | 9,725 (47.0%) |
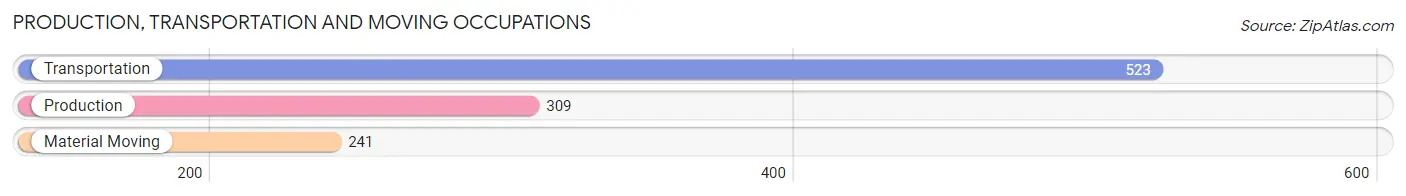
Production, Transportation and Moving Occupations
The most common Production, Transportation and Moving occupations in Oviedo are Transportation (523 | 2.5%), Production (309 | 1.5%), and Material Moving (241 | 1.2%).
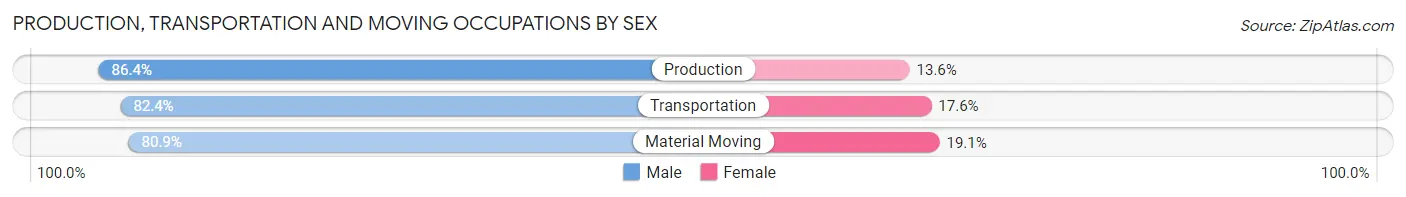
Production, Transportation and Moving Occupations by Sex
| Occupation | Male | Female |
| Production | 267 (86.4%) | 42 (13.6%) |
| Transportation | 431 (82.4%) | 92 (17.6%) |
| Material Moving | 195 (80.9%) | 46 (19.1%) |
| Total (Category) | 893 (83.2%) | 180 (16.8%) |
| Total (Overall) | 10,950 (53.0%) | 9,725 (47.0%) |
Employment Industries by Sex in Oviedo
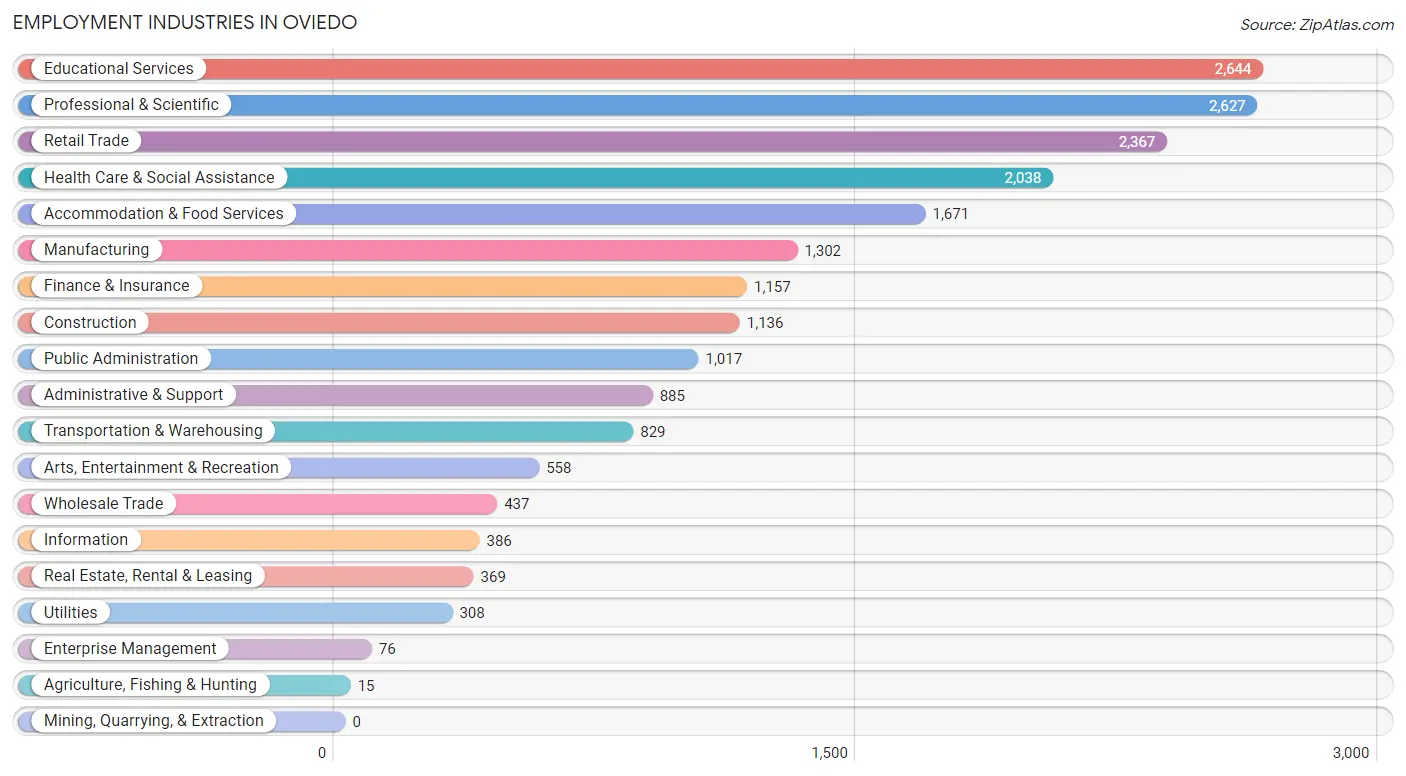
Employment Industries in Oviedo
The major employment industries in Oviedo include Educational Services (2,644 | 12.8%), Professional & Scientific (2,627 | 12.7%), Retail Trade (2,367 | 11.5%), Health Care & Social Assistance (2,038 | 9.9%), and Accommodation & Food Services (1,671 | 8.1%).
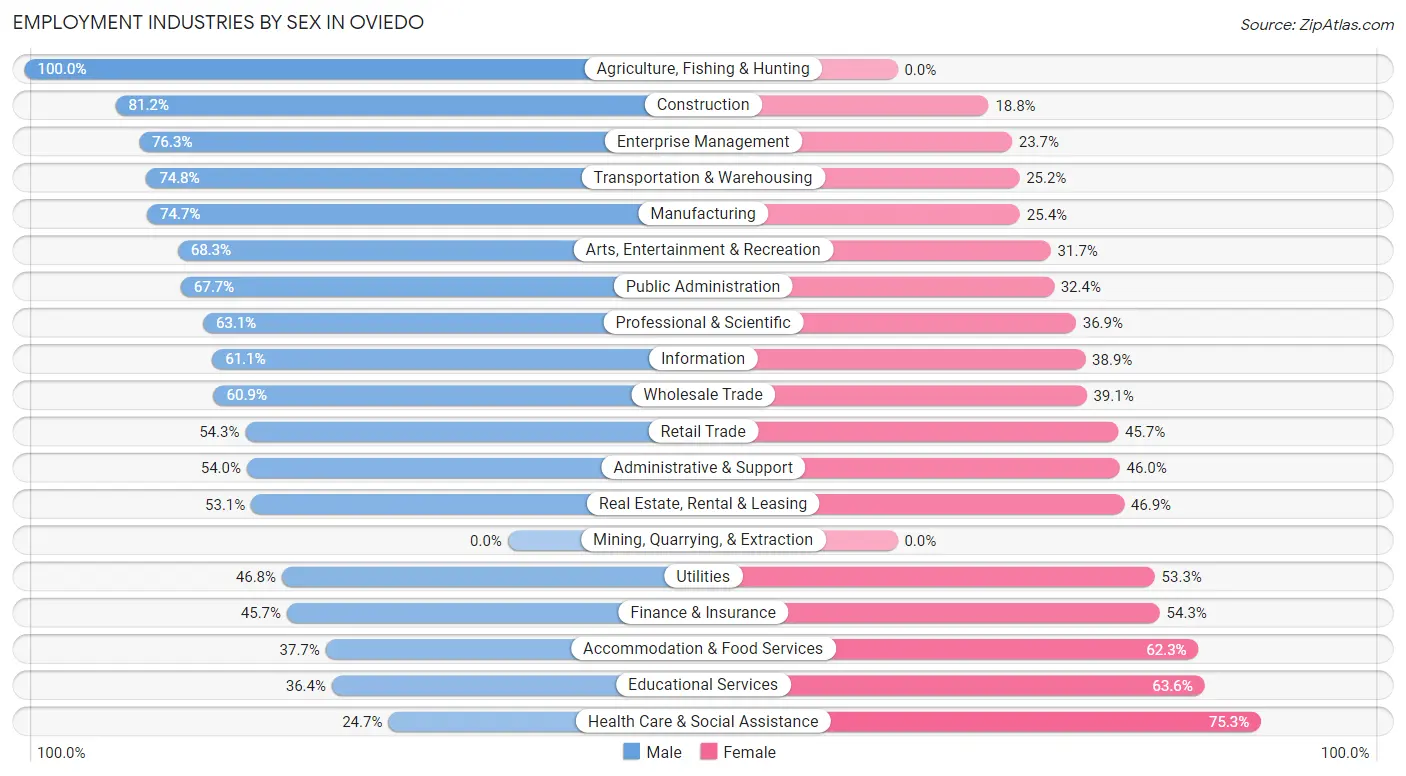
Employment Industries by Sex in Oviedo
The Oviedo industries that see more men than women are Agriculture, Fishing & Hunting (100.0%), Construction (81.2%), and Enterprise Management (76.3%), whereas the industries that tend to have a higher number of women are Health Care & Social Assistance (75.3%), Educational Services (63.6%), and Accommodation & Food Services (62.3%).
| Industry | Male | Female |
| Agriculture, Fishing & Hunting | 15 (100.0%) | 0 (0.0%) |
| Mining, Quarrying, & Extraction | 0 (0.0%) | 0 (0.0%) |
| Construction | 922 (81.2%) | 214 (18.8%) |
| Manufacturing | 972 (74.7%) | 330 (25.4%) |
| Wholesale Trade | 266 (60.9%) | 171 (39.1%) |
| Retail Trade | 1,286 (54.3%) | 1,081 (45.7%) |
| Transportation & Warehousing | 620 (74.8%) | 209 (25.2%) |
| Utilities | 144 (46.8%) | 164 (53.2%) |
| Information | 236 (61.1%) | 150 (38.9%) |
| Finance & Insurance | 529 (45.7%) | 628 (54.3%) |
| Real Estate, Rental & Leasing | 196 (53.1%) | 173 (46.9%) |
| Professional & Scientific | 1,657 (63.1%) | 970 (36.9%) |
| Enterprise Management | 58 (76.3%) | 18 (23.7%) |
| Administrative & Support | 478 (54.0%) | 407 (46.0%) |
| Educational Services | 963 (36.4%) | 1,681 (63.6%) |
| Health Care & Social Assistance | 504 (24.7%) | 1,534 (75.3%) |
| Arts, Entertainment & Recreation | 381 (68.3%) | 177 (31.7%) |
| Accommodation & Food Services | 630 (37.7%) | 1,041 (62.3%) |
| Public Administration | 688 (67.6%) | 329 (32.4%) |
| Total | 10,950 (53.0%) | 9,725 (47.0%) |
Education in Oviedo
School Enrollment in Oviedo
The most common levels of schooling among the 12,241 students in Oviedo are high school (3,049 | 24.9%), college / undergraduate (2,670 | 21.8%), and middle school (2,341 | 19.1%).
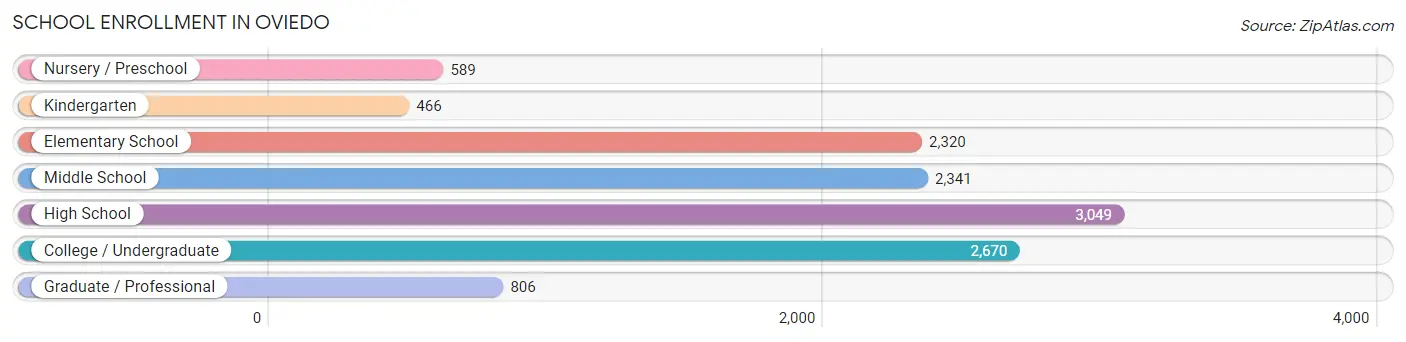
| School Level | # Students | % Students |
| Nursery / Preschool | 589 | 4.8% |
| Kindergarten | 466 | 3.8% |
| Elementary School | 2,320 | 19.0% |
| Middle School | 2,341 | 19.1% |
| High School | 3,049 | 24.9% |
| College / Undergraduate | 2,670 | 21.8% |
| Graduate / Professional | 806 | 6.6% |
| Total | 12,241 | 100.0% |
School Enrollment by Age by Funding Source in Oviedo
Out of a total of 12,241 students who are enrolled in schools in Oviedo, 1,897 (15.5%) attend a private institution, while the remaining 10,344 (84.5%) are enrolled in public schools. The age group of 3 to 4 year olds has the highest likelihood of being enrolled in private schools, with 238 (58.9% in the age bracket) enrolled. Conversely, the age group of 15 to 17 year olds has the lowest likelihood of being enrolled in a private school, with 1,957 (92.7% in the age bracket) attending a public institution.
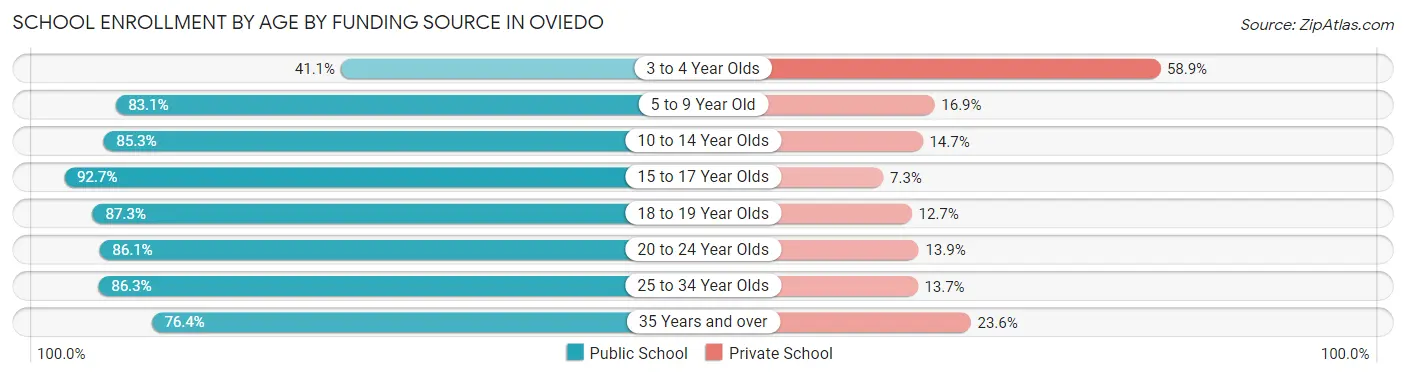
| Age Bracket | Public School | Private School |
| 3 to 4 Year Olds | 166 (41.1%) | 238 (58.9%) |
| 5 to 9 Year Old | 2,125 (83.1%) | 432 (16.9%) |
| 10 to 14 Year Olds | 2,738 (85.3%) | 471 (14.7%) |
| 15 to 17 Year Olds | 1,957 (92.7%) | 155 (7.3%) |
| 18 to 19 Year Olds | 759 (87.3%) | 110 (12.7%) |
| 20 to 24 Year Olds | 1,068 (86.1%) | 173 (13.9%) |
| 25 to 34 Year Olds | 1,011 (86.3%) | 161 (13.7%) |
| 35 Years and over | 517 (76.4%) | 160 (23.6%) |
| Total | 10,344 (84.5%) | 1,897 (15.5%) |
Educational Attainment by Field of Study in Oviedo
Business (3,427 | 22.7%), engineering (1,732 | 11.5%), science & technology (1,479 | 9.8%), education (1,479 | 9.8%), and arts & humanities (970 | 6.4%) are the most common fields of study among 15,078 individuals in Oviedo who have obtained a bachelor's degree or higher.
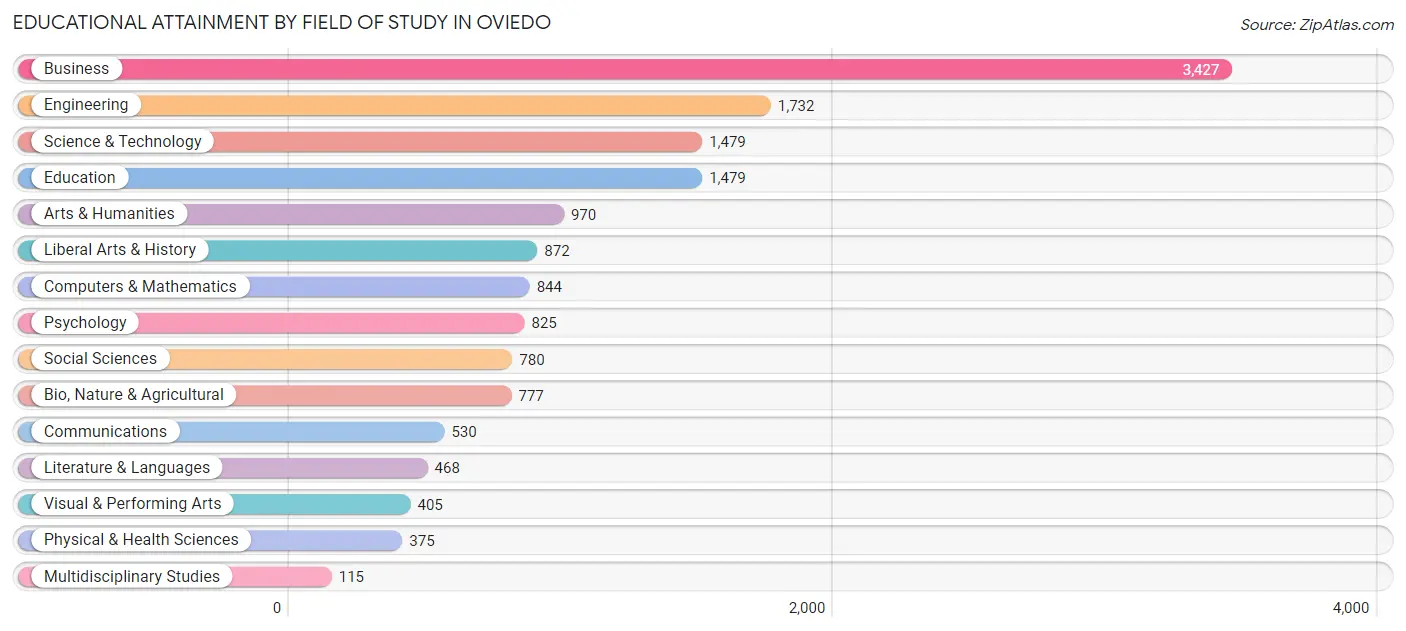
| Field of Study | # Graduates | % Graduates |
| Computers & Mathematics | 844 | 5.6% |
| Bio, Nature & Agricultural | 777 | 5.1% |
| Physical & Health Sciences | 375 | 2.5% |
| Psychology | 825 | 5.5% |
| Social Sciences | 780 | 5.2% |
| Engineering | 1,732 | 11.5% |
| Multidisciplinary Studies | 115 | 0.8% |
| Science & Technology | 1,479 | 9.8% |
| Business | 3,427 | 22.7% |
| Education | 1,479 | 9.8% |
| Literature & Languages | 468 | 3.1% |
| Liberal Arts & History | 872 | 5.8% |
| Visual & Performing Arts | 405 | 2.7% |
| Communications | 530 | 3.5% |
| Arts & Humanities | 970 | 6.4% |
| Total | 15,078 | 100.0% |
Transportation & Commute in Oviedo
Vehicle Availability by Sex in Oviedo
The most prevalent vehicle ownership categories in Oviedo are males with 2 vehicles (5,245, accounting for 48.5%) and females with 2 vehicles (4,229, making up 54.7%).
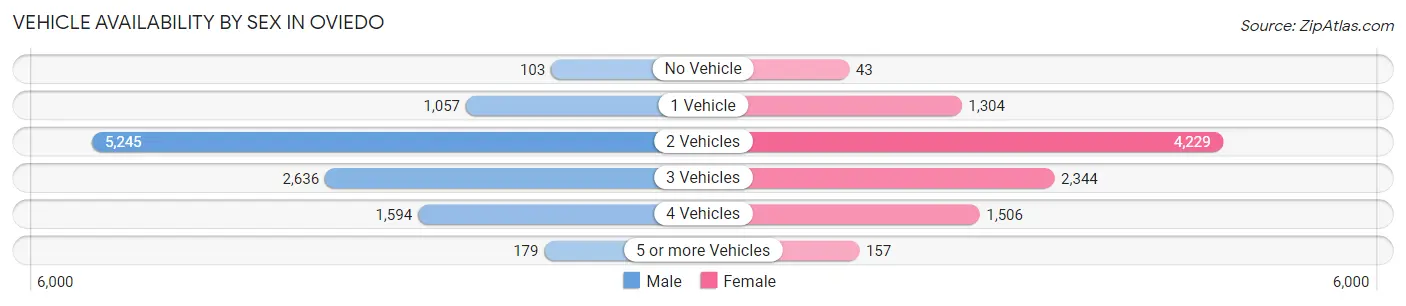
| Vehicles Available | Male | Female |
| No Vehicle | 103 (0.9%) | 43 (0.4%) |
| 1 Vehicle | 1,057 (9.8%) | 1,304 (13.6%) |
| 2 Vehicles | 5,245 (48.5%) | 4,229 (44.1%) |
| 3 Vehicles | 2,636 (24.4%) | 2,344 (24.5%) |
| 4 Vehicles | 1,594 (14.7%) | 1,506 (15.7%) |
| 5 or more Vehicles | 179 (1.7%) | 157 (1.6%) |
| Total | 10,814 (100.0%) | 9,583 (100.0%) |
Commute Time in Oviedo
The most frequently occuring commute durations in Oviedo are 30 to 34 minutes (2,920 commuters, 18.1%), 15 to 19 minutes (2,469 commuters, 15.3%), and 20 to 24 minutes (1,852 commuters, 11.5%).
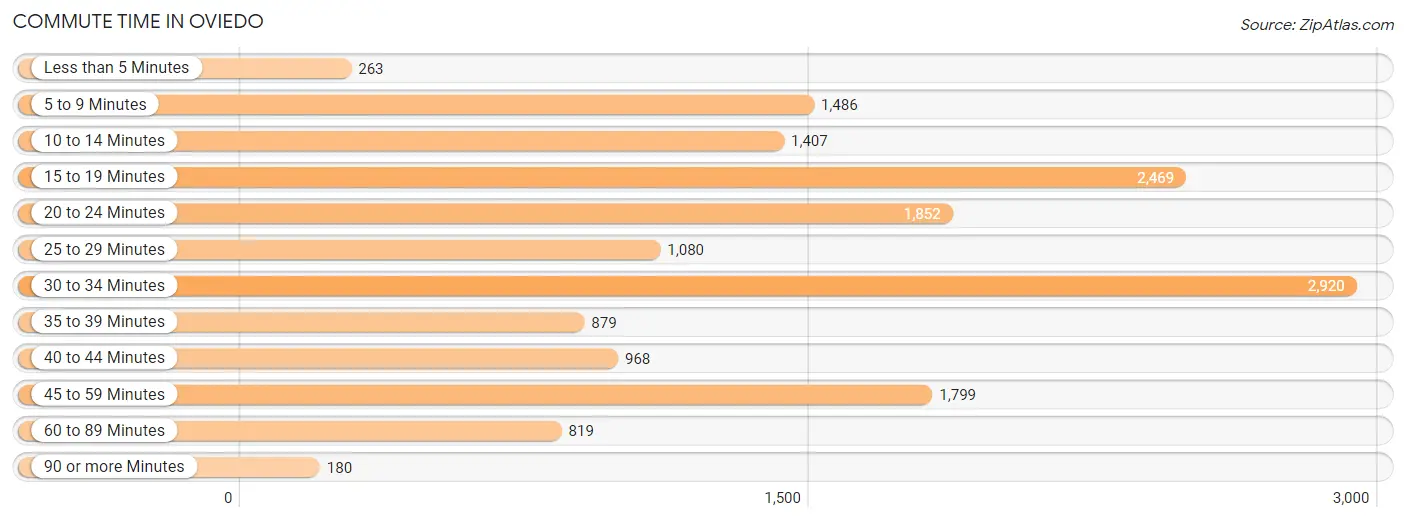
| Commute Time | # Commuters | % Commuters |
| Less than 5 Minutes | 263 | 1.6% |
| 5 to 9 Minutes | 1,486 | 9.2% |
| 10 to 14 Minutes | 1,407 | 8.7% |
| 15 to 19 Minutes | 2,469 | 15.3% |
| 20 to 24 Minutes | 1,852 | 11.5% |
| 25 to 29 Minutes | 1,080 | 6.7% |
| 30 to 34 Minutes | 2,920 | 18.1% |
| 35 to 39 Minutes | 879 | 5.4% |
| 40 to 44 Minutes | 968 | 6.0% |
| 45 to 59 Minutes | 1,799 | 11.2% |
| 60 to 89 Minutes | 819 | 5.1% |
| 90 or more Minutes | 180 | 1.1% |
Commute Time by Sex in Oviedo
The most common commute times in Oviedo are 30 to 34 minutes (1,550 commuters, 18.5%) for males and 30 to 34 minutes (1,370 commuters, 17.7%) for females.
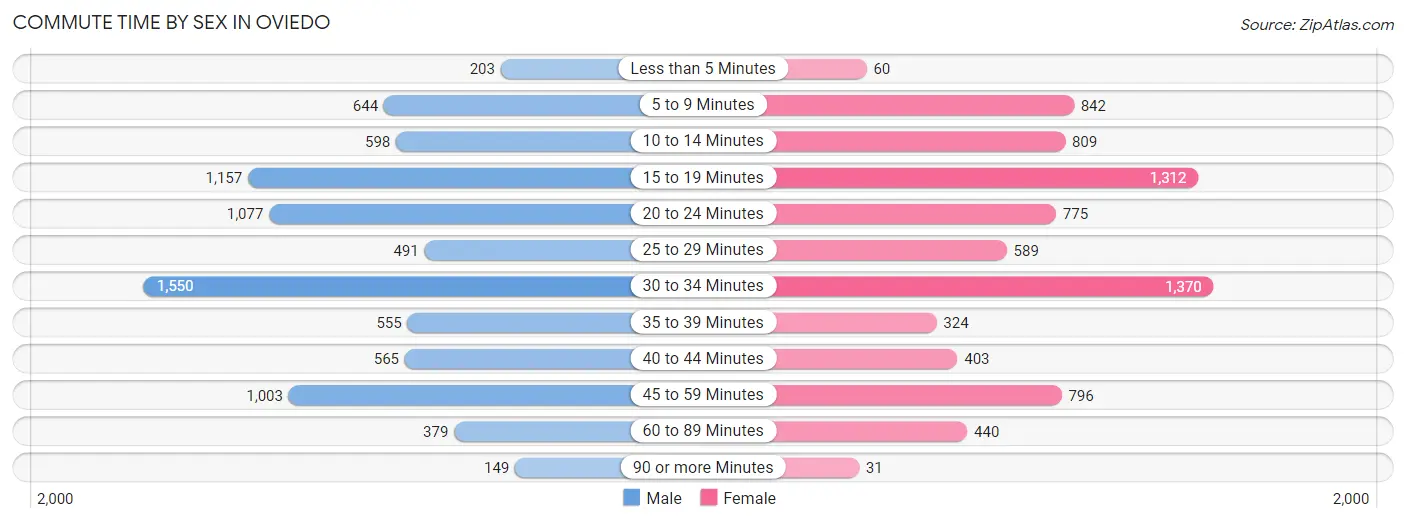
| Commute Time | Male | Female |
| Less than 5 Minutes | 203 (2.4%) | 60 (0.8%) |
| 5 to 9 Minutes | 644 (7.7%) | 842 (10.9%) |
| 10 to 14 Minutes | 598 (7.1%) | 809 (10.4%) |
| 15 to 19 Minutes | 1,157 (13.8%) | 1,312 (16.9%) |
| 20 to 24 Minutes | 1,077 (12.9%) | 775 (10.0%) |
| 25 to 29 Minutes | 491 (5.9%) | 589 (7.6%) |
| 30 to 34 Minutes | 1,550 (18.5%) | 1,370 (17.7%) |
| 35 to 39 Minutes | 555 (6.6%) | 324 (4.2%) |
| 40 to 44 Minutes | 565 (6.8%) | 403 (5.2%) |
| 45 to 59 Minutes | 1,003 (12.0%) | 796 (10.3%) |
| 60 to 89 Minutes | 379 (4.5%) | 440 (5.7%) |
| 90 or more Minutes | 149 (1.8%) | 31 (0.4%) |
Time of Departure to Work by Sex in Oviedo
The most frequent times of departure to work in Oviedo are 7:00 AM to 7:29 AM (1,470, 17.6%) for males and 6:30 AM to 6:59 AM (1,226, 15.8%) for females.
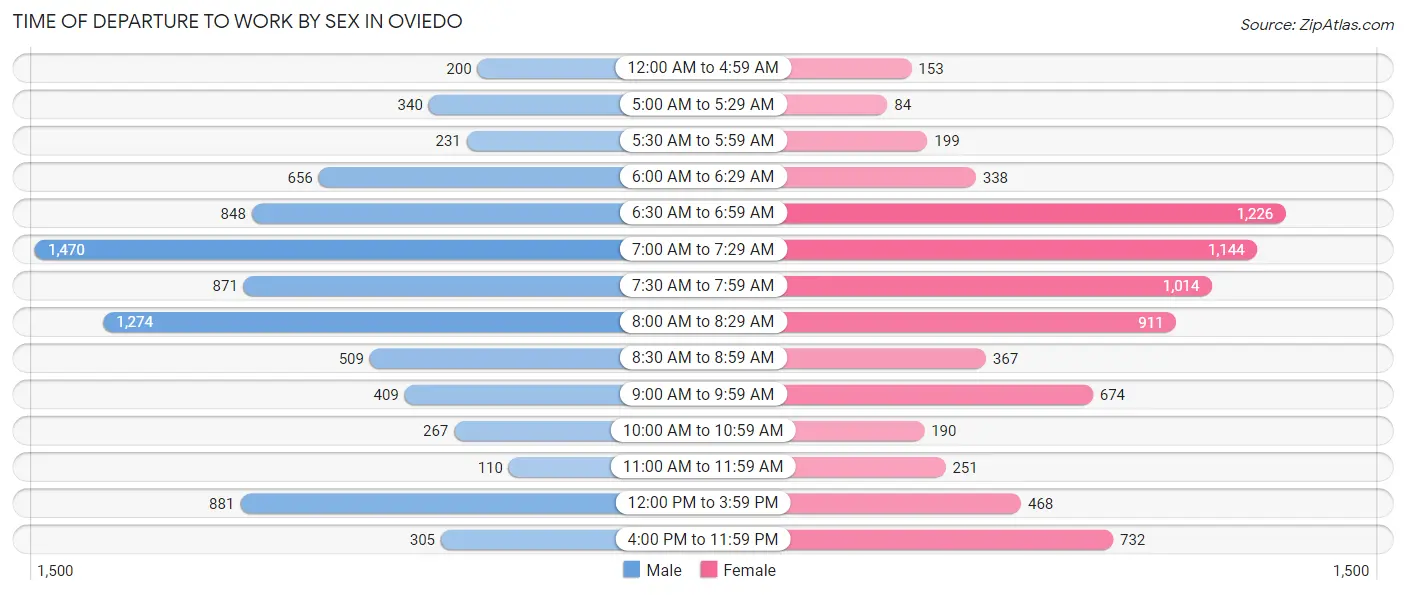
| Time of Departure | Male | Female |
| 12:00 AM to 4:59 AM | 200 (2.4%) | 153 (2.0%) |
| 5:00 AM to 5:29 AM | 340 (4.1%) | 84 (1.1%) |
| 5:30 AM to 5:59 AM | 231 (2.8%) | 199 (2.6%) |
| 6:00 AM to 6:29 AM | 656 (7.8%) | 338 (4.4%) |
| 6:30 AM to 6:59 AM | 848 (10.1%) | 1,226 (15.8%) |
| 7:00 AM to 7:29 AM | 1,470 (17.6%) | 1,144 (14.8%) |
| 7:30 AM to 7:59 AM | 871 (10.4%) | 1,014 (13.1%) |
| 8:00 AM to 8:29 AM | 1,274 (15.2%) | 911 (11.7%) |
| 8:30 AM to 8:59 AM | 509 (6.1%) | 367 (4.7%) |
| 9:00 AM to 9:59 AM | 409 (4.9%) | 674 (8.7%) |
| 10:00 AM to 10:59 AM | 267 (3.2%) | 190 (2.5%) |
| 11:00 AM to 11:59 AM | 110 (1.3%) | 251 (3.2%) |
| 12:00 PM to 3:59 PM | 881 (10.5%) | 468 (6.0%) |
| 4:00 PM to 11:59 PM | 305 (3.6%) | 732 (9.4%) |
| Total | 8,371 (100.0%) | 7,751 (100.0%) |
Housing Occupancy in Oviedo
Occupancy by Ownership in Oviedo
Of the total 12,925 dwellings in Oviedo, owner-occupied units account for 10,214 (79.0%), while renter-occupied units make up 2,711 (21.0%).
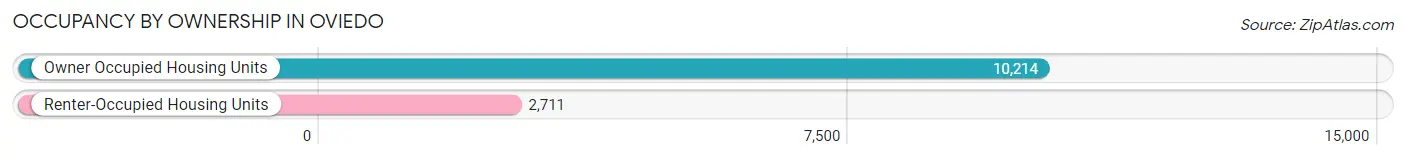
| Occupancy | # Housing Units | % Housing Units |
| Owner Occupied Housing Units | 10,214 | 79.0% |
| Renter-Occupied Housing Units | 2,711 | 21.0% |
| Total Occupied Housing Units | 12,925 | 100.0% |
Occupancy by Household Size in Oviedo
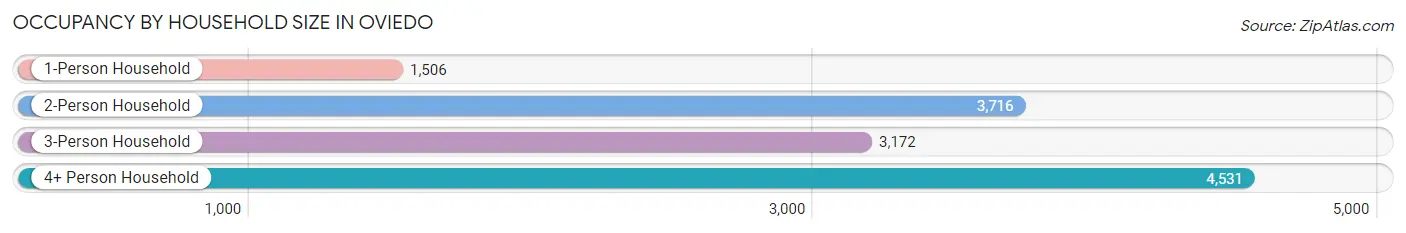
| Household Size | # Housing Units | % Housing Units |
| 1-Person Household | 1,506 | 11.7% |
| 2-Person Household | 3,716 | 28.7% |
| 3-Person Household | 3,172 | 24.5% |
| 4+ Person Household | 4,531 | 35.1% |
| Total Housing Units | 12,925 | 100.0% |
Occupancy by Ownership by Household Size in Oviedo

| Household Size | Owner-occupied | Renter-occupied |
| 1-Person Household | 1,092 (72.5%) | 414 (27.5%) |
| 2-Person Household | 2,943 (79.2%) | 773 (20.8%) |
| 3-Person Household | 2,433 (76.7%) | 739 (23.3%) |
| 4+ Person Household | 3,746 (82.7%) | 785 (17.3%) |
| Total Housing Units | 10,214 (79.0%) | 2,711 (21.0%) |
Occupancy by Educational Attainment in Oviedo
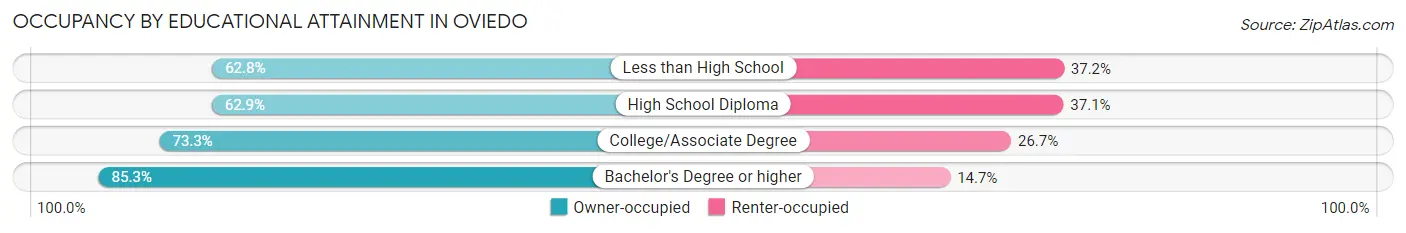
| Household Size | Owner-occupied | Renter-occupied |
| Less than High School | 135 (62.8%) | 80 (37.2%) |
| High School Diploma | 925 (62.9%) | 546 (37.1%) |
| College/Associate Degree | 2,641 (73.3%) | 964 (26.7%) |
| Bachelor's Degree or higher | 6,513 (85.3%) | 1,121 (14.7%) |
Occupancy by Age of Householder in Oviedo
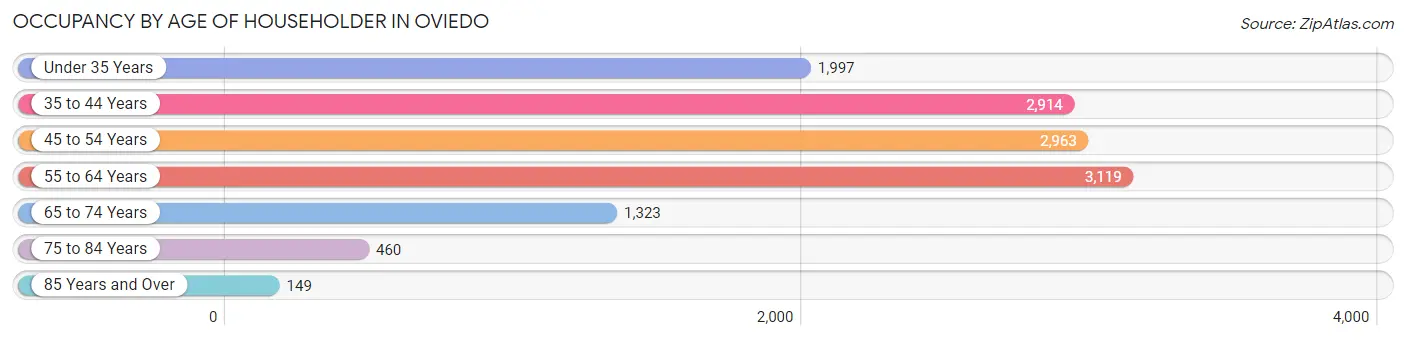
| Age Bracket | # Households | % Households |
| Under 35 Years | 1,997 | 15.4% |
| 35 to 44 Years | 2,914 | 22.6% |
| 45 to 54 Years | 2,963 | 22.9% |
| 55 to 64 Years | 3,119 | 24.1% |
| 65 to 74 Years | 1,323 | 10.2% |
| 75 to 84 Years | 460 | 3.6% |
| 85 Years and Over | 149 | 1.1% |
| Total | 12,925 | 100.0% |
Housing Finances in Oviedo
Median Income by Occupancy in Oviedo
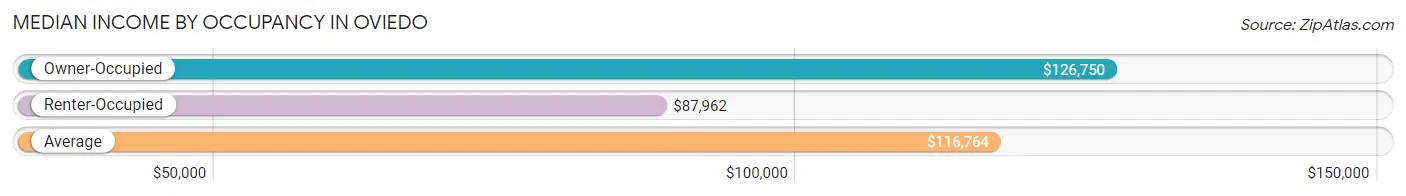
| Occupancy Type | # Households | Median Income |
| Owner-Occupied | 10,214 (79.0%) | $126,750 |
| Renter-Occupied | 2,711 (21.0%) | $87,962 |
| Average | 12,925 (100.0%) | $116,764 |
Occupancy by Householder Income Bracket in Oviedo
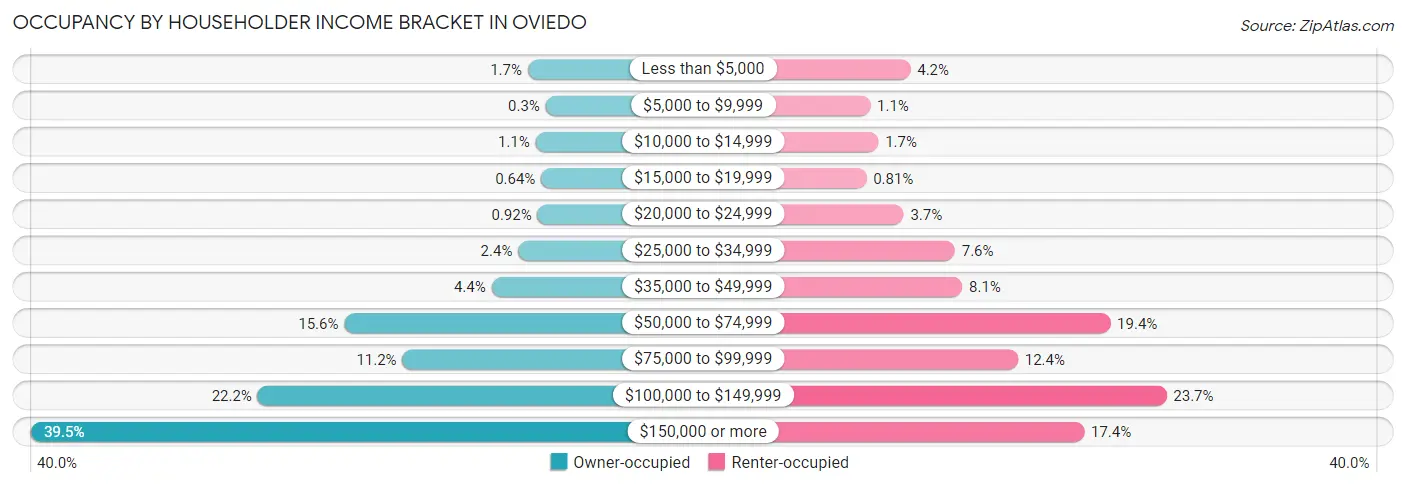
| Income Bracket | Owner-occupied | Renter-occupied |
| Less than $5,000 | 170 (1.7%) | 113 (4.2%) |
| $5,000 to $9,999 | 31 (0.3%) | 30 (1.1%) |
| $10,000 to $14,999 | 109 (1.1%) | 47 (1.7%) |
| $15,000 to $19,999 | 65 (0.6%) | 22 (0.8%) |
| $20,000 to $24,999 | 94 (0.9%) | 99 (3.6%) |
| $25,000 to $34,999 | 244 (2.4%) | 205 (7.6%) |
| $35,000 to $49,999 | 451 (4.4%) | 220 (8.1%) |
| $50,000 to $74,999 | 1,597 (15.6%) | 526 (19.4%) |
| $75,000 to $99,999 | 1,145 (11.2%) | 335 (12.4%) |
| $100,000 to $149,999 | 2,272 (22.2%) | 642 (23.7%) |
| $150,000 or more | 4,036 (39.5%) | 472 (17.4%) |
| Total | 10,214 (100.0%) | 2,711 (100.0%) |
Monthly Housing Cost Tiers in Oviedo
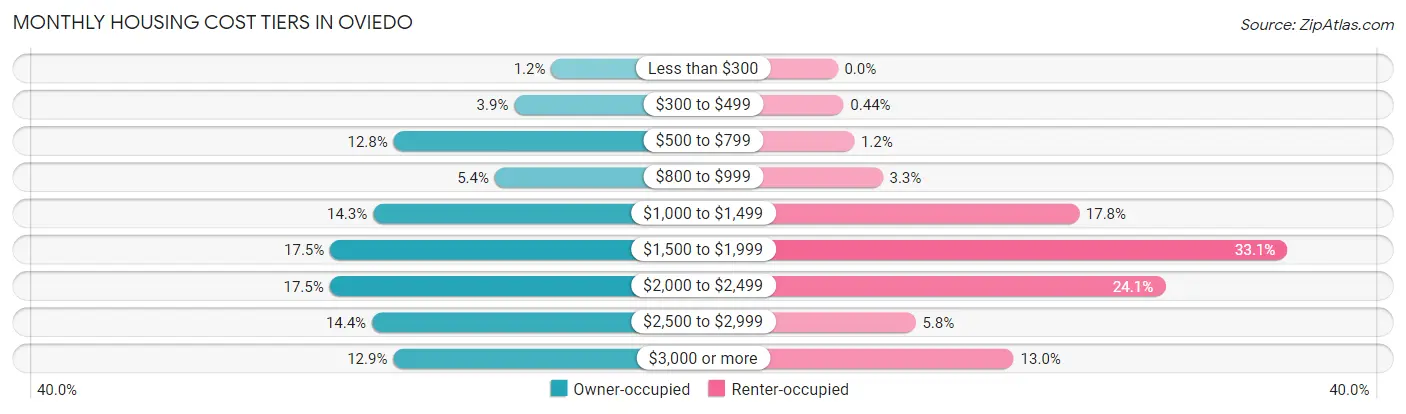
| Monthly Cost | Owner-occupied | Renter-occupied |
| Less than $300 | 124 (1.2%) | 0 (0.0%) |
| $300 to $499 | 402 (3.9%) | 12 (0.4%) |
| $500 to $799 | 1,310 (12.8%) | 33 (1.2%) |
| $800 to $999 | 549 (5.4%) | 90 (3.3%) |
| $1,000 to $1,499 | 1,465 (14.3%) | 482 (17.8%) |
| $1,500 to $1,999 | 1,787 (17.5%) | 898 (33.1%) |
| $2,000 to $2,499 | 1,792 (17.5%) | 654 (24.1%) |
| $2,500 to $2,999 | 1,473 (14.4%) | 156 (5.8%) |
| $3,000 or more | 1,312 (12.9%) | 352 (13.0%) |
| Total | 10,214 (100.0%) | 2,711 (100.0%) |
Physical Housing Characteristics in Oviedo
Housing Structures in Oviedo
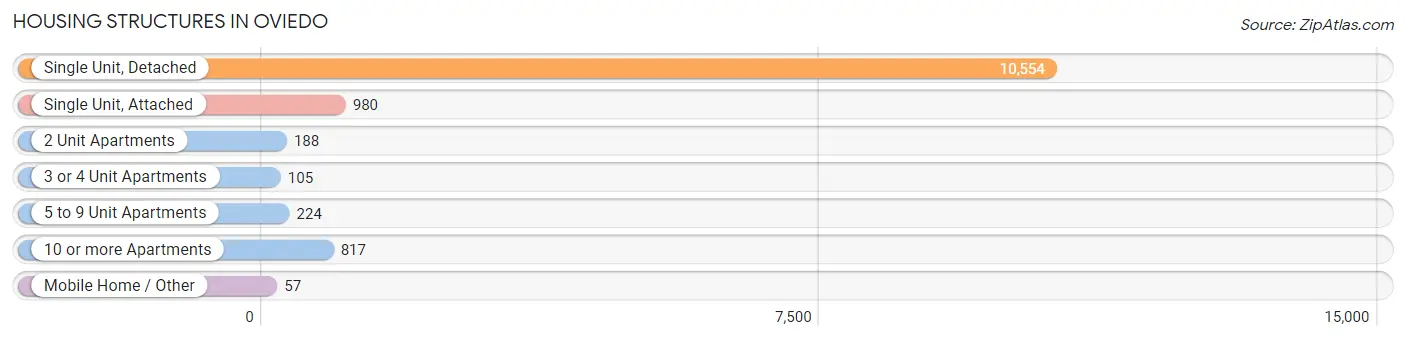
| Structure Type | # Housing Units | % Housing Units |
| Single Unit, Detached | 10,554 | 81.7% |
| Single Unit, Attached | 980 | 7.6% |
| 2 Unit Apartments | 188 | 1.5% |
| 3 or 4 Unit Apartments | 105 | 0.8% |
| 5 to 9 Unit Apartments | 224 | 1.7% |
| 10 or more Apartments | 817 | 6.3% |
| Mobile Home / Other | 57 | 0.4% |
| Total | 12,925 | 100.0% |
Housing Structures by Occupancy in Oviedo
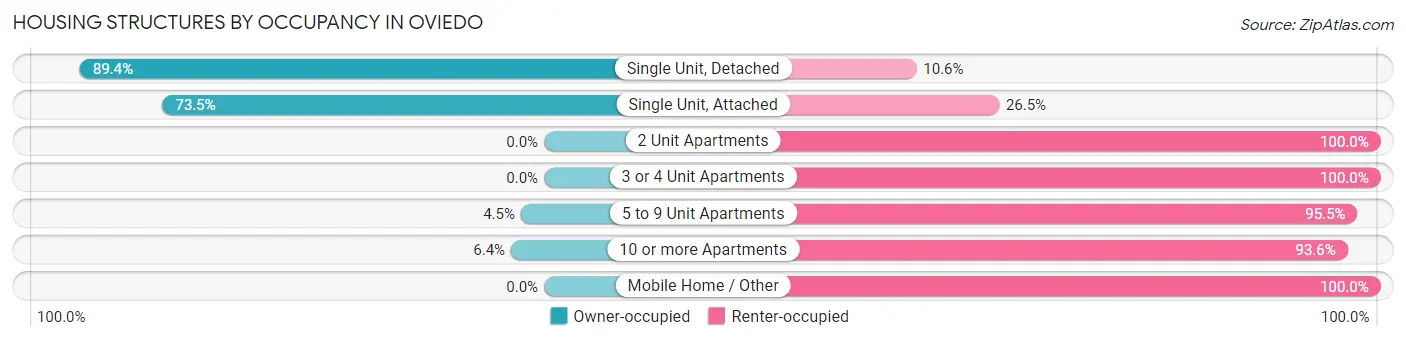
| Structure Type | Owner-occupied | Renter-occupied |
| Single Unit, Detached | 9,432 (89.4%) | 1,122 (10.6%) |
| Single Unit, Attached | 720 (73.5%) | 260 (26.5%) |
| 2 Unit Apartments | 0 (0.0%) | 188 (100.0%) |
| 3 or 4 Unit Apartments | 0 (0.0%) | 105 (100.0%) |
| 5 to 9 Unit Apartments | 10 (4.5%) | 214 (95.5%) |
| 10 or more Apartments | 52 (6.4%) | 765 (93.6%) |
| Mobile Home / Other | 0 (0.0%) | 57 (100.0%) |
| Total | 10,214 (79.0%) | 2,711 (21.0%) |
Housing Structures by Number of Rooms in Oviedo
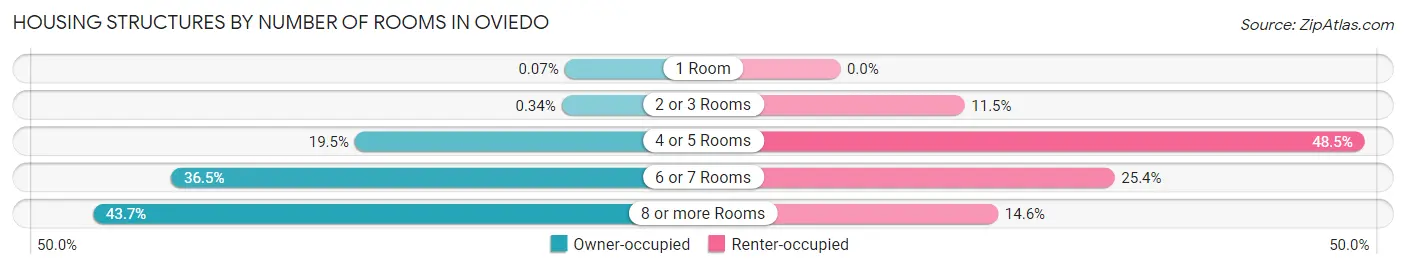
| Number of Rooms | Owner-occupied | Renter-occupied |
| 1 Room | 7 (0.1%) | 0 (0.0%) |
| 2 or 3 Rooms | 35 (0.3%) | 312 (11.5%) |
| 4 or 5 Rooms | 1,988 (19.5%) | 1,315 (48.5%) |
| 6 or 7 Rooms | 3,723 (36.4%) | 688 (25.4%) |
| 8 or more Rooms | 4,461 (43.7%) | 396 (14.6%) |
| Total | 10,214 (100.0%) | 2,711 (100.0%) |
Housing Structure by Heating Type in Oviedo
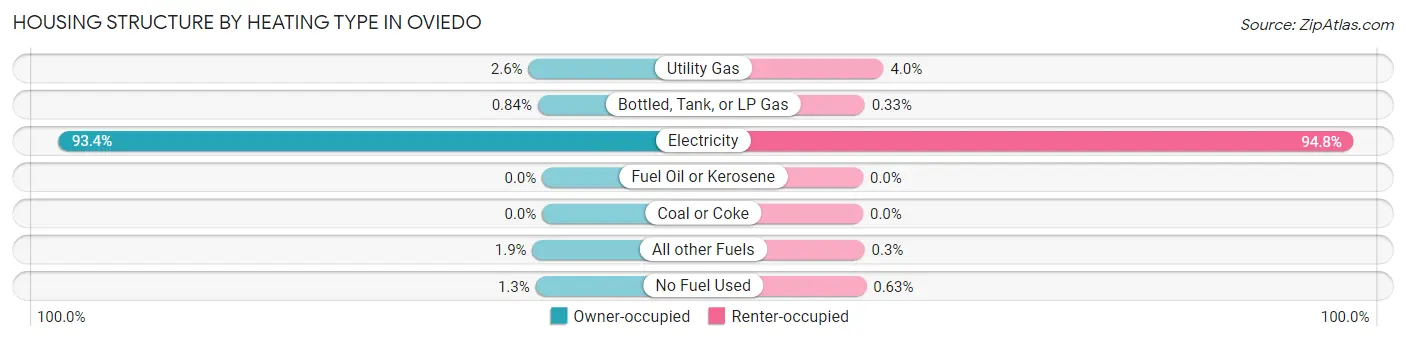
| Heating Type | Owner-occupied | Renter-occupied |
| Utility Gas | 270 (2.6%) | 107 (4.0%) |
| Bottled, Tank, or LP Gas | 86 (0.8%) | 9 (0.3%) |
| Electricity | 9,537 (93.4%) | 2,570 (94.8%) |
| Fuel Oil or Kerosene | 0 (0.0%) | 0 (0.0%) |
| Coal or Coke | 0 (0.0%) | 0 (0.0%) |
| All other Fuels | 191 (1.9%) | 8 (0.3%) |
| No Fuel Used | 130 (1.3%) | 17 (0.6%) |
| Total | 10,214 (100.0%) | 2,711 (100.0%) |
Household Vehicle Usage in Oviedo
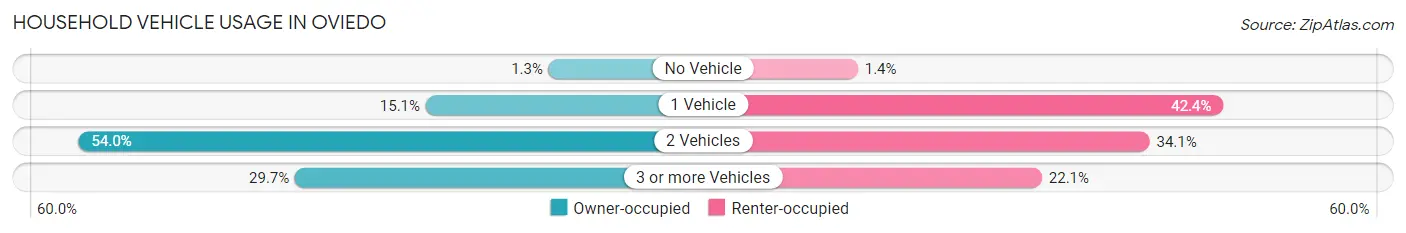
| Vehicles per Household | Owner-occupied | Renter-occupied |
| No Vehicle | 131 (1.3%) | 39 (1.4%) |
| 1 Vehicle | 1,537 (15.0%) | 1,149 (42.4%) |
| 2 Vehicles | 5,512 (54.0%) | 925 (34.1%) |
| 3 or more Vehicles | 3,034 (29.7%) | 598 (22.1%) |
| Total | 10,214 (100.0%) | 2,711 (100.0%) |
Real Estate & Mortgages in Oviedo
Real Estate and Mortgage Overview in Oviedo
| Characteristic | Without Mortgage | With Mortgage |
| Housing Units | 2,554 | 7,660 |
| Median Property Value | $394,100 | $398,100 |
| Median Household Income | $98,750 | $3,305 |
| Monthly Housing Costs | $697 | $1,312 |
| Real Estate Taxes | $2,786 | $361 |
Property Value by Mortgage Status in Oviedo
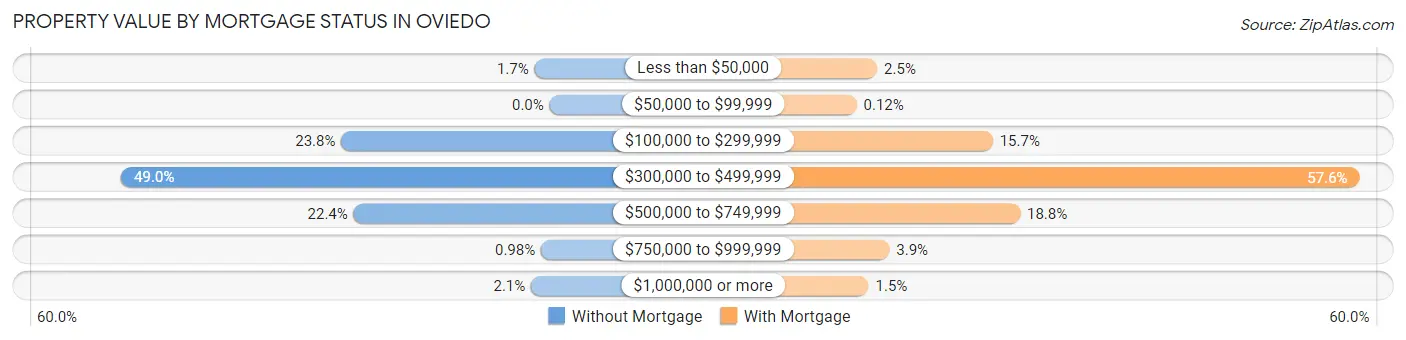
| Property Value | Without Mortgage | With Mortgage |
| Less than $50,000 | 44 (1.7%) | 189 (2.5%) |
| $50,000 to $99,999 | 0 (0.0%) | 9 (0.1%) |
| $100,000 to $299,999 | 608 (23.8%) | 1,201 (15.7%) |
| $300,000 to $499,999 | 1,251 (49.0%) | 4,411 (57.6%) |
| $500,000 to $749,999 | 572 (22.4%) | 1,440 (18.8%) |
| $750,000 to $999,999 | 25 (1.0%) | 296 (3.9%) |
| $1,000,000 or more | 54 (2.1%) | 114 (1.5%) |
| Total | 2,554 (100.0%) | 7,660 (100.0%) |
Household Income by Mortgage Status in Oviedo
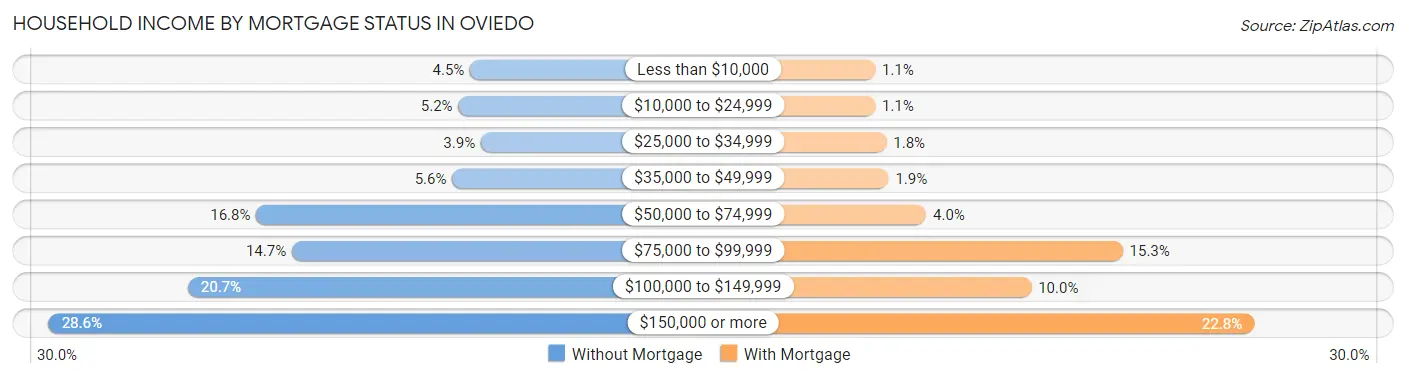
| Household Income | Without Mortgage | With Mortgage |
| Less than $10,000 | 116 (4.5%) | 85 (1.1%) |
| $10,000 to $24,999 | 133 (5.2%) | 85 (1.1%) |
| $25,000 to $34,999 | 100 (3.9%) | 135 (1.8%) |
| $35,000 to $49,999 | 142 (5.6%) | 144 (1.9%) |
| $50,000 to $74,999 | 428 (16.8%) | 309 (4.0%) |
| $75,000 to $99,999 | 376 (14.7%) | 1,169 (15.3%) |
| $100,000 to $149,999 | 528 (20.7%) | 769 (10.0%) |
| $150,000 or more | 731 (28.6%) | 1,744 (22.8%) |
| Total | 2,554 (100.0%) | 7,660 (100.0%) |
Property Value to Household Income Ratio in Oviedo
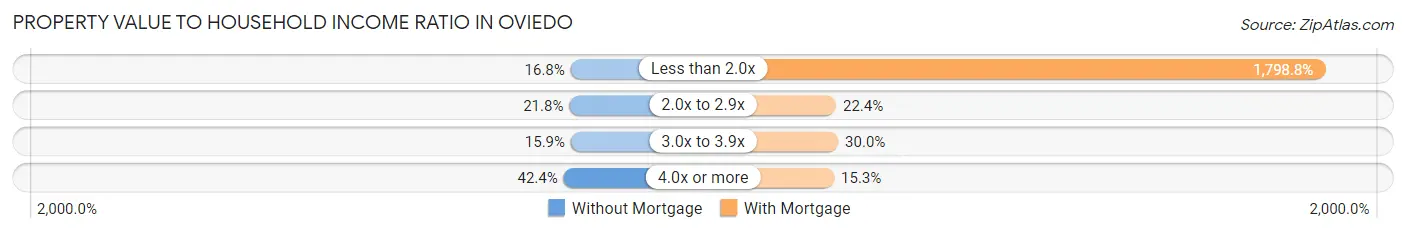
| Value-to-Income Ratio | Without Mortgage | With Mortgage |
| Less than 2.0x | 429 (16.8%) | 137,785 (1,798.8%) |
| 2.0x to 2.9x | 557 (21.8%) | 1,713 (22.4%) |
| 3.0x to 3.9x | 407 (15.9%) | 2,294 (29.9%) |
| 4.0x or more | 1,082 (42.4%) | 1,172 (15.3%) |
| Total | 2,554 (100.0%) | 7,660 (100.0%) |
Real Estate Taxes by Mortgage Status in Oviedo
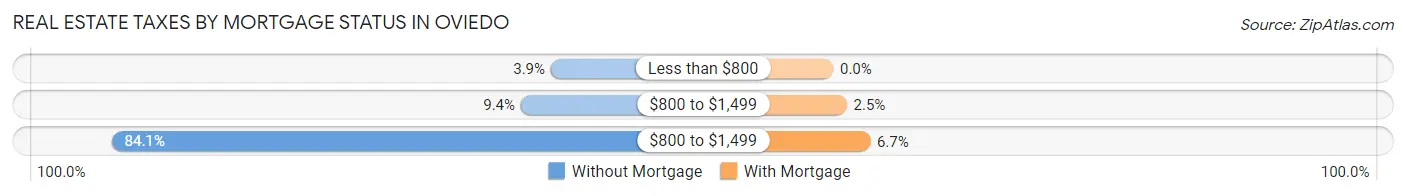
| Property Taxes | Without Mortgage | With Mortgage |
| Less than $800 | 99 (3.9%) | 0 (0.0%) |
| $800 to $1,499 | 239 (9.4%) | 190 (2.5%) |
| $800 to $1,499 | 2,148 (84.1%) | 516 (6.7%) |
| Total | 2,554 (100.0%) | 7,660 (100.0%) |
Health & Disability in Oviedo
Health Insurance Coverage by Age in Oviedo
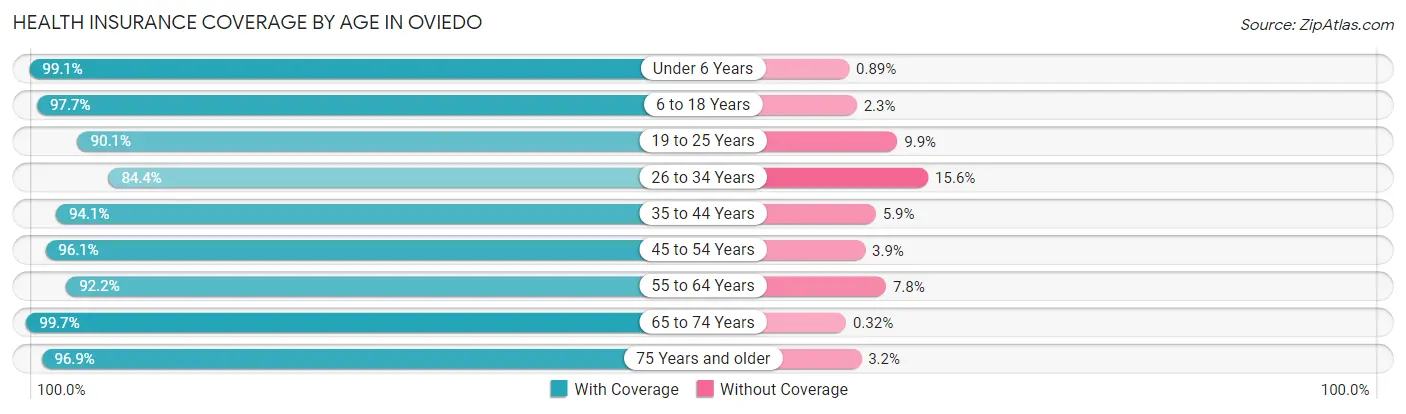
| Age Bracket | With Coverage | Without Coverage |
| Under 6 Years | 2,661 (99.1%) | 24 (0.9%) |
| 6 to 18 Years | 7,991 (97.7%) | 190 (2.3%) |
| 19 to 25 Years | 2,643 (90.1%) | 290 (9.9%) |
| 26 to 34 Years | 4,169 (84.4%) | 773 (15.6%) |
| 35 to 44 Years | 5,312 (94.1%) | 331 (5.9%) |
| 45 to 54 Years | 5,570 (96.1%) | 225 (3.9%) |
| 55 to 64 Years | 4,938 (92.2%) | 416 (7.8%) |
| 65 to 74 Years | 2,468 (99.7%) | 8 (0.3%) |
| 75 Years and older | 1,321 (96.9%) | 43 (3.2%) |
| Total | 37,073 (94.2%) | 2,300 (5.8%) |
Health Insurance Coverage by Citizenship Status in Oviedo
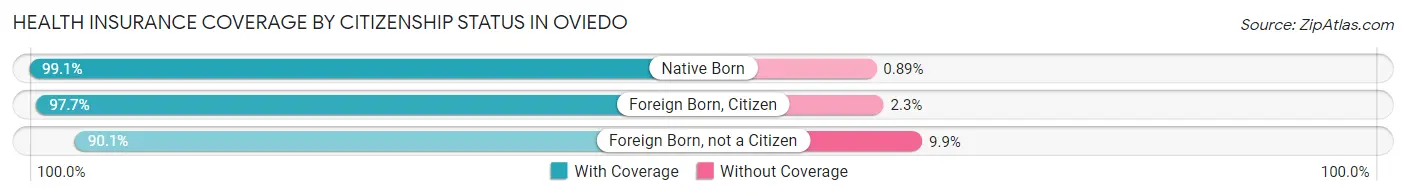
| Citizenship Status | With Coverage | Without Coverage |
| Native Born | 2,661 (99.1%) | 24 (0.9%) |
| Foreign Born, Citizen | 7,991 (97.7%) | 190 (2.3%) |
| Foreign Born, not a Citizen | 2,643 (90.1%) | 290 (9.9%) |
Health Insurance Coverage by Household Income in Oviedo
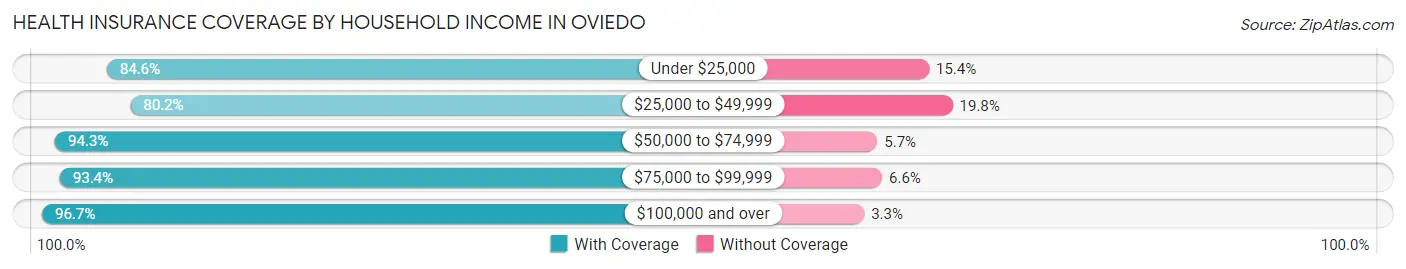
| Household Income | With Coverage | Without Coverage |
| Under $25,000 | 1,389 (84.6%) | 253 (15.4%) |
| $25,000 to $49,999 | 2,556 (80.2%) | 632 (19.8%) |
| $50,000 to $74,999 | 5,172 (94.3%) | 314 (5.7%) |
| $75,000 to $99,999 | 4,210 (93.4%) | 298 (6.6%) |
| $100,000 and over | 23,741 (96.7%) | 802 (3.3%) |
Public vs Private Health Insurance Coverage by Age in Oviedo
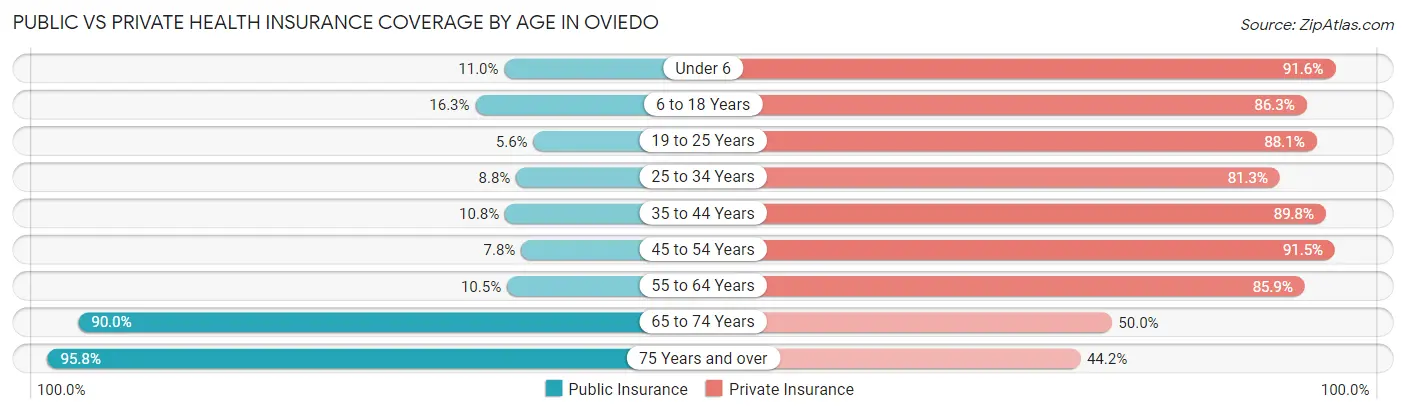
| Age Bracket | Public Insurance | Private Insurance |
| Under 6 | 294 (11.0%) | 2,458 (91.5%) |
| 6 to 18 Years | 1,336 (16.3%) | 7,057 (86.3%) |
| 19 to 25 Years | 163 (5.6%) | 2,584 (88.1%) |
| 25 to 34 Years | 433 (8.8%) | 4,017 (81.3%) |
| 35 to 44 Years | 610 (10.8%) | 5,069 (89.8%) |
| 45 to 54 Years | 453 (7.8%) | 5,304 (91.5%) |
| 55 to 64 Years | 560 (10.5%) | 4,600 (85.9%) |
| 65 to 74 Years | 2,229 (90.0%) | 1,239 (50.0%) |
| 75 Years and over | 1,306 (95.8%) | 603 (44.2%) |
| Total | 7,384 (18.8%) | 32,931 (83.6%) |
Disability Status by Sex by Age in Oviedo
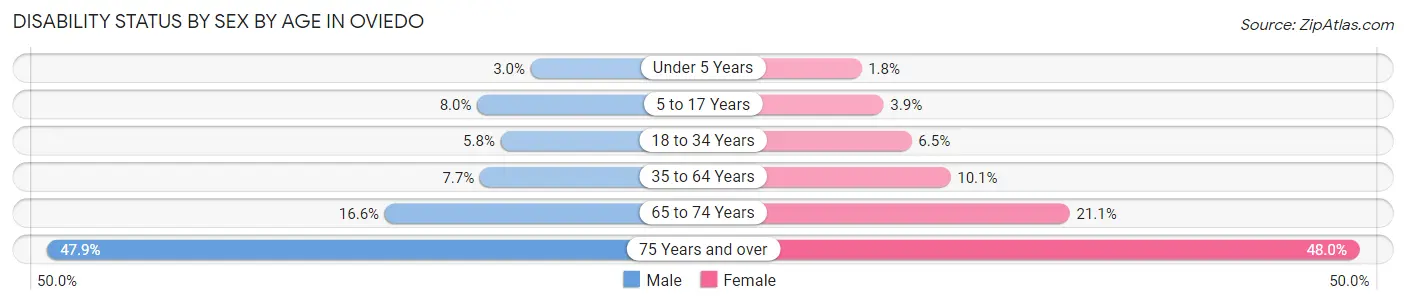
| Age Bracket | Male | Female |
| Under 5 Years | 33 (3.0%) | 20 (1.8%) |
| 5 to 17 Years | 330 (8.0%) | 150 (3.9%) |
| 18 to 34 Years | 243 (5.8%) | 281 (6.5%) |
| 35 to 64 Years | 640 (7.7%) | 857 (10.1%) |
| 65 to 74 Years | 186 (16.6%) | 286 (21.1%) |
| 75 Years and over | 228 (47.9%) | 426 (48.0%) |
Disability Class by Sex by Age in Oviedo
Disability Class: Hearing Difficulty
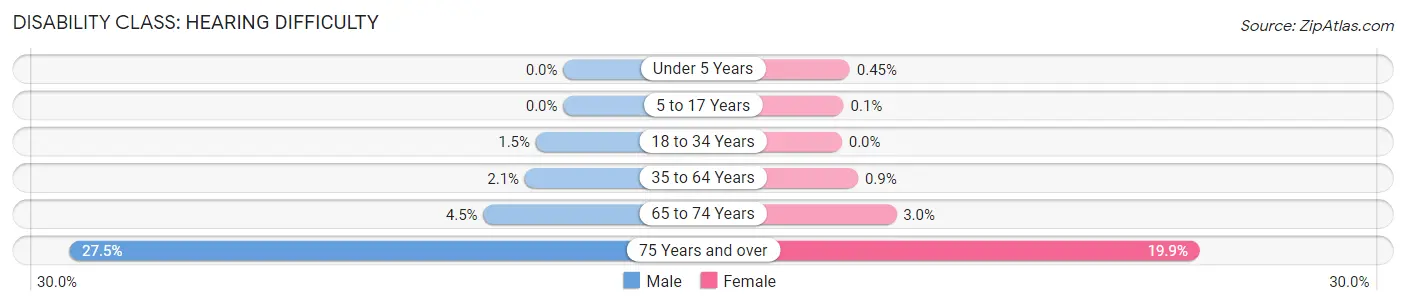
| Age Bracket | Male | Female |
| Under 5 Years | 0 (0.0%) | 5 (0.4%) |
| 5 to 17 Years | 0 (0.0%) | 4 (0.1%) |
| 18 to 34 Years | 64 (1.5%) | 0 (0.0%) |
| 35 to 64 Years | 177 (2.1%) | 77 (0.9%) |
| 65 to 74 Years | 50 (4.4%) | 41 (3.0%) |
| 75 Years and over | 131 (27.5%) | 177 (19.9%) |
Disability Class: Vision Difficulty
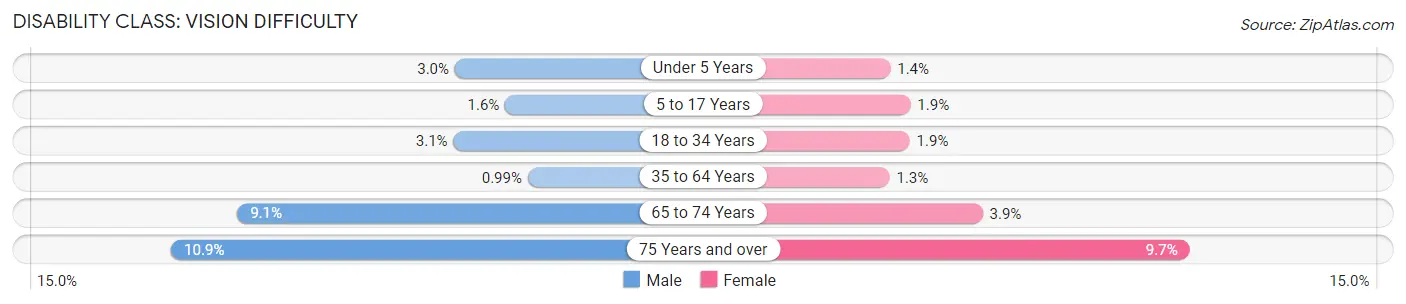
| Age Bracket | Male | Female |
| Under 5 Years | 33 (3.0%) | 15 (1.3%) |
| 5 to 17 Years | 67 (1.6%) | 74 (1.9%) |
| 18 to 34 Years | 128 (3.1%) | 82 (1.9%) |
| 35 to 64 Years | 82 (1.0%) | 113 (1.3%) |
| 65 to 74 Years | 102 (9.1%) | 53 (3.9%) |
| 75 Years and over | 52 (10.9%) | 86 (9.7%) |
Disability Class: Cognitive Difficulty
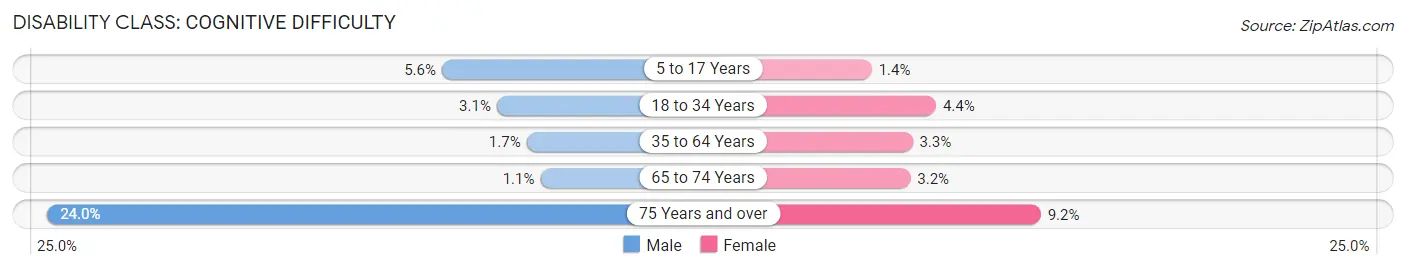
| Age Bracket | Male | Female |
| 5 to 17 Years | 233 (5.6%) | 54 (1.4%) |
| 18 to 34 Years | 129 (3.1%) | 190 (4.4%) |
| 35 to 64 Years | 142 (1.7%) | 279 (3.3%) |
| 65 to 74 Years | 12 (1.1%) | 43 (3.2%) |
| 75 Years and over | 114 (23.9%) | 82 (9.2%) |
Disability Class: Ambulatory Difficulty
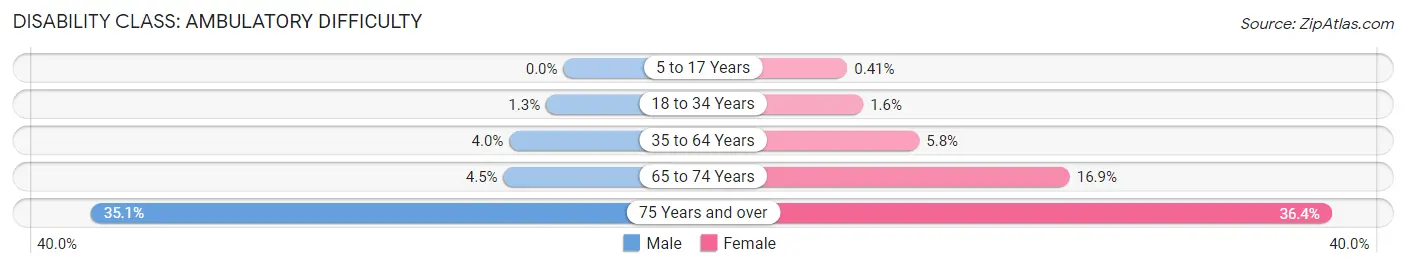
| Age Bracket | Male | Female |
| 5 to 17 Years | 0 (0.0%) | 16 (0.4%) |
| 18 to 34 Years | 54 (1.3%) | 69 (1.6%) |
| 35 to 64 Years | 333 (4.0%) | 490 (5.8%) |
| 65 to 74 Years | 50 (4.4%) | 229 (16.9%) |
| 75 Years and over | 167 (35.1%) | 323 (36.4%) |
Disability Class: Self-Care Difficulty
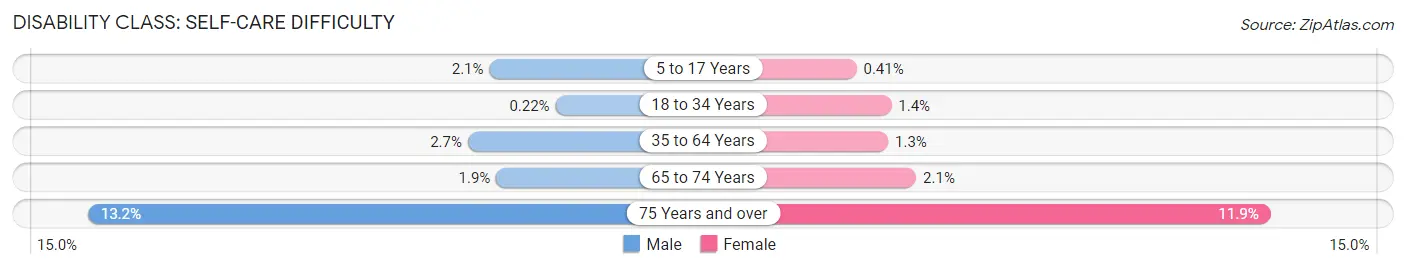
| Age Bracket | Male | Female |
| 5 to 17 Years | 85 (2.1%) | 16 (0.4%) |
| 18 to 34 Years | 9 (0.2%) | 60 (1.4%) |
| 35 to 64 Years | 220 (2.7%) | 110 (1.3%) |
| 65 to 74 Years | 21 (1.9%) | 28 (2.1%) |
| 75 Years and over | 63 (13.2%) | 106 (11.9%) |
Technology Access in Oviedo
Computing Device Access in Oviedo
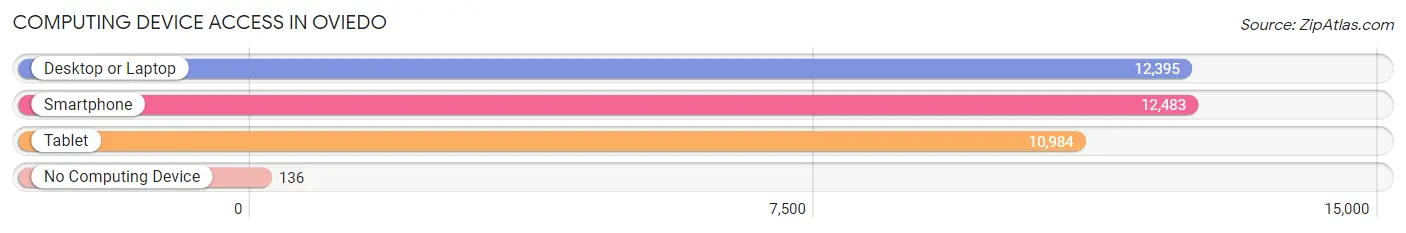
| Device Type | # Households | % Households |
| Desktop or Laptop | 12,395 | 95.9% |
| Smartphone | 12,483 | 96.6% |
| Tablet | 10,984 | 85.0% |
| No Computing Device | 136 | 1.1% |
| Total | 12,925 | 100.0% |
Internet Access in Oviedo
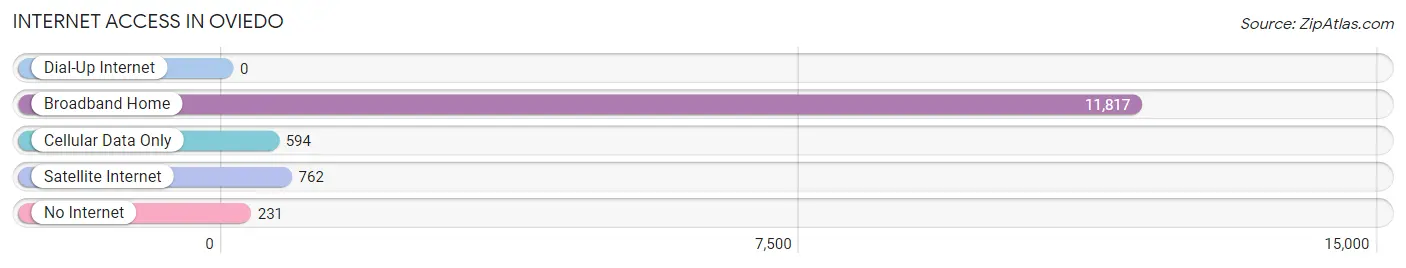
| Internet Type | # Households | % Households |
| Dial-Up Internet | 0 | 0.0% |
| Broadband Home | 11,817 | 91.4% |
| Cellular Data Only | 594 | 4.6% |
| Satellite Internet | 762 | 5.9% |
| No Internet | 231 | 1.8% |
| Total | 12,925 | 100.0% |
Oviedo Summary
Oviedo is a city located in Seminole County, Florida, United States. It is part of the Orlando–Kissimmee–Sanford Metropolitan Statistical Area. The population was 33,342 at the 2010 census, up from 26,316 at the 2000 census.
History
Oviedo was founded in the late 1800s by settlers from Spain. The city was named after the Spanish city of Oviedo, which is located in the Asturias region of northern Spain. The settlers were attracted to the area due to its fertile soil and mild climate.
The first settlers in Oviedo were cattle ranchers, who established large ranches in the area. The city was officially incorporated in 1925.
In the 1950s, the city began to experience rapid growth due to the influx of people from the nearby Orlando area. This growth continued throughout the 1960s and 1970s, and by the 1980s, Oviedo had become a thriving suburban community.
Geography
Oviedo is located in central Florida, approximately 25 miles northeast of Orlando. The city is situated on the northern edge of the Central Florida Green Swamp, which is part of the larger Ocala National Forest.
The city covers an area of approximately 24 square miles, and is bordered by the cities of Winter Springs to the north, Chuluota to the east, Geneva to the south, and Winter Park to the west.
The city is located at an elevation of approximately 100 feet above sea level. The terrain is mostly flat, with some rolling hills in the northern part of the city.
Economy
Oviedo’s economy is largely based on the service industry, with many residents employed in retail, healthcare, and education. The city is also home to several large employers, including Lockheed Martin, Siemens, and the University of Central Florida.
The city is also home to several shopping centers, including Oviedo Marketplace, Oviedo Mall, and Oviedo Crossing.
Demographics
As of the 2010 census, there were 33,342 people, 11,945 households, and 8,845 families residing in the city. The population density was 1,372.3 people per square mile. The racial makeup of the city was 79.2% White, 11.3% African American, 0.4% Native American, 3.2% Asian, 0.1% Pacific Islander, 3.2% from other races, and 2.7% from two or more races. Hispanic or Latino of any race were 11.3% of the population.
The median income for a household in the city was $63,945, and the median income for a family was $76,945. The per capita income for the city was $30,945. About 4.2% of families and 6.2% of the population were below the poverty line, including 8.2% of those under age 18 and 4.2% of those age 65 or over.
The city is served by the Seminole County Public Schools system. The city is also home to several private schools, including Oviedo Christian School, Trinity Preparatory School, and The Master’s Academy.
Common Questions
What is Per Capita Income in Oviedo?
Per Capita income in Oviedo is $46,456.
What is the Median Family Income in Oviedo?
Median Family Income in Oviedo is $120,478.
What is the Median Household income in Oviedo?
Median Household Income in Oviedo is $116,764.
What is Income or Wage Gap in Oviedo?
Income or Wage Gap in Oviedo is 23.1%.
Women in Oviedo earn 76.9 cents for every dollar earned by a man.
What is Inequality or Gini Index in Oviedo?
Inequality or Gini Index in Oviedo is 0.39.
What is the Total Population of Oviedo?
Total Population of Oviedo is 39,552.
What is the Total Male Population of Oviedo?
Total Male Population of Oviedo is 19,321.
What is the Total Female Population of Oviedo?
Total Female Population of Oviedo is 20,231.
What is the Ratio of Males per 100 Females in Oviedo?
There are 95.50 Males per 100 Females in Oviedo.
What is the Ratio of Females per 100 Males in Oviedo?
There are 104.71 Females per 100 Males in Oviedo.
What is the Median Population Age in Oviedo?
Median Population Age in Oviedo is 36.9 Years.
What is the Average Family Size in Oviedo
Average Family Size in Oviedo is 3.3 People.
What is the Average Household Size in Oviedo
Average Household Size in Oviedo is 3.0 People.
How Large is the Labor Force in Oviedo?
There are 21,648 People in the Labor Forcein in Oviedo.
What is the Percentage of People in the Labor Force in Oviedo?
70.1% of People are in the Labor Force in Oviedo.
What is the Unemployment Rate in Oviedo?
Unemployment Rate in Oviedo is 4.2%.