Muldrow, OK Map & Demographics
Muldrow Map
Muldrow Overview
$21,875
PER CAPITA INCOME
$68,125
AVG FAMILY INCOME
$45,982
AVG HOUSEHOLD INCOME
48.8%
WAGE / INCOME GAP [ % ]
51.2¢/ $1
WAGE / INCOME GAP [ $ ]
0.41
INEQUALITY / GINI INDEX
3,294
TOTAL POPULATION
1,684
MALE POPULATION
1,610
FEMALE POPULATION
104.60
MALES / 100 FEMALES
95.61
FEMALES / 100 MALES
37.8
MEDIAN AGE
3.6
AVG FAMILY SIZE
2.8
AVG HOUSEHOLD SIZE
1,445
LABOR FORCE [ PEOPLE ]
54.5%
PERCENT IN LABOR FORCE
4.5%
UNEMPLOYMENT RATE
Muldrow Zip Codes
Muldrow Area Codes
Income in Muldrow
Income Overview in Muldrow
Per Capita Income in Muldrow is $21,875, while median incomes of families and households are $68,125 and $45,982 respectively.
| Characteristic | Number | Measure |
| Per Capita Income | 3,294 | $21,875 |
| Median Family Income | 771 | $68,125 |
| Mean Family Income | 771 | $72,734 |
| Median Household Income | 1,189 | $45,982 |
| Mean Household Income | 1,189 | $57,200 |
| Income Deficit | 771 | $0 |
| Wage / Income Gap (%) | 3,294 | 48.84% |
| Wage / Income Gap ($) | 3,294 | 51.16¢ per $1 |
| Gini / Inequality Index | 3,294 | 0.41 |
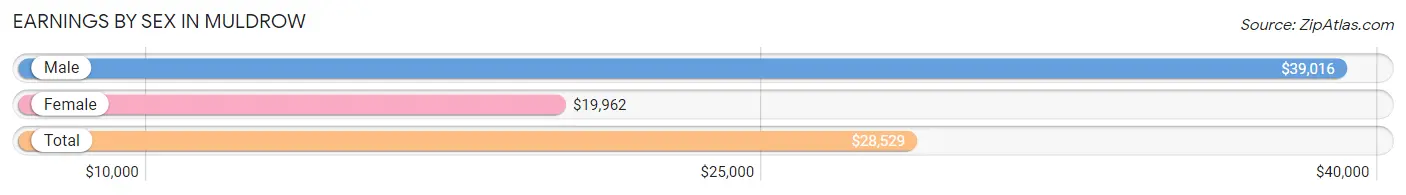
Earnings by Sex in Muldrow
Average Earnings in Muldrow are $28,529, $39,016 for men and $19,962 for women, a difference of 48.8%.
| Sex | Number | Average Earnings |
| Male | 801 (54.6%) | $39,016 |
| Female | 665 (45.4%) | $19,962 |
| Total | 1,466 (100.0%) | $28,529 |
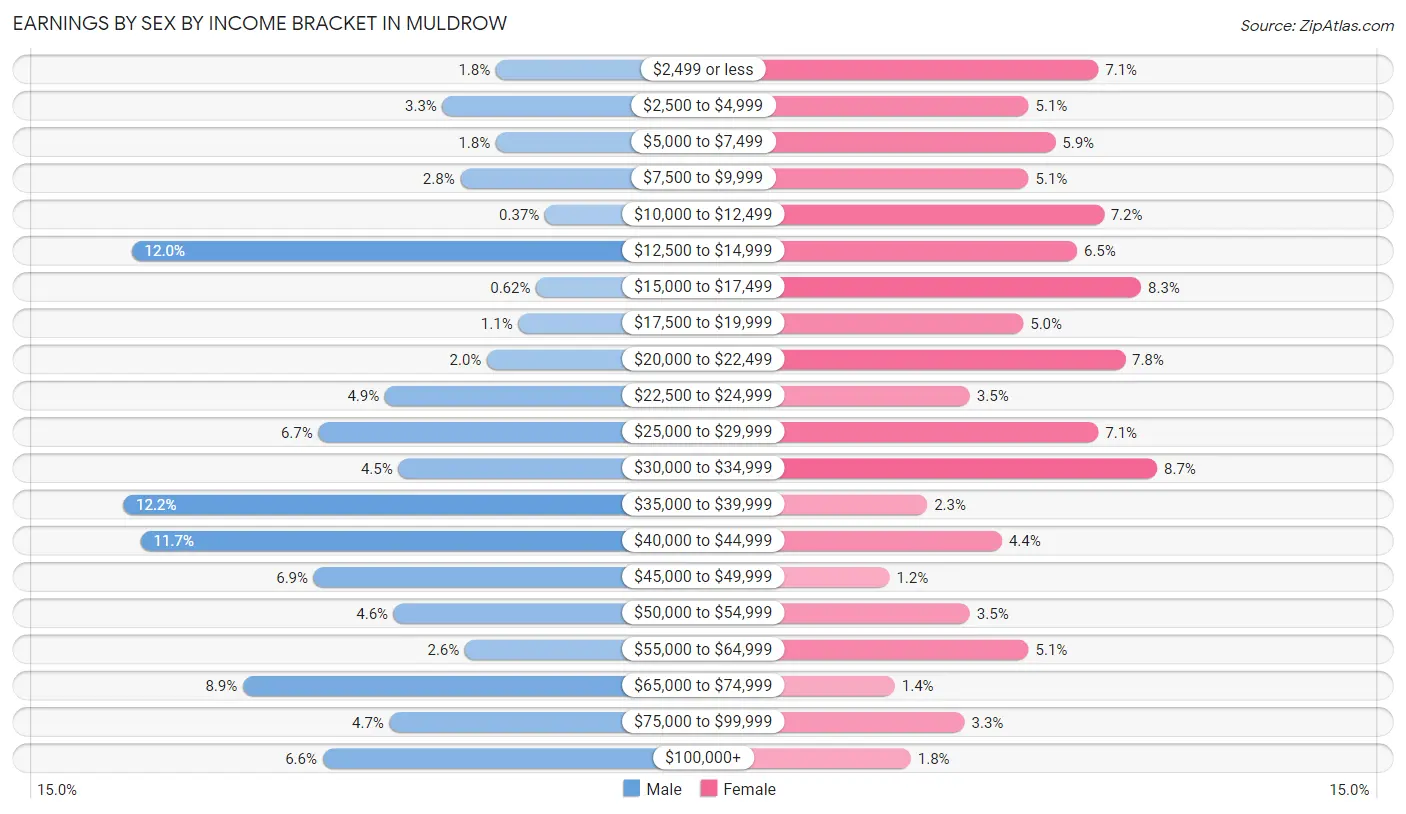
Earnings by Sex by Income Bracket in Muldrow
The most common earnings brackets in Muldrow are $35,000 to $39,999 for men (98 | 12.2%) and $30,000 to $34,999 for women (58 | 8.7%).
| Income | Male | Female |
| $2,499 or less | 14 (1.8%) | 47 (7.1%) |
| $2,500 to $4,999 | 26 (3.3%) | 34 (5.1%) |
| $5,000 to $7,499 | 14 (1.8%) | 39 (5.9%) |
| $7,500 to $9,999 | 22 (2.8%) | 34 (5.1%) |
| $10,000 to $12,499 | 3 (0.4%) | 48 (7.2%) |
| $12,500 to $14,999 | 96 (12.0%) | 43 (6.5%) |
| $15,000 to $17,499 | 5 (0.6%) | 55 (8.3%) |
| $17,500 to $19,999 | 9 (1.1%) | 33 (5.0%) |
| $20,000 to $22,499 | 16 (2.0%) | 52 (7.8%) |
| $22,500 to $24,999 | 39 (4.9%) | 23 (3.5%) |
| $25,000 to $29,999 | 54 (6.7%) | 47 (7.1%) |
| $30,000 to $34,999 | 36 (4.5%) | 58 (8.7%) |
| $35,000 to $39,999 | 98 (12.2%) | 15 (2.3%) |
| $40,000 to $44,999 | 94 (11.7%) | 29 (4.4%) |
| $45,000 to $49,999 | 55 (6.9%) | 8 (1.2%) |
| $50,000 to $54,999 | 37 (4.6%) | 23 (3.5%) |
| $55,000 to $64,999 | 21 (2.6%) | 34 (5.1%) |
| $65,000 to $74,999 | 71 (8.9%) | 9 (1.3%) |
| $75,000 to $99,999 | 38 (4.7%) | 22 (3.3%) |
| $100,000+ | 53 (6.6%) | 12 (1.8%) |
| Total | 801 (100.0%) | 665 (100.0%) |
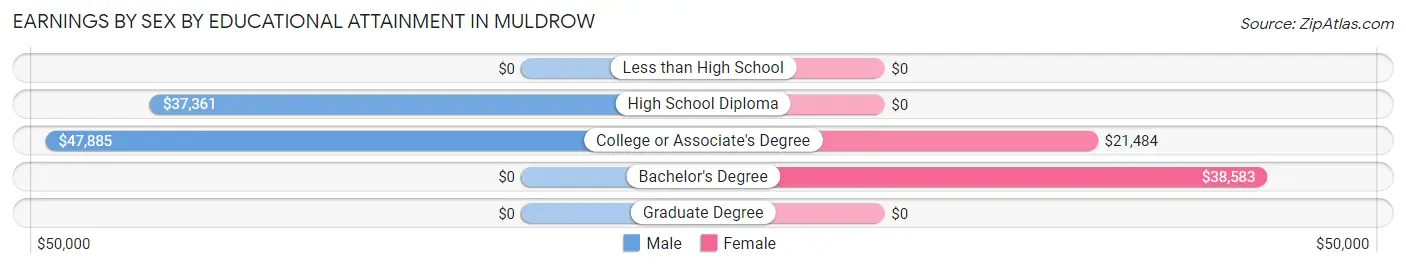
Earnings by Sex by Educational Attainment in Muldrow
Average earnings in Muldrow are $39,656 for men and $19,545 for women, a difference of 50.7%. Men with an educational attainment of college or associate's degree enjoy the highest average annual earnings of $47,885, while those with high school diploma education earn the least with $37,361. Women with an educational attainment of bachelor's degree earn the most with the average annual earnings of $38,583, while those with college or associate's degree education have the smallest earnings of $21,484.
| Educational Attainment | Male Income | Female Income |
| Less than High School | - | - |
| High School Diploma | $37,361 | $0 |
| College or Associate's Degree | $47,885 | $21,484 |
| Bachelor's Degree | - | - |
| Graduate Degree | - | - |
| Total | $39,656 | $19,545 |
Family Income in Muldrow
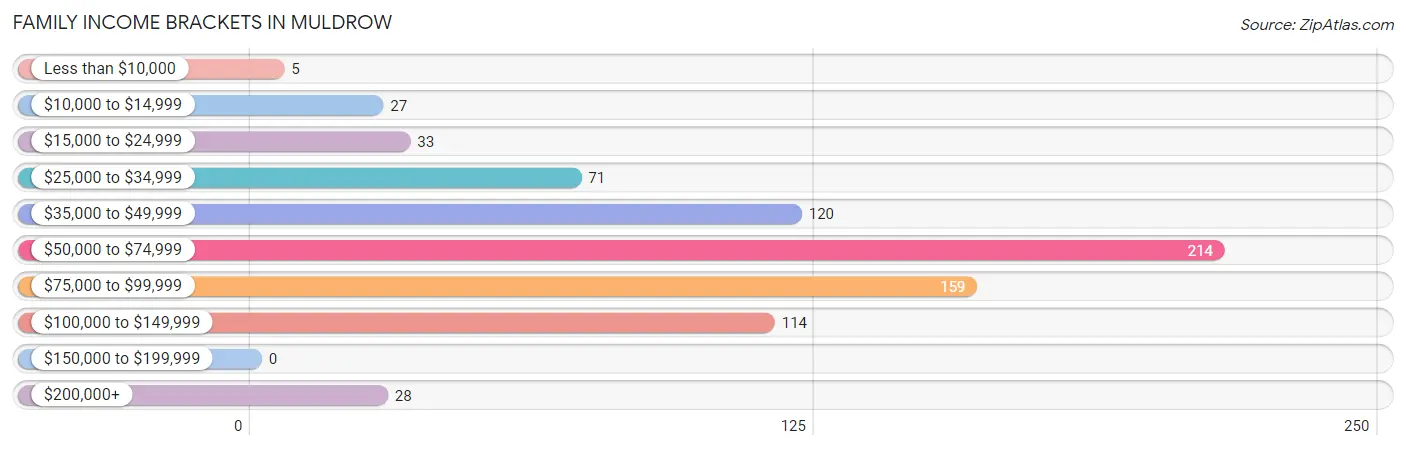
Family Income Brackets in Muldrow
According to the Muldrow family income data, there are 214 families falling into the $50,000 to $74,999 income range, which is the most common income bracket and makes up 27.8% of all families.
| Income Bracket | # Families | % Families |
| Less than $10,000 | 5 | 0.6% |
| $10,000 to $14,999 | 27 | 3.5% |
| $15,000 to $24,999 | 33 | 4.3% |
| $25,000 to $34,999 | 71 | 9.2% |
| $35,000 to $49,999 | 120 | 15.6% |
| $50,000 to $74,999 | 214 | 27.8% |
| $75,000 to $99,999 | 159 | 20.6% |
| $100,000 to $149,999 | 114 | 14.8% |
| $150,000 to $199,999 | 0 | 0.0% |
| $200,000+ | 28 | 3.6% |
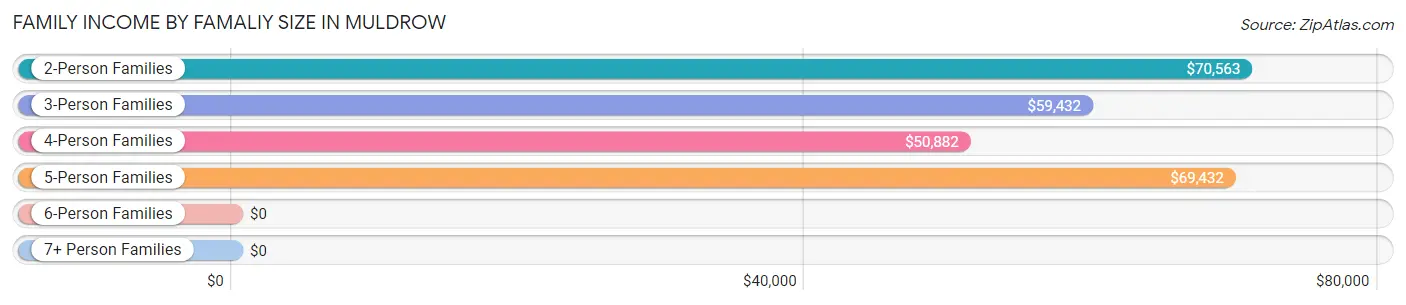
Family Income by Famaliy Size in Muldrow
2-person families (296 | 38.4%) account for the highest median family income in Muldrow with $70,563 per family, while 2-person families (296 | 38.4%) have the highest median income of $35,282 per family member.
| Income Bracket | # Families | Median Income |
| 2-Person Families | 296 (38.4%) | $70,563 |
| 3-Person Families | 195 (25.3%) | $59,432 |
| 4-Person Families | 154 (20.0%) | $50,882 |
| 5-Person Families | 62 (8.0%) | $69,432 |
| 6-Person Families | 30 (3.9%) | $0 |
| 7+ Person Families | 34 (4.4%) | $0 |
| Total | 771 (100.0%) | $68,125 |
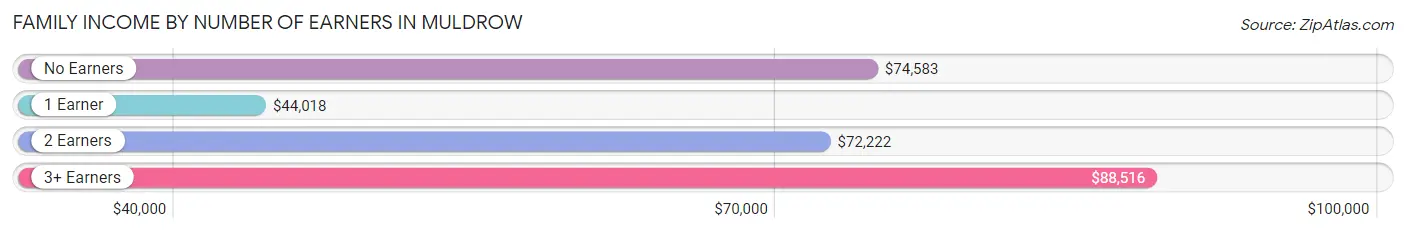
Family Income by Number of Earners in Muldrow
The median family income in Muldrow is $68,125, with families comprising 3+ earners (76) having the highest median family income of $88,516, while families with 1 earner (301) have the lowest median family income of $44,018, accounting for 9.9% and 39.0% of families, respectively.
| Number of Earners | # Families | Median Income |
| No Earners | 104 (13.5%) | $74,583 |
| 1 Earner | 301 (39.0%) | $44,018 |
| 2 Earners | 290 (37.6%) | $72,222 |
| 3+ Earners | 76 (9.9%) | $88,516 |
| Total | 771 (100.0%) | $68,125 |
Household Income in Muldrow
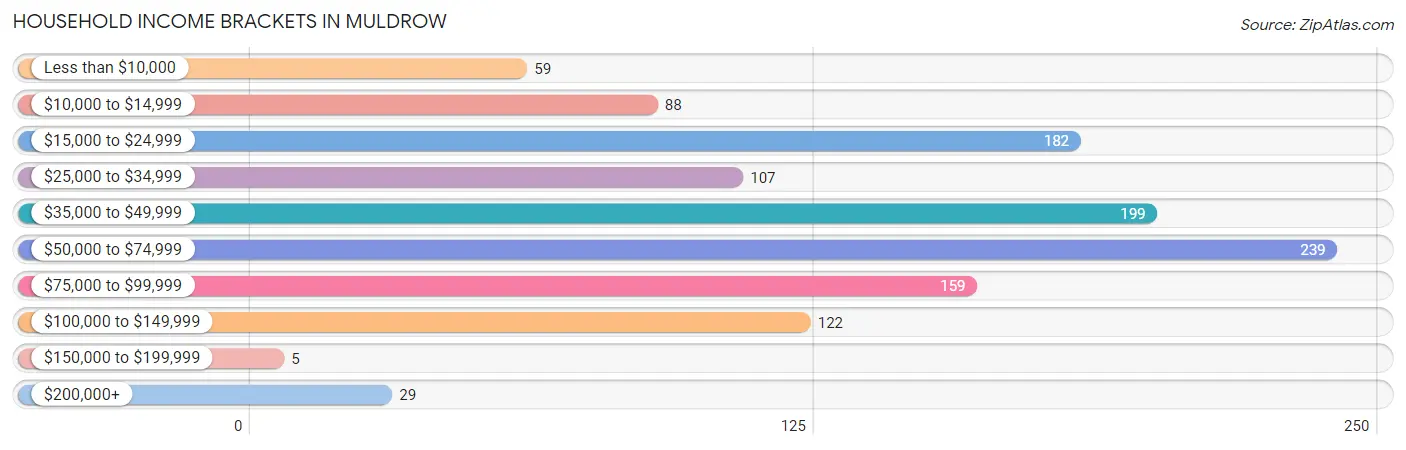
Household Income Brackets in Muldrow
With 239 households falling in the category, the $50,000 to $74,999 income range is the most frequent in Muldrow, accounting for 20.1% of all households. In contrast, only 5 households (0.4%) fall into the $150,000 to $199,999 income bracket, making it the least populous group.
| Income Bracket | # Households | % Households |
| Less than $10,000 | 59 | 5.0% |
| $10,000 to $14,999 | 88 | 7.4% |
| $15,000 to $24,999 | 182 | 15.3% |
| $25,000 to $34,999 | 107 | 9.0% |
| $35,000 to $49,999 | 199 | 16.7% |
| $50,000 to $74,999 | 239 | 20.1% |
| $75,000 to $99,999 | 159 | 13.4% |
| $100,000 to $149,999 | 122 | 10.3% |
| $150,000 to $199,999 | 5 | 0.4% |
| $200,000+ | 29 | 2.4% |
Household Income by Householder Age in Muldrow
The median household income in Muldrow is $45,982, with the highest median household income of $53,875 found in the 25 to 44 years age bracket for the primary householder. A total of 373 households (31.4%) fall into this category. Meanwhile, the 15 to 24 years age bracket for the primary householder has the lowest median household income of $0, with 34 households (2.9%) in this group.
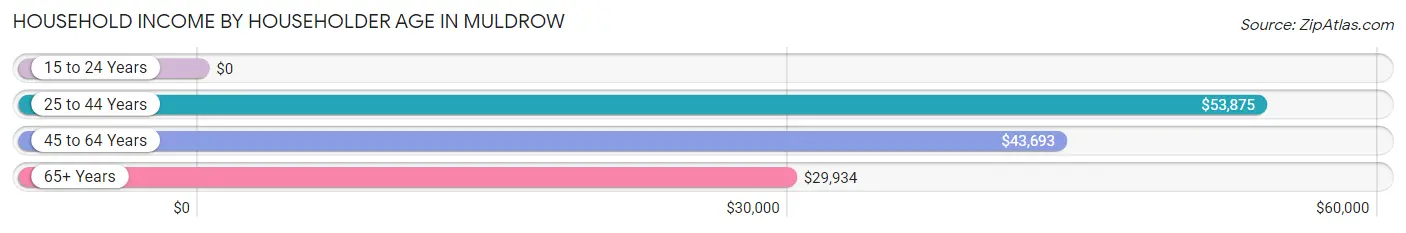
| Income Bracket | # Households | Median Income |
| 15 to 24 Years | 34 (2.9%) | $0 |
| 25 to 44 Years | 373 (31.4%) | $53,875 |
| 45 to 64 Years | 551 (46.3%) | $43,693 |
| 65+ Years | 231 (19.4%) | $29,934 |
| Total | 1,189 (100.0%) | $45,982 |
Poverty in Muldrow
Income Below Poverty by Sex and Age in Muldrow
With 15.5% poverty level for males and 15.0% for females among the residents of Muldrow, 15 year old males and 5 year old females are the most vulnerable to poverty, with 9 males (100.0%) and 19 females (100.0%) in their respective age groups living below the poverty level.
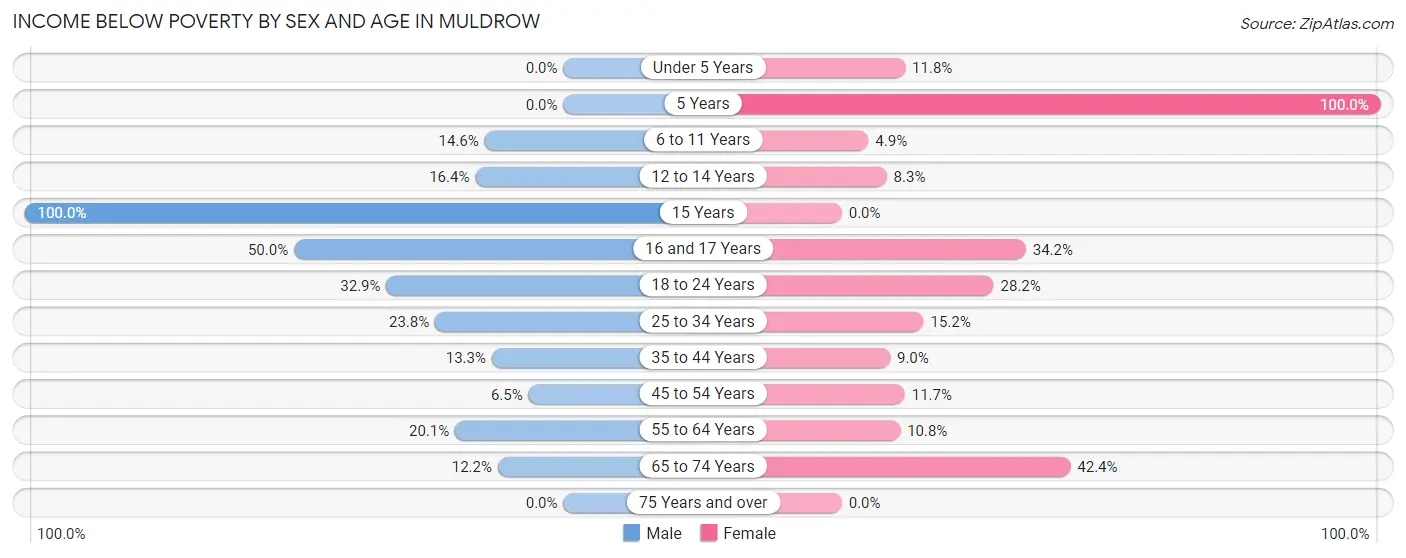
| Age Bracket | Male | Female |
| Under 5 Years | 0 (0.0%) | 10 (11.8%) |
| 5 Years | 0 (0.0%) | 19 (100.0%) |
| 6 to 11 Years | 18 (14.6%) | 4 (4.9%) |
| 12 to 14 Years | 9 (16.4%) | 4 (8.3%) |
| 15 Years | 9 (100.0%) | 0 (0.0%) |
| 16 and 17 Years | 9 (50.0%) | 14 (34.2%) |
| 18 to 24 Years | 68 (32.9%) | 51 (28.2%) |
| 25 to 34 Years | 55 (23.8%) | 34 (15.2%) |
| 35 to 44 Years | 23 (13.3%) | 17 (8.9%) |
| 45 to 54 Years | 21 (6.5%) | 33 (11.7%) |
| 55 to 64 Years | 40 (20.1%) | 27 (10.8%) |
| 65 to 74 Years | 9 (12.2%) | 28 (42.4%) |
| 75 Years and over | 0 (0.0%) | 0 (0.0%) |
| Total | 261 (15.5%) | 241 (15.0%) |
Income Above Poverty by Sex and Age in Muldrow
According to the poverty statistics in Muldrow, males aged under 5 years and females aged 15 years are the age groups that are most secure financially, with 100.0% of males and 100.0% of females in these age groups living above the poverty line.
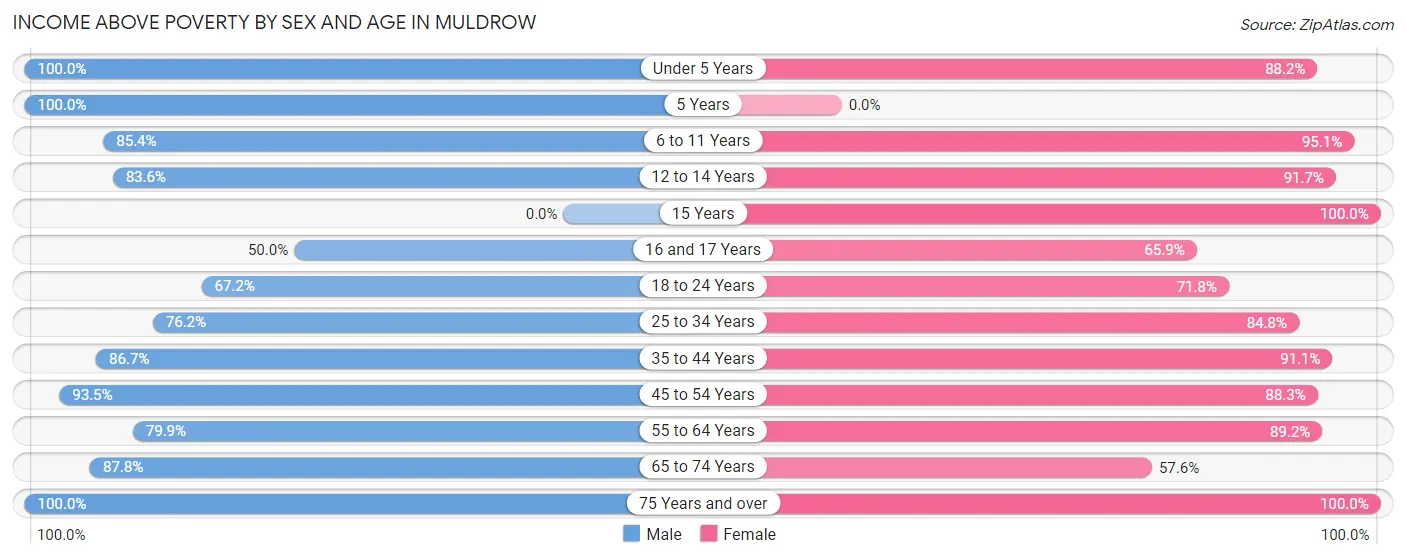
| Age Bracket | Male | Female |
| Under 5 Years | 173 (100.0%) | 75 (88.2%) |
| 5 Years | 8 (100.0%) | 0 (0.0%) |
| 6 to 11 Years | 105 (85.4%) | 77 (95.1%) |
| 12 to 14 Years | 46 (83.6%) | 44 (91.7%) |
| 15 Years | 0 (0.0%) | 42 (100.0%) |
| 16 and 17 Years | 9 (50.0%) | 27 (65.8%) |
| 18 to 24 Years | 139 (67.1%) | 130 (71.8%) |
| 25 to 34 Years | 176 (76.2%) | 190 (84.8%) |
| 35 to 44 Years | 150 (86.7%) | 173 (91.0%) |
| 45 to 54 Years | 304 (93.5%) | 249 (88.3%) |
| 55 to 64 Years | 159 (79.9%) | 222 (89.2%) |
| 65 to 74 Years | 65 (87.8%) | 38 (57.6%) |
| 75 Years and over | 89 (100.0%) | 102 (100.0%) |
| Total | 1,423 (84.5%) | 1,369 (85.0%) |
Income Below Poverty Among Married-Couple Families in Muldrow
The poverty statistics for married-couple families in Muldrow show that 6.5% or 39 of the total 600 families live below the poverty line. Families with 3 or 4 children have the highest poverty rate of 15.1%, comprising of 10 families. On the other hand, families with no children have the lowest poverty rate of 0.0%, which includes 0 families.
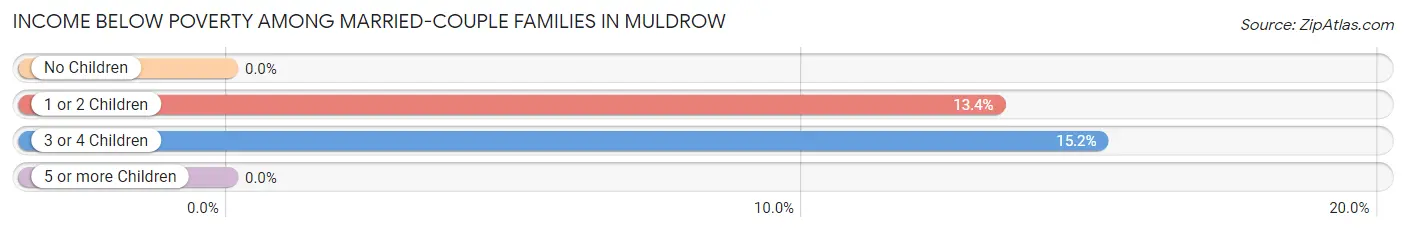
| Children | Above Poverty | Below Poverty |
| No Children | 317 (100.0%) | 0 (0.0%) |
| 1 or 2 Children | 188 (86.6%) | 29 (13.4%) |
| 3 or 4 Children | 56 (84.9%) | 10 (15.1%) |
| 5 or more Children | 0 (0.0%) | 0 (0.0%) |
| Total | 561 (93.5%) | 39 (6.5%) |
Income Below Poverty Among Single-Parent Households in Muldrow
According to the poverty data in Muldrow, 27.6% or 21 single-father households and 5.3% or 5 single-mother households are living below the poverty line. Among single-father households, those with no children have the highest poverty rate, with 14 households (51.8%) experiencing poverty. Likewise, among single-mother households, those with no children have the highest poverty rate, with 5 households (9.4%) falling below the poverty line.
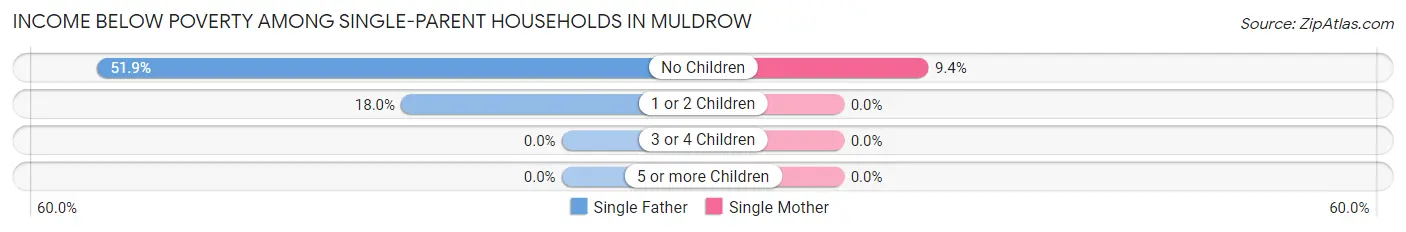
| Children | Single Father | Single Mother |
| No Children | 14 (51.8%) | 5 (9.4%) |
| 1 or 2 Children | 7 (17.9%) | 0 (0.0%) |
| 3 or 4 Children | 0 (0.0%) | 0 (0.0%) |
| 5 or more Children | 0 (0.0%) | 0 (0.0%) |
| Total | 21 (27.6%) | 5 (5.3%) |
Income Below Poverty Among Married-Couple vs Single-Parent Households in Muldrow
The poverty data for Muldrow shows that 39 of the married-couple family households (6.5%) and 26 of the single-parent households (15.2%) are living below the poverty level. Within the married-couple family households, those with 3 or 4 children have the highest poverty rate, with 10 households (15.1%) falling below the poverty line. Among the single-parent households, those with no children have the highest poverty rate, with 19 household (23.7%) living below poverty.
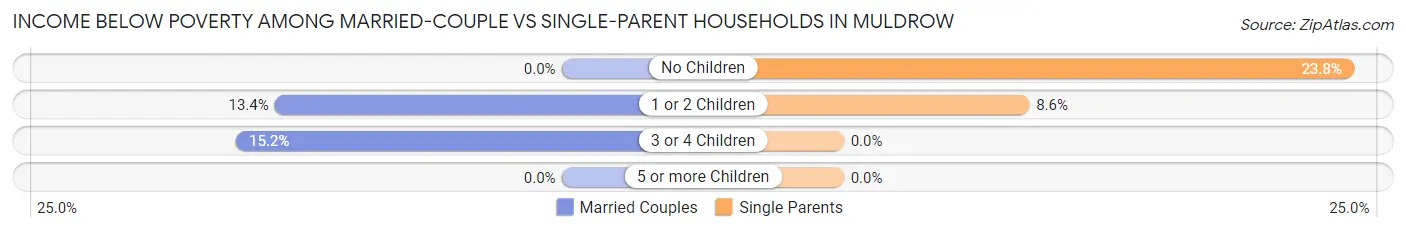
| Children | Married-Couple Families | Single-Parent Households |
| No Children | 0 (0.0%) | 19 (23.7%) |
| 1 or 2 Children | 29 (13.4%) | 7 (8.6%) |
| 3 or 4 Children | 10 (15.1%) | 0 (0.0%) |
| 5 or more Children | 0 (0.0%) | 0 (0.0%) |
| Total | 39 (6.5%) | 26 (15.2%) |
Race in Muldrow
The most populous races in Muldrow are White / Caucasian (2,216 | 67.3%), Two or more Races (503 | 15.3%), and Native / Alaskan (401 | 12.2%).
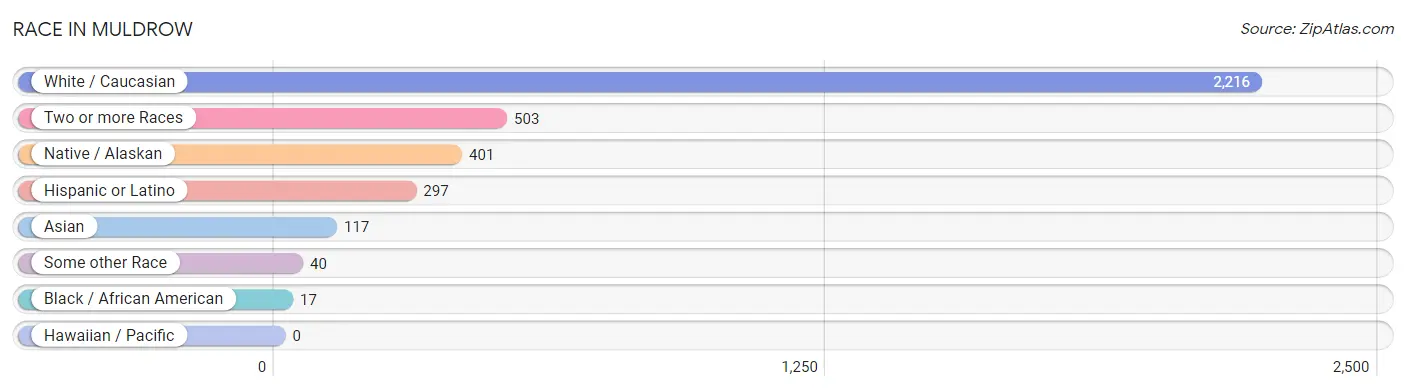
| Race | # Population | % Population |
| Asian | 117 | 3.5% |
| Black / African American | 17 | 0.5% |
| Hawaiian / Pacific | 0 | 0.0% |
| Hispanic or Latino | 297 | 9.0% |
| Native / Alaskan | 401 | 12.2% |
| White / Caucasian | 2,216 | 67.3% |
| Two or more Races | 503 | 15.3% |
| Some other Race | 40 | 1.2% |
| Total | 3,294 | 100.0% |
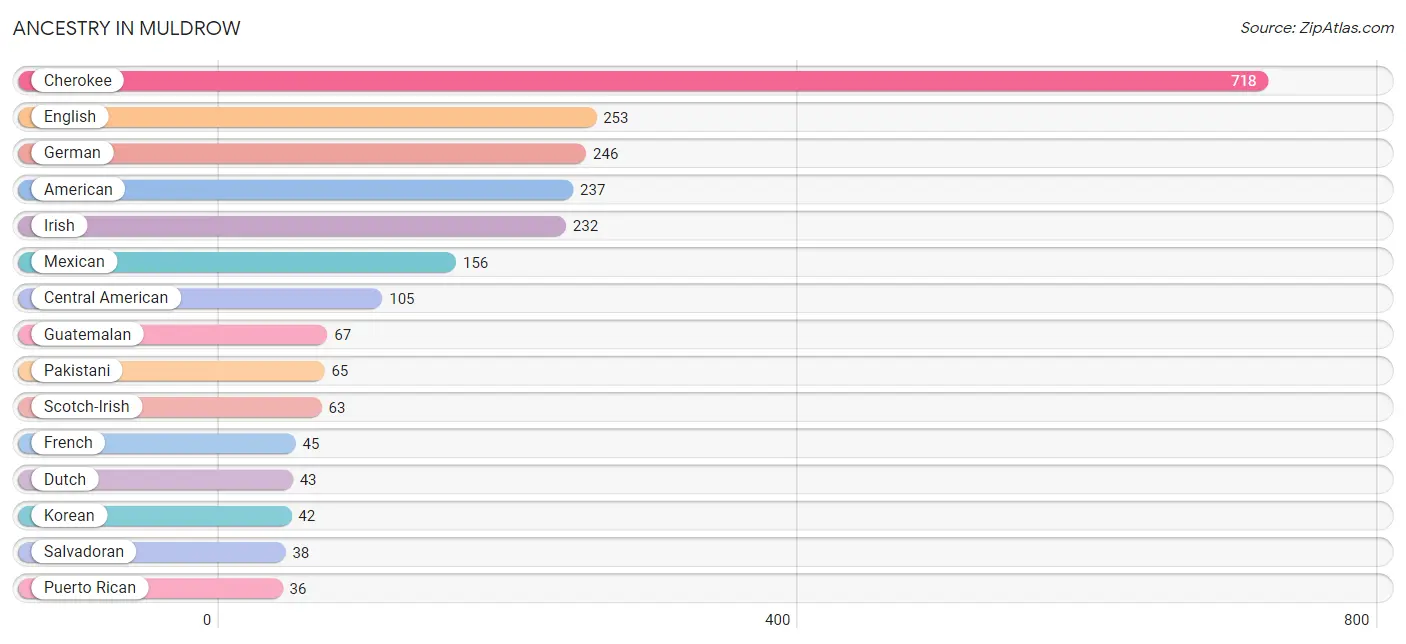
Ancestry in Muldrow
The most populous ancestries reported in Muldrow are Cherokee (718 | 21.8%), English (253 | 7.7%), German (246 | 7.5%), American (237 | 7.2%), and Irish (232 | 7.0%), together accounting for 51.2% of all Muldrow residents.
| Ancestry | # Population | % Population |
| American | 237 | 7.2% |
| Apache | 14 | 0.4% |
| Arab | 19 | 0.6% |
| Austrian | 11 | 0.3% |
| Bhutanese | 13 | 0.4% |
| British | 29 | 0.9% |
| Bulgarian | 19 | 0.6% |
| Central American | 105 | 3.2% |
| Cherokee | 718 | 21.8% |
| Chippewa | 9 | 0.3% |
| Choctaw | 11 | 0.3% |
| Creek | 9 | 0.3% |
| Croatian | 13 | 0.4% |
| Delaware | 28 | 0.9% |
| Dutch | 43 | 1.3% |
| Dutch West Indian | 17 | 0.5% |
| Eastern European | 28 | 0.9% |
| English | 253 | 7.7% |
| French | 45 | 1.4% |
| German | 246 | 7.5% |
| Guatemalan | 67 | 2.0% |
| Irish | 232 | 7.0% |
| Italian | 19 | 0.6% |
| Korean | 42 | 1.3% |
| Mexican | 156 | 4.7% |
| Navajo | 21 | 0.6% |
| Northern European | 9 | 0.3% |
| Norwegian | 19 | 0.6% |
| Pakistani | 65 | 2.0% |
| Polish | 13 | 0.4% |
| Puerto Rican | 36 | 1.1% |
| Salvadoran | 38 | 1.1% |
| Scandinavian | 8 | 0.2% |
| Scotch-Irish | 63 | 1.9% |
| Scottish | 23 | 0.7% |
| Shoshone | 27 | 0.8% |
| Swedish | 26 | 0.8% |
| Welsh | 19 | 0.6% |
| Yugoslavian | 10 | 0.3% | View All 39 Rows |
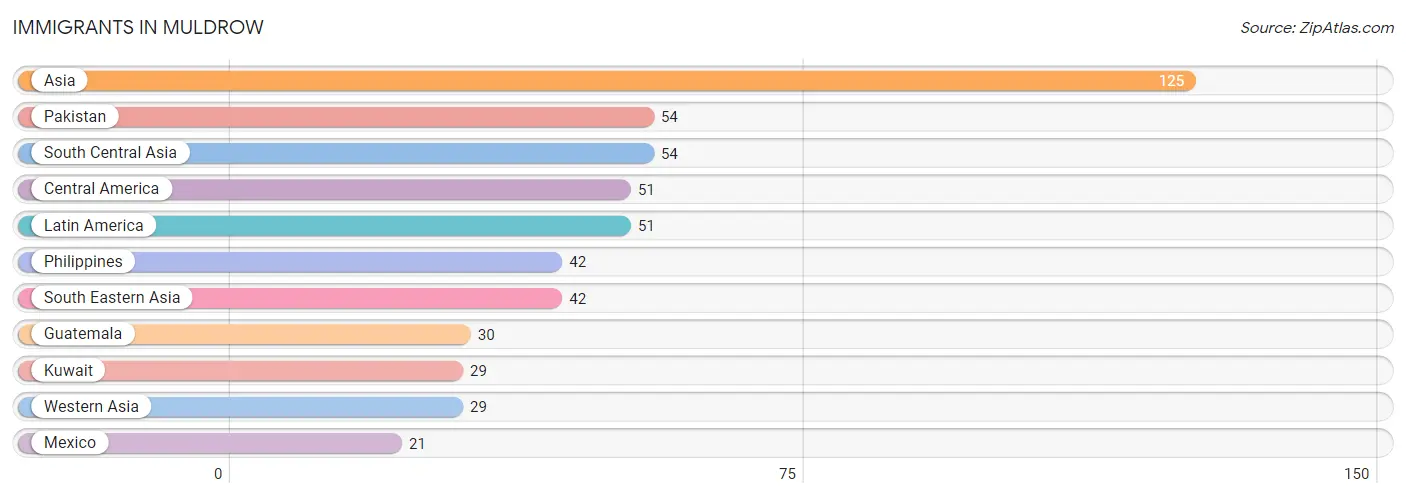
Immigrants in Muldrow
The most numerous immigrant groups reported in Muldrow came from Asia (125 | 3.8%), Pakistan (54 | 1.6%), South Central Asia (54 | 1.6%), Central America (51 | 1.5%), and Latin America (51 | 1.5%), together accounting for 10.2% of all Muldrow residents.
| Immigration Origin | # Population | % Population |
| Asia | 125 | 3.8% |
| Central America | 51 | 1.5% |
| Guatemala | 30 | 0.9% |
| Kuwait | 29 | 0.9% |
| Latin America | 51 | 1.5% |
| Mexico | 21 | 0.6% |
| Pakistan | 54 | 1.6% |
| Philippines | 42 | 1.3% |
| South Central Asia | 54 | 1.6% |
| South Eastern Asia | 42 | 1.3% |
| Western Asia | 29 | 0.9% | View All 11 Rows |
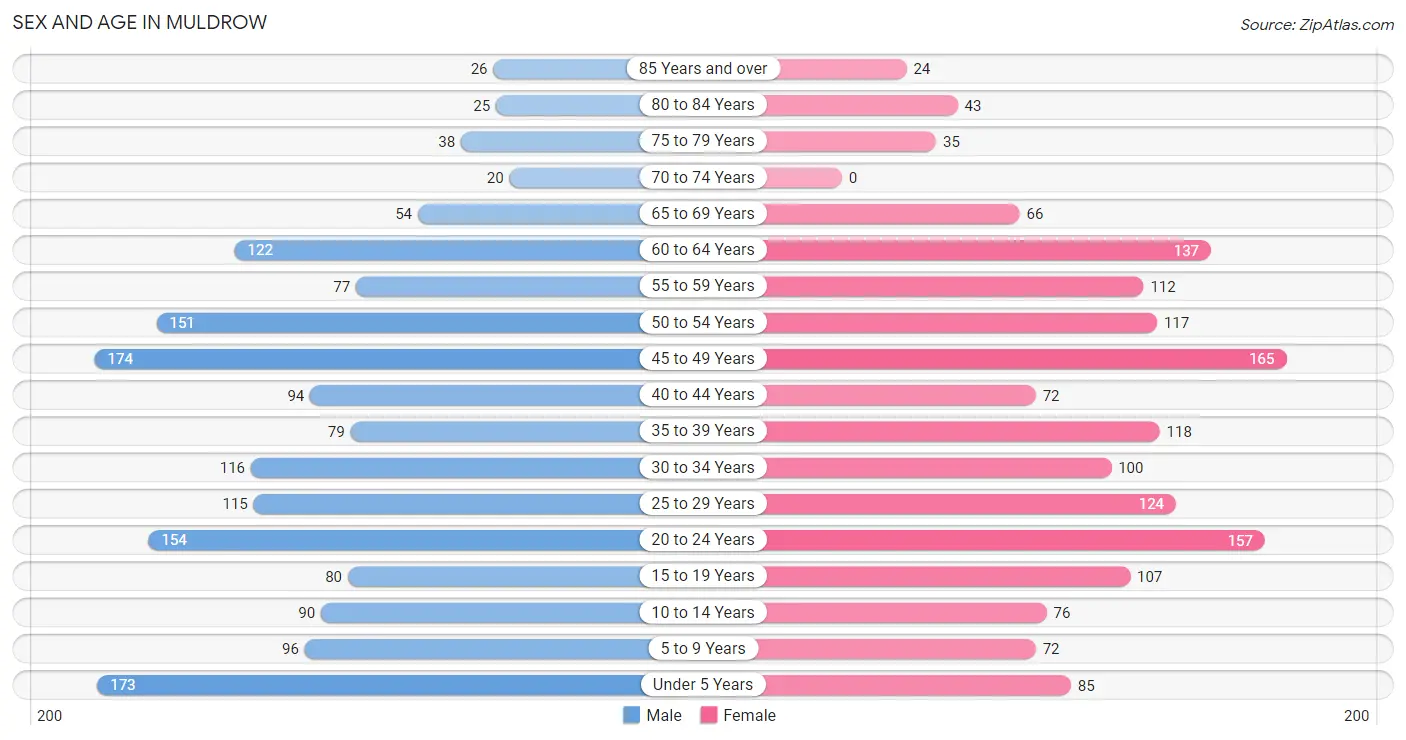
Sex and Age in Muldrow
Sex and Age in Muldrow
The most populous age groups in Muldrow are 45 to 49 Years (174 | 10.3%) for men and 45 to 49 Years (165 | 10.2%) for women.
| Age Bracket | Male | Female |
| Under 5 Years | 173 (10.3%) | 85 (5.3%) |
| 5 to 9 Years | 96 (5.7%) | 72 (4.5%) |
| 10 to 14 Years | 90 (5.3%) | 76 (4.7%) |
| 15 to 19 Years | 80 (4.8%) | 107 (6.7%) |
| 20 to 24 Years | 154 (9.1%) | 157 (9.8%) |
| 25 to 29 Years | 115 (6.8%) | 124 (7.7%) |
| 30 to 34 Years | 116 (6.9%) | 100 (6.2%) |
| 35 to 39 Years | 79 (4.7%) | 118 (7.3%) |
| 40 to 44 Years | 94 (5.6%) | 72 (4.5%) |
| 45 to 49 Years | 174 (10.3%) | 165 (10.2%) |
| 50 to 54 Years | 151 (9.0%) | 117 (7.3%) |
| 55 to 59 Years | 77 (4.6%) | 112 (7.0%) |
| 60 to 64 Years | 122 (7.2%) | 137 (8.5%) |
| 65 to 69 Years | 54 (3.2%) | 66 (4.1%) |
| 70 to 74 Years | 20 (1.2%) | 0 (0.0%) |
| 75 to 79 Years | 38 (2.3%) | 35 (2.2%) |
| 80 to 84 Years | 25 (1.5%) | 43 (2.7%) |
| 85 Years and over | 26 (1.5%) | 24 (1.5%) |
| Total | 1,684 (100.0%) | 1,610 (100.0%) |
Families and Households in Muldrow
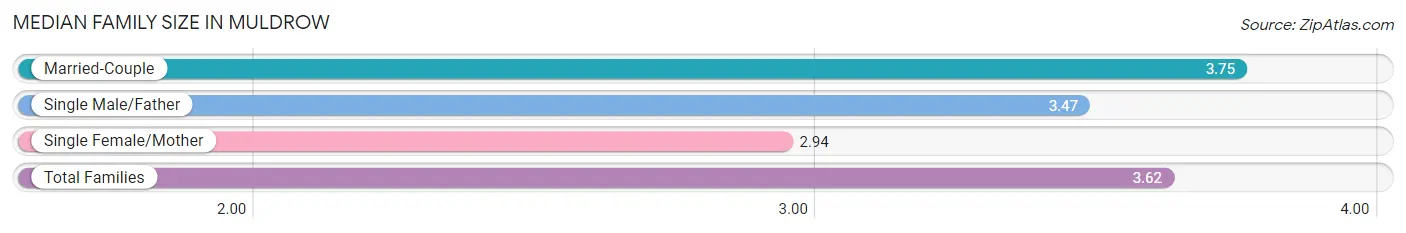
Median Family Size in Muldrow
The median family size in Muldrow is 3.62 persons per family, with married-couple families (600 | 77.8%) accounting for the largest median family size of 3.75 persons per family. On the other hand, single female/mother families (95 | 12.3%) represent the smallest median family size with 2.94 persons per family.
| Family Type | # Families | Family Size |
| Married-Couple | 600 (77.8%) | 3.75 |
| Single Male/Father | 76 (9.9%) | 3.47 |
| Single Female/Mother | 95 (12.3%) | 2.94 |
| Total Families | 771 (100.0%) | 3.62 |
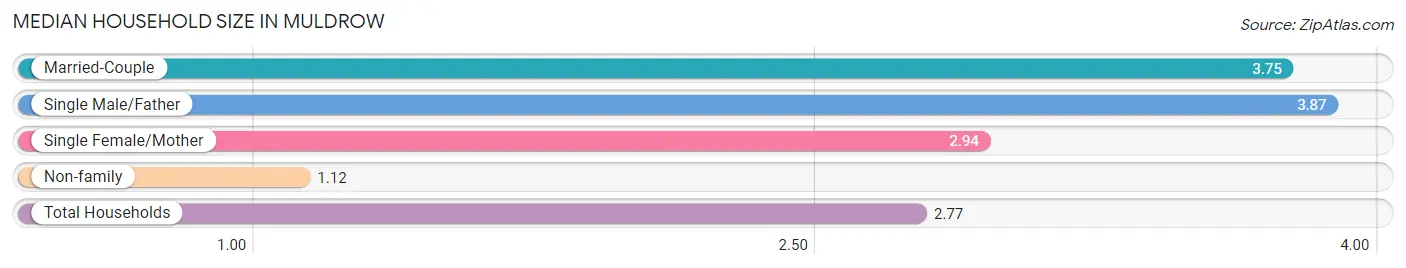
Median Household Size in Muldrow
The median household size in Muldrow is 2.77 persons per household, with single male/father households (76 | 6.4%) accounting for the largest median household size of 3.87 persons per household. non-family households (418 | 35.2%) represent the smallest median household size with 1.12 persons per household.
| Household Type | # Households | Household Size |
| Married-Couple | 600 (50.5%) | 3.75 |
| Single Male/Father | 76 (6.4%) | 3.87 |
| Single Female/Mother | 95 (8.0%) | 2.94 |
| Non-family | 418 (35.2%) | 1.12 |
| Total Households | 1,189 (100.0%) | 2.77 |
Household Size by Marriage Status in Muldrow
Out of a total of 1,189 households in Muldrow, 771 (64.8%) are family households, while 418 (35.2%) are nonfamily households. The most numerous type of family households are 2-person households, comprising 275, and the most common type of nonfamily households are 1-person households, comprising 377.
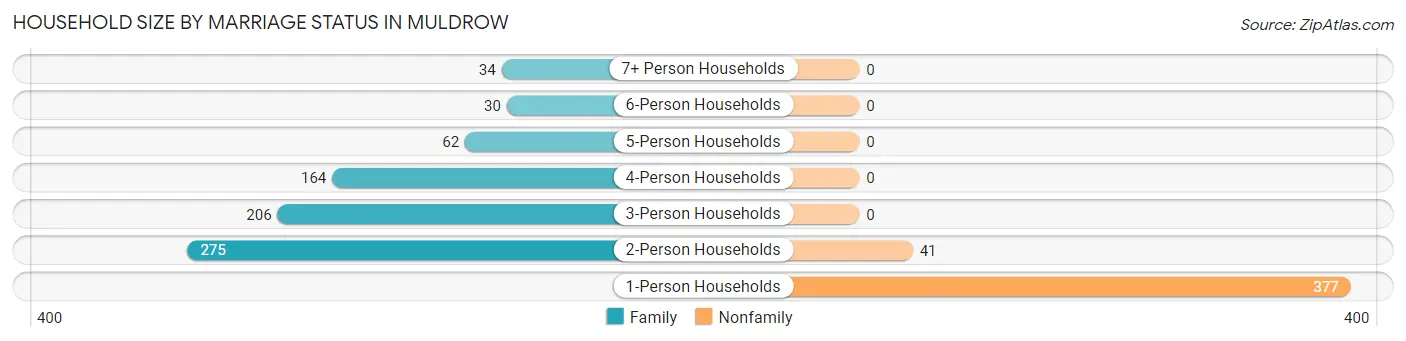
| Household Size | Family Households | Nonfamily Households |
| 1-Person Households | - | 377 (31.7%) |
| 2-Person Households | 275 (23.1%) | 41 (3.5%) |
| 3-Person Households | 206 (17.3%) | 0 (0.0%) |
| 4-Person Households | 164 (13.8%) | 0 (0.0%) |
| 5-Person Households | 62 (5.2%) | 0 (0.0%) |
| 6-Person Households | 30 (2.5%) | 0 (0.0%) |
| 7+ Person Households | 34 (2.9%) | 0 (0.0%) |
| Total | 771 (64.8%) | 418 (35.2%) |
Female Fertility in Muldrow
Fertility by Age in Muldrow
Average fertility rate in Muldrow is 64.0 births per 1,000 women. Women in the age bracket of 20 to 34 years have the highest fertility rate with 94.0 births per 1,000 women. Women in the age bracket of 20 to 34 years acount for 66.7% of all women with births.
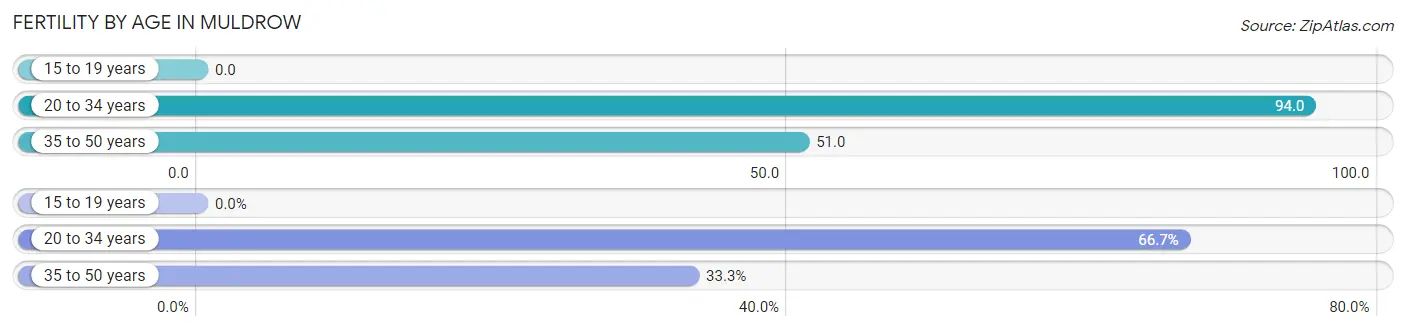
| Age Bracket | Women with Births | Births / 1,000 Women |
| 15 to 19 years | 0 (0.0%) | 0.0 |
| 20 to 34 years | 36 (66.7%) | 94.0 |
| 35 to 50 years | 18 (33.3%) | 51.0 |
| Total | 54 (100.0%) | 64.0 |
Fertility by Age by Marriage Status in Muldrow
74.1% of women with births (54) in Muldrow are married. The highest percentage of unmarried women with births falls into 20 to 34 years age bracket with 38.9% of them unmarried at the time of birth, while the lowest percentage of unmarried women with births belong to 35 to 50 years age bracket with 0.0% of them unmarried.
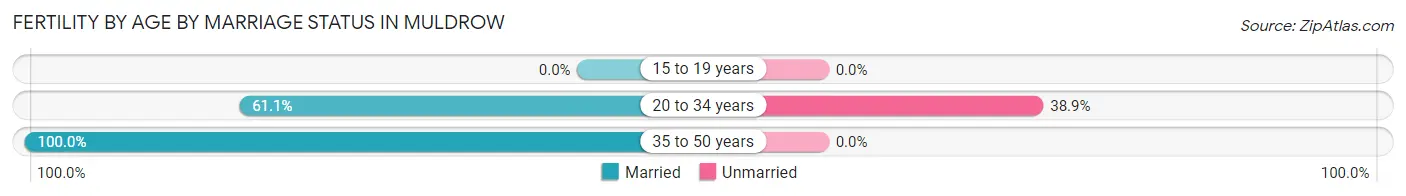
| Age Bracket | Married | Unmarried |
| 15 to 19 years | 0 (0.0%) | 0 (0.0%) |
| 20 to 34 years | 22 (61.1%) | 14 (38.9%) |
| 35 to 50 years | 18 (100.0%) | 0 (0.0%) |
| Total | 40 (74.1%) | 14 (25.9%) |
Fertility by Education in Muldrow
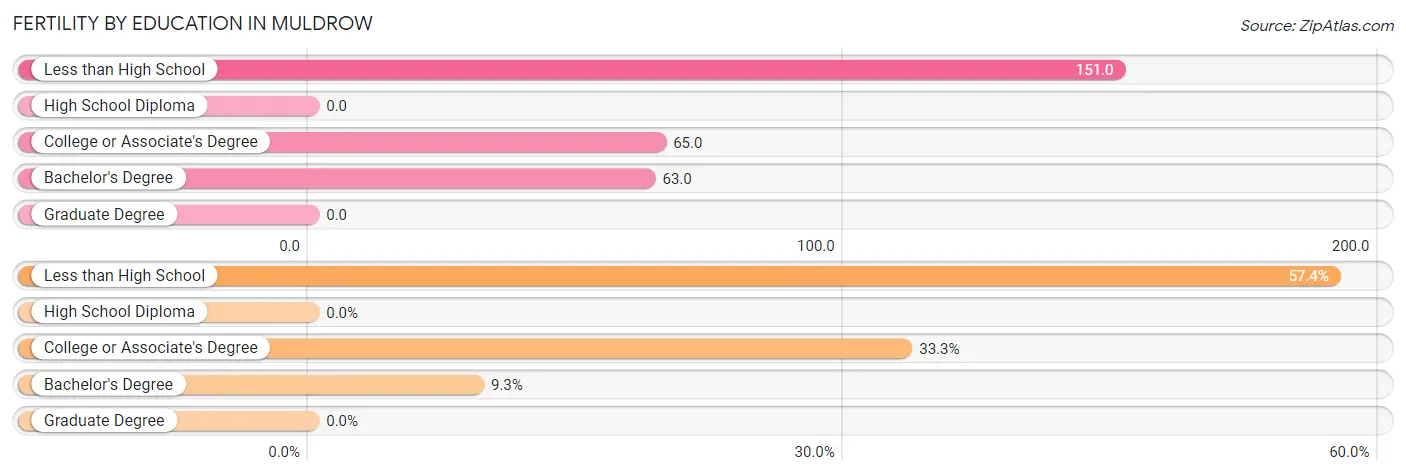
| Educational Attainment | Women with Births | Births / 1,000 Women |
| Less than High School | 31 (57.4%) | 151.0 |
| High School Diploma | 0 (0.0%) | 0.0 |
| College or Associate's Degree | 18 (33.3%) | 65.0 |
| Bachelor's Degree | 5 (9.3%) | 63.0 |
| Graduate Degree | 0 (0.0%) | 0.0 |
| Total | 54 (100.0%) | 64.0 |
Fertility by Education by Marriage Status in Muldrow
25.9% of women with births in Muldrow are unmarried. Women with the educational attainment of college or associate's degree are most likely to be married with 100.0% of them married at childbirth, while women with the educational attainment of bachelor's degree are least likely to be married with 100.0% of them unmarried at childbirth.
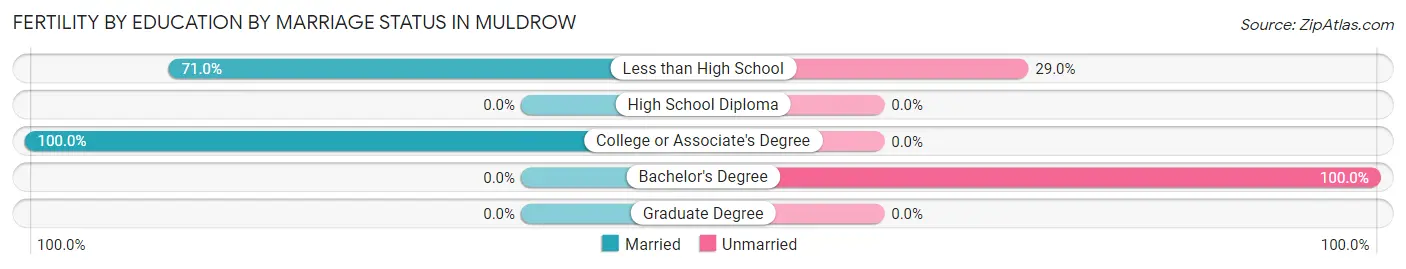
| Educational Attainment | Married | Unmarried |
| Less than High School | 22 (71.0%) | 9 (29.0%) |
| High School Diploma | 0 (0.0%) | 0 (0.0%) |
| College or Associate's Degree | 18 (100.0%) | 0 (0.0%) |
| Bachelor's Degree | 0 (0.0%) | 5 (100.0%) |
| Graduate Degree | 0 (0.0%) | 0 (0.0%) |
| Total | 40 (74.1%) | 14 (25.9%) |
Employment Characteristics in Muldrow
Employment by Class of Employer in Muldrow
Among the 1,363 employed individuals in Muldrow, private company employees (906 | 66.5%), local government employees (183 | 13.4%), and state government employees (110 | 8.1%) make up the most common classes of employment.
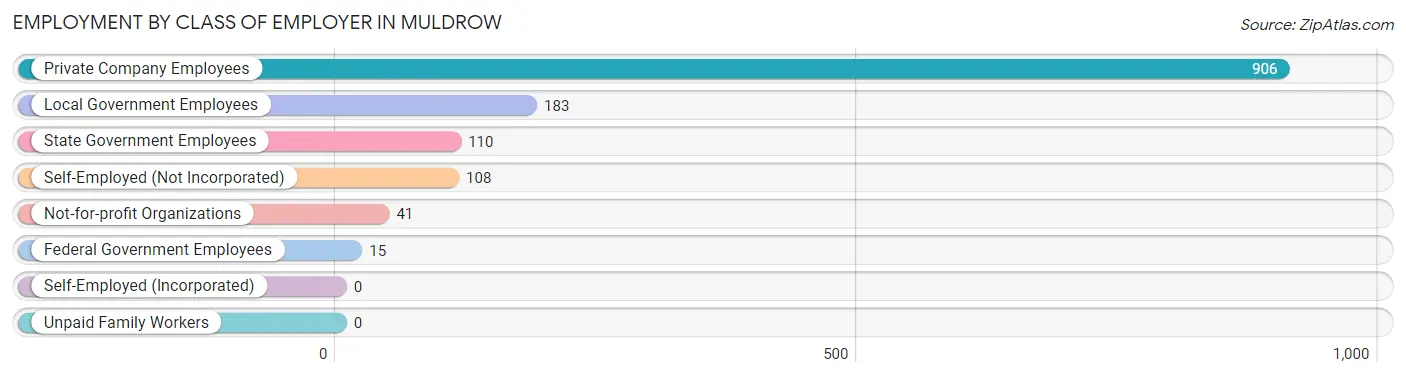
| Employer Class | # Employees | % Employees |
| Private Company Employees | 906 | 66.5% |
| Self-Employed (Incorporated) | 0 | 0.0% |
| Self-Employed (Not Incorporated) | 108 | 7.9% |
| Not-for-profit Organizations | 41 | 3.0% |
| Local Government Employees | 183 | 13.4% |
| State Government Employees | 110 | 8.1% |
| Federal Government Employees | 15 | 1.1% |
| Unpaid Family Workers | 0 | 0.0% |
| Total | 1,363 | 100.0% |
Employment Status by Age in Muldrow
According to the labor force statistics for Muldrow, out of the total population over 16 years of age (2,651), 54.5% or 1,445 individuals are in the labor force, with 4.5% or 65 of them unemployed. The age group with the highest labor force participation rate is 35 to 44 years, with 86.0% or 312 individuals in the labor force. Within the labor force, the 25 to 29 years age range has the highest percentage of unemployed individuals, with 25.2% or 32 of them being unemployed.
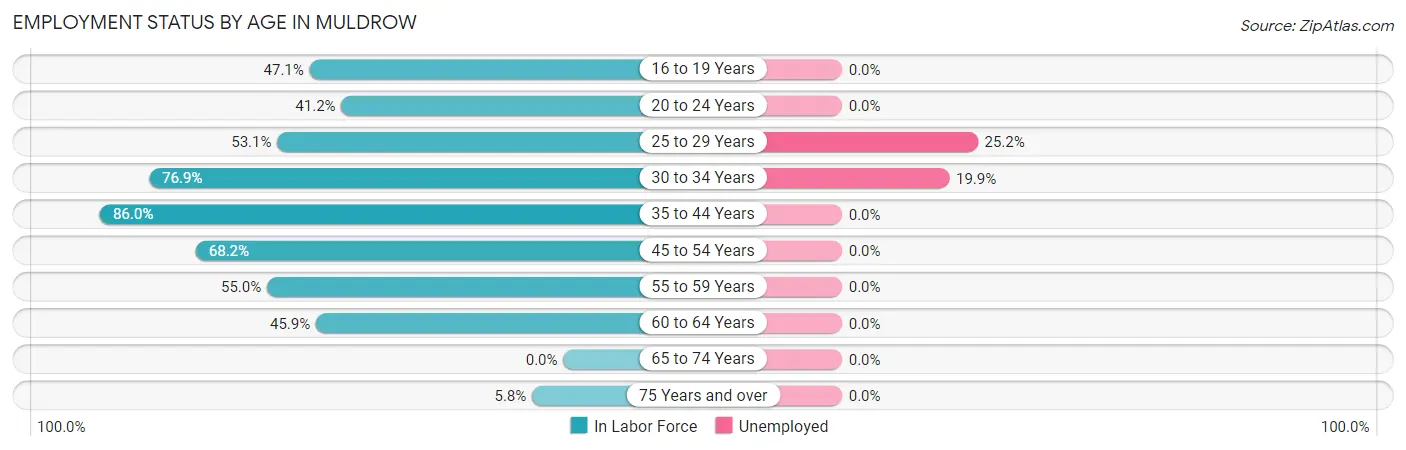
| Age Bracket | In Labor Force | Unemployed |
| 16 to 19 Years | 64 (47.1%) | 0 (0.0%) |
| 20 to 24 Years | 128 (41.2%) | 0 (0.0%) |
| 25 to 29 Years | 127 (53.1%) | 32 (25.2%) |
| 30 to 34 Years | 166 (76.9%) | 33 (19.9%) |
| 35 to 44 Years | 312 (86.0%) | 0 (0.0%) |
| 45 to 54 Years | 414 (68.2%) | 0 (0.0%) |
| 55 to 59 Years | 104 (55.0%) | 0 (0.0%) |
| 60 to 64 Years | 119 (45.9%) | 0 (0.0%) |
| 65 to 74 Years | 0 (0.0%) | 0 (0.0%) |
| 75 Years and over | 11 (5.8%) | 0 (0.0%) |
| Total | 1,445 (54.5%) | 65 (4.5%) |
Employment Status by Educational Attainment in Muldrow
According to labor force statistics for Muldrow, 66.3% of individuals (1,242) out of the total population between 25 and 64 years of age (1,873) are in the labor force, with 5.2% or 65 of them being unemployed. The group with the highest labor force participation rate are those with the educational attainment of college / associate degree, with 77.5% or 575 individuals in the labor force. Within the labor force, individuals with high school diploma education have the highest percentage of unemployment, with 9.5% or 40 of them being unemployed.
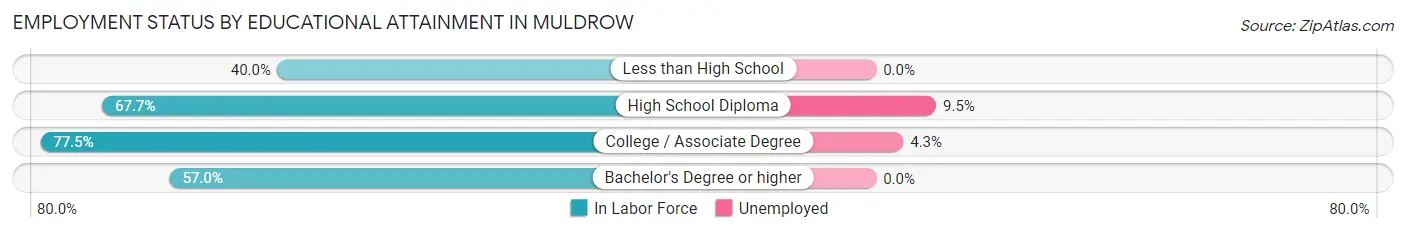
| Educational Attainment | In Labor Force | Unemployed |
| Less than High School | 104 (40.0%) | 0 (0.0%) |
| High School Diploma | 421 (67.7%) | 59 (9.5%) |
| College / Associate Degree | 575 (77.5%) | 32 (4.3%) |
| Bachelor's Degree or higher | 142 (57.0%) | 0 (0.0%) |
| Total | 1,242 (66.3%) | 97 (5.2%) |
Employment Occupations by Sex in Muldrow
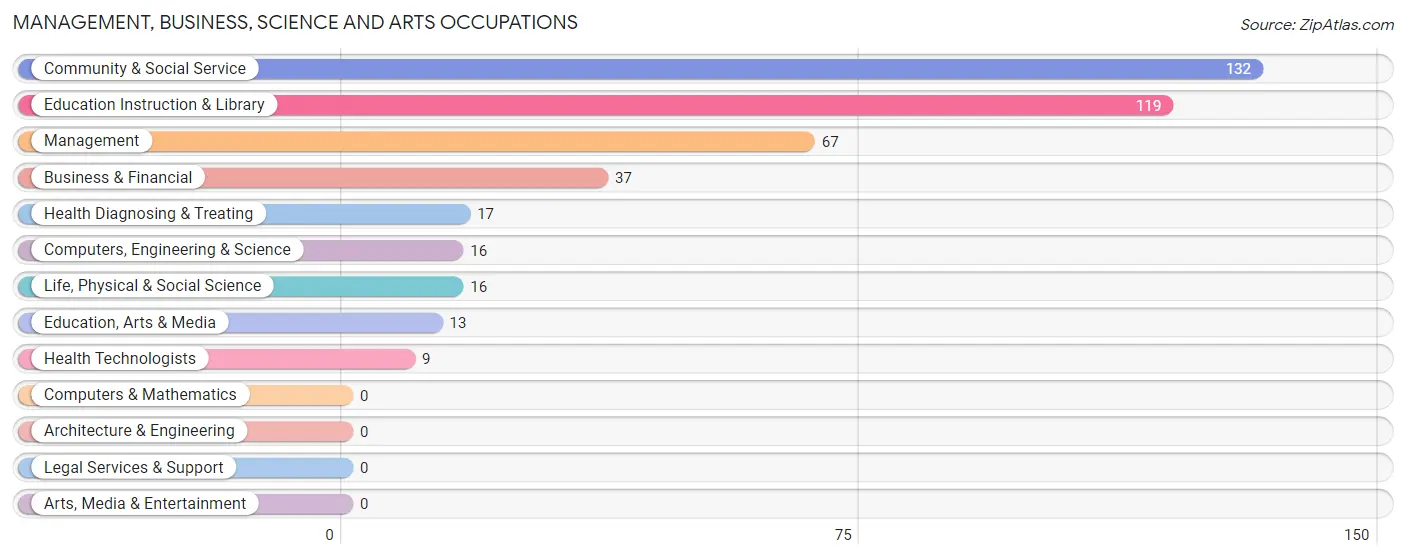
Management, Business, Science and Arts Occupations
The most common Management, Business, Science and Arts occupations in Muldrow are Community & Social Service (132 | 9.6%), Education Instruction & Library (119 | 8.6%), Management (67 | 4.9%), Business & Financial (37 | 2.7%), and Health Diagnosing & Treating (17 | 1.2%).
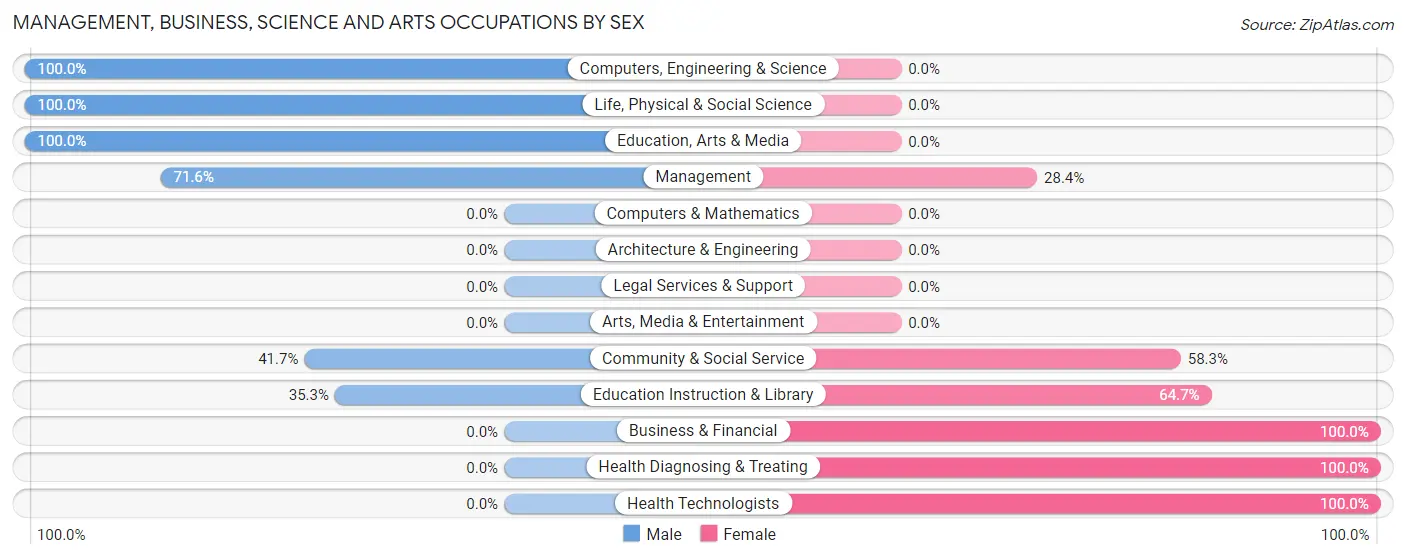
Management, Business, Science and Arts Occupations by Sex
Within the Management, Business, Science and Arts occupations in Muldrow, the most male-oriented occupations are Computers, Engineering & Science (100.0%), Life, Physical & Social Science (100.0%), and Education, Arts & Media (100.0%), while the most female-oriented occupations are Business & Financial (100.0%), Health Diagnosing & Treating (100.0%), and Health Technologists (100.0%).
| Occupation | Male | Female |
| Management | 48 (71.6%) | 19 (28.4%) |
| Business & Financial | 0 (0.0%) | 37 (100.0%) |
| Computers, Engineering & Science | 16 (100.0%) | 0 (0.0%) |
| Computers & Mathematics | 0 (0.0%) | 0 (0.0%) |
| Architecture & Engineering | 0 (0.0%) | 0 (0.0%) |
| Life, Physical & Social Science | 16 (100.0%) | 0 (0.0%) |
| Community & Social Service | 55 (41.7%) | 77 (58.3%) |
| Education, Arts & Media | 13 (100.0%) | 0 (0.0%) |
| Legal Services & Support | 0 (0.0%) | 0 (0.0%) |
| Education Instruction & Library | 42 (35.3%) | 77 (64.7%) |
| Arts, Media & Entertainment | 0 (0.0%) | 0 (0.0%) |
| Health Diagnosing & Treating | 0 (0.0%) | 17 (100.0%) |
| Health Technologists | 0 (0.0%) | 9 (100.0%) |
| Total (Category) | 119 (44.2%) | 150 (55.8%) |
| Total (Overall) | 746 (54.1%) | 634 (45.9%) |
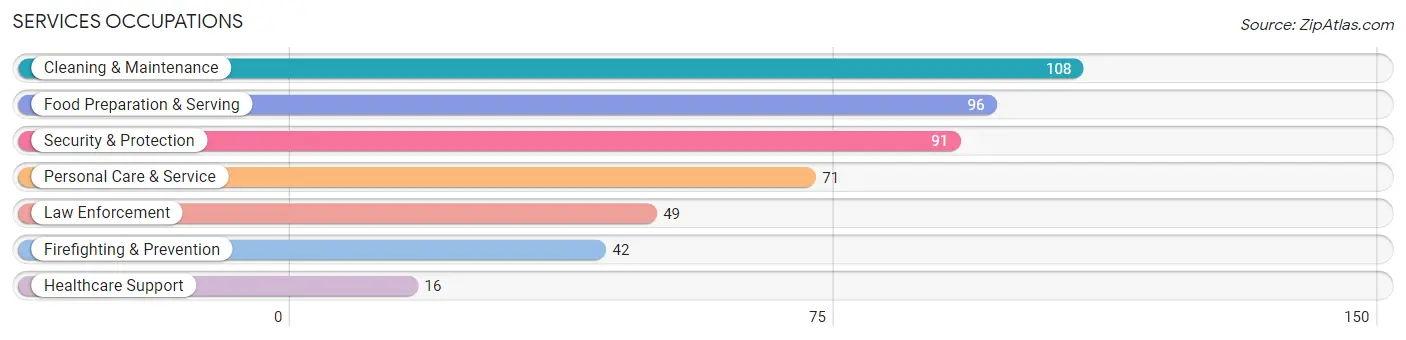
Services Occupations
The most common Services occupations in Muldrow are Cleaning & Maintenance (108 | 7.8%), Food Preparation & Serving (96 | 7.0%), Security & Protection (91 | 6.6%), Personal Care & Service (71 | 5.1%), and Law Enforcement (49 | 3.5%).
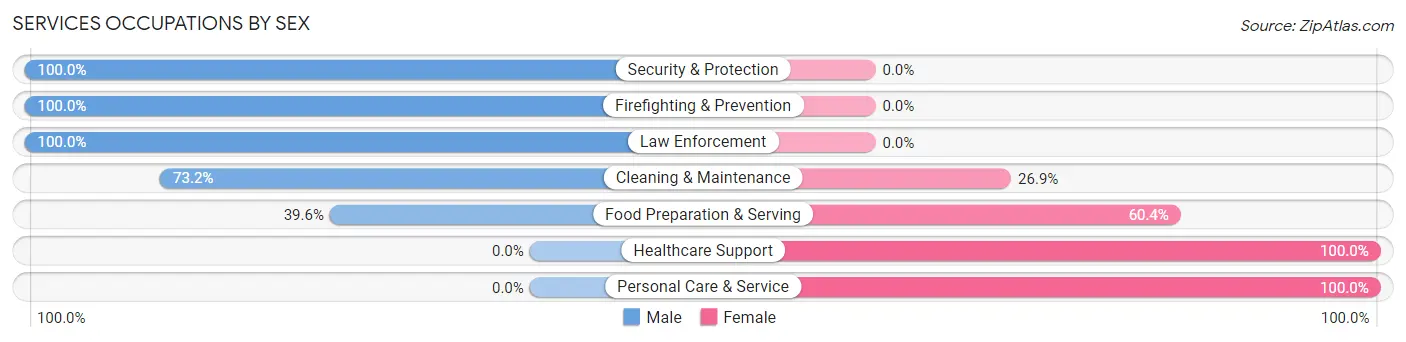
Services Occupations by Sex
Within the Services occupations in Muldrow, the most male-oriented occupations are Security & Protection (100.0%), Firefighting & Prevention (100.0%), and Law Enforcement (100.0%), while the most female-oriented occupations are Healthcare Support (100.0%), Personal Care & Service (100.0%), and Food Preparation & Serving (60.4%).
| Occupation | Male | Female |
| Healthcare Support | 0 (0.0%) | 16 (100.0%) |
| Security & Protection | 91 (100.0%) | 0 (0.0%) |
| Firefighting & Prevention | 42 (100.0%) | 0 (0.0%) |
| Law Enforcement | 49 (100.0%) | 0 (0.0%) |
| Food Preparation & Serving | 38 (39.6%) | 58 (60.4%) |
| Cleaning & Maintenance | 79 (73.2%) | 29 (26.9%) |
| Personal Care & Service | 0 (0.0%) | 71 (100.0%) |
| Total (Category) | 208 (54.4%) | 174 (45.6%) |
| Total (Overall) | 746 (54.1%) | 634 (45.9%) |
Sales and Office Occupations
The most common Sales and Office occupations in Muldrow are Sales & Related (196 | 14.2%), and Office & Administration (95 | 6.9%).
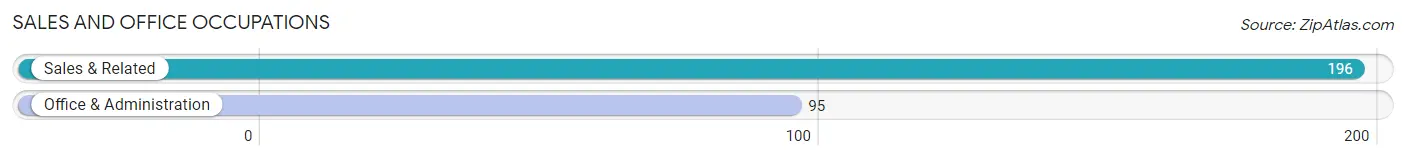
Sales and Office Occupations by Sex

| Occupation | Male | Female |
| Sales & Related | 101 (51.5%) | 95 (48.5%) |
| Office & Administration | 0 (0.0%) | 95 (100.0%) |
| Total (Category) | 101 (34.7%) | 190 (65.3%) |
| Total (Overall) | 746 (54.1%) | 634 (45.9%) |
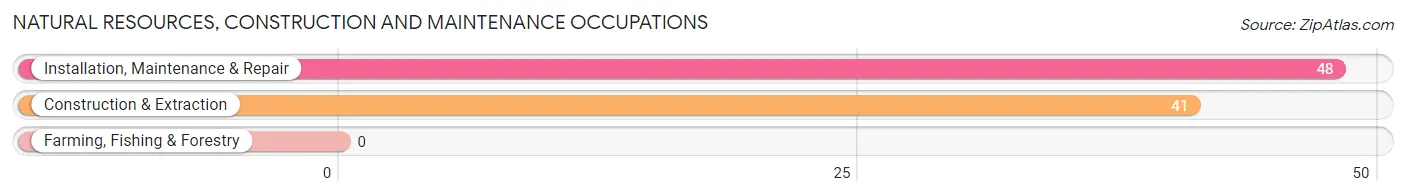
Natural Resources, Construction and Maintenance Occupations
The most common Natural Resources, Construction and Maintenance occupations in Muldrow are Installation, Maintenance & Repair (48 | 3.5%), and Construction & Extraction (41 | 3.0%).
Natural Resources, Construction and Maintenance Occupations by Sex
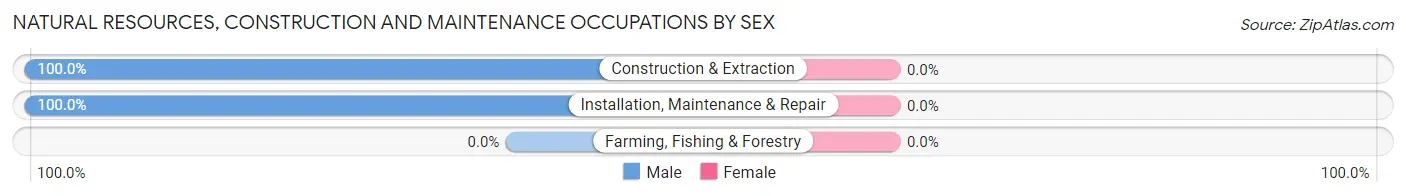
| Occupation | Male | Female |
| Farming, Fishing & Forestry | 0 (0.0%) | 0 (0.0%) |
| Construction & Extraction | 41 (100.0%) | 0 (0.0%) |
| Installation, Maintenance & Repair | 48 (100.0%) | 0 (0.0%) |
| Total (Category) | 89 (100.0%) | 0 (0.0%) |
| Total (Overall) | 746 (54.1%) | 634 (45.9%) |
Production, Transportation and Moving Occupations
The most common Production, Transportation and Moving occupations in Muldrow are Production (240 | 17.4%), Transportation (60 | 4.3%), and Material Moving (49 | 3.5%).
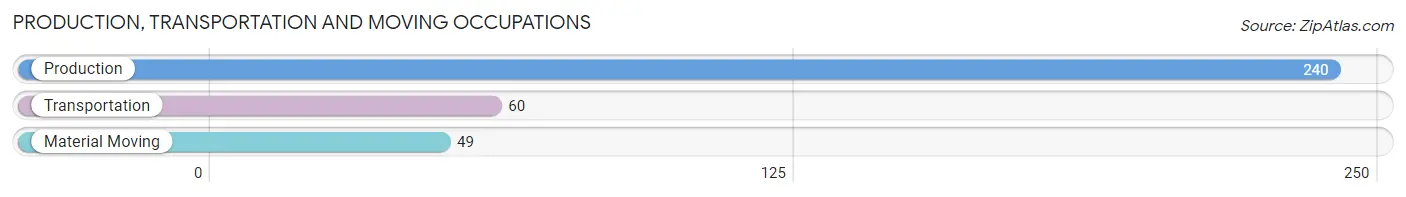
Production, Transportation and Moving Occupations by Sex
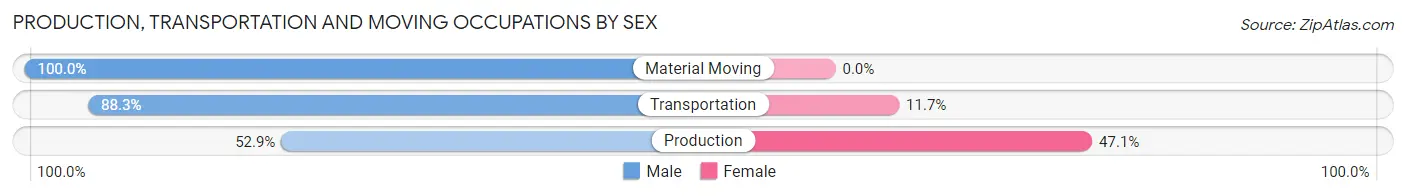
| Occupation | Male | Female |
| Production | 127 (52.9%) | 113 (47.1%) |
| Transportation | 53 (88.3%) | 7 (11.7%) |
| Material Moving | 49 (100.0%) | 0 (0.0%) |
| Total (Category) | 229 (65.6%) | 120 (34.4%) |
| Total (Overall) | 746 (54.1%) | 634 (45.9%) |
Employment Industries by Sex in Muldrow
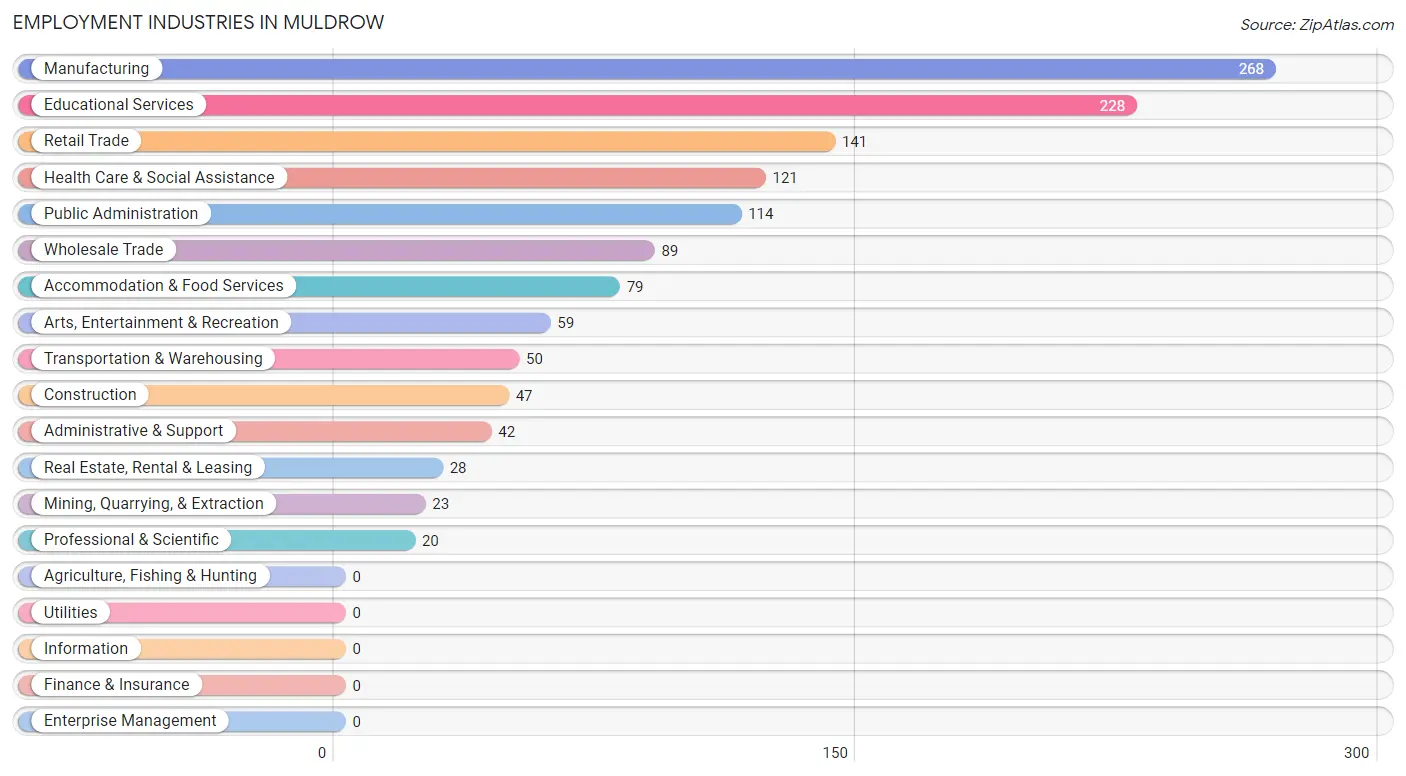
Employment Industries in Muldrow
The major employment industries in Muldrow include Manufacturing (268 | 19.4%), Educational Services (228 | 16.5%), Retail Trade (141 | 10.2%), Health Care & Social Assistance (121 | 8.8%), and Public Administration (114 | 8.3%).
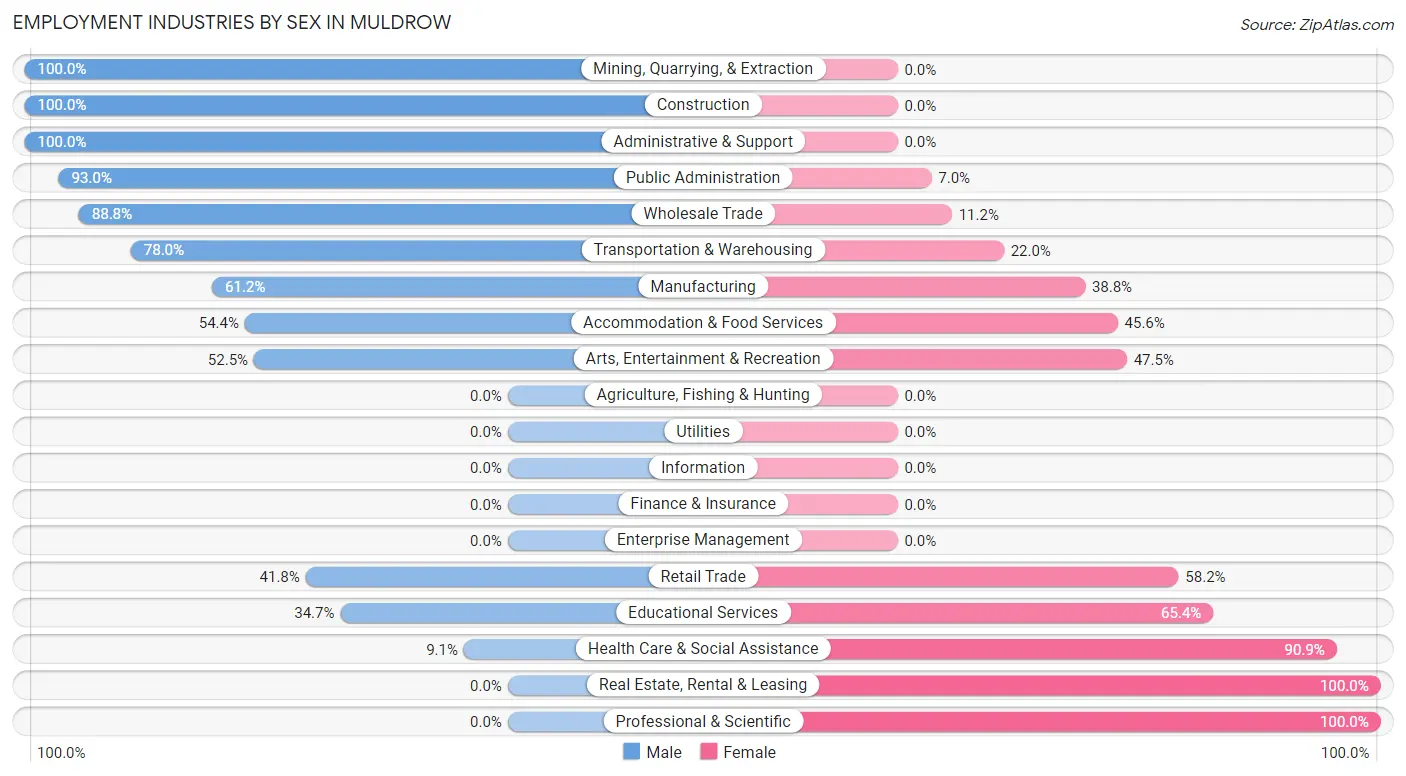
Employment Industries by Sex in Muldrow
The Muldrow industries that see more men than women are Mining, Quarrying, & Extraction (100.0%), Construction (100.0%), and Administrative & Support (100.0%), whereas the industries that tend to have a higher number of women are Real Estate, Rental & Leasing (100.0%), Professional & Scientific (100.0%), and Health Care & Social Assistance (90.9%).
| Industry | Male | Female |
| Agriculture, Fishing & Hunting | 0 (0.0%) | 0 (0.0%) |
| Mining, Quarrying, & Extraction | 23 (100.0%) | 0 (0.0%) |
| Construction | 47 (100.0%) | 0 (0.0%) |
| Manufacturing | 164 (61.2%) | 104 (38.8%) |
| Wholesale Trade | 79 (88.8%) | 10 (11.2%) |
| Retail Trade | 59 (41.8%) | 82 (58.2%) |
| Transportation & Warehousing | 39 (78.0%) | 11 (22.0%) |
| Utilities | 0 (0.0%) | 0 (0.0%) |
| Information | 0 (0.0%) | 0 (0.0%) |
| Finance & Insurance | 0 (0.0%) | 0 (0.0%) |
| Real Estate, Rental & Leasing | 0 (0.0%) | 28 (100.0%) |
| Professional & Scientific | 0 (0.0%) | 20 (100.0%) |
| Enterprise Management | 0 (0.0%) | 0 (0.0%) |
| Administrative & Support | 42 (100.0%) | 0 (0.0%) |
| Educational Services | 79 (34.6%) | 149 (65.3%) |
| Health Care & Social Assistance | 11 (9.1%) | 110 (90.9%) |
| Arts, Entertainment & Recreation | 31 (52.5%) | 28 (47.5%) |
| Accommodation & Food Services | 43 (54.4%) | 36 (45.6%) |
| Public Administration | 106 (93.0%) | 8 (7.0%) |
| Total | 746 (54.1%) | 634 (45.9%) |
Education in Muldrow
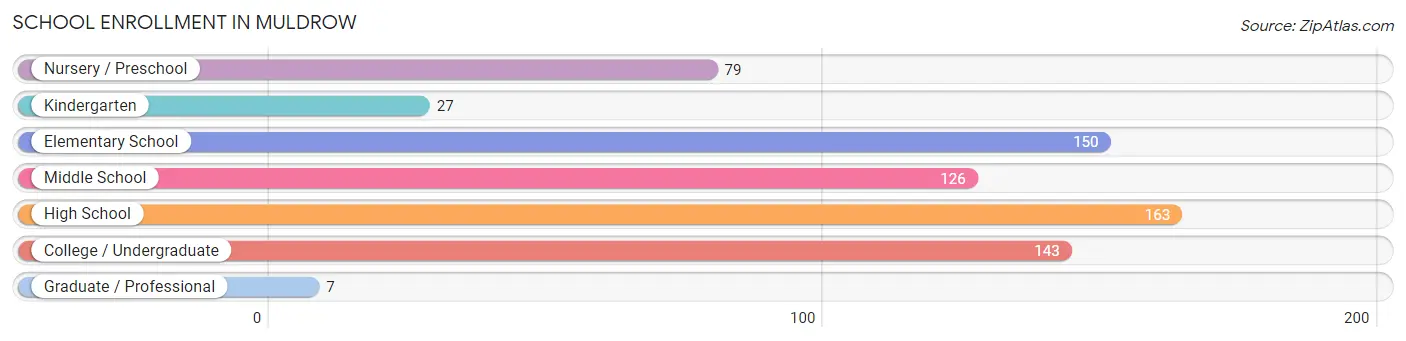
School Enrollment in Muldrow
The most common levels of schooling among the 695 students in Muldrow are high school (163 | 23.4%), elementary school (150 | 21.6%), and college / undergraduate (143 | 20.6%).
| School Level | # Students | % Students |
| Nursery / Preschool | 79 | 11.4% |
| Kindergarten | 27 | 3.9% |
| Elementary School | 150 | 21.6% |
| Middle School | 126 | 18.1% |
| High School | 163 | 23.4% |
| College / Undergraduate | 143 | 20.6% |
| Graduate / Professional | 7 | 1.0% |
| Total | 695 | 100.0% |
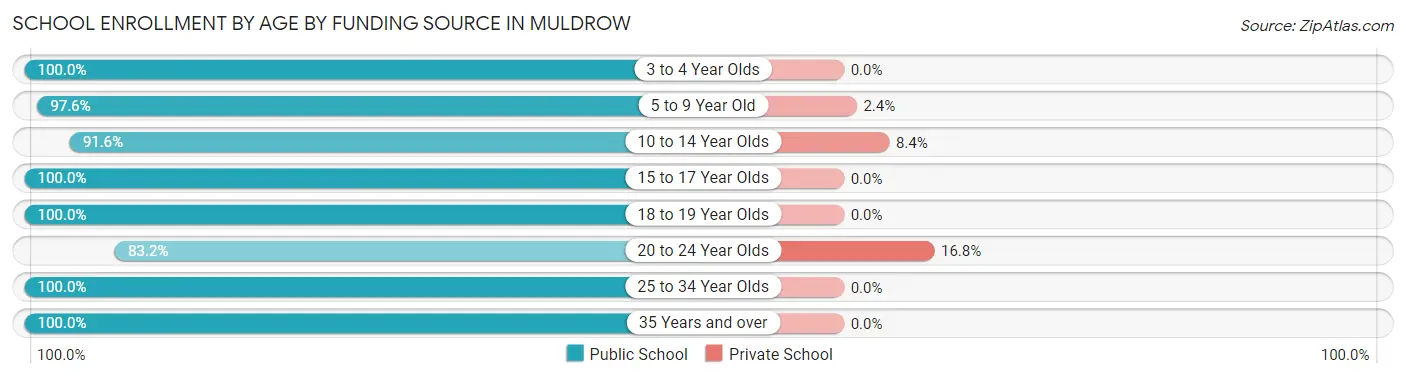
School Enrollment by Age by Funding Source in Muldrow
Out of a total of 695 students who are enrolled in schools in Muldrow, 34 (4.9%) attend a private institution, while the remaining 661 (95.1%) are enrolled in public schools. The age group of 20 to 24 year olds has the highest likelihood of being enrolled in private schools, with 16 (16.8% in the age bracket) enrolled. Conversely, the age group of 3 to 4 year olds has the lowest likelihood of being enrolled in a private school, with 79 (100.0% in the age bracket) attending a public institution.
| Age Bracket | Public School | Private School |
| 3 to 4 Year Olds | 79 (100.0%) | 0 (0.0%) |
| 5 to 9 Year Old | 164 (97.6%) | 4 (2.4%) |
| 10 to 14 Year Olds | 152 (91.6%) | 14 (8.4%) |
| 15 to 17 Year Olds | 110 (100.0%) | 0 (0.0%) |
| 18 to 19 Year Olds | 42 (100.0%) | 0 (0.0%) |
| 20 to 24 Year Olds | 79 (83.2%) | 16 (16.8%) |
| 25 to 34 Year Olds | 13 (100.0%) | 0 (0.0%) |
| 35 Years and over | 22 (100.0%) | 0 (0.0%) |
| Total | 661 (95.1%) | 34 (4.9%) |
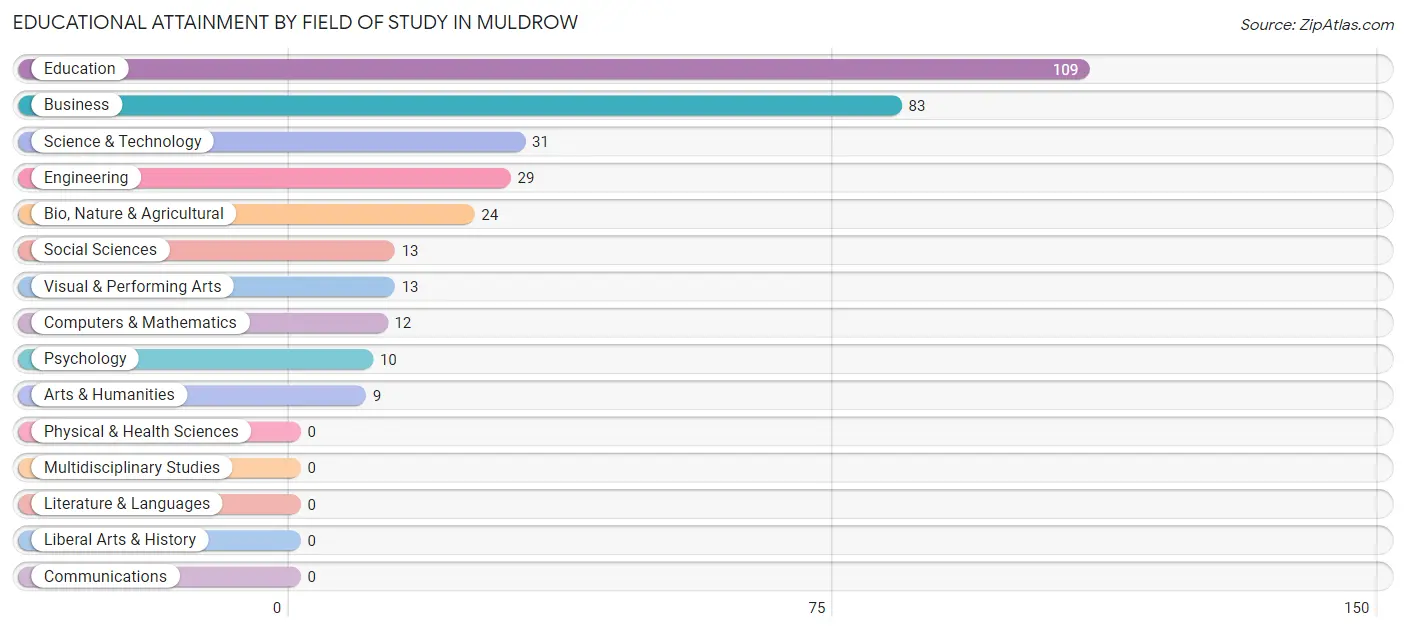
Educational Attainment by Field of Study in Muldrow
Education (109 | 32.7%), business (83 | 24.9%), science & technology (31 | 9.3%), engineering (29 | 8.7%), and bio, nature & agricultural (24 | 7.2%) are the most common fields of study among 333 individuals in Muldrow who have obtained a bachelor's degree or higher.
| Field of Study | # Graduates | % Graduates |
| Computers & Mathematics | 12 | 3.6% |
| Bio, Nature & Agricultural | 24 | 7.2% |
| Physical & Health Sciences | 0 | 0.0% |
| Psychology | 10 | 3.0% |
| Social Sciences | 13 | 3.9% |
| Engineering | 29 | 8.7% |
| Multidisciplinary Studies | 0 | 0.0% |
| Science & Technology | 31 | 9.3% |
| Business | 83 | 24.9% |
| Education | 109 | 32.7% |
| Literature & Languages | 0 | 0.0% |
| Liberal Arts & History | 0 | 0.0% |
| Visual & Performing Arts | 13 | 3.9% |
| Communications | 0 | 0.0% |
| Arts & Humanities | 9 | 2.7% |
| Total | 333 | 100.0% |
Transportation & Commute in Muldrow
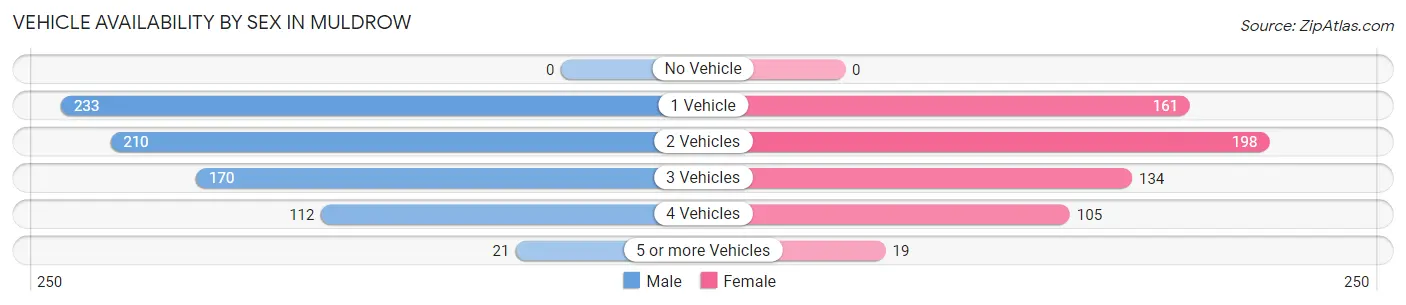
Vehicle Availability by Sex in Muldrow
The most prevalent vehicle ownership categories in Muldrow are males with 1 vehicle (233, accounting for 31.2%) and females with 1 vehicle (161, making up 37.8%).
| Vehicles Available | Male | Female |
| No Vehicle | 0 (0.0%) | 0 (0.0%) |
| 1 Vehicle | 233 (31.2%) | 161 (26.1%) |
| 2 Vehicles | 210 (28.1%) | 198 (32.1%) |
| 3 Vehicles | 170 (22.8%) | 134 (21.7%) |
| 4 Vehicles | 112 (15.0%) | 105 (17.0%) |
| 5 or more Vehicles | 21 (2.8%) | 19 (3.1%) |
| Total | 746 (100.0%) | 617 (100.0%) |
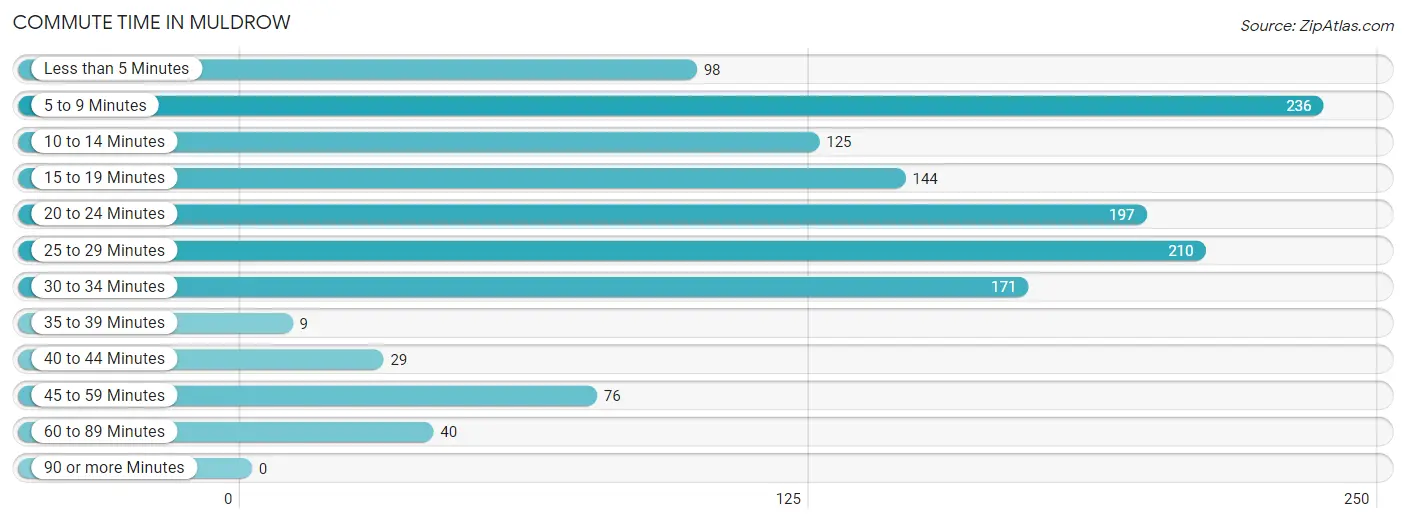
Commute Time in Muldrow
The most frequently occuring commute durations in Muldrow are 5 to 9 minutes (236 commuters, 17.7%), 25 to 29 minutes (210 commuters, 15.7%), and 20 to 24 minutes (197 commuters, 14.8%).
| Commute Time | # Commuters | % Commuters |
| Less than 5 Minutes | 98 | 7.3% |
| 5 to 9 Minutes | 236 | 17.7% |
| 10 to 14 Minutes | 125 | 9.4% |
| 15 to 19 Minutes | 144 | 10.8% |
| 20 to 24 Minutes | 197 | 14.8% |
| 25 to 29 Minutes | 210 | 15.7% |
| 30 to 34 Minutes | 171 | 12.8% |
| 35 to 39 Minutes | 9 | 0.7% |
| 40 to 44 Minutes | 29 | 2.2% |
| 45 to 59 Minutes | 76 | 5.7% |
| 60 to 89 Minutes | 40 | 3.0% |
| 90 or more Minutes | 0 | 0.0% |
Commute Time by Sex in Muldrow
The most common commute times in Muldrow are 25 to 29 minutes (145 commuters, 19.8%) for males and 30 to 34 minutes (130 commuters, 21.6%) for females.
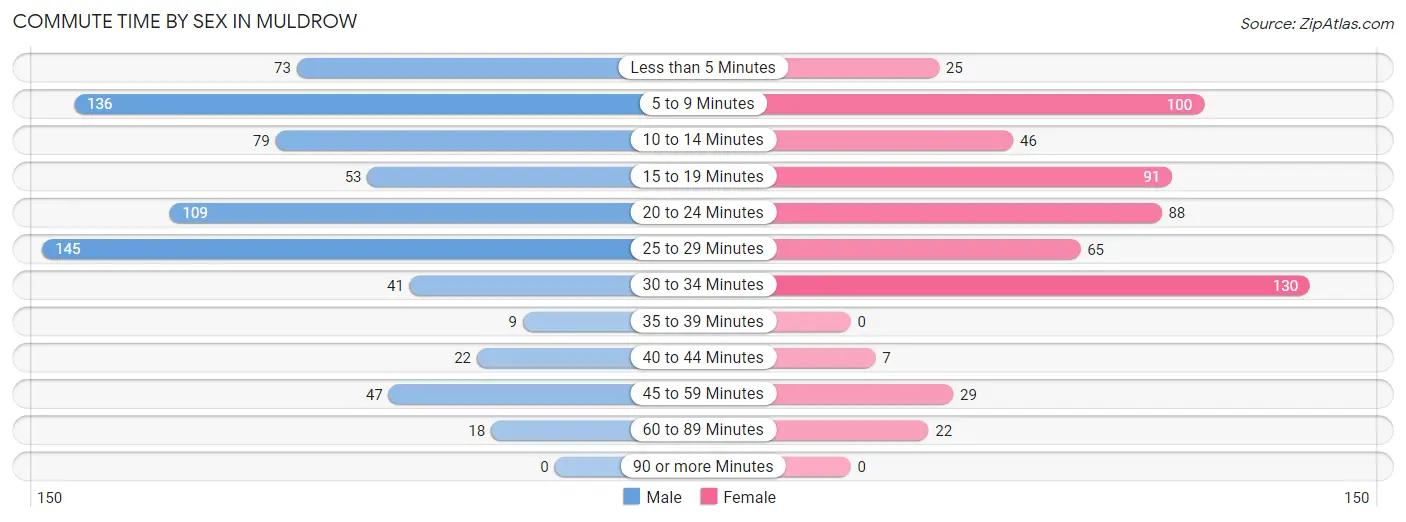
| Commute Time | Male | Female |
| Less than 5 Minutes | 73 (10.0%) | 25 (4.2%) |
| 5 to 9 Minutes | 136 (18.6%) | 100 (16.6%) |
| 10 to 14 Minutes | 79 (10.8%) | 46 (7.6%) |
| 15 to 19 Minutes | 53 (7.2%) | 91 (15.1%) |
| 20 to 24 Minutes | 109 (14.9%) | 88 (14.6%) |
| 25 to 29 Minutes | 145 (19.8%) | 65 (10.8%) |
| 30 to 34 Minutes | 41 (5.6%) | 130 (21.6%) |
| 35 to 39 Minutes | 9 (1.2%) | 0 (0.0%) |
| 40 to 44 Minutes | 22 (3.0%) | 7 (1.2%) |
| 45 to 59 Minutes | 47 (6.4%) | 29 (4.8%) |
| 60 to 89 Minutes | 18 (2.5%) | 22 (3.6%) |
| 90 or more Minutes | 0 (0.0%) | 0 (0.0%) |
Time of Departure to Work by Sex in Muldrow
The most frequent times of departure to work in Muldrow are 7:30 AM to 7:59 AM (186, 25.4%) for males and 7:00 AM to 7:29 AM (210, 34.8%) for females.
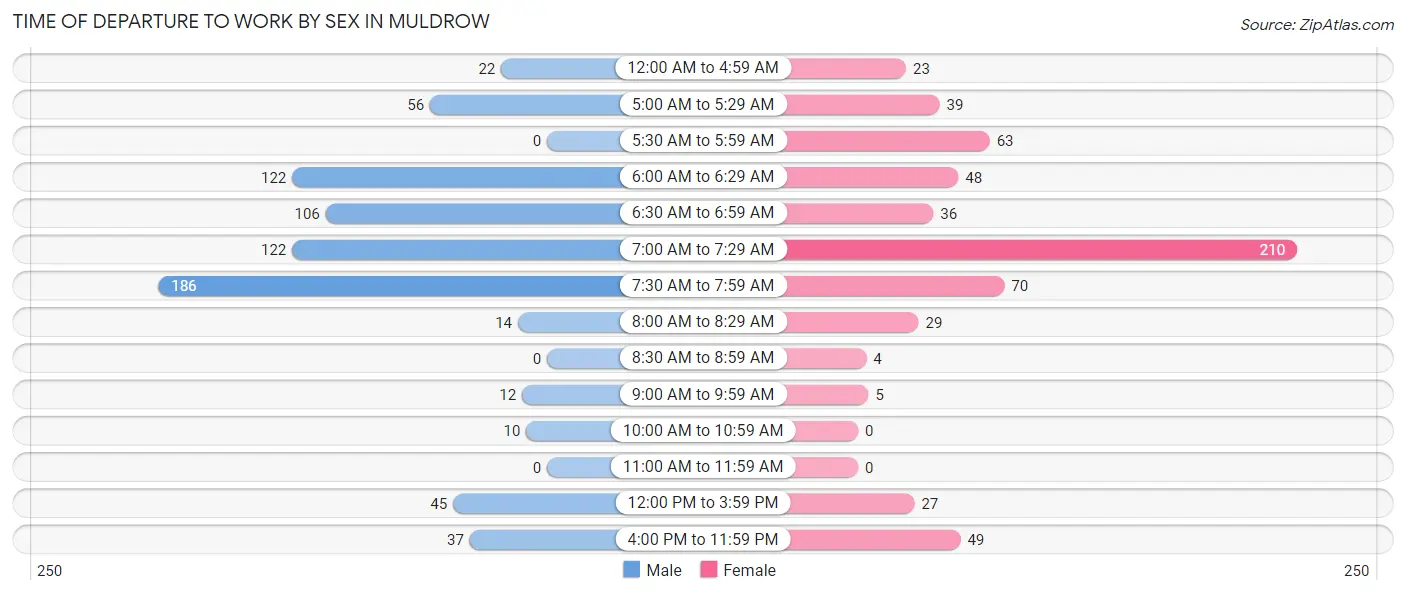
| Time of Departure | Male | Female |
| 12:00 AM to 4:59 AM | 22 (3.0%) | 23 (3.8%) |
| 5:00 AM to 5:29 AM | 56 (7.6%) | 39 (6.5%) |
| 5:30 AM to 5:59 AM | 0 (0.0%) | 63 (10.4%) |
| 6:00 AM to 6:29 AM | 122 (16.7%) | 48 (8.0%) |
| 6:30 AM to 6:59 AM | 106 (14.5%) | 36 (6.0%) |
| 7:00 AM to 7:29 AM | 122 (16.7%) | 210 (34.8%) |
| 7:30 AM to 7:59 AM | 186 (25.4%) | 70 (11.6%) |
| 8:00 AM to 8:29 AM | 14 (1.9%) | 29 (4.8%) |
| 8:30 AM to 8:59 AM | 0 (0.0%) | 4 (0.7%) |
| 9:00 AM to 9:59 AM | 12 (1.6%) | 5 (0.8%) |
| 10:00 AM to 10:59 AM | 10 (1.4%) | 0 (0.0%) |
| 11:00 AM to 11:59 AM | 0 (0.0%) | 0 (0.0%) |
| 12:00 PM to 3:59 PM | 45 (6.1%) | 27 (4.5%) |
| 4:00 PM to 11:59 PM | 37 (5.1%) | 49 (8.1%) |
| Total | 732 (100.0%) | 603 (100.0%) |
Housing Occupancy in Muldrow
Occupancy by Ownership in Muldrow
Of the total 1,189 dwellings in Muldrow, owner-occupied units account for 825 (69.4%), while renter-occupied units make up 364 (30.6%).
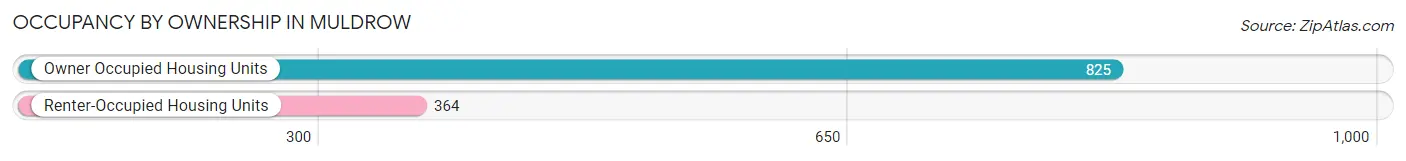
| Occupancy | # Housing Units | % Housing Units |
| Owner Occupied Housing Units | 825 | 69.4% |
| Renter-Occupied Housing Units | 364 | 30.6% |
| Total Occupied Housing Units | 1,189 | 100.0% |
Occupancy by Household Size in Muldrow
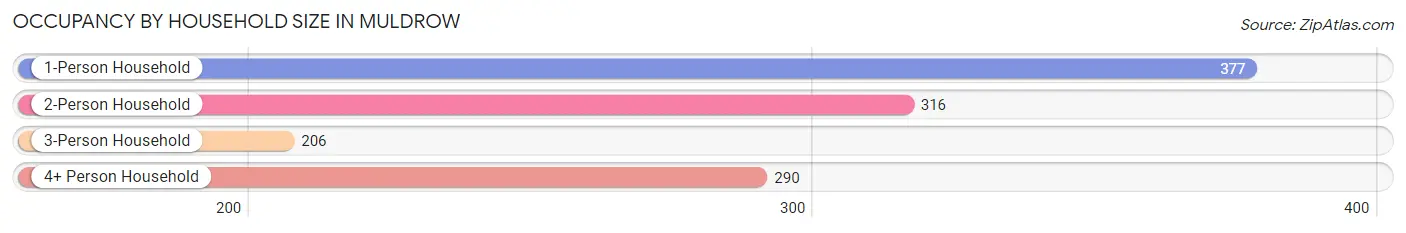
| Household Size | # Housing Units | % Housing Units |
| 1-Person Household | 377 | 31.7% |
| 2-Person Household | 316 | 26.6% |
| 3-Person Household | 206 | 17.3% |
| 4+ Person Household | 290 | 24.4% |
| Total Housing Units | 1,189 | 100.0% |
Occupancy by Ownership by Household Size in Muldrow
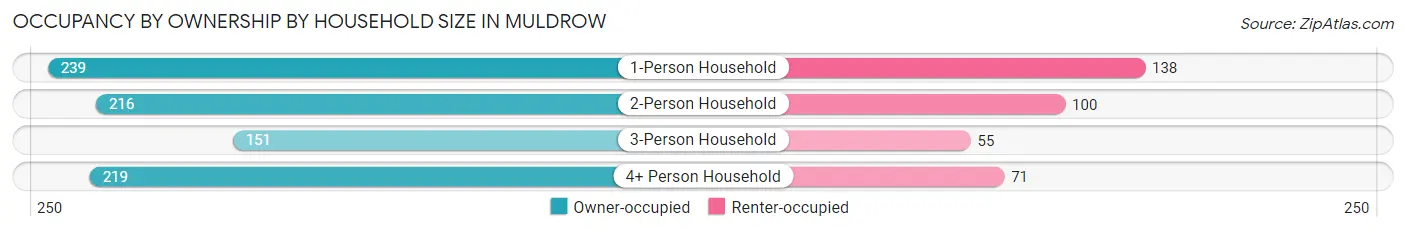
| Household Size | Owner-occupied | Renter-occupied |
| 1-Person Household | 239 (63.4%) | 138 (36.6%) |
| 2-Person Household | 216 (68.3%) | 100 (31.7%) |
| 3-Person Household | 151 (73.3%) | 55 (26.7%) |
| 4+ Person Household | 219 (75.5%) | 71 (24.5%) |
| Total Housing Units | 825 (69.4%) | 364 (30.6%) |
Occupancy by Educational Attainment in Muldrow
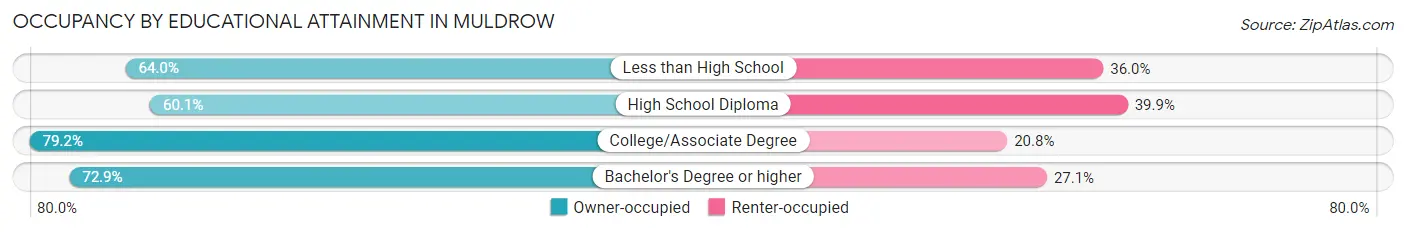
| Household Size | Owner-occupied | Renter-occupied |
| Less than High School | 119 (64.0%) | 67 (36.0%) |
| High School Diploma | 238 (60.1%) | 158 (39.9%) |
| College/Associate Degree | 320 (79.2%) | 84 (20.8%) |
| Bachelor's Degree or higher | 148 (72.9%) | 55 (27.1%) |
Occupancy by Age of Householder in Muldrow
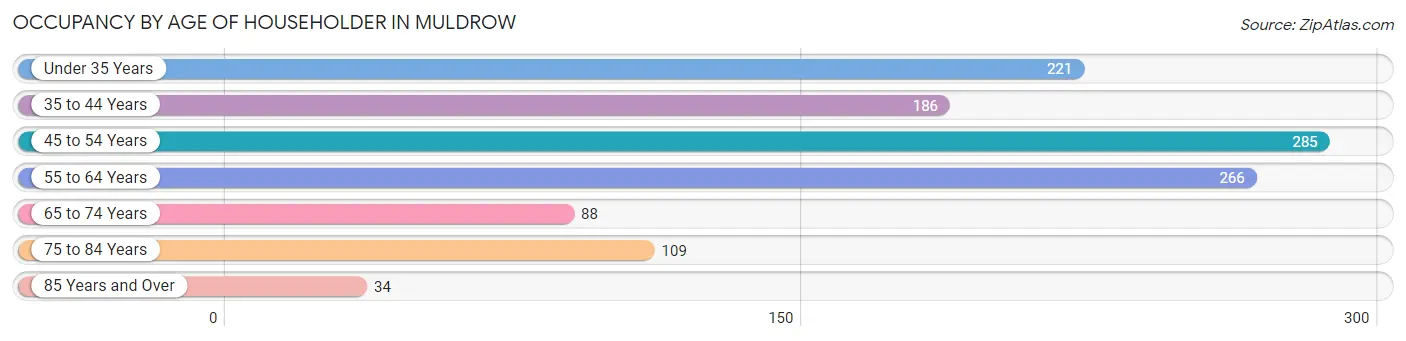
| Age Bracket | # Households | % Households |
| Under 35 Years | 221 | 18.6% |
| 35 to 44 Years | 186 | 15.6% |
| 45 to 54 Years | 285 | 24.0% |
| 55 to 64 Years | 266 | 22.4% |
| 65 to 74 Years | 88 | 7.4% |
| 75 to 84 Years | 109 | 9.2% |
| 85 Years and Over | 34 | 2.9% |
| Total | 1,189 | 100.0% |
Housing Finances in Muldrow
Median Income by Occupancy in Muldrow
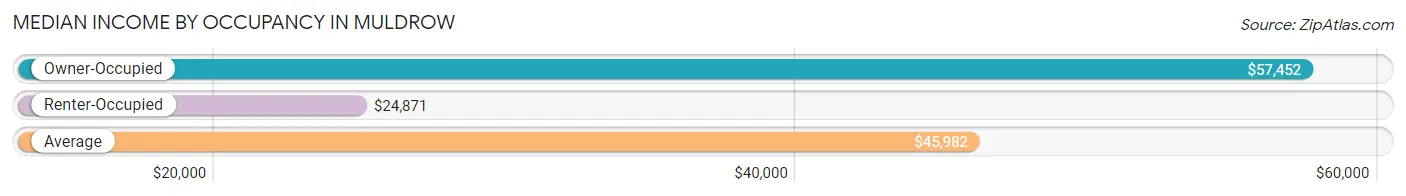
| Occupancy Type | # Households | Median Income |
| Owner-Occupied | 825 (69.4%) | $57,452 |
| Renter-Occupied | 364 (30.6%) | $24,871 |
| Average | 1,189 (100.0%) | $45,982 |
Occupancy by Householder Income Bracket in Muldrow
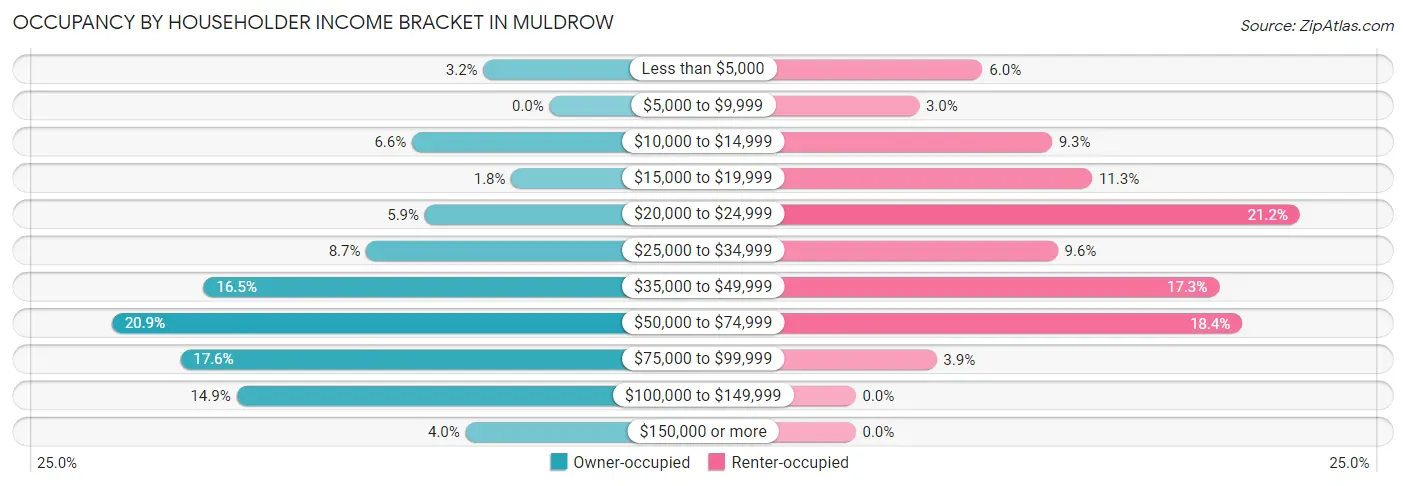
| Income Bracket | Owner-occupied | Renter-occupied |
| Less than $5,000 | 26 (3.2%) | 22 (6.0%) |
| $5,000 to $9,999 | 0 (0.0%) | 11 (3.0%) |
| $10,000 to $14,999 | 54 (6.6%) | 34 (9.3%) |
| $15,000 to $19,999 | 15 (1.8%) | 41 (11.3%) |
| $20,000 to $24,999 | 49 (5.9%) | 77 (21.1%) |
| $25,000 to $34,999 | 72 (8.7%) | 35 (9.6%) |
| $35,000 to $49,999 | 136 (16.5%) | 63 (17.3%) |
| $50,000 to $74,999 | 172 (20.8%) | 67 (18.4%) |
| $75,000 to $99,999 | 145 (17.6%) | 14 (3.8%) |
| $100,000 to $149,999 | 123 (14.9%) | 0 (0.0%) |
| $150,000 or more | 33 (4.0%) | 0 (0.0%) |
| Total | 825 (100.0%) | 364 (100.0%) |
Monthly Housing Cost Tiers in Muldrow
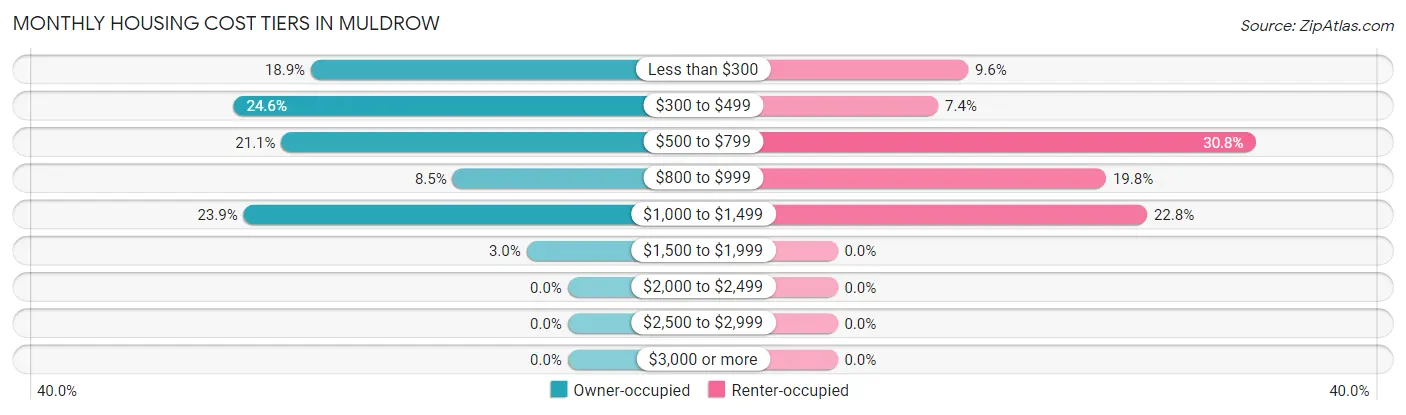
| Monthly Cost | Owner-occupied | Renter-occupied |
| Less than $300 | 156 (18.9%) | 35 (9.6%) |
| $300 to $499 | 203 (24.6%) | 27 (7.4%) |
| $500 to $799 | 174 (21.1%) | 112 (30.8%) |
| $800 to $999 | 70 (8.5%) | 72 (19.8%) |
| $1,000 to $1,499 | 197 (23.9%) | 83 (22.8%) |
| $1,500 to $1,999 | 25 (3.0%) | 0 (0.0%) |
| $2,000 to $2,499 | 0 (0.0%) | 0 (0.0%) |
| $2,500 to $2,999 | 0 (0.0%) | 0 (0.0%) |
| $3,000 or more | 0 (0.0%) | 0 (0.0%) |
| Total | 825 (100.0%) | 364 (100.0%) |
Physical Housing Characteristics in Muldrow
Housing Structures in Muldrow
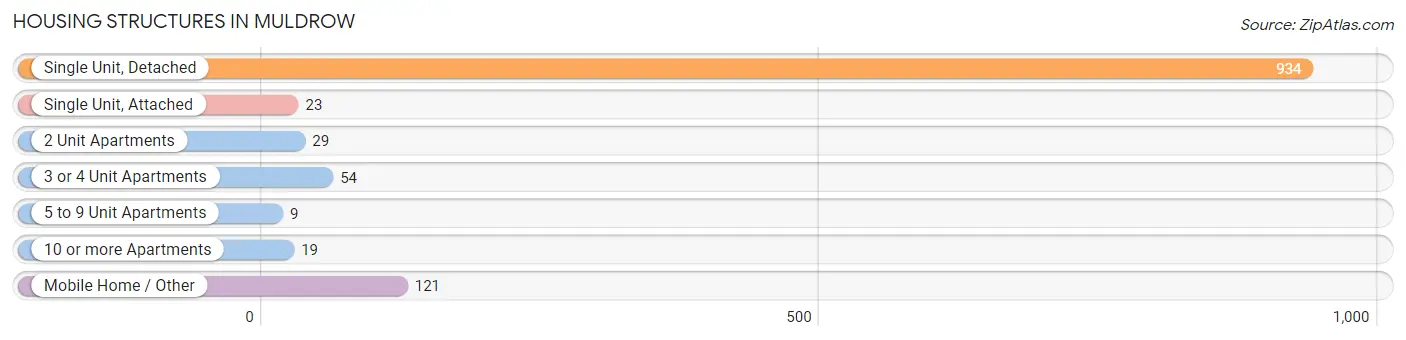
| Structure Type | # Housing Units | % Housing Units |
| Single Unit, Detached | 934 | 78.5% |
| Single Unit, Attached | 23 | 1.9% |
| 2 Unit Apartments | 29 | 2.4% |
| 3 or 4 Unit Apartments | 54 | 4.5% |
| 5 to 9 Unit Apartments | 9 | 0.8% |
| 10 or more Apartments | 19 | 1.6% |
| Mobile Home / Other | 121 | 10.2% |
| Total | 1,189 | 100.0% |
Housing Structures by Occupancy in Muldrow
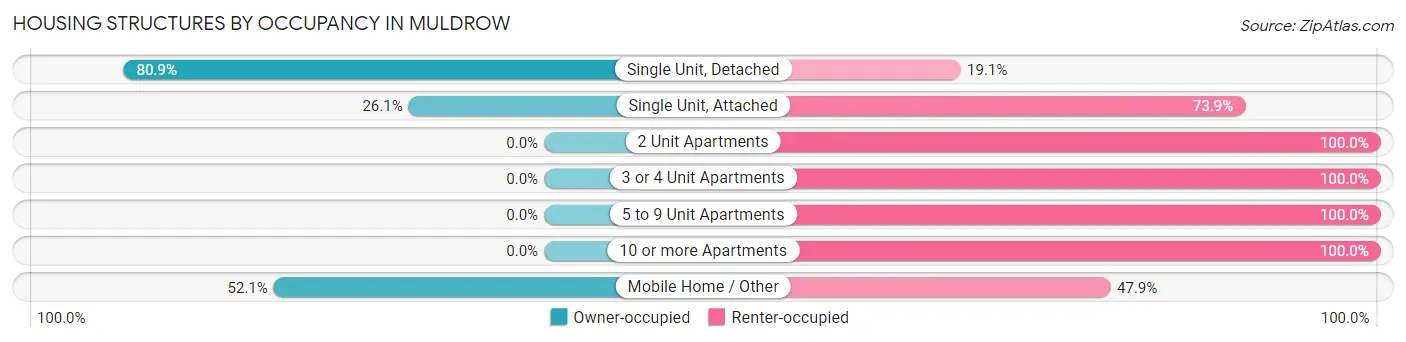
| Structure Type | Owner-occupied | Renter-occupied |
| Single Unit, Detached | 756 (80.9%) | 178 (19.1%) |
| Single Unit, Attached | 6 (26.1%) | 17 (73.9%) |
| 2 Unit Apartments | 0 (0.0%) | 29 (100.0%) |
| 3 or 4 Unit Apartments | 0 (0.0%) | 54 (100.0%) |
| 5 to 9 Unit Apartments | 0 (0.0%) | 9 (100.0%) |
| 10 or more Apartments | 0 (0.0%) | 19 (100.0%) |
| Mobile Home / Other | 63 (52.1%) | 58 (47.9%) |
| Total | 825 (69.4%) | 364 (30.6%) |
Housing Structures by Number of Rooms in Muldrow
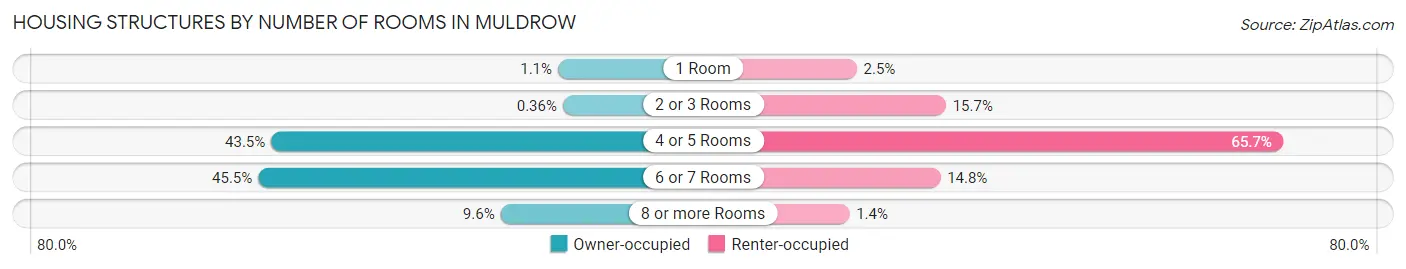
| Number of Rooms | Owner-occupied | Renter-occupied |
| 1 Room | 9 (1.1%) | 9 (2.5%) |
| 2 or 3 Rooms | 3 (0.4%) | 57 (15.7%) |
| 4 or 5 Rooms | 359 (43.5%) | 239 (65.7%) |
| 6 or 7 Rooms | 375 (45.5%) | 54 (14.8%) |
| 8 or more Rooms | 79 (9.6%) | 5 (1.4%) |
| Total | 825 (100.0%) | 364 (100.0%) |
Housing Structure by Heating Type in Muldrow
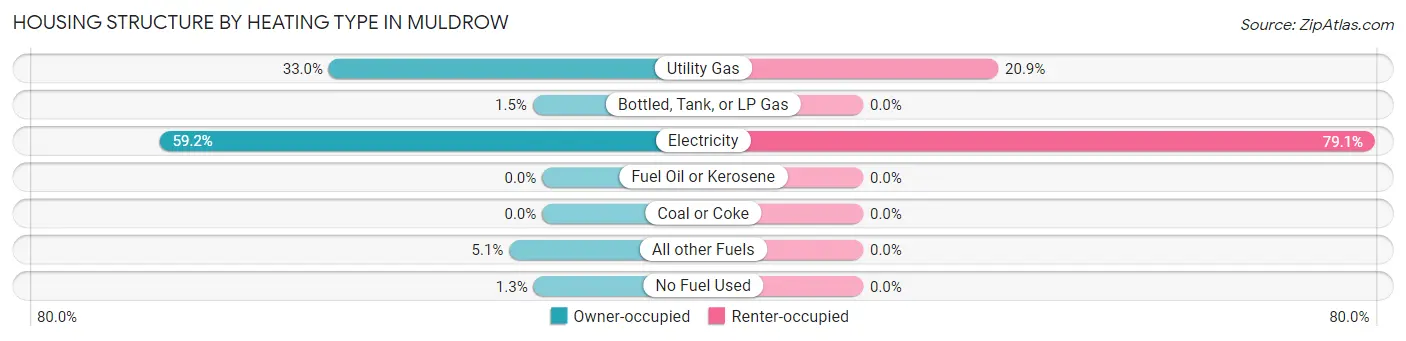
| Heating Type | Owner-occupied | Renter-occupied |
| Utility Gas | 272 (33.0%) | 76 (20.9%) |
| Bottled, Tank, or LP Gas | 12 (1.5%) | 0 (0.0%) |
| Electricity | 488 (59.2%) | 288 (79.1%) |
| Fuel Oil or Kerosene | 0 (0.0%) | 0 (0.0%) |
| Coal or Coke | 0 (0.0%) | 0 (0.0%) |
| All other Fuels | 42 (5.1%) | 0 (0.0%) |
| No Fuel Used | 11 (1.3%) | 0 (0.0%) |
| Total | 825 (100.0%) | 364 (100.0%) |
Household Vehicle Usage in Muldrow
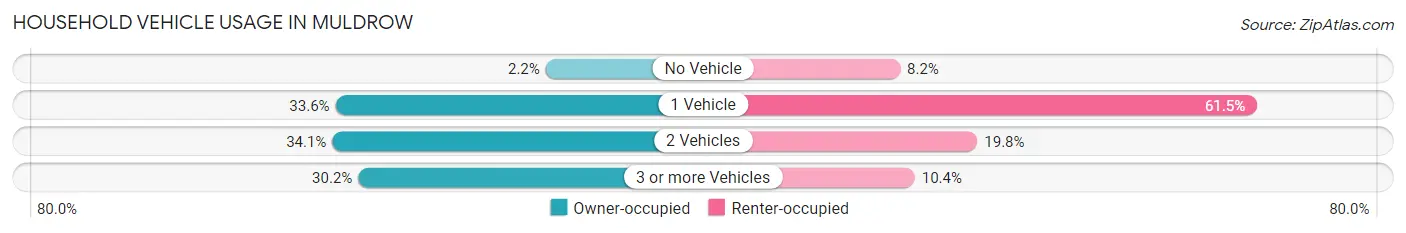
| Vehicles per Household | Owner-occupied | Renter-occupied |
| No Vehicle | 18 (2.2%) | 30 (8.2%) |
| 1 Vehicle | 277 (33.6%) | 224 (61.5%) |
| 2 Vehicles | 281 (34.1%) | 72 (19.8%) |
| 3 or more Vehicles | 249 (30.2%) | 38 (10.4%) |
| Total | 825 (100.0%) | 364 (100.0%) |
Real Estate & Mortgages in Muldrow
Real Estate and Mortgage Overview in Muldrow
| Characteristic | Without Mortgage | With Mortgage |
| Housing Units | 446 | 379 |
| Median Property Value | $75,000 | $116,700 |
| Median Household Income | $43,393 | $16 |
| Monthly Housing Costs | $331 | $0 |
| Real Estate Taxes | $504 | $20 |
Property Value by Mortgage Status in Muldrow
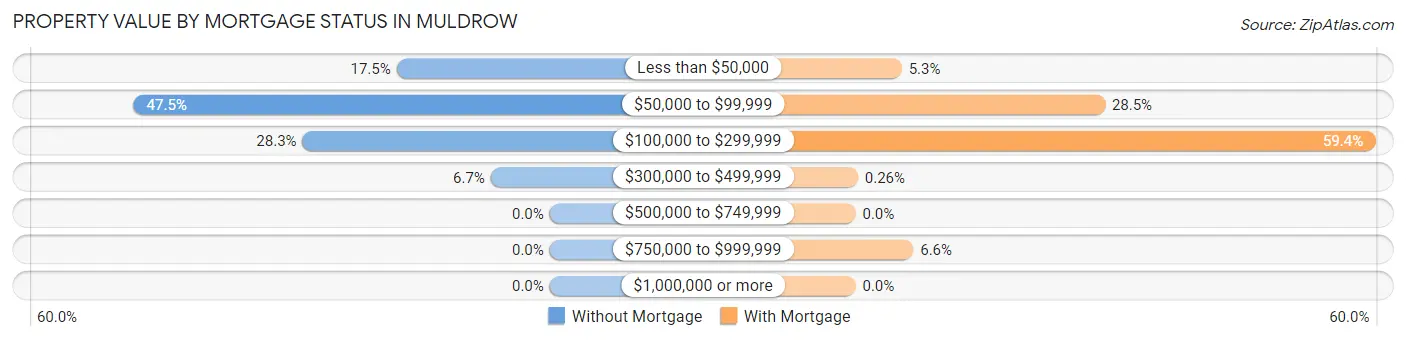
| Property Value | Without Mortgage | With Mortgage |
| Less than $50,000 | 78 (17.5%) | 20 (5.3%) |
| $50,000 to $99,999 | 212 (47.5%) | 108 (28.5%) |
| $100,000 to $299,999 | 126 (28.2%) | 225 (59.4%) |
| $300,000 to $499,999 | 30 (6.7%) | 1 (0.3%) |
| $500,000 to $749,999 | 0 (0.0%) | 0 (0.0%) |
| $750,000 to $999,999 | 0 (0.0%) | 25 (6.6%) |
| $1,000,000 or more | 0 (0.0%) | 0 (0.0%) |
| Total | 446 (100.0%) | 379 (100.0%) |
Household Income by Mortgage Status in Muldrow
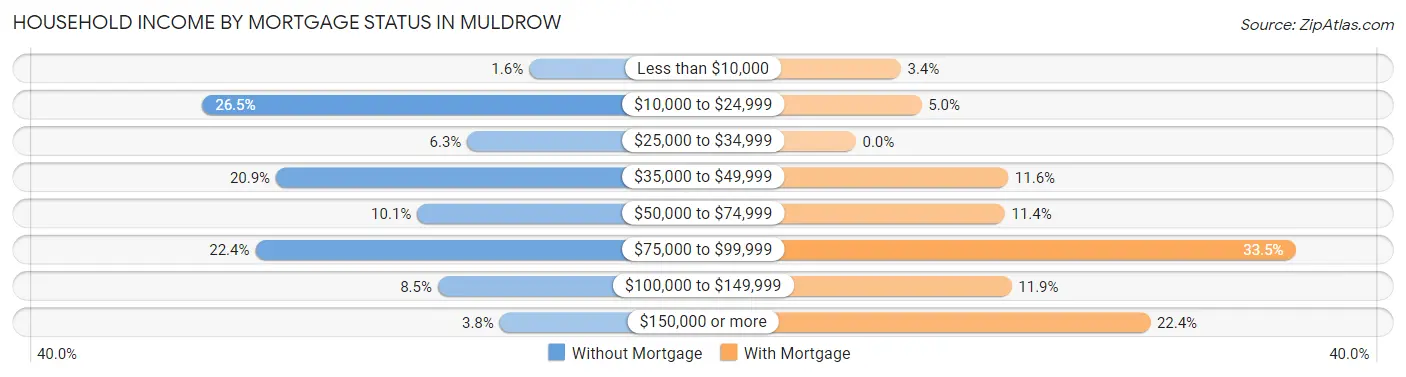
| Household Income | Without Mortgage | With Mortgage |
| Less than $10,000 | 7 (1.6%) | 13 (3.4%) |
| $10,000 to $24,999 | 118 (26.5%) | 19 (5.0%) |
| $25,000 to $34,999 | 28 (6.3%) | 0 (0.0%) |
| $35,000 to $49,999 | 93 (20.8%) | 44 (11.6%) |
| $50,000 to $74,999 | 45 (10.1%) | 43 (11.4%) |
| $75,000 to $99,999 | 100 (22.4%) | 127 (33.5%) |
| $100,000 to $149,999 | 38 (8.5%) | 45 (11.9%) |
| $150,000 or more | 17 (3.8%) | 85 (22.4%) |
| Total | 446 (100.0%) | 379 (100.0%) |
Property Value to Household Income Ratio in Muldrow
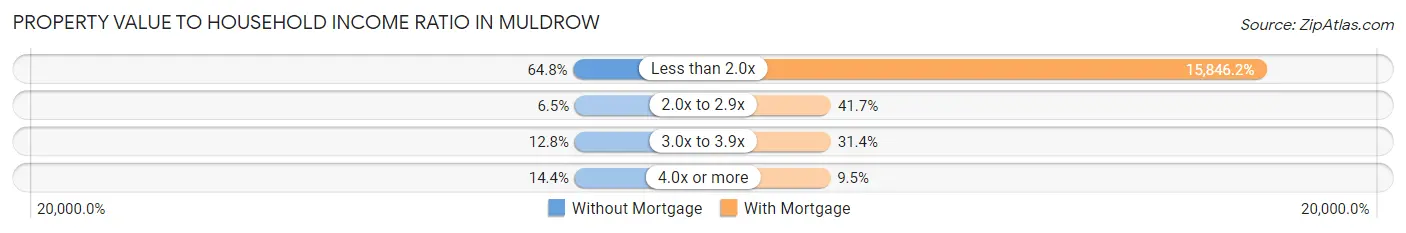
| Value-to-Income Ratio | Without Mortgage | With Mortgage |
| Less than 2.0x | 289 (64.8%) | 60,057 (15,846.2%) |
| 2.0x to 2.9x | 29 (6.5%) | 158 (41.7%) |
| 3.0x to 3.9x | 57 (12.8%) | 119 (31.4%) |
| 4.0x or more | 64 (14.3%) | 36 (9.5%) |
| Total | 446 (100.0%) | 379 (100.0%) |
Real Estate Taxes by Mortgage Status in Muldrow
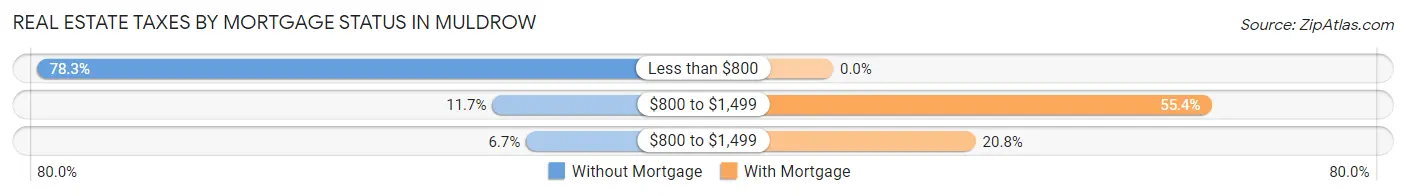
| Property Taxes | Without Mortgage | With Mortgage |
| Less than $800 | 349 (78.2%) | 0 (0.0%) |
| $800 to $1,499 | 52 (11.7%) | 210 (55.4%) |
| $800 to $1,499 | 30 (6.7%) | 79 (20.8%) |
| Total | 446 (100.0%) | 379 (100.0%) |
Health & Disability in Muldrow
Health Insurance Coverage by Age in Muldrow
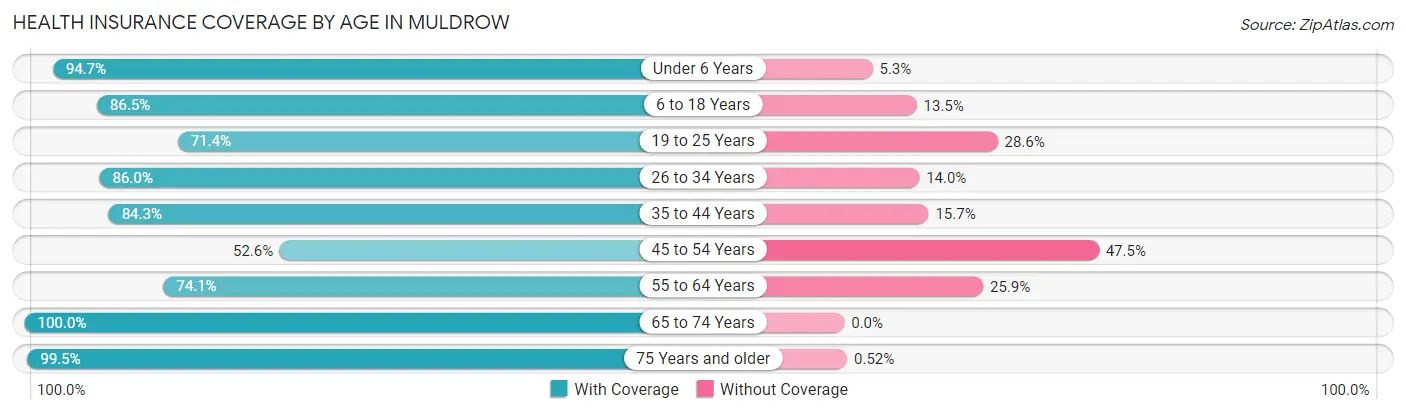
| Age Bracket | With Coverage | Without Coverage |
| Under 6 Years | 270 (94.7%) | 15 (5.3%) |
| 6 to 18 Years | 417 (86.5%) | 65 (13.5%) |
| 19 to 25 Years | 295 (71.4%) | 118 (28.6%) |
| 26 to 34 Years | 314 (86.0%) | 51 (14.0%) |
| 35 to 44 Years | 306 (84.3%) | 57 (15.7%) |
| 45 to 54 Years | 319 (52.5%) | 288 (47.4%) |
| 55 to 64 Years | 332 (74.1%) | 116 (25.9%) |
| 65 to 74 Years | 140 (100.0%) | 0 (0.0%) |
| 75 Years and older | 190 (99.5%) | 1 (0.5%) |
| Total | 2,583 (78.4%) | 711 (21.6%) |
Health Insurance Coverage by Citizenship Status in Muldrow
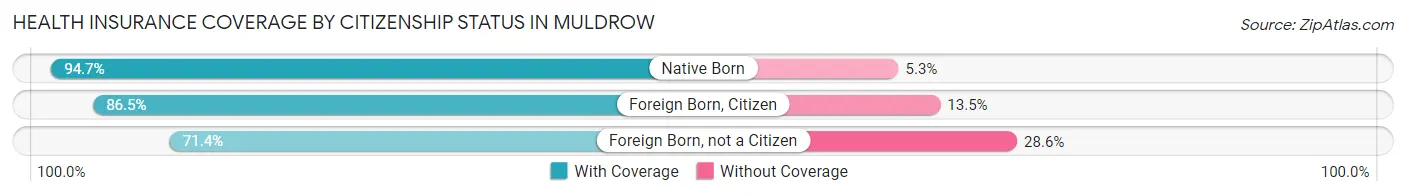
| Citizenship Status | With Coverage | Without Coverage |
| Native Born | 270 (94.7%) | 15 (5.3%) |
| Foreign Born, Citizen | 417 (86.5%) | 65 (13.5%) |
| Foreign Born, not a Citizen | 295 (71.4%) | 118 (28.6%) |
Health Insurance Coverage by Household Income in Muldrow
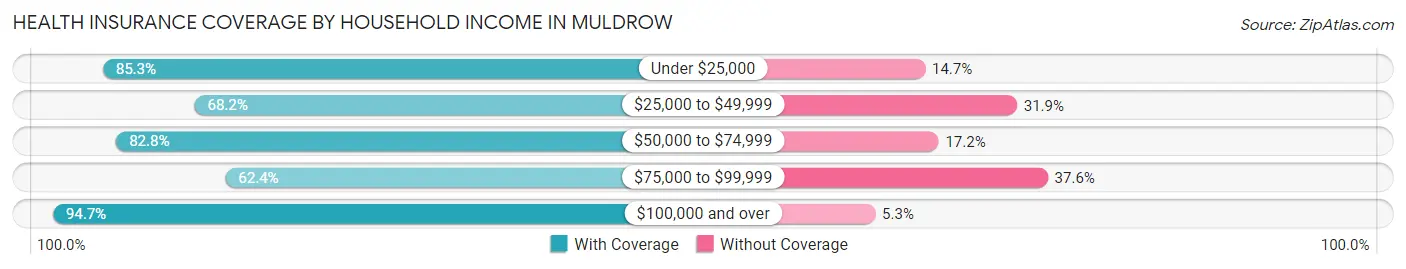
| Household Income | With Coverage | Without Coverage |
| Under $25,000 | 518 (85.3%) | 89 (14.7%) |
| $25,000 to $49,999 | 475 (68.1%) | 222 (31.9%) |
| $50,000 to $74,999 | 723 (82.8%) | 150 (17.2%) |
| $75,000 to $99,999 | 368 (62.4%) | 222 (37.6%) |
| $100,000 and over | 499 (94.7%) | 28 (5.3%) |
Public vs Private Health Insurance Coverage by Age in Muldrow
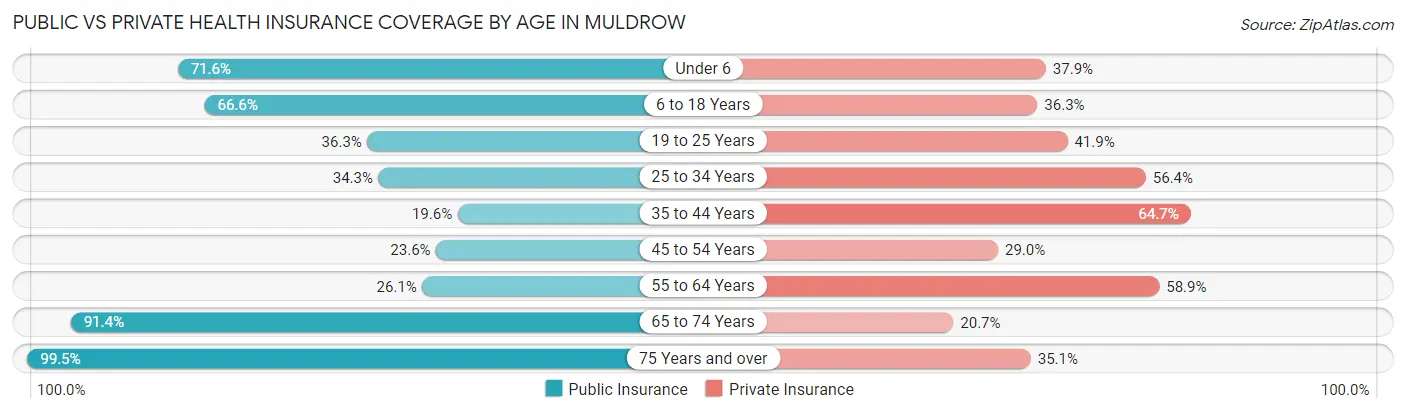
| Age Bracket | Public Insurance | Private Insurance |
| Under 6 | 204 (71.6%) | 108 (37.9%) |
| 6 to 18 Years | 321 (66.6%) | 175 (36.3%) |
| 19 to 25 Years | 150 (36.3%) | 173 (41.9%) |
| 25 to 34 Years | 125 (34.3%) | 206 (56.4%) |
| 35 to 44 Years | 71 (19.6%) | 235 (64.7%) |
| 45 to 54 Years | 143 (23.6%) | 176 (29.0%) |
| 55 to 64 Years | 117 (26.1%) | 264 (58.9%) |
| 65 to 74 Years | 128 (91.4%) | 29 (20.7%) |
| 75 Years and over | 190 (99.5%) | 67 (35.1%) |
| Total | 1,449 (44.0%) | 1,433 (43.5%) |
Disability Status by Sex by Age in Muldrow
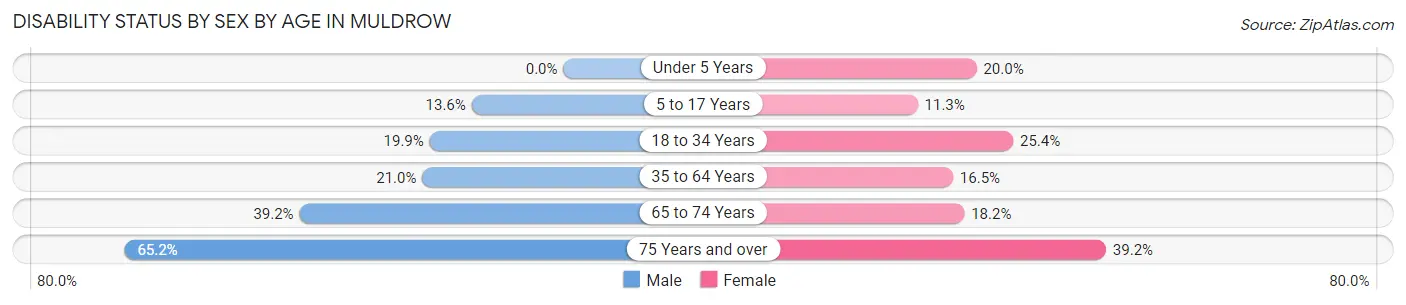
| Age Bracket | Male | Female |
| Under 5 Years | 0 (0.0%) | 17 (20.0%) |
| 5 to 17 Years | 29 (13.6%) | 26 (11.3%) |
| 18 to 34 Years | 87 (19.9%) | 103 (25.4%) |
| 35 to 64 Years | 146 (20.9%) | 119 (16.5%) |
| 65 to 74 Years | 29 (39.2%) | 12 (18.2%) |
| 75 Years and over | 58 (65.2%) | 40 (39.2%) |
Disability Class by Sex by Age in Muldrow
Disability Class: Hearing Difficulty
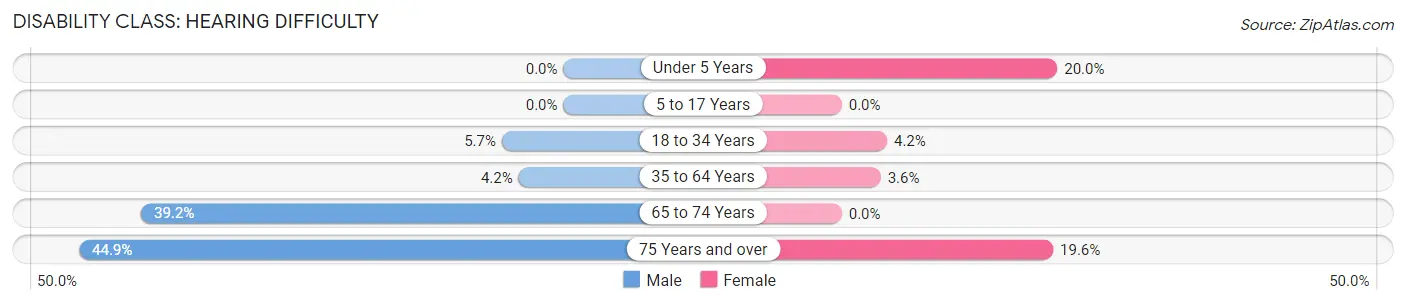
| Age Bracket | Male | Female |
| Under 5 Years | 0 (0.0%) | 17 (20.0%) |
| 5 to 17 Years | 0 (0.0%) | 0 (0.0%) |
| 18 to 34 Years | 25 (5.7%) | 17 (4.2%) |
| 35 to 64 Years | 29 (4.2%) | 26 (3.6%) |
| 65 to 74 Years | 29 (39.2%) | 0 (0.0%) |
| 75 Years and over | 40 (44.9%) | 20 (19.6%) |
Disability Class: Vision Difficulty
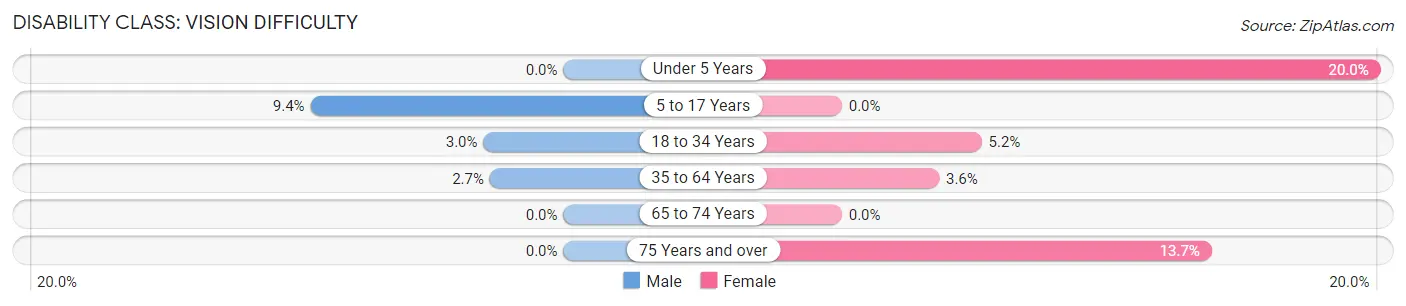
| Age Bracket | Male | Female |
| Under 5 Years | 0 (0.0%) | 17 (20.0%) |
| 5 to 17 Years | 20 (9.4%) | 0 (0.0%) |
| 18 to 34 Years | 13 (3.0%) | 21 (5.2%) |
| 35 to 64 Years | 19 (2.7%) | 26 (3.6%) |
| 65 to 74 Years | 0 (0.0%) | 0 (0.0%) |
| 75 Years and over | 0 (0.0%) | 14 (13.7%) |
Disability Class: Cognitive Difficulty
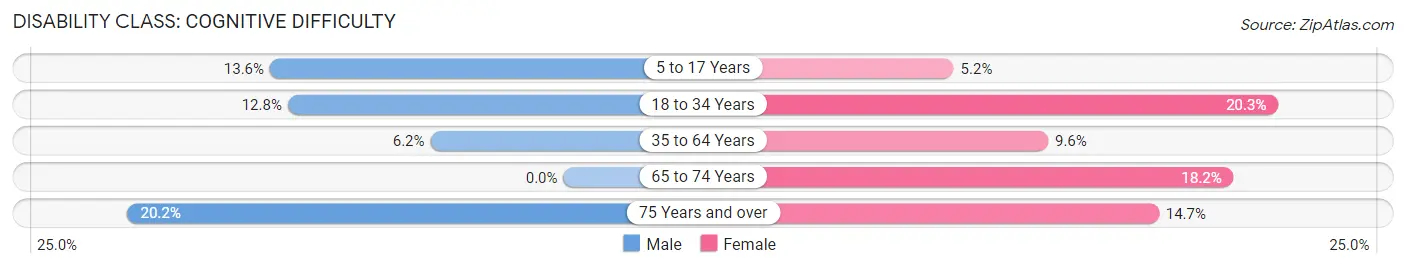
| Age Bracket | Male | Female |
| 5 to 17 Years | 29 (13.6%) | 12 (5.2%) |
| 18 to 34 Years | 56 (12.8%) | 82 (20.3%) |
| 35 to 64 Years | 43 (6.2%) | 69 (9.6%) |
| 65 to 74 Years | 0 (0.0%) | 12 (18.2%) |
| 75 Years and over | 18 (20.2%) | 15 (14.7%) |
Disability Class: Ambulatory Difficulty
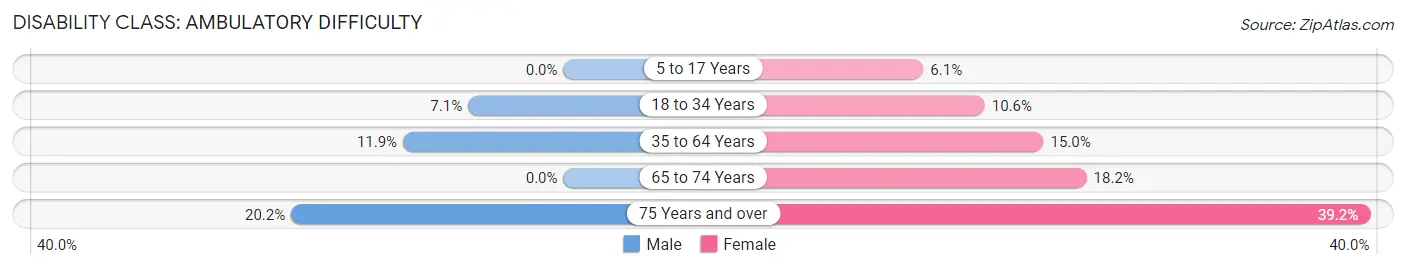
| Age Bracket | Male | Female |
| 5 to 17 Years | 0 (0.0%) | 14 (6.1%) |
| 18 to 34 Years | 31 (7.1%) | 43 (10.6%) |
| 35 to 64 Years | 83 (11.9%) | 108 (15.0%) |
| 65 to 74 Years | 0 (0.0%) | 12 (18.2%) |
| 75 Years and over | 18 (20.2%) | 40 (39.2%) |
Disability Class: Self-Care Difficulty
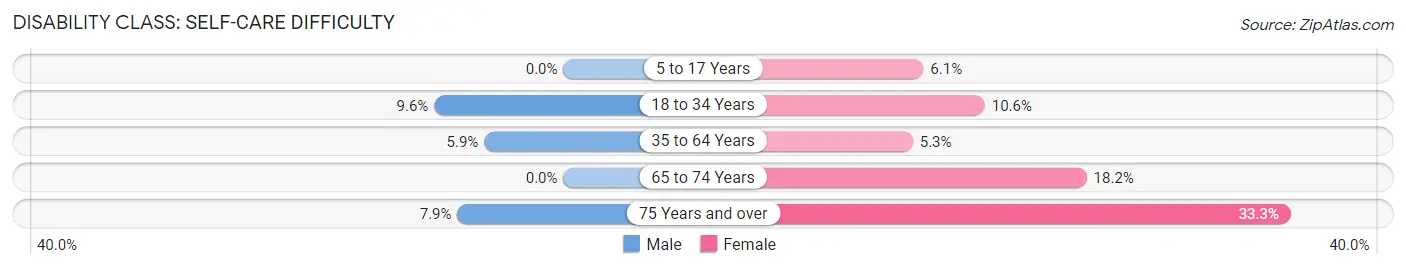
| Age Bracket | Male | Female |
| 5 to 17 Years | 0 (0.0%) | 14 (6.1%) |
| 18 to 34 Years | 42 (9.6%) | 43 (10.6%) |
| 35 to 64 Years | 41 (5.9%) | 38 (5.3%) |
| 65 to 74 Years | 0 (0.0%) | 12 (18.2%) |
| 75 Years and over | 7 (7.9%) | 34 (33.3%) |
Technology Access in Muldrow
Computing Device Access in Muldrow
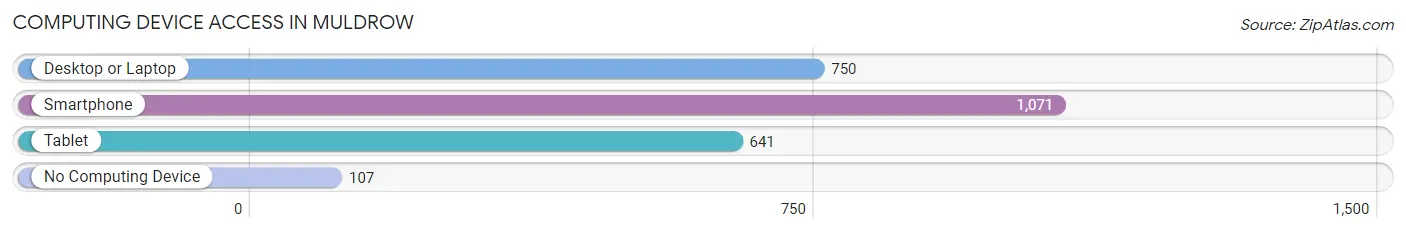
| Device Type | # Households | % Households |
| Desktop or Laptop | 750 | 63.1% |
| Smartphone | 1,071 | 90.1% |
| Tablet | 641 | 53.9% |
| No Computing Device | 107 | 9.0% |
| Total | 1,189 | 100.0% |
Internet Access in Muldrow
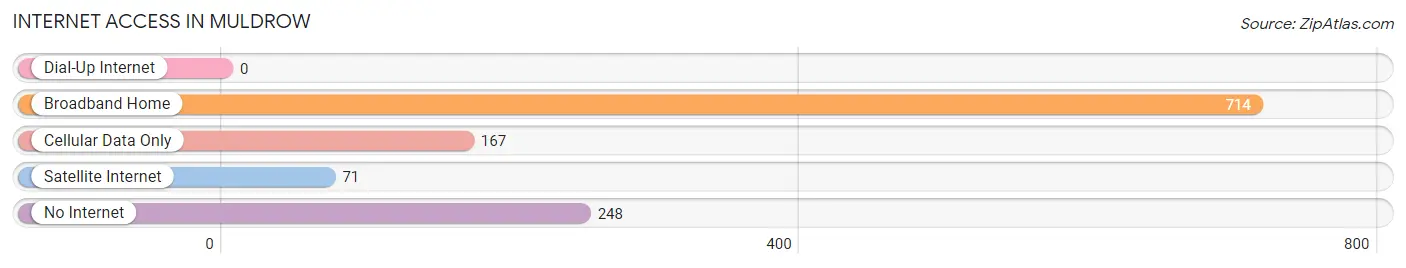
| Internet Type | # Households | % Households |
| Dial-Up Internet | 0 | 0.0% |
| Broadband Home | 714 | 60.1% |
| Cellular Data Only | 167 | 14.1% |
| Satellite Internet | 71 | 6.0% |
| No Internet | 248 | 20.9% |
| Total | 1,189 | 100.0% |
Muldrow Summary
Muldrow is a town located in Sequoyah County, Oklahoma. It is situated in the foothills of the Ozark Mountains, near the Arkansas border. The town was founded in 1887 and named after the Muldrow family, who were early settlers in the area. The population of Muldrow was 2,845 at the 2010 census, an increase of 8.3% from the 2000 census.
Geography
Muldrow is located at 35°25'25" North, 94°45'45" West (35.423, -94.7625). It is situated in the foothills of the Ozark Mountains, near the Arkansas border. The town is located in the Arkansas River Valley, and is surrounded by rolling hills and wooded areas. The town is located approximately 10 miles south of Fort Smith, Arkansas, and approximately 30 miles north of Sallisaw, Oklahoma.
Climate
Muldrow has a humid subtropical climate, with hot, humid summers and mild winters. The average annual temperature is 63°F (17°C). The average annual precipitation is 45.5 inches (115.6 cm).
Demographics
As of the 2010 census, there were 2,845 people, 1,093 households, and 745 families residing in the town. The population density was 845.3 people per square mile (326.2/km2). There were 1,223 housing units at an average density of 359.3 per square mile (139.1/km2). The racial makeup of the town was 79.2% White, 0.7% African American, 14.2% Native American, 0.2% Asian, 0.1% Pacific Islander, 0.7% from other races, and 4.9% from two or more races. Hispanic or Latino of any race were 2.7% of the population.
Economy
Muldrow's economy is largely based on agriculture and manufacturing. The town is home to several large poultry processing plants, as well as a number of smaller businesses. The town is also home to a number of retail stores, restaurants, and other services.
Education
Muldrow is served by the Muldrow Public School District. The district includes Muldrow High School, Muldrow Middle School, and Muldrow Elementary School. The district also operates a number of alternative education programs, including a virtual school and a home school program.
Transportation
Muldrow is served by U.S. Route 59, which runs through the town. The town is also served by a number of local bus routes. The nearest airport is Fort Smith Regional Airport, located approximately 10 miles north of the town.
Culture
Muldrow is home to a number of cultural attractions, including the Muldrow Public Library, the Muldrow Historical Museum, and the Muldrow Arts Center. The town also hosts a number of annual events, including the Muldrow Festival of Lights, the Muldrow Music Festival, and the Muldrow Christmas Parade.
Common Questions
What is Per Capita Income in Muldrow?
Per Capita income in Muldrow is $21,875.
What is the Median Family Income in Muldrow?
Median Family Income in Muldrow is $68,125.
What is the Median Household income in Muldrow?
Median Household Income in Muldrow is $45,982.
What is Income or Wage Gap in Muldrow?
Income or Wage Gap in Muldrow is 48.8%.
Women in Muldrow earn 51.2 cents for every dollar earned by a man.
What is Inequality or Gini Index in Muldrow?
Inequality or Gini Index in Muldrow is 0.41.
What is the Total Population of Muldrow?
Total Population of Muldrow is 3,294.
What is the Total Male Population of Muldrow?
Total Male Population of Muldrow is 1,684.
What is the Total Female Population of Muldrow?
Total Female Population of Muldrow is 1,610.
What is the Ratio of Males per 100 Females in Muldrow?
There are 104.60 Males per 100 Females in Muldrow.
What is the Ratio of Females per 100 Males in Muldrow?
There are 95.61 Females per 100 Males in Muldrow.
What is the Median Population Age in Muldrow?
Median Population Age in Muldrow is 37.8 Years.
What is the Average Family Size in Muldrow
Average Family Size in Muldrow is 3.6 People.
What is the Average Household Size in Muldrow
Average Household Size in Muldrow is 2.8 People.
How Large is the Labor Force in Muldrow?
There are 1,445 People in the Labor Forcein in Muldrow.
What is the Percentage of People in the Labor Force in Muldrow?
54.5% of People are in the Labor Force in Muldrow.
What is the Unemployment Rate in Muldrow?
Unemployment Rate in Muldrow is 4.5%.