Montgomeryville, PA Map & Demographics
Montgomeryville Map
Montgomeryville Overview
$55,697
PER CAPITA INCOME
$135,763
AVG FAMILY INCOME
$120,250
AVG HOUSEHOLD INCOME
20.5%
WAGE / INCOME GAP [ % ]
79.5¢/ $1
WAGE / INCOME GAP [ $ ]
0.41
INEQUALITY / GINI INDEX
13,008
TOTAL POPULATION
6,629
MALE POPULATION
6,379
FEMALE POPULATION
103.92
MALES / 100 FEMALES
96.23
FEMALES / 100 MALES
44.7
MEDIAN AGE
3.1
AVG FAMILY SIZE
2.7
AVG HOUSEHOLD SIZE
7,128
LABOR FORCE [ PEOPLE ]
68.7%
PERCENT IN LABOR FORCE
7.3%
UNEMPLOYMENT RATE
Montgomeryville Zip Codes
Income in Montgomeryville
Income Overview in Montgomeryville
Per Capita Income in Montgomeryville is $55,697, while median incomes of families and households are $135,763 and $120,250 respectively.
| Characteristic | Number | Measure |
| Per Capita Income | 13,008 | $55,697 |
| Median Family Income | 3,719 | $135,763 |
| Mean Family Income | 3,719 | $169,262 |
| Median Household Income | 4,726 | $120,250 |
| Mean Household Income | 4,726 | $152,130 |
| Income Deficit | 3,719 | $0 |
| Wage / Income Gap (%) | 13,008 | 20.46% |
| Wage / Income Gap ($) | 13,008 | 79.54¢ per $1 |
| Gini / Inequality Index | 13,008 | 0.41 |
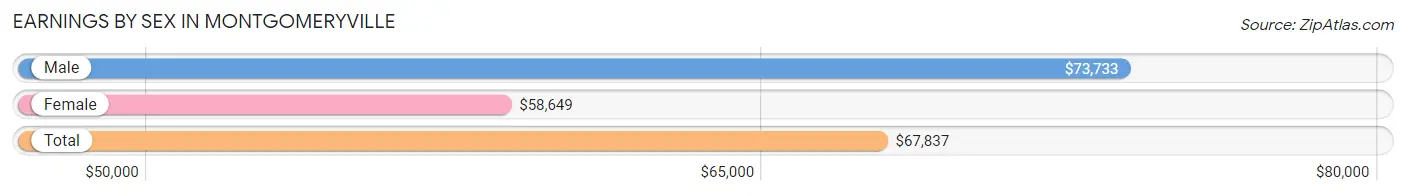
Earnings by Sex in Montgomeryville
Average Earnings in Montgomeryville are $67,837, $73,733 for men and $58,649 for women, a difference of 20.5%.
| Sex | Number | Average Earnings |
| Male | 3,892 (52.9%) | $73,733 |
| Female | 3,464 (47.1%) | $58,649 |
| Total | 7,356 (100.0%) | $67,837 |
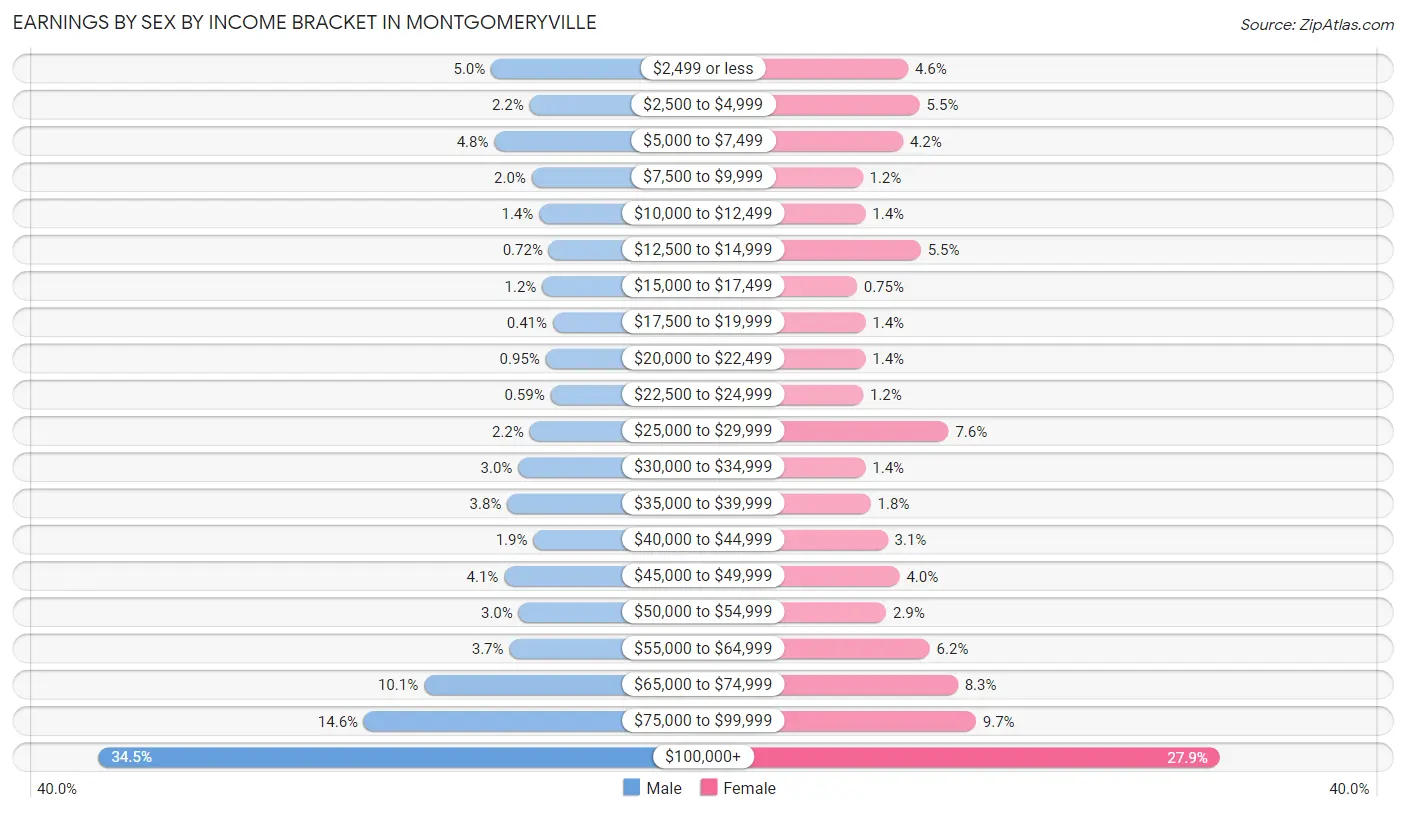
Earnings by Sex by Income Bracket in Montgomeryville
The most common earnings brackets in Montgomeryville are $100,000+ for men (1,341 | 34.5%) and $100,000+ for women (968 | 27.9%).
| Income | Male | Female |
| $2,499 or less | 196 (5.0%) | 159 (4.6%) |
| $2,500 to $4,999 | 84 (2.2%) | 189 (5.5%) |
| $5,000 to $7,499 | 187 (4.8%) | 146 (4.2%) |
| $7,500 to $9,999 | 78 (2.0%) | 41 (1.2%) |
| $10,000 to $12,499 | 56 (1.4%) | 48 (1.4%) |
| $12,500 to $14,999 | 28 (0.7%) | 192 (5.5%) |
| $15,000 to $17,499 | 47 (1.2%) | 26 (0.7%) |
| $17,500 to $19,999 | 16 (0.4%) | 48 (1.4%) |
| $20,000 to $22,499 | 37 (0.9%) | 48 (1.4%) |
| $22,500 to $24,999 | 23 (0.6%) | 42 (1.2%) |
| $25,000 to $29,999 | 84 (2.2%) | 264 (7.6%) |
| $30,000 to $34,999 | 117 (3.0%) | 48 (1.4%) |
| $35,000 to $39,999 | 149 (3.8%) | 62 (1.8%) |
| $40,000 to $44,999 | 73 (1.9%) | 106 (3.1%) |
| $45,000 to $49,999 | 158 (4.1%) | 137 (4.0%) |
| $50,000 to $54,999 | 116 (3.0%) | 102 (2.9%) |
| $55,000 to $64,999 | 143 (3.7%) | 215 (6.2%) |
| $65,000 to $74,999 | 392 (10.1%) | 288 (8.3%) |
| $75,000 to $99,999 | 567 (14.6%) | 335 (9.7%) |
| $100,000+ | 1,341 (34.5%) | 968 (27.9%) |
| Total | 3,892 (100.0%) | 3,464 (100.0%) |
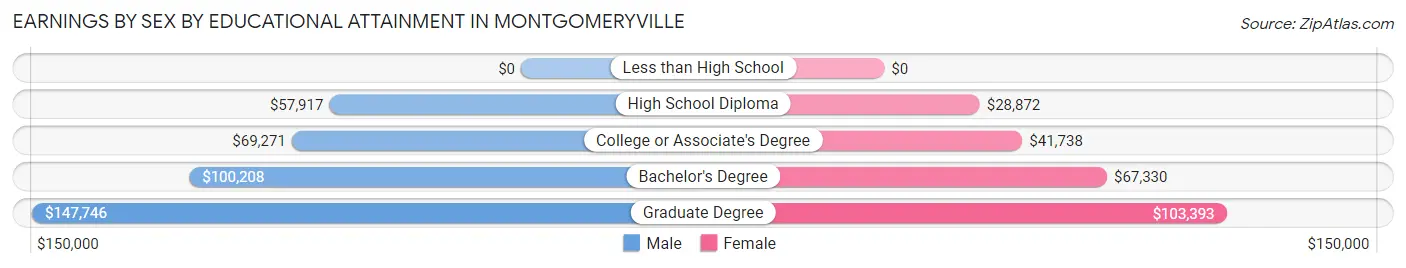
Earnings by Sex by Educational Attainment in Montgomeryville
Average earnings in Montgomeryville are $76,620 for men and $68,014 for women, a difference of 11.2%. Men with an educational attainment of graduate degree enjoy the highest average annual earnings of $147,746, while those with high school diploma education earn the least with $57,917. Women with an educational attainment of graduate degree earn the most with the average annual earnings of $103,393, while those with high school diploma education have the smallest earnings of $28,872.
| Educational Attainment | Male Income | Female Income |
| Less than High School | - | - |
| High School Diploma | $57,917 | $28,872 |
| College or Associate's Degree | $69,271 | $41,738 |
| Bachelor's Degree | $100,208 | $67,330 |
| Graduate Degree | $147,746 | $103,393 |
| Total | $76,620 | $68,014 |
Family Income in Montgomeryville
Family Income Brackets in Montgomeryville
According to the Montgomeryville family income data, there are 1,138 families falling into the $200,000+ income range, which is the most common income bracket and makes up 30.6% of all families. Conversely, the $10,000 to $14,999 income bracket is the least frequent group with only 15 families (0.4%) belonging to this category.
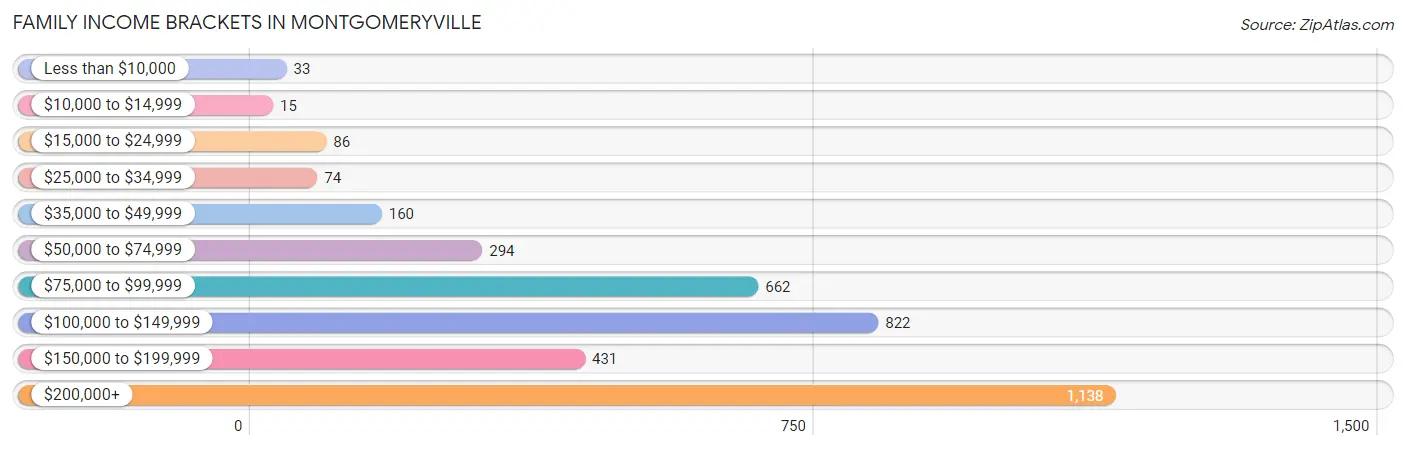
| Income Bracket | # Families | % Families |
| Less than $10,000 | 33 | 0.9% |
| $10,000 to $14,999 | 15 | 0.4% |
| $15,000 to $24,999 | 86 | 2.3% |
| $25,000 to $34,999 | 74 | 2.0% |
| $35,000 to $49,999 | 160 | 4.3% |
| $50,000 to $74,999 | 294 | 7.9% |
| $75,000 to $99,999 | 662 | 17.8% |
| $100,000 to $149,999 | 822 | 22.1% |
| $150,000 to $199,999 | 431 | 11.6% |
| $200,000+ | 1,138 | 30.6% |
Family Income by Famaliy Size in Montgomeryville
6-person families (206 | 5.5%) account for the highest median family income in Montgomeryville with $218,750 per family, while 2-person families (1,626 | 43.7%) have the highest median income of $54,890 per family member.
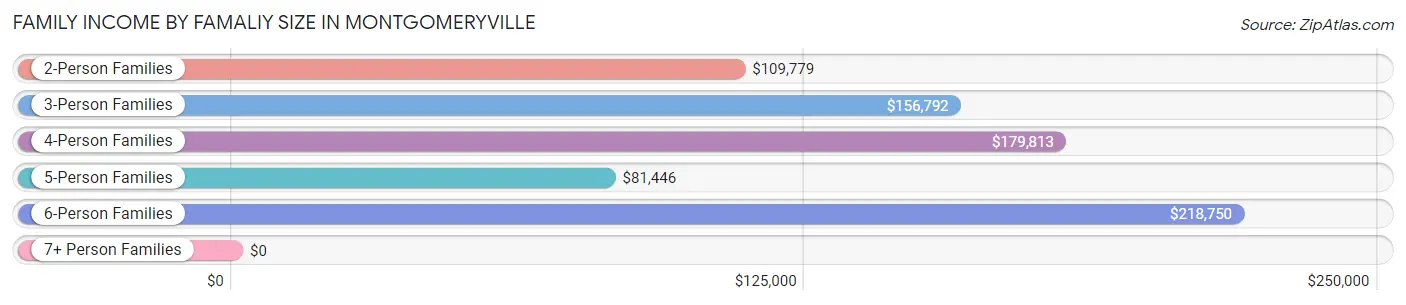
| Income Bracket | # Families | Median Income |
| 2-Person Families | 1,626 (43.7%) | $109,779 |
| 3-Person Families | 849 (22.8%) | $156,792 |
| 4-Person Families | 769 (20.7%) | $179,813 |
| 5-Person Families | 230 (6.2%) | $81,446 |
| 6-Person Families | 206 (5.5%) | $218,750 |
| 7+ Person Families | 39 (1.1%) | $0 |
| Total | 3,719 (100.0%) | $135,763 |
Family Income by Number of Earners in Montgomeryville
The median family income in Montgomeryville is $135,763, with families comprising 3+ earners (568) having the highest median family income of $209,821, while families with no earners (500) have the lowest median family income of $59,459, accounting for 15.3% and 13.4% of families, respectively.
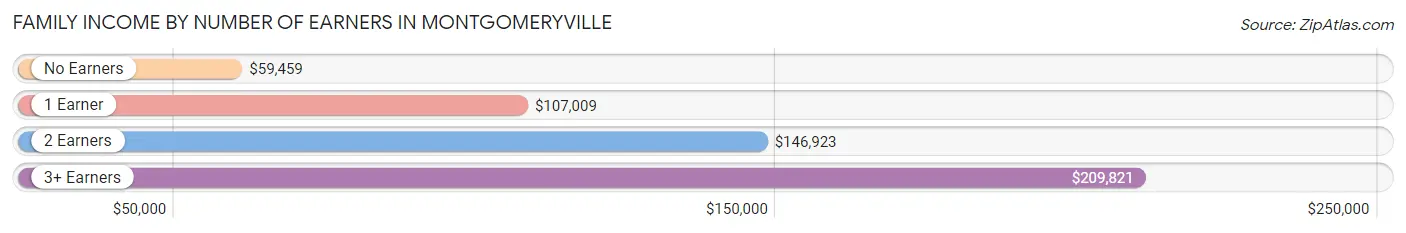
| Number of Earners | # Families | Median Income |
| No Earners | 500 (13.4%) | $59,459 |
| 1 Earner | 763 (20.5%) | $107,009 |
| 2 Earners | 1,888 (50.8%) | $146,923 |
| 3+ Earners | 568 (15.3%) | $209,821 |
| Total | 3,719 (100.0%) | $135,763 |
Household Income in Montgomeryville
Household Income Brackets in Montgomeryville
With 1,233 households falling in the category, the $200,000+ income range is the most frequent in Montgomeryville, accounting for 26.1% of all households. In contrast, only 24 households (0.5%) fall into the $10,000 to $14,999 income bracket, making it the least populous group.
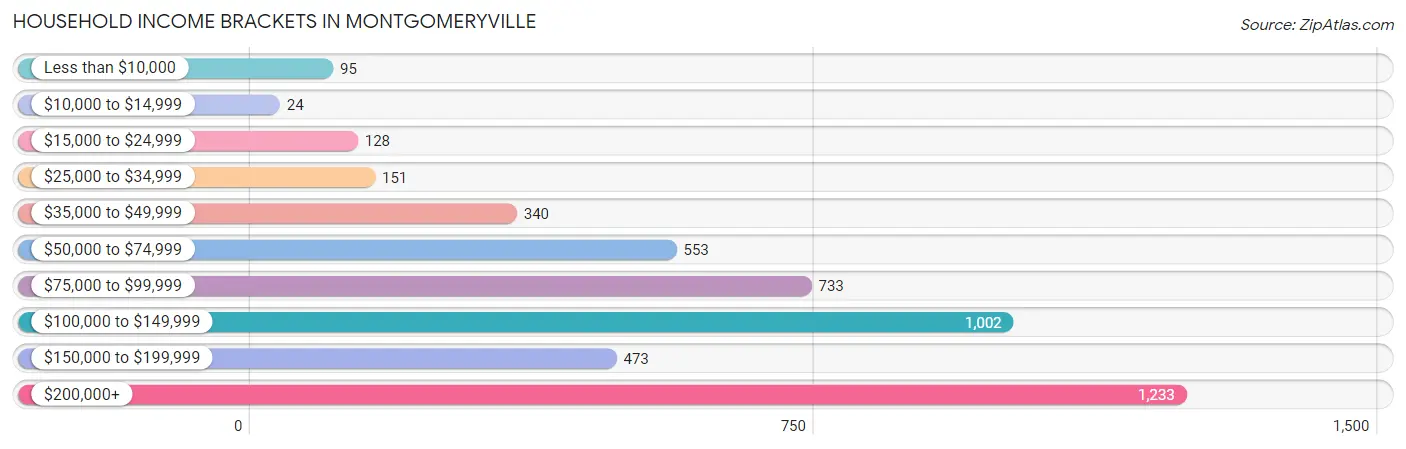
| Income Bracket | # Households | % Households |
| Less than $10,000 | 95 | 2.0% |
| $10,000 to $14,999 | 24 | 0.5% |
| $15,000 to $24,999 | 128 | 2.7% |
| $25,000 to $34,999 | 151 | 3.2% |
| $35,000 to $49,999 | 340 | 7.2% |
| $50,000 to $74,999 | 553 | 11.7% |
| $75,000 to $99,999 | 733 | 15.5% |
| $100,000 to $149,999 | 1,002 | 21.2% |
| $150,000 to $199,999 | 473 | 10.0% |
| $200,000+ | 1,233 | 26.1% |
Household Income by Householder Age in Montgomeryville
The median household income in Montgomeryville is $120,250, with the highest median household income of $145,789 found in the 25 to 44 years age bracket for the primary householder. A total of 1,316 households (27.9%) fall into this category. Meanwhile, the 15 to 24 years age bracket for the primary householder has the lowest median household income of $0, with 10 households (0.2%) in this group.
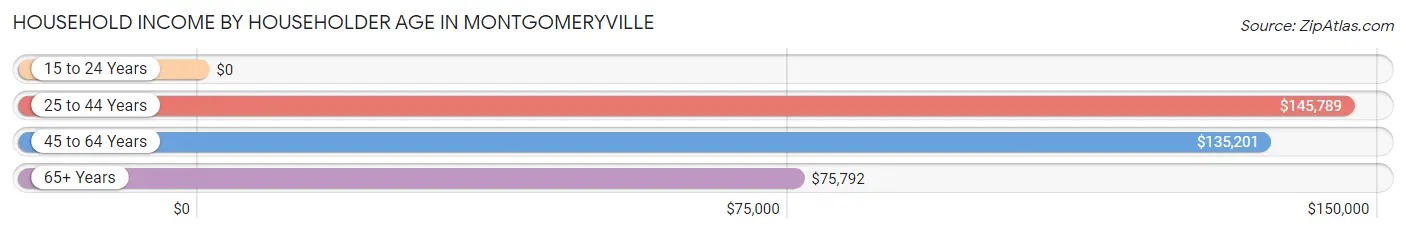
| Income Bracket | # Households | Median Income |
| 15 to 24 Years | 10 (0.2%) | $0 |
| 25 to 44 Years | 1,316 (27.9%) | $145,789 |
| 45 to 64 Years | 2,215 (46.9%) | $135,201 |
| 65+ Years | 1,185 (25.1%) | $75,792 |
| Total | 4,726 (100.0%) | $120,250 |
Poverty in Montgomeryville
Income Below Poverty by Sex and Age in Montgomeryville
With 2.6% poverty level for males and 3.2% for females among the residents of Montgomeryville, 15 year old males and 12 to 14 year old females are the most vulnerable to poverty, with 14 males (9.3%) and 33 females (11.4%) in their respective age groups living below the poverty level.
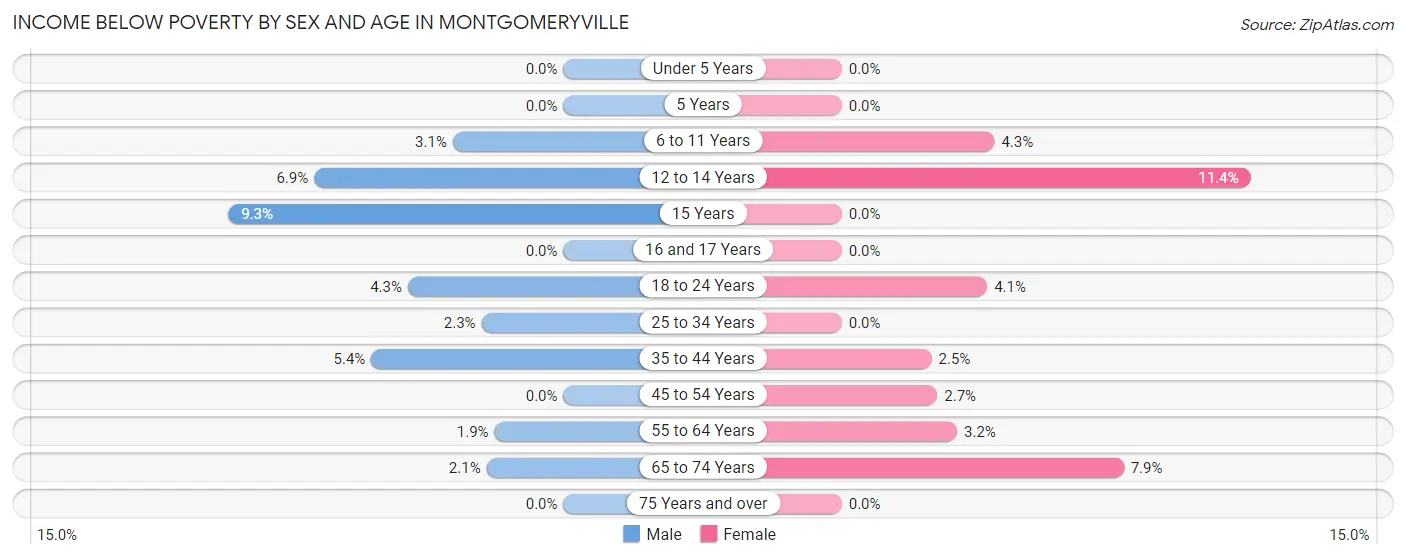
| Age Bracket | Male | Female |
| Under 5 Years | 0 (0.0%) | 0 (0.0%) |
| 5 Years | 0 (0.0%) | 0 (0.0%) |
| 6 to 11 Years | 19 (3.1%) | 20 (4.3%) |
| 12 to 14 Years | 25 (6.9%) | 33 (11.4%) |
| 15 Years | 14 (9.3%) | 0 (0.0%) |
| 16 and 17 Years | 0 (0.0%) | 0 (0.0%) |
| 18 to 24 Years | 18 (4.3%) | 14 (4.1%) |
| 25 to 34 Years | 15 (2.3%) | 0 (0.0%) |
| 35 to 44 Years | 46 (5.3%) | 21 (2.5%) |
| 45 to 54 Years | 0 (0.0%) | 24 (2.7%) |
| 55 to 64 Years | 19 (1.9%) | 39 (3.2%) |
| 65 to 74 Years | 16 (2.1%) | 50 (7.9%) |
| 75 Years and over | 0 (0.0%) | 0 (0.0%) |
| Total | 172 (2.6%) | 201 (3.2%) |
Income Above Poverty by Sex and Age in Montgomeryville
According to the poverty statistics in Montgomeryville, males aged under 5 years and females aged under 5 years are the age groups that are most secure financially, with 100.0% of males and 100.0% of females in these age groups living above the poverty line.
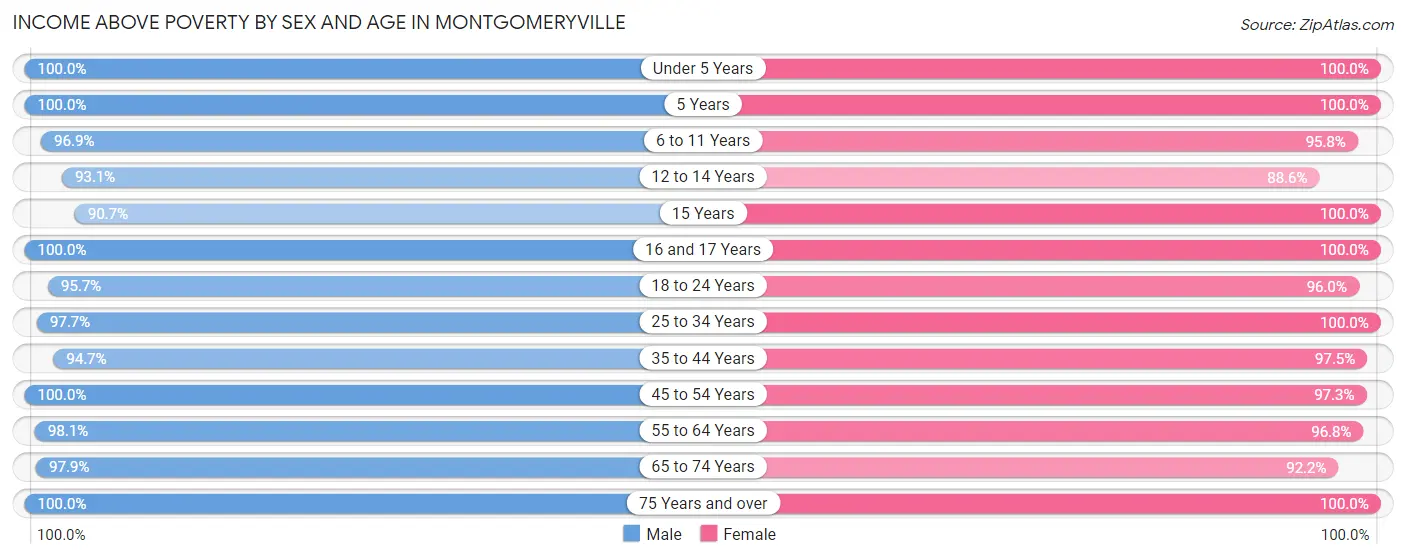
| Age Bracket | Male | Female |
| Under 5 Years | 262 (100.0%) | 242 (100.0%) |
| 5 Years | 38 (100.0%) | 108 (100.0%) |
| 6 to 11 Years | 598 (96.9%) | 451 (95.8%) |
| 12 to 14 Years | 335 (93.1%) | 257 (88.6%) |
| 15 Years | 136 (90.7%) | 94 (100.0%) |
| 16 and 17 Years | 141 (100.0%) | 162 (100.0%) |
| 18 to 24 Years | 398 (95.7%) | 332 (96.0%) |
| 25 to 34 Years | 643 (97.7%) | 497 (100.0%) |
| 35 to 44 Years | 814 (94.7%) | 820 (97.5%) |
| 45 to 54 Years | 980 (100.0%) | 877 (97.3%) |
| 55 to 64 Years | 973 (98.1%) | 1,177 (96.8%) |
| 65 to 74 Years | 730 (97.9%) | 587 (92.1%) |
| 75 Years and over | 317 (100.0%) | 510 (100.0%) |
| Total | 6,365 (97.4%) | 6,114 (96.8%) |
Income Below Poverty Among Married-Couple Families in Montgomeryville
The poverty statistics for married-couple families in Montgomeryville show that 1.1% or 38 of the total 3,346 families live below the poverty line. Families with 3 or 4 children have the highest poverty rate of 2.7%, comprising of 10 families. On the other hand, families with 5 or more children have the lowest poverty rate of 0.0%, which includes 0 families.
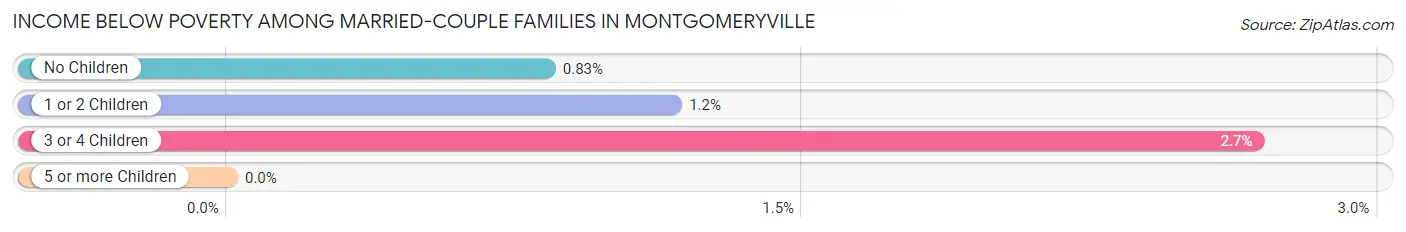
| Children | Above Poverty | Below Poverty |
| No Children | 1,909 (99.2%) | 16 (0.8%) |
| 1 or 2 Children | 1,025 (98.8%) | 12 (1.2%) |
| 3 or 4 Children | 363 (97.3%) | 10 (2.7%) |
| 5 or more Children | 11 (100.0%) | 0 (0.0%) |
| Total | 3,308 (98.9%) | 38 (1.1%) |
Income Below Poverty Among Single-Parent Households in Montgomeryville
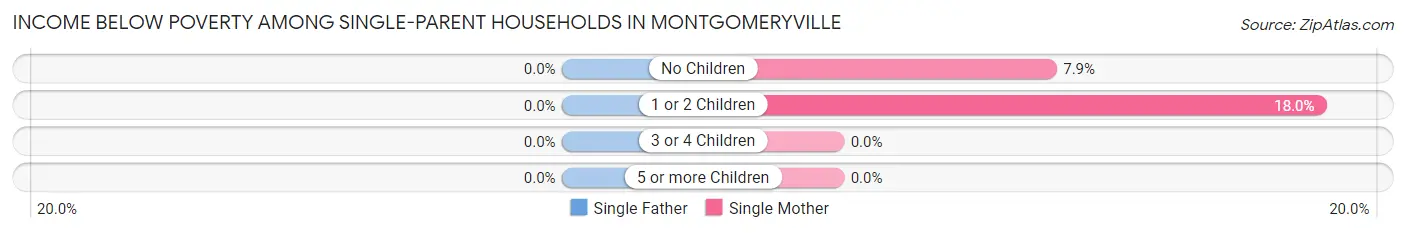
| Children | Single Father | Single Mother |
| No Children | 0 (0.0%) | 16 (7.9%) |
| 1 or 2 Children | 0 (0.0%) | 16 (18.0%) |
| 3 or 4 Children | 0 (0.0%) | 0 (0.0%) |
| 5 or more Children | 0 (0.0%) | 0 (0.0%) |
| Total | 0 (0.0%) | 32 (11.0%) |
Income Below Poverty Among Married-Couple vs Single-Parent Households in Montgomeryville
The poverty data for Montgomeryville shows that 38 of the married-couple family households (1.1%) and 32 of the single-parent households (8.6%) are living below the poverty level. Within the married-couple family households, those with 3 or 4 children have the highest poverty rate, with 10 households (2.7%) falling below the poverty line. Among the single-parent households, those with 1 or 2 children have the highest poverty rate, with 16 household (16.0%) living below poverty.
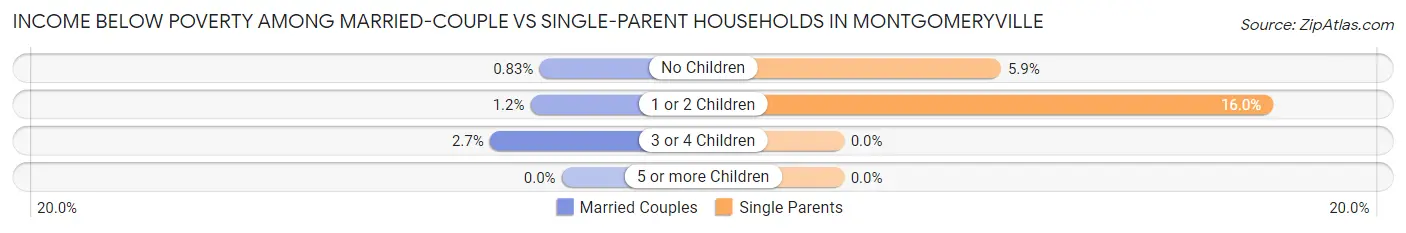
| Children | Married-Couple Families | Single-Parent Households |
| No Children | 16 (0.8%) | 16 (5.9%) |
| 1 or 2 Children | 12 (1.2%) | 16 (16.0%) |
| 3 or 4 Children | 10 (2.7%) | 0 (0.0%) |
| 5 or more Children | 0 (0.0%) | 0 (0.0%) |
| Total | 38 (1.1%) | 32 (8.6%) |
Race in Montgomeryville
The most populous races in Montgomeryville are White / Caucasian (9,453 | 72.7%), Asian (2,369 | 18.2%), and Black / African American (694 | 5.3%).
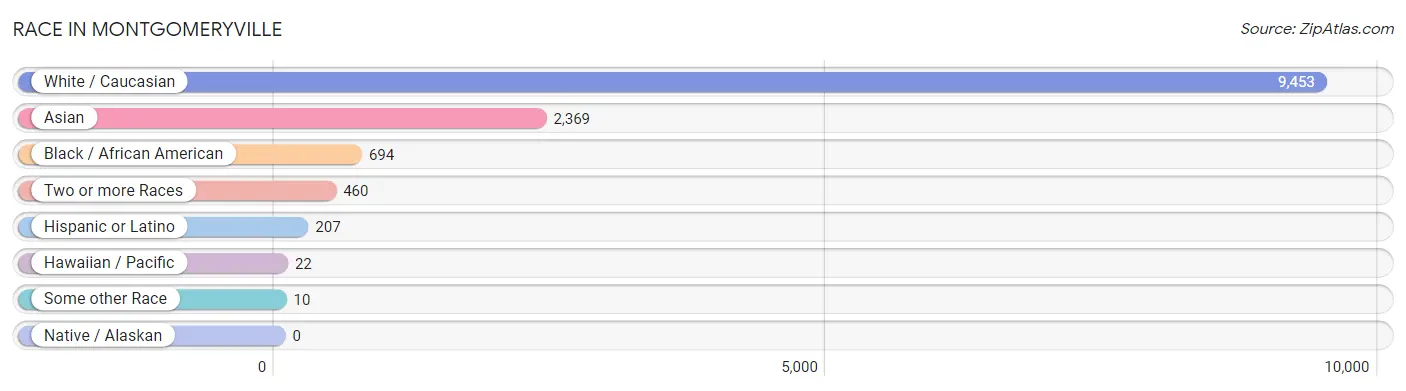
| Race | # Population | % Population |
| Asian | 2,369 | 18.2% |
| Black / African American | 694 | 5.3% |
| Hawaiian / Pacific | 22 | 0.2% |
| Hispanic or Latino | 207 | 1.6% |
| Native / Alaskan | 0 | 0.0% |
| White / Caucasian | 9,453 | 72.7% |
| Two or more Races | 460 | 3.5% |
| Some other Race | 10 | 0.1% |
| Total | 13,008 | 100.0% |
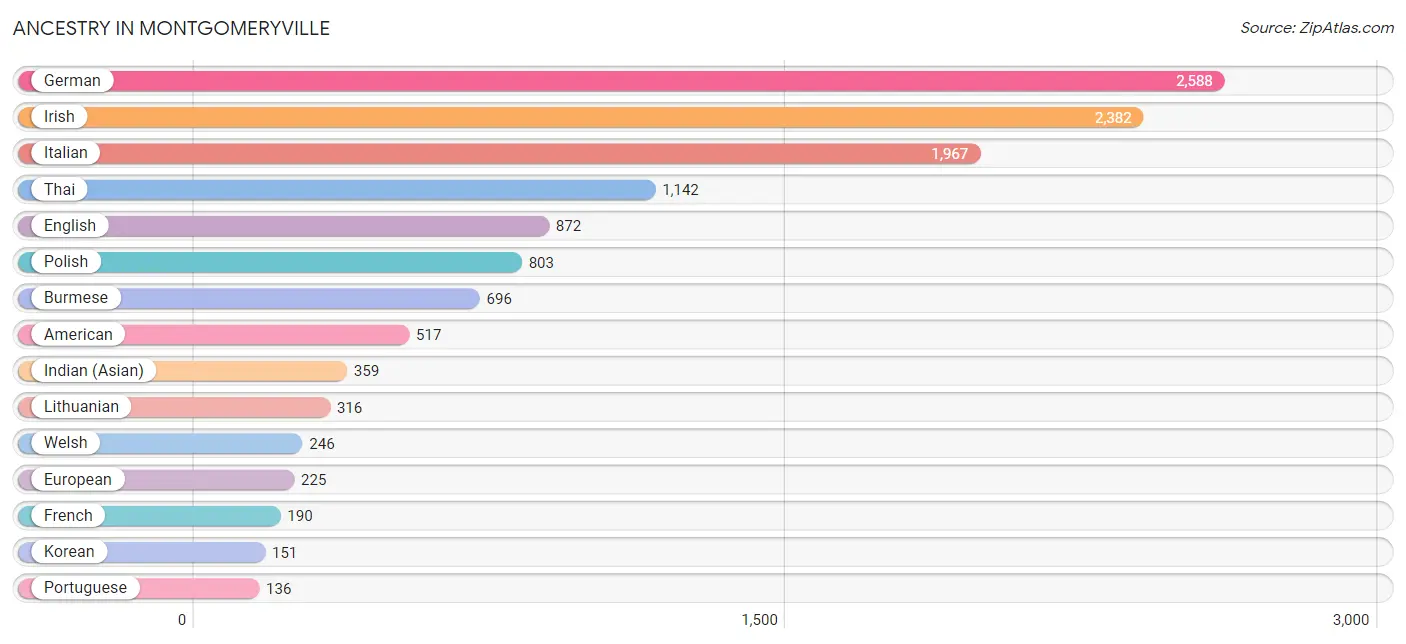
Ancestry in Montgomeryville
The most populous ancestries reported in Montgomeryville are German (2,588 | 19.9%), Irish (2,382 | 18.3%), Italian (1,967 | 15.1%), Thai (1,142 | 8.8%), and English (872 | 6.7%), together accounting for 68.8% of all Montgomeryville residents.
| Ancestry | # Population | % Population |
| African | 50 | 0.4% |
| Albanian | 11 | 0.1% |
| American | 517 | 4.0% |
| Arab | 82 | 0.6% |
| Armenian | 12 | 0.1% |
| Austrian | 73 | 0.6% |
| Bhutanese | 6 | 0.1% |
| Blackfeet | 14 | 0.1% |
| British | 19 | 0.2% |
| Burmese | 696 | 5.3% |
| Cherokee | 92 | 0.7% |
| Croatian | 20 | 0.2% |
| Czech | 22 | 0.2% |
| Czechoslovakian | 14 | 0.1% |
| Delaware | 7 | 0.1% |
| Dutch | 110 | 0.9% |
| Eastern European | 69 | 0.5% |
| English | 872 | 6.7% |
| European | 225 | 1.7% |
| Filipino | 33 | 0.3% |
| French | 190 | 1.5% |
| French Canadian | 17 | 0.1% |
| German | 2,588 | 19.9% |
| German Russian | 14 | 0.1% |
| Greek | 24 | 0.2% |
| Hungarian | 86 | 0.7% |
| Indian (Asian) | 359 | 2.8% |
| Irish | 2,382 | 18.3% |
| Iroquois | 3 | 0.0% |
| Italian | 1,967 | 15.1% |
| Jamaican | 89 | 0.7% |
| Japanese | 69 | 0.5% |
| Korean | 151 | 1.2% |
| Lebanese | 21 | 0.2% |
| Lithuanian | 316 | 2.4% |
| Mexican | 133 | 1.0% |
| Northern European | 63 | 0.5% |
| Norwegian | 9 | 0.1% |
| Pennsylvania German | 62 | 0.5% |
| Polish | 803 | 6.2% |
| Portuguese | 136 | 1.1% |
| Puerto Rican | 20 | 0.2% |
| Romanian | 9 | 0.1% |
| Russian | 88 | 0.7% |
| Scandinavian | 10 | 0.1% |
| Scotch-Irish | 46 | 0.4% |
| Scottish | 92 | 0.7% |
| Sioux | 12 | 0.1% |
| Slovak | 38 | 0.3% |
| Slovene | 9 | 0.1% |
| South American | 54 | 0.4% |
| Sri Lankan | 121 | 0.9% |
| Subsaharan African | 50 | 0.4% |
| Swedish | 118 | 0.9% |
| Swiss | 24 | 0.2% |
| Thai | 1,142 | 8.8% |
| Tongan | 22 | 0.2% |
| Trinidadian and Tobagonian | 16 | 0.1% |
| Turkish | 21 | 0.2% |
| Ukrainian | 57 | 0.4% |
| Venezuelan | 54 | 0.4% |
| Welsh | 246 | 1.9% |
| Yugoslavian | 18 | 0.1% | View All 63 Rows |
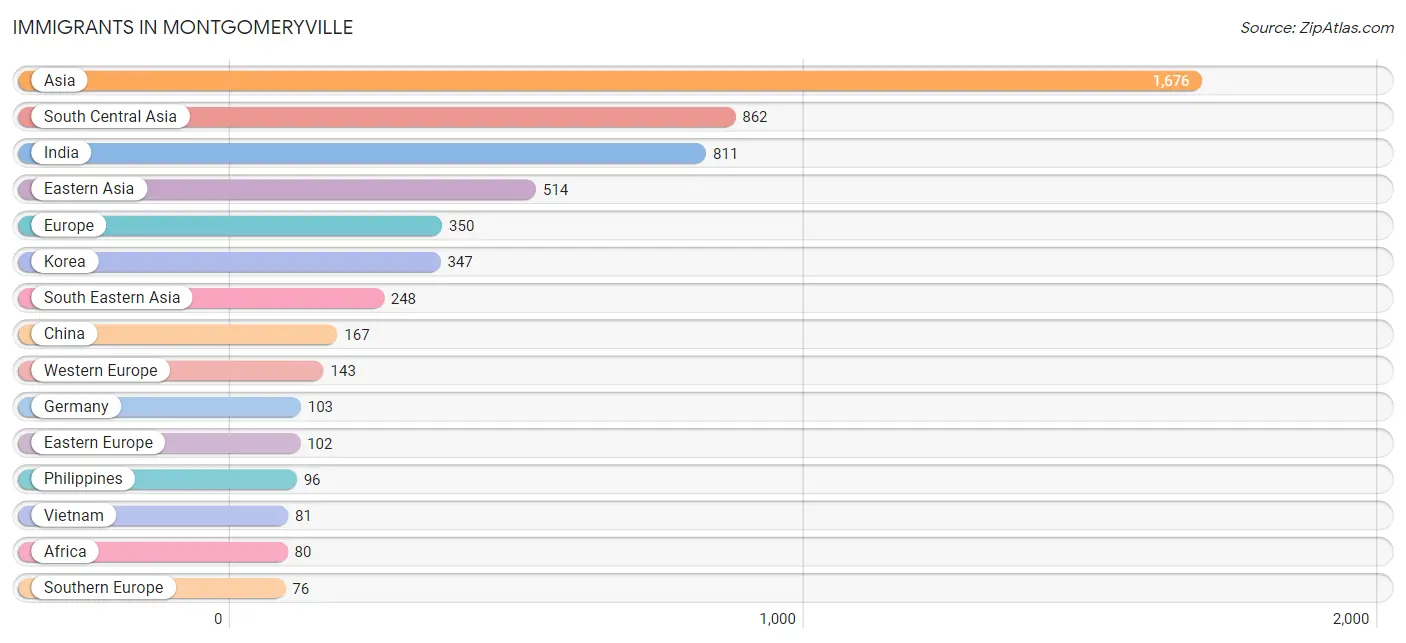
Immigrants in Montgomeryville
The most numerous immigrant groups reported in Montgomeryville came from Asia (1,676 | 12.9%), South Central Asia (862 | 6.6%), India (811 | 6.2%), Eastern Asia (514 | 4.0%), and Europe (350 | 2.7%), together accounting for 32.4% of all Montgomeryville residents.
| Immigration Origin | # Population | % Population |
| Africa | 80 | 0.6% |
| Asia | 1,676 | 12.9% |
| Bahamas | 16 | 0.1% |
| Brazil | 7 | 0.1% |
| Bulgaria | 25 | 0.2% |
| Cambodia | 54 | 0.4% |
| Canada | 11 | 0.1% |
| Caribbean | 16 | 0.1% |
| China | 167 | 1.3% |
| Eastern Africa | 26 | 0.2% |
| Eastern Asia | 514 | 4.0% |
| Eastern Europe | 102 | 0.8% |
| Egypt | 31 | 0.2% |
| England | 11 | 0.1% |
| Europe | 350 | 2.7% |
| France | 40 | 0.3% |
| Germany | 103 | 0.8% |
| Greece | 10 | 0.1% |
| Hong Kong | 32 | 0.3% |
| Hungary | 11 | 0.1% |
| India | 811 | 6.2% |
| Italy | 13 | 0.1% |
| Kazakhstan | 18 | 0.1% |
| Korea | 347 | 2.7% |
| Kuwait | 31 | 0.2% |
| Laos | 17 | 0.1% |
| Latin America | 35 | 0.3% |
| Lebanon | 11 | 0.1% |
| Nepal | 33 | 0.3% |
| Northern Africa | 42 | 0.3% |
| Northern Europe | 29 | 0.2% |
| Philippines | 96 | 0.7% |
| Poland | 27 | 0.2% |
| Portugal | 53 | 0.4% |
| South America | 19 | 0.2% |
| South Central Asia | 862 | 6.6% |
| South Eastern Asia | 248 | 1.9% |
| Southern Europe | 76 | 0.6% |
| Turkey | 10 | 0.1% |
| Ukraine | 20 | 0.2% |
| Venezuela | 12 | 0.1% |
| Vietnam | 81 | 0.6% |
| Western Asia | 52 | 0.4% |
| Western Europe | 143 | 1.1% | View All 44 Rows |
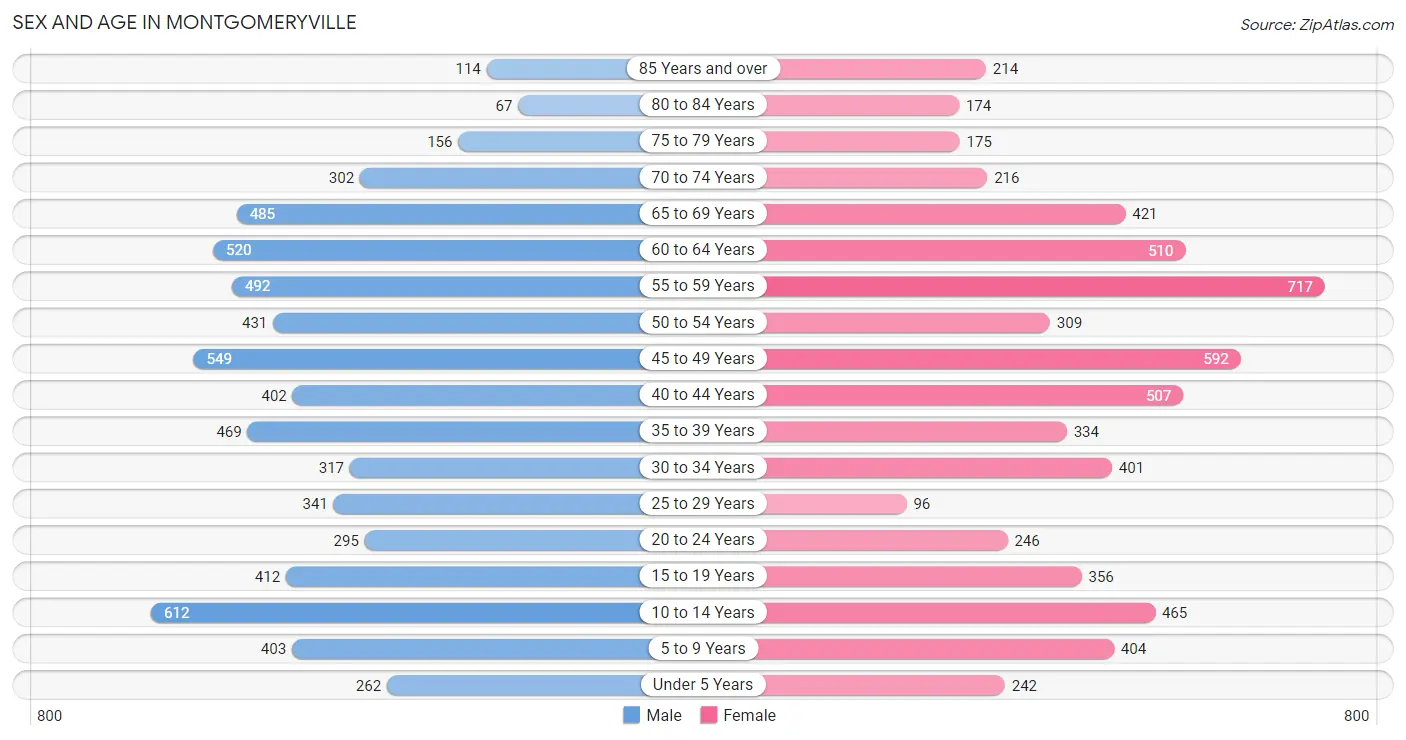
Sex and Age in Montgomeryville
Sex and Age in Montgomeryville
The most populous age groups in Montgomeryville are 10 to 14 Years (612 | 9.2%) for men and 55 to 59 Years (717 | 11.2%) for women.
| Age Bracket | Male | Female |
| Under 5 Years | 262 (4.0%) | 242 (3.8%) |
| 5 to 9 Years | 403 (6.1%) | 404 (6.3%) |
| 10 to 14 Years | 612 (9.2%) | 465 (7.3%) |
| 15 to 19 Years | 412 (6.2%) | 356 (5.6%) |
| 20 to 24 Years | 295 (4.4%) | 246 (3.9%) |
| 25 to 29 Years | 341 (5.1%) | 96 (1.5%) |
| 30 to 34 Years | 317 (4.8%) | 401 (6.3%) |
| 35 to 39 Years | 469 (7.1%) | 334 (5.2%) |
| 40 to 44 Years | 402 (6.1%) | 507 (8.0%) |
| 45 to 49 Years | 549 (8.3%) | 592 (9.3%) |
| 50 to 54 Years | 431 (6.5%) | 309 (4.8%) |
| 55 to 59 Years | 492 (7.4%) | 717 (11.2%) |
| 60 to 64 Years | 520 (7.8%) | 510 (8.0%) |
| 65 to 69 Years | 485 (7.3%) | 421 (6.6%) |
| 70 to 74 Years | 302 (4.6%) | 216 (3.4%) |
| 75 to 79 Years | 156 (2.4%) | 175 (2.7%) |
| 80 to 84 Years | 67 (1.0%) | 174 (2.7%) |
| 85 Years and over | 114 (1.7%) | 214 (3.4%) |
| Total | 6,629 (100.0%) | 6,379 (100.0%) |
Families and Households in Montgomeryville
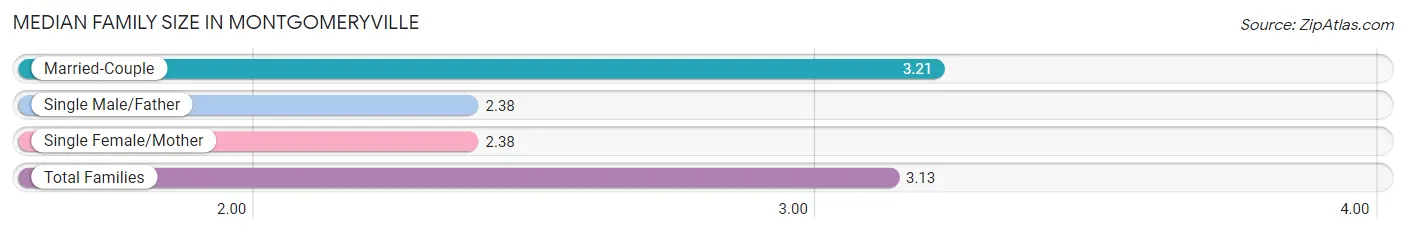
Median Family Size in Montgomeryville
The median family size in Montgomeryville is 3.13 persons per family, with married-couple families (3,346 | 90.0%) accounting for the largest median family size of 3.21 persons per family. On the other hand, single male/father families (82 | 2.2%) represent the smallest median family size with 2.38 persons per family.
| Family Type | # Families | Family Size |
| Married-Couple | 3,346 (90.0%) | 3.21 |
| Single Male/Father | 82 (2.2%) | 2.38 |
| Single Female/Mother | 291 (7.8%) | 2.38 |
| Total Families | 3,719 (100.0%) | 3.13 |
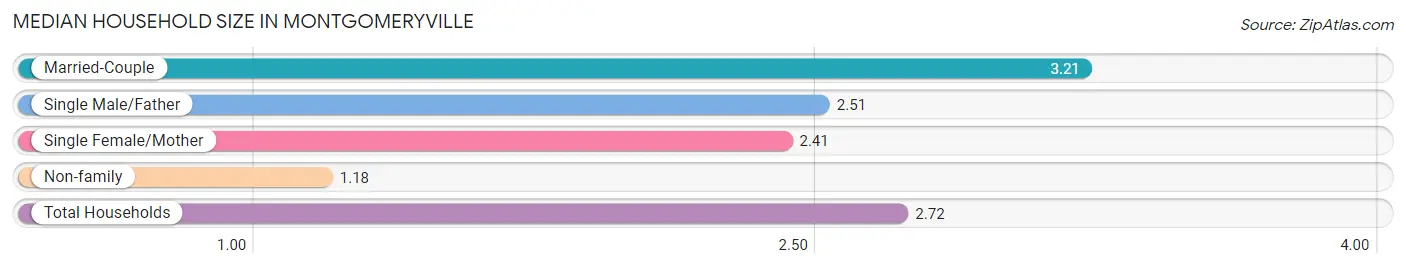
Median Household Size in Montgomeryville
The median household size in Montgomeryville is 2.72 persons per household, with married-couple households (3,346 | 70.8%) accounting for the largest median household size of 3.21 persons per household. non-family households (1,007 | 21.3%) represent the smallest median household size with 1.18 persons per household.
| Household Type | # Households | Household Size |
| Married-Couple | 3,346 (70.8%) | 3.21 |
| Single Male/Father | 82 (1.7%) | 2.51 |
| Single Female/Mother | 291 (6.2%) | 2.41 |
| Non-family | 1,007 (21.3%) | 1.18 |
| Total Households | 4,726 (100.0%) | 2.72 |
Household Size by Marriage Status in Montgomeryville
Out of a total of 4,726 households in Montgomeryville, 3,719 (78.7%) are family households, while 1,007 (21.3%) are nonfamily households. The most numerous type of family households are 2-person households, comprising 1,600, and the most common type of nonfamily households are 1-person households, comprising 854.
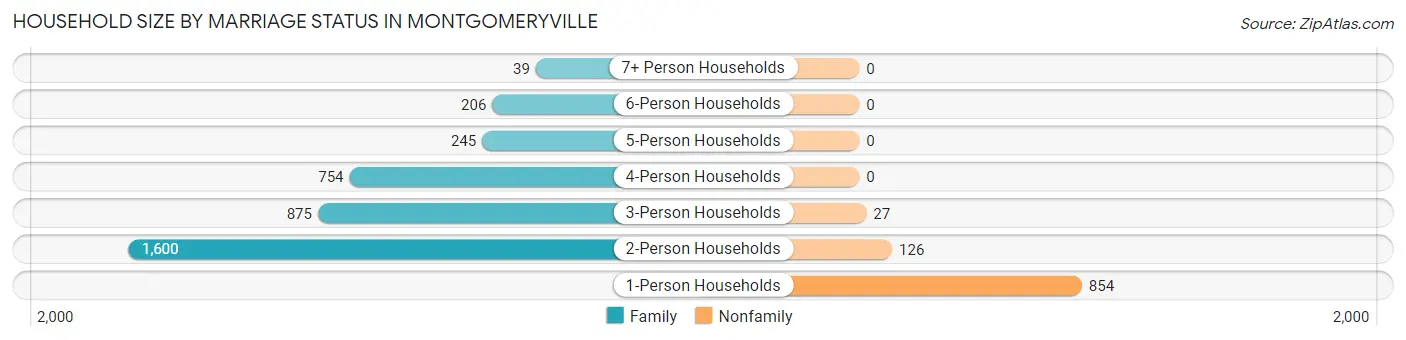
| Household Size | Family Households | Nonfamily Households |
| 1-Person Households | - | 854 (18.1%) |
| 2-Person Households | 1,600 (33.9%) | 126 (2.7%) |
| 3-Person Households | 875 (18.5%) | 27 (0.6%) |
| 4-Person Households | 754 (16.0%) | 0 (0.0%) |
| 5-Person Households | 245 (5.2%) | 0 (0.0%) |
| 6-Person Households | 206 (4.4%) | 0 (0.0%) |
| 7+ Person Households | 39 (0.8%) | 0 (0.0%) |
| Total | 3,719 (78.7%) | 1,007 (21.3%) |
Female Fertility in Montgomeryville
Fertility by Age in Montgomeryville
Average fertility rate in Montgomeryville is 34.0 births per 1,000 women. Women in the age bracket of 20 to 34 years have the highest fertility rate with 105.0 births per 1,000 women. Women in the age bracket of 20 to 34 years acount for 89.7% of all women with births.
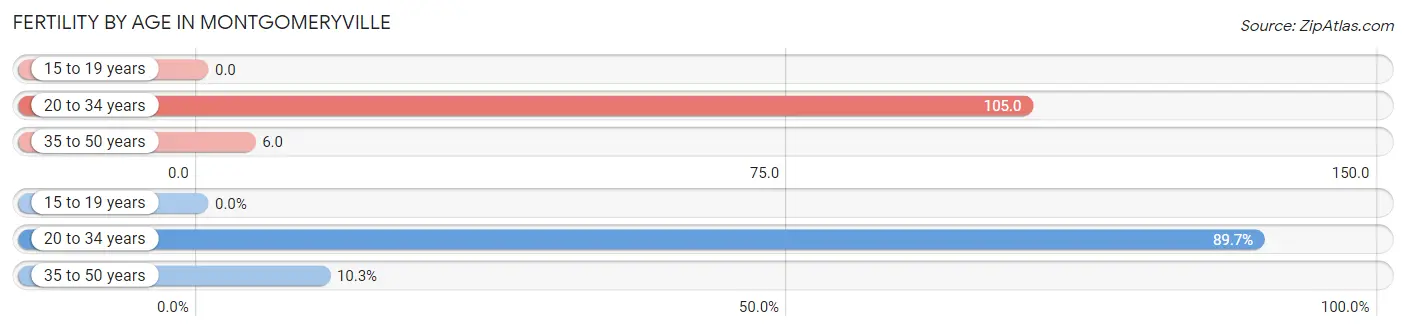
| Age Bracket | Women with Births | Births / 1,000 Women |
| 15 to 19 years | 0 (0.0%) | 0.0 |
| 20 to 34 years | 78 (89.7%) | 105.0 |
| 35 to 50 years | 9 (10.3%) | 6.0 |
| Total | 87 (100.0%) | 34.0 |
Fertility by Age by Marriage Status in Montgomeryville
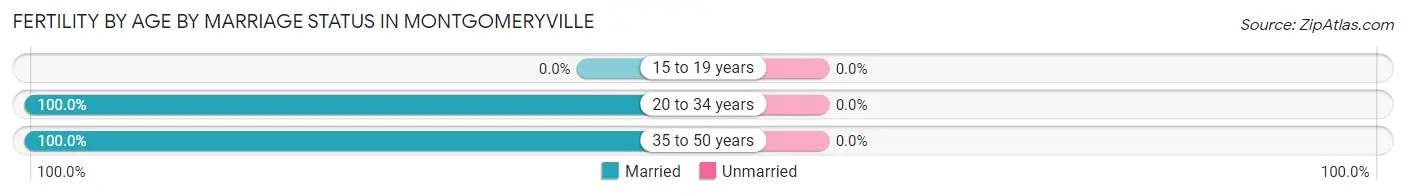
| Age Bracket | Married | Unmarried |
| 15 to 19 years | 0 (0.0%) | 0 (0.0%) |
| 20 to 34 years | 78 (100.0%) | 0 (0.0%) |
| 35 to 50 years | 9 (100.0%) | 0 (0.0%) |
| Total | 87 (100.0%) | 0 (0.0%) |
Fertility by Education in Montgomeryville
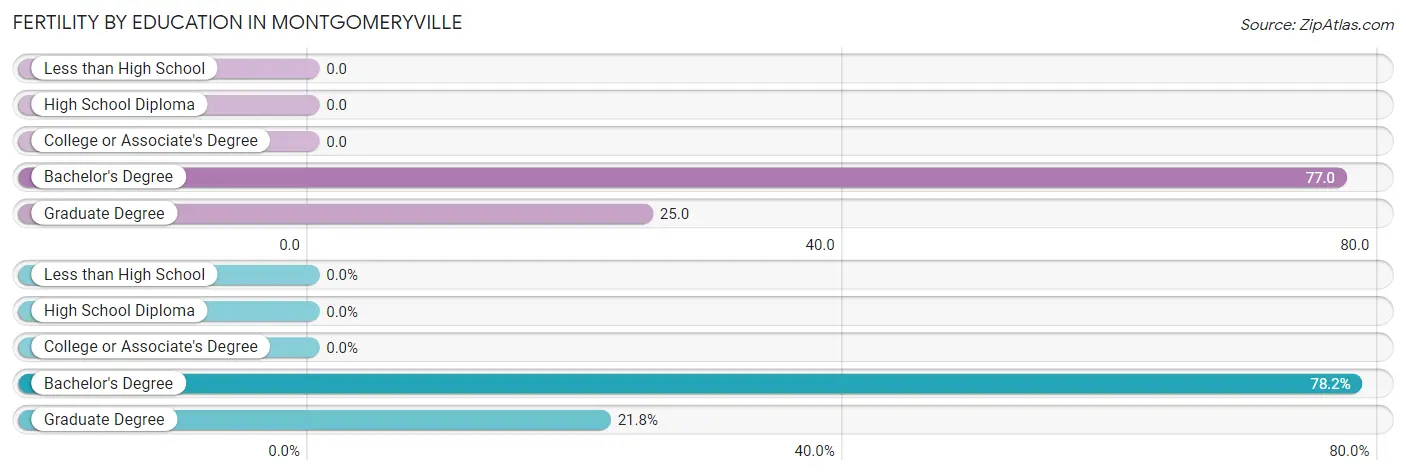
| Educational Attainment | Women with Births | Births / 1,000 Women |
| Less than High School | 0 (0.0%) | 0.0 |
| High School Diploma | 0 (0.0%) | 0.0 |
| College or Associate's Degree | 0 (0.0%) | 0.0 |
| Bachelor's Degree | 68 (78.2%) | 77.0 |
| Graduate Degree | 19 (21.8%) | 25.0 |
| Total | 87 (100.0%) | 34.0 |
Fertility by Education by Marriage Status in Montgomeryville
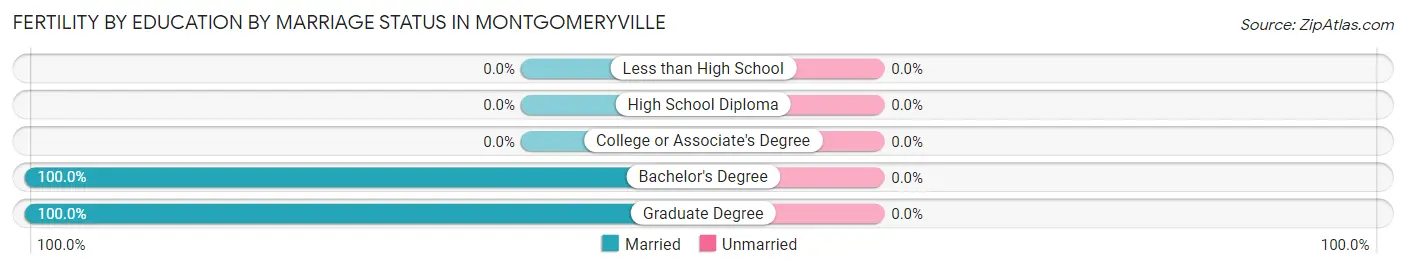
| Educational Attainment | Married | Unmarried |
| Less than High School | 0 (0.0%) | 0 (0.0%) |
| High School Diploma | 0 (0.0%) | 0 (0.0%) |
| College or Associate's Degree | 0 (0.0%) | 0 (0.0%) |
| Bachelor's Degree | 68 (100.0%) | 0 (0.0%) |
| Graduate Degree | 19 (100.0%) | 0 (0.0%) |
| Total | 87 (100.0%) | 0 (0.0%) |
Employment Characteristics in Montgomeryville
Employment by Class of Employer in Montgomeryville
Among the 6,471 employed individuals in Montgomeryville, private company employees (4,358 | 67.3%), not-for-profit organizations (839 | 13.0%), and self-employed (incorporated) (477 | 7.4%) make up the most common classes of employment.
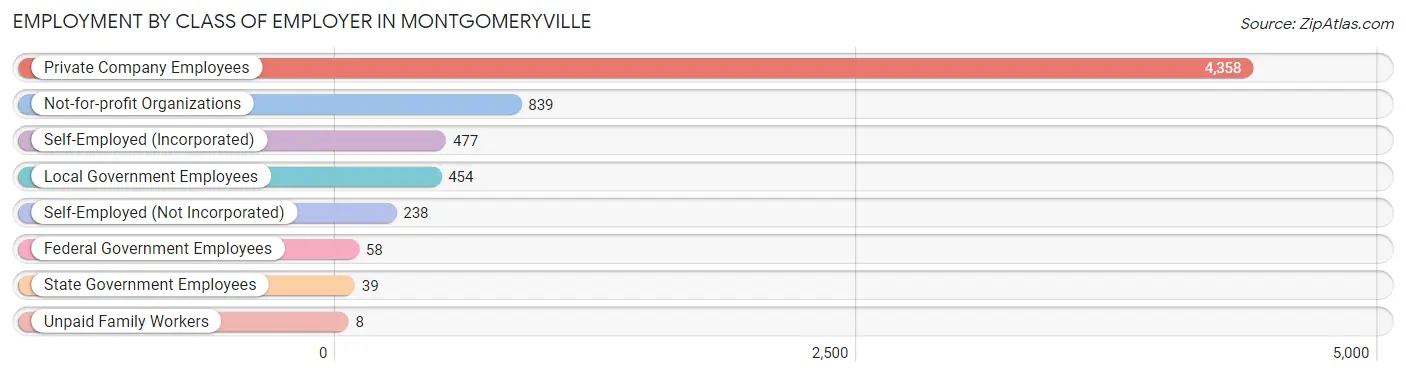
| Employer Class | # Employees | % Employees |
| Private Company Employees | 4,358 | 67.3% |
| Self-Employed (Incorporated) | 477 | 7.4% |
| Self-Employed (Not Incorporated) | 238 | 3.7% |
| Not-for-profit Organizations | 839 | 13.0% |
| Local Government Employees | 454 | 7.0% |
| State Government Employees | 39 | 0.6% |
| Federal Government Employees | 58 | 0.9% |
| Unpaid Family Workers | 8 | 0.1% |
| Total | 6,471 | 100.0% |
Employment Status by Age in Montgomeryville
According to the labor force statistics for Montgomeryville, out of the total population over 16 years of age (10,376), 68.7% or 7,128 individuals are in the labor force, with 7.3% or 520 of them unemployed. The age group with the highest labor force participation rate is 30 to 34 years, with 94.3% or 677 individuals in the labor force. Within the labor force, the 20 to 24 years age range has the highest percentage of unemployed individuals, with 37.6% or 157 of them being unemployed.
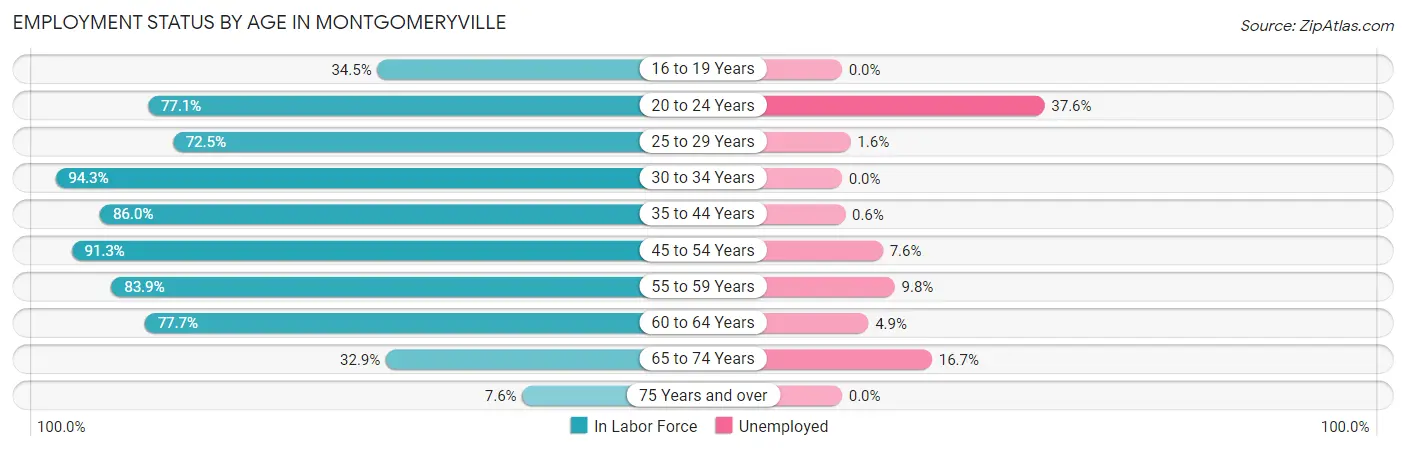
| Age Bracket | In Labor Force | Unemployed |
| 16 to 19 Years | 181 (34.5%) | 0 (0.0%) |
| 20 to 24 Years | 417 (77.1%) | 157 (37.6%) |
| 25 to 29 Years | 317 (72.5%) | 5 (1.6%) |
| 30 to 34 Years | 677 (94.3%) | 0 (0.0%) |
| 35 to 44 Years | 1,472 (86.0%) | 9 (0.6%) |
| 45 to 54 Years | 1,717 (91.3%) | 130 (7.6%) |
| 55 to 59 Years | 1,014 (83.9%) | 99 (9.8%) |
| 60 to 64 Years | 800 (77.7%) | 39 (4.9%) |
| 65 to 74 Years | 468 (32.9%) | 78 (16.7%) |
| 75 Years and over | 68 (7.6%) | 0 (0.0%) |
| Total | 7,128 (68.7%) | 520 (7.3%) |
Employment Status by Educational Attainment in Montgomeryville
According to labor force statistics for Montgomeryville, 85.8% of individuals (5,995) out of the total population between 25 and 64 years of age (6,987) are in the labor force, with 4.7% or 282 of them being unemployed. The group with the highest labor force participation rate are those with the educational attainment of college / associate degree, with 89.5% or 1,267 individuals in the labor force. Within the labor force, individuals with high school diploma education have the highest percentage of unemployment, with 11.9% or 100 of them being unemployed.
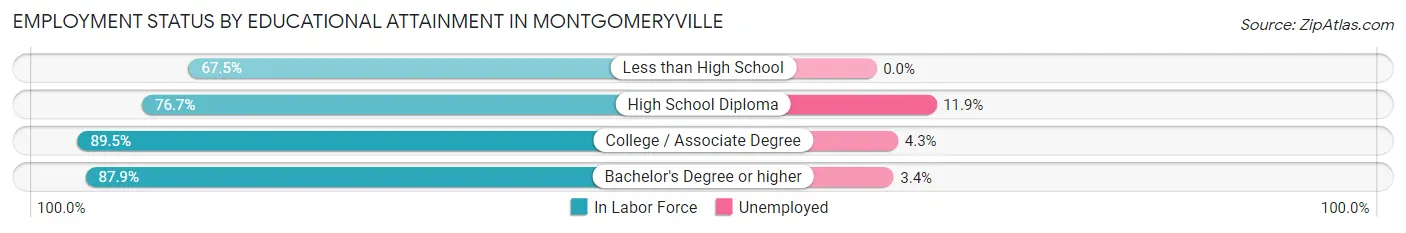
| Educational Attainment | In Labor Force | Unemployed |
| Less than High School | 139 (67.5%) | 0 (0.0%) |
| High School Diploma | 841 (76.7%) | 130 (11.9%) |
| College / Associate Degree | 1,267 (89.5%) | 61 (4.3%) |
| Bachelor's Degree or higher | 3,752 (87.9%) | 145 (3.4%) |
| Total | 5,995 (85.8%) | 328 (4.7%) |
Employment Occupations by Sex in Montgomeryville
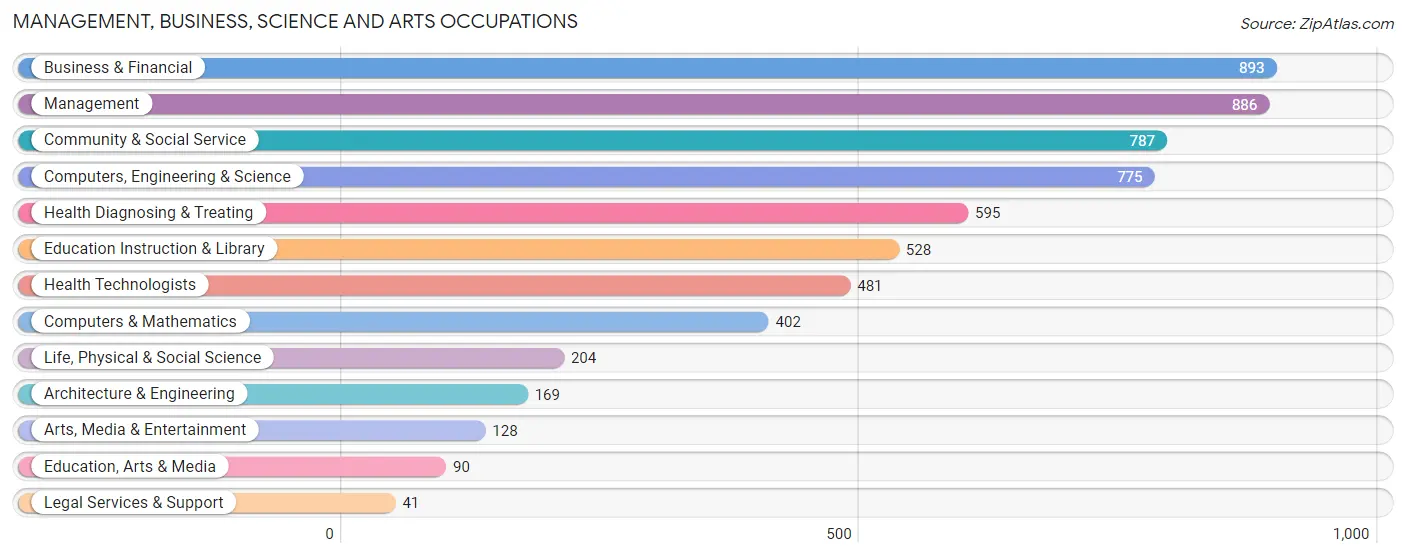
Management, Business, Science and Arts Occupations
The most common Management, Business, Science and Arts occupations in Montgomeryville are Business & Financial (893 | 13.5%), Management (886 | 13.4%), Community & Social Service (787 | 11.9%), Computers, Engineering & Science (775 | 11.7%), and Health Diagnosing & Treating (595 | 9.0%).
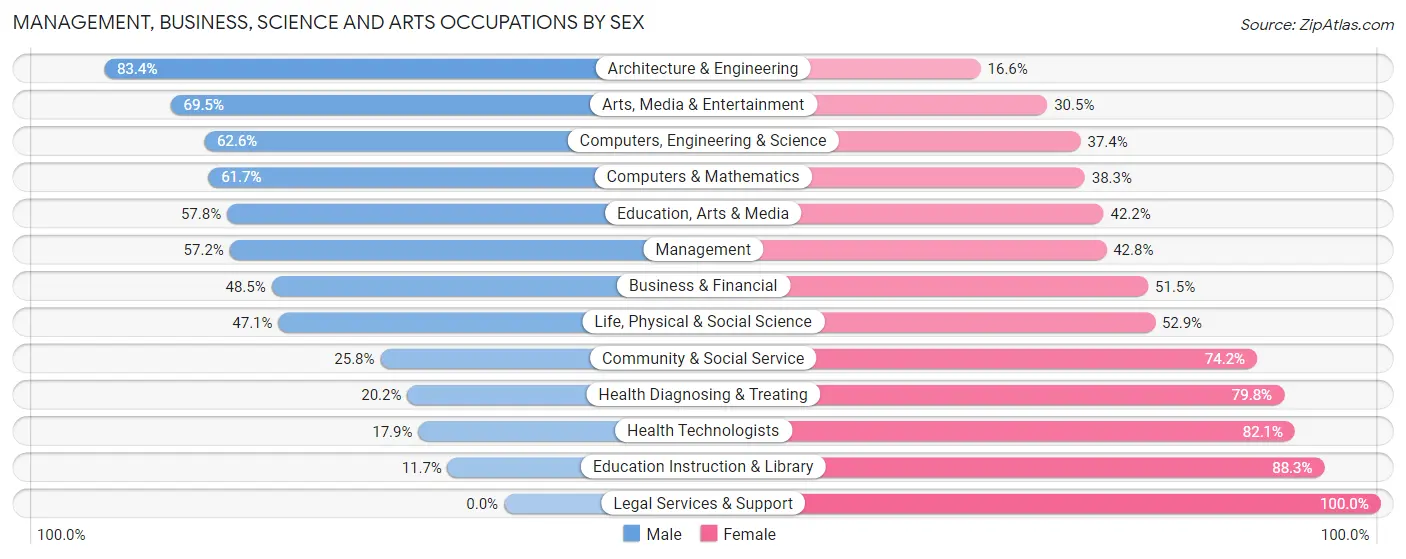
Management, Business, Science and Arts Occupations by Sex
Within the Management, Business, Science and Arts occupations in Montgomeryville, the most male-oriented occupations are Architecture & Engineering (83.4%), Arts, Media & Entertainment (69.5%), and Computers, Engineering & Science (62.6%), while the most female-oriented occupations are Legal Services & Support (100.0%), Education Instruction & Library (88.3%), and Health Technologists (82.1%).
| Occupation | Male | Female |
| Management | 507 (57.2%) | 379 (42.8%) |
| Business & Financial | 433 (48.5%) | 460 (51.5%) |
| Computers, Engineering & Science | 485 (62.6%) | 290 (37.4%) |
| Computers & Mathematics | 248 (61.7%) | 154 (38.3%) |
| Architecture & Engineering | 141 (83.4%) | 28 (16.6%) |
| Life, Physical & Social Science | 96 (47.1%) | 108 (52.9%) |
| Community & Social Service | 203 (25.8%) | 584 (74.2%) |
| Education, Arts & Media | 52 (57.8%) | 38 (42.2%) |
| Legal Services & Support | 0 (0.0%) | 41 (100.0%) |
| Education Instruction & Library | 62 (11.7%) | 466 (88.3%) |
| Arts, Media & Entertainment | 89 (69.5%) | 39 (30.5%) |
| Health Diagnosing & Treating | 120 (20.2%) | 475 (79.8%) |
| Health Technologists | 86 (17.9%) | 395 (82.1%) |
| Total (Category) | 1,748 (44.4%) | 2,188 (55.6%) |
| Total (Overall) | 3,415 (51.6%) | 3,199 (48.4%) |
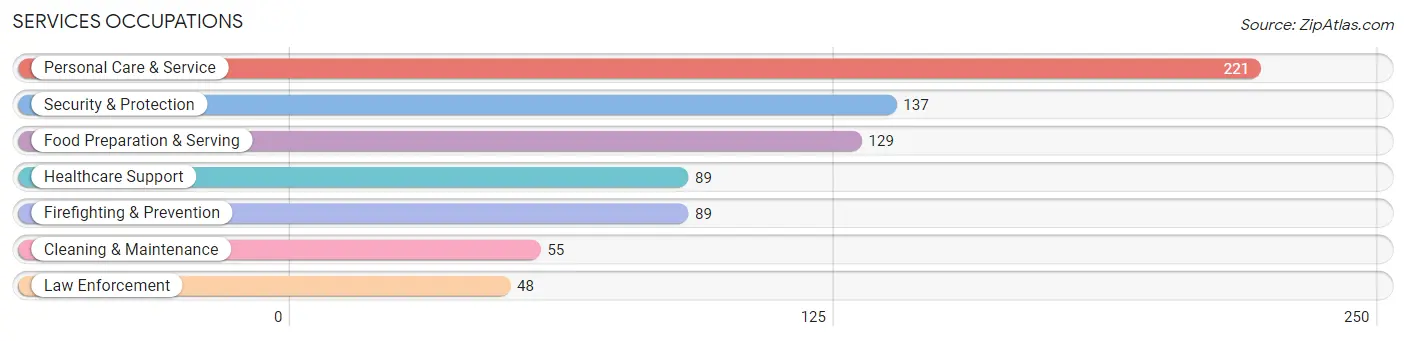
Services Occupations
The most common Services occupations in Montgomeryville are Personal Care & Service (221 | 3.3%), Security & Protection (137 | 2.1%), Food Preparation & Serving (129 | 1.9%), Healthcare Support (89 | 1.3%), and Firefighting & Prevention (89 | 1.3%).
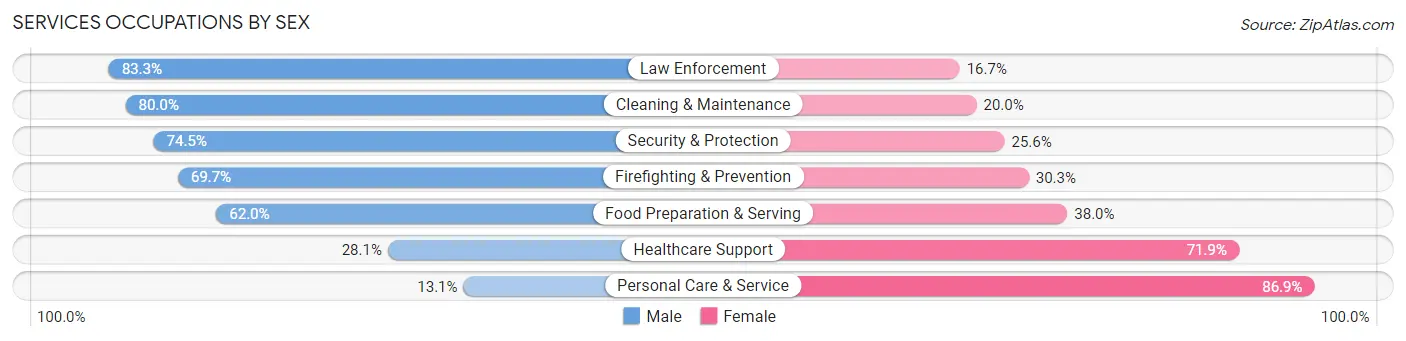
Services Occupations by Sex
Within the Services occupations in Montgomeryville, the most male-oriented occupations are Law Enforcement (83.3%), Cleaning & Maintenance (80.0%), and Security & Protection (74.5%), while the most female-oriented occupations are Personal Care & Service (86.9%), Healthcare Support (71.9%), and Food Preparation & Serving (38.0%).
| Occupation | Male | Female |
| Healthcare Support | 25 (28.1%) | 64 (71.9%) |
| Security & Protection | 102 (74.5%) | 35 (25.6%) |
| Firefighting & Prevention | 62 (69.7%) | 27 (30.3%) |
| Law Enforcement | 40 (83.3%) | 8 (16.7%) |
| Food Preparation & Serving | 80 (62.0%) | 49 (38.0%) |
| Cleaning & Maintenance | 44 (80.0%) | 11 (20.0%) |
| Personal Care & Service | 29 (13.1%) | 192 (86.9%) |
| Total (Category) | 280 (44.4%) | 351 (55.6%) |
| Total (Overall) | 3,415 (51.6%) | 3,199 (48.4%) |
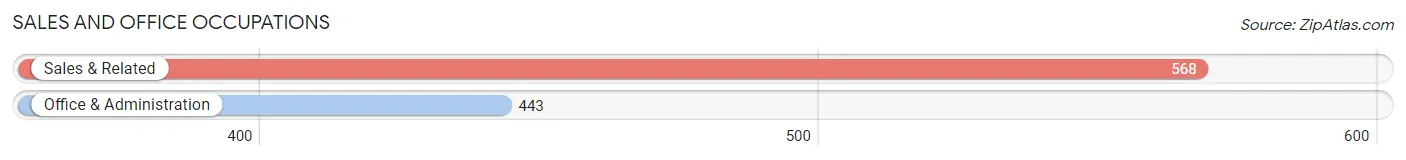
Sales and Office Occupations
The most common Sales and Office occupations in Montgomeryville are Sales & Related (568 | 8.6%), and Office & Administration (443 | 6.7%).
Sales and Office Occupations by Sex
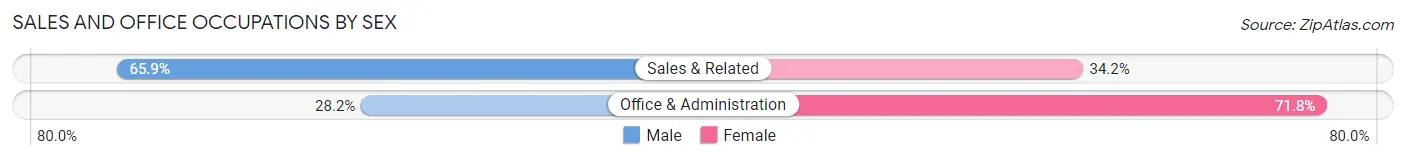
| Occupation | Male | Female |
| Sales & Related | 374 (65.8%) | 194 (34.2%) |
| Office & Administration | 125 (28.2%) | 318 (71.8%) |
| Total (Category) | 499 (49.4%) | 512 (50.6%) |
| Total (Overall) | 3,415 (51.6%) | 3,199 (48.4%) |
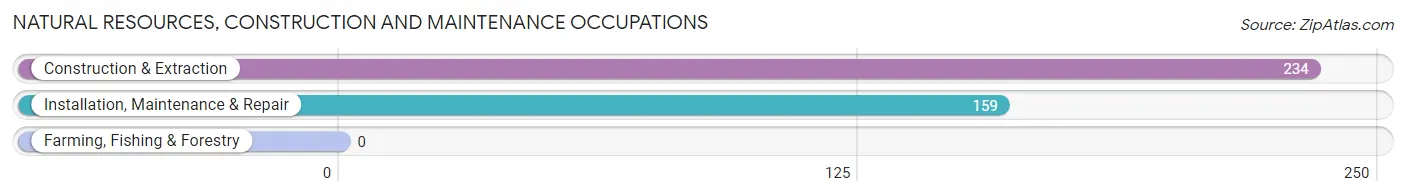
Natural Resources, Construction and Maintenance Occupations
The most common Natural Resources, Construction and Maintenance occupations in Montgomeryville are Construction & Extraction (234 | 3.5%), and Installation, Maintenance & Repair (159 | 2.4%).
Natural Resources, Construction and Maintenance Occupations by Sex
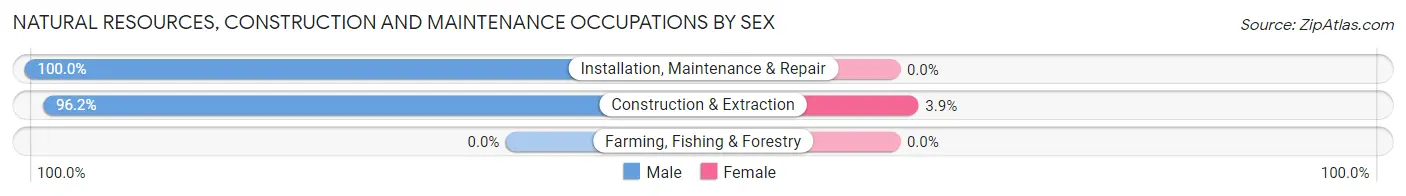
| Occupation | Male | Female |
| Farming, Fishing & Forestry | 0 (0.0%) | 0 (0.0%) |
| Construction & Extraction | 225 (96.2%) | 9 (3.8%) |
| Installation, Maintenance & Repair | 159 (100.0%) | 0 (0.0%) |
| Total (Category) | 384 (97.7%) | 9 (2.3%) |
| Total (Overall) | 3,415 (51.6%) | 3,199 (48.4%) |
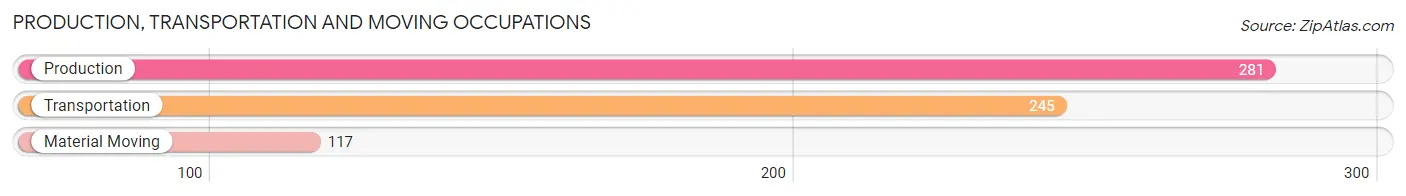
Production, Transportation and Moving Occupations
The most common Production, Transportation and Moving occupations in Montgomeryville are Production (281 | 4.3%), Transportation (245 | 3.7%), and Material Moving (117 | 1.8%).
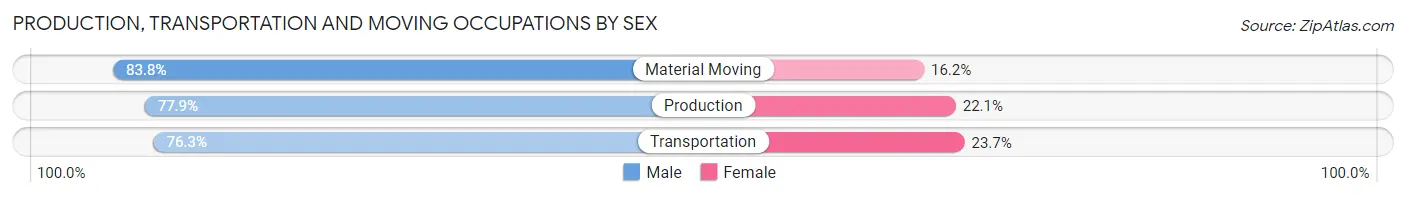
Production, Transportation and Moving Occupations by Sex
| Occupation | Male | Female |
| Production | 219 (77.9%) | 62 (22.1%) |
| Transportation | 187 (76.3%) | 58 (23.7%) |
| Material Moving | 98 (83.8%) | 19 (16.2%) |
| Total (Category) | 504 (78.4%) | 139 (21.6%) |
| Total (Overall) | 3,415 (51.6%) | 3,199 (48.4%) |
Employment Industries by Sex in Montgomeryville
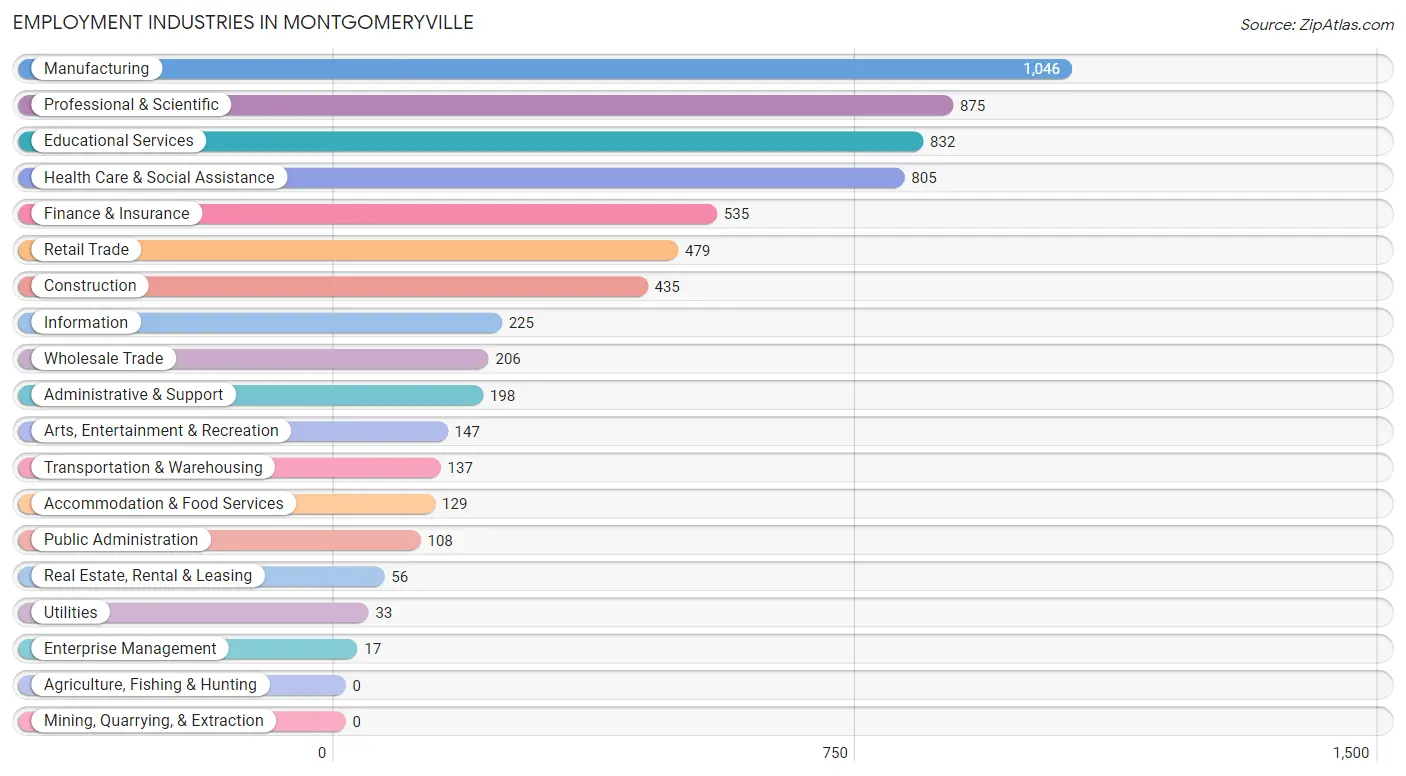
Employment Industries in Montgomeryville
The major employment industries in Montgomeryville include Manufacturing (1,046 | 15.8%), Professional & Scientific (875 | 13.2%), Educational Services (832 | 12.6%), Health Care & Social Assistance (805 | 12.2%), and Finance & Insurance (535 | 8.1%).
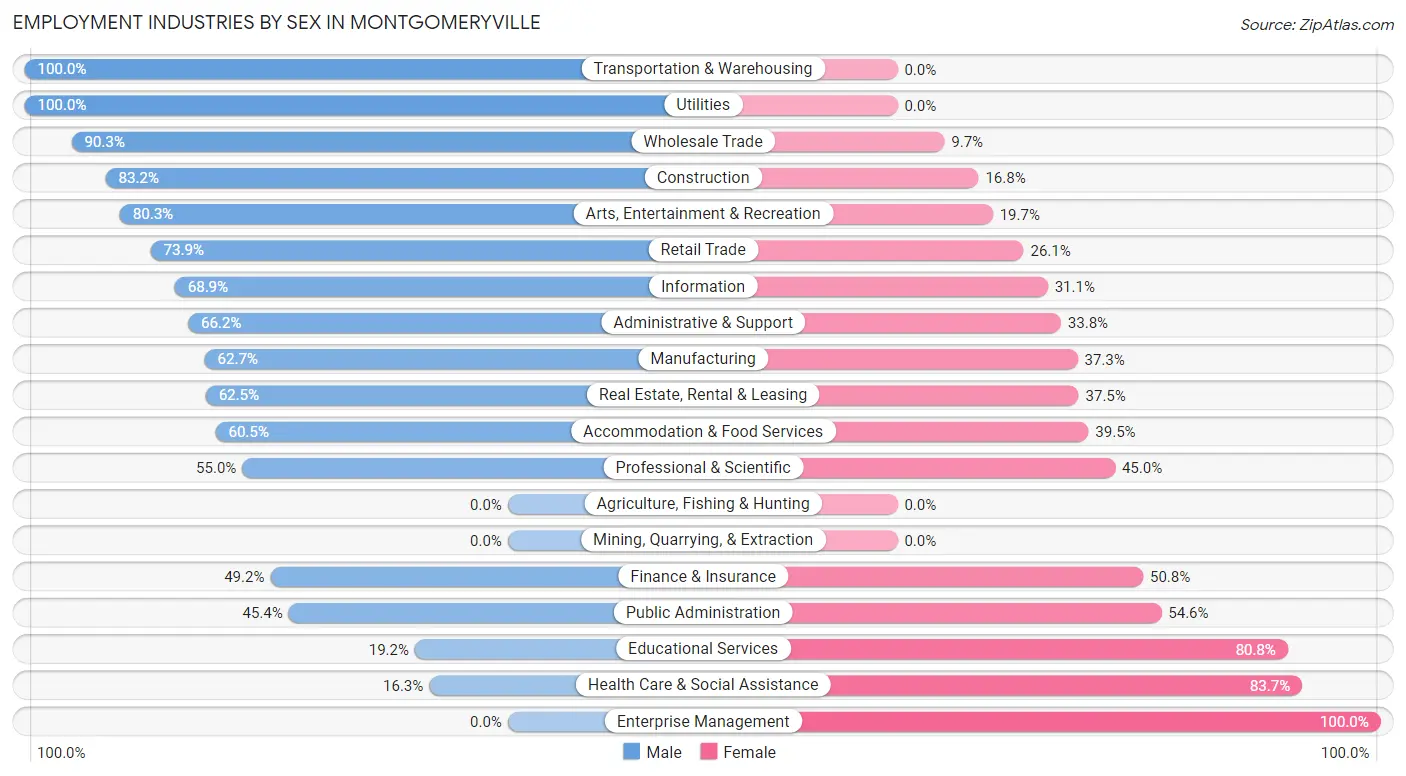
Employment Industries by Sex in Montgomeryville
The Montgomeryville industries that see more men than women are Transportation & Warehousing (100.0%), Utilities (100.0%), and Wholesale Trade (90.3%), whereas the industries that tend to have a higher number of women are Enterprise Management (100.0%), Health Care & Social Assistance (83.7%), and Educational Services (80.8%).
| Industry | Male | Female |
| Agriculture, Fishing & Hunting | 0 (0.0%) | 0 (0.0%) |
| Mining, Quarrying, & Extraction | 0 (0.0%) | 0 (0.0%) |
| Construction | 362 (83.2%) | 73 (16.8%) |
| Manufacturing | 656 (62.7%) | 390 (37.3%) |
| Wholesale Trade | 186 (90.3%) | 20 (9.7%) |
| Retail Trade | 354 (73.9%) | 125 (26.1%) |
| Transportation & Warehousing | 137 (100.0%) | 0 (0.0%) |
| Utilities | 33 (100.0%) | 0 (0.0%) |
| Information | 155 (68.9%) | 70 (31.1%) |
| Finance & Insurance | 263 (49.2%) | 272 (50.8%) |
| Real Estate, Rental & Leasing | 35 (62.5%) | 21 (37.5%) |
| Professional & Scientific | 481 (55.0%) | 394 (45.0%) |
| Enterprise Management | 0 (0.0%) | 17 (100.0%) |
| Administrative & Support | 131 (66.2%) | 67 (33.8%) |
| Educational Services | 160 (19.2%) | 672 (80.8%) |
| Health Care & Social Assistance | 131 (16.3%) | 674 (83.7%) |
| Arts, Entertainment & Recreation | 118 (80.3%) | 29 (19.7%) |
| Accommodation & Food Services | 78 (60.5%) | 51 (39.5%) |
| Public Administration | 49 (45.4%) | 59 (54.6%) |
| Total | 3,415 (51.6%) | 3,199 (48.4%) |
Education in Montgomeryville
School Enrollment in Montgomeryville
The most common levels of schooling among the 3,270 students in Montgomeryville are middle school (843 | 25.8%), elementary school (734 | 22.5%), and high school (699 | 21.4%).
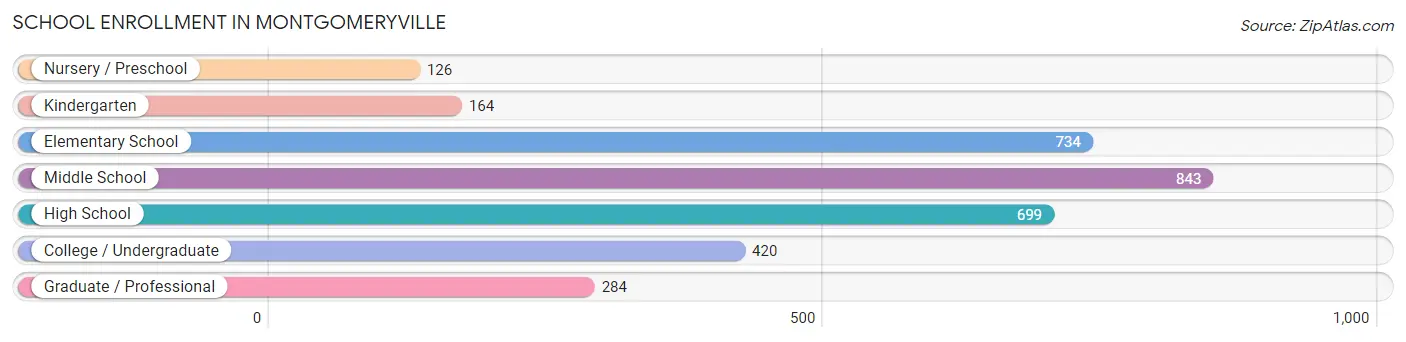
| School Level | # Students | % Students |
| Nursery / Preschool | 126 | 3.8% |
| Kindergarten | 164 | 5.0% |
| Elementary School | 734 | 22.5% |
| Middle School | 843 | 25.8% |
| High School | 699 | 21.4% |
| College / Undergraduate | 420 | 12.8% |
| Graduate / Professional | 284 | 8.7% |
| Total | 3,270 | 100.0% |
School Enrollment by Age by Funding Source in Montgomeryville
Out of a total of 3,270 students who are enrolled in schools in Montgomeryville, 471 (14.4%) attend a private institution, while the remaining 2,799 (85.6%) are enrolled in public schools. The age group of 20 to 24 year olds has the highest likelihood of being enrolled in private schools, with 44 (24.6% in the age bracket) enrolled. Conversely, the age group of 25 to 34 year olds has the lowest likelihood of being enrolled in a private school, with 137 (100.0% in the age bracket) attending a public institution.
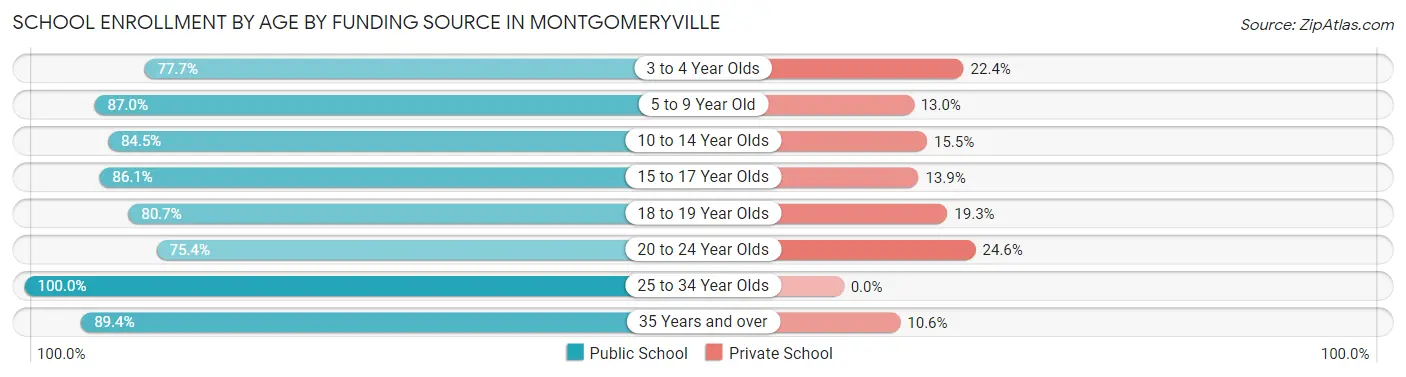
| Age Bracket | Public School | Private School |
| 3 to 4 Year Olds | 66 (77.6%) | 19 (22.4%) |
| 5 to 9 Year Old | 687 (87.0%) | 103 (13.0%) |
| 10 to 14 Year Olds | 881 (84.5%) | 162 (15.5%) |
| 15 to 17 Year Olds | 463 (86.1%) | 75 (13.9%) |
| 18 to 19 Year Olds | 142 (80.7%) | 34 (19.3%) |
| 20 to 24 Year Olds | 135 (75.4%) | 44 (24.6%) |
| 25 to 34 Year Olds | 137 (100.0%) | 0 (0.0%) |
| 35 Years and over | 288 (89.4%) | 34 (10.6%) |
| Total | 2,799 (85.6%) | 471 (14.4%) |
Educational Attainment by Field of Study in Montgomeryville
Business (1,261 | 24.1%), education (751 | 14.3%), science & technology (590 | 11.3%), engineering (472 | 9.0%), and bio, nature & agricultural (412 | 7.9%) are the most common fields of study among 5,240 individuals in Montgomeryville who have obtained a bachelor's degree or higher.
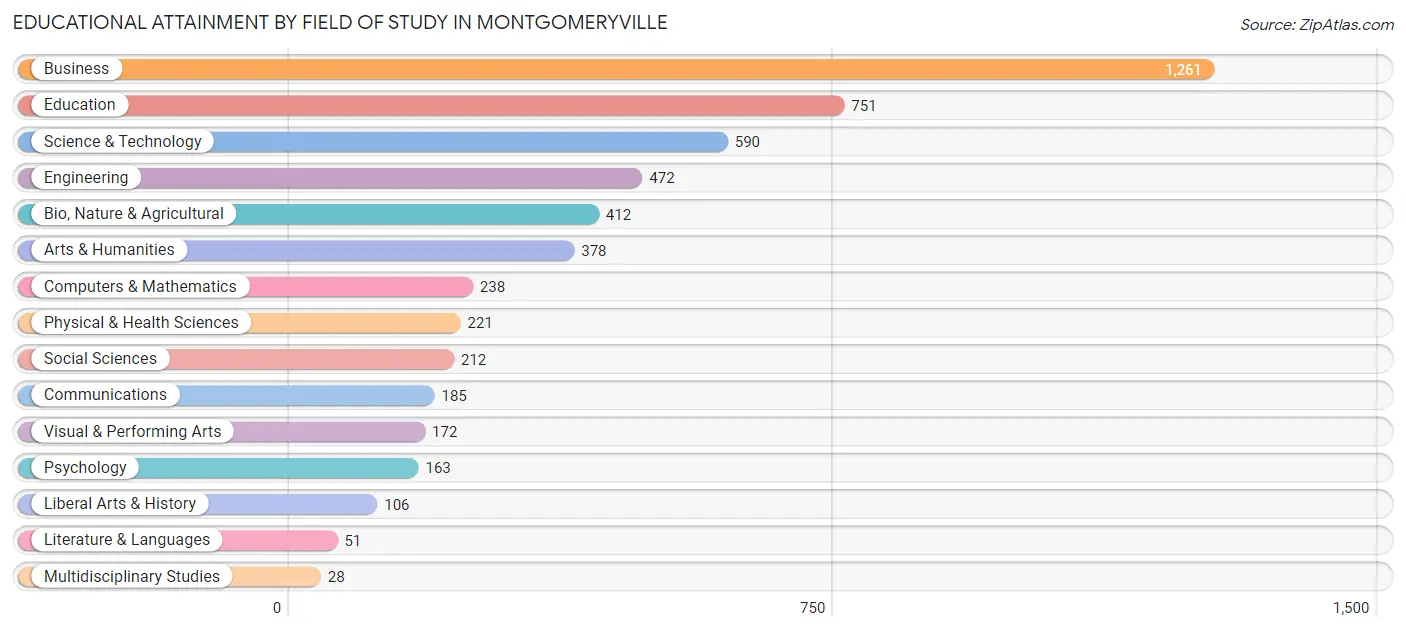
| Field of Study | # Graduates | % Graduates |
| Computers & Mathematics | 238 | 4.5% |
| Bio, Nature & Agricultural | 412 | 7.9% |
| Physical & Health Sciences | 221 | 4.2% |
| Psychology | 163 | 3.1% |
| Social Sciences | 212 | 4.1% |
| Engineering | 472 | 9.0% |
| Multidisciplinary Studies | 28 | 0.5% |
| Science & Technology | 590 | 11.3% |
| Business | 1,261 | 24.1% |
| Education | 751 | 14.3% |
| Literature & Languages | 51 | 1.0% |
| Liberal Arts & History | 106 | 2.0% |
| Visual & Performing Arts | 172 | 3.3% |
| Communications | 185 | 3.5% |
| Arts & Humanities | 378 | 7.2% |
| Total | 5,240 | 100.0% |
Transportation & Commute in Montgomeryville
Vehicle Availability by Sex in Montgomeryville
The most prevalent vehicle ownership categories in Montgomeryville are males with 2 vehicles (1,739, accounting for 51.1%) and females with 2 vehicles (1,588, making up 56.6%).
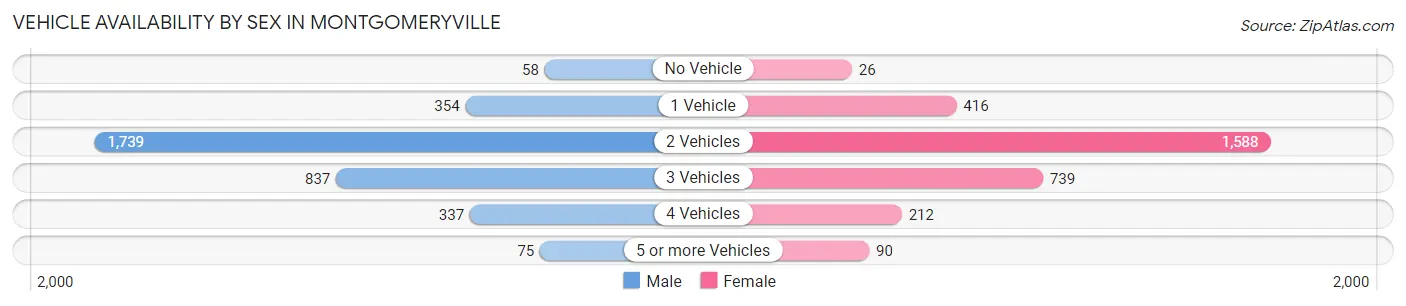
| Vehicles Available | Male | Female |
| No Vehicle | 58 (1.7%) | 26 (0.9%) |
| 1 Vehicle | 354 (10.4%) | 416 (13.6%) |
| 2 Vehicles | 1,739 (51.1%) | 1,588 (51.7%) |
| 3 Vehicles | 837 (24.6%) | 739 (24.1%) |
| 4 Vehicles | 337 (9.9%) | 212 (6.9%) |
| 5 or more Vehicles | 75 (2.2%) | 90 (2.9%) |
| Total | 3,400 (100.0%) | 3,071 (100.0%) |
Commute Time in Montgomeryville
The most frequently occuring commute durations in Montgomeryville are 20 to 24 minutes (890 commuters, 16.1%), 45 to 59 minutes (697 commuters, 12.6%), and 30 to 34 minutes (660 commuters, 12.0%).
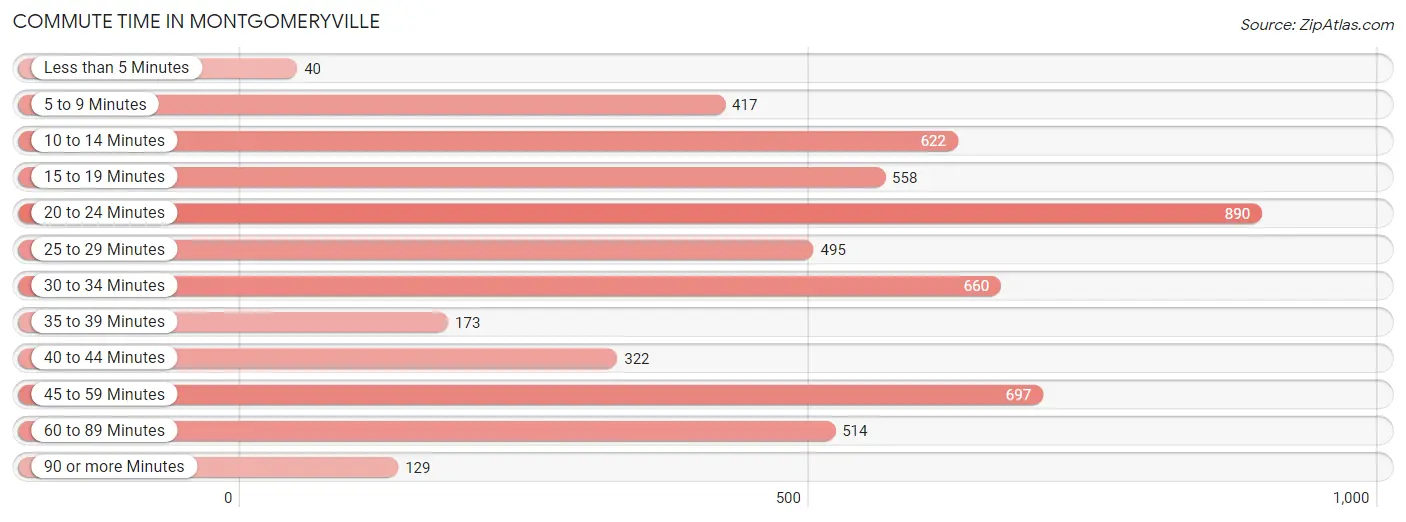
| Commute Time | # Commuters | % Commuters |
| Less than 5 Minutes | 40 | 0.7% |
| 5 to 9 Minutes | 417 | 7.6% |
| 10 to 14 Minutes | 622 | 11.3% |
| 15 to 19 Minutes | 558 | 10.1% |
| 20 to 24 Minutes | 890 | 16.1% |
| 25 to 29 Minutes | 495 | 9.0% |
| 30 to 34 Minutes | 660 | 12.0% |
| 35 to 39 Minutes | 173 | 3.1% |
| 40 to 44 Minutes | 322 | 5.8% |
| 45 to 59 Minutes | 697 | 12.6% |
| 60 to 89 Minutes | 514 | 9.3% |
| 90 or more Minutes | 129 | 2.3% |
Commute Time by Sex in Montgomeryville
The most common commute times in Montgomeryville are 45 to 59 minutes (491 commuters, 16.2%) for males and 20 to 24 minutes (476 commuters, 19.2%) for females.
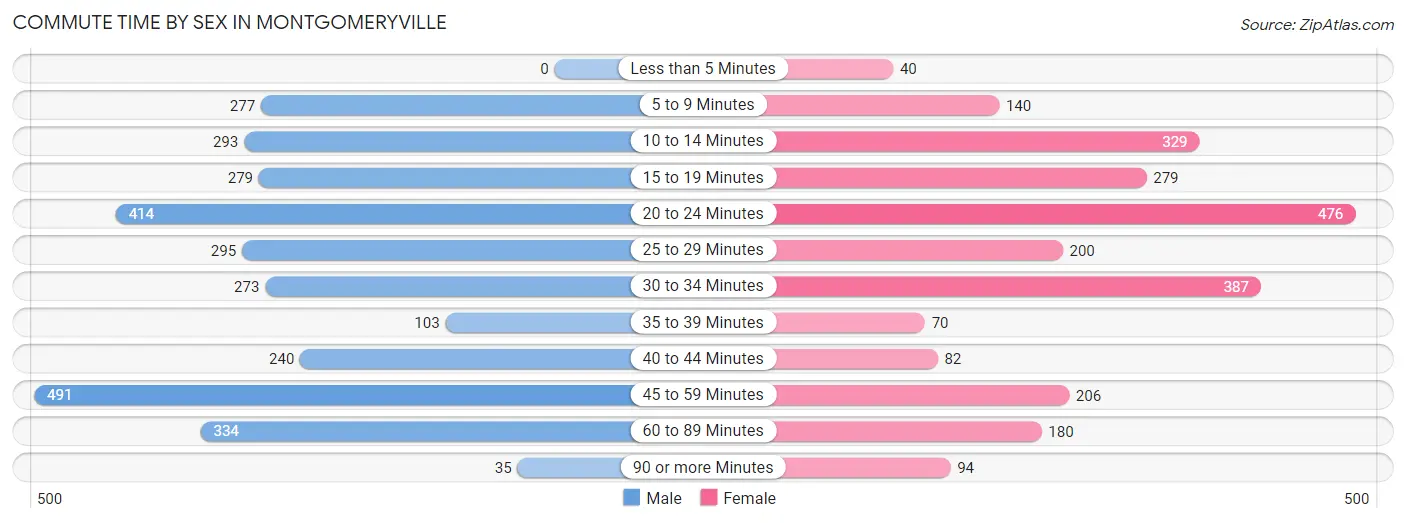
| Commute Time | Male | Female |
| Less than 5 Minutes | 0 (0.0%) | 40 (1.6%) |
| 5 to 9 Minutes | 277 (9.1%) | 140 (5.6%) |
| 10 to 14 Minutes | 293 (9.7%) | 329 (13.3%) |
| 15 to 19 Minutes | 279 (9.2%) | 279 (11.2%) |
| 20 to 24 Minutes | 414 (13.7%) | 476 (19.2%) |
| 25 to 29 Minutes | 295 (9.7%) | 200 (8.1%) |
| 30 to 34 Minutes | 273 (9.0%) | 387 (15.6%) |
| 35 to 39 Minutes | 103 (3.4%) | 70 (2.8%) |
| 40 to 44 Minutes | 240 (7.9%) | 82 (3.3%) |
| 45 to 59 Minutes | 491 (16.2%) | 206 (8.3%) |
| 60 to 89 Minutes | 334 (11.0%) | 180 (7.2%) |
| 90 or more Minutes | 35 (1.1%) | 94 (3.8%) |
Time of Departure to Work by Sex in Montgomeryville
The most frequent times of departure to work in Montgomeryville are 7:00 AM to 7:29 AM (584, 19.3%) for males and 8:30 AM to 8:59 AM (392, 15.8%) for females.
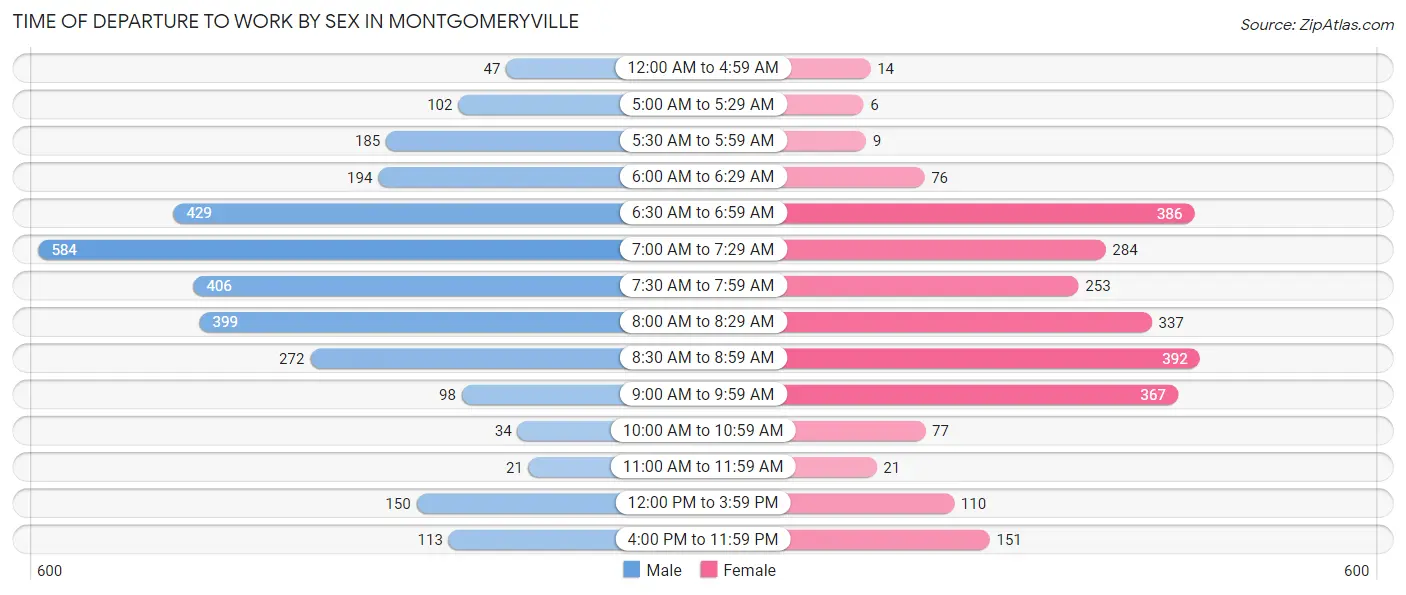
| Time of Departure | Male | Female |
| 12:00 AM to 4:59 AM | 47 (1.5%) | 14 (0.6%) |
| 5:00 AM to 5:29 AM | 102 (3.4%) | 6 (0.2%) |
| 5:30 AM to 5:59 AM | 185 (6.1%) | 9 (0.4%) |
| 6:00 AM to 6:29 AM | 194 (6.4%) | 76 (3.1%) |
| 6:30 AM to 6:59 AM | 429 (14.1%) | 386 (15.5%) |
| 7:00 AM to 7:29 AM | 584 (19.3%) | 284 (11.4%) |
| 7:30 AM to 7:59 AM | 406 (13.4%) | 253 (10.2%) |
| 8:00 AM to 8:29 AM | 399 (13.2%) | 337 (13.6%) |
| 8:30 AM to 8:59 AM | 272 (9.0%) | 392 (15.8%) |
| 9:00 AM to 9:59 AM | 98 (3.2%) | 367 (14.8%) |
| 10:00 AM to 10:59 AM | 34 (1.1%) | 77 (3.1%) |
| 11:00 AM to 11:59 AM | 21 (0.7%) | 21 (0.9%) |
| 12:00 PM to 3:59 PM | 150 (4.9%) | 110 (4.4%) |
| 4:00 PM to 11:59 PM | 113 (3.7%) | 151 (6.1%) |
| Total | 3,034 (100.0%) | 2,483 (100.0%) |
Housing Occupancy in Montgomeryville
Occupancy by Ownership in Montgomeryville
Of the total 4,726 dwellings in Montgomeryville, owner-occupied units account for 4,353 (92.1%), while renter-occupied units make up 373 (7.9%).
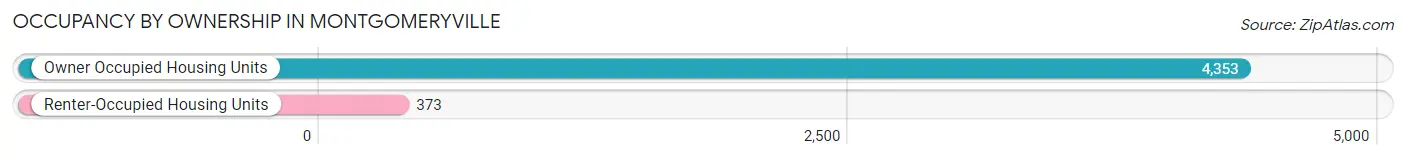
| Occupancy | # Housing Units | % Housing Units |
| Owner Occupied Housing Units | 4,353 | 92.1% |
| Renter-Occupied Housing Units | 373 | 7.9% |
| Total Occupied Housing Units | 4,726 | 100.0% |
Occupancy by Household Size in Montgomeryville
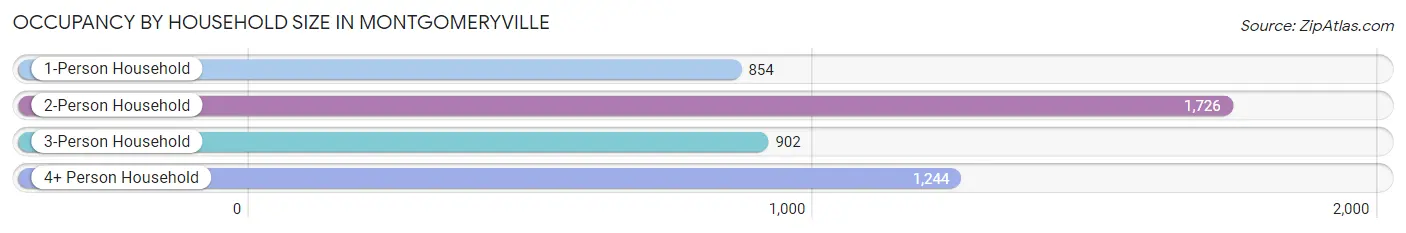
| Household Size | # Housing Units | % Housing Units |
| 1-Person Household | 854 | 18.1% |
| 2-Person Household | 1,726 | 36.5% |
| 3-Person Household | 902 | 19.1% |
| 4+ Person Household | 1,244 | 26.3% |
| Total Housing Units | 4,726 | 100.0% |
Occupancy by Ownership by Household Size in Montgomeryville
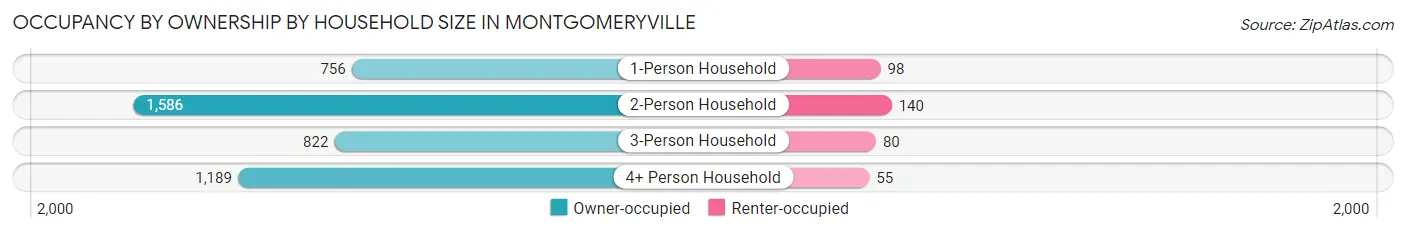
| Household Size | Owner-occupied | Renter-occupied |
| 1-Person Household | 756 (88.5%) | 98 (11.5%) |
| 2-Person Household | 1,586 (91.9%) | 140 (8.1%) |
| 3-Person Household | 822 (91.1%) | 80 (8.9%) |
| 4+ Person Household | 1,189 (95.6%) | 55 (4.4%) |
| Total Housing Units | 4,353 (92.1%) | 373 (7.9%) |
Occupancy by Educational Attainment in Montgomeryville
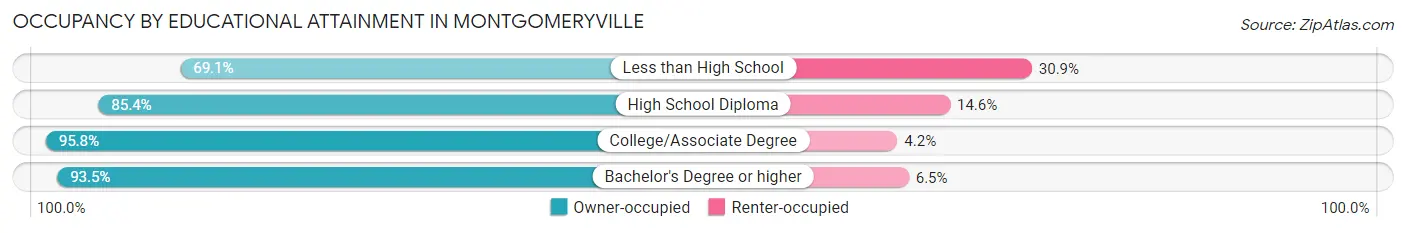
| Household Size | Owner-occupied | Renter-occupied |
| Less than High School | 103 (69.1%) | 46 (30.9%) |
| High School Diploma | 548 (85.4%) | 94 (14.6%) |
| College/Associate Degree | 911 (95.8%) | 40 (4.2%) |
| Bachelor's Degree or higher | 2,791 (93.5%) | 193 (6.5%) |
Occupancy by Age of Householder in Montgomeryville
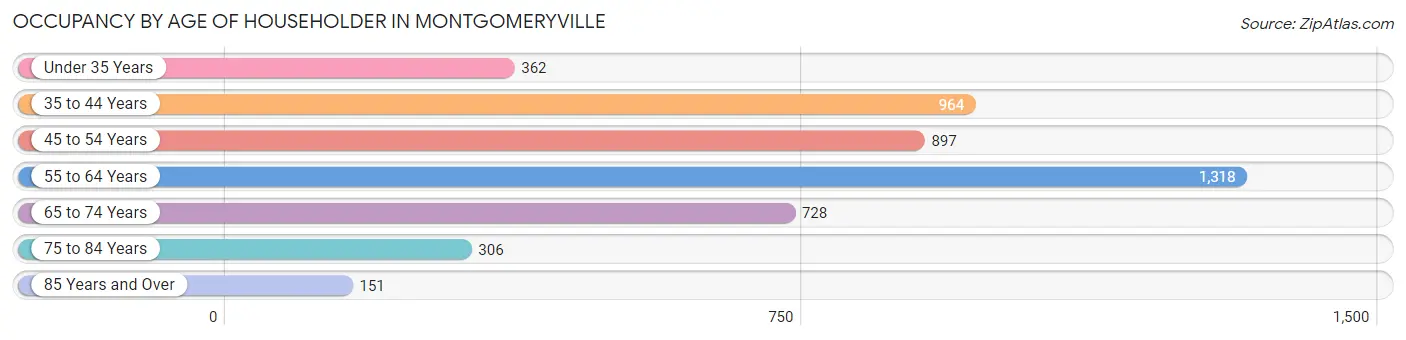
| Age Bracket | # Households | % Households |
| Under 35 Years | 362 | 7.7% |
| 35 to 44 Years | 964 | 20.4% |
| 45 to 54 Years | 897 | 19.0% |
| 55 to 64 Years | 1,318 | 27.9% |
| 65 to 74 Years | 728 | 15.4% |
| 75 to 84 Years | 306 | 6.5% |
| 85 Years and Over | 151 | 3.2% |
| Total | 4,726 | 100.0% |
Housing Finances in Montgomeryville
Median Income by Occupancy in Montgomeryville
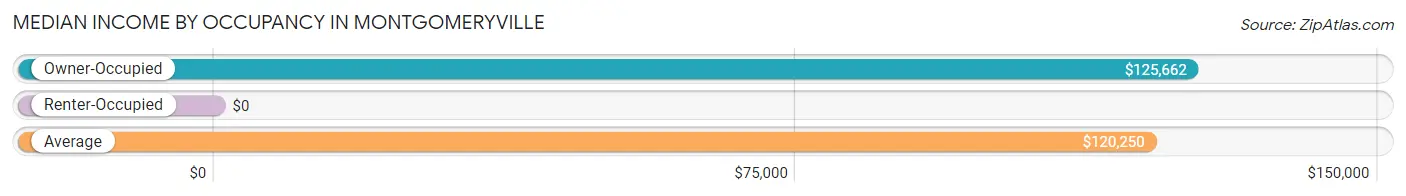
| Occupancy Type | # Households | Median Income |
| Owner-Occupied | 4,353 (92.1%) | $125,662 |
| Renter-Occupied | 373 (7.9%) | $0 |
| Average | 4,726 (100.0%) | $120,250 |
Occupancy by Householder Income Bracket in Montgomeryville
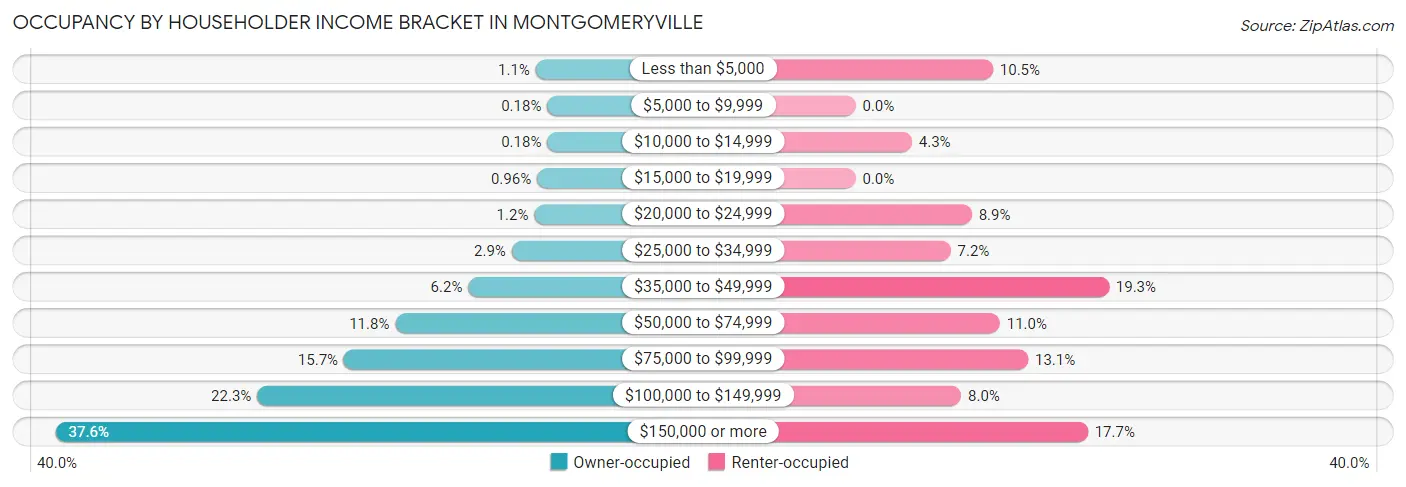
| Income Bracket | Owner-occupied | Renter-occupied |
| Less than $5,000 | 46 (1.1%) | 39 (10.5%) |
| $5,000 to $9,999 | 8 (0.2%) | 0 (0.0%) |
| $10,000 to $14,999 | 8 (0.2%) | 16 (4.3%) |
| $15,000 to $19,999 | 42 (1.0%) | 0 (0.0%) |
| $20,000 to $24,999 | 51 (1.2%) | 33 (8.8%) |
| $25,000 to $34,999 | 126 (2.9%) | 27 (7.2%) |
| $35,000 to $49,999 | 270 (6.2%) | 72 (19.3%) |
| $50,000 to $74,999 | 512 (11.8%) | 41 (11.0%) |
| $75,000 to $99,999 | 682 (15.7%) | 49 (13.1%) |
| $100,000 to $149,999 | 970 (22.3%) | 30 (8.0%) |
| $150,000 or more | 1,638 (37.6%) | 66 (17.7%) |
| Total | 4,353 (100.0%) | 373 (100.0%) |
Monthly Housing Cost Tiers in Montgomeryville
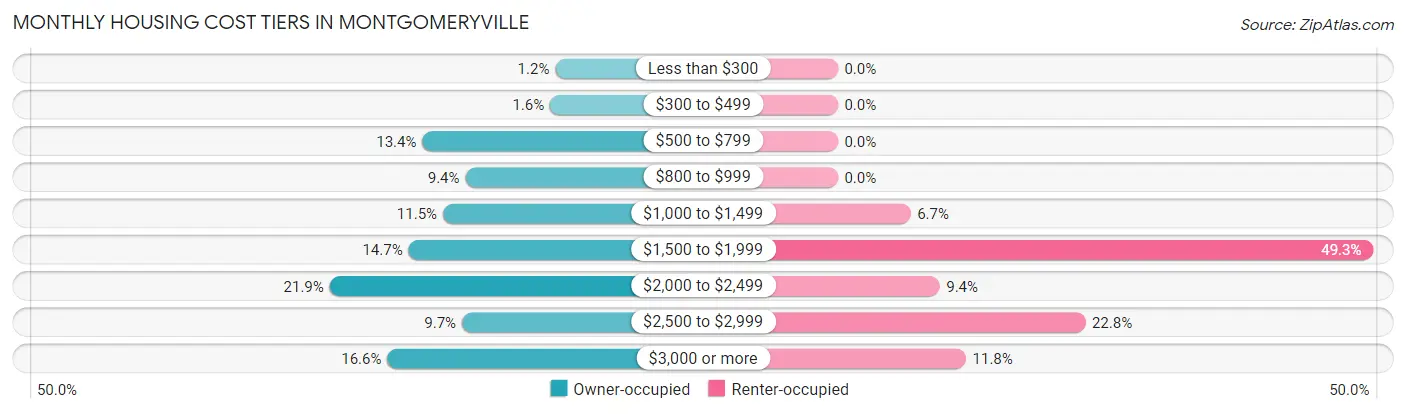
| Monthly Cost | Owner-occupied | Renter-occupied |
| Less than $300 | 50 (1.1%) | 0 (0.0%) |
| $300 to $499 | 71 (1.6%) | 0 (0.0%) |
| $500 to $799 | 583 (13.4%) | 0 (0.0%) |
| $800 to $999 | 410 (9.4%) | 0 (0.0%) |
| $1,000 to $1,499 | 500 (11.5%) | 25 (6.7%) |
| $1,500 to $1,999 | 638 (14.7%) | 184 (49.3%) |
| $2,000 to $2,499 | 954 (21.9%) | 35 (9.4%) |
| $2,500 to $2,999 | 424 (9.7%) | 85 (22.8%) |
| $3,000 or more | 723 (16.6%) | 44 (11.8%) |
| Total | 4,353 (100.0%) | 373 (100.0%) |
Physical Housing Characteristics in Montgomeryville
Housing Structures in Montgomeryville
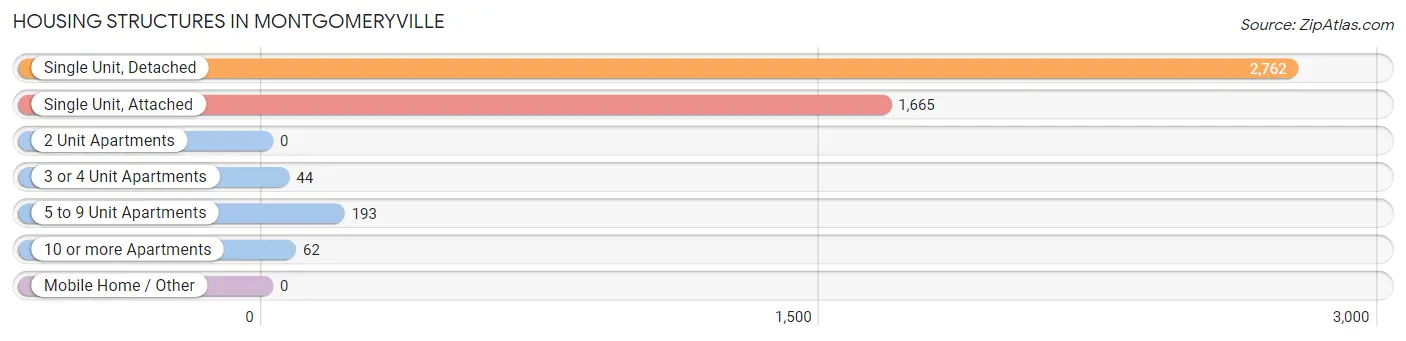
| Structure Type | # Housing Units | % Housing Units |
| Single Unit, Detached | 2,762 | 58.4% |
| Single Unit, Attached | 1,665 | 35.2% |
| 2 Unit Apartments | 0 | 0.0% |
| 3 or 4 Unit Apartments | 44 | 0.9% |
| 5 to 9 Unit Apartments | 193 | 4.1% |
| 10 or more Apartments | 62 | 1.3% |
| Mobile Home / Other | 0 | 0.0% |
| Total | 4,726 | 100.0% |
Housing Structures by Occupancy in Montgomeryville
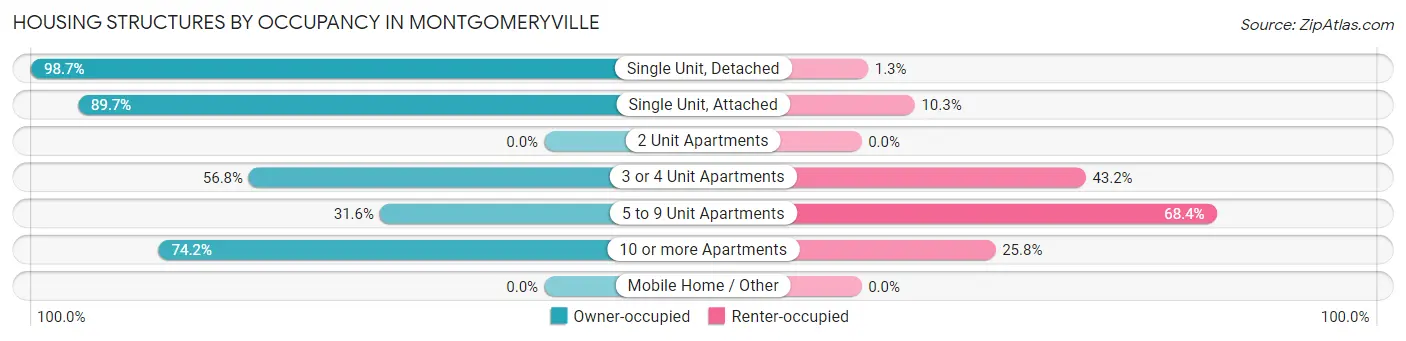
| Structure Type | Owner-occupied | Renter-occupied |
| Single Unit, Detached | 2,727 (98.7%) | 35 (1.3%) |
| Single Unit, Attached | 1,494 (89.7%) | 171 (10.3%) |
| 2 Unit Apartments | 0 (0.0%) | 0 (0.0%) |
| 3 or 4 Unit Apartments | 25 (56.8%) | 19 (43.2%) |
| 5 to 9 Unit Apartments | 61 (31.6%) | 132 (68.4%) |
| 10 or more Apartments | 46 (74.2%) | 16 (25.8%) |
| Mobile Home / Other | 0 (0.0%) | 0 (0.0%) |
| Total | 4,353 (92.1%) | 373 (7.9%) |
Housing Structures by Number of Rooms in Montgomeryville
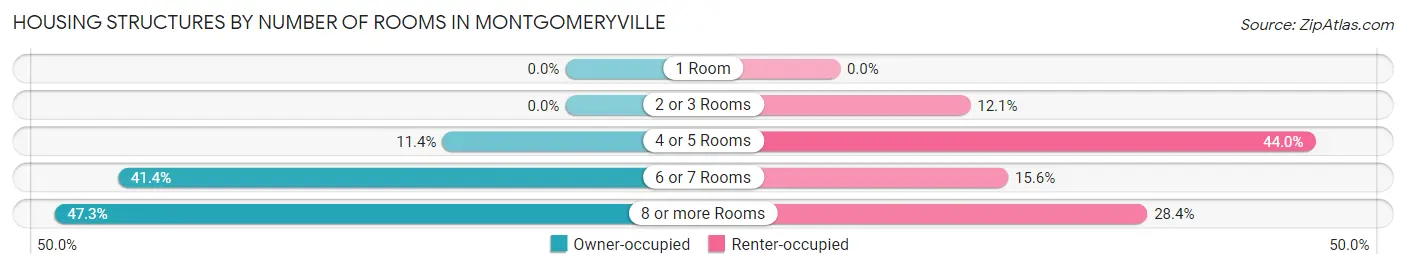
| Number of Rooms | Owner-occupied | Renter-occupied |
| 1 Room | 0 (0.0%) | 0 (0.0%) |
| 2 or 3 Rooms | 0 (0.0%) | 45 (12.1%) |
| 4 or 5 Rooms | 495 (11.4%) | 164 (44.0%) |
| 6 or 7 Rooms | 1,801 (41.4%) | 58 (15.5%) |
| 8 or more Rooms | 2,057 (47.2%) | 106 (28.4%) |
| Total | 4,353 (100.0%) | 373 (100.0%) |
Housing Structure by Heating Type in Montgomeryville
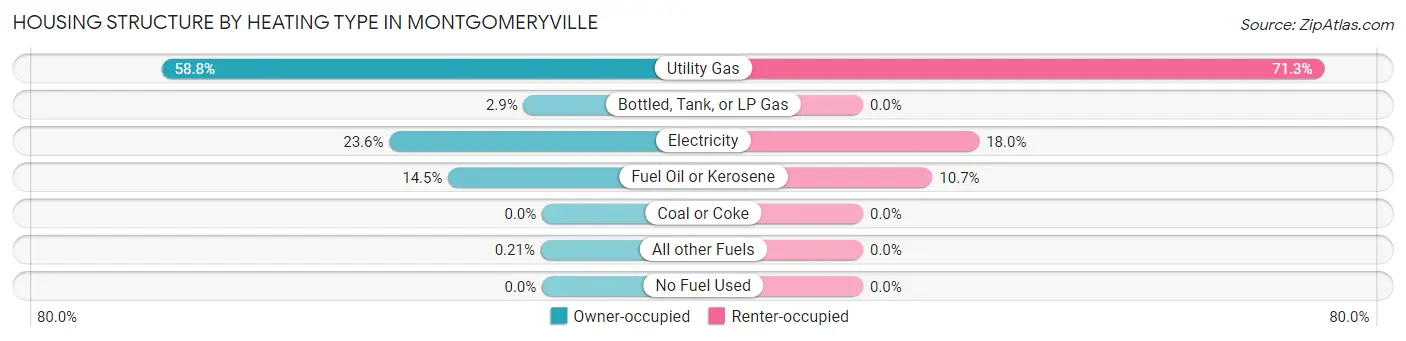
| Heating Type | Owner-occupied | Renter-occupied |
| Utility Gas | 2,560 (58.8%) | 266 (71.3%) |
| Bottled, Tank, or LP Gas | 125 (2.9%) | 0 (0.0%) |
| Electricity | 1,028 (23.6%) | 67 (18.0%) |
| Fuel Oil or Kerosene | 631 (14.5%) | 40 (10.7%) |
| Coal or Coke | 0 (0.0%) | 0 (0.0%) |
| All other Fuels | 9 (0.2%) | 0 (0.0%) |
| No Fuel Used | 0 (0.0%) | 0 (0.0%) |
| Total | 4,353 (100.0%) | 373 (100.0%) |
Household Vehicle Usage in Montgomeryville
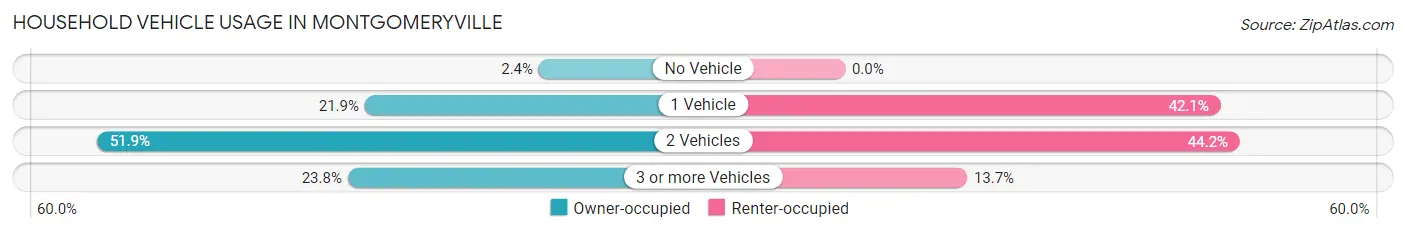
| Vehicles per Household | Owner-occupied | Renter-occupied |
| No Vehicle | 104 (2.4%) | 0 (0.0%) |
| 1 Vehicle | 953 (21.9%) | 157 (42.1%) |
| 2 Vehicles | 2,260 (51.9%) | 165 (44.2%) |
| 3 or more Vehicles | 1,036 (23.8%) | 51 (13.7%) |
| Total | 4,353 (100.0%) | 373 (100.0%) |
Real Estate & Mortgages in Montgomeryville
Real Estate and Mortgage Overview in Montgomeryville
| Characteristic | Without Mortgage | With Mortgage |
| Housing Units | 1,140 | 3,213 |
| Median Property Value | $412,500 | $400,500 |
| Median Household Income | $109,783 | $1,267 |
| Monthly Housing Costs | $768 | $715 |
| Real Estate Taxes | $4,634 | $67 |
Property Value by Mortgage Status in Montgomeryville
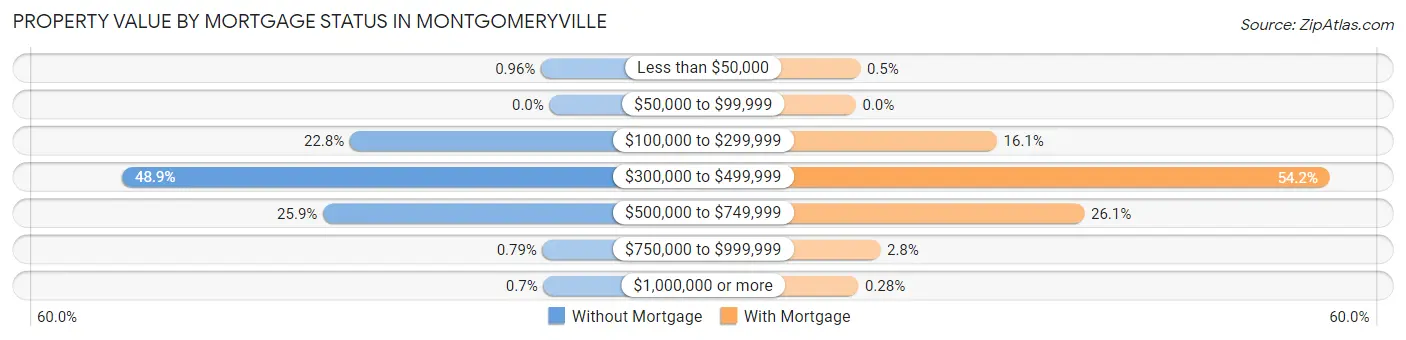
| Property Value | Without Mortgage | With Mortgage |
| Less than $50,000 | 11 (1.0%) | 16 (0.5%) |
| $50,000 to $99,999 | 0 (0.0%) | 0 (0.0%) |
| $100,000 to $299,999 | 260 (22.8%) | 518 (16.1%) |
| $300,000 to $499,999 | 557 (48.9%) | 1,741 (54.2%) |
| $500,000 to $749,999 | 295 (25.9%) | 839 (26.1%) |
| $750,000 to $999,999 | 9 (0.8%) | 90 (2.8%) |
| $1,000,000 or more | 8 (0.7%) | 9 (0.3%) |
| Total | 1,140 (100.0%) | 3,213 (100.0%) |
Household Income by Mortgage Status in Montgomeryville
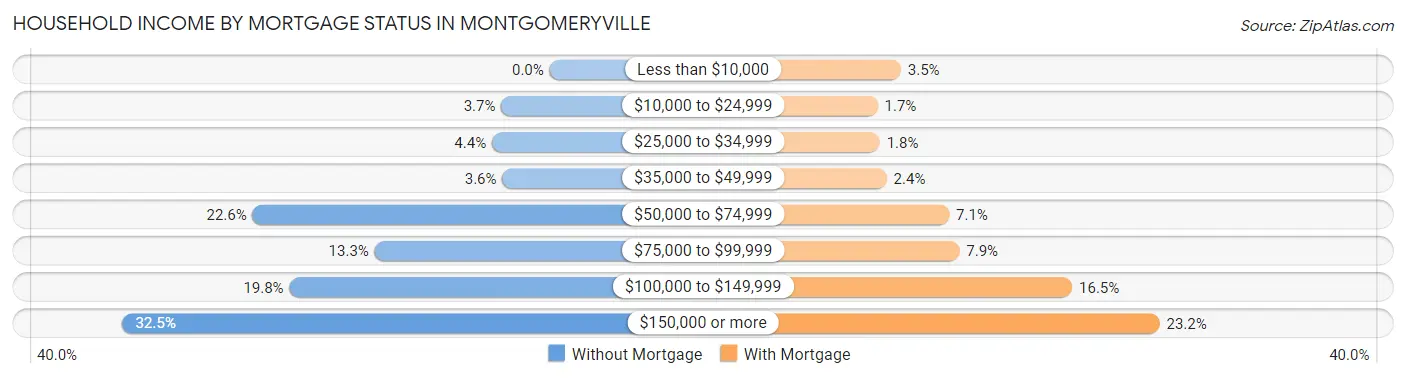
| Household Income | Without Mortgage | With Mortgage |
| Less than $10,000 | 0 (0.0%) | 111 (3.5%) |
| $10,000 to $24,999 | 42 (3.7%) | 54 (1.7%) |
| $25,000 to $34,999 | 50 (4.4%) | 59 (1.8%) |
| $35,000 to $49,999 | 41 (3.6%) | 76 (2.4%) |
| $50,000 to $74,999 | 258 (22.6%) | 229 (7.1%) |
| $75,000 to $99,999 | 152 (13.3%) | 254 (7.9%) |
| $100,000 to $149,999 | 226 (19.8%) | 530 (16.5%) |
| $150,000 or more | 371 (32.5%) | 744 (23.2%) |
| Total | 1,140 (100.0%) | 3,213 (100.0%) |
Property Value to Household Income Ratio in Montgomeryville
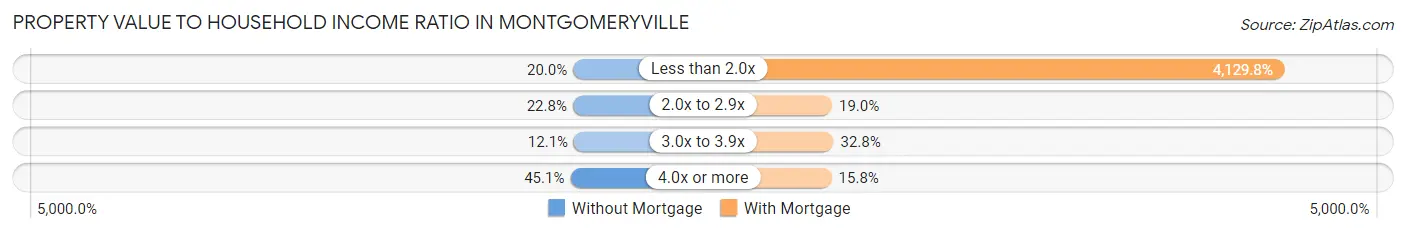
| Value-to-Income Ratio | Without Mortgage | With Mortgage |
| Less than 2.0x | 228 (20.0%) | 132,689 (4,129.7%) |
| 2.0x to 2.9x | 260 (22.8%) | 611 (19.0%) |
| 3.0x to 3.9x | 138 (12.1%) | 1,053 (32.8%) |
| 4.0x or more | 514 (45.1%) | 509 (15.8%) |
| Total | 1,140 (100.0%) | 3,213 (100.0%) |
Real Estate Taxes by Mortgage Status in Montgomeryville
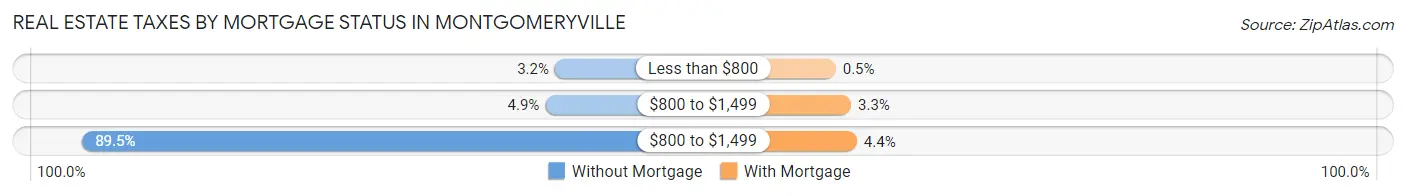
| Property Taxes | Without Mortgage | With Mortgage |
| Less than $800 | 36 (3.2%) | 16 (0.5%) |
| $800 to $1,499 | 56 (4.9%) | 106 (3.3%) |
| $800 to $1,499 | 1,020 (89.5%) | 140 (4.4%) |
| Total | 1,140 (100.0%) | 3,213 (100.0%) |
Health & Disability in Montgomeryville
Health Insurance Coverage by Age in Montgomeryville
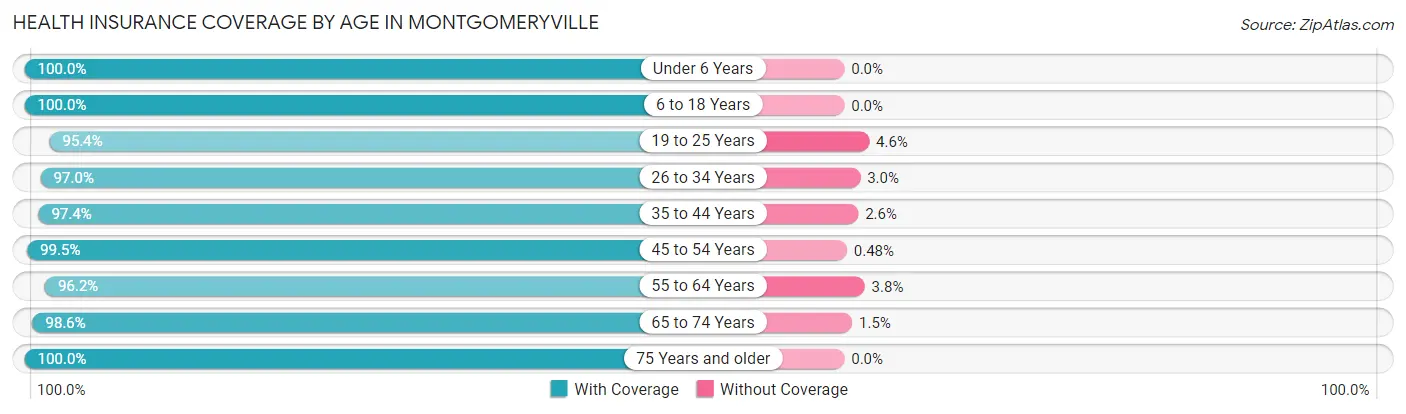
| Age Bracket | With Coverage | Without Coverage |
| Under 6 Years | 650 (100.0%) | 0 (0.0%) |
| 6 to 18 Years | 2,478 (100.0%) | 0 (0.0%) |
| 19 to 25 Years | 682 (95.4%) | 33 (4.6%) |
| 26 to 34 Years | 979 (97.0%) | 30 (3.0%) |
| 35 to 44 Years | 1,657 (97.4%) | 44 (2.6%) |
| 45 to 54 Years | 1,872 (99.5%) | 9 (0.5%) |
| 55 to 64 Years | 2,124 (96.2%) | 84 (3.8%) |
| 65 to 74 Years | 1,363 (98.6%) | 20 (1.5%) |
| 75 Years and older | 827 (100.0%) | 0 (0.0%) |
| Total | 12,632 (98.3%) | 220 (1.7%) |
Health Insurance Coverage by Citizenship Status in Montgomeryville
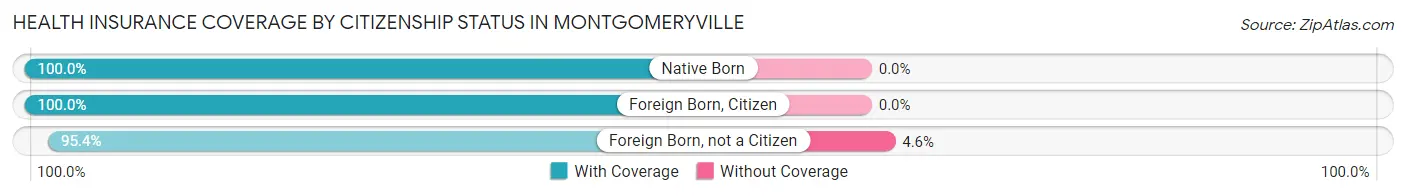
| Citizenship Status | With Coverage | Without Coverage |
| Native Born | 650 (100.0%) | 0 (0.0%) |
| Foreign Born, Citizen | 2,478 (100.0%) | 0 (0.0%) |
| Foreign Born, not a Citizen | 682 (95.4%) | 33 (4.6%) |
Health Insurance Coverage by Household Income in Montgomeryville
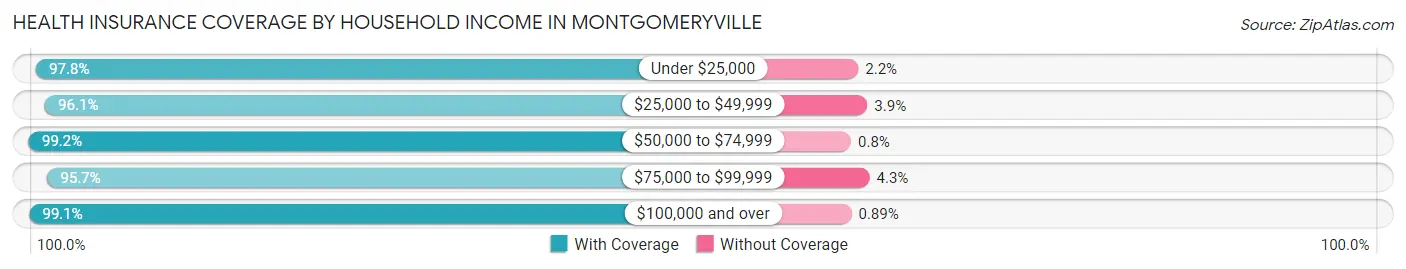
| Household Income | With Coverage | Without Coverage |
| Under $25,000 | 454 (97.8%) | 10 (2.2%) |
| $25,000 to $49,999 | 846 (96.1%) | 34 (3.9%) |
| $50,000 to $74,999 | 1,121 (99.2%) | 9 (0.8%) |
| $75,000 to $99,999 | 2,109 (95.7%) | 94 (4.3%) |
| $100,000 and over | 8,102 (99.1%) | 73 (0.9%) |
Public vs Private Health Insurance Coverage by Age in Montgomeryville
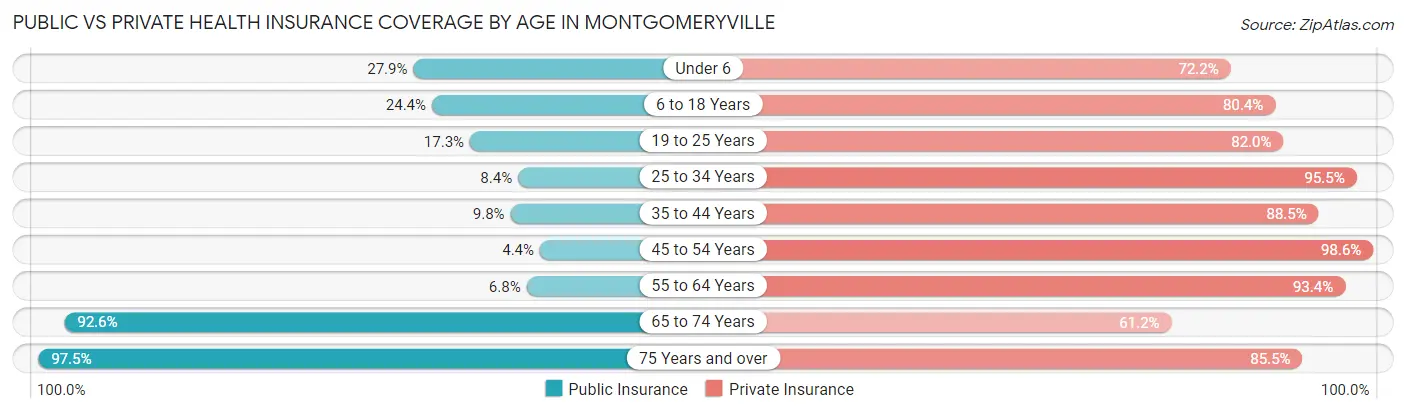
| Age Bracket | Public Insurance | Private Insurance |
| Under 6 | 181 (27.9%) | 469 (72.2%) |
| 6 to 18 Years | 605 (24.4%) | 1,993 (80.4%) |
| 19 to 25 Years | 124 (17.3%) | 586 (82.0%) |
| 25 to 34 Years | 85 (8.4%) | 964 (95.5%) |
| 35 to 44 Years | 167 (9.8%) | 1,505 (88.5%) |
| 45 to 54 Years | 82 (4.4%) | 1,855 (98.6%) |
| 55 to 64 Years | 151 (6.8%) | 2,062 (93.4%) |
| 65 to 74 Years | 1,281 (92.6%) | 846 (61.2%) |
| 75 Years and over | 806 (97.5%) | 707 (85.5%) |
| Total | 3,482 (27.1%) | 10,987 (85.5%) |
Disability Status by Sex by Age in Montgomeryville
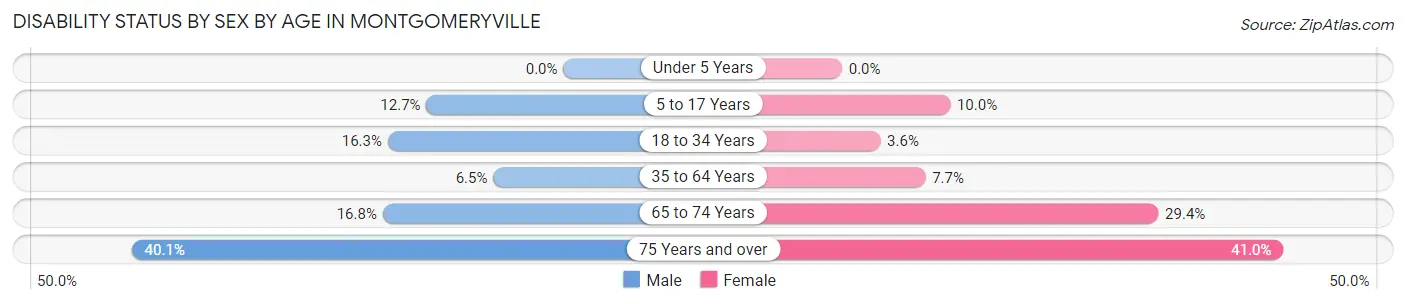
| Age Bracket | Male | Female |
| Under 5 Years | 0 (0.0%) | 0 (0.0%) |
| 5 to 17 Years | 166 (12.7%) | 113 (10.0%) |
| 18 to 34 Years | 175 (16.3%) | 30 (3.6%) |
| 35 to 64 Years | 184 (6.5%) | 229 (7.7%) |
| 65 to 74 Years | 125 (16.8%) | 187 (29.4%) |
| 75 Years and over | 127 (40.1%) | 209 (41.0%) |
Disability Class by Sex by Age in Montgomeryville
Disability Class: Hearing Difficulty
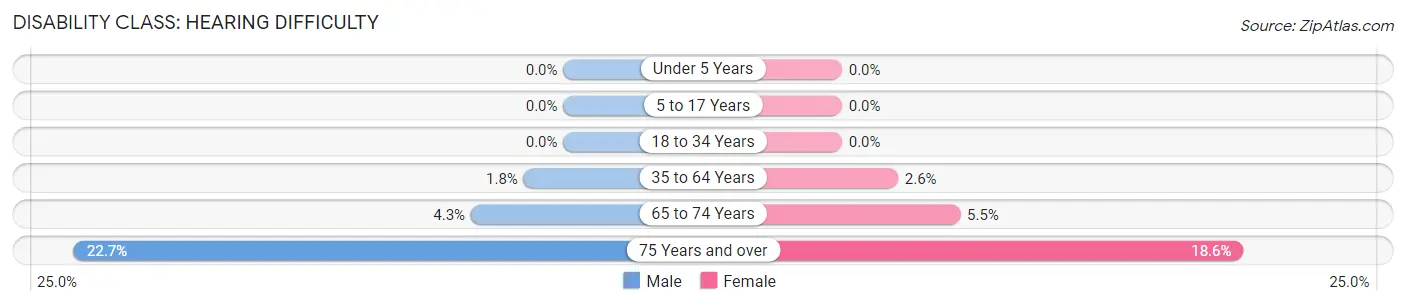
| Age Bracket | Male | Female |
| Under 5 Years | 0 (0.0%) | 0 (0.0%) |
| 5 to 17 Years | 0 (0.0%) | 0 (0.0%) |
| 18 to 34 Years | 0 (0.0%) | 0 (0.0%) |
| 35 to 64 Years | 52 (1.8%) | 77 (2.6%) |
| 65 to 74 Years | 32 (4.3%) | 35 (5.5%) |
| 75 Years and over | 72 (22.7%) | 95 (18.6%) |
Disability Class: Vision Difficulty
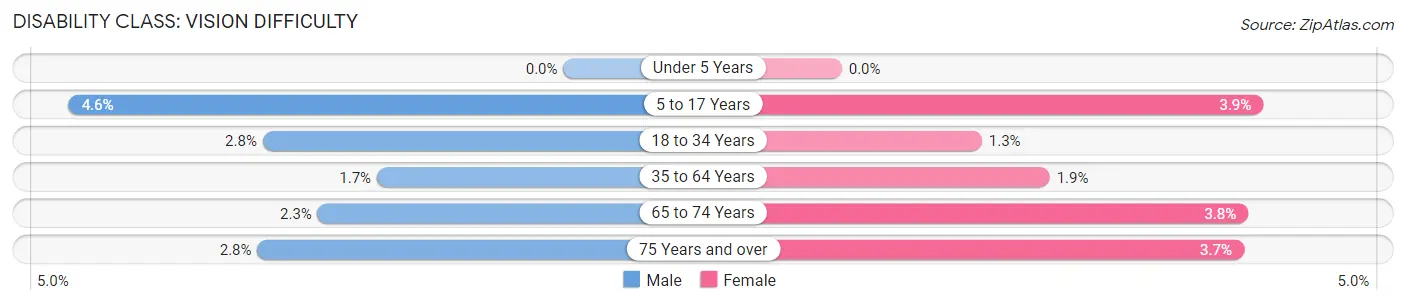
| Age Bracket | Male | Female |
| Under 5 Years | 0 (0.0%) | 0 (0.0%) |
| 5 to 17 Years | 60 (4.6%) | 44 (3.9%) |
| 18 to 34 Years | 30 (2.8%) | 11 (1.3%) |
| 35 to 64 Years | 49 (1.7%) | 57 (1.9%) |
| 65 to 74 Years | 17 (2.3%) | 24 (3.8%) |
| 75 Years and over | 9 (2.8%) | 19 (3.7%) |
Disability Class: Cognitive Difficulty
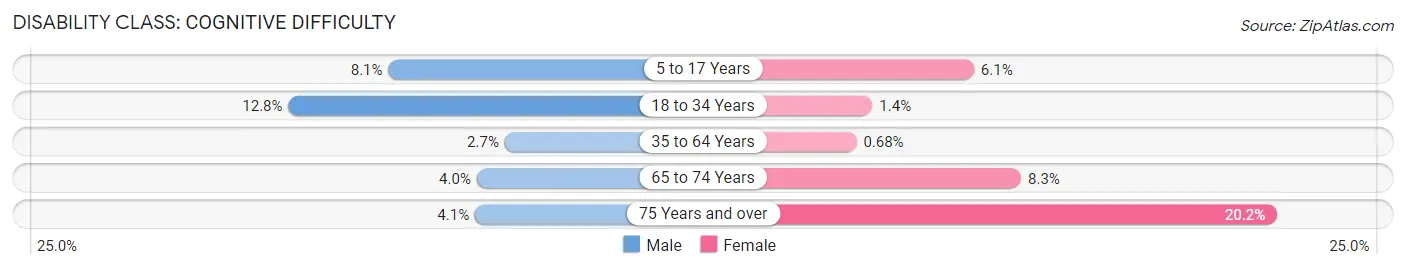
| Age Bracket | Male | Female |
| 5 to 17 Years | 106 (8.1%) | 69 (6.1%) |
| 18 to 34 Years | 137 (12.8%) | 12 (1.4%) |
| 35 to 64 Years | 77 (2.7%) | 20 (0.7%) |
| 65 to 74 Years | 30 (4.0%) | 53 (8.3%) |
| 75 Years and over | 13 (4.1%) | 103 (20.2%) |
Disability Class: Ambulatory Difficulty
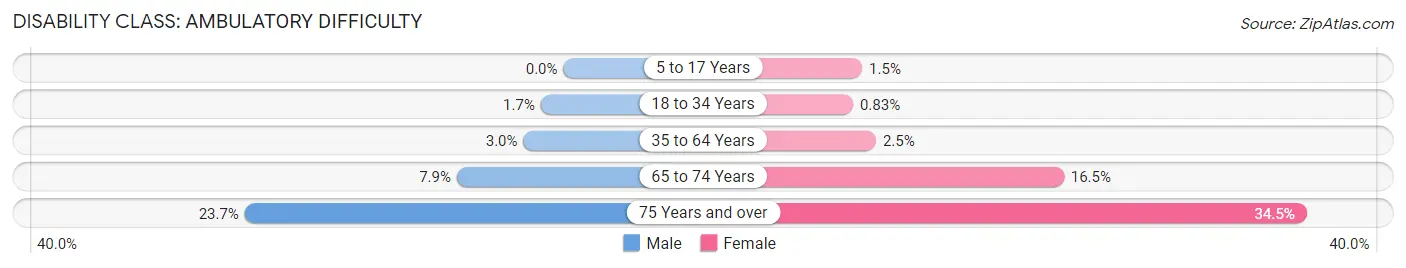
| Age Bracket | Male | Female |
| 5 to 17 Years | 0 (0.0%) | 17 (1.5%) |
| 18 to 34 Years | 18 (1.7%) | 7 (0.8%) |
| 35 to 64 Years | 84 (3.0%) | 75 (2.5%) |
| 65 to 74 Years | 59 (7.9%) | 105 (16.5%) |
| 75 Years and over | 75 (23.7%) | 176 (34.5%) |
Disability Class: Self-Care Difficulty
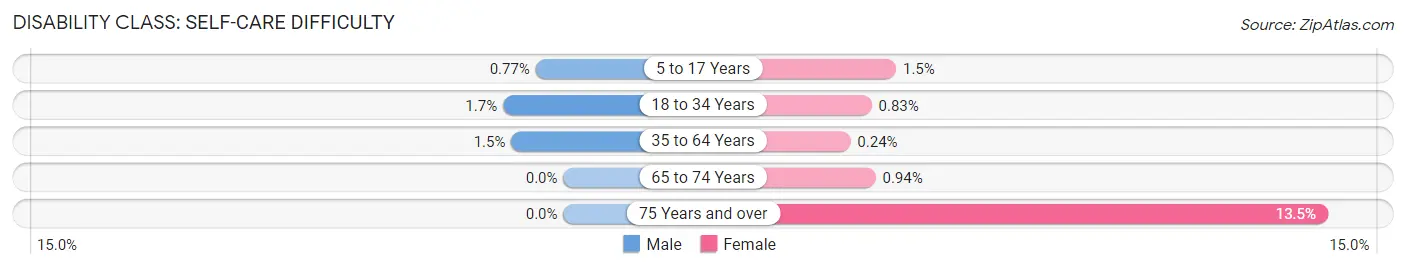
| Age Bracket | Male | Female |
| 5 to 17 Years | 10 (0.8%) | 17 (1.5%) |
| 18 to 34 Years | 18 (1.7%) | 7 (0.8%) |
| 35 to 64 Years | 41 (1.5%) | 7 (0.2%) |
| 65 to 74 Years | 0 (0.0%) | 6 (0.9%) |
| 75 Years and over | 0 (0.0%) | 69 (13.5%) |
Technology Access in Montgomeryville
Computing Device Access in Montgomeryville
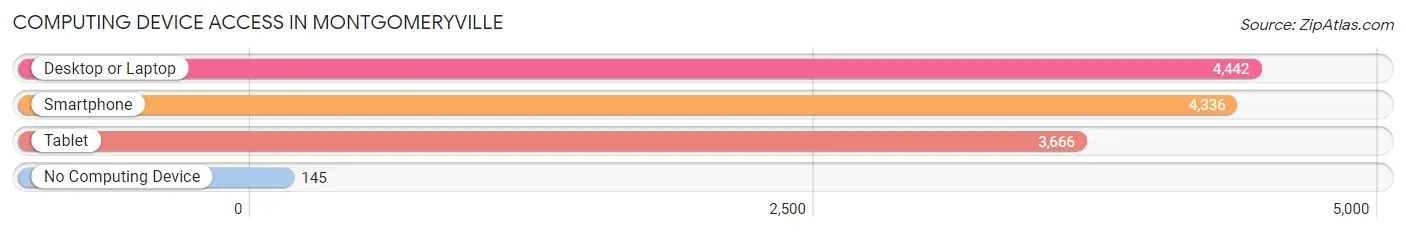
| Device Type | # Households | % Households |
| Desktop or Laptop | 4,442 | 94.0% |
| Smartphone | 4,336 | 91.7% |
| Tablet | 3,666 | 77.6% |
| No Computing Device | 145 | 3.1% |
| Total | 4,726 | 100.0% |
Internet Access in Montgomeryville
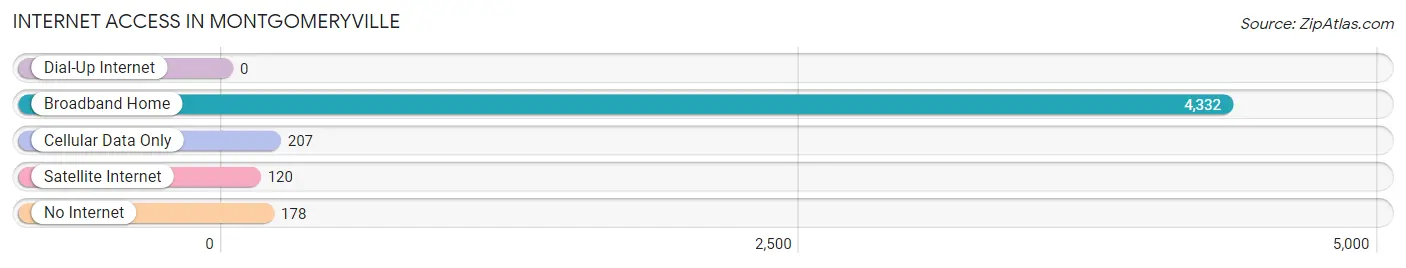
| Internet Type | # Households | % Households |
| Dial-Up Internet | 0 | 0.0% |
| Broadband Home | 4,332 | 91.7% |
| Cellular Data Only | 207 | 4.4% |
| Satellite Internet | 120 | 2.5% |
| No Internet | 178 | 3.8% |
| Total | 4,726 | 100.0% |
Montgomeryville Summary
Montgomeryville, Pennsylvania is a census-designated place located in Montgomery County, Pennsylvania. It is situated approximately 25 miles northwest of Philadelphia and is part of the North Penn Valley region. The population of Montgomeryville was 8,945 at the 2010 census.
History
The area that is now Montgomeryville was originally inhabited by the Lenni Lenape Native Americans. The first European settlers arrived in the area in the late 1700s. The area was originally known as “Gwynedd” and was part of the Gwynedd Township. In 1851, the area was renamed “Montgomeryville” after the Montgomery family, who had settled in the area in the early 1800s.
In the late 1800s, Montgomeryville began to develop as a small village. The first post office was established in 1876 and the first school was built in 1877. The village was incorporated in 1895 and the first mayor was elected in 1896.
In the early 1900s, Montgomeryville began to grow rapidly. The first bank was established in 1906 and the first fire company was formed in 1907. The first telephone exchange was established in 1910 and the first electric power plant was built in 1911.
Geography
Montgomeryville is located at 40°14'45" North, 75°14'45" West (40.245833, -75.245833). It is situated in the North Penn Valley region of Montgomery County, Pennsylvania. The area is mostly flat and is located at an elevation of approximately 400 feet above sea level.
The climate in Montgomeryville is classified as humid continental, with hot, humid summers and cold, snowy winters. The average annual temperature is approximately 50°F and the average annual precipitation is approximately 40 inches.
Economy
The economy of Montgomeryville is largely based on retail and services. The largest employers in the area are Montgomery Mall, Montgomeryville Nissan, and Montgomeryville Cycle Center. Other major employers include Montgomeryville Acura, Montgomeryville Honda, and Montgomeryville Toyota.
The area is also home to several small businesses, including restaurants, shops, and professional services.
Demographics
As of the 2010 census, the population of Montgomeryville was 8,945. The racial makeup of the area was 87.3% White, 5.2% African American, 0.3% Native American, 3.2% Asian, and 3.9% from other races. Hispanic or Latino of any race were 6.7% of the population.
The median household income in Montgomeryville was $71,945, and the median family income was $81,945. The per capita income was $32,945. About 4.2% of families and 5.3% of the population were below the poverty line.
The population of Montgomeryville is well-educated, with 92.3% of the population over the age of 25 having a high school diploma or higher. About 33.2% of the population has a bachelor’s degree or higher.
Common Questions
What is Per Capita Income in Montgomeryville?
Per Capita income in Montgomeryville is $55,697.
What is the Median Family Income in Montgomeryville?
Median Family Income in Montgomeryville is $135,763.
What is the Median Household income in Montgomeryville?
Median Household Income in Montgomeryville is $120,250.
What is Income or Wage Gap in Montgomeryville?
Income or Wage Gap in Montgomeryville is 20.5%.
Women in Montgomeryville earn 79.5 cents for every dollar earned by a man.
What is Inequality or Gini Index in Montgomeryville?
Inequality or Gini Index in Montgomeryville is 0.41.
What is the Total Population of Montgomeryville?
Total Population of Montgomeryville is 13,008.
What is the Total Male Population of Montgomeryville?
Total Male Population of Montgomeryville is 6,629.
What is the Total Female Population of Montgomeryville?
Total Female Population of Montgomeryville is 6,379.
What is the Ratio of Males per 100 Females in Montgomeryville?
There are 103.92 Males per 100 Females in Montgomeryville.
What is the Ratio of Females per 100 Males in Montgomeryville?
There are 96.23 Females per 100 Males in Montgomeryville.
What is the Median Population Age in Montgomeryville?
Median Population Age in Montgomeryville is 44.7 Years.
What is the Average Family Size in Montgomeryville
Average Family Size in Montgomeryville is 3.1 People.
What is the Average Household Size in Montgomeryville
Average Household Size in Montgomeryville is 2.7 People.
How Large is the Labor Force in Montgomeryville?
There are 7,128 People in the Labor Forcein in Montgomeryville.
What is the Percentage of People in the Labor Force in Montgomeryville?
68.7% of People are in the Labor Force in Montgomeryville.
What is the Unemployment Rate in Montgomeryville?
Unemployment Rate in Montgomeryville is 7.3%.