Cumberland Head, NY Map & Demographics
Cumberland Head Map
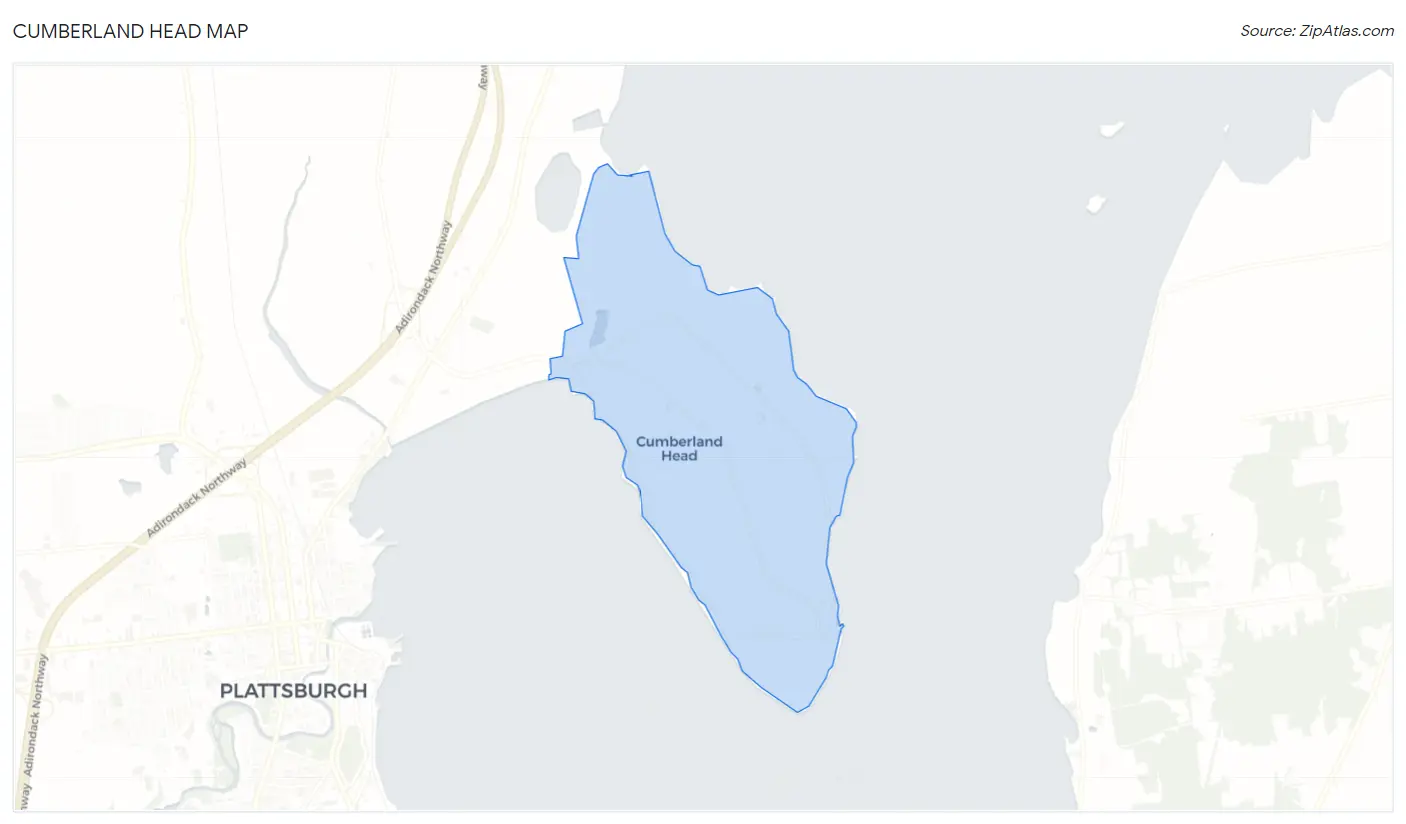
Cumberland Head Overview
$63,356
PER CAPITA INCOME
$111,563
AVG FAMILY INCOME
$92,833
AVG HOUSEHOLD INCOME
1.9%
WAGE / INCOME GAP [ % ]
98.1¢/ $1
WAGE / INCOME GAP [ $ ]
0.43
INEQUALITY / GINI INDEX
1,357
TOTAL POPULATION
629
MALE POPULATION
728
FEMALE POPULATION
86.40
MALES / 100 FEMALES
115.74
FEMALES / 100 MALES
55.4
MEDIAN AGE
2.5
AVG FAMILY SIZE
2.2
AVG HOUSEHOLD SIZE
628
LABOR FORCE [ PEOPLE ]
50.7%
PERCENT IN LABOR FORCE
2.2%
UNEMPLOYMENT RATE
Income in Cumberland Head
Income Overview in Cumberland Head
Per Capita Income in Cumberland Head is $63,356, while median incomes of families and households are $111,563 and $92,833 respectively.
| Characteristic | Number | Measure |
| Per Capita Income | 1,357 | $63,356 |
| Median Family Income | 446 | $111,563 |
| Mean Family Income | 446 | $155,411 |
| Median Household Income | 602 | $92,833 |
| Mean Household Income | 602 | $140,643 |
| Income Deficit | 446 | $0 |
| Wage / Income Gap (%) | 1,357 | 1.90% |
| Wage / Income Gap ($) | 1,357 | 98.10¢ per $1 |
| Gini / Inequality Index | 1,357 | 0.43 |
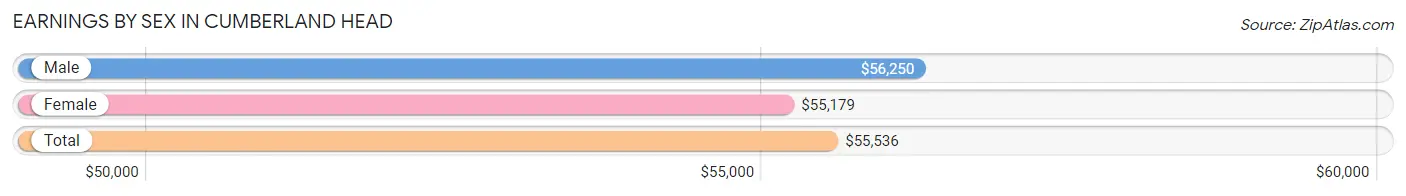
Earnings by Sex in Cumberland Head
Average Earnings in Cumberland Head are $55,536, $56,250 for men and $55,179 for women, a difference of 1.9%.
| Sex | Number | Average Earnings |
| Male | 309 (44.9%) | $56,250 |
| Female | 380 (55.1%) | $55,179 |
| Total | 689 (100.0%) | $55,536 |
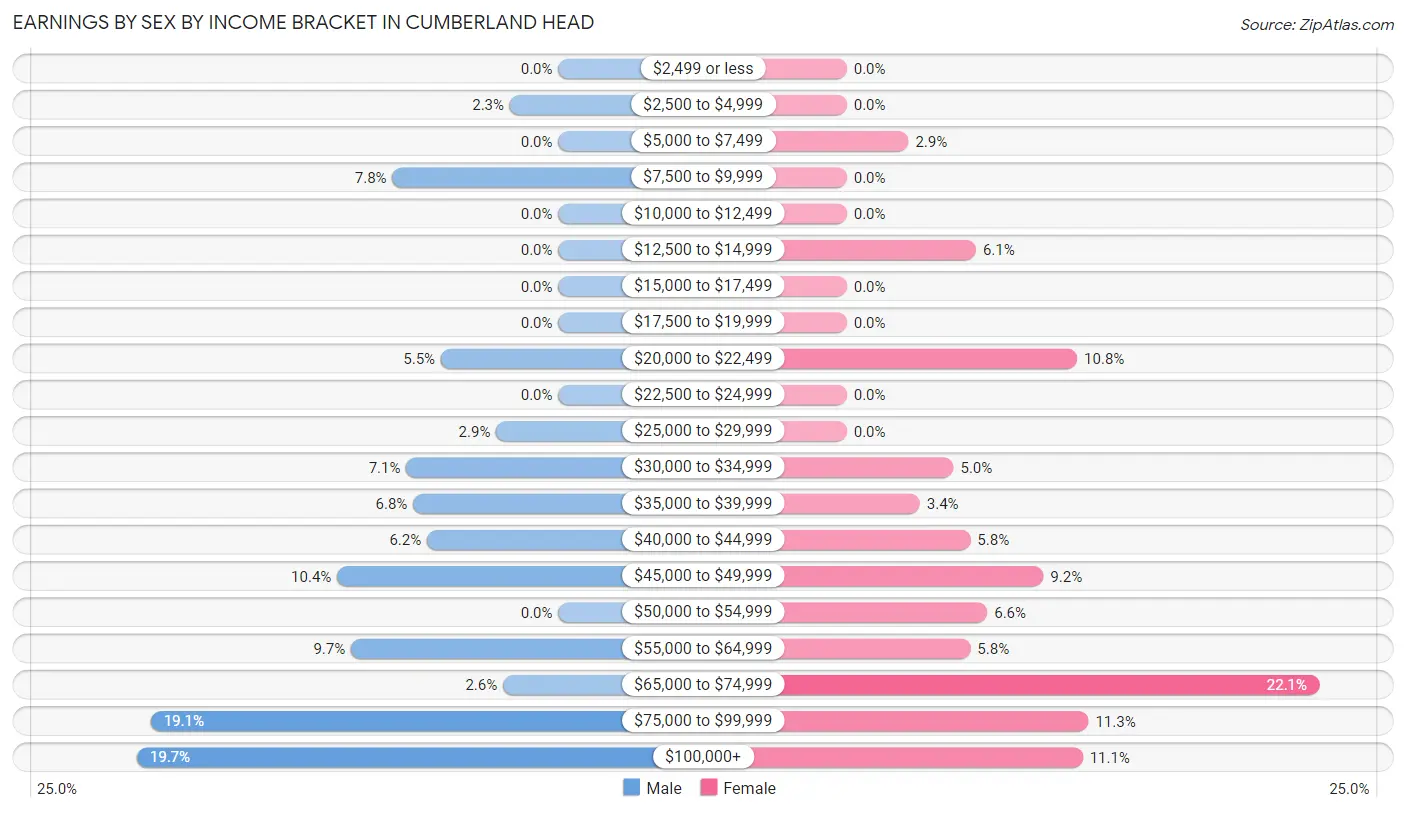
Earnings by Sex by Income Bracket in Cumberland Head
The most common earnings brackets in Cumberland Head are $100,000+ for men (61 | 19.7%) and $65,000 to $74,999 for women (84 | 22.1%).
| Income | Male | Female |
| $2,499 or less | 0 (0.0%) | 0 (0.0%) |
| $2,500 to $4,999 | 7 (2.3%) | 0 (0.0%) |
| $5,000 to $7,499 | 0 (0.0%) | 11 (2.9%) |
| $7,500 to $9,999 | 24 (7.8%) | 0 (0.0%) |
| $10,000 to $12,499 | 0 (0.0%) | 0 (0.0%) |
| $12,500 to $14,999 | 0 (0.0%) | 23 (6.0%) |
| $15,000 to $17,499 | 0 (0.0%) | 0 (0.0%) |
| $17,500 to $19,999 | 0 (0.0%) | 0 (0.0%) |
| $20,000 to $22,499 | 17 (5.5%) | 41 (10.8%) |
| $22,500 to $24,999 | 0 (0.0%) | 0 (0.0%) |
| $25,000 to $29,999 | 9 (2.9%) | 0 (0.0%) |
| $30,000 to $34,999 | 22 (7.1%) | 19 (5.0%) |
| $35,000 to $39,999 | 21 (6.8%) | 13 (3.4%) |
| $40,000 to $44,999 | 19 (6.1%) | 22 (5.8%) |
| $45,000 to $49,999 | 32 (10.4%) | 35 (9.2%) |
| $50,000 to $54,999 | 0 (0.0%) | 25 (6.6%) |
| $55,000 to $64,999 | 30 (9.7%) | 22 (5.8%) |
| $65,000 to $74,999 | 8 (2.6%) | 84 (22.1%) |
| $75,000 to $99,999 | 59 (19.1%) | 43 (11.3%) |
| $100,000+ | 61 (19.7%) | 42 (11.1%) |
| Total | 309 (100.0%) | 380 (100.0%) |
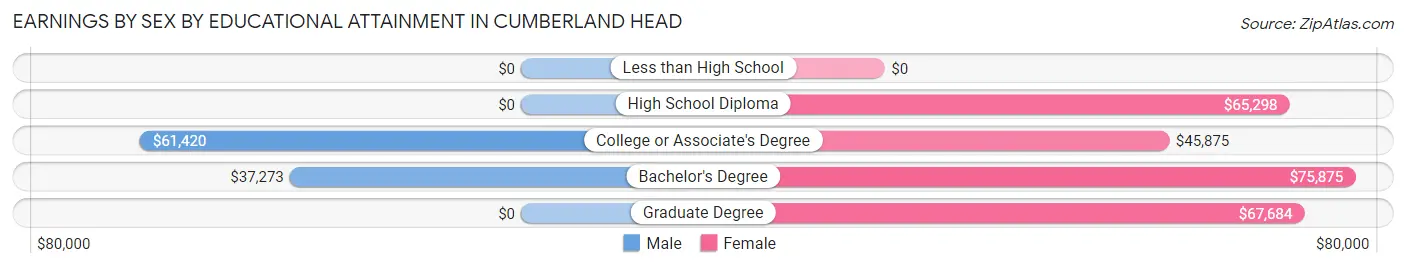
Earnings by Sex by Educational Attainment in Cumberland Head
Average earnings in Cumberland Head are $60,852 for men and $56,161 for women, a difference of 7.7%. Men with an educational attainment of college or associate's degree enjoy the highest average annual earnings of $61,420, while those with bachelor's degree education earn the least with $37,273. Women with an educational attainment of bachelor's degree earn the most with the average annual earnings of $75,875, while those with college or associate's degree education have the smallest earnings of $45,875.
| Educational Attainment | Male Income | Female Income |
| Less than High School | - | - |
| High School Diploma | - | - |
| College or Associate's Degree | $61,420 | $45,875 |
| Bachelor's Degree | $37,273 | $75,875 |
| Graduate Degree | - | - |
| Total | $60,852 | $56,161 |
Family Income in Cumberland Head
Family Income Brackets in Cumberland Head
According to the Cumberland Head family income data, there are 112 families falling into the $100,000 to $149,999 income range, which is the most common income bracket and makes up 25.1% of all families.
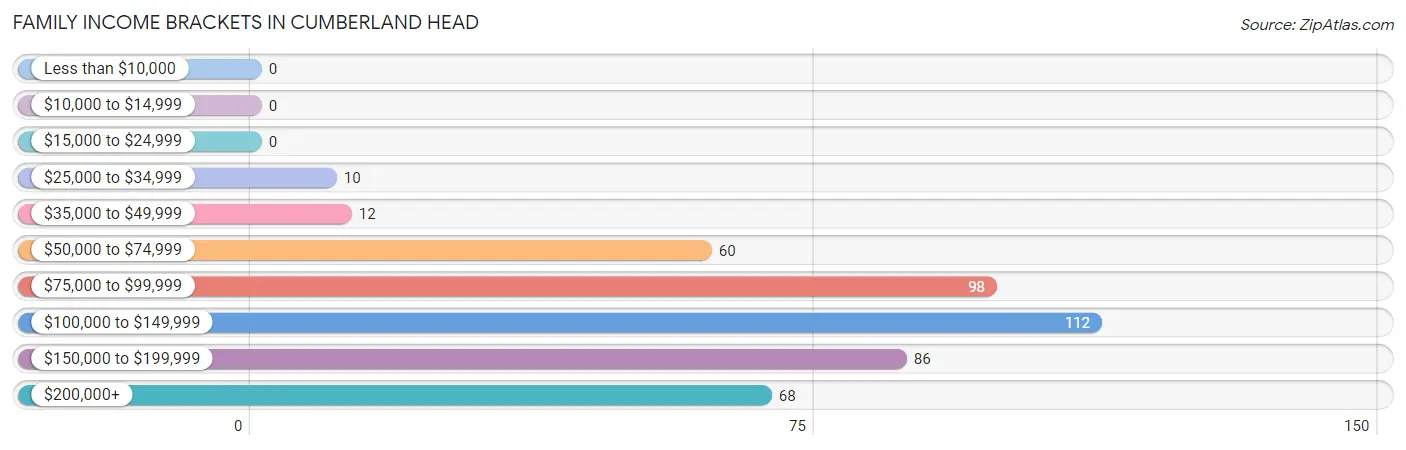
| Income Bracket | # Families | % Families |
| Less than $10,000 | 0 | 0.0% |
| $10,000 to $14,999 | 0 | 0.0% |
| $15,000 to $24,999 | 0 | 0.0% |
| $25,000 to $34,999 | 10 | 2.2% |
| $35,000 to $49,999 | 12 | 2.7% |
| $50,000 to $74,999 | 60 | 13.5% |
| $75,000 to $99,999 | 98 | 22.0% |
| $100,000 to $149,999 | 112 | 25.1% |
| $150,000 to $199,999 | 86 | 19.3% |
| $200,000+ | 68 | 15.2% |
Family Income by Famaliy Size in Cumberland Head
3-person families (60 | 13.5%) account for the highest median family income in Cumberland Head with $152,833 per family, while 2-person families (329 | 73.8%) have the highest median income of $55,547 per family member.
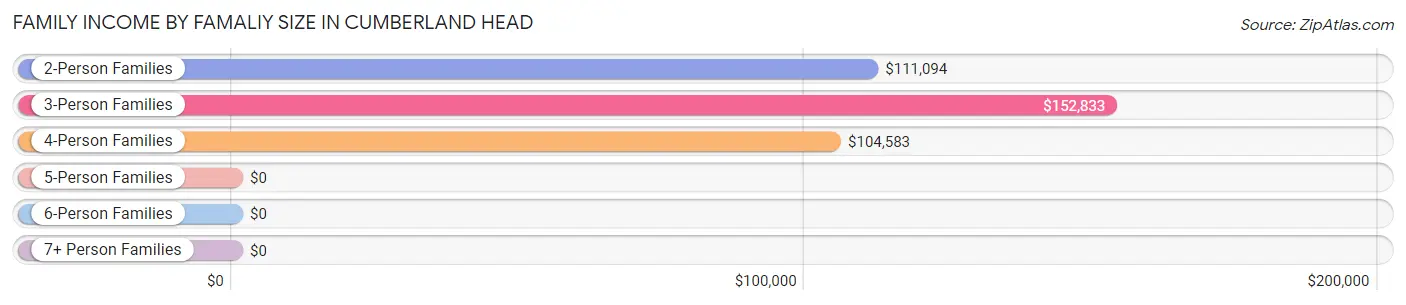
| Income Bracket | # Families | Median Income |
| 2-Person Families | 329 (73.8%) | $111,094 |
| 3-Person Families | 60 (13.5%) | $152,833 |
| 4-Person Families | 49 (11.0%) | $104,583 |
| 5-Person Families | 8 (1.8%) | $0 |
| 6-Person Families | 0 (0.0%) | $0 |
| 7+ Person Families | 0 (0.0%) | $0 |
| Total | 446 (100.0%) | $111,563 |
Family Income by Number of Earners in Cumberland Head
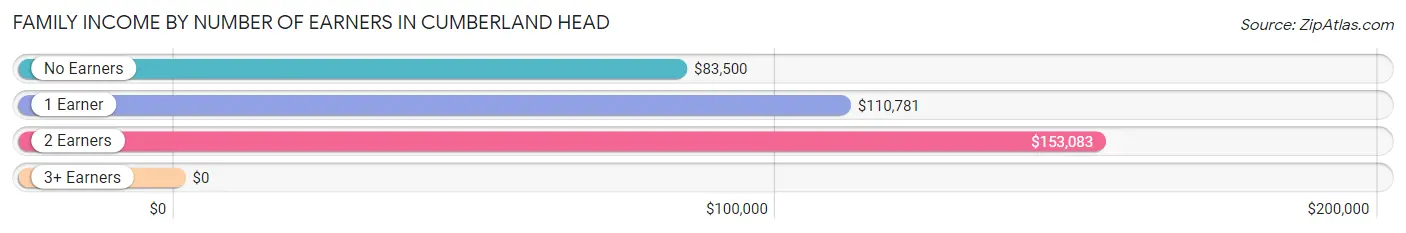
| Number of Earners | # Families | Median Income |
| No Earners | 138 (30.9%) | $83,500 |
| 1 Earner | 111 (24.9%) | $110,781 |
| 2 Earners | 177 (39.7%) | $153,083 |
| 3+ Earners | 20 (4.5%) | $0 |
| Total | 446 (100.0%) | $111,563 |
Household Income in Cumberland Head
Household Income Brackets in Cumberland Head
With 122 households falling in the category, the $75,000 to $99,999 income range is the most frequent in Cumberland Head, accounting for 20.3% of all households.
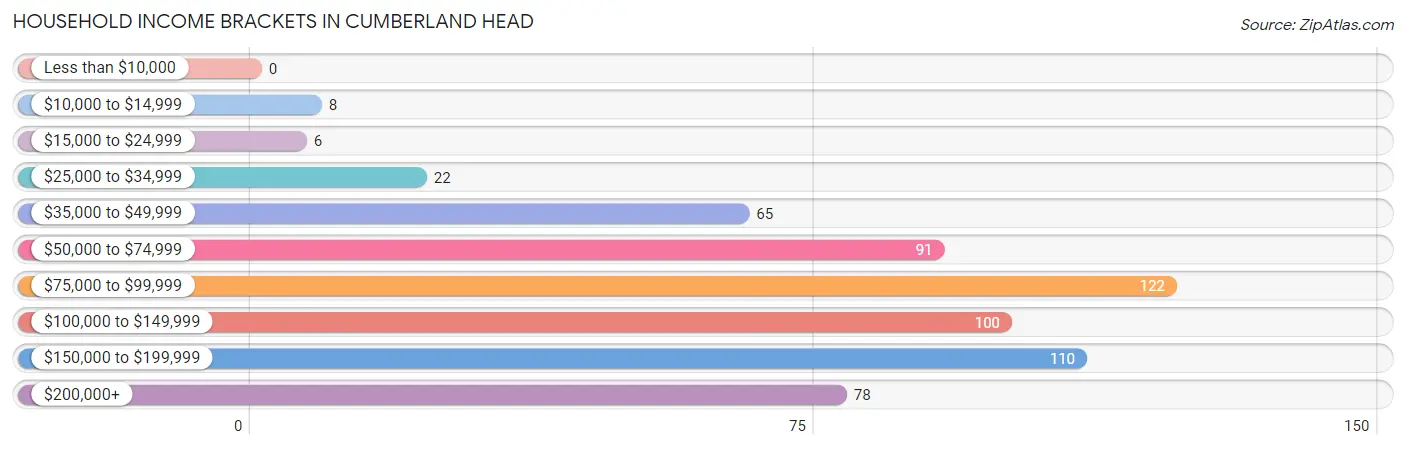
| Income Bracket | # Households | % Households |
| Less than $10,000 | 0 | 0.0% |
| $10,000 to $14,999 | 8 | 1.3% |
| $15,000 to $24,999 | 6 | 1.0% |
| $25,000 to $34,999 | 22 | 3.7% |
| $35,000 to $49,999 | 65 | 10.8% |
| $50,000 to $74,999 | 91 | 15.1% |
| $75,000 to $99,999 | 122 | 20.3% |
| $100,000 to $149,999 | 100 | 16.6% |
| $150,000 to $199,999 | 110 | 18.3% |
| $200,000+ | 78 | 13.0% |
Household Income by Householder Age in Cumberland Head
The median household income in Cumberland Head is $92,833, with the highest median household income of $151,667 found in the 45 to 64 years age bracket for the primary householder. A total of 206 households (34.2%) fall into this category.
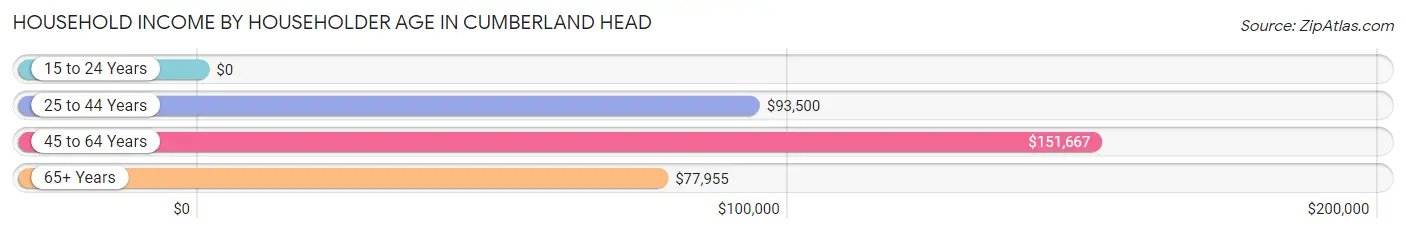
| Income Bracket | # Households | Median Income |
| 15 to 24 Years | 0 (0.0%) | $0 |
| 25 to 44 Years | 138 (22.9%) | $93,500 |
| 45 to 64 Years | 206 (34.2%) | $151,667 |
| 65+ Years | 258 (42.9%) | $77,955 |
| Total | 602 (100.0%) | $92,833 |
Poverty in Cumberland Head
Income Below Poverty by Sex and Age in Cumberland Head
With 1.8% poverty level for males and 1.9% for females among the residents of Cumberland Head, 45 to 54 year old males and 35 to 44 year old females are the most vulnerable to poverty, with 8 males (11.6%) and 11 females (12.5%) in their respective age groups living below the poverty level.
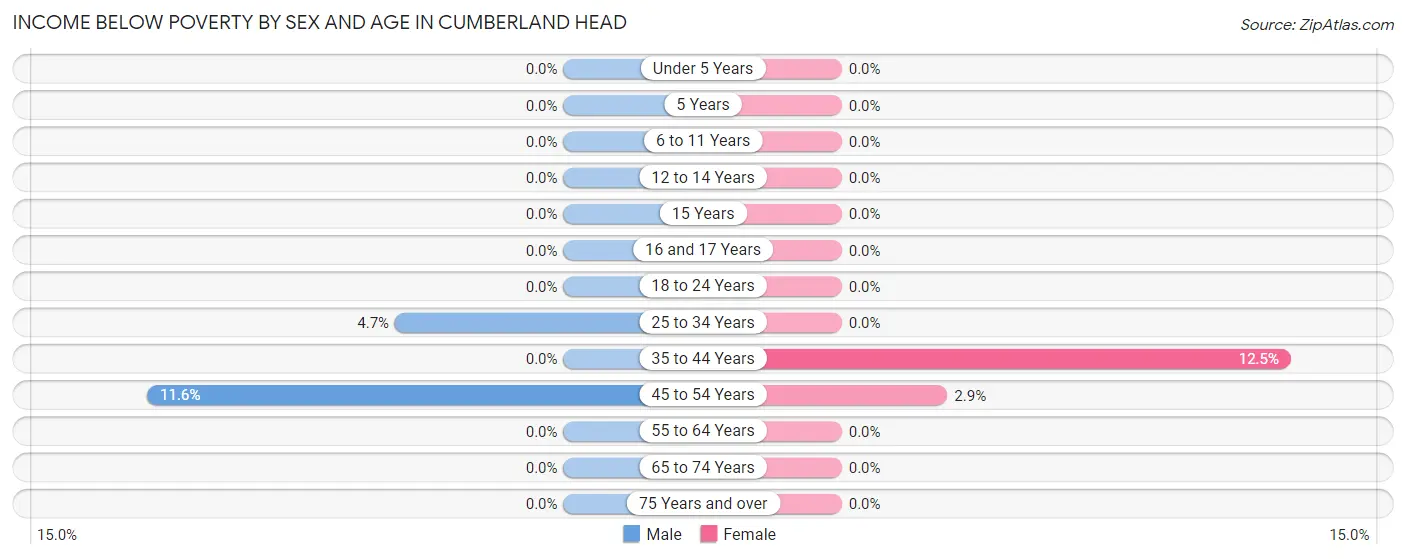
| Age Bracket | Male | Female |
| Under 5 Years | 0 (0.0%) | 0 (0.0%) |
| 5 Years | 0 (0.0%) | 0 (0.0%) |
| 6 to 11 Years | 0 (0.0%) | 0 (0.0%) |
| 12 to 14 Years | 0 (0.0%) | 0 (0.0%) |
| 15 Years | 0 (0.0%) | 0 (0.0%) |
| 16 and 17 Years | 0 (0.0%) | 0 (0.0%) |
| 18 to 24 Years | 0 (0.0%) | 0 (0.0%) |
| 25 to 34 Years | 3 (4.7%) | 0 (0.0%) |
| 35 to 44 Years | 0 (0.0%) | 11 (12.5%) |
| 45 to 54 Years | 8 (11.6%) | 3 (2.9%) |
| 55 to 64 Years | 0 (0.0%) | 0 (0.0%) |
| 65 to 74 Years | 0 (0.0%) | 0 (0.0%) |
| 75 Years and over | 0 (0.0%) | 0 (0.0%) |
| Total | 11 (1.8%) | 14 (1.9%) |
Income Above Poverty by Sex and Age in Cumberland Head
According to the poverty statistics in Cumberland Head, males aged under 5 years and females aged under 5 years are the age groups that are most secure financially, with 100.0% of males and 100.0% of females in these age groups living above the poverty line.
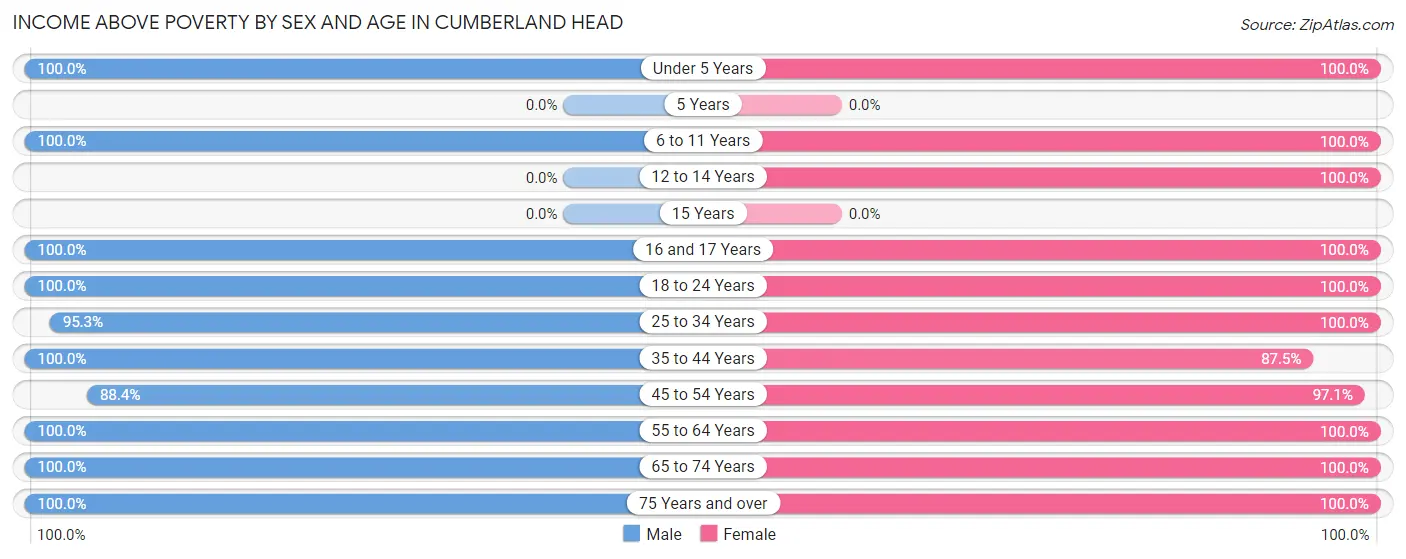
| Age Bracket | Male | Female |
| Under 5 Years | 27 (100.0%) | 24 (100.0%) |
| 5 Years | 0 (0.0%) | 0 (0.0%) |
| 6 to 11 Years | 35 (100.0%) | 5 (100.0%) |
| 12 to 14 Years | 0 (0.0%) | 25 (100.0%) |
| 15 Years | 0 (0.0%) | 0 (0.0%) |
| 16 and 17 Years | 10 (100.0%) | 10 (100.0%) |
| 18 to 24 Years | 24 (100.0%) | 11 (100.0%) |
| 25 to 34 Years | 61 (95.3%) | 107 (100.0%) |
| 35 to 44 Years | 62 (100.0%) | 77 (87.5%) |
| 45 to 54 Years | 61 (88.4%) | 99 (97.1%) |
| 55 to 64 Years | 165 (100.0%) | 114 (100.0%) |
| 65 to 74 Years | 108 (100.0%) | 68 (100.0%) |
| 75 Years and over | 60 (100.0%) | 174 (100.0%) |
| Total | 613 (98.2%) | 714 (98.1%) |
Income Below Poverty Among Married-Couple Families in Cumberland Head
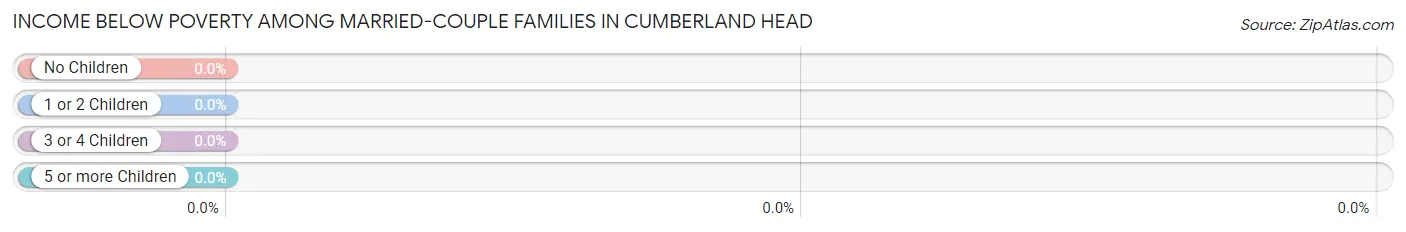
| Children | Above Poverty | Below Poverty |
| No Children | 320 (100.0%) | 0 (0.0%) |
| 1 or 2 Children | 83 (100.0%) | 0 (0.0%) |
| 3 or 4 Children | 0 (0.0%) | 0 (0.0%) |
| 5 or more Children | 0 (0.0%) | 0 (0.0%) |
| Total | 403 (100.0%) | 0 (0.0%) |
Income Below Poverty Among Single-Parent Households in Cumberland Head
| Children | Single Father | Single Mother |
| No Children | 0 (0.0%) | 0 (0.0%) |
| 1 or 2 Children | 0 (0.0%) | 0 (0.0%) |
| 3 or 4 Children | 0 (0.0%) | 0 (0.0%) |
| 5 or more Children | 0 (0.0%) | 0 (0.0%) |
| Total | 0 (0.0%) | 0 (0.0%) |
Income Below Poverty Among Married-Couple vs Single-Parent Households in Cumberland Head
| Children | Married-Couple Families | Single-Parent Households |
| No Children | 0 (0.0%) | 0 (0.0%) |
| 1 or 2 Children | 0 (0.0%) | 0 (0.0%) |
| 3 or 4 Children | 0 (0.0%) | 0 (0.0%) |
| 5 or more Children | 0 (0.0%) | 0 (0.0%) |
| Total | 0 (0.0%) | 0 (0.0%) |
Race in Cumberland Head
The most populous races in Cumberland Head are White / Caucasian (1,284 | 94.6%), Black / African American (31 | 2.3%), and Two or more Races (28 | 2.1%).
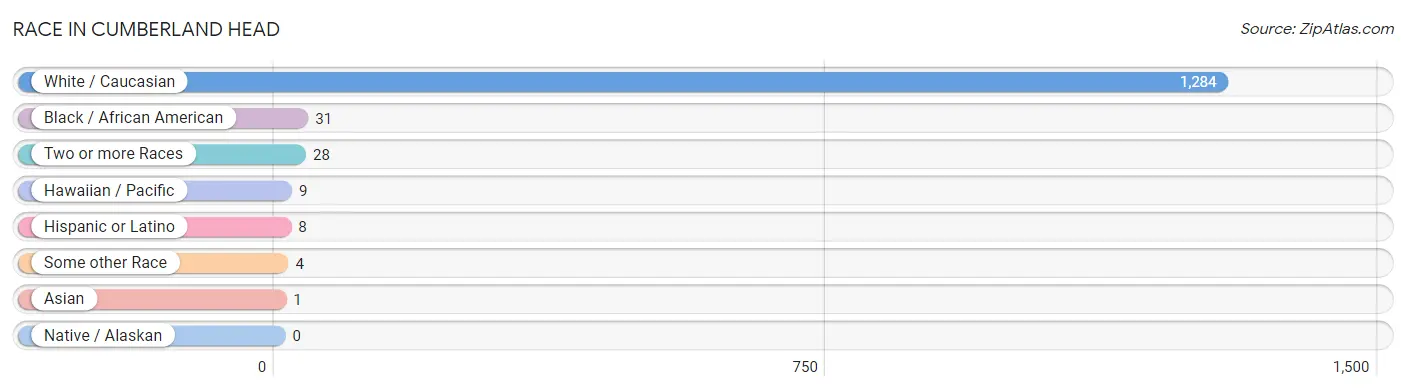
| Race | # Population | % Population |
| Asian | 1 | 0.1% |
| Black / African American | 31 | 2.3% |
| Hawaiian / Pacific | 9 | 0.7% |
| Hispanic or Latino | 8 | 0.6% |
| Native / Alaskan | 0 | 0.0% |
| White / Caucasian | 1,284 | 94.6% |
| Two or more Races | 28 | 2.1% |
| Some other Race | 4 | 0.3% |
| Total | 1,357 | 100.0% |
Ancestry in Cumberland Head
The most populous ancestries reported in Cumberland Head are German (235 | 17.3%), Irish (228 | 16.8%), English (197 | 14.5%), French (149 | 11.0%), and Italian (125 | 9.2%), together accounting for 68.8% of all Cumberland Head residents.
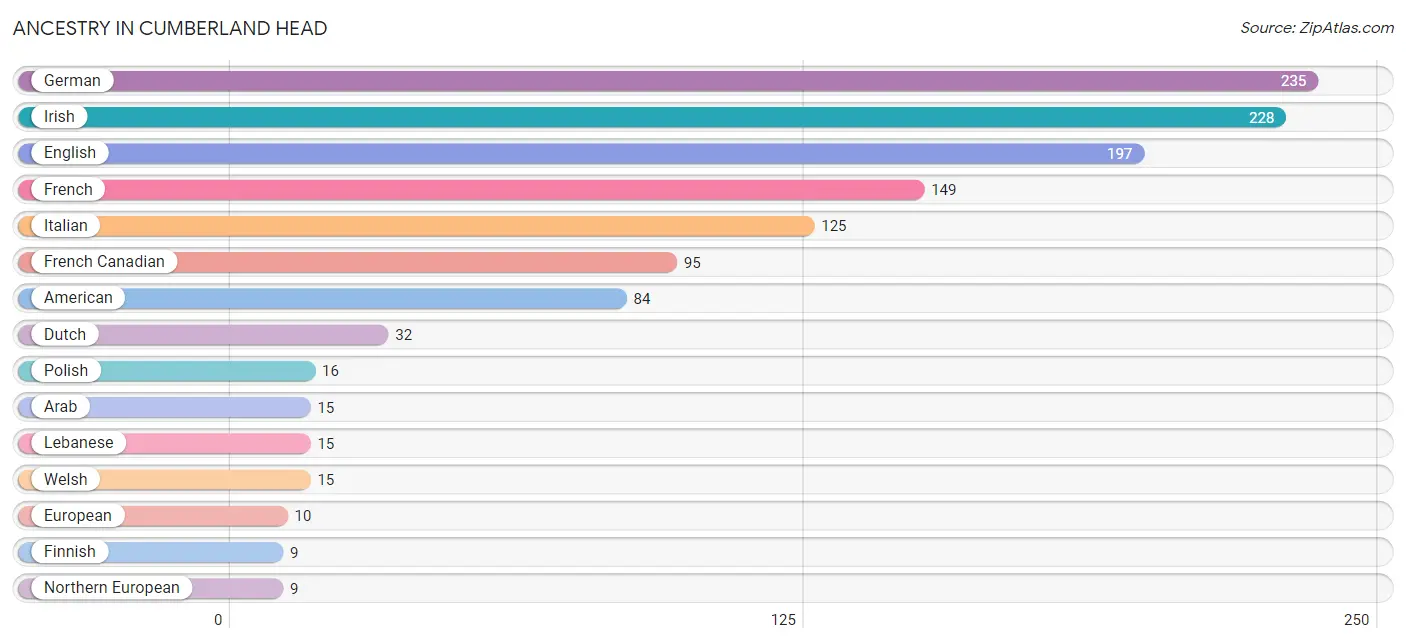
| Ancestry | # Population | % Population |
| American | 84 | 6.2% |
| Arab | 15 | 1.1% |
| British | 6 | 0.4% |
| British West Indian | 8 | 0.6% |
| Canadian | 6 | 0.4% |
| Dutch | 32 | 2.4% |
| English | 197 | 14.5% |
| European | 10 | 0.7% |
| Finnish | 9 | 0.7% |
| French | 149 | 11.0% |
| French Canadian | 95 | 7.0% |
| German | 235 | 17.3% |
| Indian (Asian) | 1 | 0.1% |
| Irish | 228 | 16.8% |
| Italian | 125 | 9.2% |
| Lebanese | 15 | 1.1% |
| Northern European | 9 | 0.7% |
| Norwegian | 8 | 0.6% |
| Polish | 16 | 1.2% |
| Puerto Rican | 6 | 0.4% |
| Spanish | 2 | 0.2% |
| Welsh | 15 | 1.1% | View All 22 Rows |
Immigrants in Cumberland Head
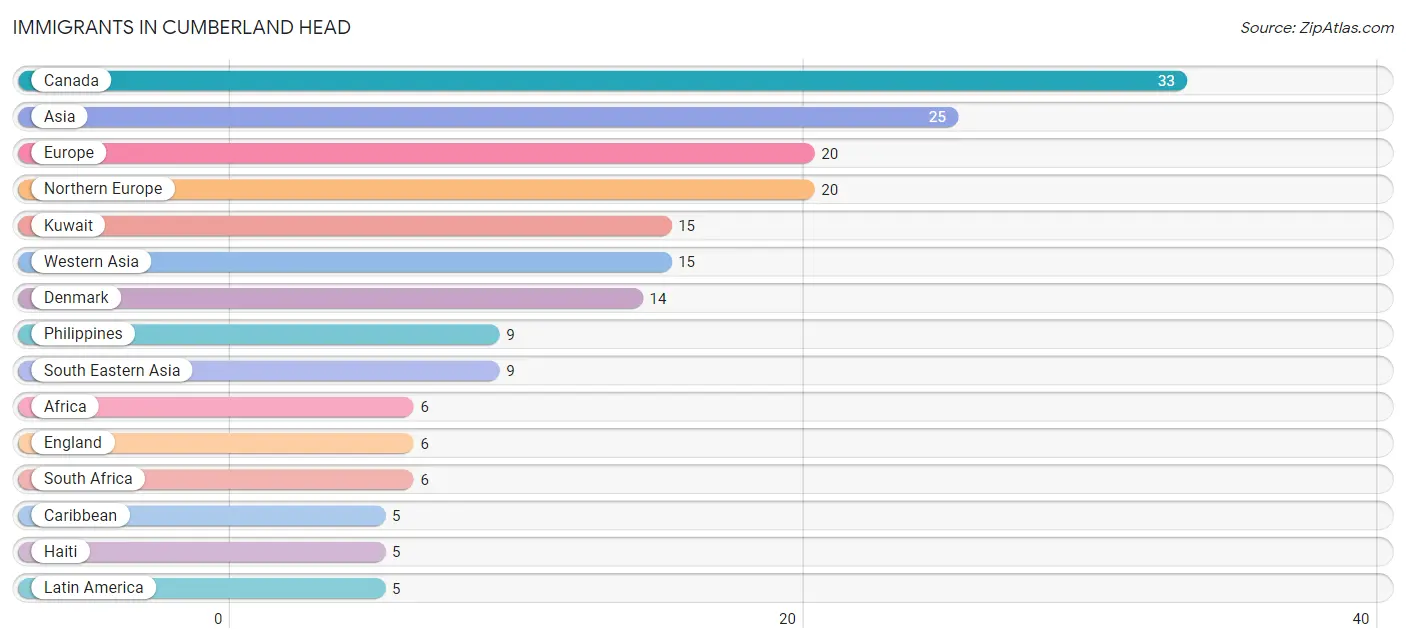
The most numerous immigrant groups reported in Cumberland Head came from Canada (33 | 2.4%), Asia (25 | 1.8%), Europe (20 | 1.5%), Northern Europe (20 | 1.5%), and Kuwait (15 | 1.1%), together accounting for 8.3% of all Cumberland Head residents.
| Immigration Origin | # Population | % Population |
| Africa | 6 | 0.4% |
| Asia | 25 | 1.8% |
| Canada | 33 | 2.4% |
| Caribbean | 5 | 0.4% |
| China | 1 | 0.1% |
| Denmark | 14 | 1.0% |
| Eastern Asia | 1 | 0.1% |
| England | 6 | 0.4% |
| Europe | 20 | 1.5% |
| Haiti | 5 | 0.4% |
| Kuwait | 15 | 1.1% |
| Latin America | 5 | 0.4% |
| Northern Europe | 20 | 1.5% |
| Philippines | 9 | 0.7% |
| South Africa | 6 | 0.4% |
| South Eastern Asia | 9 | 0.7% |
| Western Asia | 15 | 1.1% | View All 17 Rows |
Sex and Age in Cumberland Head
Sex and Age in Cumberland Head
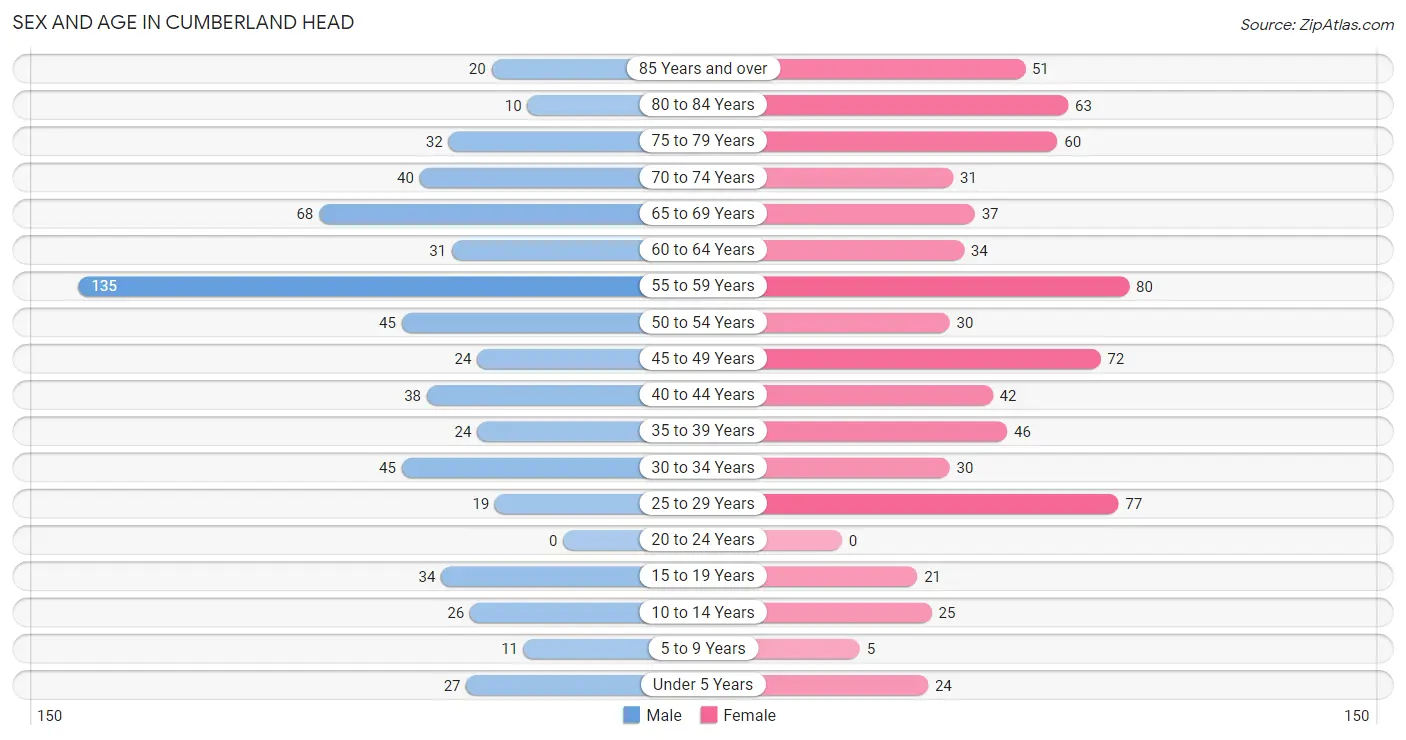
The most populous age groups in Cumberland Head are 55 to 59 Years (135 | 21.5%) for men and 55 to 59 Years (80 | 11.0%) for women.
| Age Bracket | Male | Female |
| Under 5 Years | 27 (4.3%) | 24 (3.3%) |
| 5 to 9 Years | 11 (1.8%) | 5 (0.7%) |
| 10 to 14 Years | 26 (4.1%) | 25 (3.4%) |
| 15 to 19 Years | 34 (5.4%) | 21 (2.9%) |
| 20 to 24 Years | 0 (0.0%) | 0 (0.0%) |
| 25 to 29 Years | 19 (3.0%) | 77 (10.6%) |
| 30 to 34 Years | 45 (7.1%) | 30 (4.1%) |
| 35 to 39 Years | 24 (3.8%) | 46 (6.3%) |
| 40 to 44 Years | 38 (6.0%) | 42 (5.8%) |
| 45 to 49 Years | 24 (3.8%) | 72 (9.9%) |
| 50 to 54 Years | 45 (7.1%) | 30 (4.1%) |
| 55 to 59 Years | 135 (21.5%) | 80 (11.0%) |
| 60 to 64 Years | 31 (4.9%) | 34 (4.7%) |
| 65 to 69 Years | 68 (10.8%) | 37 (5.1%) |
| 70 to 74 Years | 40 (6.4%) | 31 (4.3%) |
| 75 to 79 Years | 32 (5.1%) | 60 (8.2%) |
| 80 to 84 Years | 10 (1.6%) | 63 (8.6%) |
| 85 Years and over | 20 (3.2%) | 51 (7.0%) |
| Total | 629 (100.0%) | 728 (100.0%) |
Families and Households in Cumberland Head
Median Family Size in Cumberland Head
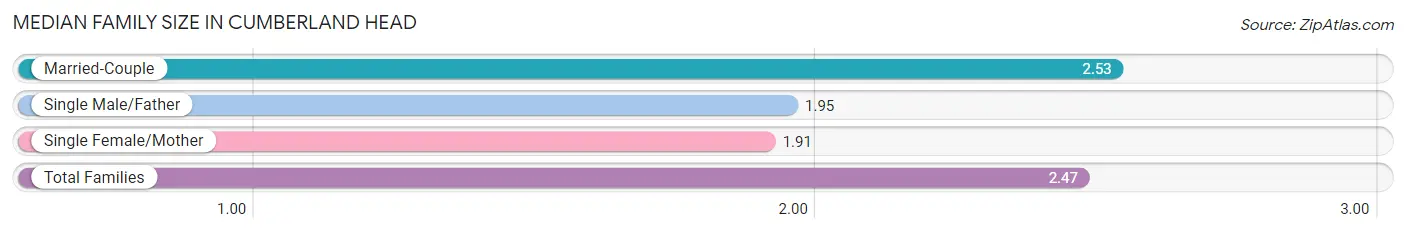
The median family size in Cumberland Head is 2.47 persons per family, with married-couple families (403 | 90.4%) accounting for the largest median family size of 2.53 persons per family. On the other hand, single female/mother families (22 | 4.9%) represent the smallest median family size with 1.91 persons per family.
| Family Type | # Families | Family Size |
| Married-Couple | 403 (90.4%) | 2.53 |
| Single Male/Father | 21 (4.7%) | 1.95 |
| Single Female/Mother | 22 (4.9%) | 1.91 |
| Total Families | 446 (100.0%) | 2.47 |
Median Household Size in Cumberland Head
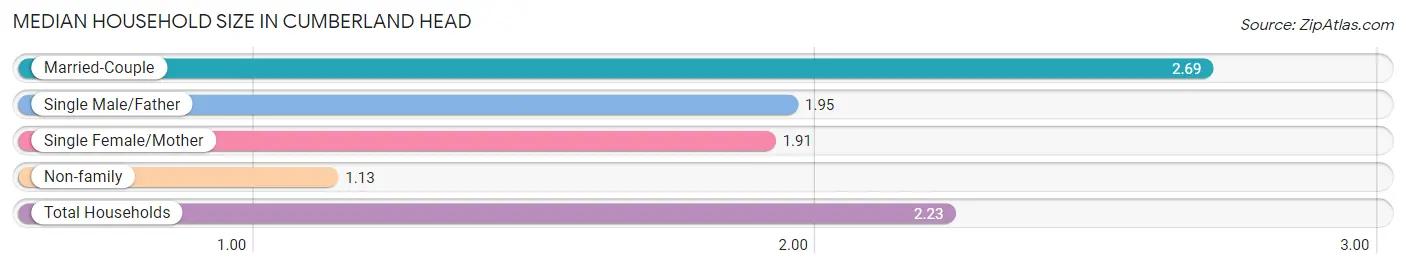
The median household size in Cumberland Head is 2.23 persons per household, with married-couple households (403 | 66.9%) accounting for the largest median household size of 2.69 persons per household. non-family households (156 | 25.9%) represent the smallest median household size with 1.13 persons per household.
| Household Type | # Households | Household Size |
| Married-Couple | 403 (66.9%) | 2.69 |
| Single Male/Father | 21 (3.5%) | 1.95 |
| Single Female/Mother | 22 (3.6%) | 1.91 |
| Non-family | 156 (25.9%) | 1.13 |
| Total Households | 602 (100.0%) | 2.23 |
Household Size by Marriage Status in Cumberland Head
Out of a total of 602 households in Cumberland Head, 446 (74.1%) are family households, while 156 (25.9%) are nonfamily households. The most numerous type of family households are 2-person households, comprising 305, and the most common type of nonfamily households are 1-person households, comprising 132.
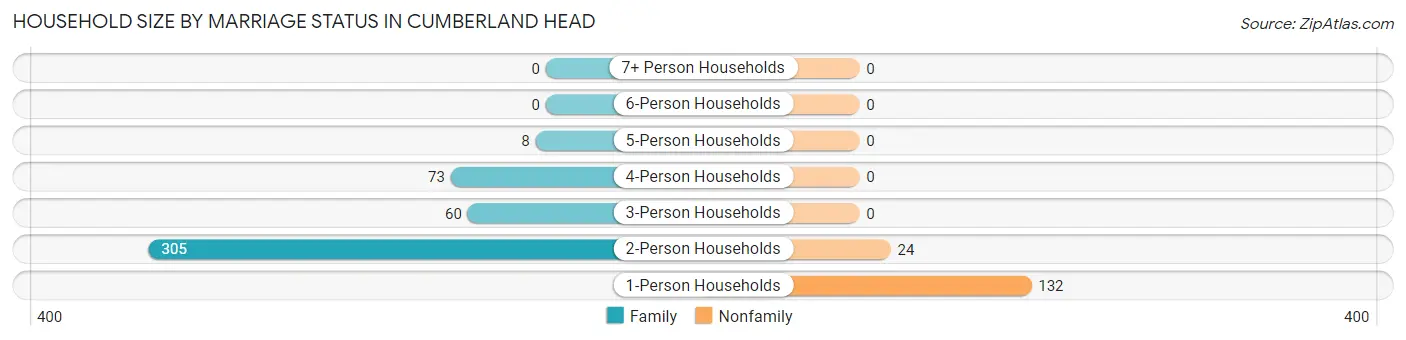
| Household Size | Family Households | Nonfamily Households |
| 1-Person Households | - | 132 (21.9%) |
| 2-Person Households | 305 (50.7%) | 24 (4.0%) |
| 3-Person Households | 60 (10.0%) | 0 (0.0%) |
| 4-Person Households | 73 (12.1%) | 0 (0.0%) |
| 5-Person Households | 8 (1.3%) | 0 (0.0%) |
| 6-Person Households | 0 (0.0%) | 0 (0.0%) |
| 7+ Person Households | 0 (0.0%) | 0 (0.0%) |
| Total | 446 (74.1%) | 156 (25.9%) |
Female Fertility in Cumberland Head
Fertility by Age in Cumberland Head
Average fertility rate in Cumberland Head is 115.0 births per 1,000 women. Women in the age bracket of 20 to 34 years have the highest fertility rate with 308.0 births per 1,000 women. Women in the age bracket of 20 to 34 years acount for 100.0% of all women with births.
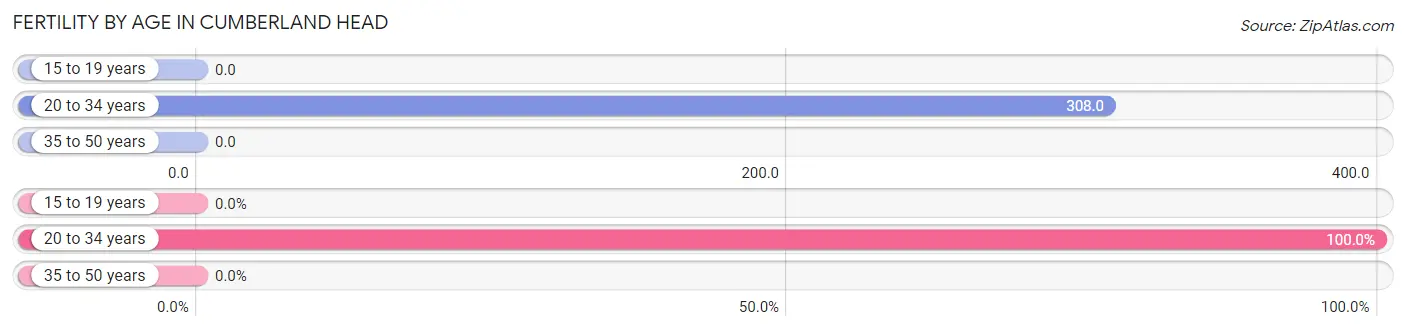
| Age Bracket | Women with Births | Births / 1,000 Women |
| 15 to 19 years | 0 (0.0%) | 0.0 |
| 20 to 34 years | 33 (100.0%) | 308.0 |
| 35 to 50 years | 0 (0.0%) | 0.0 |
| Total | 33 (100.0%) | 115.0 |
Fertility by Age by Marriage Status in Cumberland Head
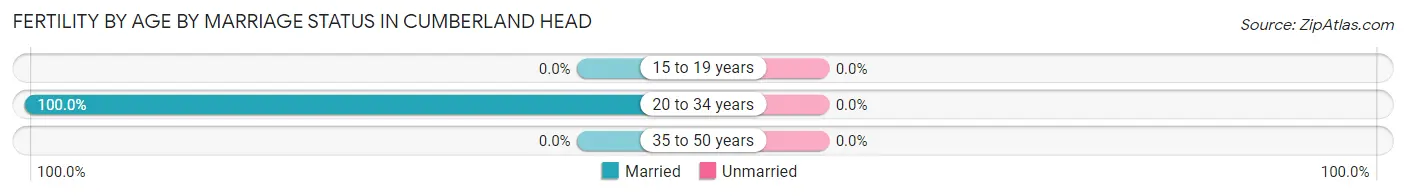
| Age Bracket | Married | Unmarried |
| 15 to 19 years | 0 (0.0%) | 0 (0.0%) |
| 20 to 34 years | 33 (100.0%) | 0 (0.0%) |
| 35 to 50 years | 0 (0.0%) | 0 (0.0%) |
| Total | 33 (100.0%) | 0 (0.0%) |
Fertility by Education in Cumberland Head
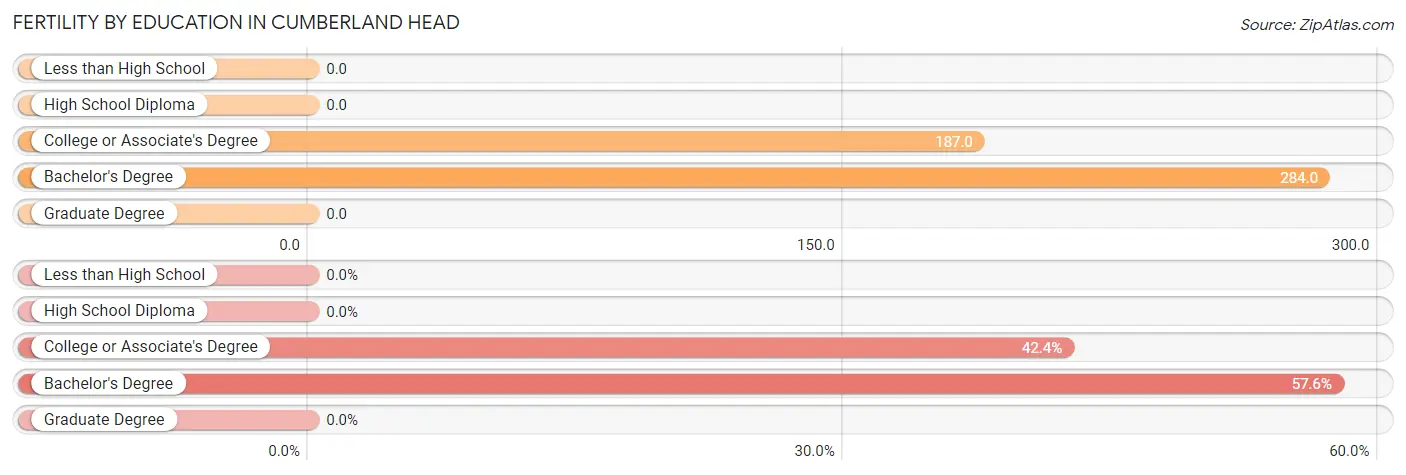
| Educational Attainment | Women with Births | Births / 1,000 Women |
| Less than High School | 0 (0.0%) | 0.0 |
| High School Diploma | 0 (0.0%) | 0.0 |
| College or Associate's Degree | 14 (42.4%) | 187.0 |
| Bachelor's Degree | 19 (57.6%) | 284.0 |
| Graduate Degree | 0 (0.0%) | 0.0 |
| Total | 33 (100.0%) | 115.0 |
Fertility by Education by Marriage Status in Cumberland Head
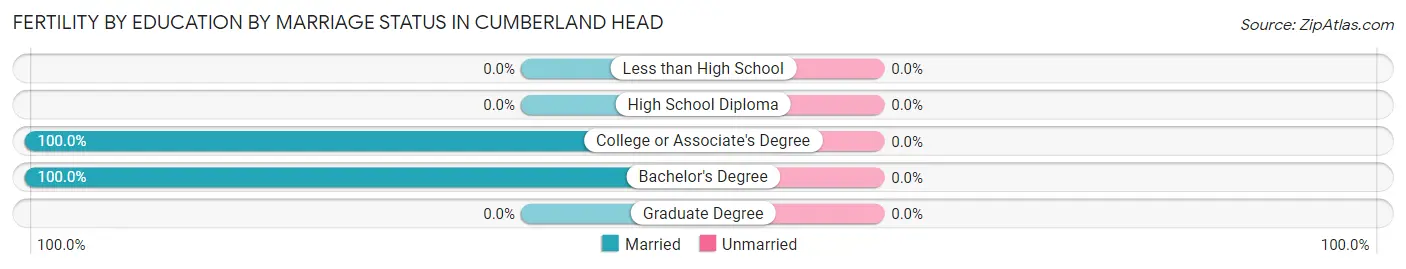
| Educational Attainment | Married | Unmarried |
| Less than High School | 0 (0.0%) | 0 (0.0%) |
| High School Diploma | 0 (0.0%) | 0 (0.0%) |
| College or Associate's Degree | 14 (100.0%) | 0 (0.0%) |
| Bachelor's Degree | 19 (100.0%) | 0 (0.0%) |
| Graduate Degree | 0 (0.0%) | 0 (0.0%) |
| Total | 33 (100.0%) | 0 (0.0%) |
Employment Characteristics in Cumberland Head
Employment by Class of Employer in Cumberland Head
Among the 614 employed individuals in Cumberland Head, private company employees (284 | 46.3%), not-for-profit organizations (107 | 17.4%), and local government employees (93 | 15.1%) make up the most common classes of employment.
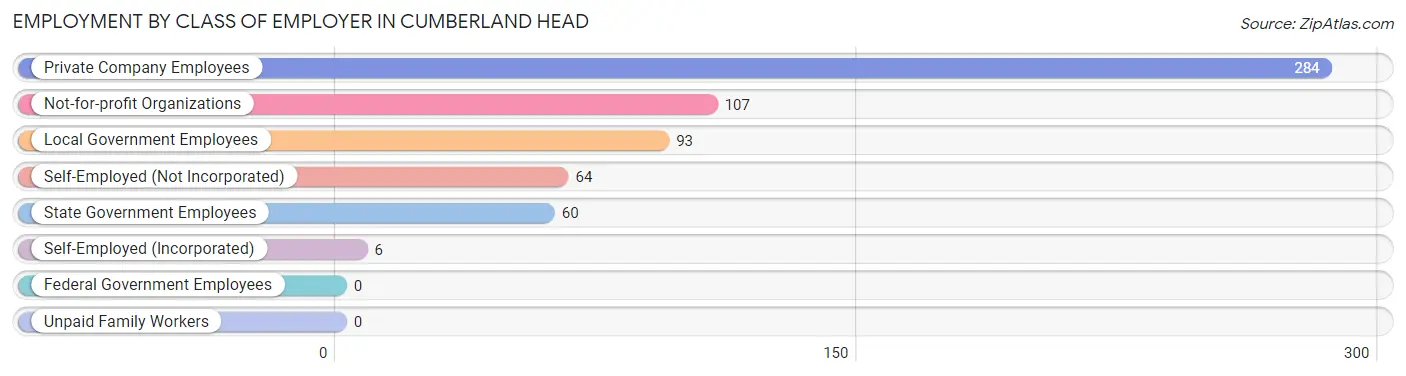
| Employer Class | # Employees | % Employees |
| Private Company Employees | 284 | 46.3% |
| Self-Employed (Incorporated) | 6 | 1.0% |
| Self-Employed (Not Incorporated) | 64 | 10.4% |
| Not-for-profit Organizations | 107 | 17.4% |
| Local Government Employees | 93 | 15.1% |
| State Government Employees | 60 | 9.8% |
| Federal Government Employees | 0 | 0.0% |
| Unpaid Family Workers | 0 | 0.0% |
| Total | 614 | 100.0% |
Employment Status by Age in Cumberland Head
According to the labor force statistics for Cumberland Head, out of the total population over 16 years of age (1,239), 50.7% or 628 individuals are in the labor force, with 2.2% or 14 of them unemployed. The age group with the highest labor force participation rate is 25 to 29 years, with 100.0% or 96 individuals in the labor force. Within the labor force, the 25 to 29 years age range has the highest percentage of unemployed individuals, with 14.6% or 14 of them being unemployed.
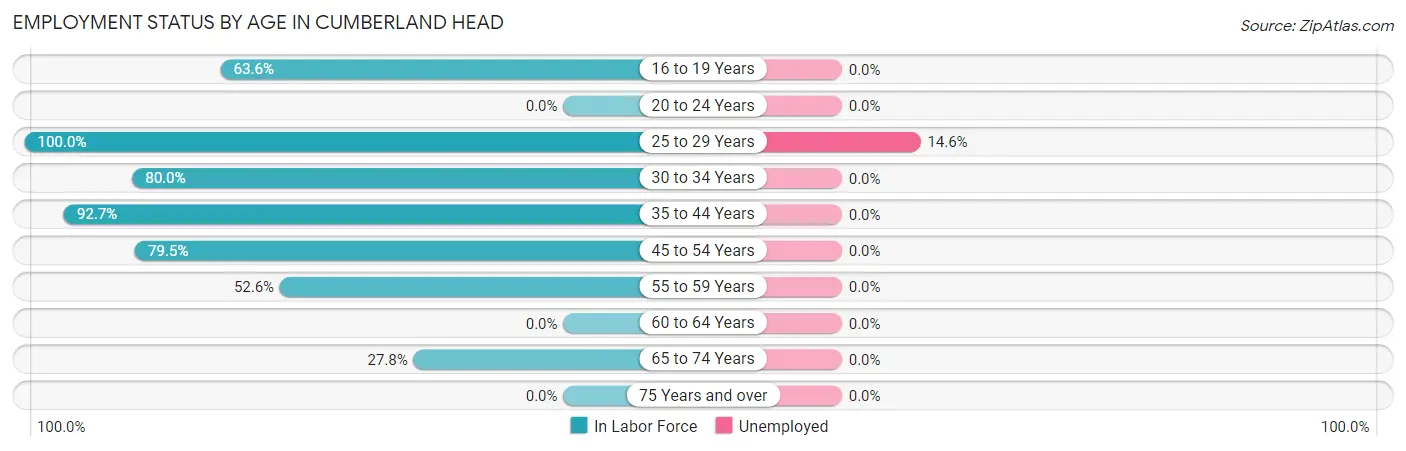
| Age Bracket | In Labor Force | Unemployed |
| 16 to 19 Years | 35 (63.6%) | 0 (0.0%) |
| 20 to 24 Years | 0 (0.0%) | 0 (0.0%) |
| 25 to 29 Years | 96 (100.0%) | 14 (14.6%) |
| 30 to 34 Years | 60 (80.0%) | 0 (0.0%) |
| 35 to 44 Years | 139 (92.7%) | 0 (0.0%) |
| 45 to 54 Years | 136 (79.5%) | 0 (0.0%) |
| 55 to 59 Years | 113 (52.6%) | 0 (0.0%) |
| 60 to 64 Years | 0 (0.0%) | 0 (0.0%) |
| 65 to 74 Years | 49 (27.8%) | 0 (0.0%) |
| 75 Years and over | 0 (0.0%) | 0 (0.0%) |
| Total | 628 (50.7%) | 14 (2.2%) |
Employment Status by Educational Attainment in Cumberland Head
According to labor force statistics for Cumberland Head, 70.5% of individuals (544) out of the total population between 25 and 64 years of age (772) are in the labor force, with 2.6% or 14 of them being unemployed. The group with the highest labor force participation rate are those with the educational attainment of bachelor's degree or higher, with 83.2% or 283 individuals in the labor force. Within the labor force, individuals with bachelor's degree or higher education have the highest percentage of unemployment, with 4.9% or 14 of them being unemployed.
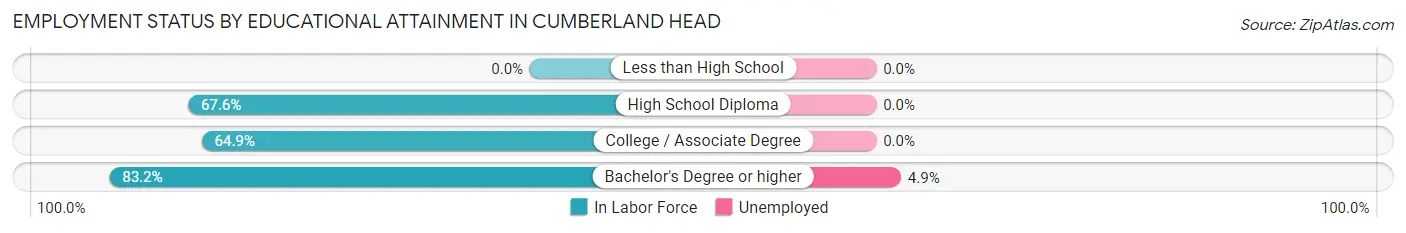
| Educational Attainment | In Labor Force | Unemployed |
| Less than High School | 0 (0.0%) | 0 (0.0%) |
| High School Diploma | 100 (67.6%) | 0 (0.0%) |
| College / Associate Degree | 161 (64.9%) | 0 (0.0%) |
| Bachelor's Degree or higher | 283 (83.2%) | 17 (4.9%) |
| Total | 544 (70.5%) | 20 (2.6%) |
Employment Occupations by Sex in Cumberland Head
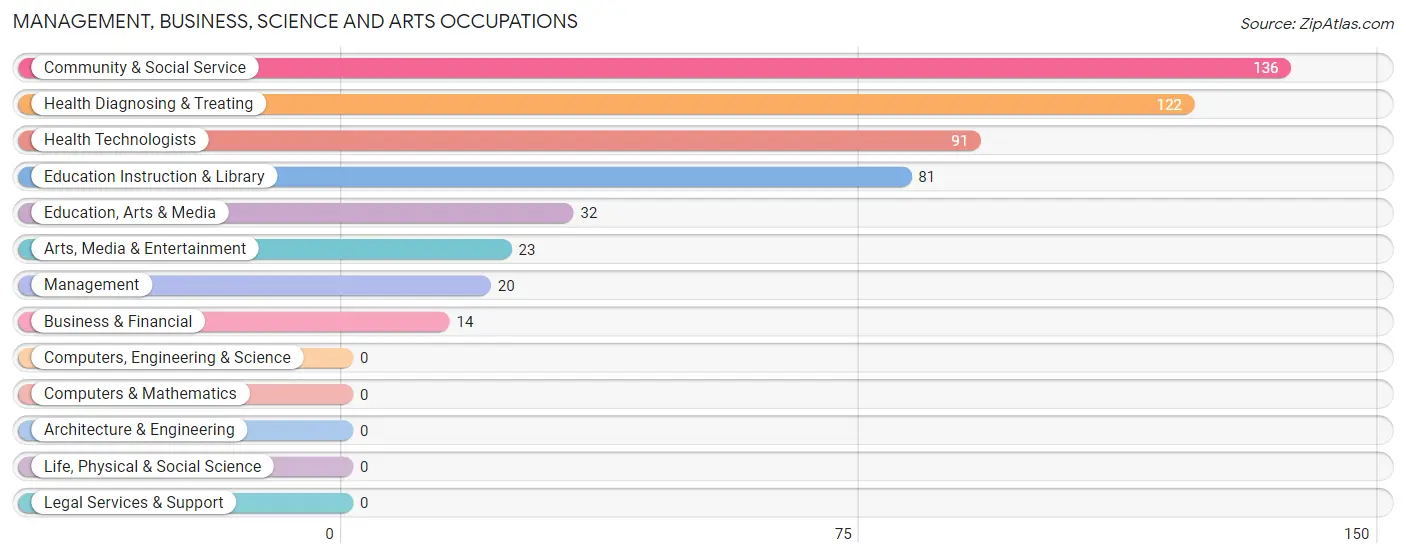
Management, Business, Science and Arts Occupations
The most common Management, Business, Science and Arts occupations in Cumberland Head are Community & Social Service (136 | 22.2%), Health Diagnosing & Treating (122 | 19.9%), Health Technologists (91 | 14.8%), Education Instruction & Library (81 | 13.2%), and Education, Arts & Media (32 | 5.2%).
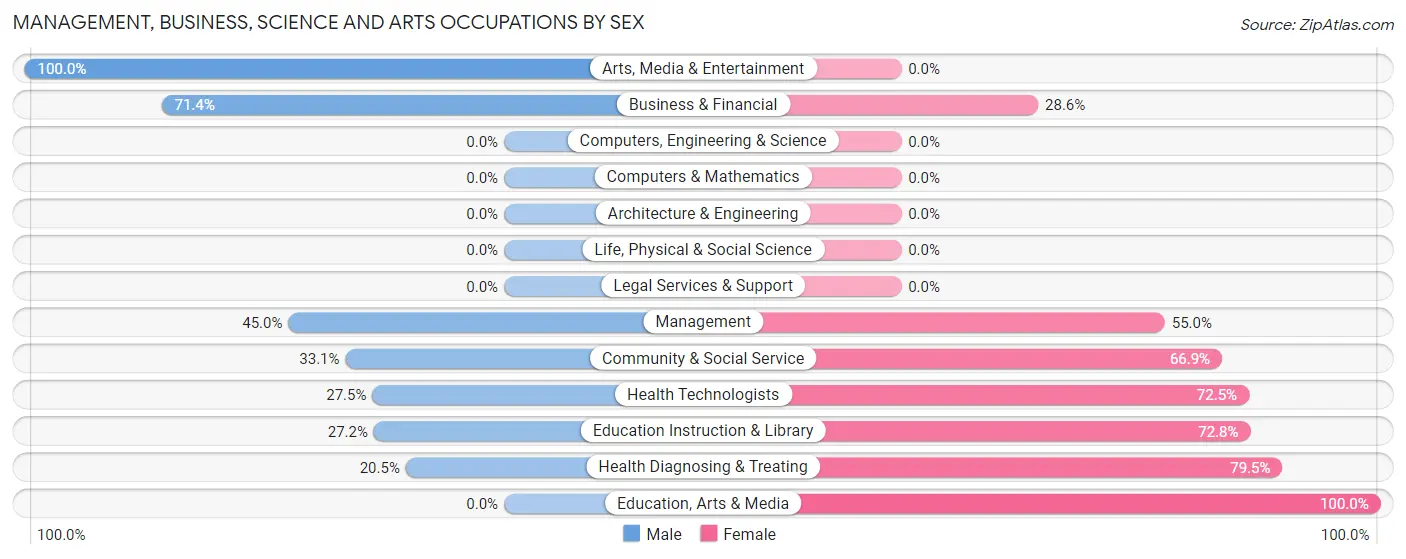
Management, Business, Science and Arts Occupations by Sex
Within the Management, Business, Science and Arts occupations in Cumberland Head, the most male-oriented occupations are Arts, Media & Entertainment (100.0%), Business & Financial (71.4%), and Management (45.0%), while the most female-oriented occupations are Education, Arts & Media (100.0%), Health Diagnosing & Treating (79.5%), and Education Instruction & Library (72.8%).
| Occupation | Male | Female |
| Management | 9 (45.0%) | 11 (55.0%) |
| Business & Financial | 10 (71.4%) | 4 (28.6%) |
| Computers, Engineering & Science | 0 (0.0%) | 0 (0.0%) |
| Computers & Mathematics | 0 (0.0%) | 0 (0.0%) |
| Architecture & Engineering | 0 (0.0%) | 0 (0.0%) |
| Life, Physical & Social Science | 0 (0.0%) | 0 (0.0%) |
| Community & Social Service | 45 (33.1%) | 91 (66.9%) |
| Education, Arts & Media | 0 (0.0%) | 32 (100.0%) |
| Legal Services & Support | 0 (0.0%) | 0 (0.0%) |
| Education Instruction & Library | 22 (27.2%) | 59 (72.8%) |
| Arts, Media & Entertainment | 23 (100.0%) | 0 (0.0%) |
| Health Diagnosing & Treating | 25 (20.5%) | 97 (79.5%) |
| Health Technologists | 25 (27.5%) | 66 (72.5%) |
| Total (Category) | 89 (30.5%) | 203 (69.5%) |
| Total (Overall) | 265 (43.2%) | 349 (56.8%) |
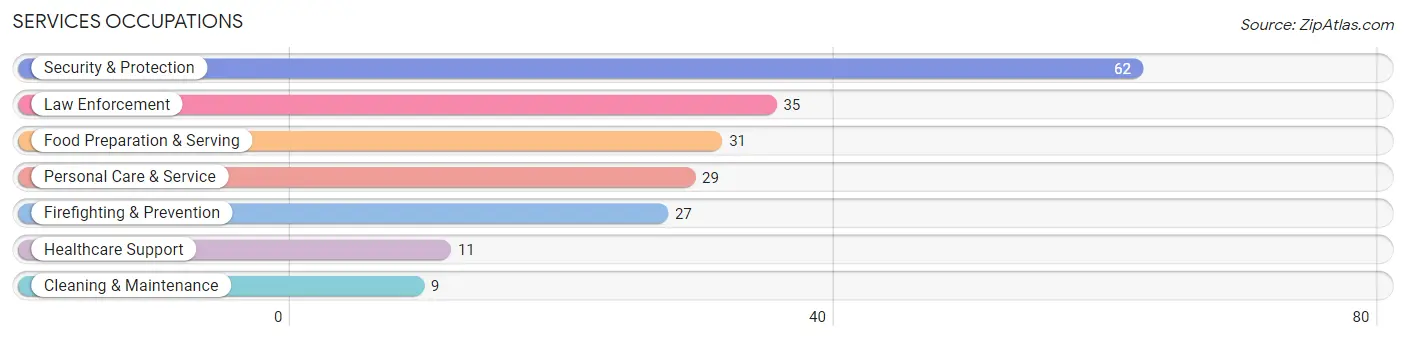
Services Occupations
The most common Services occupations in Cumberland Head are Security & Protection (62 | 10.1%), Law Enforcement (35 | 5.7%), Food Preparation & Serving (31 | 5.1%), Personal Care & Service (29 | 4.7%), and Firefighting & Prevention (27 | 4.4%).
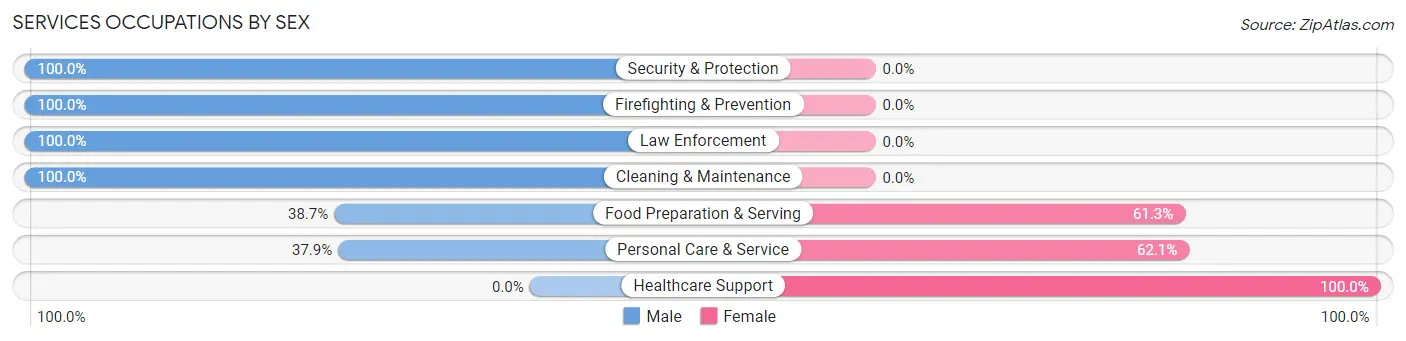
Services Occupations by Sex
Within the Services occupations in Cumberland Head, the most male-oriented occupations are Security & Protection (100.0%), Firefighting & Prevention (100.0%), and Law Enforcement (100.0%), while the most female-oriented occupations are Healthcare Support (100.0%), Personal Care & Service (62.1%), and Food Preparation & Serving (61.3%).
| Occupation | Male | Female |
| Healthcare Support | 0 (0.0%) | 11 (100.0%) |
| Security & Protection | 62 (100.0%) | 0 (0.0%) |
| Firefighting & Prevention | 27 (100.0%) | 0 (0.0%) |
| Law Enforcement | 35 (100.0%) | 0 (0.0%) |
| Food Preparation & Serving | 12 (38.7%) | 19 (61.3%) |
| Cleaning & Maintenance | 9 (100.0%) | 0 (0.0%) |
| Personal Care & Service | 11 (37.9%) | 18 (62.1%) |
| Total (Category) | 94 (66.2%) | 48 (33.8%) |
| Total (Overall) | 265 (43.2%) | 349 (56.8%) |
Sales and Office Occupations
The most common Sales and Office occupations in Cumberland Head are Sales & Related (54 | 8.8%), and Office & Administration (28 | 4.6%).
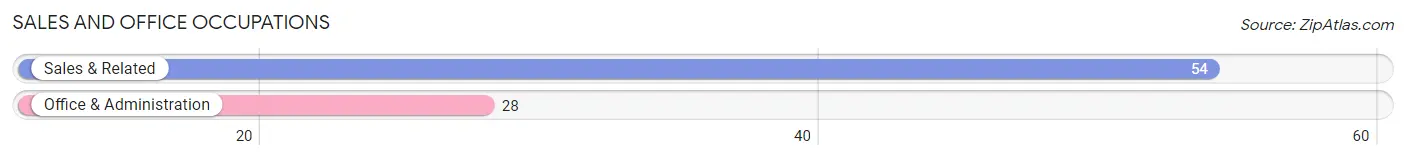
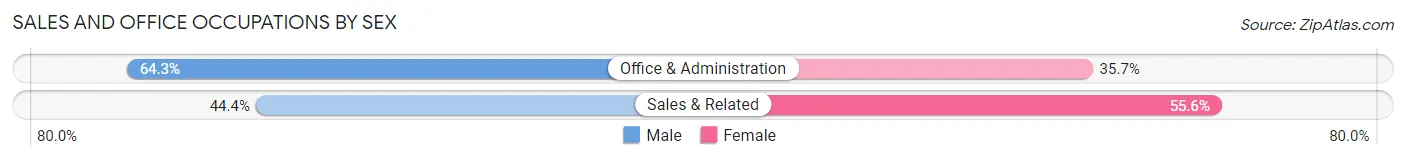
Sales and Office Occupations by Sex
| Occupation | Male | Female |
| Sales & Related | 24 (44.4%) | 30 (55.6%) |
| Office & Administration | 18 (64.3%) | 10 (35.7%) |
| Total (Category) | 42 (51.2%) | 40 (48.8%) |
| Total (Overall) | 265 (43.2%) | 349 (56.8%) |
Natural Resources, Construction and Maintenance Occupations
The most common Natural Resources, Construction and Maintenance occupations in Cumberland Head are , and Installation, Maintenance & Repair (12 | 1.9%).
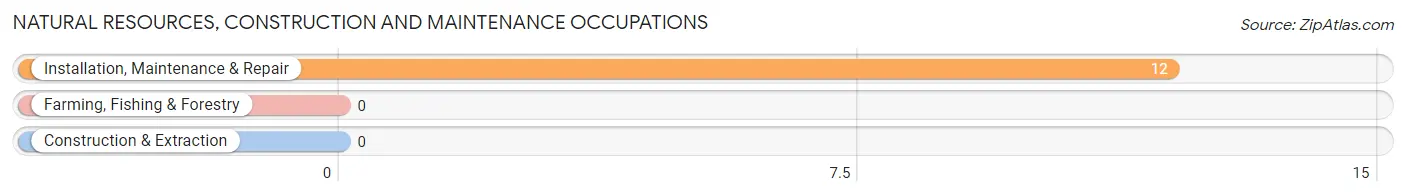
Natural Resources, Construction and Maintenance Occupations by Sex
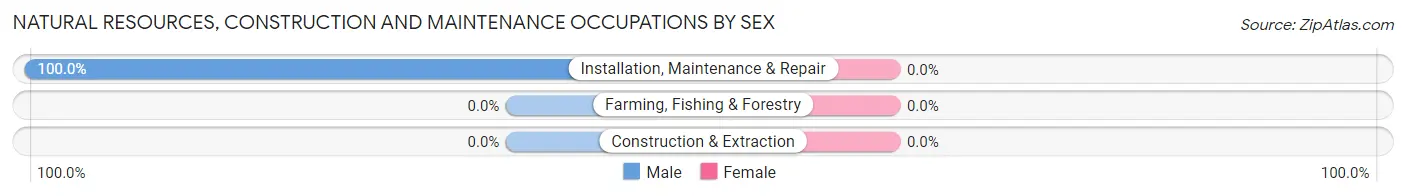
| Occupation | Male | Female |
| Farming, Fishing & Forestry | 0 (0.0%) | 0 (0.0%) |
| Construction & Extraction | 0 (0.0%) | 0 (0.0%) |
| Installation, Maintenance & Repair | 12 (100.0%) | 0 (0.0%) |
| Total (Category) | 12 (100.0%) | 0 (0.0%) |
| Total (Overall) | 265 (43.2%) | 349 (56.8%) |
Production, Transportation and Moving Occupations
The most common Production, Transportation and Moving occupations in Cumberland Head are Transportation (46 | 7.5%), Material Moving (25 | 4.1%), and Production (15 | 2.4%).
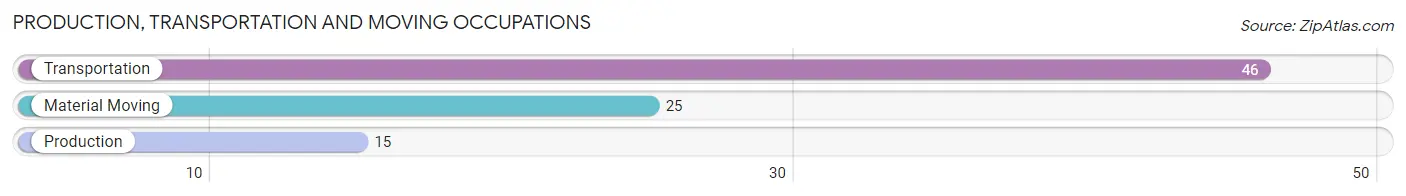
Production, Transportation and Moving Occupations by Sex
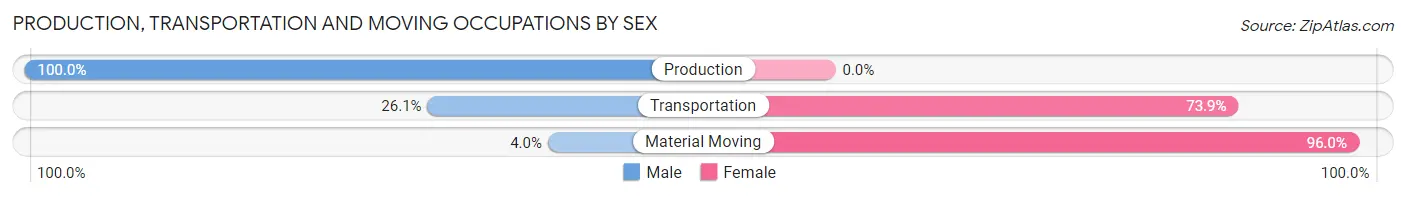
| Occupation | Male | Female |
| Production | 15 (100.0%) | 0 (0.0%) |
| Transportation | 12 (26.1%) | 34 (73.9%) |
| Material Moving | 1 (4.0%) | 24 (96.0%) |
| Total (Category) | 28 (32.6%) | 58 (67.4%) |
| Total (Overall) | 265 (43.2%) | 349 (56.8%) |
Employment Industries by Sex in Cumberland Head
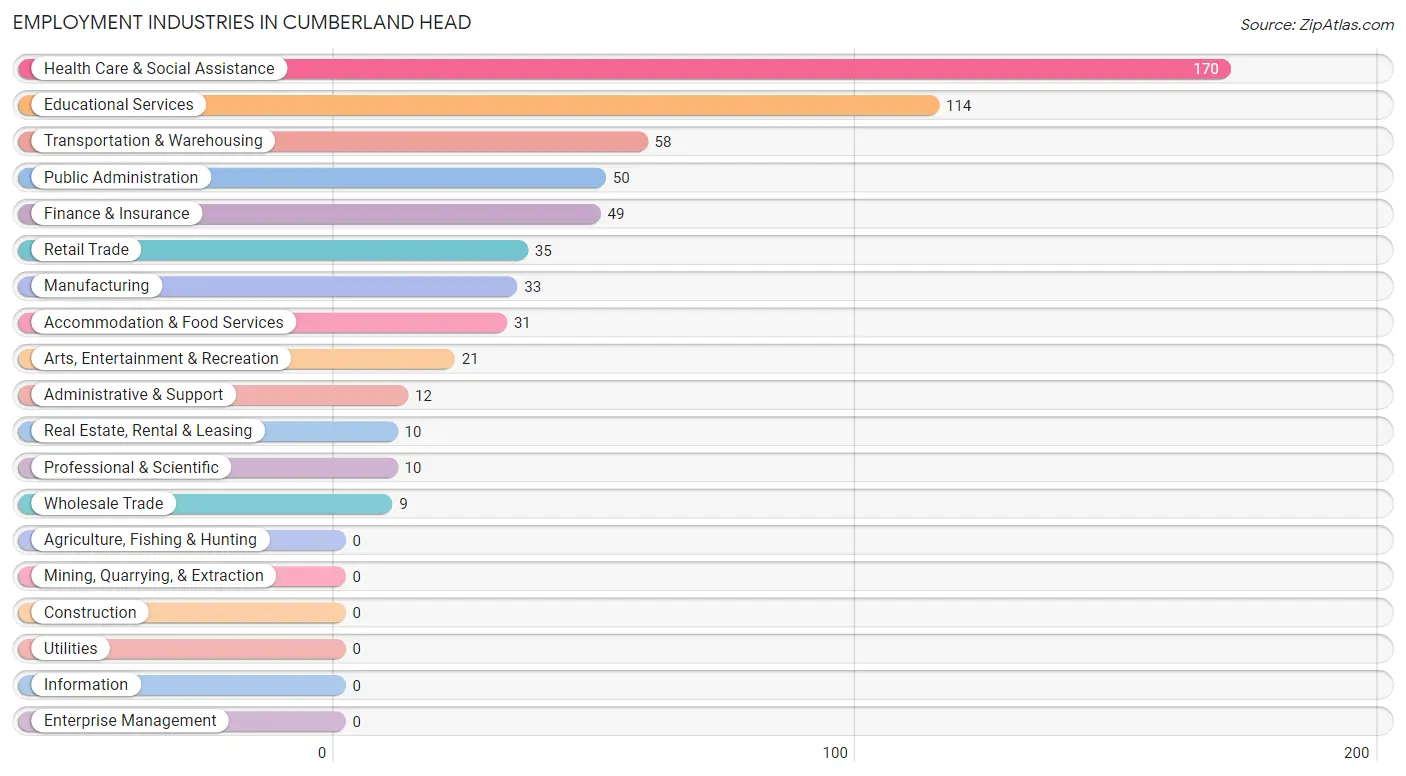
Employment Industries in Cumberland Head
The major employment industries in Cumberland Head include Health Care & Social Assistance (170 | 27.7%), Educational Services (114 | 18.6%), Transportation & Warehousing (58 | 9.5%), Public Administration (50 | 8.1%), and Finance & Insurance (49 | 8.0%).
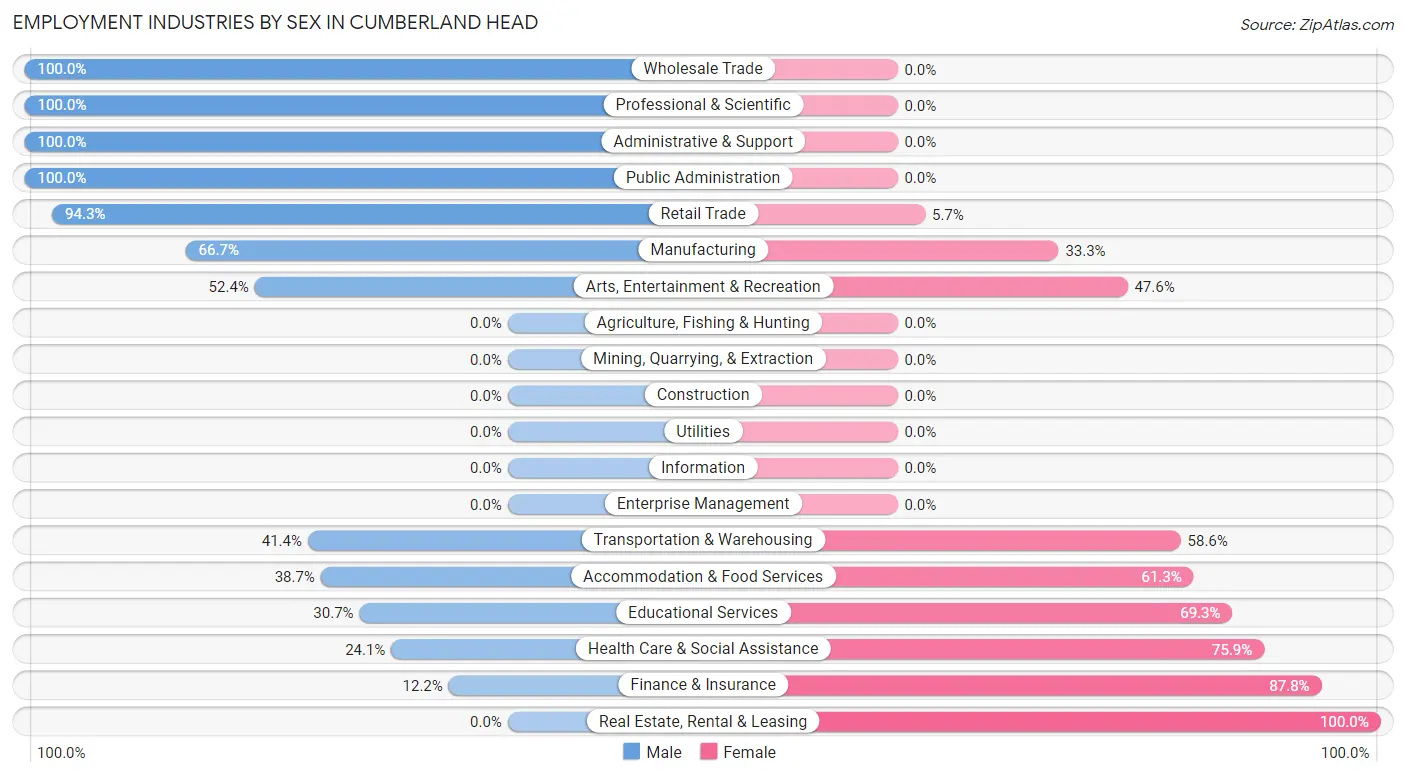
Employment Industries by Sex in Cumberland Head
The Cumberland Head industries that see more men than women are Wholesale Trade (100.0%), Professional & Scientific (100.0%), and Administrative & Support (100.0%), whereas the industries that tend to have a higher number of women are Real Estate, Rental & Leasing (100.0%), Finance & Insurance (87.8%), and Health Care & Social Assistance (75.9%).
| Industry | Male | Female |
| Agriculture, Fishing & Hunting | 0 (0.0%) | 0 (0.0%) |
| Mining, Quarrying, & Extraction | 0 (0.0%) | 0 (0.0%) |
| Construction | 0 (0.0%) | 0 (0.0%) |
| Manufacturing | 22 (66.7%) | 11 (33.3%) |
| Wholesale Trade | 9 (100.0%) | 0 (0.0%) |
| Retail Trade | 33 (94.3%) | 2 (5.7%) |
| Transportation & Warehousing | 24 (41.4%) | 34 (58.6%) |
| Utilities | 0 (0.0%) | 0 (0.0%) |
| Information | 0 (0.0%) | 0 (0.0%) |
| Finance & Insurance | 6 (12.2%) | 43 (87.8%) |
| Real Estate, Rental & Leasing | 0 (0.0%) | 10 (100.0%) |
| Professional & Scientific | 10 (100.0%) | 0 (0.0%) |
| Enterprise Management | 0 (0.0%) | 0 (0.0%) |
| Administrative & Support | 12 (100.0%) | 0 (0.0%) |
| Educational Services | 35 (30.7%) | 79 (69.3%) |
| Health Care & Social Assistance | 41 (24.1%) | 129 (75.9%) |
| Arts, Entertainment & Recreation | 11 (52.4%) | 10 (47.6%) |
| Accommodation & Food Services | 12 (38.7%) | 19 (61.3%) |
| Public Administration | 50 (100.0%) | 0 (0.0%) |
| Total | 265 (43.2%) | 349 (56.8%) |
Education in Cumberland Head
School Enrollment in Cumberland Head
The most common levels of schooling among the 150 students in Cumberland Head are college / undergraduate (44 | 29.3%), middle school (36 | 24.0%), and high school (35 | 23.3%).
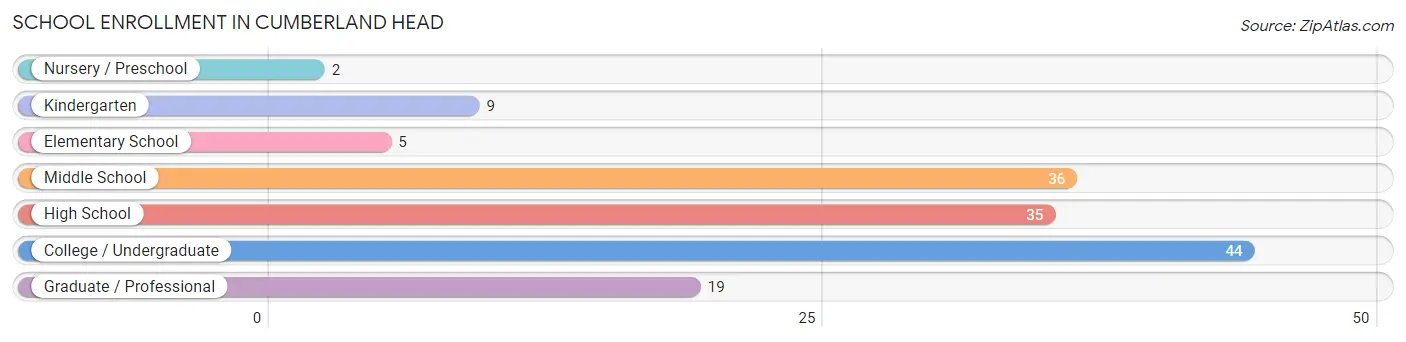
| School Level | # Students | % Students |
| Nursery / Preschool | 2 | 1.3% |
| Kindergarten | 9 | 6.0% |
| Elementary School | 5 | 3.3% |
| Middle School | 36 | 24.0% |
| High School | 35 | 23.3% |
| College / Undergraduate | 44 | 29.3% |
| Graduate / Professional | 19 | 12.7% |
| Total | 150 | 100.0% |
School Enrollment by Age by Funding Source in Cumberland Head
Out of a total of 150 students who are enrolled in schools in Cumberland Head, 7 (4.7%) attend a private institution, while the remaining 143 (95.3%) are enrolled in public schools. The age group of 10 to 14 year olds has the highest likelihood of being enrolled in private schools, with 7 (13.7% in the age bracket) enrolled. Conversely, the age group of 5 to 9 year old has the lowest likelihood of being enrolled in a private school, with 16 (100.0% in the age bracket) attending a public institution.
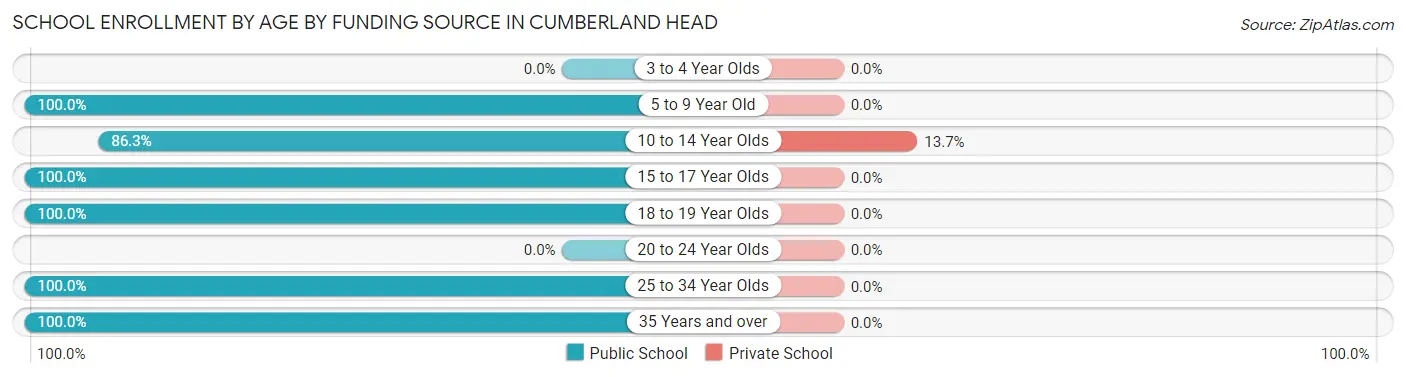
| Age Bracket | Public School | Private School |
| 3 to 4 Year Olds | 0 (0.0%) | 0 (0.0%) |
| 5 to 9 Year Old | 16 (100.0%) | 0 (0.0%) |
| 10 to 14 Year Olds | 44 (86.3%) | 7 (13.7%) |
| 15 to 17 Year Olds | 20 (100.0%) | 0 (0.0%) |
| 18 to 19 Year Olds | 23 (100.0%) | 0 (0.0%) |
| 20 to 24 Year Olds | 0 (0.0%) | 0 (0.0%) |
| 25 to 34 Year Olds | 19 (100.0%) | 0 (0.0%) |
| 35 Years and over | 21 (100.0%) | 0 (0.0%) |
| Total | 143 (95.3%) | 7 (4.7%) |
Educational Attainment by Field of Study in Cumberland Head
Education (174 | 26.7%), science & technology (111 | 17.0%), business (73 | 11.2%), bio, nature & agricultural (61 | 9.3%), and social sciences (56 | 8.6%) are the most common fields of study among 653 individuals in Cumberland Head who have obtained a bachelor's degree or higher.
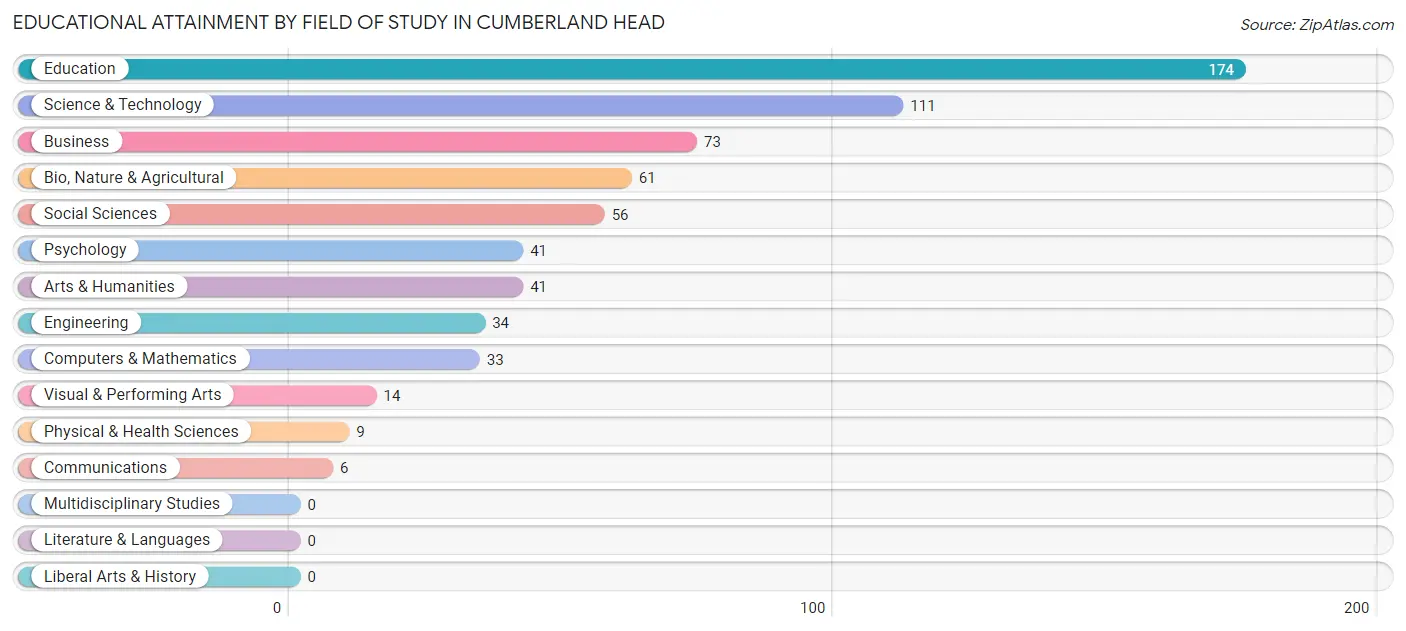
| Field of Study | # Graduates | % Graduates |
| Computers & Mathematics | 33 | 5.1% |
| Bio, Nature & Agricultural | 61 | 9.3% |
| Physical & Health Sciences | 9 | 1.4% |
| Psychology | 41 | 6.3% |
| Social Sciences | 56 | 8.6% |
| Engineering | 34 | 5.2% |
| Multidisciplinary Studies | 0 | 0.0% |
| Science & Technology | 111 | 17.0% |
| Business | 73 | 11.2% |
| Education | 174 | 26.7% |
| Literature & Languages | 0 | 0.0% |
| Liberal Arts & History | 0 | 0.0% |
| Visual & Performing Arts | 14 | 2.1% |
| Communications | 6 | 0.9% |
| Arts & Humanities | 41 | 6.3% |
| Total | 653 | 100.0% |
Transportation & Commute in Cumberland Head
Vehicle Availability by Sex in Cumberland Head
The most prevalent vehicle ownership categories in Cumberland Head are males with 2 vehicles (192, accounting for 72.7%) and females with 2 vehicles (134, making up 55.0%).
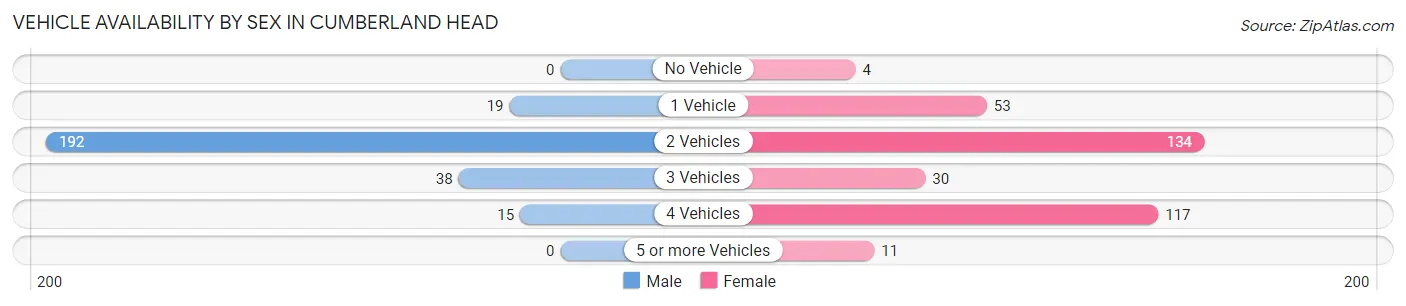
| Vehicles Available | Male | Female |
| No Vehicle | 0 (0.0%) | 4 (1.1%) |
| 1 Vehicle | 19 (7.2%) | 53 (15.2%) |
| 2 Vehicles | 192 (72.7%) | 134 (38.4%) |
| 3 Vehicles | 38 (14.4%) | 30 (8.6%) |
| 4 Vehicles | 15 (5.7%) | 117 (33.5%) |
| 5 or more Vehicles | 0 (0.0%) | 11 (3.2%) |
| Total | 264 (100.0%) | 349 (100.0%) |
Commute Time in Cumberland Head
The most frequently occuring commute durations in Cumberland Head are 15 to 19 minutes (172 commuters, 31.3%), 10 to 14 minutes (88 commuters, 16.0%), and 20 to 24 minutes (82 commuters, 14.9%).
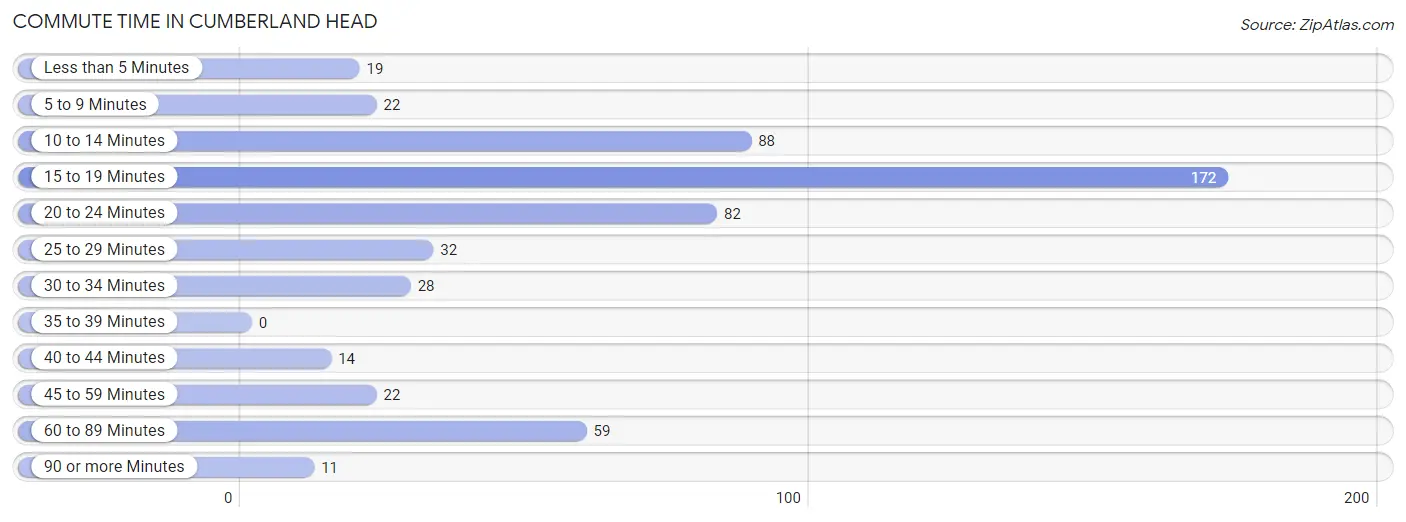
| Commute Time | # Commuters | % Commuters |
| Less than 5 Minutes | 19 | 3.5% |
| 5 to 9 Minutes | 22 | 4.0% |
| 10 to 14 Minutes | 88 | 16.0% |
| 15 to 19 Minutes | 172 | 31.3% |
| 20 to 24 Minutes | 82 | 14.9% |
| 25 to 29 Minutes | 32 | 5.8% |
| 30 to 34 Minutes | 28 | 5.1% |
| 35 to 39 Minutes | 0 | 0.0% |
| 40 to 44 Minutes | 14 | 2.5% |
| 45 to 59 Minutes | 22 | 4.0% |
| 60 to 89 Minutes | 59 | 10.7% |
| 90 or more Minutes | 11 | 2.0% |
Commute Time by Sex in Cumberland Head
The most common commute times in Cumberland Head are 15 to 19 minutes (95 commuters, 37.2%) for males and 15 to 19 minutes (77 commuters, 26.2%) for females.
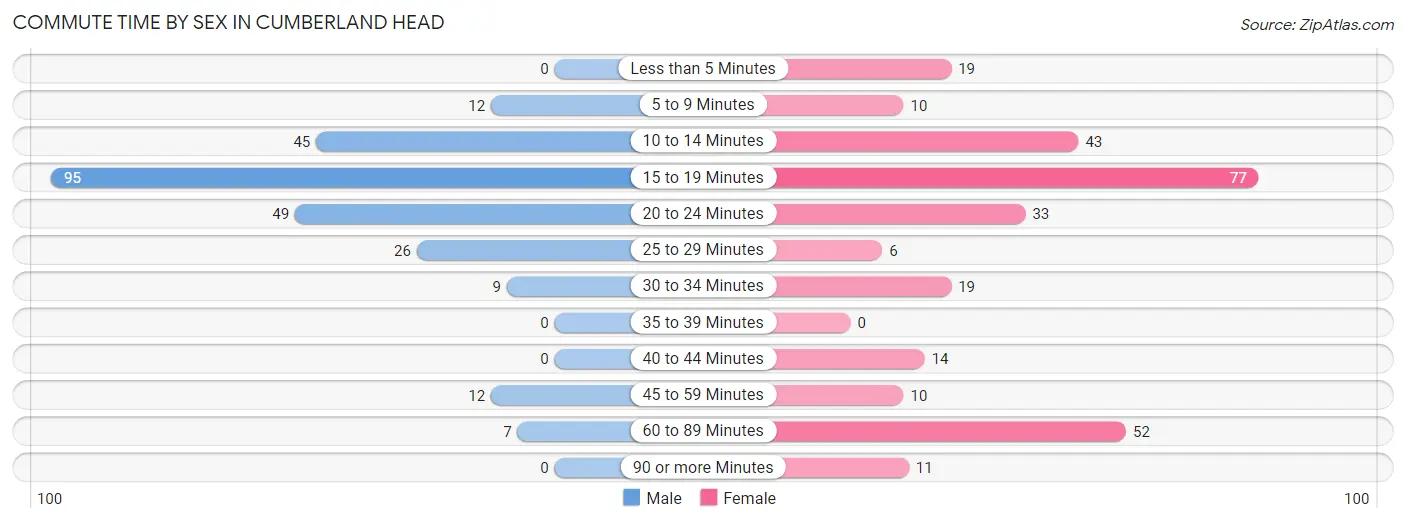
| Commute Time | Male | Female |
| Less than 5 Minutes | 0 (0.0%) | 19 (6.5%) |
| 5 to 9 Minutes | 12 (4.7%) | 10 (3.4%) |
| 10 to 14 Minutes | 45 (17.6%) | 43 (14.6%) |
| 15 to 19 Minutes | 95 (37.2%) | 77 (26.2%) |
| 20 to 24 Minutes | 49 (19.2%) | 33 (11.2%) |
| 25 to 29 Minutes | 26 (10.2%) | 6 (2.0%) |
| 30 to 34 Minutes | 9 (3.5%) | 19 (6.5%) |
| 35 to 39 Minutes | 0 (0.0%) | 0 (0.0%) |
| 40 to 44 Minutes | 0 (0.0%) | 14 (4.8%) |
| 45 to 59 Minutes | 12 (4.7%) | 10 (3.4%) |
| 60 to 89 Minutes | 7 (2.8%) | 52 (17.7%) |
| 90 or more Minutes | 0 (0.0%) | 11 (3.7%) |
Time of Departure to Work by Sex in Cumberland Head
The most frequent times of departure to work in Cumberland Head are 7:00 AM to 7:29 AM (63, 24.7%) for males and 7:30 AM to 7:59 AM (59, 20.1%) for females.
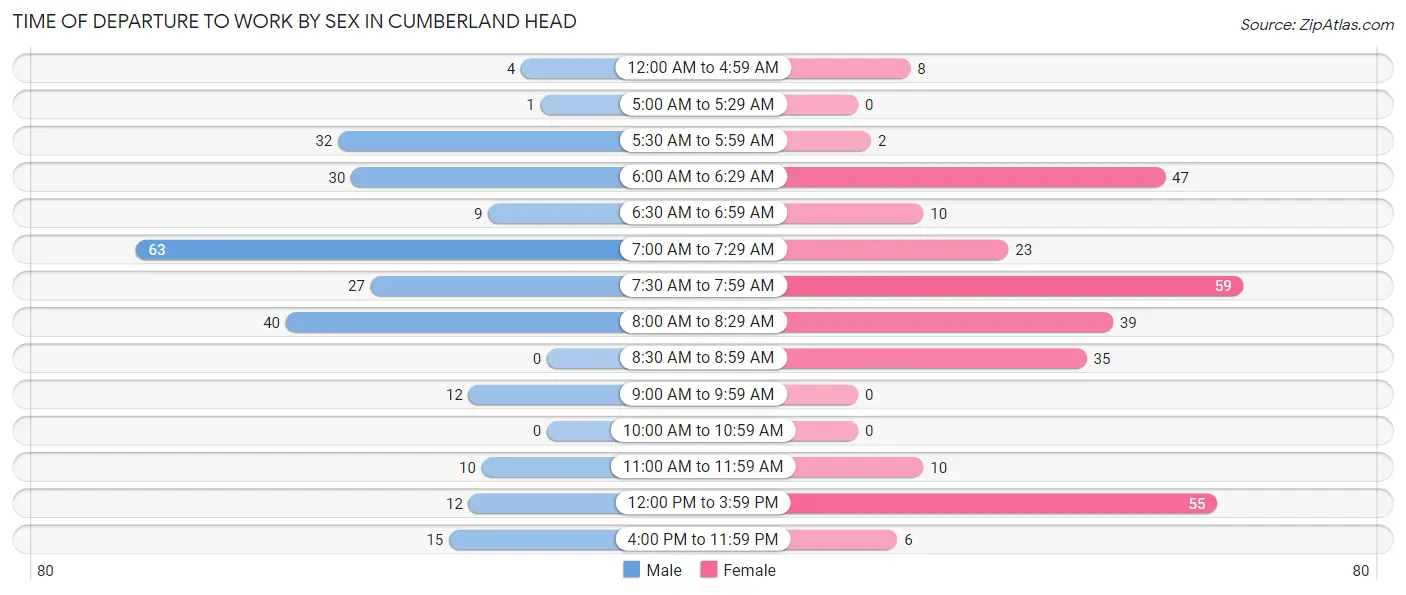
| Time of Departure | Male | Female |
| 12:00 AM to 4:59 AM | 4 (1.6%) | 8 (2.7%) |
| 5:00 AM to 5:29 AM | 1 (0.4%) | 0 (0.0%) |
| 5:30 AM to 5:59 AM | 32 (12.6%) | 2 (0.7%) |
| 6:00 AM to 6:29 AM | 30 (11.8%) | 47 (16.0%) |
| 6:30 AM to 6:59 AM | 9 (3.5%) | 10 (3.4%) |
| 7:00 AM to 7:29 AM | 63 (24.7%) | 23 (7.8%) |
| 7:30 AM to 7:59 AM | 27 (10.6%) | 59 (20.1%) |
| 8:00 AM to 8:29 AM | 40 (15.7%) | 39 (13.3%) |
| 8:30 AM to 8:59 AM | 0 (0.0%) | 35 (11.9%) |
| 9:00 AM to 9:59 AM | 12 (4.7%) | 0 (0.0%) |
| 10:00 AM to 10:59 AM | 0 (0.0%) | 0 (0.0%) |
| 11:00 AM to 11:59 AM | 10 (3.9%) | 10 (3.4%) |
| 12:00 PM to 3:59 PM | 12 (4.7%) | 55 (18.7%) |
| 4:00 PM to 11:59 PM | 15 (5.9%) | 6 (2.0%) |
| Total | 255 (100.0%) | 294 (100.0%) |
Housing Occupancy in Cumberland Head
Occupancy by Ownership in Cumberland Head
Of the total 602 dwellings in Cumberland Head, owner-occupied units account for 549 (91.2%), while renter-occupied units make up 53 (8.8%).
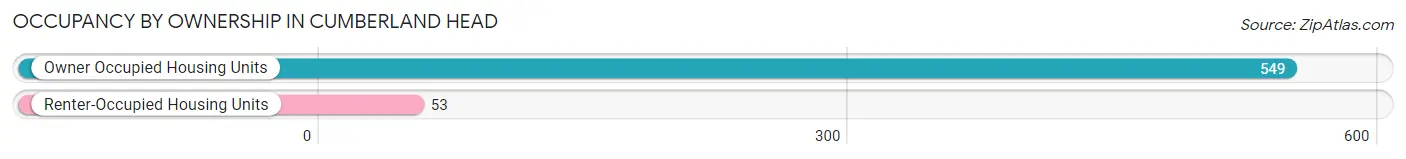
| Occupancy | # Housing Units | % Housing Units |
| Owner Occupied Housing Units | 549 | 91.2% |
| Renter-Occupied Housing Units | 53 | 8.8% |
| Total Occupied Housing Units | 602 | 100.0% |
Occupancy by Household Size in Cumberland Head
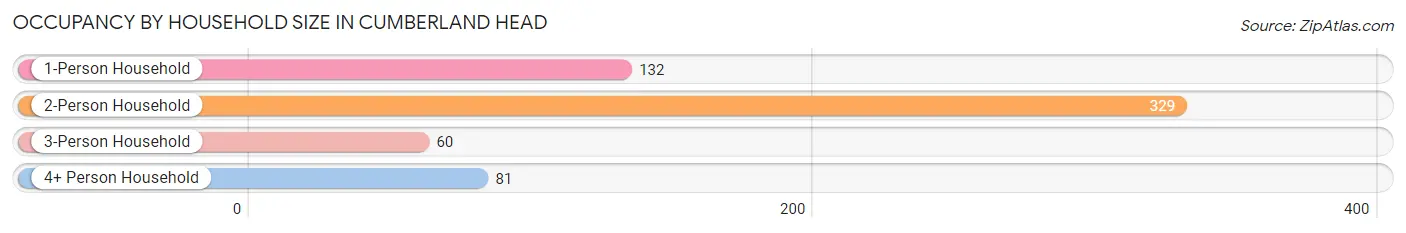
| Household Size | # Housing Units | % Housing Units |
| 1-Person Household | 132 | 21.9% |
| 2-Person Household | 329 | 54.6% |
| 3-Person Household | 60 | 10.0% |
| 4+ Person Household | 81 | 13.5% |
| Total Housing Units | 602 | 100.0% |
Occupancy by Ownership by Household Size in Cumberland Head
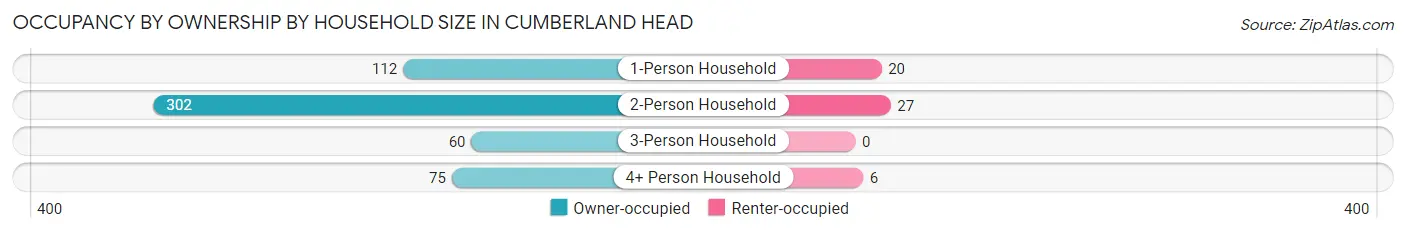
| Household Size | Owner-occupied | Renter-occupied |
| 1-Person Household | 112 (84.9%) | 20 (15.1%) |
| 2-Person Household | 302 (91.8%) | 27 (8.2%) |
| 3-Person Household | 60 (100.0%) | 0 (0.0%) |
| 4+ Person Household | 75 (92.6%) | 6 (7.4%) |
| Total Housing Units | 549 (91.2%) | 53 (8.8%) |
Occupancy by Educational Attainment in Cumberland Head
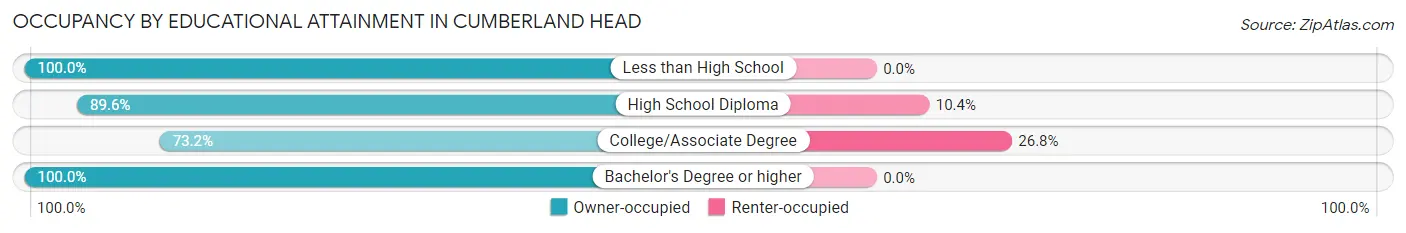
| Household Size | Owner-occupied | Renter-occupied |
| Less than High School | 40 (100.0%) | 0 (0.0%) |
| High School Diploma | 103 (89.6%) | 12 (10.4%) |
| College/Associate Degree | 112 (73.2%) | 41 (26.8%) |
| Bachelor's Degree or higher | 294 (100.0%) | 0 (0.0%) |
Occupancy by Age of Householder in Cumberland Head
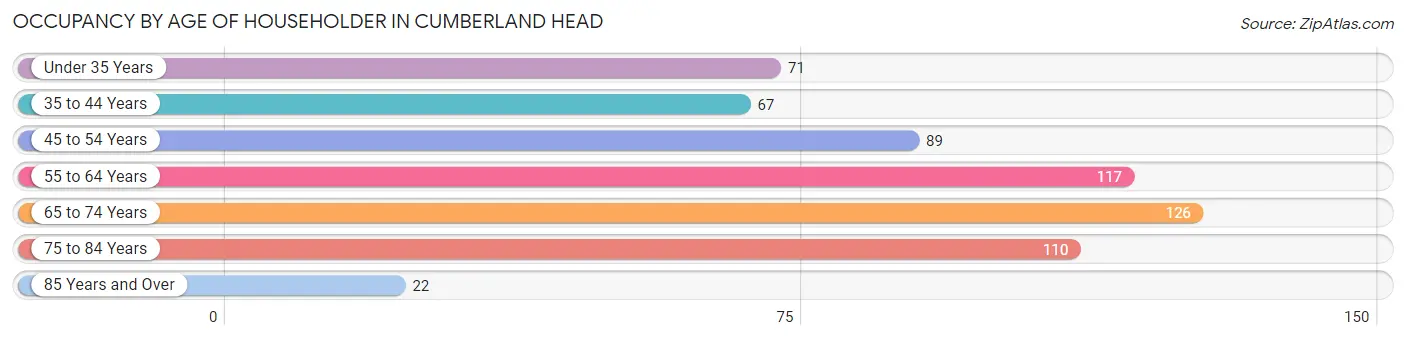
| Age Bracket | # Households | % Households |
| Under 35 Years | 71 | 11.8% |
| 35 to 44 Years | 67 | 11.1% |
| 45 to 54 Years | 89 | 14.8% |
| 55 to 64 Years | 117 | 19.4% |
| 65 to 74 Years | 126 | 20.9% |
| 75 to 84 Years | 110 | 18.3% |
| 85 Years and Over | 22 | 3.6% |
| Total | 602 | 100.0% |
Housing Finances in Cumberland Head
Median Income by Occupancy in Cumberland Head
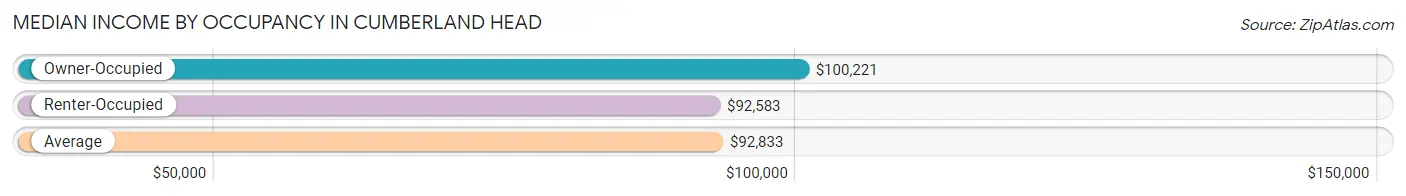
| Occupancy Type | # Households | Median Income |
| Owner-Occupied | 549 (91.2%) | $100,221 |
| Renter-Occupied | 53 (8.8%) | $92,583 |
| Average | 602 (100.0%) | $92,833 |
Occupancy by Householder Income Bracket in Cumberland Head
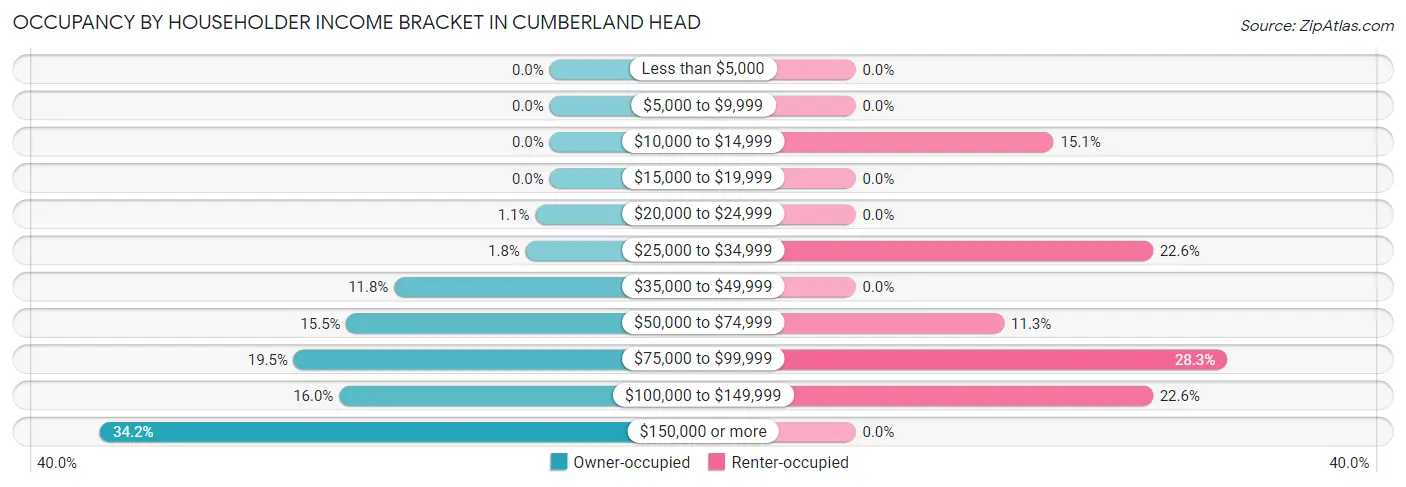
| Income Bracket | Owner-occupied | Renter-occupied |
| Less than $5,000 | 0 (0.0%) | 0 (0.0%) |
| $5,000 to $9,999 | 0 (0.0%) | 0 (0.0%) |
| $10,000 to $14,999 | 0 (0.0%) | 8 (15.1%) |
| $15,000 to $19,999 | 0 (0.0%) | 0 (0.0%) |
| $20,000 to $24,999 | 6 (1.1%) | 0 (0.0%) |
| $25,000 to $34,999 | 10 (1.8%) | 12 (22.6%) |
| $35,000 to $49,999 | 65 (11.8%) | 0 (0.0%) |
| $50,000 to $74,999 | 85 (15.5%) | 6 (11.3%) |
| $75,000 to $99,999 | 107 (19.5%) | 15 (28.3%) |
| $100,000 to $149,999 | 88 (16.0%) | 12 (22.6%) |
| $150,000 or more | 188 (34.2%) | 0 (0.0%) |
| Total | 549 (100.0%) | 53 (100.0%) |
Monthly Housing Cost Tiers in Cumberland Head
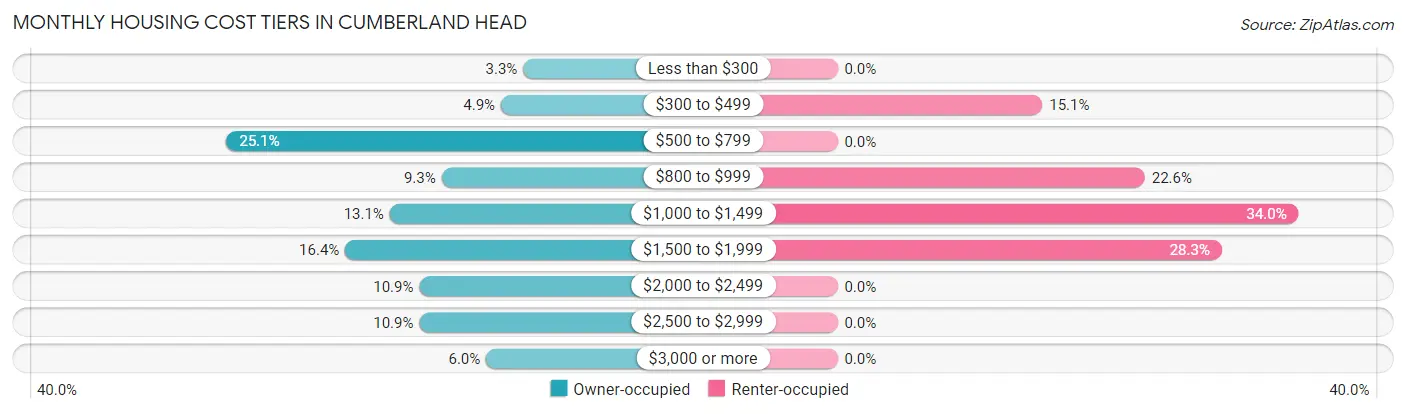
| Monthly Cost | Owner-occupied | Renter-occupied |
| Less than $300 | 18 (3.3%) | 0 (0.0%) |
| $300 to $499 | 27 (4.9%) | 8 (15.1%) |
| $500 to $799 | 138 (25.1%) | 0 (0.0%) |
| $800 to $999 | 51 (9.3%) | 12 (22.6%) |
| $1,000 to $1,499 | 72 (13.1%) | 18 (34.0%) |
| $1,500 to $1,999 | 90 (16.4%) | 15 (28.3%) |
| $2,000 to $2,499 | 60 (10.9%) | 0 (0.0%) |
| $2,500 to $2,999 | 60 (10.9%) | 0 (0.0%) |
| $3,000 or more | 33 (6.0%) | 0 (0.0%) |
| Total | 549 (100.0%) | 53 (100.0%) |
Physical Housing Characteristics in Cumberland Head
Housing Structures in Cumberland Head
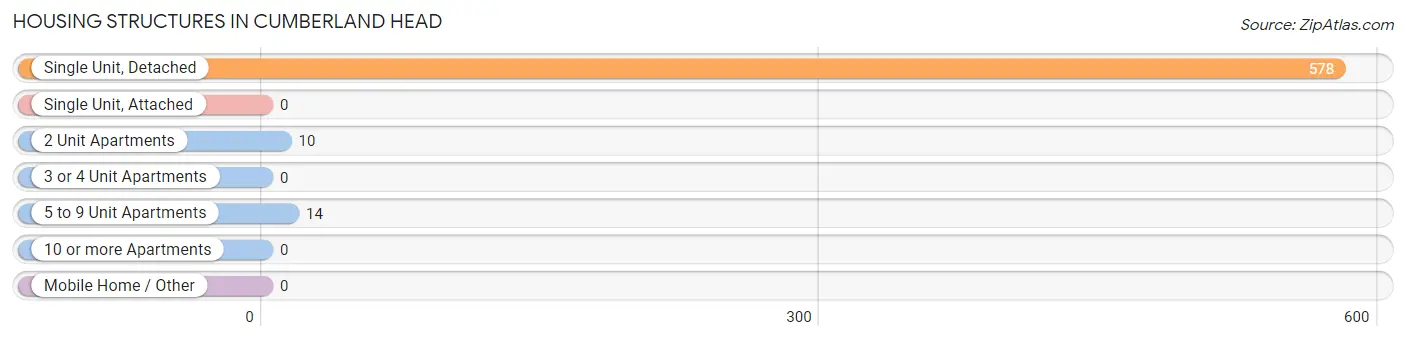
| Structure Type | # Housing Units | % Housing Units |
| Single Unit, Detached | 578 | 96.0% |
| Single Unit, Attached | 0 | 0.0% |
| 2 Unit Apartments | 10 | 1.7% |
| 3 or 4 Unit Apartments | 0 | 0.0% |
| 5 to 9 Unit Apartments | 14 | 2.3% |
| 10 or more Apartments | 0 | 0.0% |
| Mobile Home / Other | 0 | 0.0% |
| Total | 602 | 100.0% |
Housing Structures by Occupancy in Cumberland Head
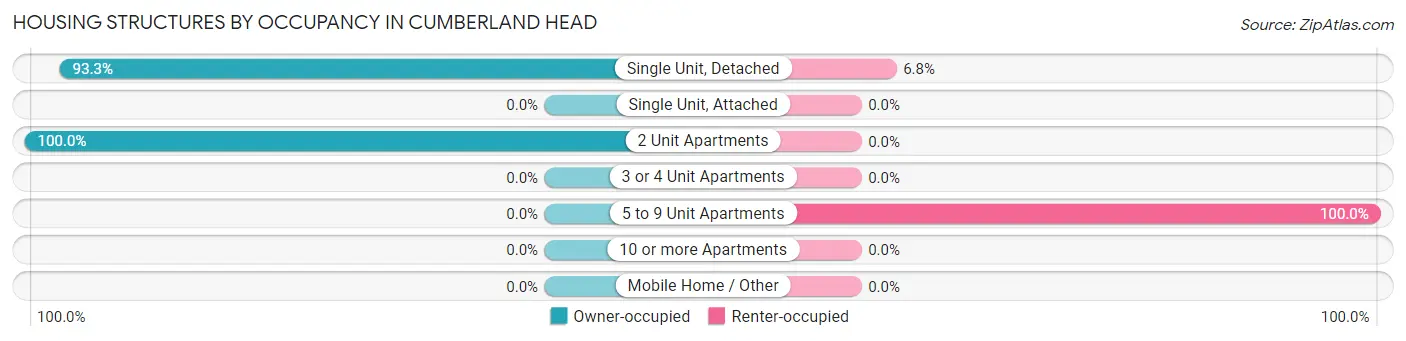
| Structure Type | Owner-occupied | Renter-occupied |
| Single Unit, Detached | 539 (93.2%) | 39 (6.8%) |
| Single Unit, Attached | 0 (0.0%) | 0 (0.0%) |
| 2 Unit Apartments | 10 (100.0%) | 0 (0.0%) |
| 3 or 4 Unit Apartments | 0 (0.0%) | 0 (0.0%) |
| 5 to 9 Unit Apartments | 0 (0.0%) | 14 (100.0%) |
| 10 or more Apartments | 0 (0.0%) | 0 (0.0%) |
| Mobile Home / Other | 0 (0.0%) | 0 (0.0%) |
| Total | 549 (91.2%) | 53 (8.8%) |
Housing Structures by Number of Rooms in Cumberland Head
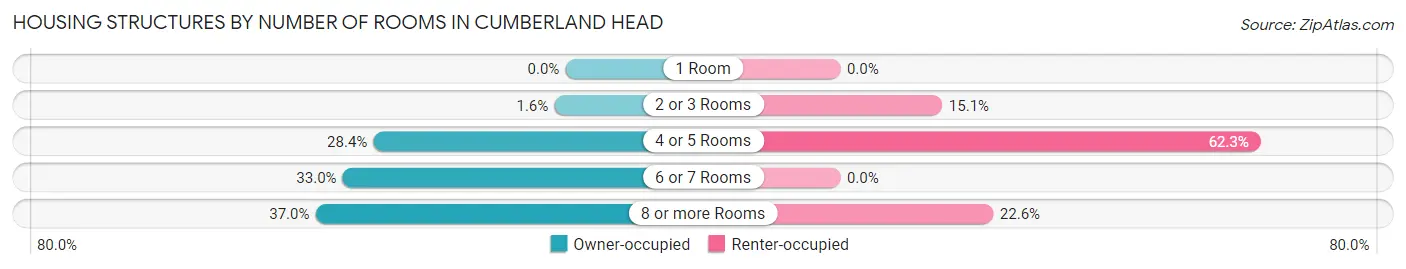
| Number of Rooms | Owner-occupied | Renter-occupied |
| 1 Room | 0 (0.0%) | 0 (0.0%) |
| 2 or 3 Rooms | 9 (1.6%) | 8 (15.1%) |
| 4 or 5 Rooms | 156 (28.4%) | 33 (62.3%) |
| 6 or 7 Rooms | 181 (33.0%) | 0 (0.0%) |
| 8 or more Rooms | 203 (37.0%) | 12 (22.6%) |
| Total | 549 (100.0%) | 53 (100.0%) |
Housing Structure by Heating Type in Cumberland Head
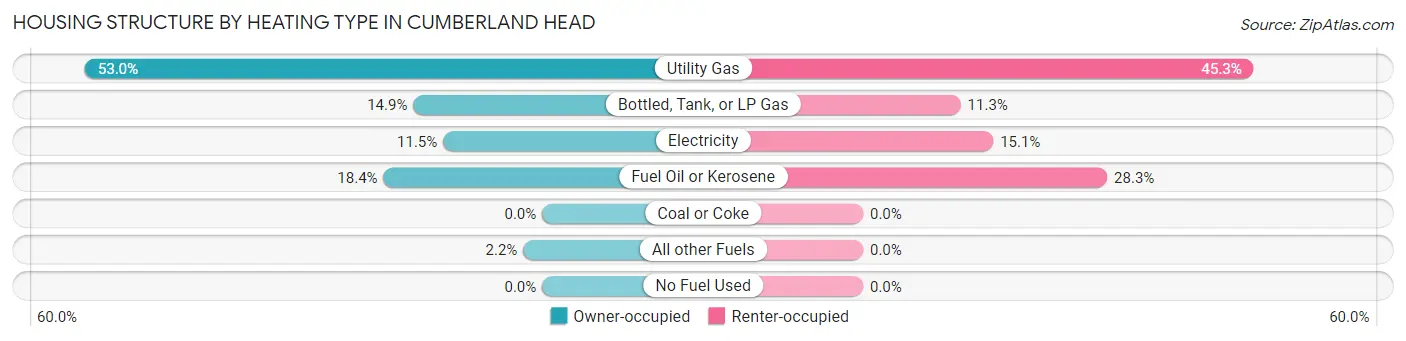
| Heating Type | Owner-occupied | Renter-occupied |
| Utility Gas | 291 (53.0%) | 24 (45.3%) |
| Bottled, Tank, or LP Gas | 82 (14.9%) | 6 (11.3%) |
| Electricity | 63 (11.5%) | 8 (15.1%) |
| Fuel Oil or Kerosene | 101 (18.4%) | 15 (28.3%) |
| Coal or Coke | 0 (0.0%) | 0 (0.0%) |
| All other Fuels | 12 (2.2%) | 0 (0.0%) |
| No Fuel Used | 0 (0.0%) | 0 (0.0%) |
| Total | 549 (100.0%) | 53 (100.0%) |
Household Vehicle Usage in Cumberland Head
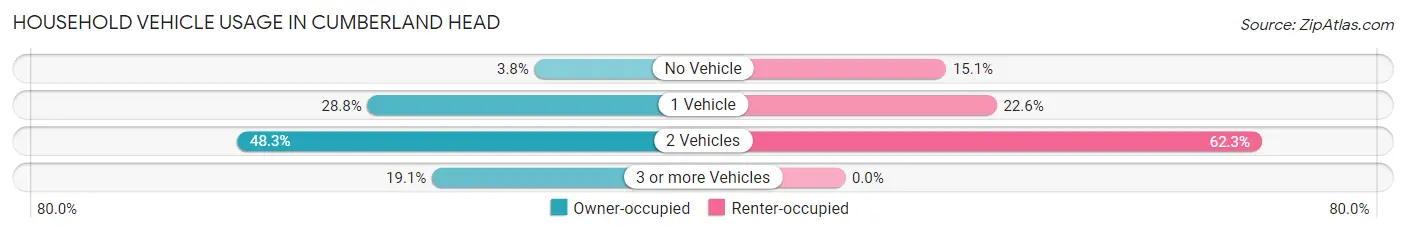
| Vehicles per Household | Owner-occupied | Renter-occupied |
| No Vehicle | 21 (3.8%) | 8 (15.1%) |
| 1 Vehicle | 158 (28.8%) | 12 (22.6%) |
| 2 Vehicles | 265 (48.3%) | 33 (62.3%) |
| 3 or more Vehicles | 105 (19.1%) | 0 (0.0%) |
| Total | 549 (100.0%) | 53 (100.0%) |
Real Estate & Mortgages in Cumberland Head
Real Estate and Mortgage Overview in Cumberland Head
| Characteristic | Without Mortgage | With Mortgage |
| Housing Units | 248 | 301 |
| Median Property Value | $163,300 | $214,700 |
| Median Household Income | $96,250 | $133 |
| Monthly Housing Costs | $583 | $33 |
| Real Estate Taxes | $3,760 | $9 |
Property Value by Mortgage Status in Cumberland Head
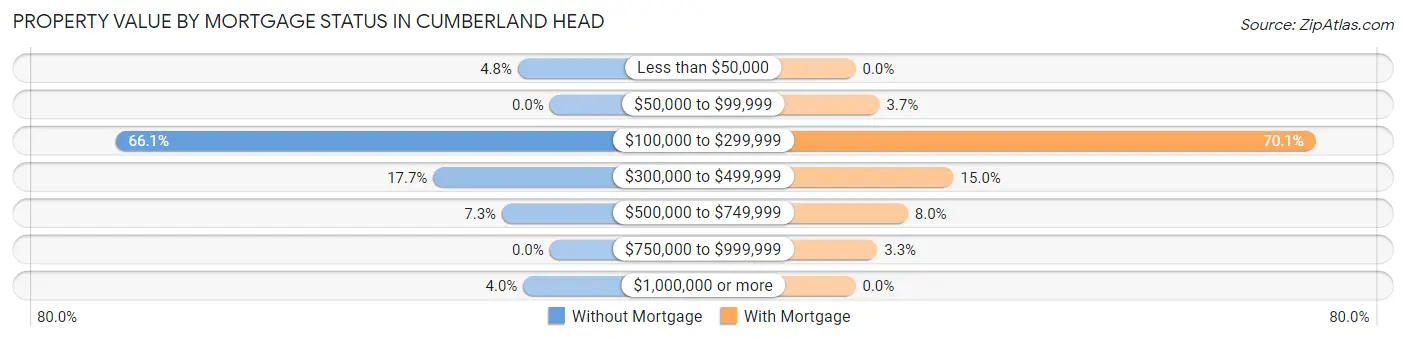
| Property Value | Without Mortgage | With Mortgage |
| Less than $50,000 | 12 (4.8%) | 0 (0.0%) |
| $50,000 to $99,999 | 0 (0.0%) | 11 (3.6%) |
| $100,000 to $299,999 | 164 (66.1%) | 211 (70.1%) |
| $300,000 to $499,999 | 44 (17.7%) | 45 (14.9%) |
| $500,000 to $749,999 | 18 (7.3%) | 24 (8.0%) |
| $750,000 to $999,999 | 0 (0.0%) | 10 (3.3%) |
| $1,000,000 or more | 10 (4.0%) | 0 (0.0%) |
| Total | 248 (100.0%) | 301 (100.0%) |
Household Income by Mortgage Status in Cumberland Head
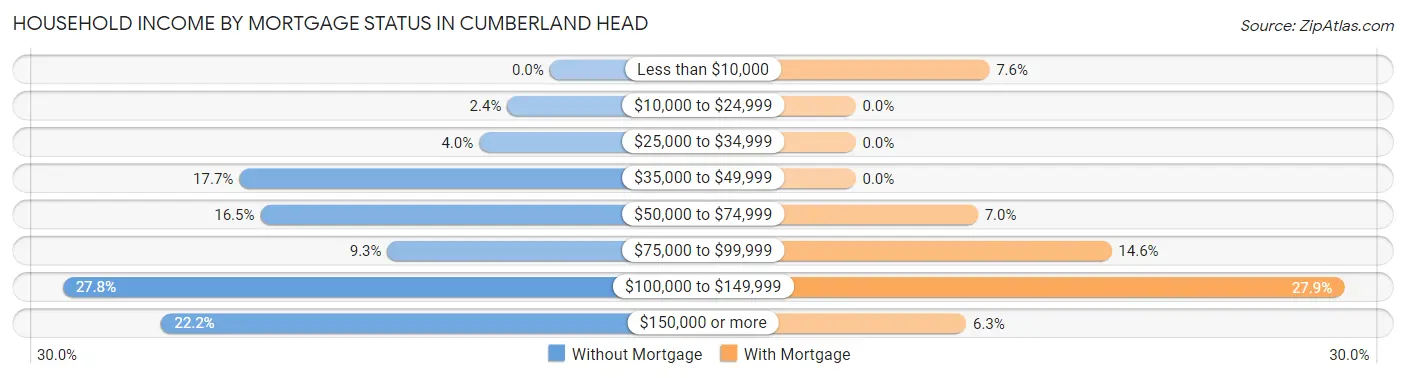
| Household Income | Without Mortgage | With Mortgage |
| Less than $10,000 | 0 (0.0%) | 23 (7.6%) |
| $10,000 to $24,999 | 6 (2.4%) | 0 (0.0%) |
| $25,000 to $34,999 | 10 (4.0%) | 0 (0.0%) |
| $35,000 to $49,999 | 44 (17.7%) | 0 (0.0%) |
| $50,000 to $74,999 | 41 (16.5%) | 21 (7.0%) |
| $75,000 to $99,999 | 23 (9.3%) | 44 (14.6%) |
| $100,000 to $149,999 | 69 (27.8%) | 84 (27.9%) |
| $150,000 or more | 55 (22.2%) | 19 (6.3%) |
| Total | 248 (100.0%) | 301 (100.0%) |
Property Value to Household Income Ratio in Cumberland Head
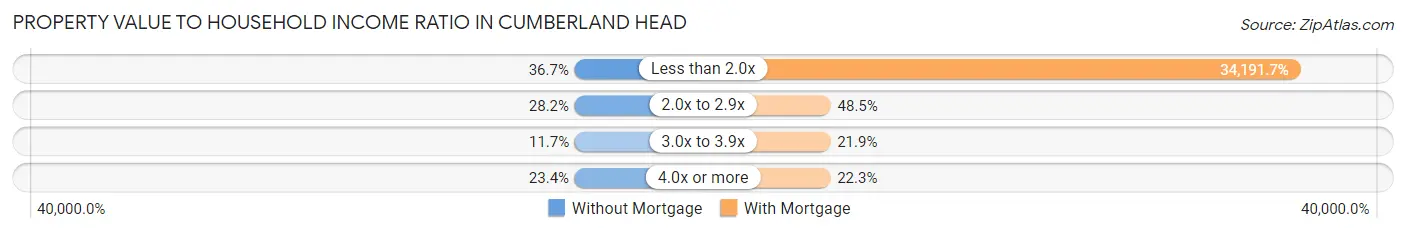
| Value-to-Income Ratio | Without Mortgage | With Mortgage |
| Less than 2.0x | 91 (36.7%) | 102,917 (34,191.7%) |
| 2.0x to 2.9x | 70 (28.2%) | 146 (48.5%) |
| 3.0x to 3.9x | 29 (11.7%) | 66 (21.9%) |
| 4.0x or more | 58 (23.4%) | 67 (22.3%) |
| Total | 248 (100.0%) | 301 (100.0%) |
Real Estate Taxes by Mortgage Status in Cumberland Head
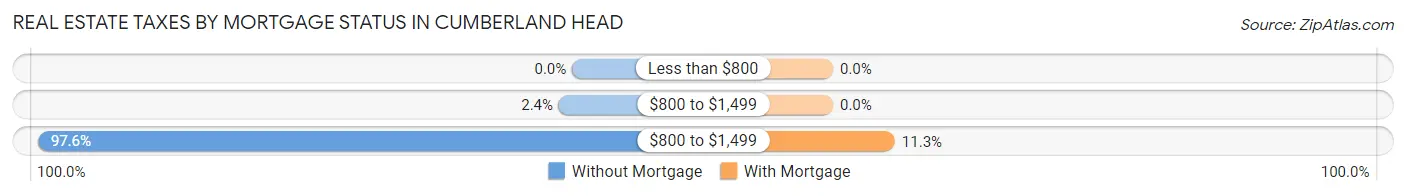
| Property Taxes | Without Mortgage | With Mortgage |
| Less than $800 | 0 (0.0%) | 0 (0.0%) |
| $800 to $1,499 | 6 (2.4%) | 0 (0.0%) |
| $800 to $1,499 | 242 (97.6%) | 34 (11.3%) |
| Total | 248 (100.0%) | 301 (100.0%) |
Health & Disability in Cumberland Head
Health Insurance Coverage by Age in Cumberland Head
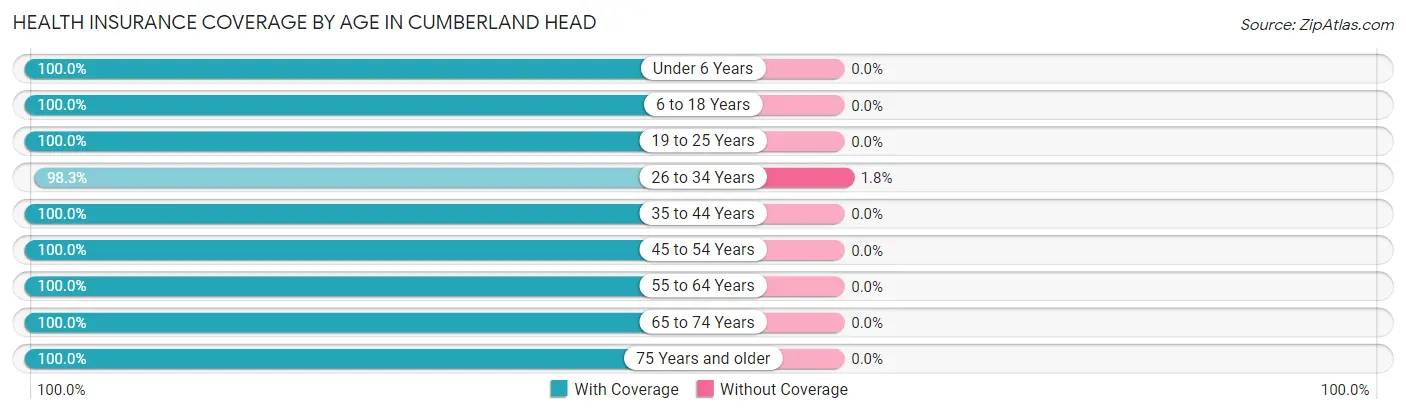
| Age Bracket | With Coverage | Without Coverage |
| Under 6 Years | 53 (100.0%) | 0 (0.0%) |
| 6 to 18 Years | 97 (100.0%) | 0 (0.0%) |
| 19 to 25 Years | 23 (100.0%) | 0 (0.0%) |
| 26 to 34 Years | 168 (98.3%) | 3 (1.8%) |
| 35 to 44 Years | 150 (100.0%) | 0 (0.0%) |
| 45 to 54 Years | 171 (100.0%) | 0 (0.0%) |
| 55 to 64 Years | 279 (100.0%) | 0 (0.0%) |
| 65 to 74 Years | 176 (100.0%) | 0 (0.0%) |
| 75 Years and older | 234 (100.0%) | 0 (0.0%) |
| Total | 1,351 (99.8%) | 3 (0.2%) |
Health Insurance Coverage by Citizenship Status in Cumberland Head
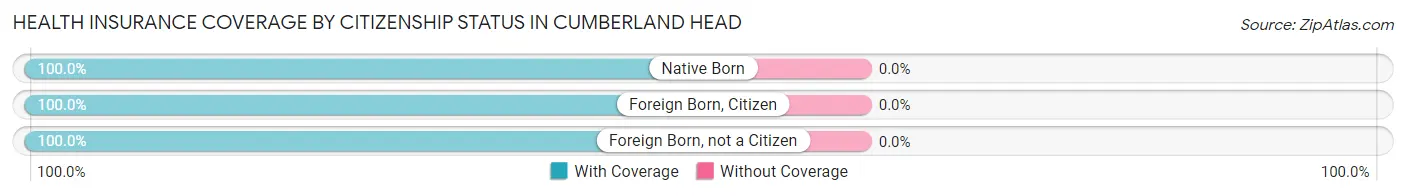
| Citizenship Status | With Coverage | Without Coverage |
| Native Born | 53 (100.0%) | 0 (0.0%) |
| Foreign Born, Citizen | 97 (100.0%) | 0 (0.0%) |
| Foreign Born, not a Citizen | 23 (100.0%) | 0 (0.0%) |
Health Insurance Coverage by Household Income in Cumberland Head
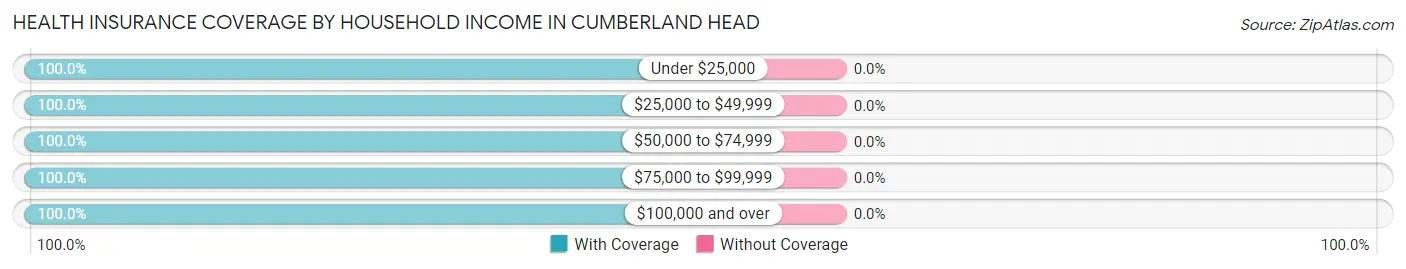
| Household Income | With Coverage | Without Coverage |
| Under $25,000 | 14 (100.0%) | 0 (0.0%) |
| $25,000 to $49,999 | 123 (100.0%) | 0 (0.0%) |
| $50,000 to $74,999 | 168 (100.0%) | 0 (0.0%) |
| $75,000 to $99,999 | 250 (100.0%) | 0 (0.0%) |
| $100,000 and over | 790 (100.0%) | 0 (0.0%) |
Public vs Private Health Insurance Coverage by Age in Cumberland Head
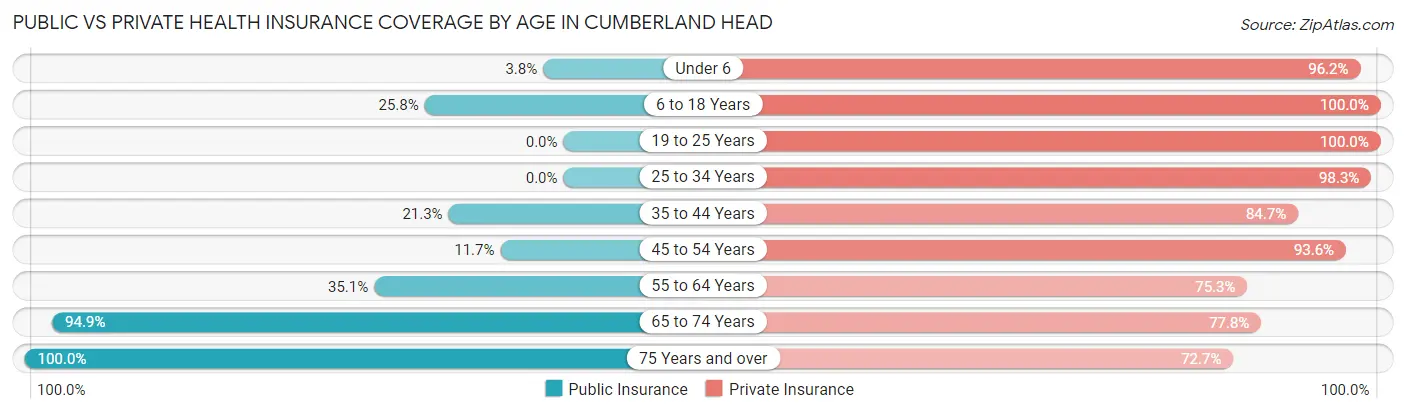
| Age Bracket | Public Insurance | Private Insurance |
| Under 6 | 2 (3.8%) | 51 (96.2%) |
| 6 to 18 Years | 25 (25.8%) | 97 (100.0%) |
| 19 to 25 Years | 0 (0.0%) | 23 (100.0%) |
| 25 to 34 Years | 0 (0.0%) | 168 (98.3%) |
| 35 to 44 Years | 32 (21.3%) | 127 (84.7%) |
| 45 to 54 Years | 20 (11.7%) | 160 (93.6%) |
| 55 to 64 Years | 98 (35.1%) | 210 (75.3%) |
| 65 to 74 Years | 167 (94.9%) | 137 (77.8%) |
| 75 Years and over | 234 (100.0%) | 170 (72.7%) |
| Total | 578 (42.7%) | 1,143 (84.4%) |
Disability Status by Sex by Age in Cumberland Head
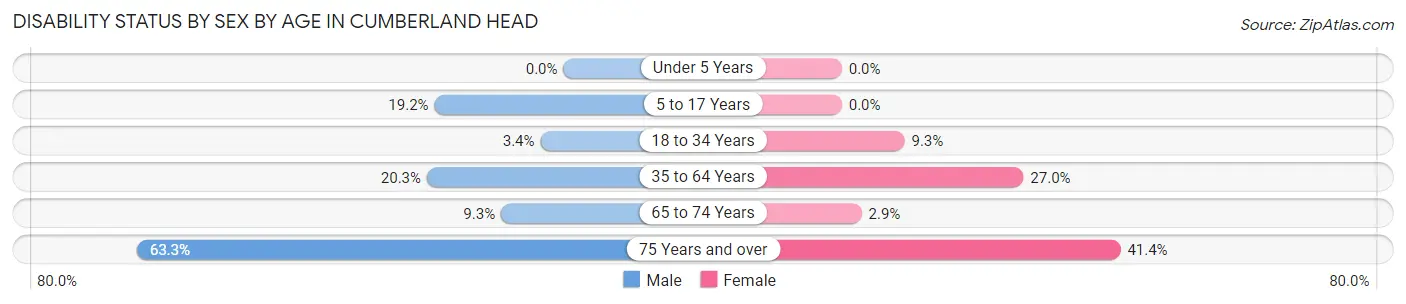
| Age Bracket | Male | Female |
| Under 5 Years | 0 (0.0%) | 0 (0.0%) |
| 5 to 17 Years | 9 (19.2%) | 0 (0.0%) |
| 18 to 34 Years | 3 (3.4%) | 11 (9.3%) |
| 35 to 64 Years | 60 (20.3%) | 82 (27.0%) |
| 65 to 74 Years | 10 (9.3%) | 2 (2.9%) |
| 75 Years and over | 38 (63.3%) | 72 (41.4%) |
Disability Class by Sex by Age in Cumberland Head
Disability Class: Hearing Difficulty
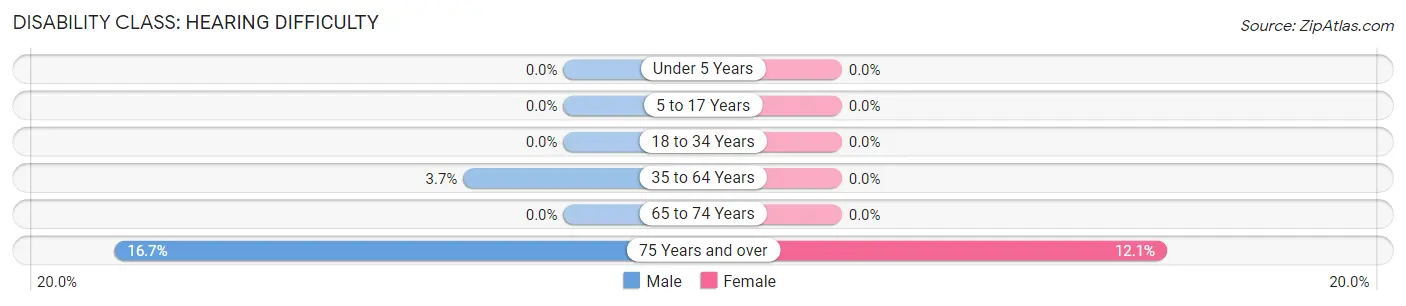
| Age Bracket | Male | Female |
| Under 5 Years | 0 (0.0%) | 0 (0.0%) |
| 5 to 17 Years | 0 (0.0%) | 0 (0.0%) |
| 18 to 34 Years | 0 (0.0%) | 0 (0.0%) |
| 35 to 64 Years | 11 (3.7%) | 0 (0.0%) |
| 65 to 74 Years | 0 (0.0%) | 0 (0.0%) |
| 75 Years and over | 10 (16.7%) | 21 (12.1%) |
Disability Class: Vision Difficulty
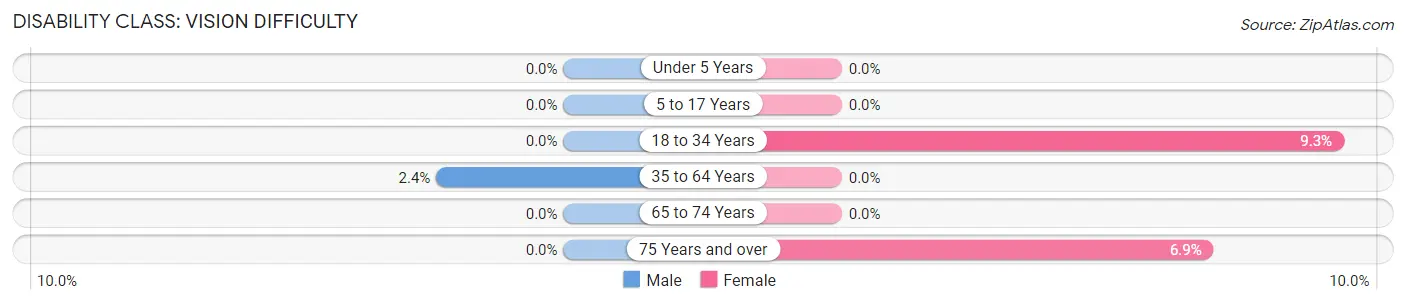
| Age Bracket | Male | Female |
| Under 5 Years | 0 (0.0%) | 0 (0.0%) |
| 5 to 17 Years | 0 (0.0%) | 0 (0.0%) |
| 18 to 34 Years | 0 (0.0%) | 11 (9.3%) |
| 35 to 64 Years | 7 (2.4%) | 0 (0.0%) |
| 65 to 74 Years | 0 (0.0%) | 0 (0.0%) |
| 75 Years and over | 0 (0.0%) | 12 (6.9%) |
Disability Class: Cognitive Difficulty
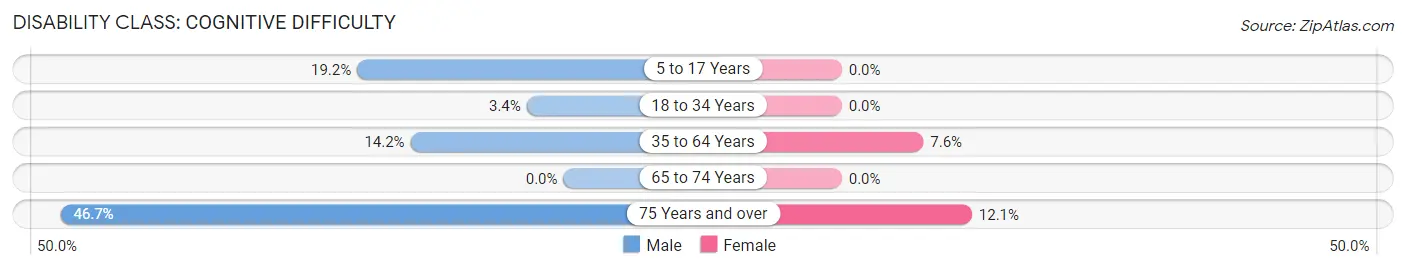
| Age Bracket | Male | Female |
| 5 to 17 Years | 9 (19.2%) | 0 (0.0%) |
| 18 to 34 Years | 3 (3.4%) | 0 (0.0%) |
| 35 to 64 Years | 42 (14.2%) | 23 (7.6%) |
| 65 to 74 Years | 0 (0.0%) | 0 (0.0%) |
| 75 Years and over | 28 (46.7%) | 21 (12.1%) |
Disability Class: Ambulatory Difficulty
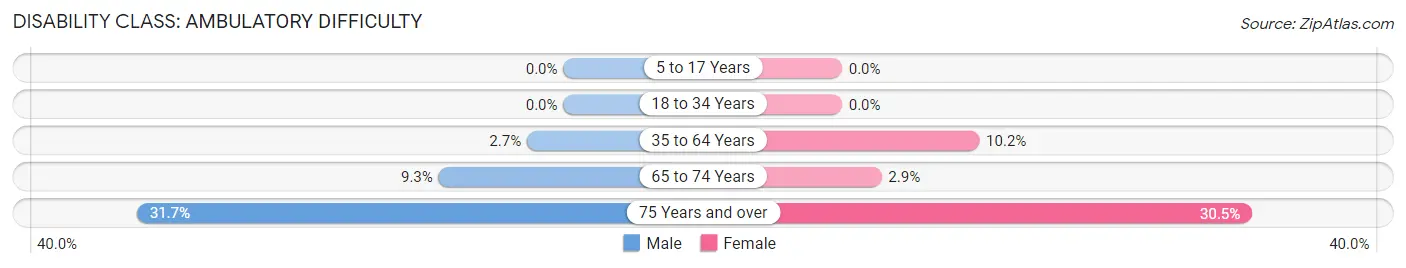
| Age Bracket | Male | Female |
| 5 to 17 Years | 0 (0.0%) | 0 (0.0%) |
| 18 to 34 Years | 0 (0.0%) | 0 (0.0%) |
| 35 to 64 Years | 8 (2.7%) | 31 (10.2%) |
| 65 to 74 Years | 10 (9.3%) | 2 (2.9%) |
| 75 Years and over | 19 (31.7%) | 53 (30.5%) |
Disability Class: Self-Care Difficulty
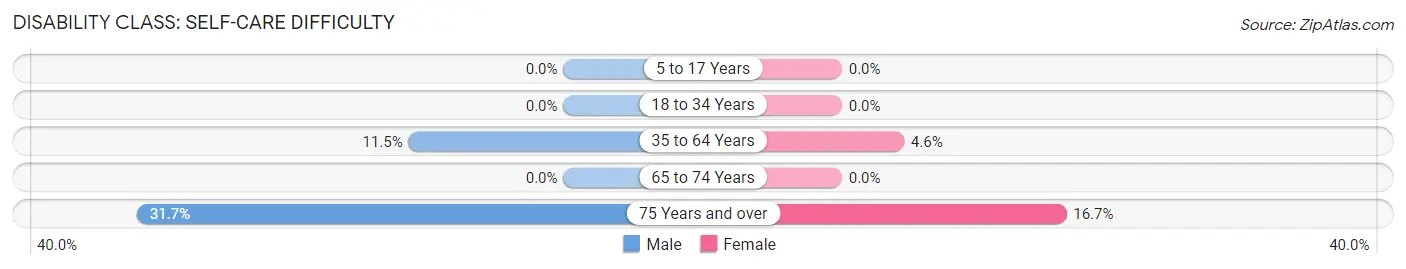
| Age Bracket | Male | Female |
| 5 to 17 Years | 0 (0.0%) | 0 (0.0%) |
| 18 to 34 Years | 0 (0.0%) | 0 (0.0%) |
| 35 to 64 Years | 34 (11.5%) | 14 (4.6%) |
| 65 to 74 Years | 0 (0.0%) | 0 (0.0%) |
| 75 Years and over | 19 (31.7%) | 29 (16.7%) |
Technology Access in Cumberland Head
Computing Device Access in Cumberland Head
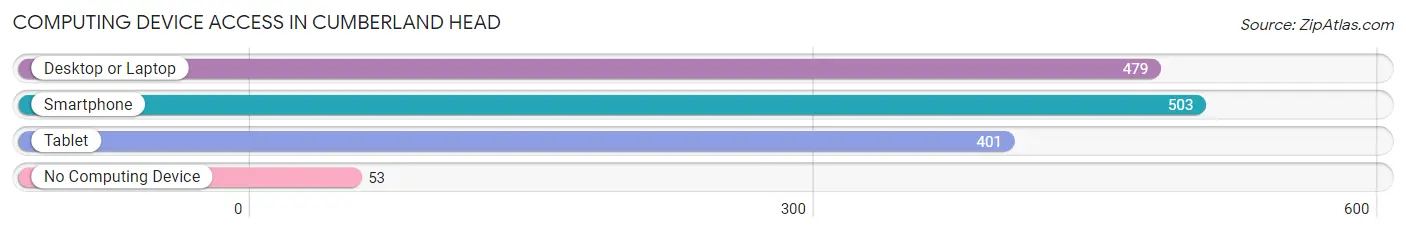
| Device Type | # Households | % Households |
| Desktop or Laptop | 479 | 79.6% |
| Smartphone | 503 | 83.6% |
| Tablet | 401 | 66.6% |
| No Computing Device | 53 | 8.8% |
| Total | 602 | 100.0% |
Internet Access in Cumberland Head
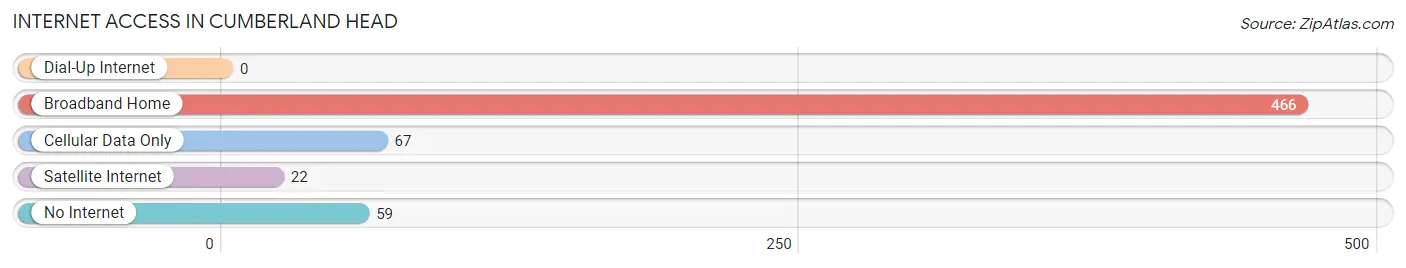
| Internet Type | # Households | % Households |
| Dial-Up Internet | 0 | 0.0% |
| Broadband Home | 466 | 77.4% |
| Cellular Data Only | 67 | 11.1% |
| Satellite Internet | 22 | 3.6% |
| No Internet | 59 | 9.8% |
| Total | 602 | 100.0% |
Cumberland Head Summary
Cumberland Head is a hamlet located in the town of Plattsburgh, New York, in Clinton County. It is situated on the western shore of Lake Champlain, just north of the city of Plattsburgh. The hamlet is home to a population of approximately 1,000 people, and is a popular destination for tourists and outdoor enthusiasts.
Geography
Cumberland Head is located in the Adirondack Mountains region of New York, and is situated on the western shore of Lake Champlain. The hamlet is bordered by the town of Plattsburgh to the south, and the town of Peru to the north. The hamlet is located approximately 10 miles north of the city of Plattsburgh, and is accessible via Route 9, which runs along the western shore of the lake.
The terrain of Cumberland Head is mostly flat, with some rolling hills and valleys. The hamlet is situated on a peninsula, with the lake on one side and the Saranac River on the other. The area is known for its scenic views of the lake and the surrounding mountains.
History
Cumberland Head was first settled in the late 1700s by settlers from Vermont. The hamlet was originally known as “Cumberland Point”, and was named after the Duke of Cumberland, who was a British general during the American Revolution. The hamlet was officially incorporated in 1810, and was renamed “Cumberland Head” in 1820.
The hamlet was an important port during the 19th century, and was a major stop on the Underground Railroad. The hamlet was also home to a number of shipyards, which built and repaired ships for the US Navy during the Civil War.
Economy
Cumberland Head is primarily a residential community, and the majority of its residents are employed in the nearby city of Plattsburgh. The hamlet is also home to a number of small businesses, including restaurants, shops, and marinas. Tourism is also an important part of the local economy, as the hamlet is a popular destination for outdoor enthusiasts and tourists.
Demographics
As of the 2010 census, the population of Cumberland Head was 1,000. The racial makeup of the hamlet was 97.2% White, 0.7% African American, 0.3% Native American, 0.3% Asian, and 1.5% from other races. The median household income was $45,000, and the median age was 44.
Conclusion
Cumberland Head is a small hamlet located in the town of Plattsburgh, New York. It is situated on the western shore of Lake Champlain, and is a popular destination for tourists and outdoor enthusiasts. The hamlet is home to a population of approximately 1,000 people, and is primarily a residential community. The local economy is largely based on tourism and small businesses, and the median household income is $45,000.
Common Questions
What is Per Capita Income in Cumberland Head?
Per Capita income in Cumberland Head is $63,356.
What is the Median Family Income in Cumberland Head?
Median Family Income in Cumberland Head is $111,563.
What is the Median Household income in Cumberland Head?
Median Household Income in Cumberland Head is $92,833.
What is Income or Wage Gap in Cumberland Head?
Income or Wage Gap in Cumberland Head is 1.9%.
Women in Cumberland Head earn 98.1 cents for every dollar earned by a man.
What is Inequality or Gini Index in Cumberland Head?
Inequality or Gini Index in Cumberland Head is 0.43.
What is the Total Population of Cumberland Head?
Total Population of Cumberland Head is 1,357.
What is the Total Male Population of Cumberland Head?
Total Male Population of Cumberland Head is 629.
What is the Total Female Population of Cumberland Head?
Total Female Population of Cumberland Head is 728.
What is the Ratio of Males per 100 Females in Cumberland Head?
There are 86.40 Males per 100 Females in Cumberland Head.
What is the Ratio of Females per 100 Males in Cumberland Head?
There are 115.74 Females per 100 Males in Cumberland Head.
What is the Median Population Age in Cumberland Head?
Median Population Age in Cumberland Head is 55.4 Years.
What is the Average Family Size in Cumberland Head
Average Family Size in Cumberland Head is 2.5 People.
What is the Average Household Size in Cumberland Head
Average Household Size in Cumberland Head is 2.2 People.
How Large is the Labor Force in Cumberland Head?
There are 628 People in the Labor Forcein in Cumberland Head.
What is the Percentage of People in the Labor Force in Cumberland Head?
50.7% of People are in the Labor Force in Cumberland Head.
What is the Unemployment Rate in Cumberland Head?
Unemployment Rate in Cumberland Head is 2.2%.