Incline Village, NV Map & Demographics
Incline Village Map
Incline Village Overview
$102,146
PER CAPITA INCOME
$175,500
AVG FAMILY INCOME
$155,195
AVG HOUSEHOLD INCOME
29.9%
WAGE / INCOME GAP [ % ]
70.1¢/ $1
WAGE / INCOME GAP [ $ ]
0.51
INEQUALITY / GINI INDEX
9,163
TOTAL POPULATION
4,725
MALE POPULATION
4,438
FEMALE POPULATION
106.47
MALES / 100 FEMALES
93.93
FEMALES / 100 MALES
48.8
MEDIAN AGE
2.6
AVG FAMILY SIZE
2.3
AVG HOUSEHOLD SIZE
5,006
LABOR FORCE [ PEOPLE ]
63.6%
PERCENT IN LABOR FORCE
3.5%
UNEMPLOYMENT RATE
Incline Village Zip Codes
Incline Village Area Codes
Income in Incline Village
Income Overview in Incline Village
Per Capita Income in Incline Village is $102,146, while median incomes of families and households are $175,500 and $155,195 respectively.
| Characteristic | Number | Measure |
| Per Capita Income | 9,163 | $102,146 |
| Median Family Income | 2,742 | $175,500 |
| Mean Family Income | 2,742 | $248,240 |
| Median Household Income | 3,925 | $155,195 |
| Mean Household Income | 3,925 | $236,787 |
| Income Deficit | 2,742 | $0 |
| Wage / Income Gap (%) | 9,163 | 29.85% |
| Wage / Income Gap ($) | 9,163 | 70.15¢ per $1 |
| Gini / Inequality Index | 9,163 | 0.51 |
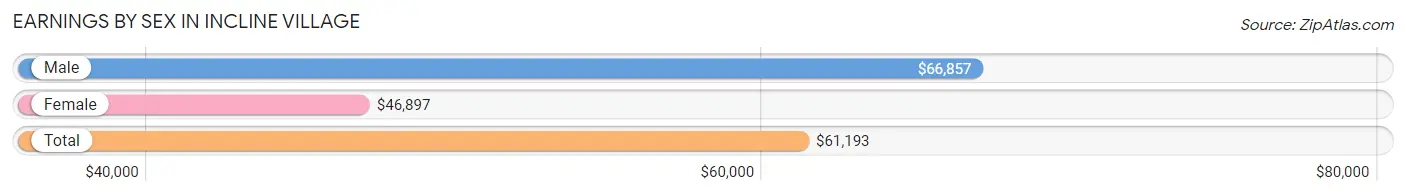
Earnings by Sex in Incline Village
Average Earnings in Incline Village are $61,193, $66,857 for men and $46,897 for women, a difference of 29.8%.
| Sex | Number | Average Earnings |
| Male | 3,022 (56.9%) | $66,857 |
| Female | 2,287 (43.1%) | $46,897 |
| Total | 5,309 (100.0%) | $61,193 |
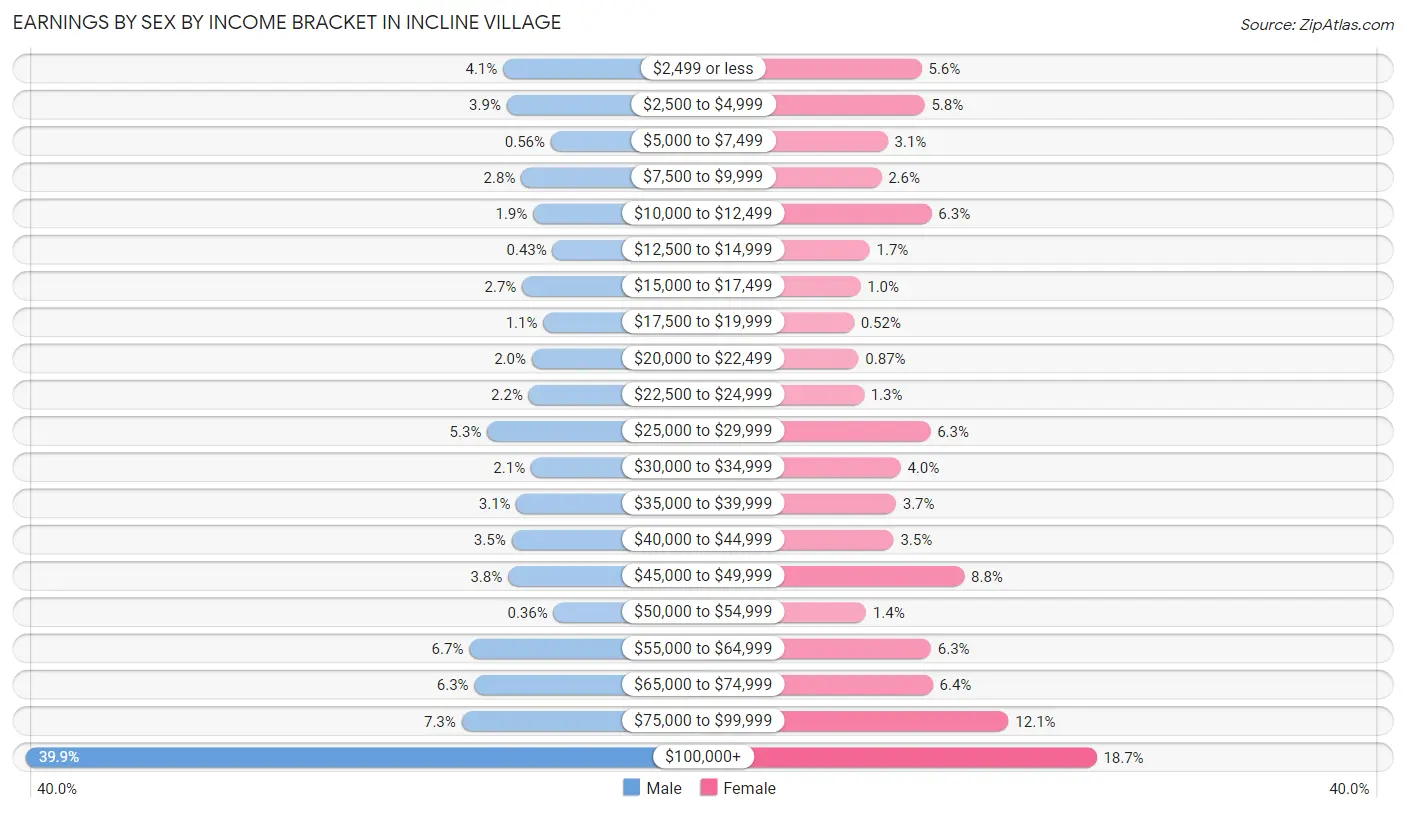
Earnings by Sex by Income Bracket in Incline Village
The most common earnings brackets in Incline Village are $100,000+ for men (1,206 | 39.9%) and $100,000+ for women (428 | 18.7%).
| Income | Male | Female |
| $2,499 or less | 125 (4.1%) | 128 (5.6%) |
| $2,500 to $4,999 | 117 (3.9%) | 133 (5.8%) |
| $5,000 to $7,499 | 17 (0.6%) | 70 (3.1%) |
| $7,500 to $9,999 | 84 (2.8%) | 59 (2.6%) |
| $10,000 to $12,499 | 57 (1.9%) | 145 (6.3%) |
| $12,500 to $14,999 | 13 (0.4%) | 39 (1.7%) |
| $15,000 to $17,499 | 82 (2.7%) | 23 (1.0%) |
| $17,500 to $19,999 | 34 (1.1%) | 12 (0.5%) |
| $20,000 to $22,499 | 60 (2.0%) | 20 (0.9%) |
| $22,500 to $24,999 | 67 (2.2%) | 29 (1.3%) |
| $25,000 to $29,999 | 161 (5.3%) | 143 (6.2%) |
| $30,000 to $34,999 | 62 (2.1%) | 92 (4.0%) |
| $35,000 to $39,999 | 95 (3.1%) | 84 (3.7%) |
| $40,000 to $44,999 | 106 (3.5%) | 80 (3.5%) |
| $45,000 to $49,999 | 114 (3.8%) | 201 (8.8%) |
| $50,000 to $54,999 | 11 (0.4%) | 33 (1.4%) |
| $55,000 to $64,999 | 202 (6.7%) | 144 (6.3%) |
| $65,000 to $74,999 | 190 (6.3%) | 147 (6.4%) |
| $75,000 to $99,999 | 219 (7.2%) | 277 (12.1%) |
| $100,000+ | 1,206 (39.9%) | 428 (18.7%) |
| Total | 3,022 (100.0%) | 2,287 (100.0%) |
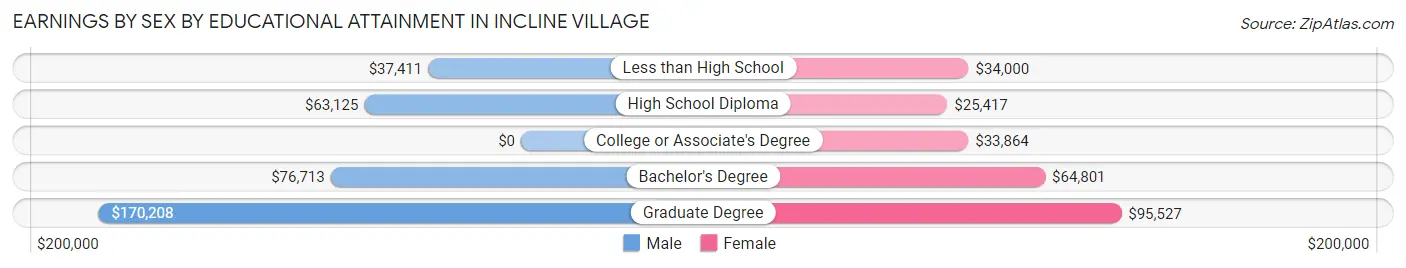
Earnings by Sex by Educational Attainment in Incline Village
Average earnings in Incline Village are $77,553 for men and $51,023 for women, a difference of 34.2%. Men with an educational attainment of graduate degree enjoy the highest average annual earnings of $170,208, while those with less than high school education earn the least with $37,411. Women with an educational attainment of graduate degree earn the most with the average annual earnings of $95,527, while those with high school diploma education have the smallest earnings of $25,417.
| Educational Attainment | Male Income | Female Income |
| Less than High School | $37,411 | $34,000 |
| High School Diploma | $63,125 | $25,417 |
| College or Associate's Degree | - | - |
| Bachelor's Degree | $76,713 | $64,801 |
| Graduate Degree | $170,208 | $95,527 |
| Total | $77,553 | $51,023 |
Family Income in Incline Village
Family Income Brackets in Incline Village
According to the Incline Village family income data, there are 1,209 families falling into the $200,000+ income range, which is the most common income bracket and makes up 44.1% of all families. Conversely, the $10,000 to $14,999 income bracket is the least frequent group with only 11 families (0.4%) belonging to this category.
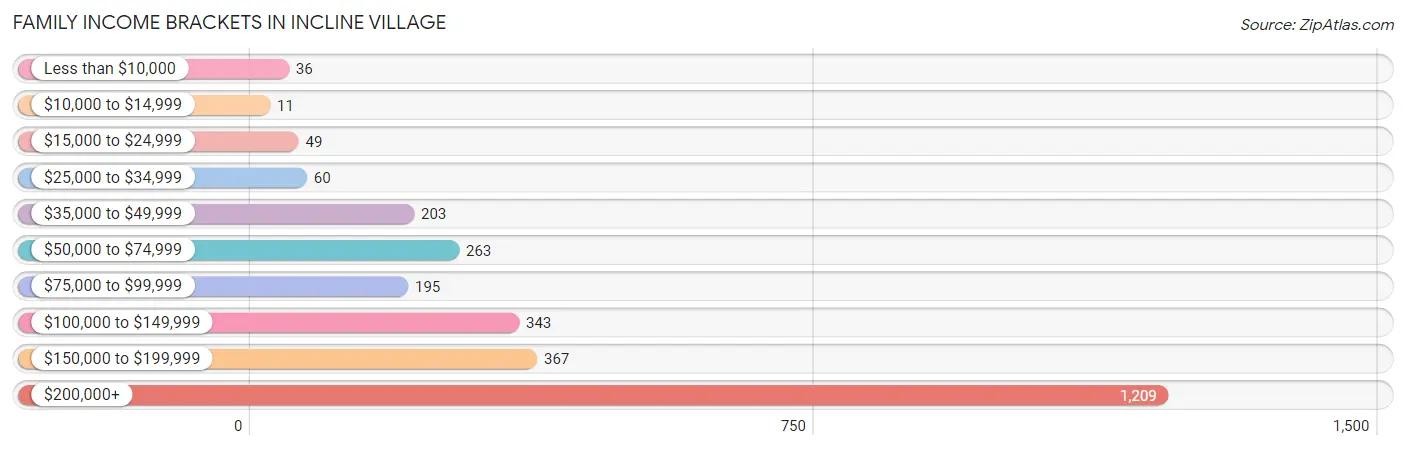
| Income Bracket | # Families | % Families |
| Less than $10,000 | 36 | 1.3% |
| $10,000 to $14,999 | 11 | 0.4% |
| $15,000 to $24,999 | 49 | 1.8% |
| $25,000 to $34,999 | 60 | 2.2% |
| $35,000 to $49,999 | 203 | 7.4% |
| $50,000 to $74,999 | 263 | 9.6% |
| $75,000 to $99,999 | 195 | 7.1% |
| $100,000 to $149,999 | 343 | 12.5% |
| $150,000 to $199,999 | 367 | 13.4% |
| $200,000+ | 1,209 | 44.1% |
Family Income by Famaliy Size in Incline Village
5-person families (53 | 1.9%) account for the highest median family income in Incline Village with $250,001 per family, while 2-person families (1,719 | 62.7%) have the highest median income of $92,422 per family member.
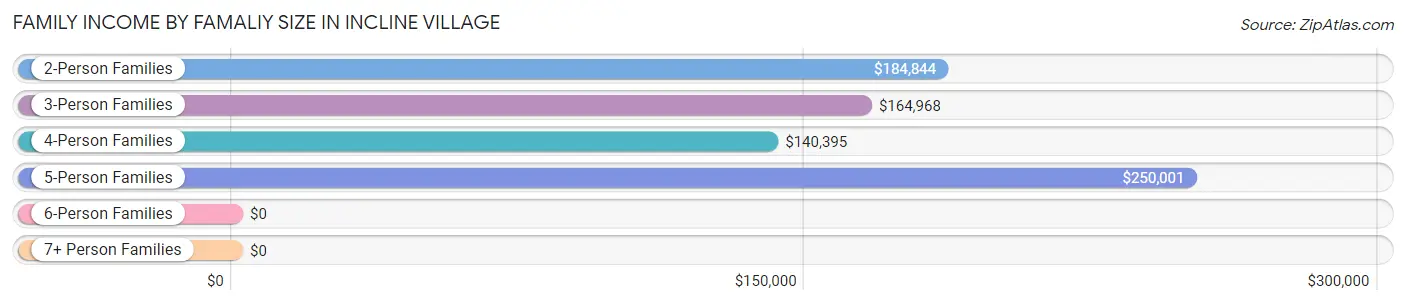
| Income Bracket | # Families | Median Income |
| 2-Person Families | 1,719 (62.7%) | $184,844 |
| 3-Person Families | 542 (19.8%) | $164,968 |
| 4-Person Families | 406 (14.8%) | $140,395 |
| 5-Person Families | 53 (1.9%) | $250,001 |
| 6-Person Families | 14 (0.5%) | $0 |
| 7+ Person Families | 8 (0.3%) | $0 |
| Total | 2,742 (100.0%) | $175,500 |
Family Income by Number of Earners in Incline Village
The median family income in Incline Village is $175,500, with families comprising 3+ earners (146) having the highest median family income of $250,001, while families with 1 earner (939) have the lowest median family income of $163,220, accounting for 5.3% and 34.3% of families, respectively.
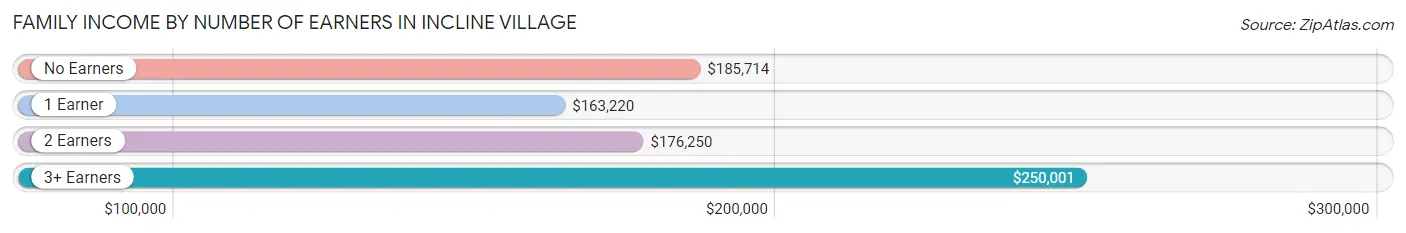
| Number of Earners | # Families | Median Income |
| No Earners | 524 (19.1%) | $185,714 |
| 1 Earner | 939 (34.3%) | $163,220 |
| 2 Earners | 1,133 (41.3%) | $176,250 |
| 3+ Earners | 146 (5.3%) | $250,001 |
| Total | 2,742 (100.0%) | $175,500 |
Household Income in Incline Village
Household Income Brackets in Incline Village
With 1,507 households falling in the category, the $200,000+ income range is the most frequent in Incline Village, accounting for 38.4% of all households. In contrast, only 24 households (0.6%) fall into the $10,000 to $14,999 income bracket, making it the least populous group.
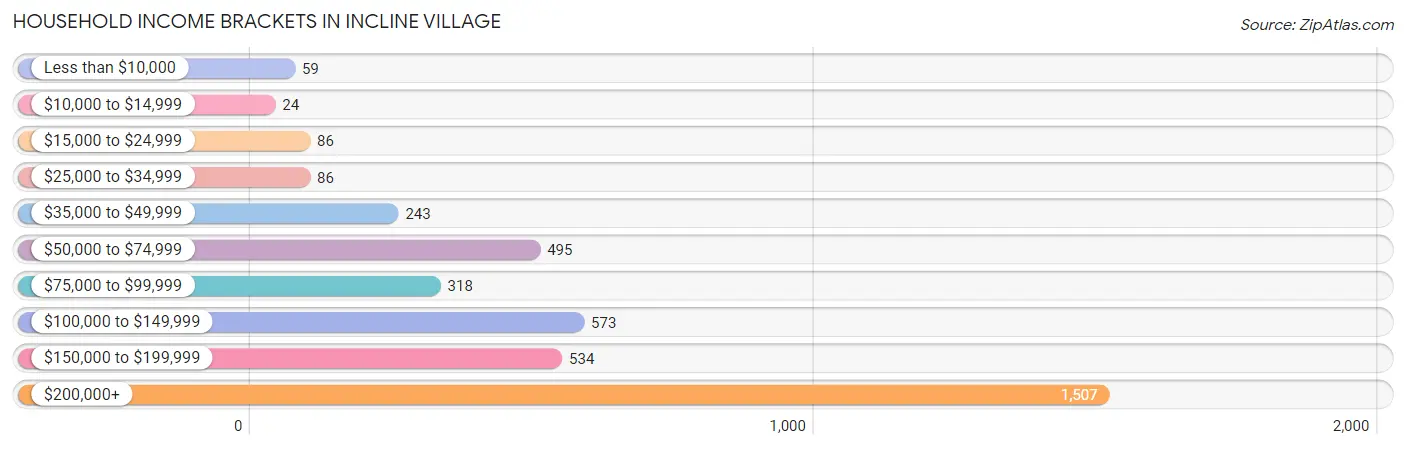
| Income Bracket | # Households | % Households |
| Less than $10,000 | 59 | 1.5% |
| $10,000 to $14,999 | 24 | 0.6% |
| $15,000 to $24,999 | 86 | 2.2% |
| $25,000 to $34,999 | 86 | 2.2% |
| $35,000 to $49,999 | 243 | 6.2% |
| $50,000 to $74,999 | 495 | 12.6% |
| $75,000 to $99,999 | 318 | 8.1% |
| $100,000 to $149,999 | 573 | 14.6% |
| $150,000 to $199,999 | 534 | 13.6% |
| $200,000+ | 1,507 | 38.4% |
Household Income by Householder Age in Incline Village
The median household income in Incline Village is $155,195, with the highest median household income of $185,368 found in the 65+ years age bracket for the primary householder. A total of 1,241 households (31.6%) fall into this category. Meanwhile, the 15 to 24 years age bracket for the primary householder has the lowest median household income of $71,250, with 84 households (2.1%) in this group.
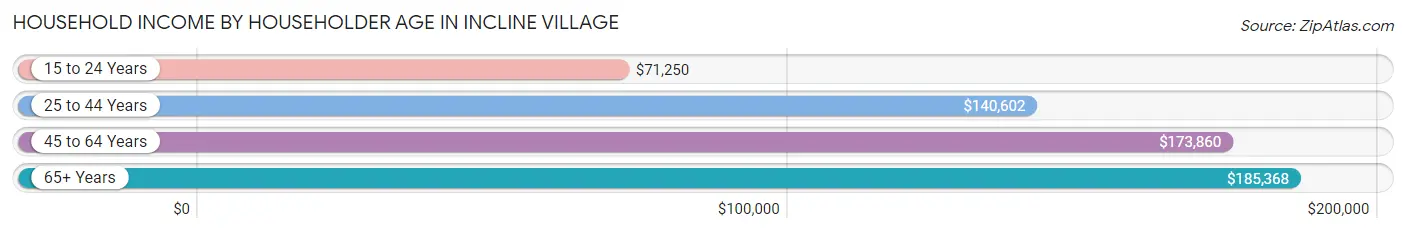
| Income Bracket | # Households | Median Income |
| 15 to 24 Years | 84 (2.1%) | $71,250 |
| 25 to 44 Years | 953 (24.3%) | $140,602 |
| 45 to 64 Years | 1,647 (42.0%) | $173,860 |
| 65+ Years | 1,241 (31.6%) | $185,368 |
| Total | 3,925 (100.0%) | $155,195 |
Poverty in Incline Village
Income Below Poverty by Sex and Age in Incline Village
With 6.9% poverty level for males and 8.5% for females among the residents of Incline Village, 25 to 34 year old males and 18 to 24 year old females are the most vulnerable to poverty, with 106 males (17.3%) and 102 females (41.6%) in their respective age groups living below the poverty level.
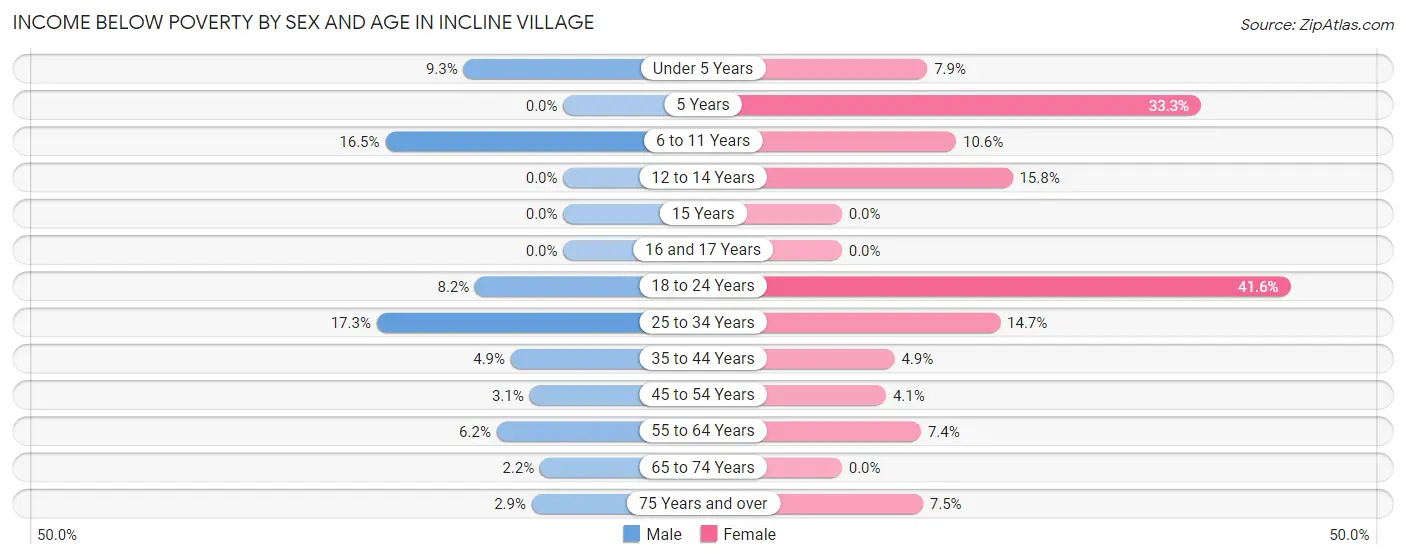
| Age Bracket | Male | Female |
| Under 5 Years | 15 (9.3%) | 13 (7.9%) |
| 5 Years | 0 (0.0%) | 14 (33.3%) |
| 6 to 11 Years | 57 (16.5%) | 26 (10.6%) |
| 12 to 14 Years | 0 (0.0%) | 16 (15.8%) |
| 15 Years | 0 (0.0%) | 0 (0.0%) |
| 16 and 17 Years | 0 (0.0%) | 0 (0.0%) |
| 18 to 24 Years | 14 (8.2%) | 102 (41.6%) |
| 25 to 34 Years | 106 (17.3%) | 67 (14.7%) |
| 35 to 44 Years | 30 (4.9%) | 25 (4.9%) |
| 45 to 54 Years | 19 (3.1%) | 27 (4.1%) |
| 55 to 64 Years | 49 (6.2%) | 57 (7.3%) |
| 65 to 74 Years | 16 (2.2%) | 0 (0.0%) |
| 75 Years and over | 9 (2.9%) | 20 (7.5%) |
| Total | 315 (6.9%) | 367 (8.5%) |
Income Above Poverty by Sex and Age in Incline Village
According to the poverty statistics in Incline Village, males aged 5 years and females aged 15 years are the age groups that are most secure financially, with 100.0% of males and 100.0% of females in these age groups living above the poverty line.
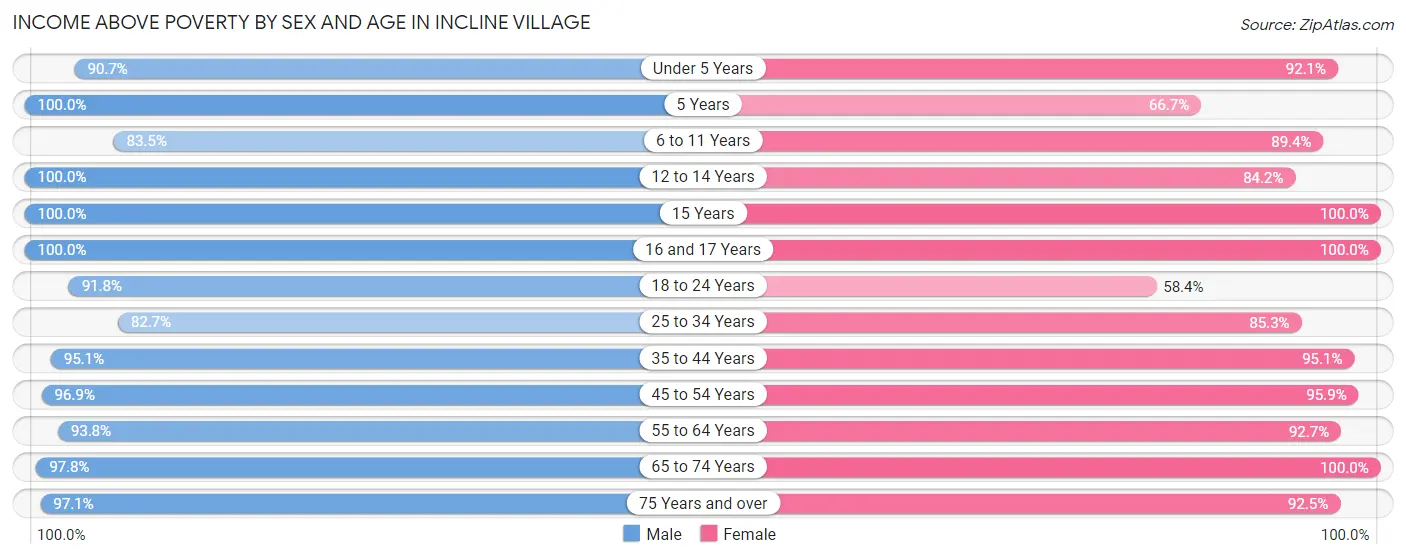
| Age Bracket | Male | Female |
| Under 5 Years | 147 (90.7%) | 151 (92.1%) |
| 5 Years | 10 (100.0%) | 28 (66.7%) |
| 6 to 11 Years | 288 (83.5%) | 219 (89.4%) |
| 12 to 14 Years | 29 (100.0%) | 85 (84.2%) |
| 15 Years | 81 (100.0%) | 59 (100.0%) |
| 16 and 17 Years | 130 (100.0%) | 60 (100.0%) |
| 18 to 24 Years | 157 (91.8%) | 143 (58.4%) |
| 25 to 34 Years | 506 (82.7%) | 389 (85.3%) |
| 35 to 44 Years | 586 (95.1%) | 486 (95.1%) |
| 45 to 54 Years | 586 (96.9%) | 632 (95.9%) |
| 55 to 64 Years | 744 (93.8%) | 719 (92.6%) |
| 65 to 74 Years | 724 (97.8%) | 719 (100.0%) |
| 75 Years and over | 298 (97.1%) | 246 (92.5%) |
| Total | 4,286 (93.1%) | 3,936 (91.5%) |
Income Below Poverty Among Married-Couple Families in Incline Village
The poverty statistics for married-couple families in Incline Village show that 3.6% or 86 of the total 2,372 families live below the poverty line. Families with 3 or 4 children have the highest poverty rate of 14.7%, comprising of 11 families. On the other hand, families with no children have the lowest poverty rate of 2.4%, which includes 41 families.
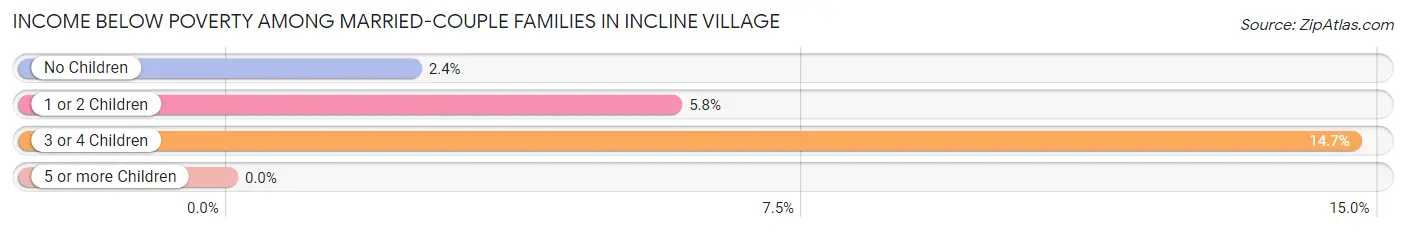
| Children | Above Poverty | Below Poverty |
| No Children | 1,670 (97.6%) | 41 (2.4%) |
| 1 or 2 Children | 552 (94.2%) | 34 (5.8%) |
| 3 or 4 Children | 64 (85.3%) | 11 (14.7%) |
| 5 or more Children | 0 (0.0%) | 0 (0.0%) |
| Total | 2,286 (96.4%) | 86 (3.6%) |
Income Below Poverty Among Single-Parent Households in Incline Village
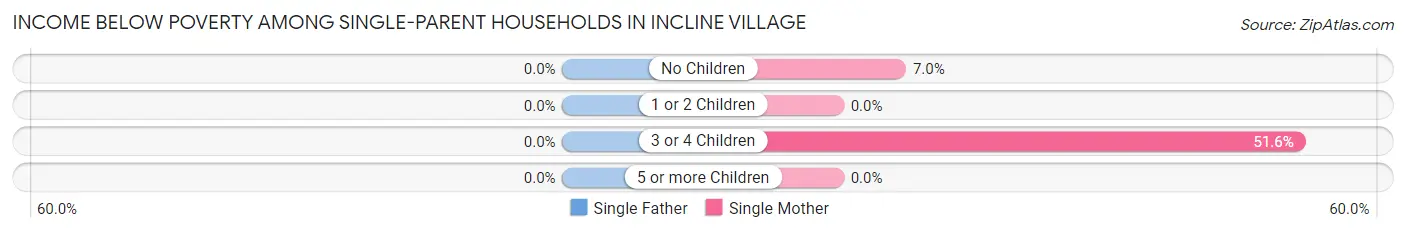
| Children | Single Father | Single Mother |
| No Children | 0 (0.0%) | 8 (7.0%) |
| 1 or 2 Children | 0 (0.0%) | 0 (0.0%) |
| 3 or 4 Children | 0 (0.0%) | 16 (51.6%) |
| 5 or more Children | 0 (0.0%) | 0 (0.0%) |
| Total | 0 (0.0%) | 24 (10.8%) |
Income Below Poverty Among Married-Couple vs Single-Parent Households in Incline Village
The poverty data for Incline Village shows that 86 of the married-couple family households (3.6%) and 24 of the single-parent households (6.5%) are living below the poverty level. Within the married-couple family households, those with 3 or 4 children have the highest poverty rate, with 11 households (14.7%) falling below the poverty line. Among the single-parent households, those with 3 or 4 children have the highest poverty rate, with 16 household (51.6%) living below poverty.
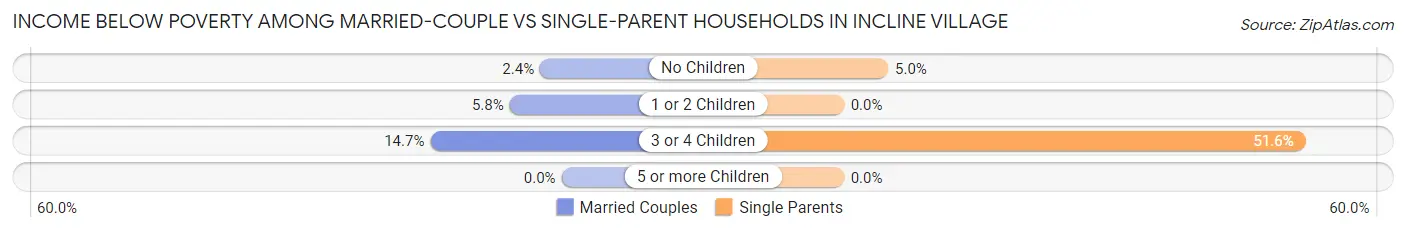
| Children | Married-Couple Families | Single-Parent Households |
| No Children | 41 (2.4%) | 8 (5.0%) |
| 1 or 2 Children | 34 (5.8%) | 0 (0.0%) |
| 3 or 4 Children | 11 (14.7%) | 16 (51.6%) |
| 5 or more Children | 0 (0.0%) | 0 (0.0%) |
| Total | 86 (3.6%) | 24 (6.5%) |
Race in Incline Village
The most populous races in Incline Village are White / Caucasian (7,391 | 80.7%), Hispanic or Latino (1,861 | 20.3%), and Two or more Races (973 | 10.6%).
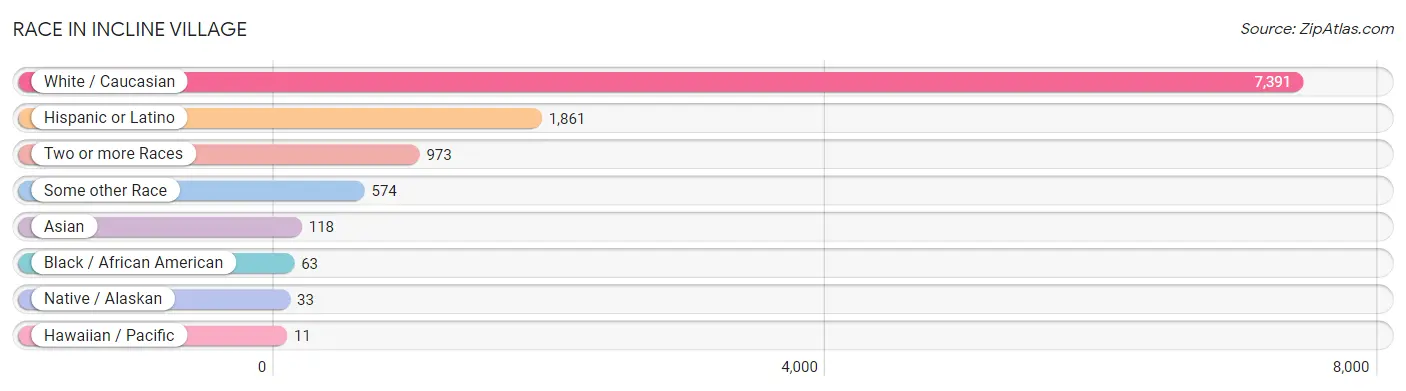
| Race | # Population | % Population |
| Asian | 118 | 1.3% |
| Black / African American | 63 | 0.7% |
| Hawaiian / Pacific | 11 | 0.1% |
| Hispanic or Latino | 1,861 | 20.3% |
| Native / Alaskan | 33 | 0.4% |
| White / Caucasian | 7,391 | 80.7% |
| Two or more Races | 973 | 10.6% |
| Some other Race | 574 | 6.3% |
| Total | 9,163 | 100.0% |
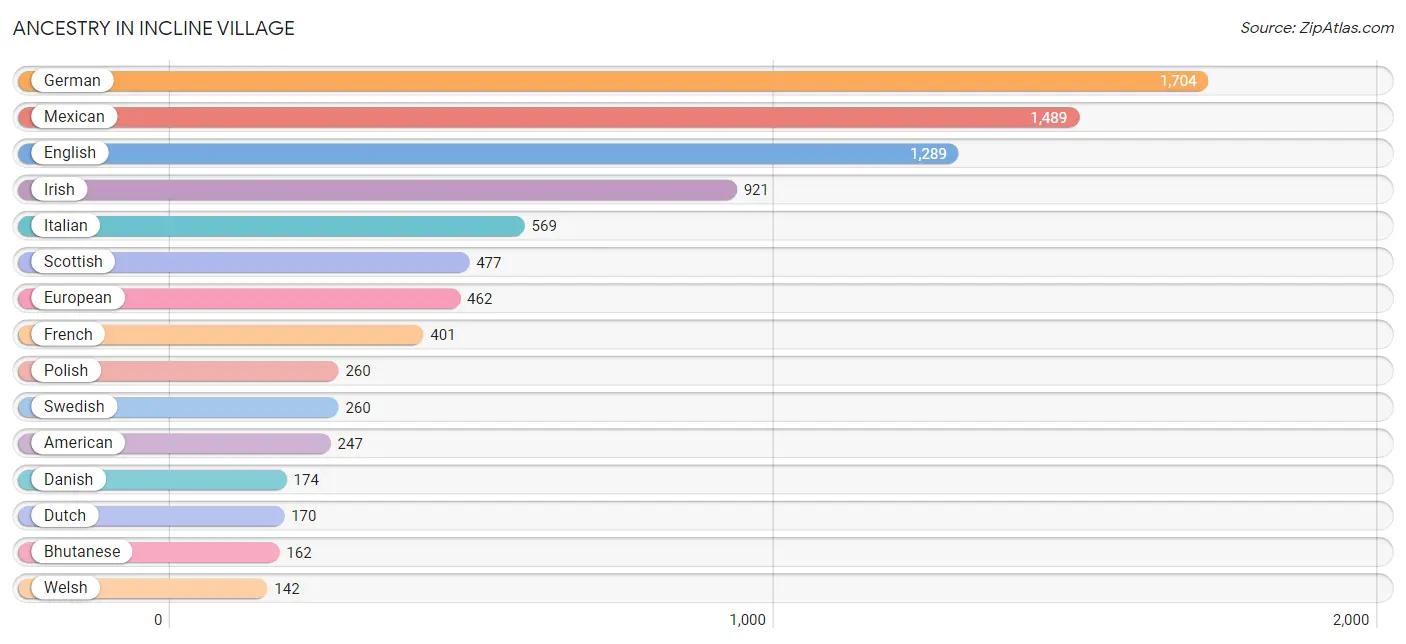
Ancestry in Incline Village
The most populous ancestries reported in Incline Village are German (1,704 | 18.6%), Mexican (1,489 | 16.3%), English (1,289 | 14.1%), Irish (921 | 10.1%), and Italian (569 | 6.2%), together accounting for 65.2% of all Incline Village residents.
| Ancestry | # Population | % Population |
| African | 24 | 0.3% |
| Aleut | 3 | 0.0% |
| American | 247 | 2.7% |
| Arab | 43 | 0.5% |
| Argentinean | 10 | 0.1% |
| Armenian | 26 | 0.3% |
| Australian | 13 | 0.1% |
| Austrian | 41 | 0.4% |
| Belgian | 40 | 0.4% |
| Bhutanese | 162 | 1.8% |
| Bolivian | 65 | 0.7% |
| Brazilian | 71 | 0.8% |
| British | 105 | 1.1% |
| Bulgarian | 5 | 0.1% |
| Burmese | 104 | 1.1% |
| Canadian | 123 | 1.3% |
| Celtic | 6 | 0.1% |
| Central American | 58 | 0.6% |
| Colombian | 51 | 0.6% |
| Croatian | 49 | 0.5% |
| Cuban | 123 | 1.3% |
| Czech | 53 | 0.6% |
| Czechoslovakian | 24 | 0.3% |
| Danish | 174 | 1.9% |
| Dutch | 170 | 1.9% |
| Eastern European | 31 | 0.3% |
| English | 1,289 | 14.1% |
| European | 462 | 5.0% |
| Finnish | 79 | 0.9% |
| French | 401 | 4.4% |
| French Canadian | 57 | 0.6% |
| German | 1,704 | 18.6% |
| Greek | 15 | 0.2% |
| Hungarian | 107 | 1.2% |
| Icelander | 14 | 0.2% |
| Indian (Asian) | 67 | 0.7% |
| Iranian | 40 | 0.4% |
| Irish | 921 | 10.1% |
| Iroquois | 55 | 0.6% |
| Italian | 569 | 6.2% |
| Korean | 35 | 0.4% |
| Lebanese | 20 | 0.2% |
| Lithuanian | 40 | 0.4% |
| Mexican | 1,489 | 16.3% |
| Native Hawaiian | 56 | 0.6% |
| Nicaraguan | 13 | 0.1% |
| Northern European | 53 | 0.6% |
| Norwegian | 109 | 1.2% |
| Palestinian | 23 | 0.3% |
| Panamanian | 8 | 0.1% |
| Polish | 260 | 2.8% |
| Portuguese | 59 | 0.6% |
| Romanian | 60 | 0.6% |
| Russian | 108 | 1.2% |
| Salvadoran | 27 | 0.3% |
| Scandinavian | 77 | 0.8% |
| Scotch-Irish | 94 | 1.0% |
| Scottish | 477 | 5.2% |
| Shoshone | 6 | 0.1% |
| Sioux | 12 | 0.1% |
| Slavic | 10 | 0.1% |
| Slovak | 11 | 0.1% |
| Slovene | 10 | 0.1% |
| South African | 27 | 0.3% |
| South American | 126 | 1.4% |
| Spaniard | 59 | 0.6% |
| Spanish | 6 | 0.1% |
| Sri Lankan | 26 | 0.3% |
| Subsaharan African | 51 | 0.6% |
| Swedish | 260 | 2.8% |
| Swiss | 14 | 0.2% |
| Thai | 4 | 0.0% |
| Tongan | 41 | 0.4% |
| Ukrainian | 13 | 0.1% |
| Vietnamese | 9 | 0.1% |
| Welsh | 142 | 1.5% | View All 76 Rows |
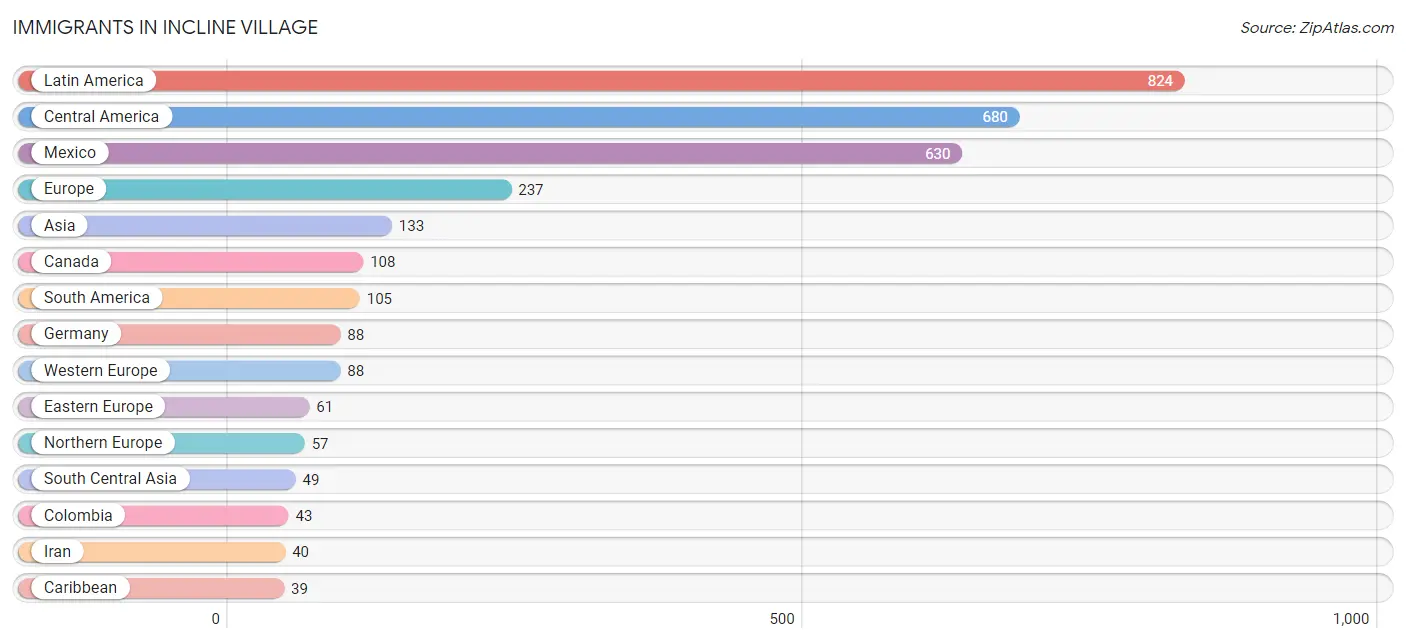
Immigrants in Incline Village
The most numerous immigrant groups reported in Incline Village came from Latin America (824 | 9.0%), Central America (680 | 7.4%), Mexico (630 | 6.9%), Europe (237 | 2.6%), and Asia (133 | 1.5%), together accounting for 27.3% of all Incline Village residents.
| Immigration Origin | # Population | % Population |
| Africa | 27 | 0.3% |
| Argentina | 10 | 0.1% |
| Asia | 133 | 1.5% |
| Bangladesh | 9 | 0.1% |
| Bolivia | 23 | 0.3% |
| Brazil | 29 | 0.3% |
| Canada | 108 | 1.2% |
| Caribbean | 39 | 0.4% |
| Central America | 680 | 7.4% |
| China | 10 | 0.1% |
| Colombia | 43 | 0.5% |
| Cuba | 39 | 0.4% |
| Eastern Asia | 27 | 0.3% |
| Eastern Europe | 61 | 0.7% |
| El Salvador | 37 | 0.4% |
| Europe | 237 | 2.6% |
| Germany | 88 | 1.0% |
| Iran | 40 | 0.4% |
| Japan | 5 | 0.1% |
| Korea | 12 | 0.1% |
| Kuwait | 23 | 0.3% |
| Latin America | 824 | 9.0% |
| Mexico | 630 | 6.9% |
| Nicaragua | 13 | 0.1% |
| Northern Europe | 57 | 0.6% |
| Oceania | 11 | 0.1% |
| Philippines | 8 | 0.1% |
| Portugal | 21 | 0.2% |
| Romania | 28 | 0.3% |
| Scotland | 24 | 0.3% |
| South Africa | 27 | 0.3% |
| South America | 105 | 1.1% |
| South Central Asia | 49 | 0.5% |
| South Eastern Asia | 34 | 0.4% |
| Southern Europe | 31 | 0.3% |
| Spain | 10 | 0.1% |
| Ukraine | 9 | 0.1% |
| Vietnam | 26 | 0.3% |
| Western Asia | 23 | 0.3% |
| Western Europe | 88 | 1.0% | View All 40 Rows |
Sex and Age in Incline Village
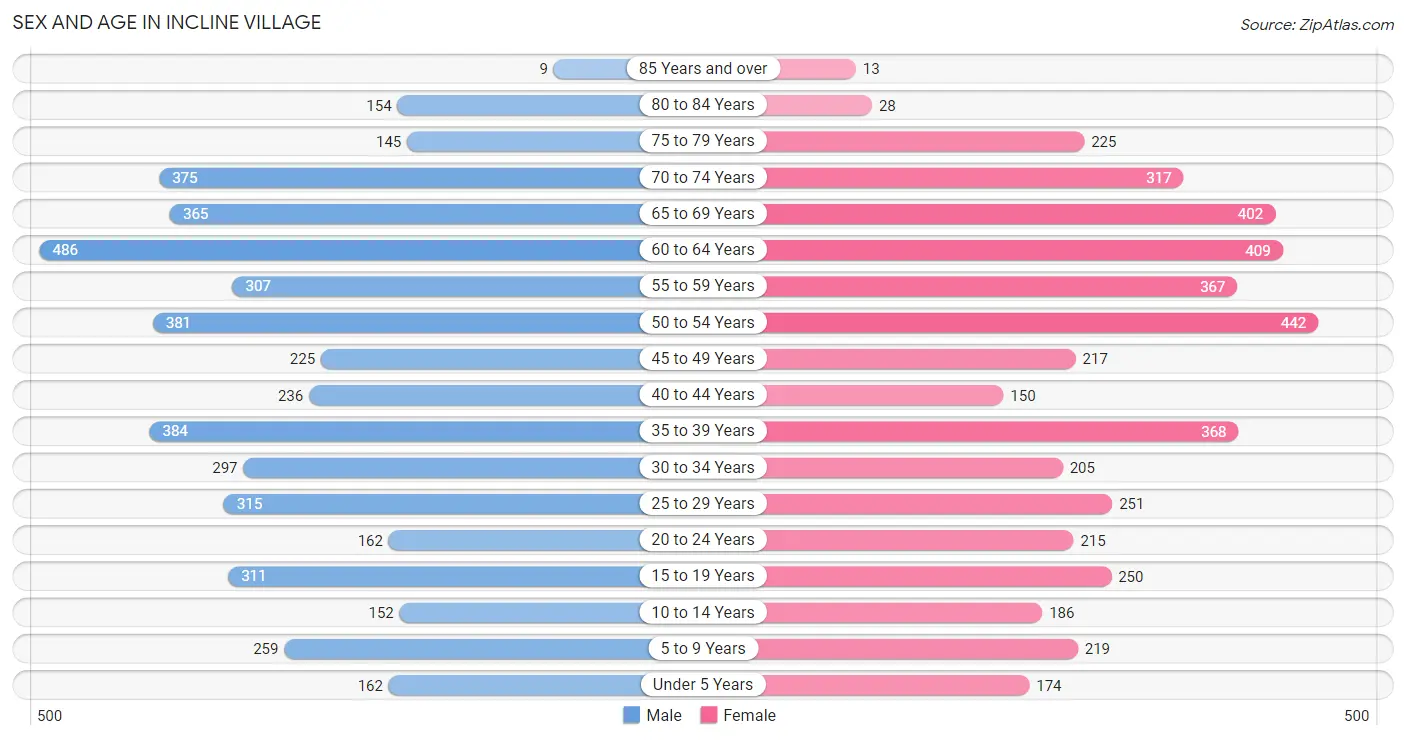
Sex and Age in Incline Village
The most populous age groups in Incline Village are 60 to 64 Years (486 | 10.3%) for men and 50 to 54 Years (442 | 10.0%) for women.
| Age Bracket | Male | Female |
| Under 5 Years | 162 (3.4%) | 174 (3.9%) |
| 5 to 9 Years | 259 (5.5%) | 219 (4.9%) |
| 10 to 14 Years | 152 (3.2%) | 186 (4.2%) |
| 15 to 19 Years | 311 (6.6%) | 250 (5.6%) |
| 20 to 24 Years | 162 (3.4%) | 215 (4.8%) |
| 25 to 29 Years | 315 (6.7%) | 251 (5.7%) |
| 30 to 34 Years | 297 (6.3%) | 205 (4.6%) |
| 35 to 39 Years | 384 (8.1%) | 368 (8.3%) |
| 40 to 44 Years | 236 (5.0%) | 150 (3.4%) |
| 45 to 49 Years | 225 (4.8%) | 217 (4.9%) |
| 50 to 54 Years | 381 (8.1%) | 442 (10.0%) |
| 55 to 59 Years | 307 (6.5%) | 367 (8.3%) |
| 60 to 64 Years | 486 (10.3%) | 409 (9.2%) |
| 65 to 69 Years | 365 (7.7%) | 402 (9.1%) |
| 70 to 74 Years | 375 (7.9%) | 317 (7.1%) |
| 75 to 79 Years | 145 (3.1%) | 225 (5.1%) |
| 80 to 84 Years | 154 (3.3%) | 28 (0.6%) |
| 85 Years and over | 9 (0.2%) | 13 (0.3%) |
| Total | 4,725 (100.0%) | 4,438 (100.0%) |
Families and Households in Incline Village
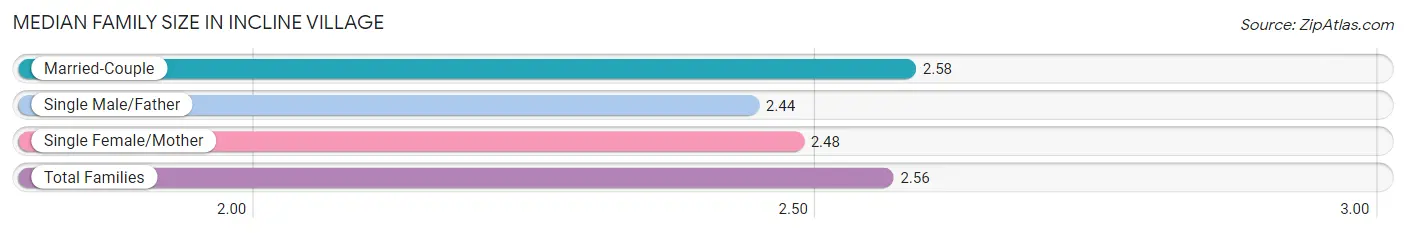
Median Family Size in Incline Village
The median family size in Incline Village is 2.56 persons per family, with married-couple families (2,372 | 86.5%) accounting for the largest median family size of 2.58 persons per family. On the other hand, single male/father families (147 | 5.4%) represent the smallest median family size with 2.44 persons per family.
| Family Type | # Families | Family Size |
| Married-Couple | 2,372 (86.5%) | 2.58 |
| Single Male/Father | 147 (5.4%) | 2.44 |
| Single Female/Mother | 223 (8.1%) | 2.48 |
| Total Families | 2,742 (100.0%) | 2.56 |
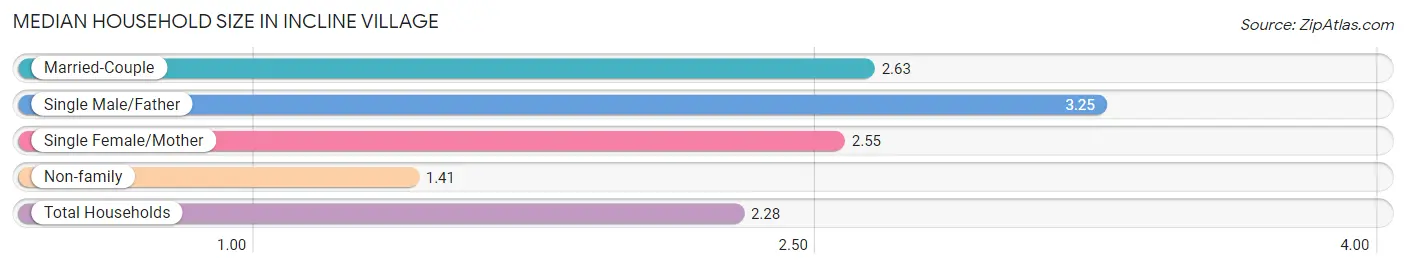
Median Household Size in Incline Village
The median household size in Incline Village is 2.28 persons per household, with single male/father households (147 | 3.7%) accounting for the largest median household size of 3.25 persons per household. non-family households (1,183 | 30.1%) represent the smallest median household size with 1.41 persons per household.
| Household Type | # Households | Household Size |
| Married-Couple | 2,372 (60.4%) | 2.63 |
| Single Male/Father | 147 (3.7%) | 3.25 |
| Single Female/Mother | 223 (5.7%) | 2.55 |
| Non-family | 1,183 (30.1%) | 1.41 |
| Total Households | 3,925 (100.0%) | 2.28 |
Household Size by Marriage Status in Incline Village
Out of a total of 3,925 households in Incline Village, 2,742 (69.9%) are family households, while 1,183 (30.1%) are nonfamily households. The most numerous type of family households are 2-person households, comprising 1,610, and the most common type of nonfamily households are 1-person households, comprising 825.
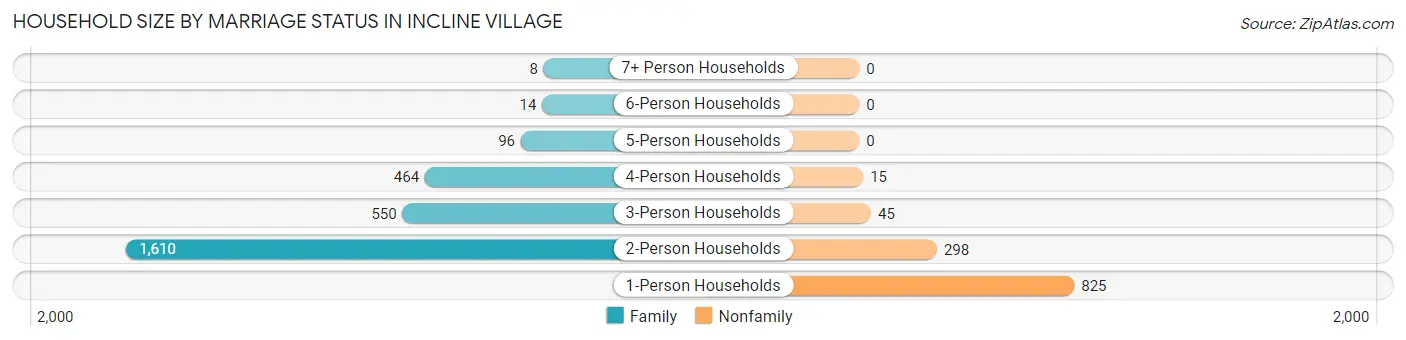
| Household Size | Family Households | Nonfamily Households |
| 1-Person Households | - | 825 (21.0%) |
| 2-Person Households | 1,610 (41.0%) | 298 (7.6%) |
| 3-Person Households | 550 (14.0%) | 45 (1.1%) |
| 4-Person Households | 464 (11.8%) | 15 (0.4%) |
| 5-Person Households | 96 (2.5%) | 0 (0.0%) |
| 6-Person Households | 14 (0.4%) | 0 (0.0%) |
| 7+ Person Households | 8 (0.2%) | 0 (0.0%) |
| Total | 2,742 (69.9%) | 1,183 (30.1%) |
Female Fertility in Incline Village
Fertility by Age in Incline Village
Average fertility rate in Incline Village is 46.0 births per 1,000 women. Women in the age bracket of 35 to 50 years have the highest fertility rate with 92.0 births per 1,000 women. Women in the age bracket of 35 to 50 years acount for 96.3% of all women with births.
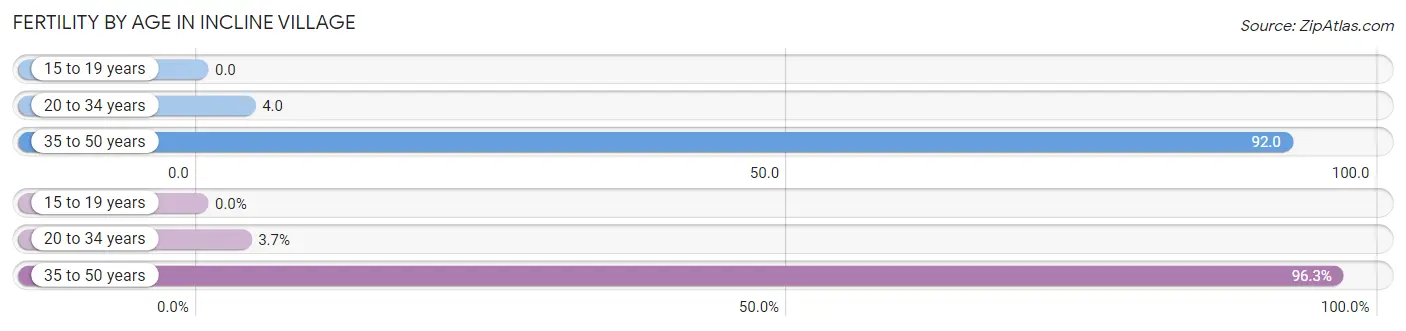
| Age Bracket | Women with Births | Births / 1,000 Women |
| 15 to 19 years | 0 (0.0%) | 0.0 |
| 20 to 34 years | 3 (3.7%) | 4.0 |
| 35 to 50 years | 79 (96.3%) | 92.0 |
| Total | 82 (100.0%) | 46.0 |
Fertility by Age by Marriage Status in Incline Village
64.6% of women with births (82) in Incline Village are married. The highest percentage of unmarried women with births falls into 35 to 50 years age bracket with 36.7% of them unmarried at the time of birth, while the lowest percentage of unmarried women with births belong to 20 to 34 years age bracket with 0.0% of them unmarried.
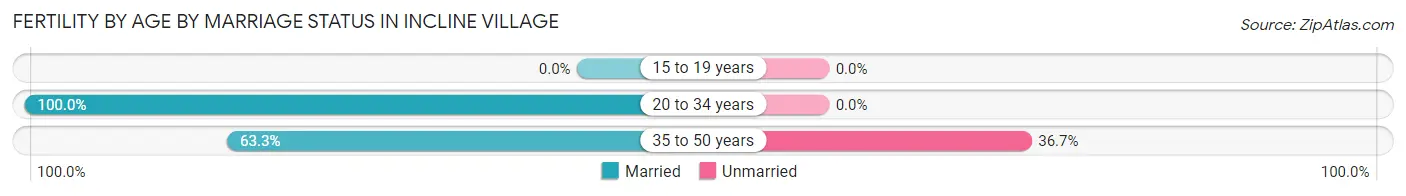
| Age Bracket | Married | Unmarried |
| 15 to 19 years | 0 (0.0%) | 0 (0.0%) |
| 20 to 34 years | 3 (100.0%) | 0 (0.0%) |
| 35 to 50 years | 50 (63.3%) | 29 (36.7%) |
| Total | 53 (64.6%) | 29 (35.4%) |
Fertility by Education in Incline Village
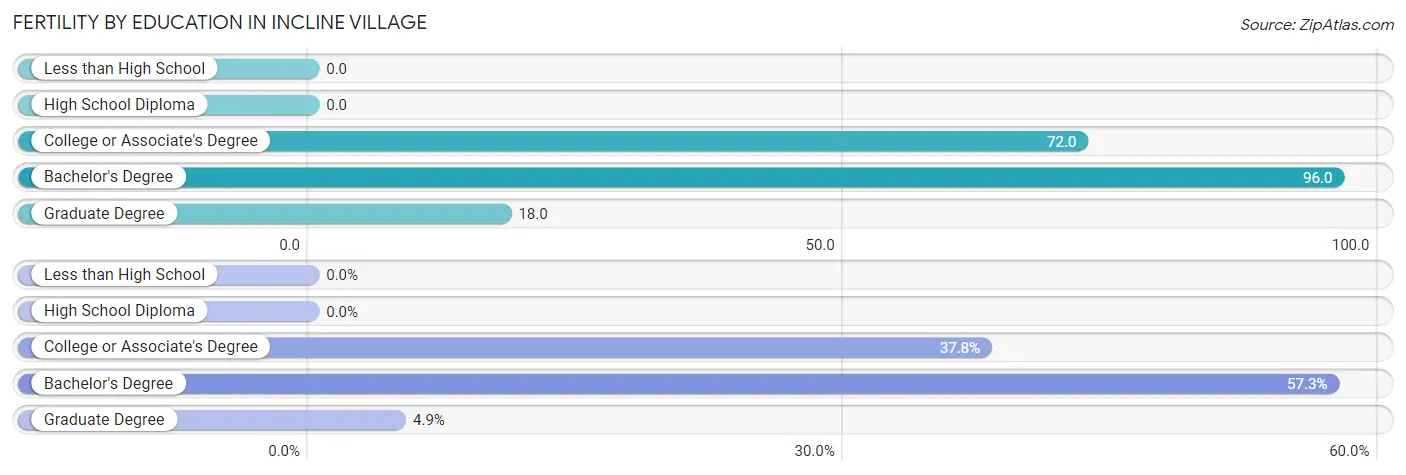
| Educational Attainment | Women with Births | Births / 1,000 Women |
| Less than High School | 0 (0.0%) | 0.0 |
| High School Diploma | 0 (0.0%) | 0.0 |
| College or Associate's Degree | 31 (37.8%) | 72.0 |
| Bachelor's Degree | 47 (57.3%) | 96.0 |
| Graduate Degree | 4 (4.9%) | 18.0 |
| Total | 82 (100.0%) | 46.0 |
Fertility by Education by Marriage Status in Incline Village
35.4% of women with births in Incline Village are unmarried. Women with the educational attainment of college or associate's degree are most likely to be married with 100.0% of them married at childbirth, while women with the educational attainment of bachelor's degree are least likely to be married with 61.7% of them unmarried at childbirth.
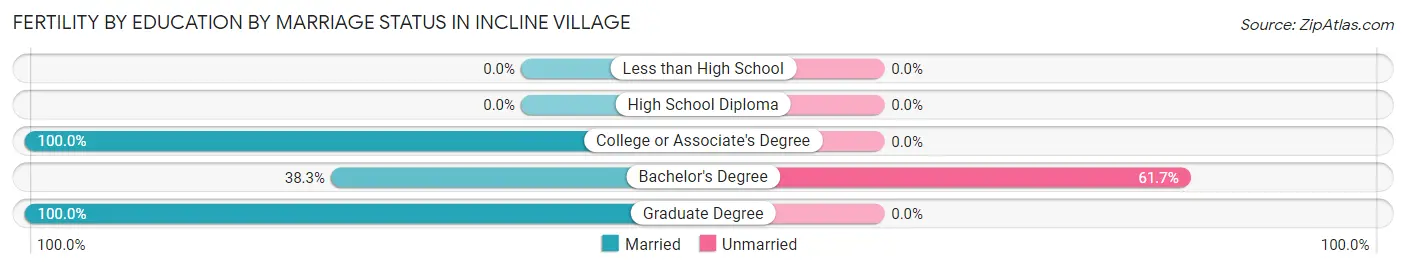
| Educational Attainment | Married | Unmarried |
| Less than High School | 0 (0.0%) | 0 (0.0%) |
| High School Diploma | 0 (0.0%) | 0 (0.0%) |
| College or Associate's Degree | 31 (100.0%) | 0 (0.0%) |
| Bachelor's Degree | 18 (38.3%) | 29 (61.7%) |
| Graduate Degree | 4 (100.0%) | 0 (0.0%) |
| Total | 53 (64.6%) | 29 (35.4%) |
Employment Characteristics in Incline Village
Employment by Class of Employer in Incline Village
Among the 4,689 employed individuals in Incline Village, private company employees (2,929 | 62.5%), self-employed (incorporated) (703 | 15.0%), and self-employed (not incorporated) (520 | 11.1%) make up the most common classes of employment.
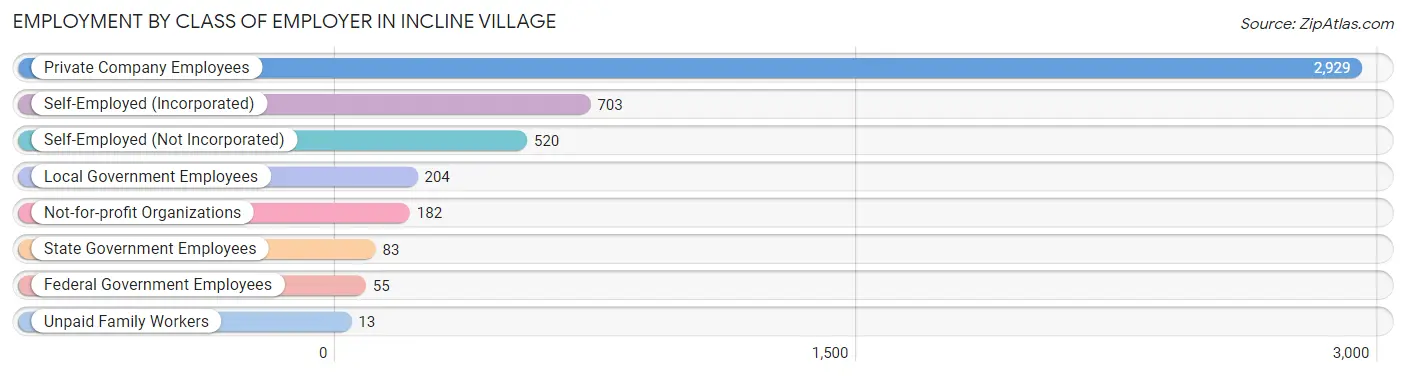
| Employer Class | # Employees | % Employees |
| Private Company Employees | 2,929 | 62.5% |
| Self-Employed (Incorporated) | 703 | 15.0% |
| Self-Employed (Not Incorporated) | 520 | 11.1% |
| Not-for-profit Organizations | 182 | 3.9% |
| Local Government Employees | 204 | 4.3% |
| State Government Employees | 83 | 1.8% |
| Federal Government Employees | 55 | 1.2% |
| Unpaid Family Workers | 13 | 0.3% |
| Total | 4,689 | 100.0% |
Employment Status by Age in Incline Village
According to the labor force statistics for Incline Village, out of the total population over 16 years of age (7,871), 63.6% or 5,006 individuals are in the labor force, with 3.5% or 175 of them unemployed. The age group with the highest labor force participation rate is 30 to 34 years, with 90.8% or 456 individuals in the labor force. Within the labor force, the 16 to 19 years age range has the highest percentage of unemployed individuals, with 19.0% or 30 of them being unemployed.
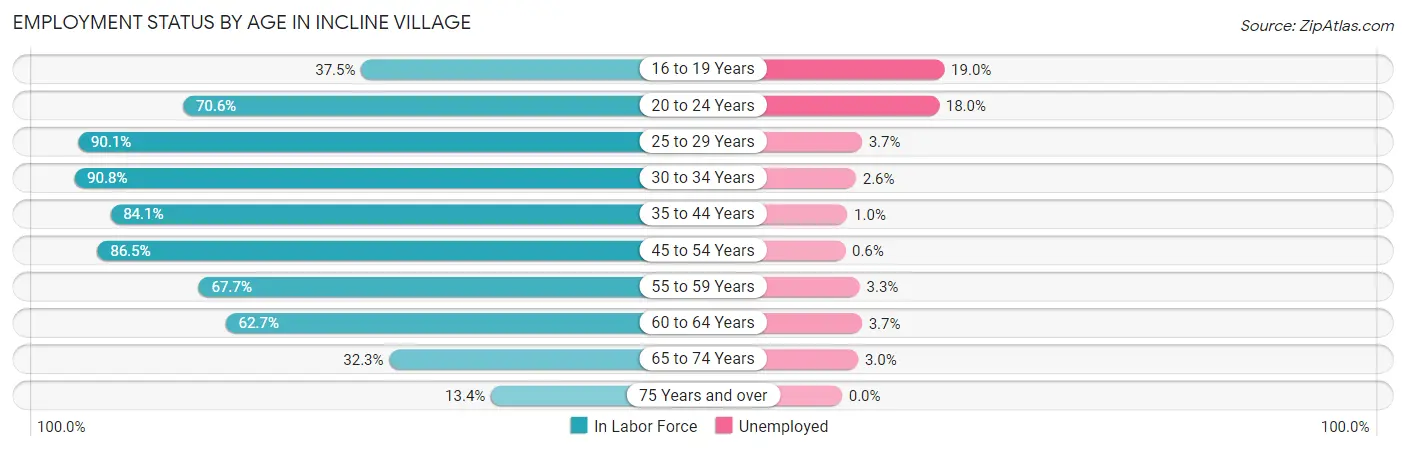
| Age Bracket | In Labor Force | Unemployed |
| 16 to 19 Years | 158 (37.5%) | 30 (19.0%) |
| 20 to 24 Years | 266 (70.6%) | 48 (18.0%) |
| 25 to 29 Years | 510 (90.1%) | 19 (3.7%) |
| 30 to 34 Years | 456 (90.8%) | 12 (2.6%) |
| 35 to 44 Years | 957 (84.1%) | 10 (1.0%) |
| 45 to 54 Years | 1,094 (86.5%) | 7 (0.6%) |
| 55 to 59 Years | 456 (67.7%) | 15 (3.3%) |
| 60 to 64 Years | 561 (62.7%) | 21 (3.7%) |
| 65 to 74 Years | 471 (32.3%) | 14 (3.0%) |
| 75 Years and over | 77 (13.4%) | 0 (0.0%) |
| Total | 5,006 (63.6%) | 175 (3.5%) |
Employment Status by Educational Attainment in Incline Village
According to labor force statistics for Incline Village, 80.0% of individuals (4,032) out of the total population between 25 and 64 years of age (5,040) are in the labor force, with 2.1% or 85 of them being unemployed. The group with the highest labor force participation rate are those with the educational attainment of high school diploma, with 93.5% or 559 individuals in the labor force. Within the labor force, individuals with college / associate degree education have the highest percentage of unemployment, with 3.5% or 26 of them being unemployed.
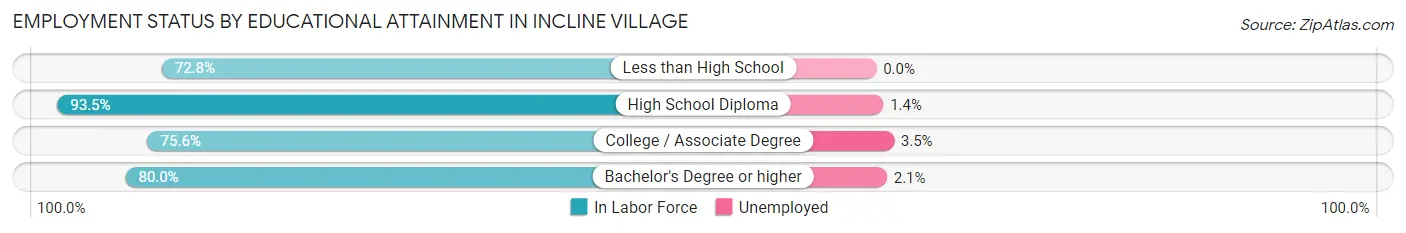
| Educational Attainment | In Labor Force | Unemployed |
| Less than High School | 345 (72.8%) | 0 (0.0%) |
| High School Diploma | 559 (93.5%) | 8 (1.4%) |
| College / Associate Degree | 752 (75.6%) | 35 (3.5%) |
| Bachelor's Degree or higher | 2,378 (80.0%) | 62 (2.1%) |
| Total | 4,032 (80.0%) | 106 (2.1%) |
Employment Occupations by Sex in Incline Village
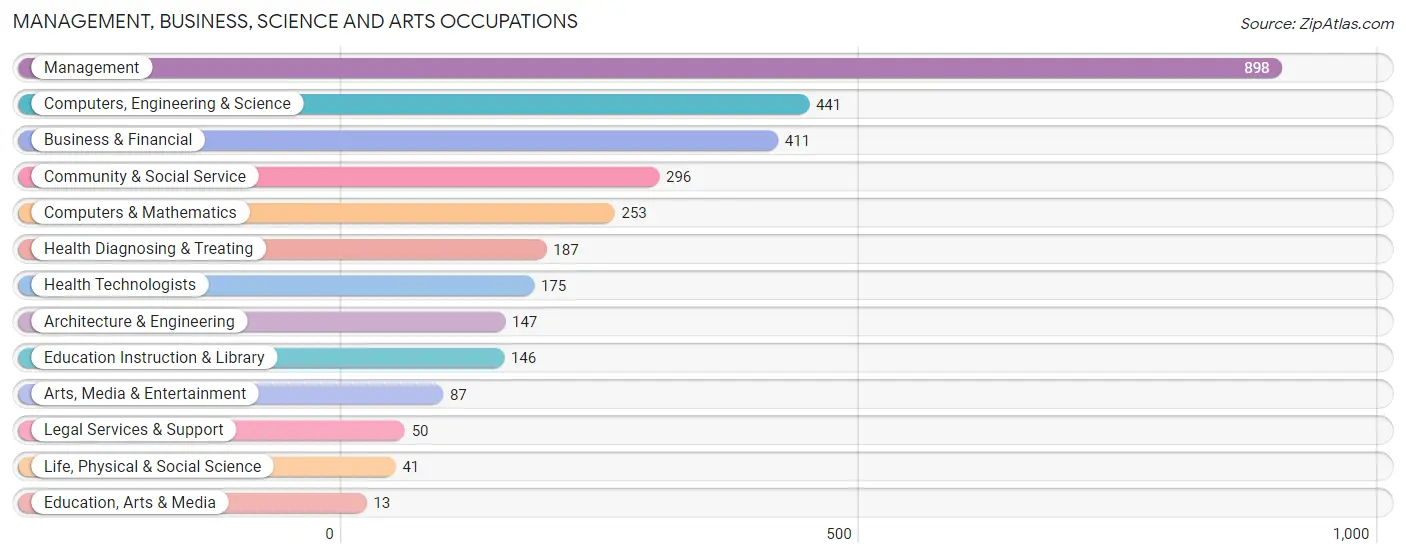
Management, Business, Science and Arts Occupations
The most common Management, Business, Science and Arts occupations in Incline Village are Management (898 | 18.6%), Computers, Engineering & Science (441 | 9.2%), Business & Financial (411 | 8.5%), Community & Social Service (296 | 6.1%), and Computers & Mathematics (253 | 5.2%).
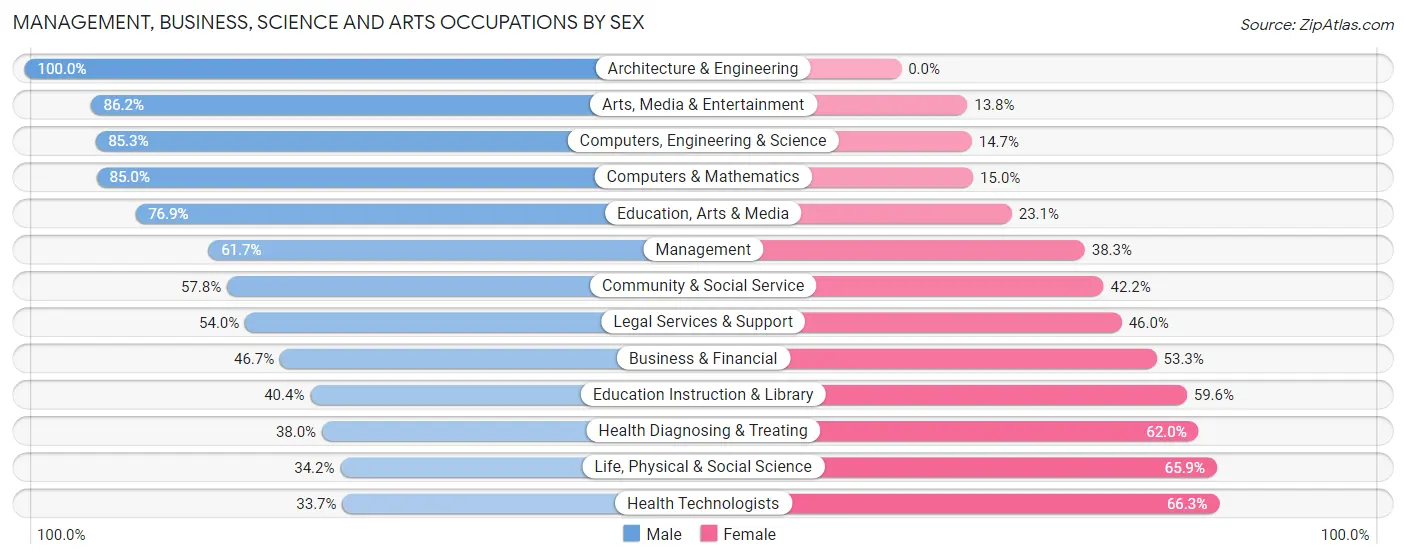
Management, Business, Science and Arts Occupations by Sex
Within the Management, Business, Science and Arts occupations in Incline Village, the most male-oriented occupations are Architecture & Engineering (100.0%), Arts, Media & Entertainment (86.2%), and Computers, Engineering & Science (85.3%), while the most female-oriented occupations are Health Technologists (66.3%), Life, Physical & Social Science (65.8%), and Health Diagnosing & Treating (62.0%).
| Occupation | Male | Female |
| Management | 554 (61.7%) | 344 (38.3%) |
| Business & Financial | 192 (46.7%) | 219 (53.3%) |
| Computers, Engineering & Science | 376 (85.3%) | 65 (14.7%) |
| Computers & Mathematics | 215 (85.0%) | 38 (15.0%) |
| Architecture & Engineering | 147 (100.0%) | 0 (0.0%) |
| Life, Physical & Social Science | 14 (34.2%) | 27 (65.8%) |
| Community & Social Service | 171 (57.8%) | 125 (42.2%) |
| Education, Arts & Media | 10 (76.9%) | 3 (23.1%) |
| Legal Services & Support | 27 (54.0%) | 23 (46.0%) |
| Education Instruction & Library | 59 (40.4%) | 87 (59.6%) |
| Arts, Media & Entertainment | 75 (86.2%) | 12 (13.8%) |
| Health Diagnosing & Treating | 71 (38.0%) | 116 (62.0%) |
| Health Technologists | 59 (33.7%) | 116 (66.3%) |
| Total (Category) | 1,364 (61.1%) | 869 (38.9%) |
| Total (Overall) | 2,774 (57.6%) | 2,043 (42.4%) |
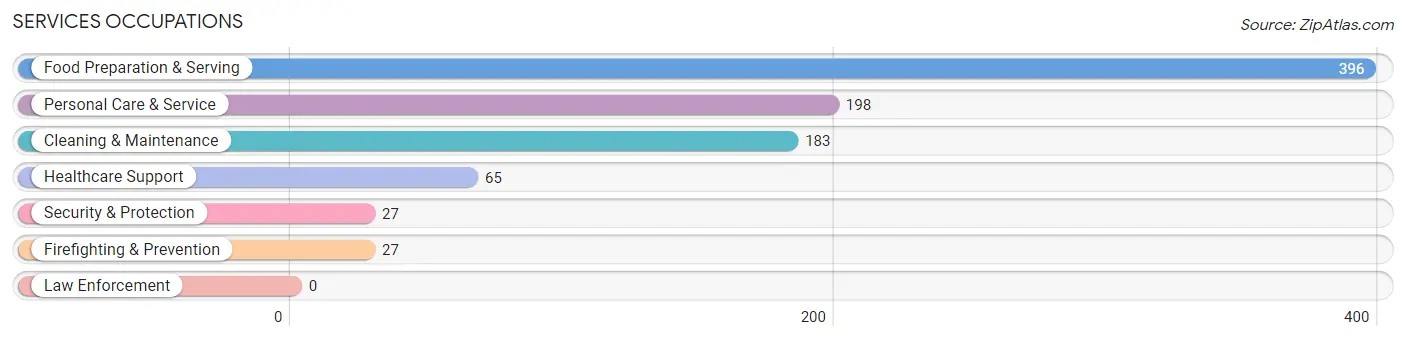
Services Occupations
The most common Services occupations in Incline Village are Food Preparation & Serving (396 | 8.2%), Personal Care & Service (198 | 4.1%), Cleaning & Maintenance (183 | 3.8%), Healthcare Support (65 | 1.3%), and Security & Protection (27 | 0.6%).
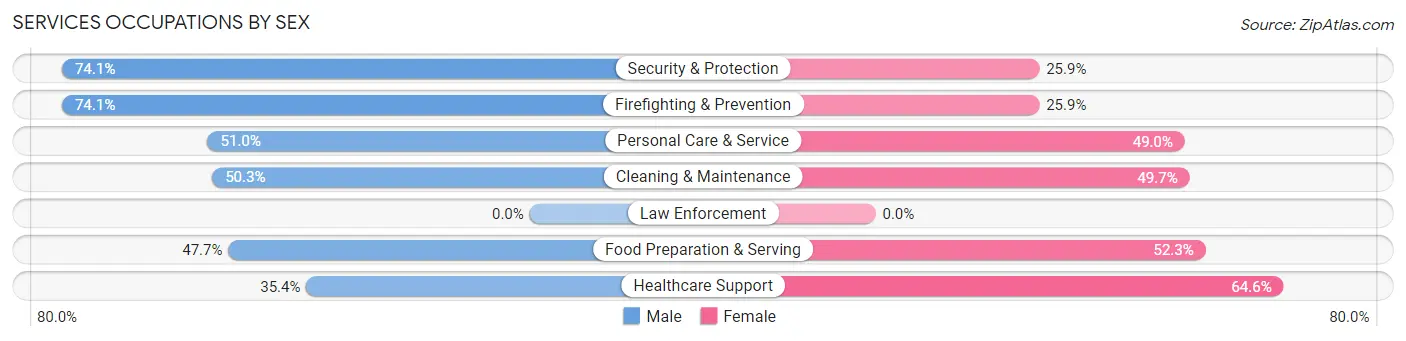
Services Occupations by Sex
Within the Services occupations in Incline Village, the most male-oriented occupations are Security & Protection (74.1%), Firefighting & Prevention (74.1%), and Personal Care & Service (51.0%), while the most female-oriented occupations are Healthcare Support (64.6%), Food Preparation & Serving (52.3%), and Cleaning & Maintenance (49.7%).
| Occupation | Male | Female |
| Healthcare Support | 23 (35.4%) | 42 (64.6%) |
| Security & Protection | 20 (74.1%) | 7 (25.9%) |
| Firefighting & Prevention | 20 (74.1%) | 7 (25.9%) |
| Law Enforcement | 0 (0.0%) | 0 (0.0%) |
| Food Preparation & Serving | 189 (47.7%) | 207 (52.3%) |
| Cleaning & Maintenance | 92 (50.3%) | 91 (49.7%) |
| Personal Care & Service | 101 (51.0%) | 97 (49.0%) |
| Total (Category) | 425 (48.9%) | 444 (51.1%) |
| Total (Overall) | 2,774 (57.6%) | 2,043 (42.4%) |
Sales and Office Occupations
The most common Sales and Office occupations in Incline Village are Office & Administration (564 | 11.7%), and Sales & Related (531 | 11.0%).
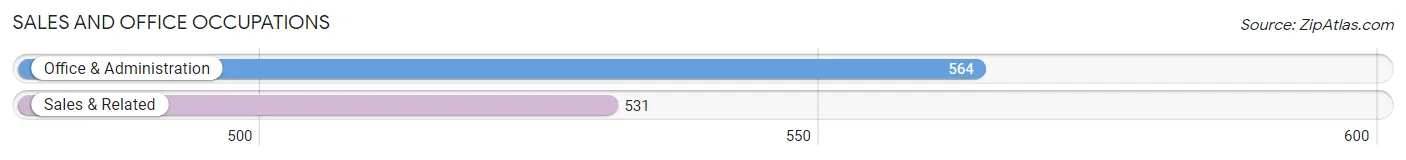
Sales and Office Occupations by Sex
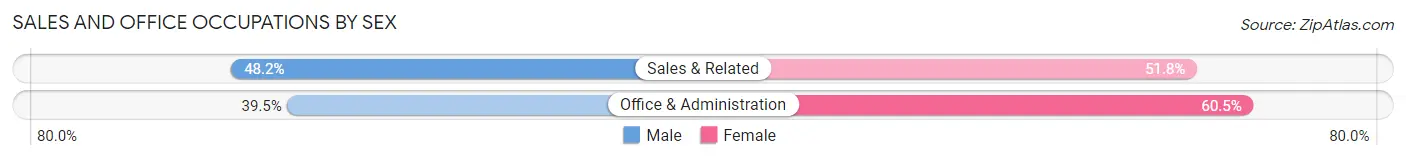
| Occupation | Male | Female |
| Sales & Related | 256 (48.2%) | 275 (51.8%) |
| Office & Administration | 223 (39.5%) | 341 (60.5%) |
| Total (Category) | 479 (43.7%) | 616 (56.3%) |
| Total (Overall) | 2,774 (57.6%) | 2,043 (42.4%) |
Natural Resources, Construction and Maintenance Occupations
The most common Natural Resources, Construction and Maintenance occupations in Incline Village are Construction & Extraction (273 | 5.7%), Installation, Maintenance & Repair (52 | 1.1%), and Farming, Fishing & Forestry (8 | 0.2%).
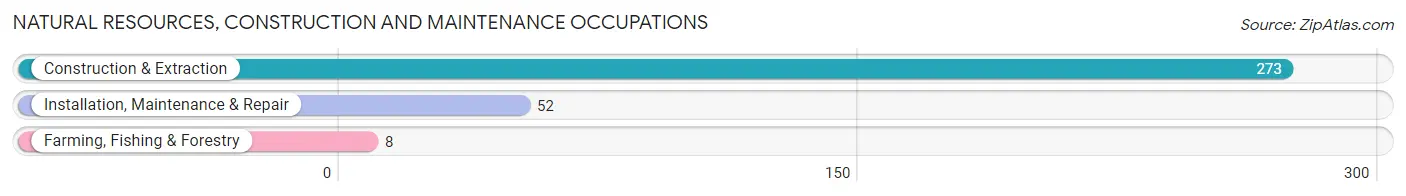
Natural Resources, Construction and Maintenance Occupations by Sex
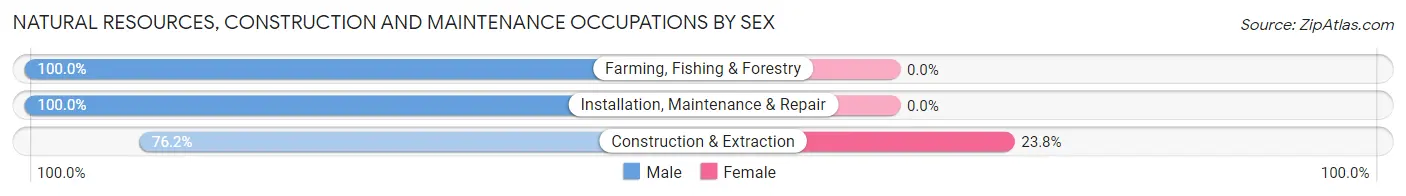
| Occupation | Male | Female |
| Farming, Fishing & Forestry | 8 (100.0%) | 0 (0.0%) |
| Construction & Extraction | 208 (76.2%) | 65 (23.8%) |
| Installation, Maintenance & Repair | 52 (100.0%) | 0 (0.0%) |
| Total (Category) | 268 (80.5%) | 65 (19.5%) |
| Total (Overall) | 2,774 (57.6%) | 2,043 (42.4%) |
Production, Transportation and Moving Occupations
The most common Production, Transportation and Moving occupations in Incline Village are Transportation (119 | 2.5%), Material Moving (89 | 1.8%), and Production (79 | 1.6%).
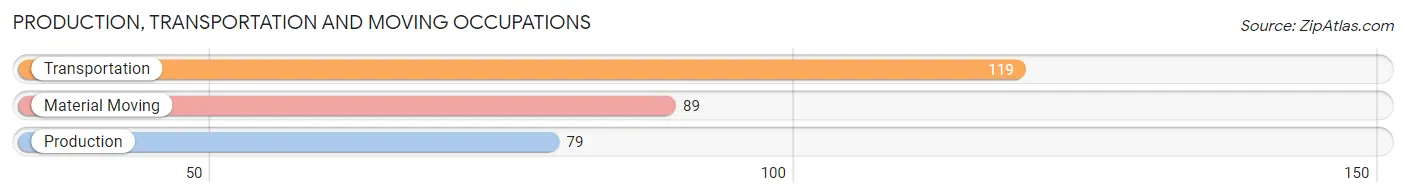
Production, Transportation and Moving Occupations by Sex
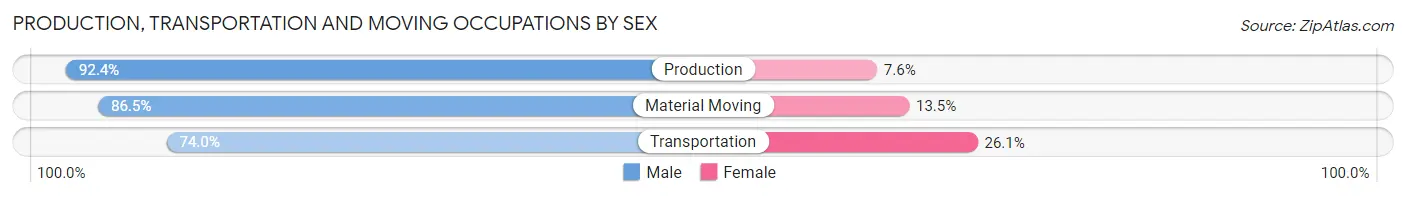
| Occupation | Male | Female |
| Production | 73 (92.4%) | 6 (7.6%) |
| Transportation | 88 (74.0%) | 31 (26.1%) |
| Material Moving | 77 (86.5%) | 12 (13.5%) |
| Total (Category) | 238 (82.9%) | 49 (17.1%) |
| Total (Overall) | 2,774 (57.6%) | 2,043 (42.4%) |
Employment Industries by Sex in Incline Village
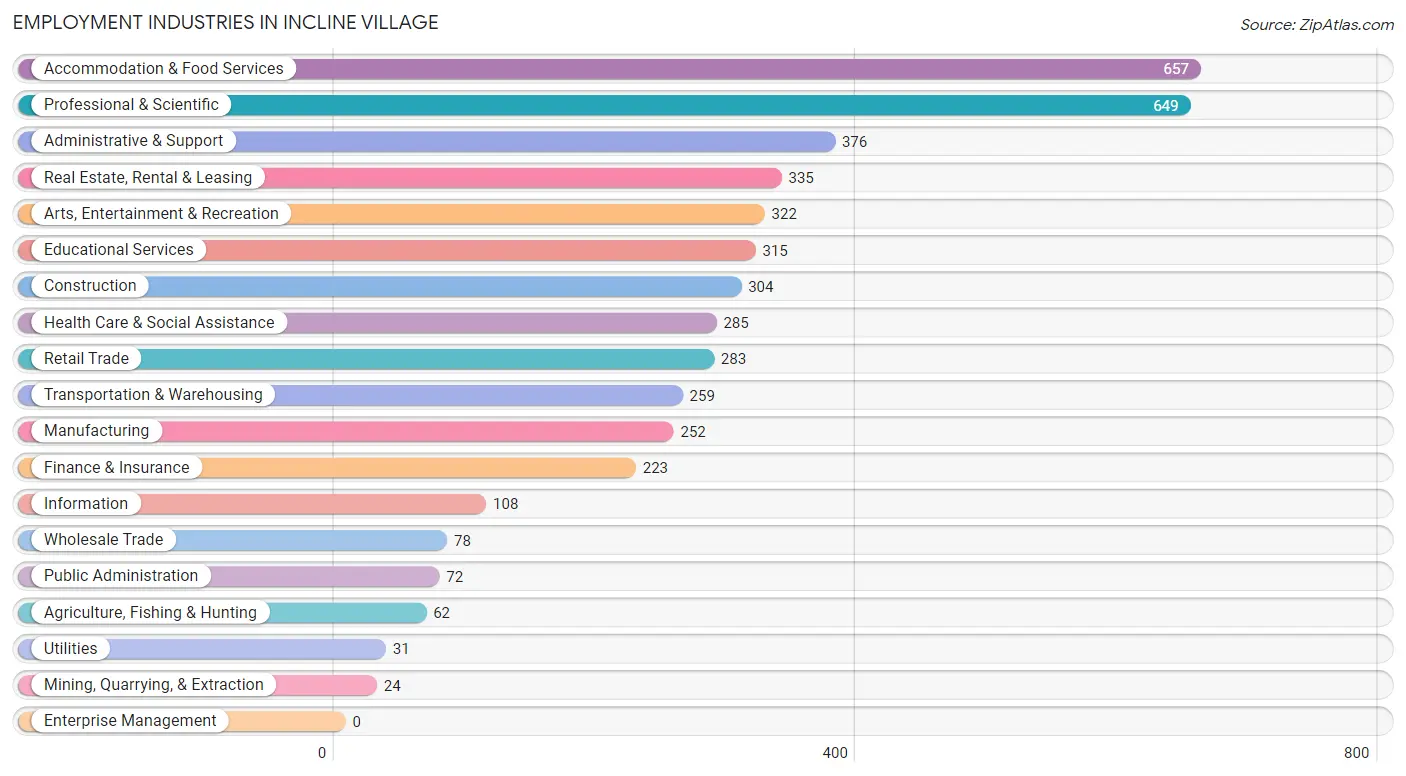
Employment Industries in Incline Village
The major employment industries in Incline Village include Accommodation & Food Services (657 | 13.6%), Professional & Scientific (649 | 13.5%), Administrative & Support (376 | 7.8%), Real Estate, Rental & Leasing (335 | 7.0%), and Arts, Entertainment & Recreation (322 | 6.7%).
Employment Industries by Sex in Incline Village
The Incline Village industries that see more men than women are Mining, Quarrying, & Extraction (100.0%), Wholesale Trade (100.0%), and Manufacturing (92.1%), whereas the industries that tend to have a higher number of women are Utilities (100.0%), Public Administration (81.9%), and Educational Services (67.3%).
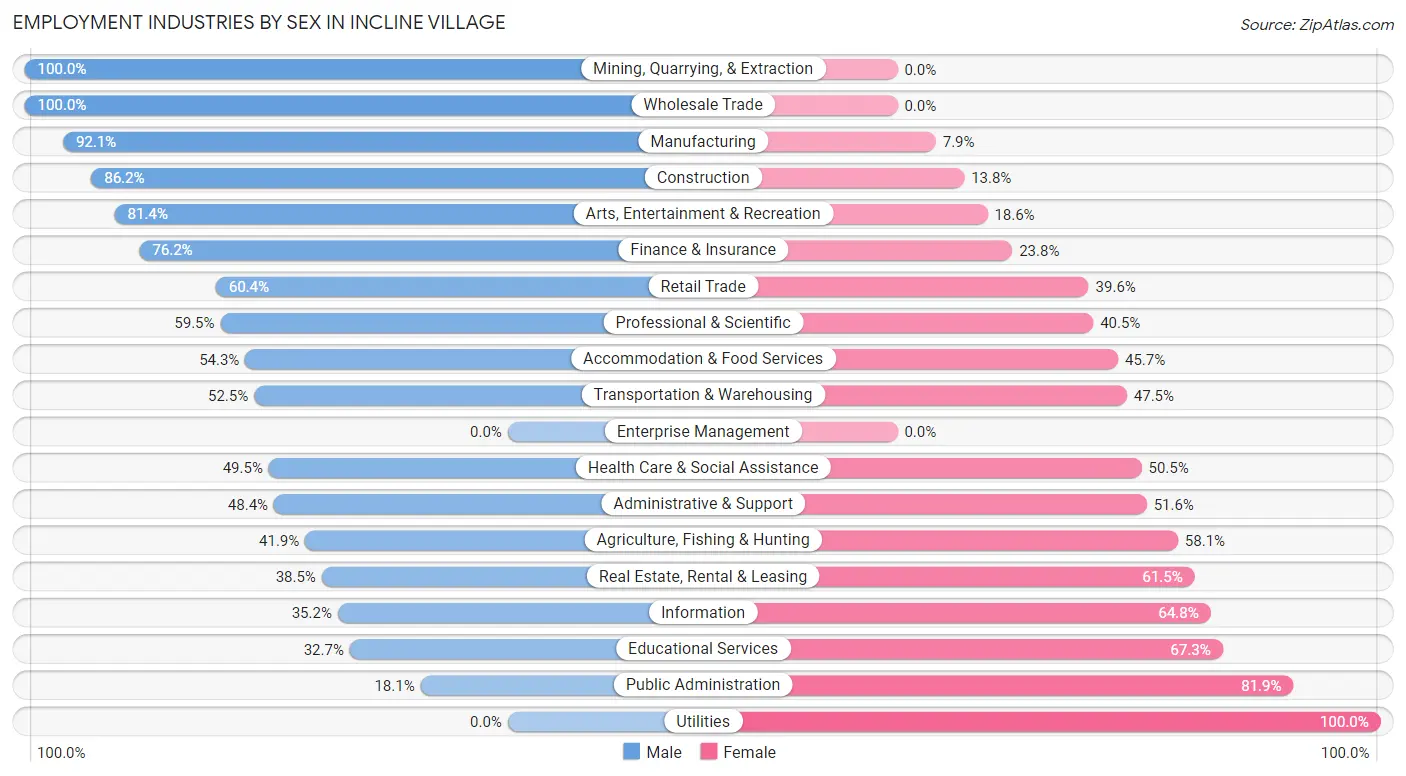
| Industry | Male | Female |
| Agriculture, Fishing & Hunting | 26 (41.9%) | 36 (58.1%) |
| Mining, Quarrying, & Extraction | 24 (100.0%) | 0 (0.0%) |
| Construction | 262 (86.2%) | 42 (13.8%) |
| Manufacturing | 232 (92.1%) | 20 (7.9%) |
| Wholesale Trade | 78 (100.0%) | 0 (0.0%) |
| Retail Trade | 171 (60.4%) | 112 (39.6%) |
| Transportation & Warehousing | 136 (52.5%) | 123 (47.5%) |
| Utilities | 0 (0.0%) | 31 (100.0%) |
| Information | 38 (35.2%) | 70 (64.8%) |
| Finance & Insurance | 170 (76.2%) | 53 (23.8%) |
| Real Estate, Rental & Leasing | 129 (38.5%) | 206 (61.5%) |
| Professional & Scientific | 386 (59.5%) | 263 (40.5%) |
| Enterprise Management | 0 (0.0%) | 0 (0.0%) |
| Administrative & Support | 182 (48.4%) | 194 (51.6%) |
| Educational Services | 103 (32.7%) | 212 (67.3%) |
| Health Care & Social Assistance | 141 (49.5%) | 144 (50.5%) |
| Arts, Entertainment & Recreation | 262 (81.4%) | 60 (18.6%) |
| Accommodation & Food Services | 357 (54.3%) | 300 (45.7%) |
| Public Administration | 13 (18.1%) | 59 (81.9%) |
| Total | 2,774 (57.6%) | 2,043 (42.4%) |
Education in Incline Village
School Enrollment in Incline Village
The most common levels of schooling among the 1,880 students in Incline Village are college / undergraduate (595 | 31.7%), elementary school (384 | 20.4%), and high school (355 | 18.9%).
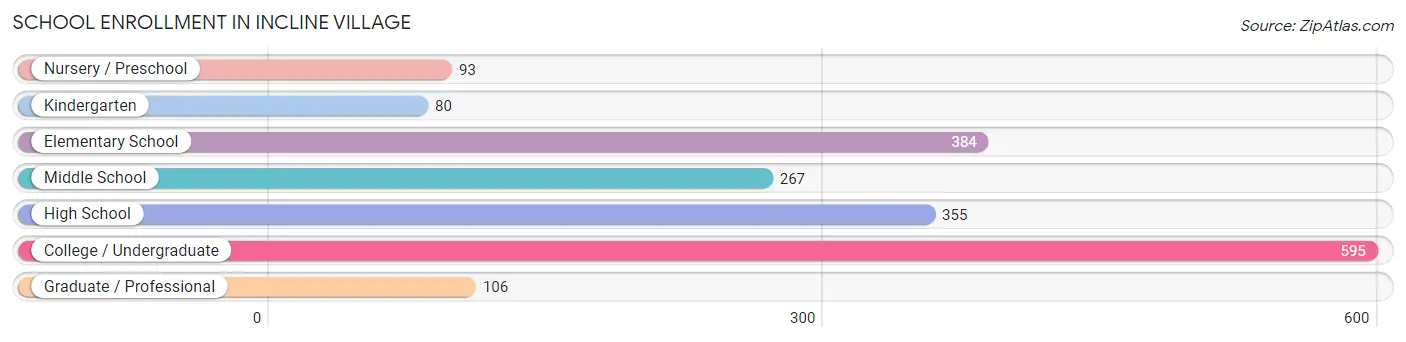
| School Level | # Students | % Students |
| Nursery / Preschool | 93 | 5.0% |
| Kindergarten | 80 | 4.3% |
| Elementary School | 384 | 20.4% |
| Middle School | 267 | 14.2% |
| High School | 355 | 18.9% |
| College / Undergraduate | 595 | 31.7% |
| Graduate / Professional | 106 | 5.6% |
| Total | 1,880 | 100.0% |
School Enrollment by Age by Funding Source in Incline Village
Out of a total of 1,880 students who are enrolled in schools in Incline Village, 682 (36.3%) attend a private institution, while the remaining 1,198 (63.7%) are enrolled in public schools. The age group of 3 to 4 year olds has the highest likelihood of being enrolled in private schools, with 75 (88.2% in the age bracket) enrolled. Conversely, the age group of 25 to 34 year olds has the lowest likelihood of being enrolled in a private school, with 168 (86.2% in the age bracket) attending a public institution.
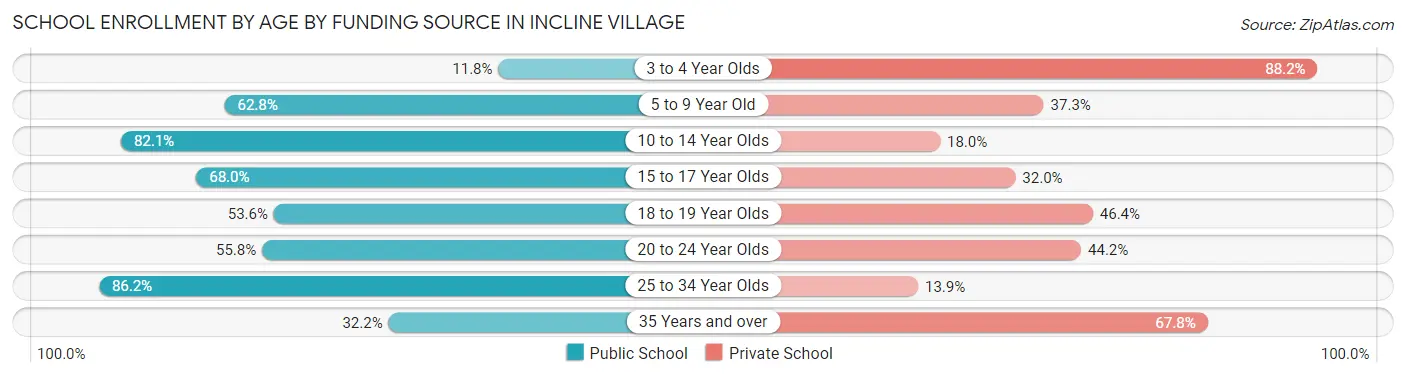
| Age Bracket | Public School | Private School |
| 3 to 4 Year Olds | 10 (11.8%) | 75 (88.2%) |
| 5 to 9 Year Old | 288 (62.7%) | 171 (37.2%) |
| 10 to 14 Year Olds | 256 (82.1%) | 56 (17.9%) |
| 15 to 17 Year Olds | 219 (68.0%) | 103 (32.0%) |
| 18 to 19 Year Olds | 112 (53.6%) | 97 (46.4%) |
| 20 to 24 Year Olds | 116 (55.8%) | 92 (44.2%) |
| 25 to 34 Year Olds | 168 (86.2%) | 27 (13.9%) |
| 35 Years and over | 29 (32.2%) | 61 (67.8%) |
| Total | 1,198 (63.7%) | 682 (36.3%) |
Educational Attainment by Field of Study in Incline Village
Business (1,357 | 29.6%), engineering (479 | 10.4%), social sciences (413 | 9.0%), education (330 | 7.2%), and bio, nature & agricultural (328 | 7.2%) are the most common fields of study among 4,584 individuals in Incline Village who have obtained a bachelor's degree or higher.
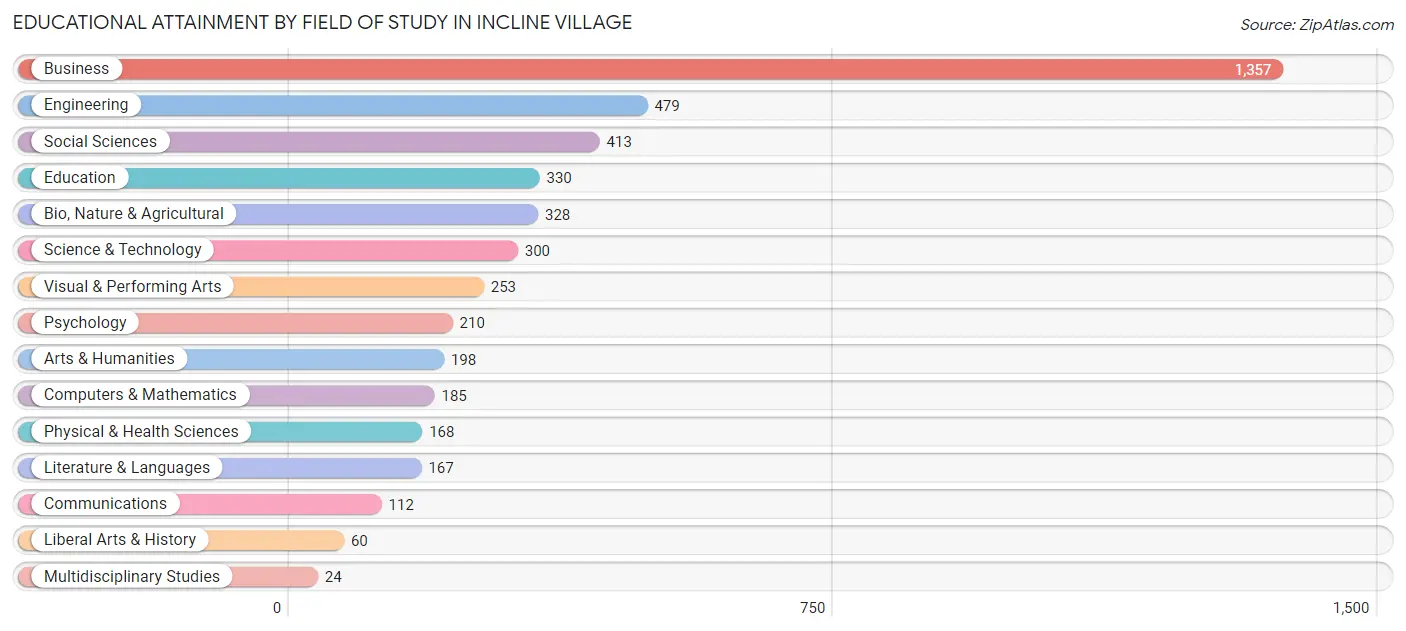
| Field of Study | # Graduates | % Graduates |
| Computers & Mathematics | 185 | 4.0% |
| Bio, Nature & Agricultural | 328 | 7.2% |
| Physical & Health Sciences | 168 | 3.7% |
| Psychology | 210 | 4.6% |
| Social Sciences | 413 | 9.0% |
| Engineering | 479 | 10.4% |
| Multidisciplinary Studies | 24 | 0.5% |
| Science & Technology | 300 | 6.5% |
| Business | 1,357 | 29.6% |
| Education | 330 | 7.2% |
| Literature & Languages | 167 | 3.6% |
| Liberal Arts & History | 60 | 1.3% |
| Visual & Performing Arts | 253 | 5.5% |
| Communications | 112 | 2.4% |
| Arts & Humanities | 198 | 4.3% |
| Total | 4,584 | 100.0% |
Transportation & Commute in Incline Village
Vehicle Availability by Sex in Incline Village
The most prevalent vehicle ownership categories in Incline Village are males with 2 vehicles (1,380, accounting for 50.7%) and females with 2 vehicles (834, making up 71.5%).
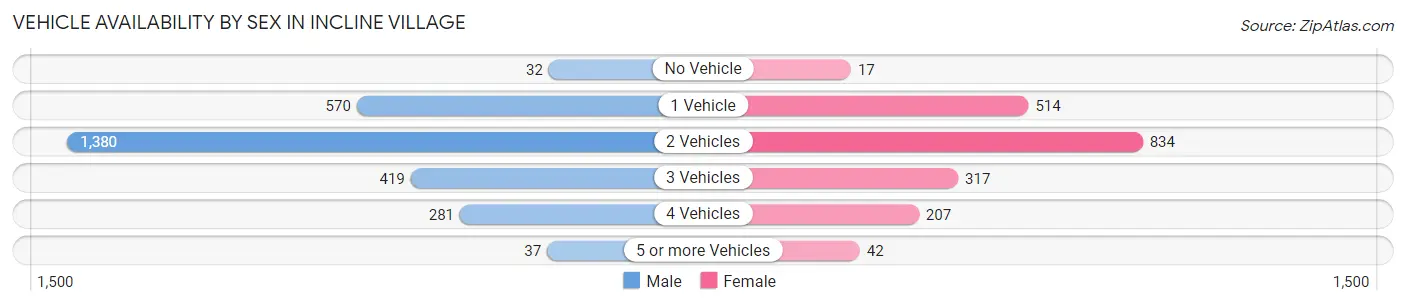
| Vehicles Available | Male | Female |
| No Vehicle | 32 (1.2%) | 17 (0.9%) |
| 1 Vehicle | 570 (21.0%) | 514 (26.6%) |
| 2 Vehicles | 1,380 (50.7%) | 834 (43.2%) |
| 3 Vehicles | 419 (15.4%) | 317 (16.4%) |
| 4 Vehicles | 281 (10.3%) | 207 (10.7%) |
| 5 or more Vehicles | 37 (1.4%) | 42 (2.2%) |
| Total | 2,719 (100.0%) | 1,931 (100.0%) |
Commute Time in Incline Village
The most frequently occuring commute durations in Incline Village are 5 to 9 minutes (826 commuters, 27.3%), less than 5 minutes (536 commuters, 17.7%), and 10 to 14 minutes (341 commuters, 11.3%).
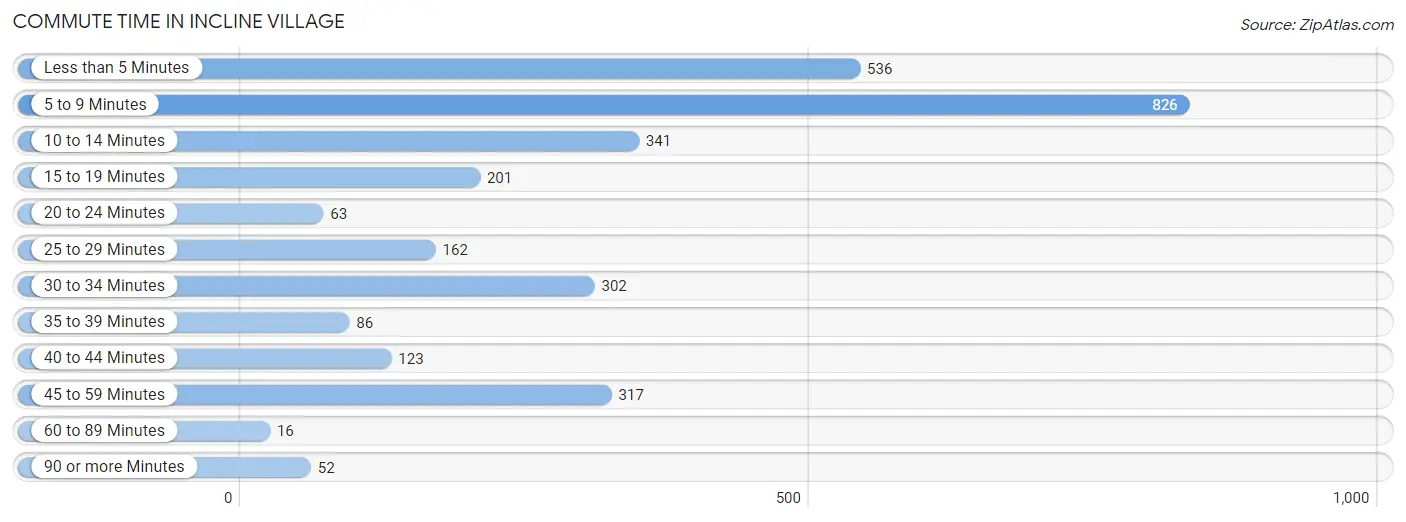
| Commute Time | # Commuters | % Commuters |
| Less than 5 Minutes | 536 | 17.7% |
| 5 to 9 Minutes | 826 | 27.3% |
| 10 to 14 Minutes | 341 | 11.3% |
| 15 to 19 Minutes | 201 | 6.6% |
| 20 to 24 Minutes | 63 | 2.1% |
| 25 to 29 Minutes | 162 | 5.4% |
| 30 to 34 Minutes | 302 | 10.0% |
| 35 to 39 Minutes | 86 | 2.8% |
| 40 to 44 Minutes | 123 | 4.1% |
| 45 to 59 Minutes | 317 | 10.5% |
| 60 to 89 Minutes | 16 | 0.5% |
| 90 or more Minutes | 52 | 1.7% |
Commute Time by Sex in Incline Village
The most common commute times in Incline Village are 5 to 9 minutes (351 commuters, 20.8%) for males and 5 to 9 minutes (475 commuters, 35.4%) for females.
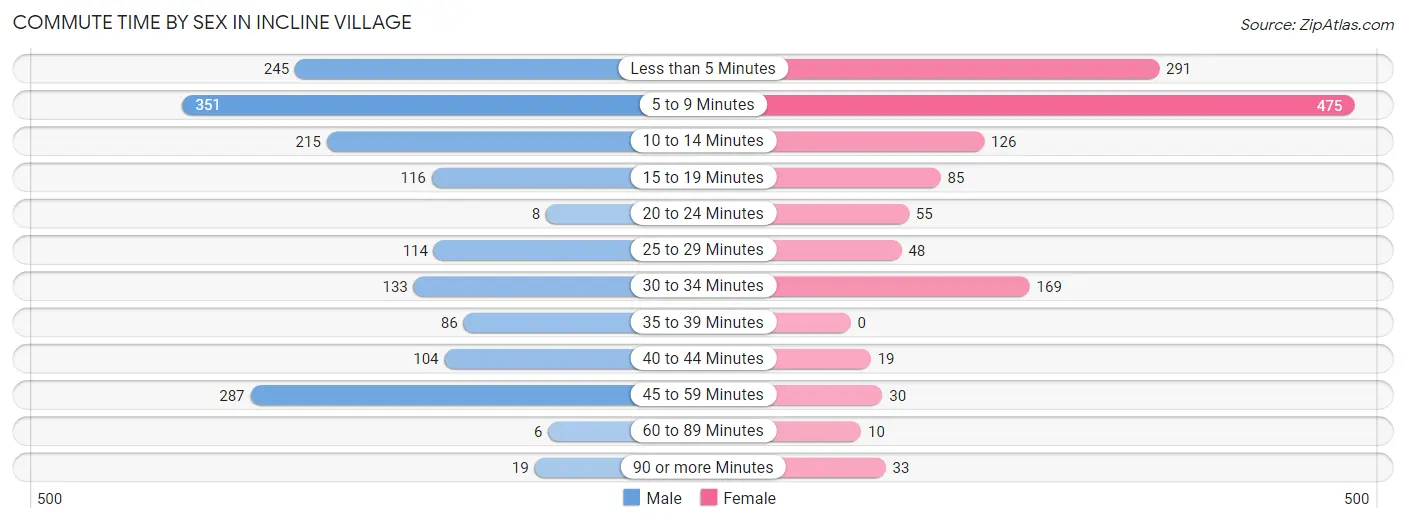
| Commute Time | Male | Female |
| Less than 5 Minutes | 245 (14.5%) | 291 (21.7%) |
| 5 to 9 Minutes | 351 (20.8%) | 475 (35.4%) |
| 10 to 14 Minutes | 215 (12.8%) | 126 (9.4%) |
| 15 to 19 Minutes | 116 (6.9%) | 85 (6.3%) |
| 20 to 24 Minutes | 8 (0.5%) | 55 (4.1%) |
| 25 to 29 Minutes | 114 (6.8%) | 48 (3.6%) |
| 30 to 34 Minutes | 133 (7.9%) | 169 (12.6%) |
| 35 to 39 Minutes | 86 (5.1%) | 0 (0.0%) |
| 40 to 44 Minutes | 104 (6.2%) | 19 (1.4%) |
| 45 to 59 Minutes | 287 (17.0%) | 30 (2.2%) |
| 60 to 89 Minutes | 6 (0.4%) | 10 (0.7%) |
| 90 or more Minutes | 19 (1.1%) | 33 (2.5%) |
Time of Departure to Work by Sex in Incline Village
The most frequent times of departure to work in Incline Village are 9:00 AM to 9:59 AM (292, 17.3%) for males and 9:00 AM to 9:59 AM (236, 17.6%) for females.
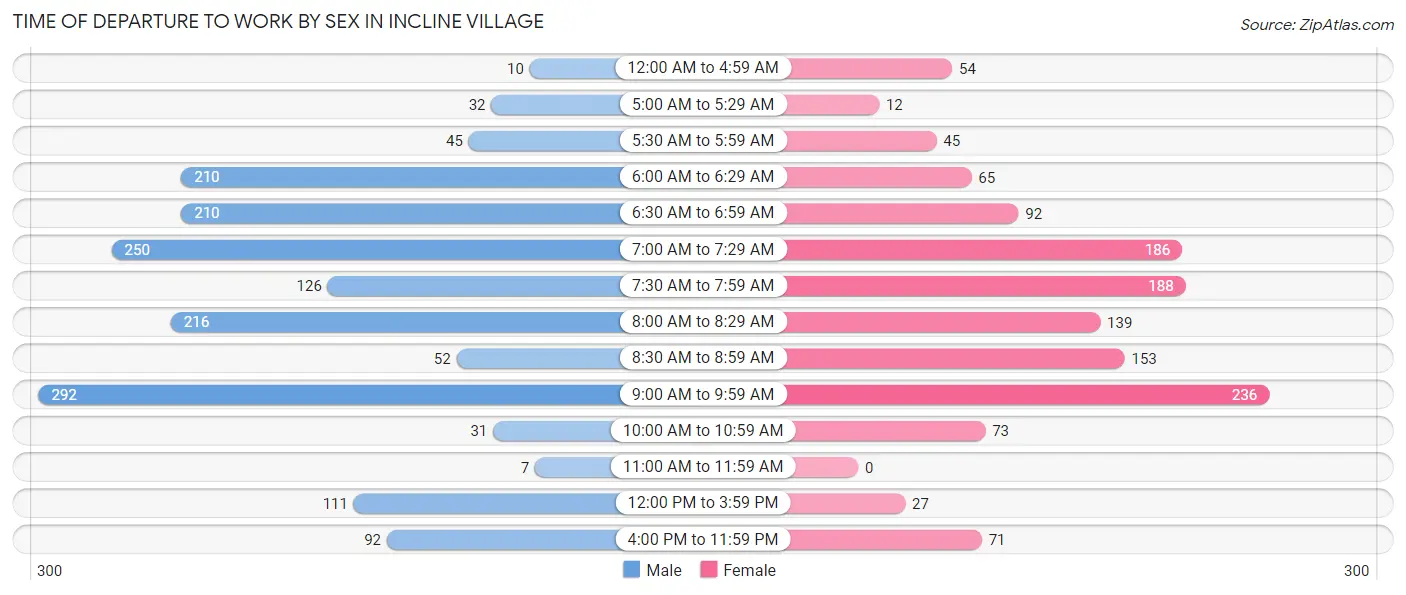
| Time of Departure | Male | Female |
| 12:00 AM to 4:59 AM | 10 (0.6%) | 54 (4.0%) |
| 5:00 AM to 5:29 AM | 32 (1.9%) | 12 (0.9%) |
| 5:30 AM to 5:59 AM | 45 (2.7%) | 45 (3.4%) |
| 6:00 AM to 6:29 AM | 210 (12.5%) | 65 (4.9%) |
| 6:30 AM to 6:59 AM | 210 (12.5%) | 92 (6.9%) |
| 7:00 AM to 7:29 AM | 250 (14.8%) | 186 (13.9%) |
| 7:30 AM to 7:59 AM | 126 (7.5%) | 188 (14.0%) |
| 8:00 AM to 8:29 AM | 216 (12.8%) | 139 (10.4%) |
| 8:30 AM to 8:59 AM | 52 (3.1%) | 153 (11.4%) |
| 9:00 AM to 9:59 AM | 292 (17.3%) | 236 (17.6%) |
| 10:00 AM to 10:59 AM | 31 (1.8%) | 73 (5.4%) |
| 11:00 AM to 11:59 AM | 7 (0.4%) | 0 (0.0%) |
| 12:00 PM to 3:59 PM | 111 (6.6%) | 27 (2.0%) |
| 4:00 PM to 11:59 PM | 92 (5.5%) | 71 (5.3%) |
| Total | 1,684 (100.0%) | 1,341 (100.0%) |
Housing Occupancy in Incline Village
Occupancy by Ownership in Incline Village
Of the total 3,925 dwellings in Incline Village, owner-occupied units account for 2,752 (70.1%), while renter-occupied units make up 1,173 (29.9%).
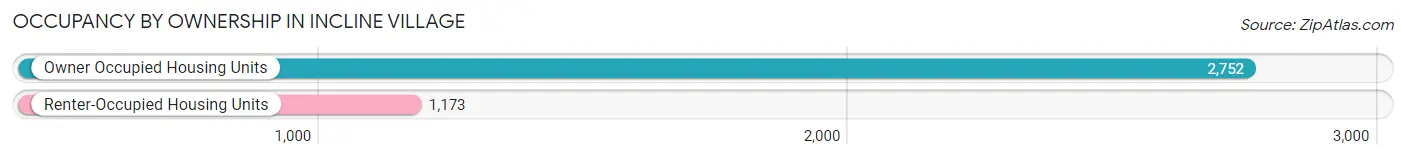
| Occupancy | # Housing Units | % Housing Units |
| Owner Occupied Housing Units | 2,752 | 70.1% |
| Renter-Occupied Housing Units | 1,173 | 29.9% |
| Total Occupied Housing Units | 3,925 | 100.0% |
Occupancy by Household Size in Incline Village
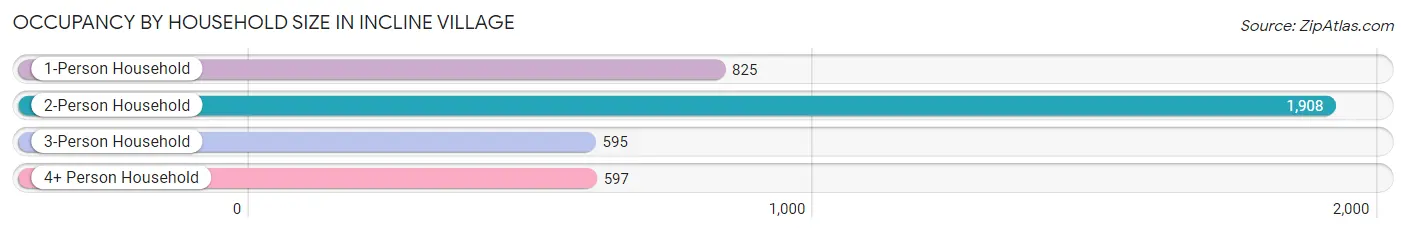
| Household Size | # Housing Units | % Housing Units |
| 1-Person Household | 825 | 21.0% |
| 2-Person Household | 1,908 | 48.6% |
| 3-Person Household | 595 | 15.2% |
| 4+ Person Household | 597 | 15.2% |
| Total Housing Units | 3,925 | 100.0% |
Occupancy by Ownership by Household Size in Incline Village
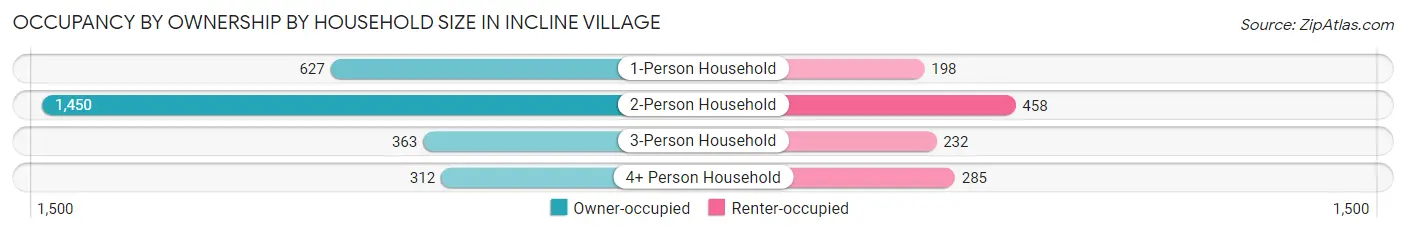
| Household Size | Owner-occupied | Renter-occupied |
| 1-Person Household | 627 (76.0%) | 198 (24.0%) |
| 2-Person Household | 1,450 (76.0%) | 458 (24.0%) |
| 3-Person Household | 363 (61.0%) | 232 (39.0%) |
| 4+ Person Household | 312 (52.3%) | 285 (47.7%) |
| Total Housing Units | 2,752 (70.1%) | 1,173 (29.9%) |
Occupancy by Educational Attainment in Incline Village
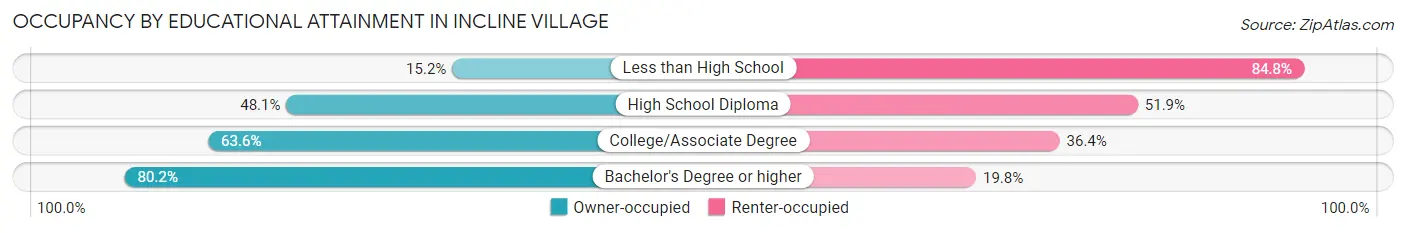
| Household Size | Owner-occupied | Renter-occupied |
| Less than High School | 39 (15.2%) | 217 (84.8%) |
| High School Diploma | 115 (48.1%) | 124 (51.9%) |
| College/Associate Degree | 586 (63.6%) | 335 (36.4%) |
| Bachelor's Degree or higher | 2,012 (80.2%) | 497 (19.8%) |
Occupancy by Age of Householder in Incline Village
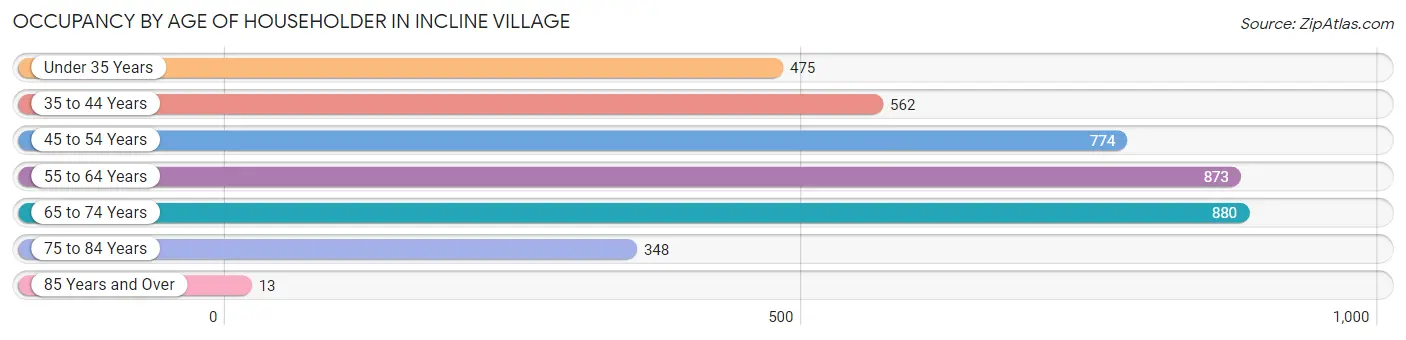
| Age Bracket | # Households | % Households |
| Under 35 Years | 475 | 12.1% |
| 35 to 44 Years | 562 | 14.3% |
| 45 to 54 Years | 774 | 19.7% |
| 55 to 64 Years | 873 | 22.2% |
| 65 to 74 Years | 880 | 22.4% |
| 75 to 84 Years | 348 | 8.9% |
| 85 Years and Over | 13 | 0.3% |
| Total | 3,925 | 100.0% |
Housing Finances in Incline Village
Median Income by Occupancy in Incline Village
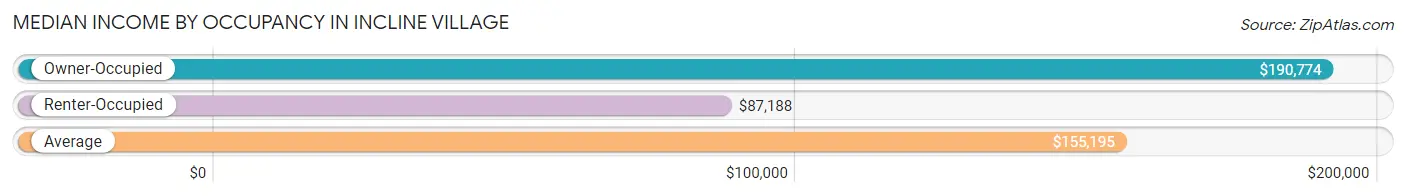
| Occupancy Type | # Households | Median Income |
| Owner-Occupied | 2,752 (70.1%) | $190,774 |
| Renter-Occupied | 1,173 (29.9%) | $87,188 |
| Average | 3,925 (100.0%) | $155,195 |
Occupancy by Householder Income Bracket in Incline Village
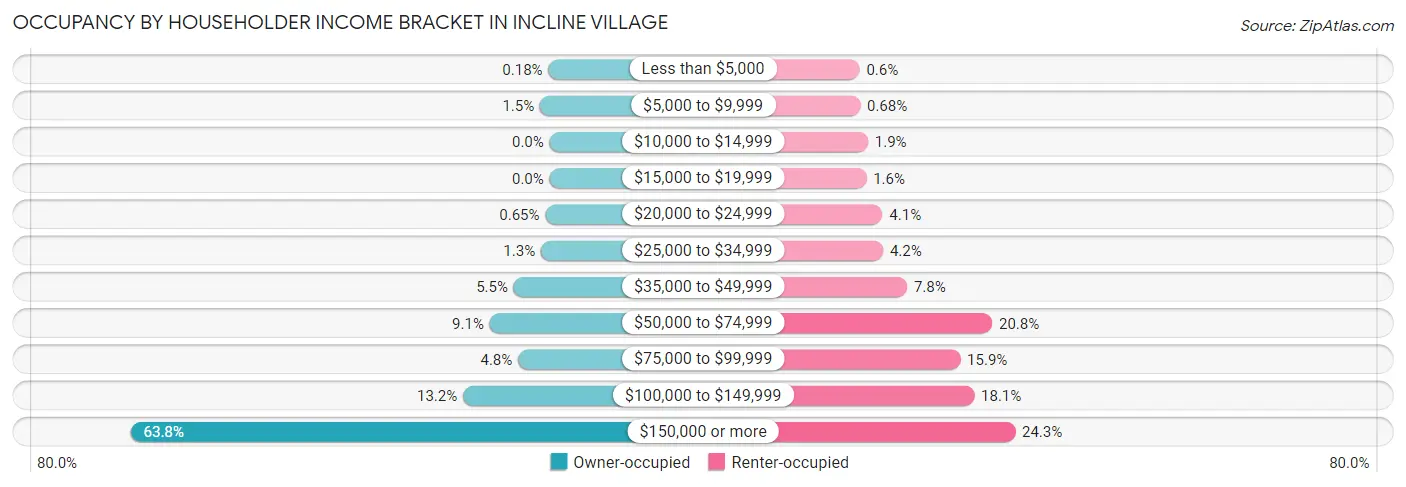
| Income Bracket | Owner-occupied | Renter-occupied |
| Less than $5,000 | 5 (0.2%) | 7 (0.6%) |
| $5,000 to $9,999 | 40 (1.5%) | 8 (0.7%) |
| $10,000 to $14,999 | 0 (0.0%) | 22 (1.9%) |
| $15,000 to $19,999 | 0 (0.0%) | 19 (1.6%) |
| $20,000 to $24,999 | 18 (0.6%) | 48 (4.1%) |
| $25,000 to $34,999 | 36 (1.3%) | 49 (4.2%) |
| $35,000 to $49,999 | 150 (5.4%) | 92 (7.8%) |
| $50,000 to $74,999 | 251 (9.1%) | 244 (20.8%) |
| $75,000 to $99,999 | 132 (4.8%) | 187 (15.9%) |
| $100,000 to $149,999 | 363 (13.2%) | 212 (18.1%) |
| $150,000 or more | 1,757 (63.8%) | 285 (24.3%) |
| Total | 2,752 (100.0%) | 1,173 (100.0%) |
Monthly Housing Cost Tiers in Incline Village
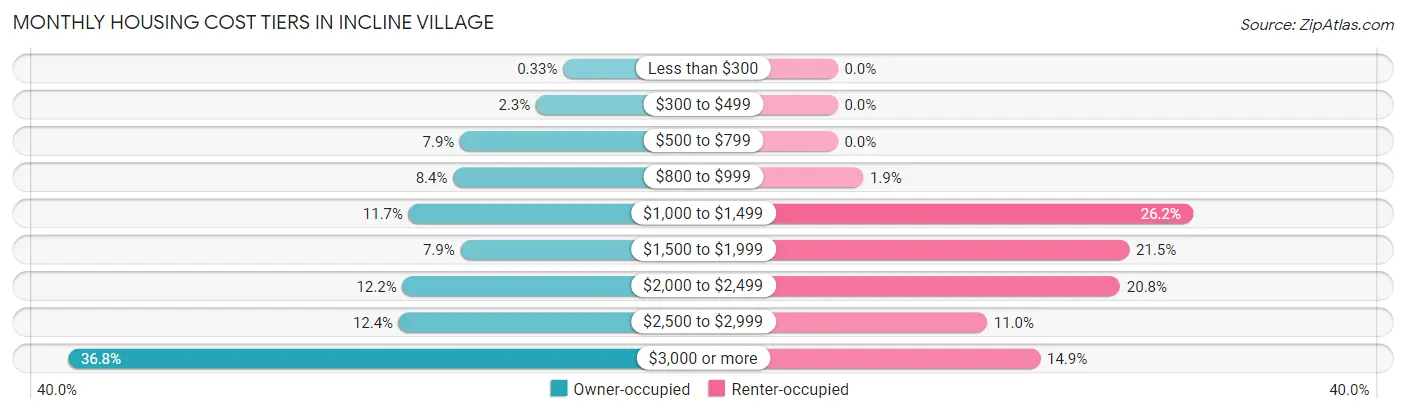
| Monthly Cost | Owner-occupied | Renter-occupied |
| Less than $300 | 9 (0.3%) | 0 (0.0%) |
| $300 to $499 | 64 (2.3%) | 0 (0.0%) |
| $500 to $799 | 218 (7.9%) | 0 (0.0%) |
| $800 to $999 | 232 (8.4%) | 22 (1.9%) |
| $1,000 to $1,499 | 322 (11.7%) | 307 (26.2%) |
| $1,500 to $1,999 | 217 (7.9%) | 252 (21.5%) |
| $2,000 to $2,499 | 335 (12.2%) | 244 (20.8%) |
| $2,500 to $2,999 | 342 (12.4%) | 129 (11.0%) |
| $3,000 or more | 1,013 (36.8%) | 175 (14.9%) |
| Total | 2,752 (100.0%) | 1,173 (100.0%) |
Physical Housing Characteristics in Incline Village
Housing Structures in Incline Village
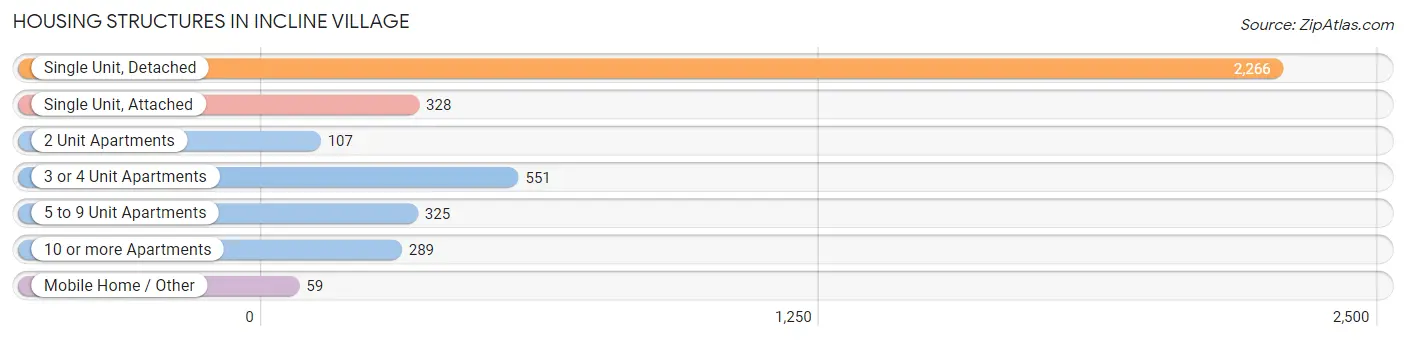
| Structure Type | # Housing Units | % Housing Units |
| Single Unit, Detached | 2,266 | 57.7% |
| Single Unit, Attached | 328 | 8.4% |
| 2 Unit Apartments | 107 | 2.7% |
| 3 or 4 Unit Apartments | 551 | 14.0% |
| 5 to 9 Unit Apartments | 325 | 8.3% |
| 10 or more Apartments | 289 | 7.4% |
| Mobile Home / Other | 59 | 1.5% |
| Total | 3,925 | 100.0% |
Housing Structures by Occupancy in Incline Village
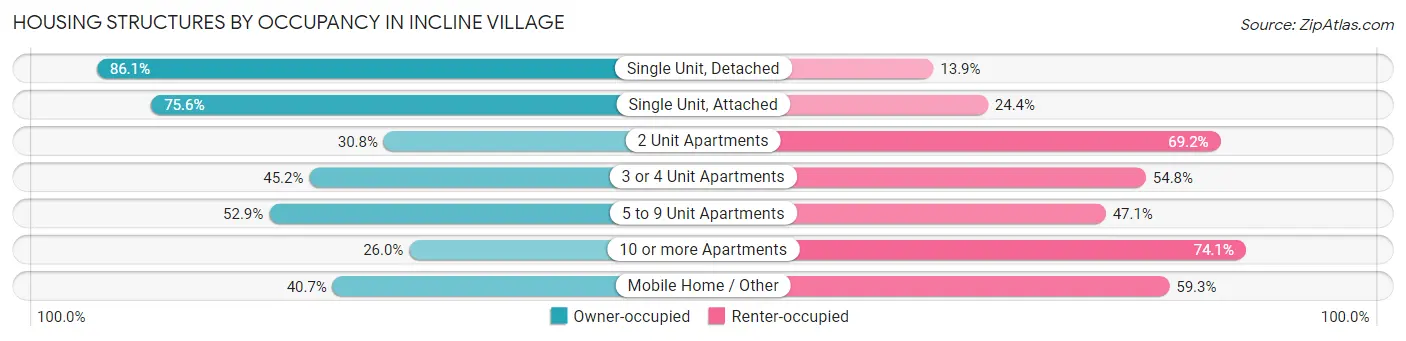
| Structure Type | Owner-occupied | Renter-occupied |
| Single Unit, Detached | 1,951 (86.1%) | 315 (13.9%) |
| Single Unit, Attached | 248 (75.6%) | 80 (24.4%) |
| 2 Unit Apartments | 33 (30.8%) | 74 (69.2%) |
| 3 or 4 Unit Apartments | 249 (45.2%) | 302 (54.8%) |
| 5 to 9 Unit Apartments | 172 (52.9%) | 153 (47.1%) |
| 10 or more Apartments | 75 (26.0%) | 214 (74.1%) |
| Mobile Home / Other | 24 (40.7%) | 35 (59.3%) |
| Total | 2,752 (70.1%) | 1,173 (29.9%) |
Housing Structures by Number of Rooms in Incline Village
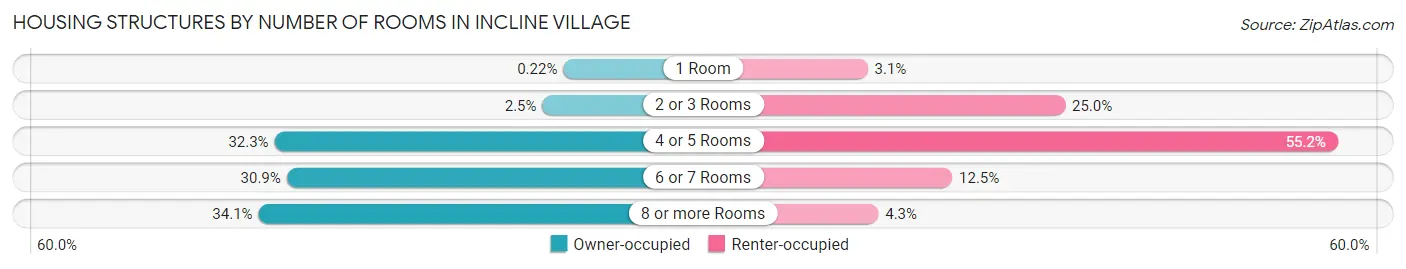
| Number of Rooms | Owner-occupied | Renter-occupied |
| 1 Room | 6 (0.2%) | 36 (3.1%) |
| 2 or 3 Rooms | 70 (2.5%) | 293 (25.0%) |
| 4 or 5 Rooms | 888 (32.3%) | 648 (55.2%) |
| 6 or 7 Rooms | 851 (30.9%) | 146 (12.4%) |
| 8 or more Rooms | 937 (34.1%) | 50 (4.3%) |
| Total | 2,752 (100.0%) | 1,173 (100.0%) |
Housing Structure by Heating Type in Incline Village
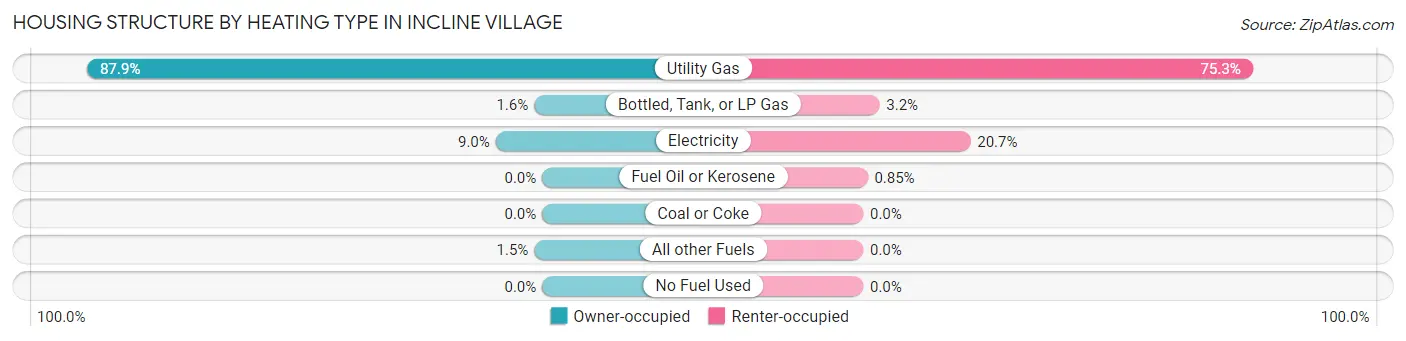
| Heating Type | Owner-occupied | Renter-occupied |
| Utility Gas | 2,420 (87.9%) | 883 (75.3%) |
| Bottled, Tank, or LP Gas | 43 (1.6%) | 37 (3.2%) |
| Electricity | 247 (9.0%) | 243 (20.7%) |
| Fuel Oil or Kerosene | 0 (0.0%) | 10 (0.9%) |
| Coal or Coke | 0 (0.0%) | 0 (0.0%) |
| All other Fuels | 42 (1.5%) | 0 (0.0%) |
| No Fuel Used | 0 (0.0%) | 0 (0.0%) |
| Total | 2,752 (100.0%) | 1,173 (100.0%) |
Household Vehicle Usage in Incline Village
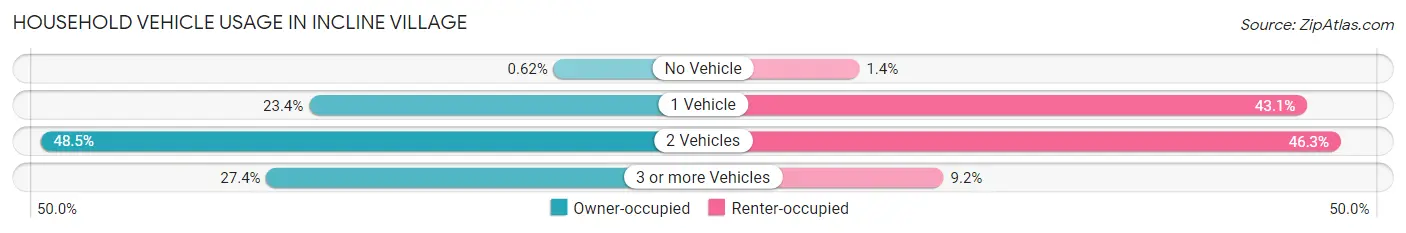
| Vehicles per Household | Owner-occupied | Renter-occupied |
| No Vehicle | 17 (0.6%) | 16 (1.4%) |
| 1 Vehicle | 645 (23.4%) | 506 (43.1%) |
| 2 Vehicles | 1,335 (48.5%) | 543 (46.3%) |
| 3 or more Vehicles | 755 (27.4%) | 108 (9.2%) |
| Total | 2,752 (100.0%) | 1,173 (100.0%) |
Real Estate & Mortgages in Incline Village
Real Estate and Mortgage Overview in Incline Village
| Characteristic | Without Mortgage | With Mortgage |
| Housing Units | 1,135 | 1,617 |
| Median Property Value | $1,363,300 | $1,102,300 |
| Median Household Income | $192,036 | $1,042 |
| Monthly Housing Costs | $1,120 | $942 |
| Real Estate Taxes | $7,120 | $62 |
Property Value by Mortgage Status in Incline Village
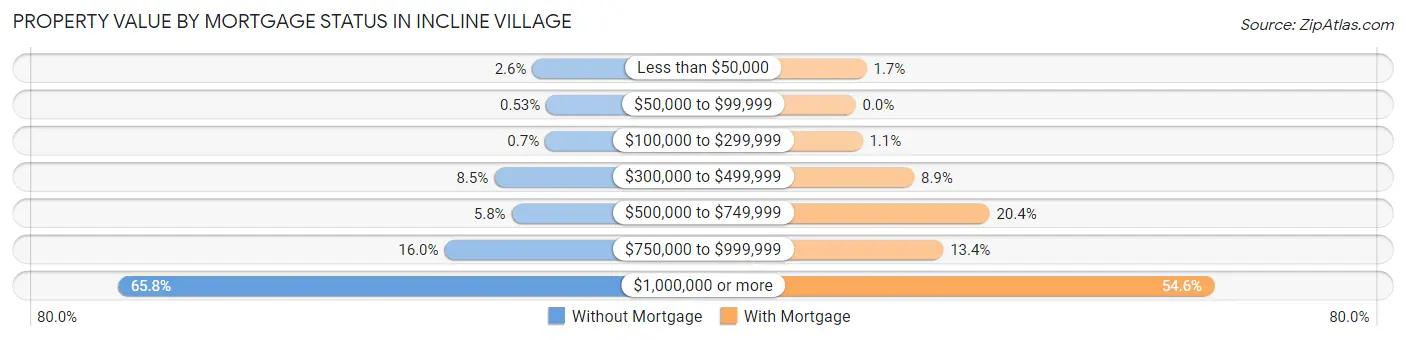
| Property Value | Without Mortgage | With Mortgage |
| Less than $50,000 | 30 (2.6%) | 27 (1.7%) |
| $50,000 to $99,999 | 6 (0.5%) | 0 (0.0%) |
| $100,000 to $299,999 | 8 (0.7%) | 17 (1.1%) |
| $300,000 to $499,999 | 96 (8.5%) | 144 (8.9%) |
| $500,000 to $749,999 | 66 (5.8%) | 330 (20.4%) |
| $750,000 to $999,999 | 182 (16.0%) | 216 (13.4%) |
| $1,000,000 or more | 747 (65.8%) | 883 (54.6%) |
| Total | 1,135 (100.0%) | 1,617 (100.0%) |
Household Income by Mortgage Status in Incline Village
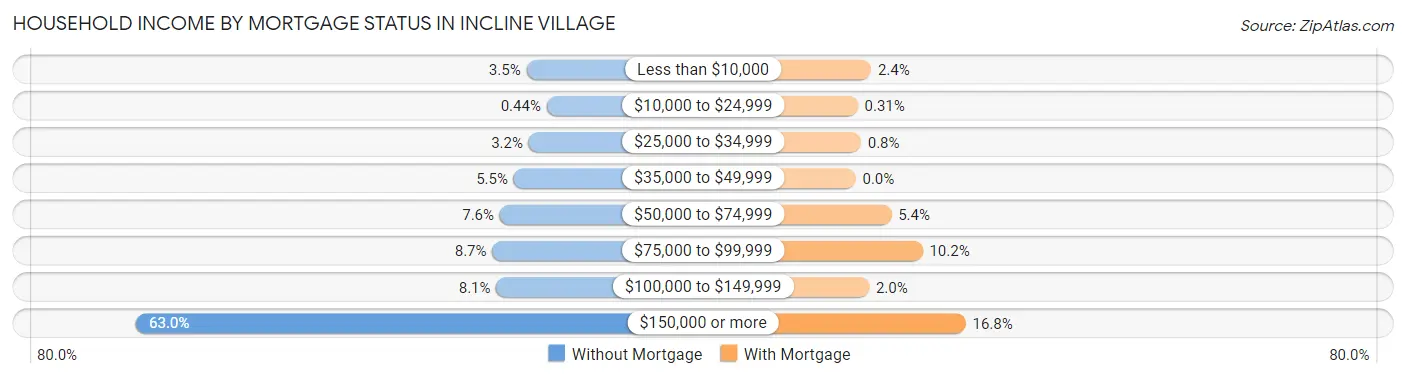
| Household Income | Without Mortgage | With Mortgage |
| Less than $10,000 | 40 (3.5%) | 38 (2.4%) |
| $10,000 to $24,999 | 5 (0.4%) | 5 (0.3%) |
| $25,000 to $34,999 | 36 (3.2%) | 13 (0.8%) |
| $35,000 to $49,999 | 62 (5.5%) | 0 (0.0%) |
| $50,000 to $74,999 | 86 (7.6%) | 88 (5.4%) |
| $75,000 to $99,999 | 99 (8.7%) | 165 (10.2%) |
| $100,000 to $149,999 | 92 (8.1%) | 33 (2.0%) |
| $150,000 or more | 715 (63.0%) | 271 (16.8%) |
| Total | 1,135 (100.0%) | 1,617 (100.0%) |
Property Value to Household Income Ratio in Incline Village
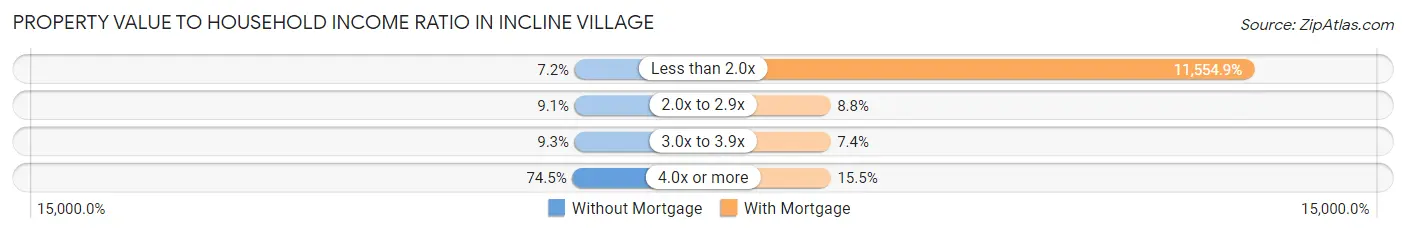
| Value-to-Income Ratio | Without Mortgage | With Mortgage |
| Less than 2.0x | 82 (7.2%) | 186,843 (11,554.9%) |
| 2.0x to 2.9x | 103 (9.1%) | 143 (8.8%) |
| 3.0x to 3.9x | 105 (9.2%) | 120 (7.4%) |
| 4.0x or more | 845 (74.5%) | 250 (15.5%) |
| Total | 1,135 (100.0%) | 1,617 (100.0%) |
Real Estate Taxes by Mortgage Status in Incline Village
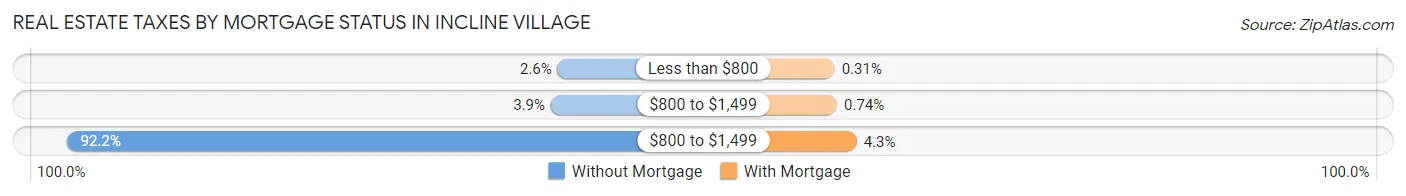
| Property Taxes | Without Mortgage | With Mortgage |
| Less than $800 | 30 (2.6%) | 5 (0.3%) |
| $800 to $1,499 | 44 (3.9%) | 12 (0.7%) |
| $800 to $1,499 | 1,046 (92.2%) | 70 (4.3%) |
| Total | 1,135 (100.0%) | 1,617 (100.0%) |
Health & Disability in Incline Village
Health Insurance Coverage by Age in Incline Village
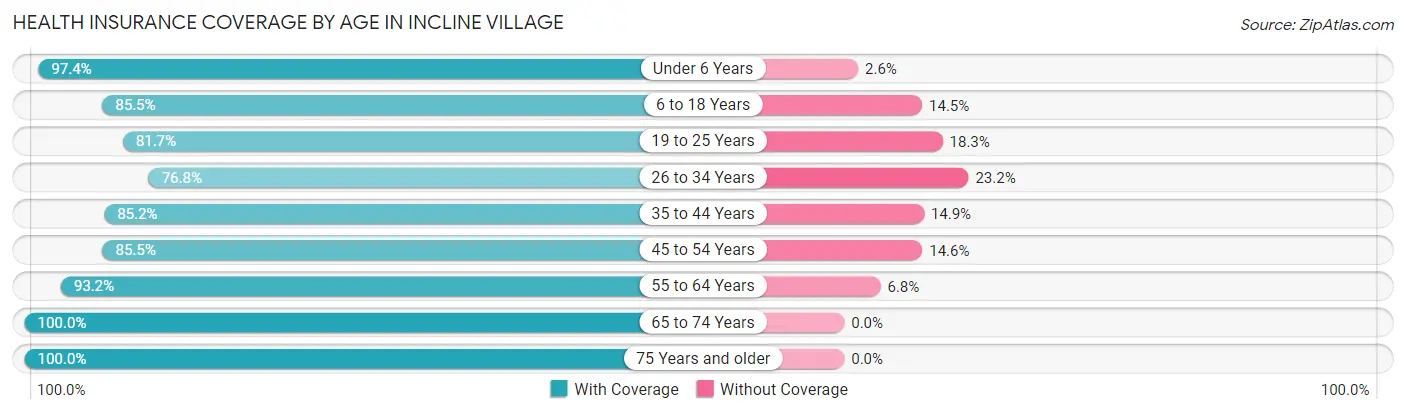
| Age Bracket | With Coverage | Without Coverage |
| Under 6 Years | 378 (97.4%) | 10 (2.6%) |
| 6 to 18 Years | 1,025 (85.5%) | 174 (14.5%) |
| 19 to 25 Years | 539 (81.7%) | 121 (18.3%) |
| 26 to 34 Years | 700 (76.8%) | 211 (23.2%) |
| 35 to 44 Years | 963 (85.2%) | 168 (14.8%) |
| 45 to 54 Years | 1,069 (85.5%) | 182 (14.5%) |
| 55 to 64 Years | 1,463 (93.2%) | 106 (6.8%) |
| 65 to 74 Years | 1,459 (100.0%) | 0 (0.0%) |
| 75 Years and older | 573 (100.0%) | 0 (0.0%) |
| Total | 8,169 (89.4%) | 972 (10.6%) |
Health Insurance Coverage by Citizenship Status in Incline Village
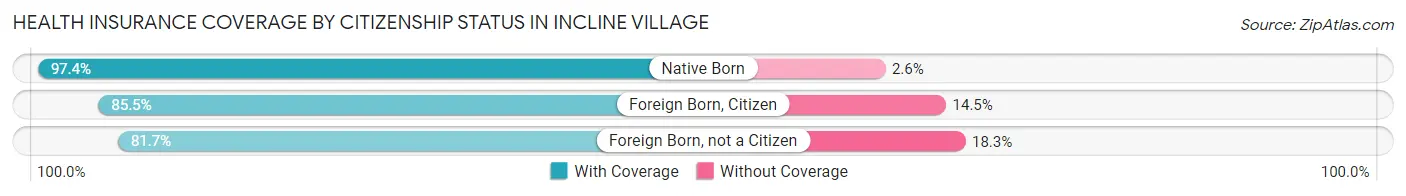
| Citizenship Status | With Coverage | Without Coverage |
| Native Born | 378 (97.4%) | 10 (2.6%) |
| Foreign Born, Citizen | 1,025 (85.5%) | 174 (14.5%) |
| Foreign Born, not a Citizen | 539 (81.7%) | 121 (18.3%) |
Health Insurance Coverage by Household Income in Incline Village
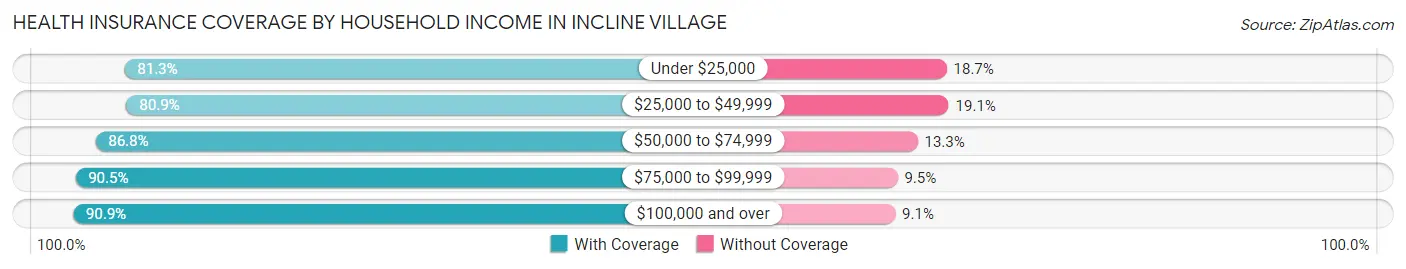
| Household Income | With Coverage | Without Coverage |
| Under $25,000 | 313 (81.3%) | 72 (18.7%) |
| $25,000 to $49,999 | 636 (80.9%) | 150 (19.1%) |
| $50,000 to $74,999 | 884 (86.8%) | 135 (13.3%) |
| $75,000 to $99,999 | 582 (90.5%) | 61 (9.5%) |
| $100,000 and over | 5,558 (90.9%) | 554 (9.1%) |
Public vs Private Health Insurance Coverage by Age in Incline Village
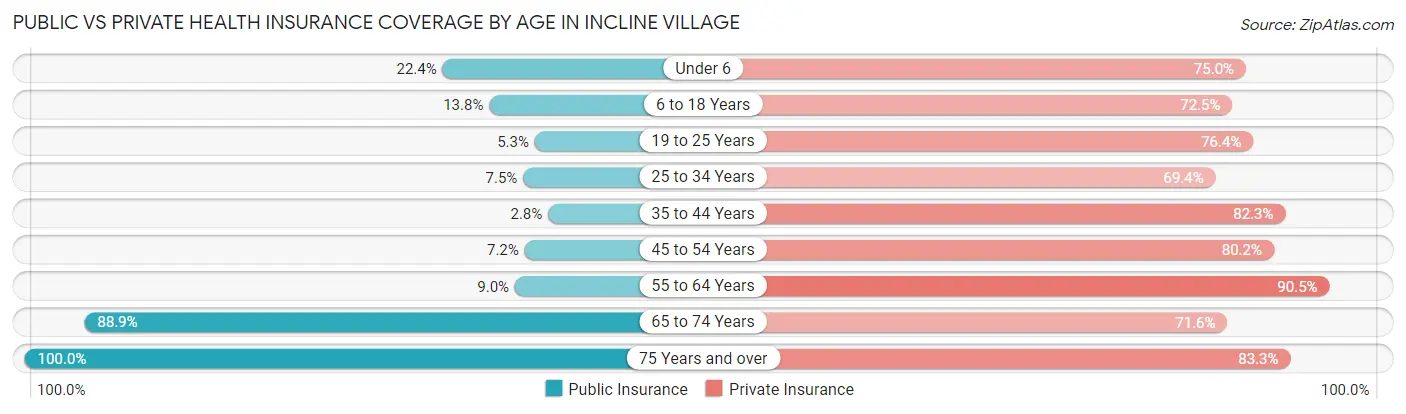
| Age Bracket | Public Insurance | Private Insurance |
| Under 6 | 87 (22.4%) | 291 (75.0%) |
| 6 to 18 Years | 165 (13.8%) | 869 (72.5%) |
| 19 to 25 Years | 35 (5.3%) | 504 (76.4%) |
| 25 to 34 Years | 68 (7.5%) | 632 (69.4%) |
| 35 to 44 Years | 32 (2.8%) | 931 (82.3%) |
| 45 to 54 Years | 90 (7.2%) | 1,003 (80.2%) |
| 55 to 64 Years | 141 (9.0%) | 1,420 (90.5%) |
| 65 to 74 Years | 1,297 (88.9%) | 1,044 (71.6%) |
| 75 Years and over | 573 (100.0%) | 477 (83.3%) |
| Total | 2,488 (27.2%) | 7,171 (78.4%) |
Disability Status by Sex by Age in Incline Village
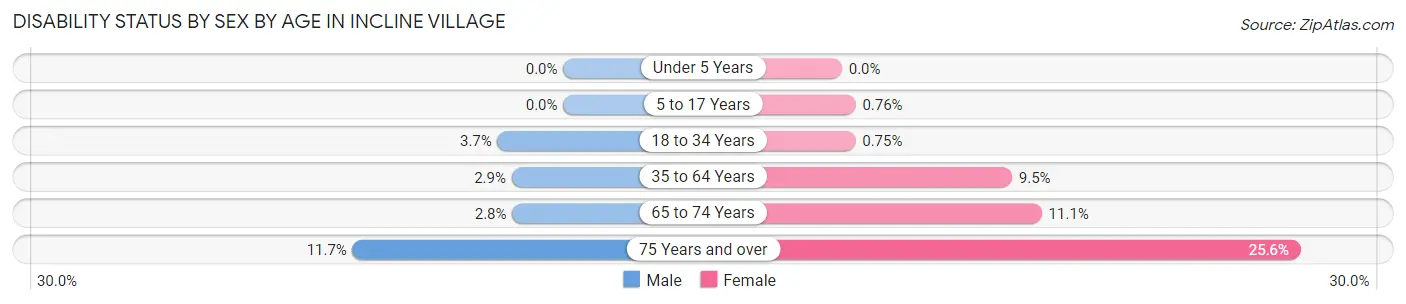
| Age Bracket | Male | Female |
| Under 5 Years | 0 (0.0%) | 0 (0.0%) |
| 5 to 17 Years | 0 (0.0%) | 4 (0.8%) |
| 18 to 34 Years | 32 (3.7%) | 6 (0.7%) |
| 35 to 64 Years | 58 (2.9%) | 183 (9.5%) |
| 65 to 74 Years | 21 (2.8%) | 80 (11.1%) |
| 75 Years and over | 36 (11.7%) | 68 (25.6%) |
Disability Class by Sex by Age in Incline Village
Disability Class: Hearing Difficulty
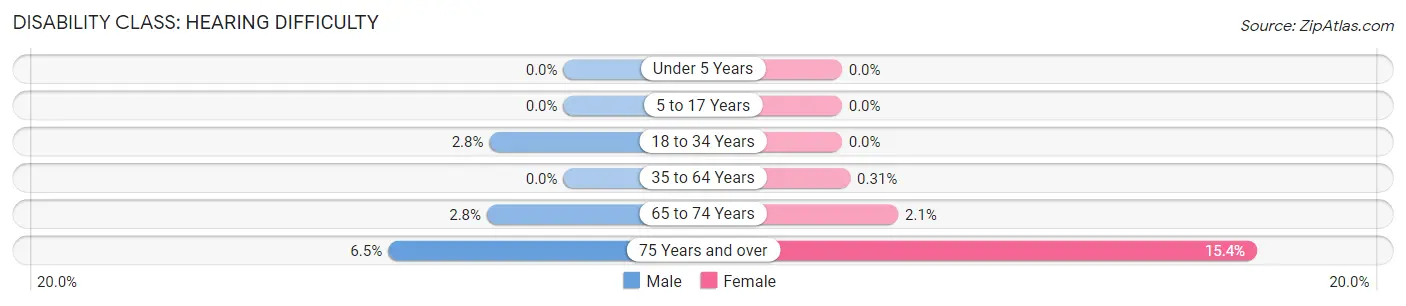
| Age Bracket | Male | Female |
| Under 5 Years | 0 (0.0%) | 0 (0.0%) |
| 5 to 17 Years | 0 (0.0%) | 0 (0.0%) |
| 18 to 34 Years | 24 (2.8%) | 0 (0.0%) |
| 35 to 64 Years | 0 (0.0%) | 6 (0.3%) |
| 65 to 74 Years | 21 (2.8%) | 15 (2.1%) |
| 75 Years and over | 20 (6.5%) | 41 (15.4%) |
Disability Class: Vision Difficulty
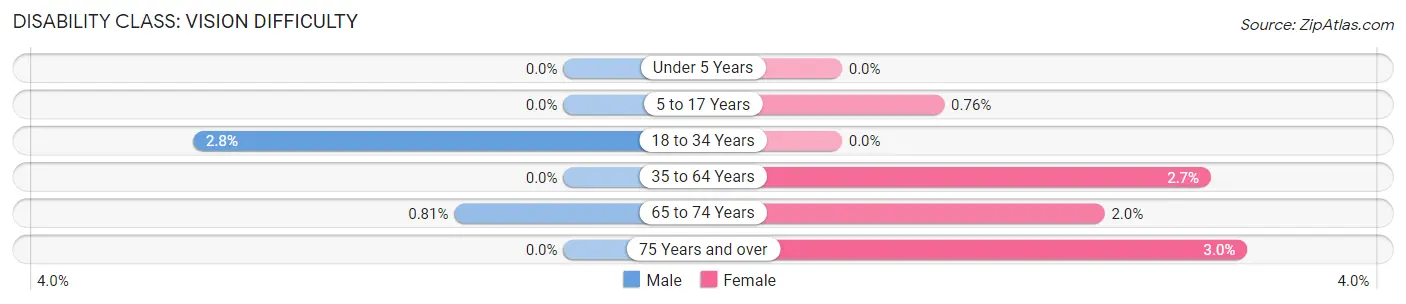
| Age Bracket | Male | Female |
| Under 5 Years | 0 (0.0%) | 0 (0.0%) |
| 5 to 17 Years | 0 (0.0%) | 4 (0.8%) |
| 18 to 34 Years | 24 (2.8%) | 0 (0.0%) |
| 35 to 64 Years | 0 (0.0%) | 53 (2.7%) |
| 65 to 74 Years | 6 (0.8%) | 14 (1.9%) |
| 75 Years and over | 0 (0.0%) | 8 (3.0%) |
Disability Class: Cognitive Difficulty
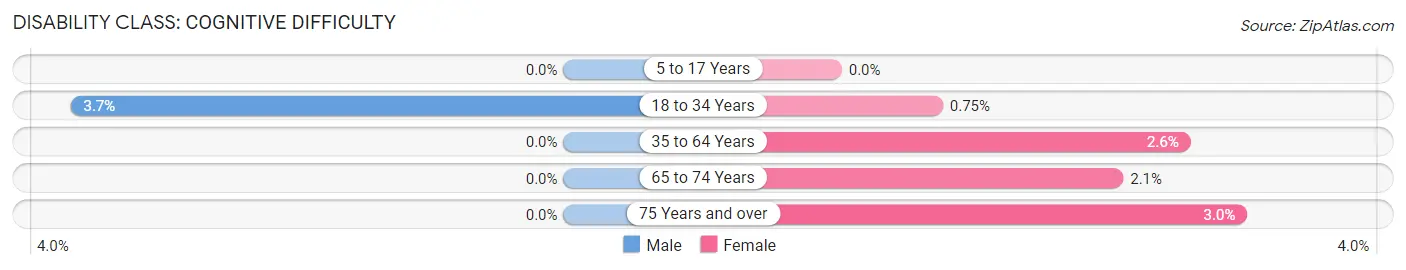
| Age Bracket | Male | Female |
| 5 to 17 Years | 0 (0.0%) | 0 (0.0%) |
| 18 to 34 Years | 32 (3.7%) | 6 (0.7%) |
| 35 to 64 Years | 0 (0.0%) | 50 (2.6%) |
| 65 to 74 Years | 0 (0.0%) | 15 (2.1%) |
| 75 Years and over | 0 (0.0%) | 8 (3.0%) |
Disability Class: Ambulatory Difficulty
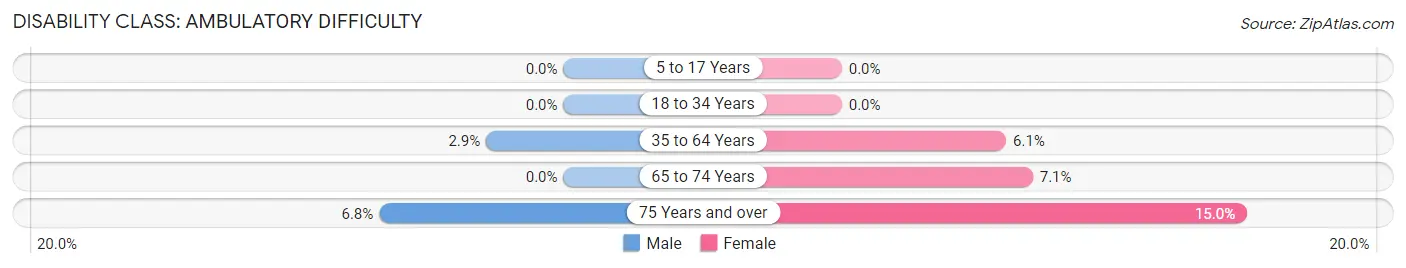
| Age Bracket | Male | Female |
| 5 to 17 Years | 0 (0.0%) | 0 (0.0%) |
| 18 to 34 Years | 0 (0.0%) | 0 (0.0%) |
| 35 to 64 Years | 58 (2.9%) | 118 (6.1%) |
| 65 to 74 Years | 0 (0.0%) | 51 (7.1%) |
| 75 Years and over | 21 (6.8%) | 40 (15.0%) |
Disability Class: Self-Care Difficulty
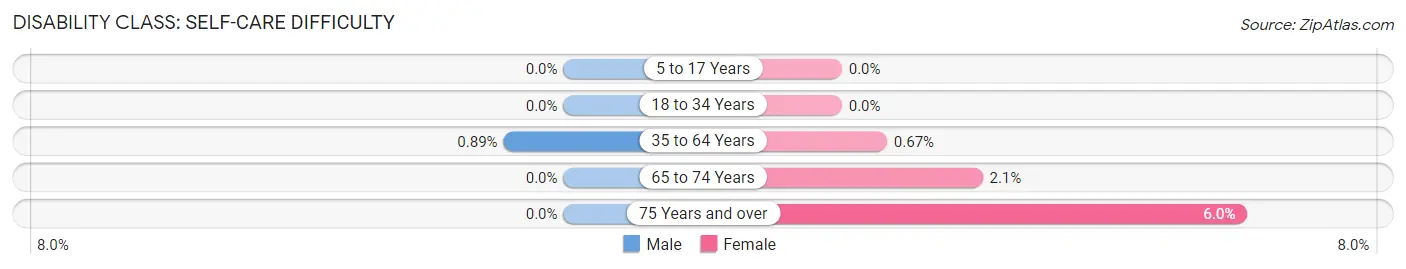
| Age Bracket | Male | Female |
| 5 to 17 Years | 0 (0.0%) | 0 (0.0%) |
| 18 to 34 Years | 0 (0.0%) | 0 (0.0%) |
| 35 to 64 Years | 18 (0.9%) | 13 (0.7%) |
| 65 to 74 Years | 0 (0.0%) | 15 (2.1%) |
| 75 Years and over | 0 (0.0%) | 16 (6.0%) |
Technology Access in Incline Village
Computing Device Access in Incline Village
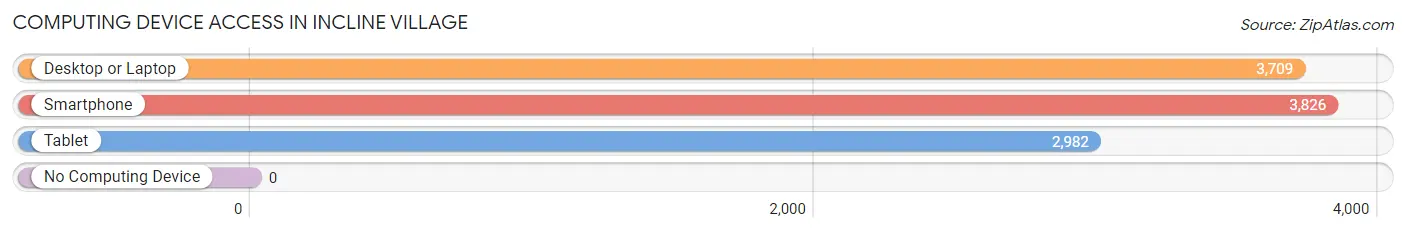
| Device Type | # Households | % Households |
| Desktop or Laptop | 3,709 | 94.5% |
| Smartphone | 3,826 | 97.5% |
| Tablet | 2,982 | 76.0% |
| No Computing Device | 0 | 0.0% |
| Total | 3,925 | 100.0% |
Internet Access in Incline Village
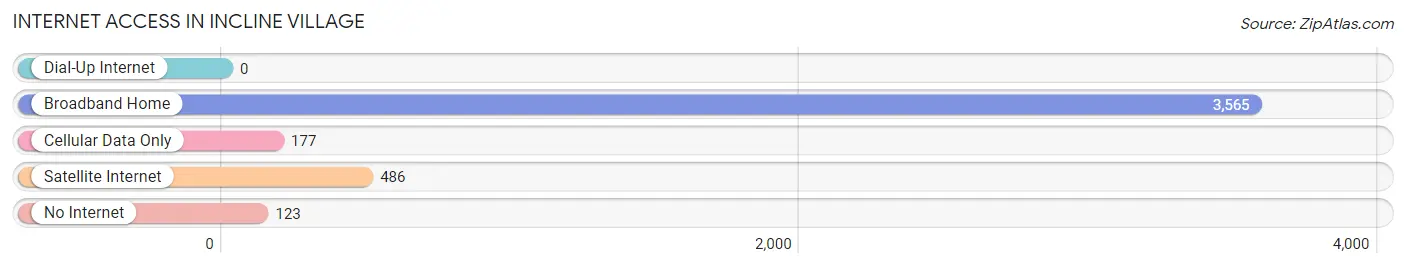
| Internet Type | # Households | % Households |
| Dial-Up Internet | 0 | 0.0% |
| Broadband Home | 3,565 | 90.8% |
| Cellular Data Only | 177 | 4.5% |
| Satellite Internet | 486 | 12.4% |
| No Internet | 123 | 3.1% |
| Total | 3,925 | 100.0% |
Incline Village Summary
Incline Village is a census-designated place (CDP) located in Washoe County, Nevada, United States. It is located on the north shore of Lake Tahoe, about 6 miles (10 km) northeast of the California state line. As of the 2010 census, the population of Incline Village was 8,777.
History
Incline Village was originally inhabited by the Washoe people, who lived in the area for thousands of years before the arrival of European settlers. The first recorded European settlers in the area were miners who arrived in the 1860s. The area was named Incline Village in 1864, after the Incline Railway, which was built to transport ore from the mines to the lake.
In the late 19th century, the area became a popular tourist destination, and several resorts were built in the area. In the early 20th century, the area was developed as a residential community, and the population began to grow.
Geography
Incline Village is located in Washoe County, Nevada, at the north end of Lake Tahoe. It is bordered to the north by the Nevada-California state line, to the east by the city of Reno, to the south by the city of Sparks, and to the west by the city of Carson City.
The CDP has a total area of 8.3 square miles (21.5 km2), of which 8.2 square miles (21.3 km2) is land and 0.1 square miles (0.2 km2) is water.
Economy
Incline Village has a diverse economy, with a mix of tourism, retail, and service industries. The largest employers in the area are the Hyatt Regency Lake Tahoe Resort, Spa and Casino, the Incline Village General Improvement District, and the Incline Village Golf Course.
Tourism is the main economic driver in Incline Village, with visitors drawn to the area for its natural beauty and recreational opportunities. The area is home to several ski resorts, including Diamond Peak Ski Resort and Mt. Rose Ski Tahoe. In addition, the area is popular for its beaches, hiking trails, and other outdoor activities.
Demographics
As of the 2010 census, there were 8,777 people, 3,945 households, and 2,541 families residing in the CDP. The population density was 1,062.3 people per square mile (409.3/km2). There were 5,845 housing units at an average density of 712.3 per square mile (275.2/km2). The racial makeup of the CDP was 91.2% White, 0.7% African American, 0.3% Native American, 2.2% Asian, 0.1% Pacific Islander, 3.2% from other races, and 2.3% from two or more races. Hispanic or Latino of any race were 8.2% of the population.
The median income for a household in the CDP was $76,944, and the median income for a family was $90,944. Males had a median income of $60,000 versus $41,250 for females. The per capita income for the CDP was $50,944. About 3.2% of families and 5.2% of the population were below the poverty line, including 6.2% of those under age 18 and 2.2% of those age 65 or over.
Common Questions
What is Per Capita Income in Incline Village?
Per Capita income in Incline Village is $102,146.
What is the Median Family Income in Incline Village?
Median Family Income in Incline Village is $175,500.
What is the Median Household income in Incline Village?
Median Household Income in Incline Village is $155,195.
What is Income or Wage Gap in Incline Village?
Income or Wage Gap in Incline Village is 29.9%.
Women in Incline Village earn 70.1 cents for every dollar earned by a man.
What is Inequality or Gini Index in Incline Village?
Inequality or Gini Index in Incline Village is 0.51.
What is the Total Population of Incline Village?
Total Population of Incline Village is 9,163.
What is the Total Male Population of Incline Village?
Total Male Population of Incline Village is 4,725.
What is the Total Female Population of Incline Village?
Total Female Population of Incline Village is 4,438.
What is the Ratio of Males per 100 Females in Incline Village?
There are 106.47 Males per 100 Females in Incline Village.
What is the Ratio of Females per 100 Males in Incline Village?
There are 93.93 Females per 100 Males in Incline Village.
What is the Median Population Age in Incline Village?
Median Population Age in Incline Village is 48.8 Years.
What is the Average Family Size in Incline Village
Average Family Size in Incline Village is 2.6 People.
What is the Average Household Size in Incline Village
Average Household Size in Incline Village is 2.3 People.
How Large is the Labor Force in Incline Village?
There are 5,006 People in the Labor Forcein in Incline Village.
What is the Percentage of People in the Labor Force in Incline Village?
63.6% of People are in the Labor Force in Incline Village.
What is the Unemployment Rate in Incline Village?
Unemployment Rate in Incline Village is 3.5%.