Merrillville, IN Map & Demographics
Merrillville Map
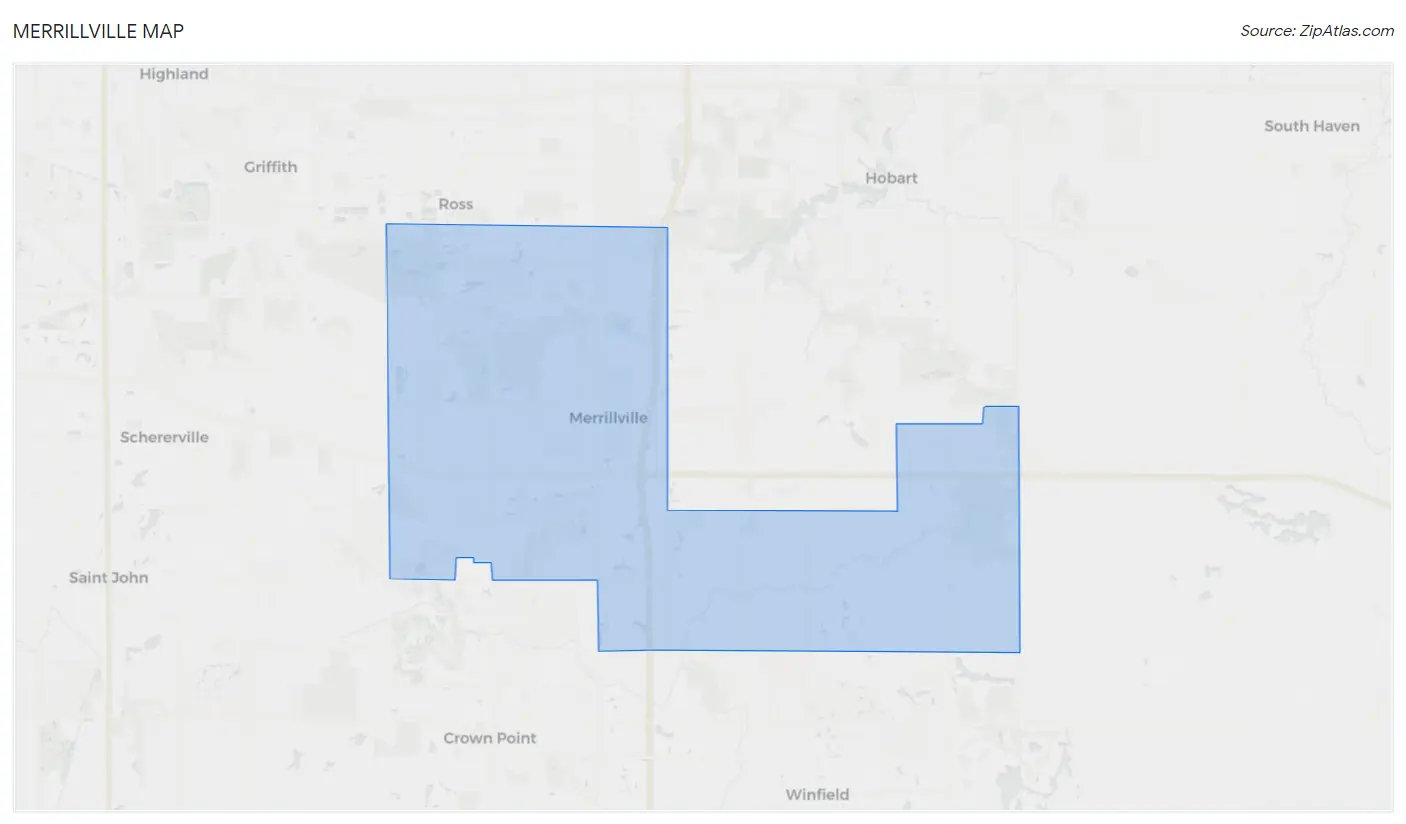
Merrillville Overview
$34,226
PER CAPITA INCOME
$84,667
AVG FAMILY INCOME
$62,221
AVG HOUSEHOLD INCOME
25.0%
WAGE / INCOME GAP [ % ]
75.0¢/ $1
WAGE / INCOME GAP [ $ ]
$12,137
FAMILY INCOME DEFICIT
0.46
INEQUALITY / GINI INDEX
36,214
TOTAL POPULATION
17,277
MALE POPULATION
18,937
FEMALE POPULATION
91.23
MALES / 100 FEMALES
109.61
FEMALES / 100 MALES
39.1
MEDIAN AGE
3.3
AVG FAMILY SIZE
2.4
AVG HOUSEHOLD SIZE
17,981
LABOR FORCE [ PEOPLE ]
61.5%
PERCENT IN LABOR FORCE
8.2%
UNEMPLOYMENT RATE
Merrillville Zip Codes
Merrillville Area Codes
Income in Merrillville
Income Overview in Merrillville
Per Capita Income in Merrillville is $34,226, while median incomes of families and households are $84,667 and $62,221 respectively.
| Characteristic | Number | Measure |
| Per Capita Income | 36,214 | $34,226 |
| Median Family Income | 8,374 | $84,667 |
| Mean Family Income | 8,374 | $95,107 |
| Median Household Income | 15,176 | $62,221 |
| Mean Household Income | 15,176 | $79,566 |
| Income Deficit | 8,374 | $12,137 |
| Wage / Income Gap (%) | 36,214 | 24.97% |
| Wage / Income Gap ($) | 36,214 | 75.03¢ per $1 |
| Gini / Inequality Index | 36,214 | 0.46 |
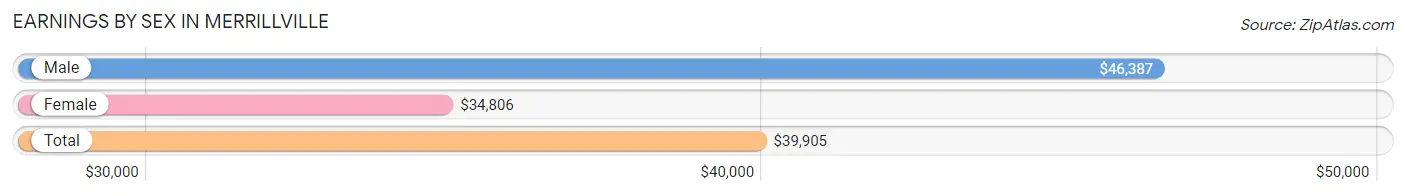
Earnings by Sex in Merrillville
Average Earnings in Merrillville are $39,905, $46,387 for men and $34,806 for women, a difference of 25.0%.
| Sex | Number | Average Earnings |
| Male | 8,930 (49.8%) | $46,387 |
| Female | 9,017 (50.2%) | $34,806 |
| Total | 17,947 (100.0%) | $39,905 |
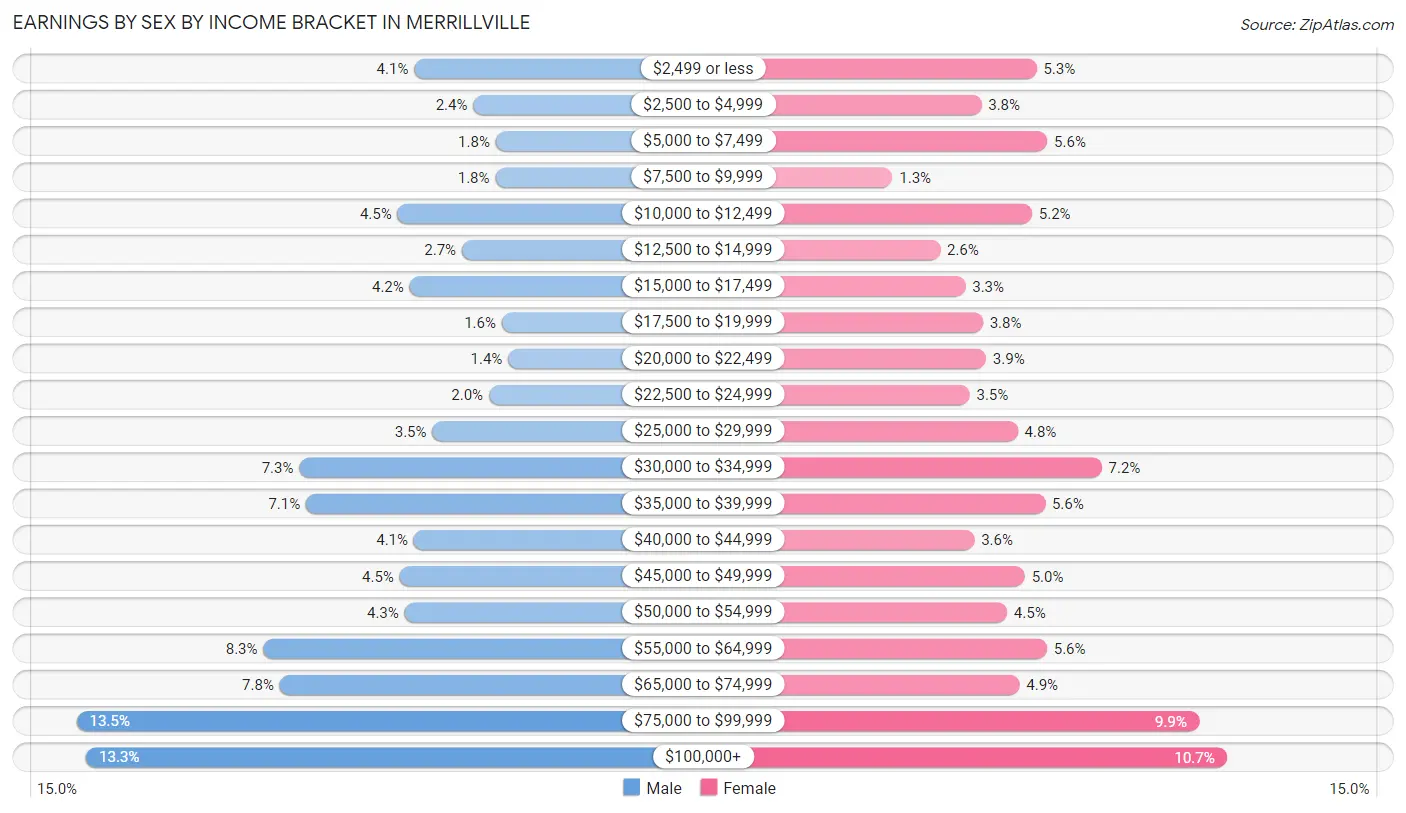
Earnings by Sex by Income Bracket in Merrillville
The most common earnings brackets in Merrillville are $75,000 to $99,999 for men (1,209 | 13.5%) and $100,000+ for women (962 | 10.7%).
| Income | Male | Female |
| $2,499 or less | 362 (4.1%) | 481 (5.3%) |
| $2,500 to $4,999 | 213 (2.4%) | 341 (3.8%) |
| $5,000 to $7,499 | 157 (1.8%) | 508 (5.6%) |
| $7,500 to $9,999 | 158 (1.8%) | 115 (1.3%) |
| $10,000 to $12,499 | 404 (4.5%) | 469 (5.2%) |
| $12,500 to $14,999 | 242 (2.7%) | 236 (2.6%) |
| $15,000 to $17,499 | 373 (4.2%) | 300 (3.3%) |
| $17,500 to $19,999 | 142 (1.6%) | 344 (3.8%) |
| $20,000 to $22,499 | 126 (1.4%) | 353 (3.9%) |
| $22,500 to $24,999 | 174 (1.9%) | 311 (3.5%) |
| $25,000 to $29,999 | 316 (3.5%) | 433 (4.8%) |
| $30,000 to $34,999 | 650 (7.3%) | 646 (7.2%) |
| $35,000 to $39,999 | 633 (7.1%) | 502 (5.6%) |
| $40,000 to $44,999 | 363 (4.1%) | 323 (3.6%) |
| $45,000 to $49,999 | 398 (4.5%) | 451 (5.0%) |
| $50,000 to $54,999 | 386 (4.3%) | 406 (4.5%) |
| $55,000 to $64,999 | 740 (8.3%) | 507 (5.6%) |
| $65,000 to $74,999 | 699 (7.8%) | 437 (4.9%) |
| $75,000 to $99,999 | 1,209 (13.5%) | 892 (9.9%) |
| $100,000+ | 1,185 (13.3%) | 962 (10.7%) |
| Total | 8,930 (100.0%) | 9,017 (100.0%) |
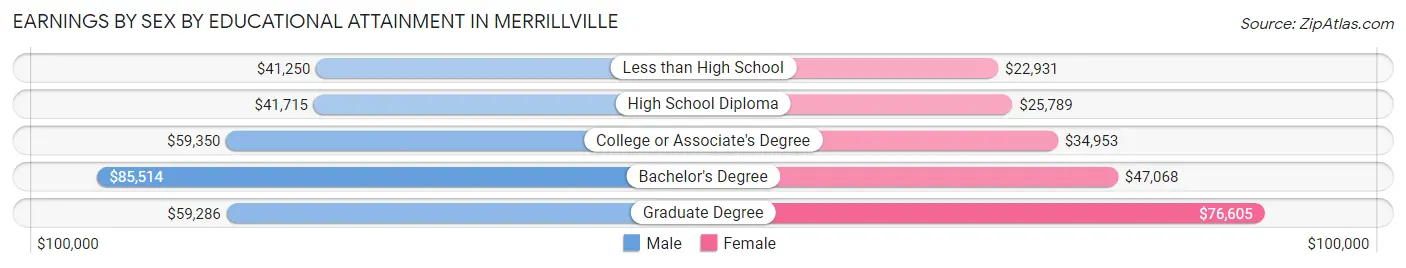
Earnings by Sex by Educational Attainment in Merrillville
Average earnings in Merrillville are $55,359 for men and $41,170 for women, a difference of 25.6%. Men with an educational attainment of bachelor's degree enjoy the highest average annual earnings of $85,514, while those with less than high school education earn the least with $41,250. Women with an educational attainment of graduate degree earn the most with the average annual earnings of $76,605, while those with less than high school education have the smallest earnings of $22,931.
| Educational Attainment | Male Income | Female Income |
| Less than High School | $41,250 | $22,931 |
| High School Diploma | $41,715 | $25,789 |
| College or Associate's Degree | $59,350 | $34,953 |
| Bachelor's Degree | $85,514 | $47,068 |
| Graduate Degree | $59,286 | $76,605 |
| Total | $55,359 | $41,170 |
Family Income in Merrillville
Family Income Brackets in Merrillville
According to the Merrillville family income data, there are 1,733 families falling into the $75,000 to $99,999 income range, which is the most common income bracket and makes up 20.7% of all families. Conversely, the less than $10,000 income bracket is the least frequent group with only 301 families (3.6%) belonging to this category.
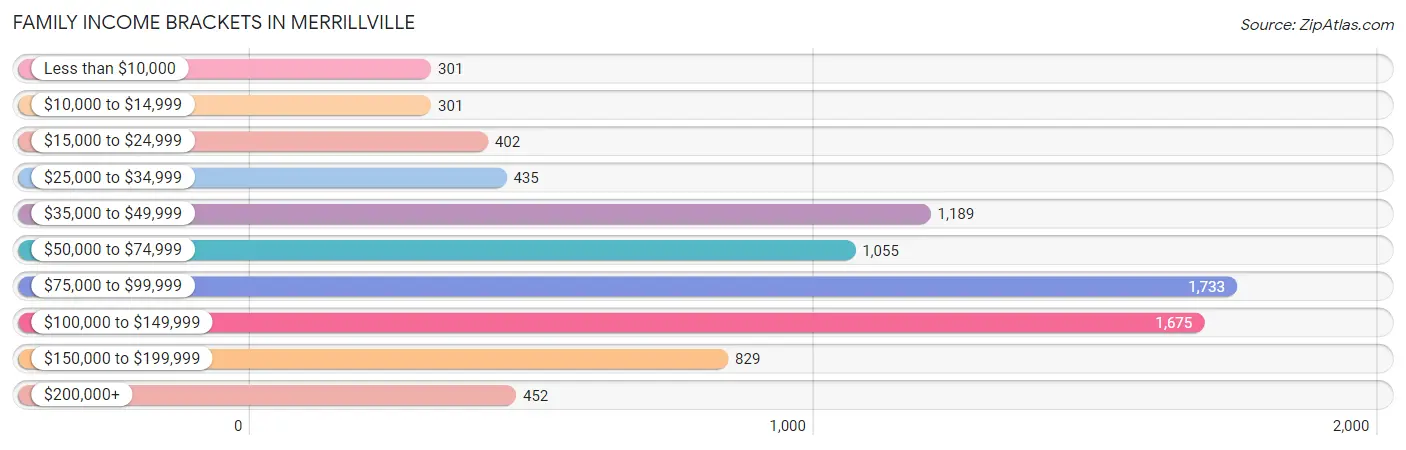
| Income Bracket | # Families | % Families |
| Less than $10,000 | 301 | 3.6% |
| $10,000 to $14,999 | 301 | 3.6% |
| $15,000 to $24,999 | 402 | 4.8% |
| $25,000 to $34,999 | 435 | 5.2% |
| $35,000 to $49,999 | 1,189 | 14.2% |
| $50,000 to $74,999 | 1,055 | 12.6% |
| $75,000 to $99,999 | 1,733 | 20.7% |
| $100,000 to $149,999 | 1,675 | 20.0% |
| $150,000 to $199,999 | 829 | 9.9% |
| $200,000+ | 452 | 5.4% |
Family Income by Famaliy Size in Merrillville
7+ person families (176 | 2.1%) account for the highest median family income in Merrillville with $190,227 per family, while 2-person families (3,702 | 44.2%) have the highest median income of $36,744 per family member.
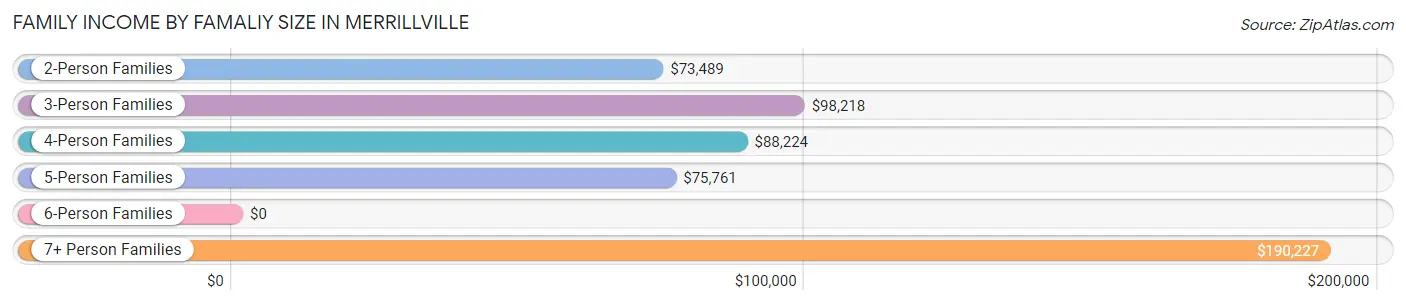
| Income Bracket | # Families | Median Income |
| 2-Person Families | 3,702 (44.2%) | $73,489 |
| 3-Person Families | 2,222 (26.5%) | $98,218 |
| 4-Person Families | 1,080 (12.9%) | $88,224 |
| 5-Person Families | 902 (10.8%) | $75,761 |
| 6-Person Families | 292 (3.5%) | $0 |
| 7+ Person Families | 176 (2.1%) | $190,227 |
| Total | 8,374 (100.0%) | $84,667 |
Family Income by Number of Earners in Merrillville
The median family income in Merrillville is $84,667, with families comprising 3+ earners (1,079) having the highest median family income of $123,823, while families with no earners (1,339) have the lowest median family income of $36,891, accounting for 12.9% and 16.0% of families, respectively.
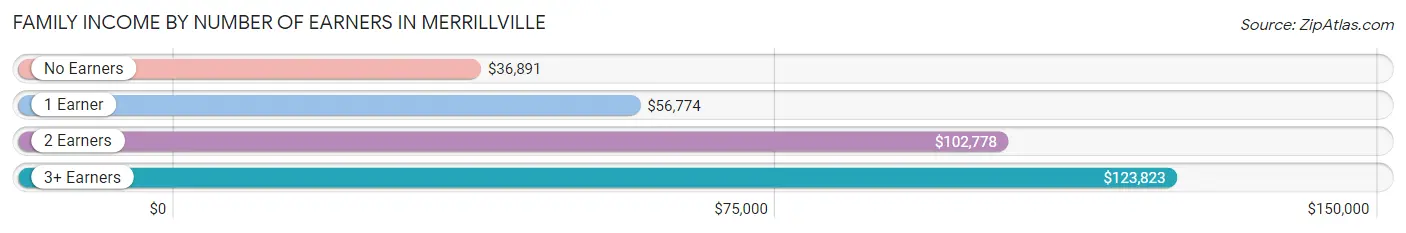
| Number of Earners | # Families | Median Income |
| No Earners | 1,339 (16.0%) | $36,891 |
| 1 Earner | 3,036 (36.3%) | $56,774 |
| 2 Earners | 2,920 (34.9%) | $102,778 |
| 3+ Earners | 1,079 (12.9%) | $123,823 |
| Total | 8,374 (100.0%) | $84,667 |
Household Income in Merrillville
Household Income Brackets in Merrillville
With 2,383 households falling in the category, the $75,000 to $99,999 income range is the most frequent in Merrillville, accounting for 15.7% of all households. In contrast, only 728 households (4.8%) fall into the $10,000 to $14,999 income bracket, making it the least populous group.
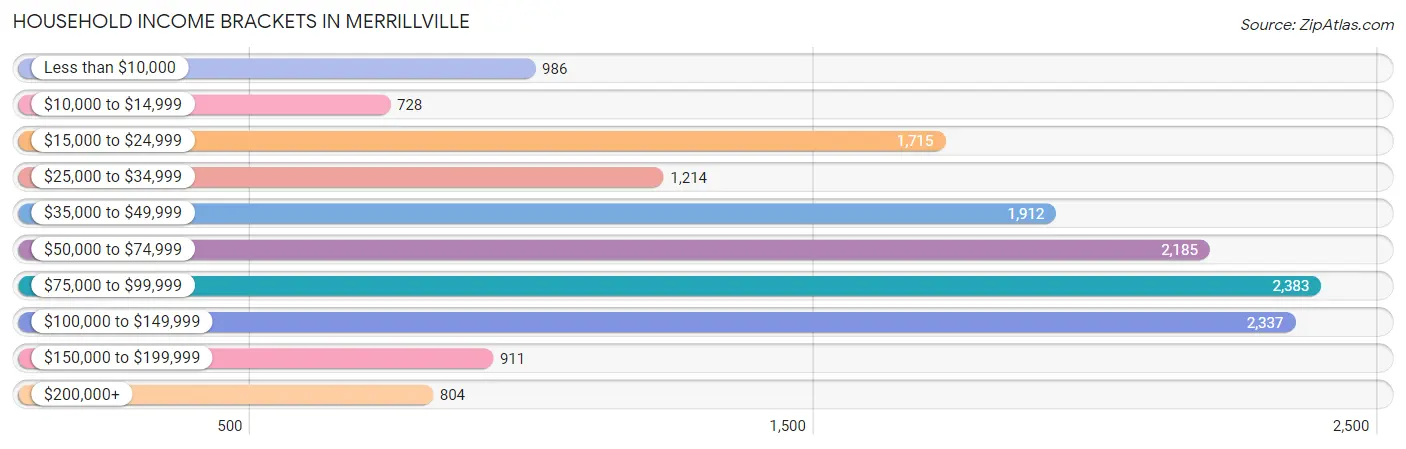
| Income Bracket | # Households | % Households |
| Less than $10,000 | 986 | 6.5% |
| $10,000 to $14,999 | 728 | 4.8% |
| $15,000 to $24,999 | 1,715 | 11.3% |
| $25,000 to $34,999 | 1,214 | 8.0% |
| $35,000 to $49,999 | 1,912 | 12.6% |
| $50,000 to $74,999 | 2,185 | 14.4% |
| $75,000 to $99,999 | 2,383 | 15.7% |
| $100,000 to $149,999 | 2,337 | 15.4% |
| $150,000 to $199,999 | 911 | 6.0% |
| $200,000+ | 804 | 5.3% |
Household Income by Householder Age in Merrillville
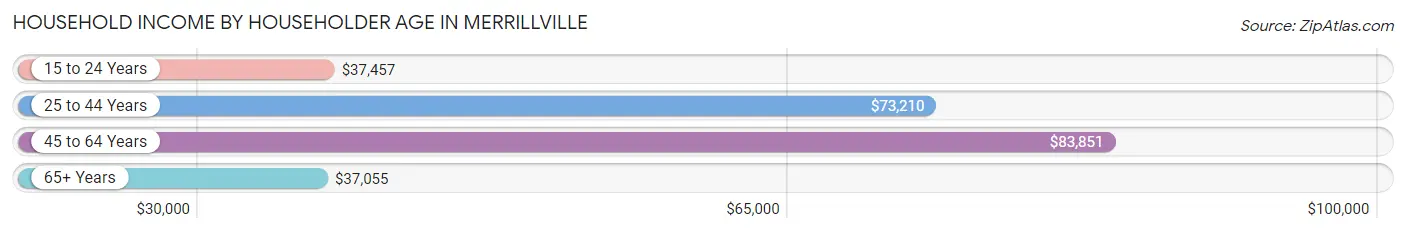
The median household income in Merrillville is $62,221, with the highest median household income of $83,851 found in the 45 to 64 years age bracket for the primary householder. A total of 5,603 households (36.9%) fall into this category. Meanwhile, the 65+ years age bracket for the primary householder has the lowest median household income of $37,055, with 4,908 households (32.3%) in this group.
| Income Bracket | # Households | Median Income |
| 15 to 24 Years | 511 (3.4%) | $37,457 |
| 25 to 44 Years | 4,154 (27.4%) | $73,210 |
| 45 to 64 Years | 5,603 (36.9%) | $83,851 |
| 65+ Years | 4,908 (32.3%) | $37,055 |
| Total | 15,176 (100.0%) | $62,221 |
Poverty in Merrillville
Income Below Poverty by Sex and Age in Merrillville
With 13.4% poverty level for males and 15.4% for females among the residents of Merrillville, 6 to 11 year old males and 5 year old females are the most vulnerable to poverty, with 465 males (34.0%) and 102 females (55.4%) in their respective age groups living below the poverty level.
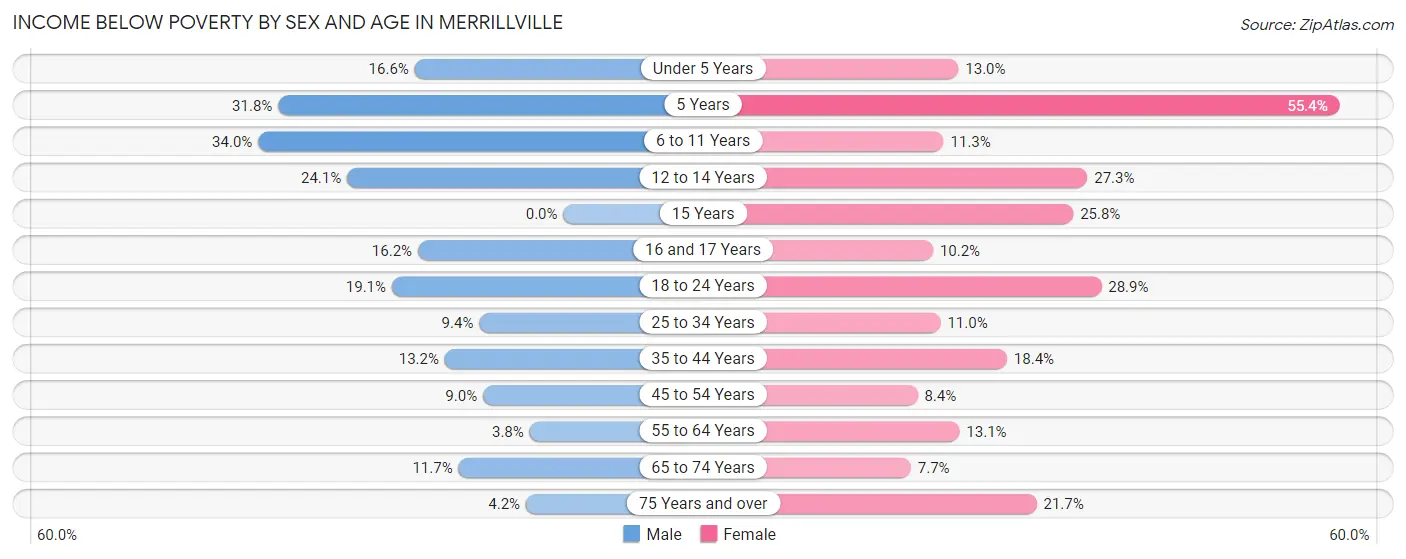
| Age Bracket | Male | Female |
| Under 5 Years | 158 (16.6%) | 135 (13.0%) |
| 5 Years | 54 (31.8%) | 102 (55.4%) |
| 6 to 11 Years | 465 (34.0%) | 152 (11.3%) |
| 12 to 14 Years | 198 (24.1%) | 114 (27.3%) |
| 15 Years | 0 (0.0%) | 42 (25.8%) |
| 16 and 17 Years | 87 (16.2%) | 62 (10.2%) |
| 18 to 24 Years | 336 (19.1%) | 510 (28.9%) |
| 25 to 34 Years | 201 (9.4%) | 228 (11.0%) |
| 35 to 44 Years | 295 (13.2%) | 398 (18.4%) |
| 45 to 54 Years | 162 (8.9%) | 192 (8.4%) |
| 55 to 64 Years | 79 (3.8%) | 336 (13.1%) |
| 65 to 74 Years | 232 (11.7%) | 150 (7.7%) |
| 75 Years and over | 34 (4.2%) | 444 (21.7%) |
| Total | 2,301 (13.4%) | 2,865 (15.4%) |
Income Above Poverty by Sex and Age in Merrillville
According to the poverty statistics in Merrillville, males aged 15 years and females aged 65 to 74 years are the age groups that are most secure financially, with 100.0% of males and 92.3% of females in these age groups living above the poverty line.
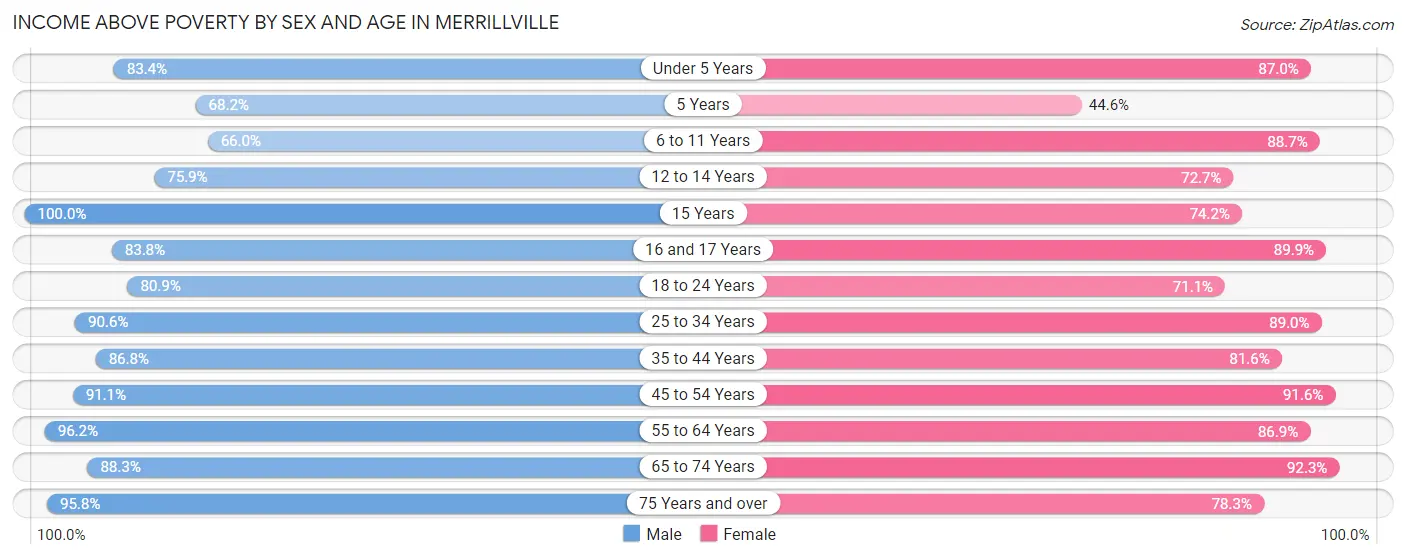
| Age Bracket | Male | Female |
| Under 5 Years | 796 (83.4%) | 905 (87.0%) |
| 5 Years | 116 (68.2%) | 82 (44.6%) |
| 6 to 11 Years | 903 (66.0%) | 1,188 (88.7%) |
| 12 to 14 Years | 624 (75.9%) | 303 (72.7%) |
| 15 Years | 411 (100.0%) | 121 (74.2%) |
| 16 and 17 Years | 450 (83.8%) | 549 (89.8%) |
| 18 to 24 Years | 1,423 (80.9%) | 1,255 (71.1%) |
| 25 to 34 Years | 1,945 (90.6%) | 1,847 (89.0%) |
| 35 to 44 Years | 1,940 (86.8%) | 1,766 (81.6%) |
| 45 to 54 Years | 1,649 (91.0%) | 2,085 (91.6%) |
| 55 to 64 Years | 2,022 (96.2%) | 2,229 (86.9%) |
| 65 to 74 Years | 1,755 (88.3%) | 1,800 (92.3%) |
| 75 Years and over | 782 (95.8%) | 1,603 (78.3%) |
| Total | 14,816 (86.6%) | 15,733 (84.6%) |
Income Below Poverty Among Married-Couple Families in Merrillville
The poverty statistics for married-couple families in Merrillville show that 5.4% or 267 of the total 4,937 families live below the poverty line. Families with 1 or 2 children have the highest poverty rate of 11.9%, comprising of 167 families. On the other hand, families with 5 or more children have the lowest poverty rate of 0.0%, which includes 0 families.
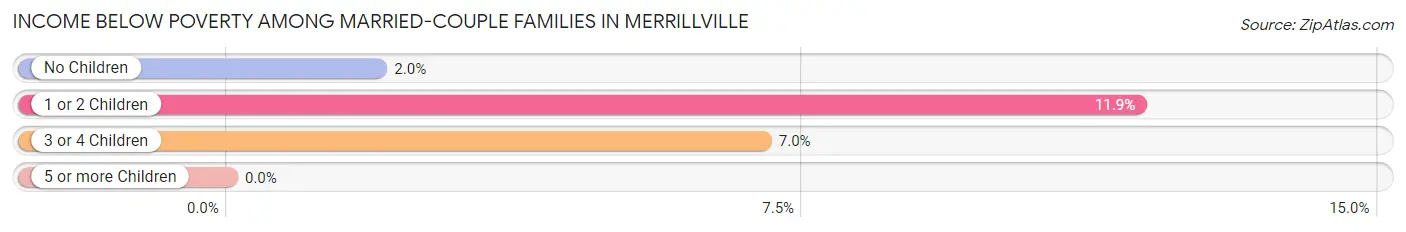
| Children | Above Poverty | Below Poverty |
| No Children | 2,772 (98.1%) | 55 (1.9%) |
| 1 or 2 Children | 1,240 (88.1%) | 167 (11.9%) |
| 3 or 4 Children | 601 (93.0%) | 45 (7.0%) |
| 5 or more Children | 57 (100.0%) | 0 (0.0%) |
| Total | 4,670 (94.6%) | 267 (5.4%) |
Income Below Poverty Among Single-Parent Households in Merrillville
According to the poverty data in Merrillville, 11.0% or 125 single-father households and 26.2% or 602 single-mother households are living below the poverty line. Among single-father households, those with 1 or 2 children have the highest poverty rate, with 97 households (20.0%) experiencing poverty. Likewise, among single-mother households, those with 5 or more children have the highest poverty rate, with 19 households (100.0%) falling below the poverty line.
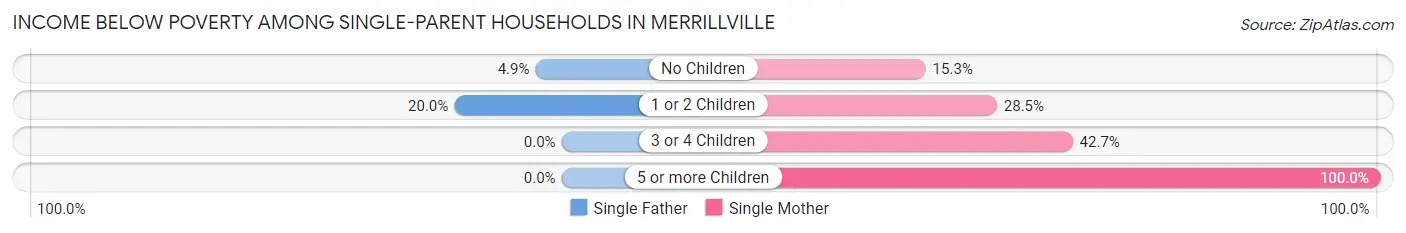
| Children | Single Father | Single Mother |
| No Children | 28 (4.9%) | 133 (15.3%) |
| 1 or 2 Children | 97 (20.0%) | 305 (28.5%) |
| 3 or 4 Children | 0 (0.0%) | 145 (42.6%) |
| 5 or more Children | 0 (0.0%) | 19 (100.0%) |
| Total | 125 (11.0%) | 602 (26.2%) |
Income Below Poverty Among Married-Couple vs Single-Parent Households in Merrillville
The poverty data for Merrillville shows that 267 of the married-couple family households (5.4%) and 727 of the single-parent households (21.1%) are living below the poverty level. Within the married-couple family households, those with 1 or 2 children have the highest poverty rate, with 167 households (11.9%) falling below the poverty line. Among the single-parent households, those with 5 or more children have the highest poverty rate, with 19 household (100.0%) living below poverty.
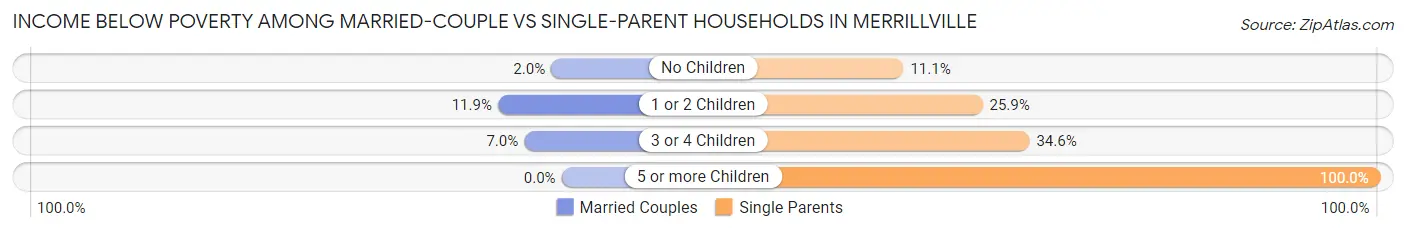
| Children | Married-Couple Families | Single-Parent Households |
| No Children | 55 (1.9%) | 161 (11.1%) |
| 1 or 2 Children | 167 (11.9%) | 402 (25.9%) |
| 3 or 4 Children | 45 (7.0%) | 145 (34.6%) |
| 5 or more Children | 0 (0.0%) | 19 (100.0%) |
| Total | 267 (5.4%) | 727 (21.1%) |
Race in Merrillville
The most populous races in Merrillville are Black / African American (16,751 | 46.3%), White / Caucasian (13,872 | 38.3%), and Hispanic or Latino (6,277 | 17.3%).
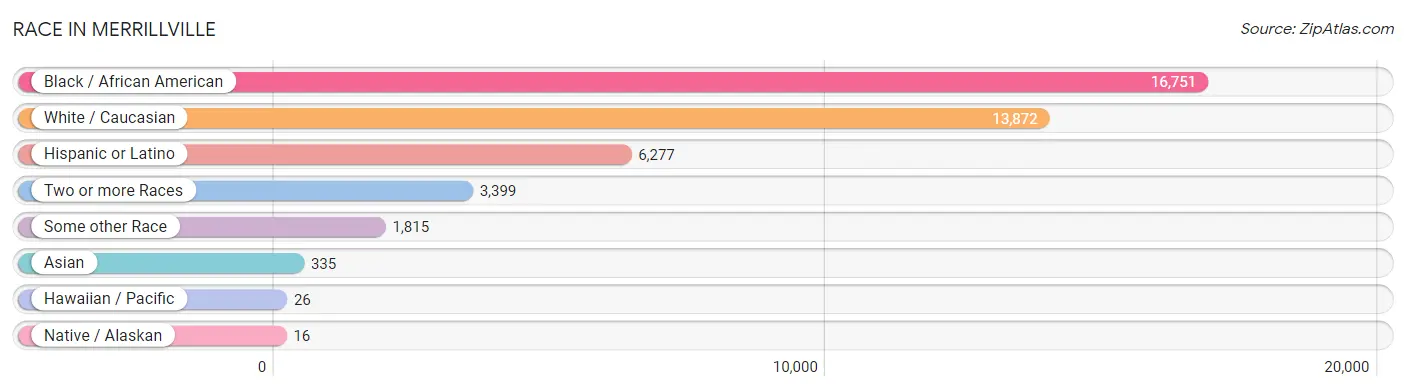
| Race | # Population | % Population |
| Asian | 335 | 0.9% |
| Black / African American | 16,751 | 46.3% |
| Hawaiian / Pacific | 26 | 0.1% |
| Hispanic or Latino | 6,277 | 17.3% |
| Native / Alaskan | 16 | 0.0% |
| White / Caucasian | 13,872 | 38.3% |
| Two or more Races | 3,399 | 9.4% |
| Some other Race | 1,815 | 5.0% |
| Total | 36,214 | 100.0% |
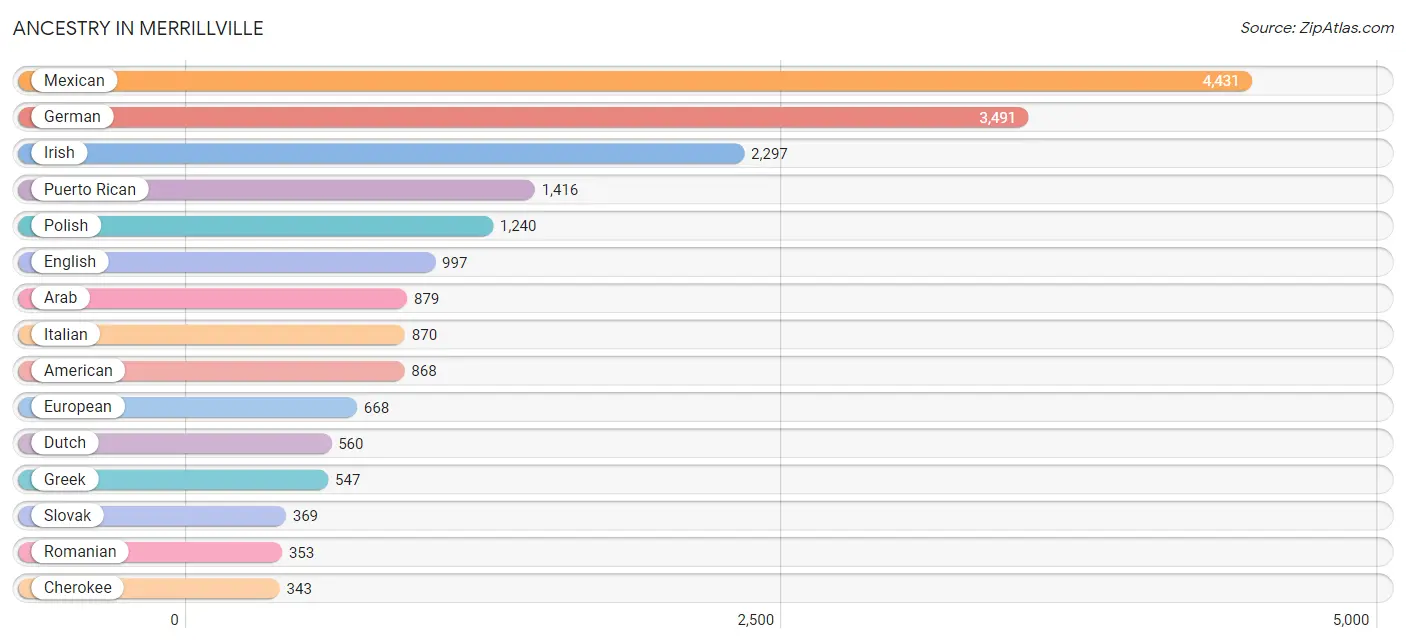
Ancestry in Merrillville
The most populous ancestries reported in Merrillville are Mexican (4,431 | 12.2%), German (3,491 | 9.6%), Irish (2,297 | 6.3%), Puerto Rican (1,416 | 3.9%), and Polish (1,240 | 3.4%), together accounting for 35.6% of all Merrillville residents.
| Ancestry | # Population | % Population |
| African | 222 | 0.6% |
| Aleut | 26 | 0.1% |
| American | 868 | 2.4% |
| Arab | 879 | 2.4% |
| Armenian | 63 | 0.2% |
| Assyrian / Chaldean / Syriac | 3 | 0.0% |
| Bhutanese | 65 | 0.2% |
| British | 84 | 0.2% |
| Canadian | 26 | 0.1% |
| Central American | 72 | 0.2% |
| Cherokee | 343 | 0.9% |
| Colombian | 25 | 0.1% |
| Croatian | 162 | 0.4% |
| Cuban | 118 | 0.3% |
| Czech | 77 | 0.2% |
| Dominican | 19 | 0.1% |
| Dutch | 560 | 1.5% |
| English | 997 | 2.8% |
| Ethiopian | 6 | 0.0% |
| European | 668 | 1.8% |
| Filipino | 46 | 0.1% |
| French | 287 | 0.8% |
| French Canadian | 17 | 0.1% |
| German | 3,491 | 9.6% |
| Greek | 547 | 1.5% |
| Guatemalan | 61 | 0.2% |
| Haitian | 45 | 0.1% |
| Hungarian | 194 | 0.5% |
| Indian (Asian) | 3 | 0.0% |
| Irish | 2,297 | 6.3% |
| Israeli | 8 | 0.0% |
| Italian | 870 | 2.4% |
| Jamaican | 200 | 0.5% |
| Jordanian | 134 | 0.4% |
| Korean | 166 | 0.5% |
| Lebanese | 16 | 0.0% |
| Lithuanian | 69 | 0.2% |
| Macedonian | 123 | 0.3% |
| Maltese | 11 | 0.0% |
| Mexican | 4,431 | 12.2% |
| Mexican American Indian | 9 | 0.0% |
| Native Hawaiian | 34 | 0.1% |
| Nigerian | 24 | 0.1% |
| Northern European | 18 | 0.1% |
| Norwegian | 110 | 0.3% |
| Pakistani | 10 | 0.0% |
| Palestinian | 57 | 0.2% |
| Polish | 1,240 | 3.4% |
| Potawatomi | 8 | 0.0% |
| Puerto Rican | 1,416 | 3.9% |
| Romanian | 353 | 1.0% |
| Russian | 30 | 0.1% |
| Salvadoran | 11 | 0.0% |
| Samoan | 19 | 0.1% |
| Scandinavian | 148 | 0.4% |
| Scotch-Irish | 75 | 0.2% |
| Scottish | 134 | 0.4% |
| Serbian | 94 | 0.3% |
| Slavic | 45 | 0.1% |
| Slovak | 369 | 1.0% |
| Somali | 10 | 0.0% |
| South American | 25 | 0.1% |
| Spanish | 57 | 0.2% |
| Subsaharan African | 266 | 0.7% |
| Swedish | 141 | 0.4% |
| Swiss | 29 | 0.1% |
| Thai | 142 | 0.4% |
| Ukrainian | 272 | 0.7% |
| Welsh | 78 | 0.2% |
| West Indian | 10 | 0.0% |
| Yugoslavian | 7 | 0.0% | View All 71 Rows |
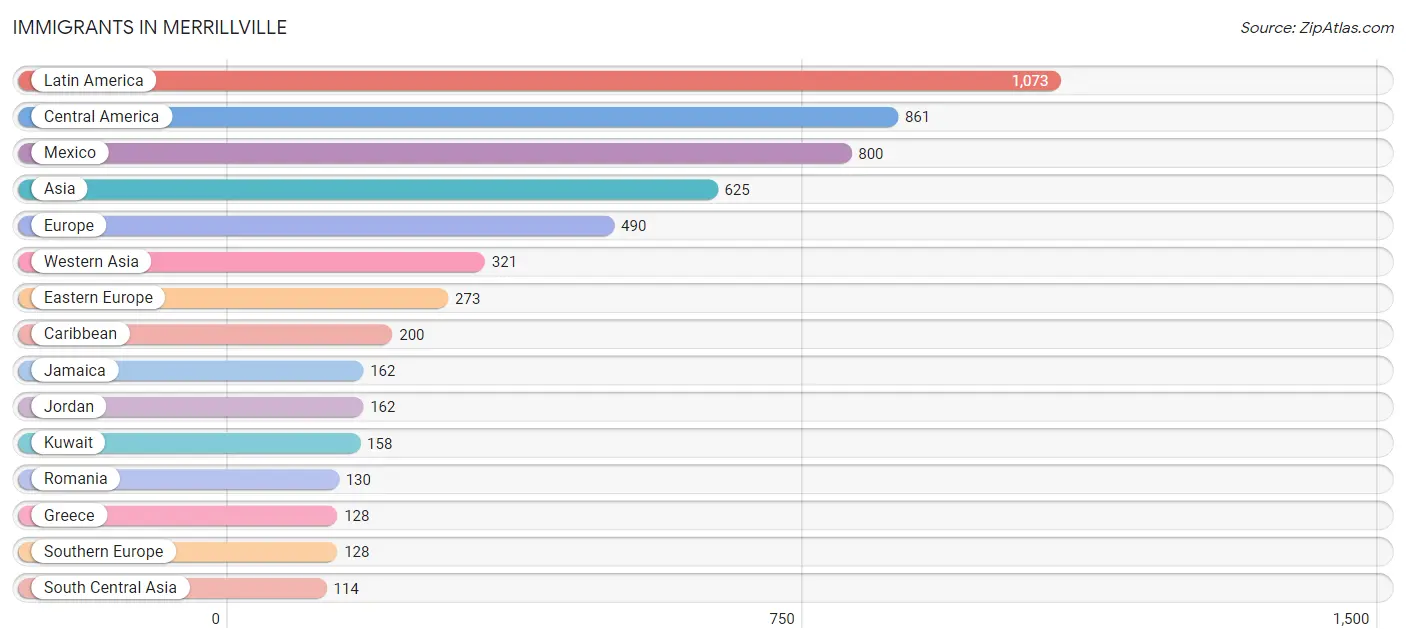
Immigrants in Merrillville
The most numerous immigrant groups reported in Merrillville came from Latin America (1,073 | 3.0%), Central America (861 | 2.4%), Mexico (800 | 2.2%), Asia (625 | 1.7%), and Europe (490 | 1.3%), together accounting for 10.6% of all Merrillville residents.
| Immigration Origin | # Population | % Population |
| Africa | 58 | 0.2% |
| Asia | 625 | 1.7% |
| Austria | 7 | 0.0% |
| Bosnia and Herzegovina | 47 | 0.1% |
| Canada | 23 | 0.1% |
| Caribbean | 200 | 0.5% |
| Central America | 861 | 2.4% |
| China | 46 | 0.1% |
| Colombia | 12 | 0.0% |
| Croatia | 9 | 0.0% |
| Eastern Africa | 34 | 0.1% |
| Eastern Asia | 77 | 0.2% |
| Eastern Europe | 273 | 0.7% |
| England | 15 | 0.0% |
| Ethiopia | 6 | 0.0% |
| Europe | 490 | 1.3% |
| France | 16 | 0.0% |
| Germany | 21 | 0.1% |
| Greece | 128 | 0.4% |
| Guatemala | 61 | 0.2% |
| Haiti | 35 | 0.1% |
| India | 104 | 0.3% |
| Iraq | 1 | 0.0% |
| Ireland | 19 | 0.1% |
| Jamaica | 162 | 0.4% |
| Japan | 31 | 0.1% |
| Jordan | 162 | 0.4% |
| Kuwait | 158 | 0.4% |
| Latin America | 1,073 | 3.0% |
| Lithuania | 10 | 0.0% |
| Mexico | 800 | 2.2% |
| Nigeria | 24 | 0.1% |
| North Macedonia | 66 | 0.2% |
| Northern Europe | 45 | 0.1% |
| Oceania | 14 | 0.0% |
| Pakistan | 10 | 0.0% |
| Philippines | 113 | 0.3% |
| Poland | 11 | 0.0% |
| Romania | 130 | 0.4% |
| Scotland | 11 | 0.0% |
| South America | 12 | 0.0% |
| South Central Asia | 114 | 0.3% |
| South Eastern Asia | 113 | 0.3% |
| Southern Europe | 128 | 0.4% |
| Taiwan | 46 | 0.1% |
| Trinidad and Tobago | 3 | 0.0% |
| Western Africa | 24 | 0.1% |
| Western Asia | 321 | 0.9% |
| Western Europe | 44 | 0.1% | View All 49 Rows |
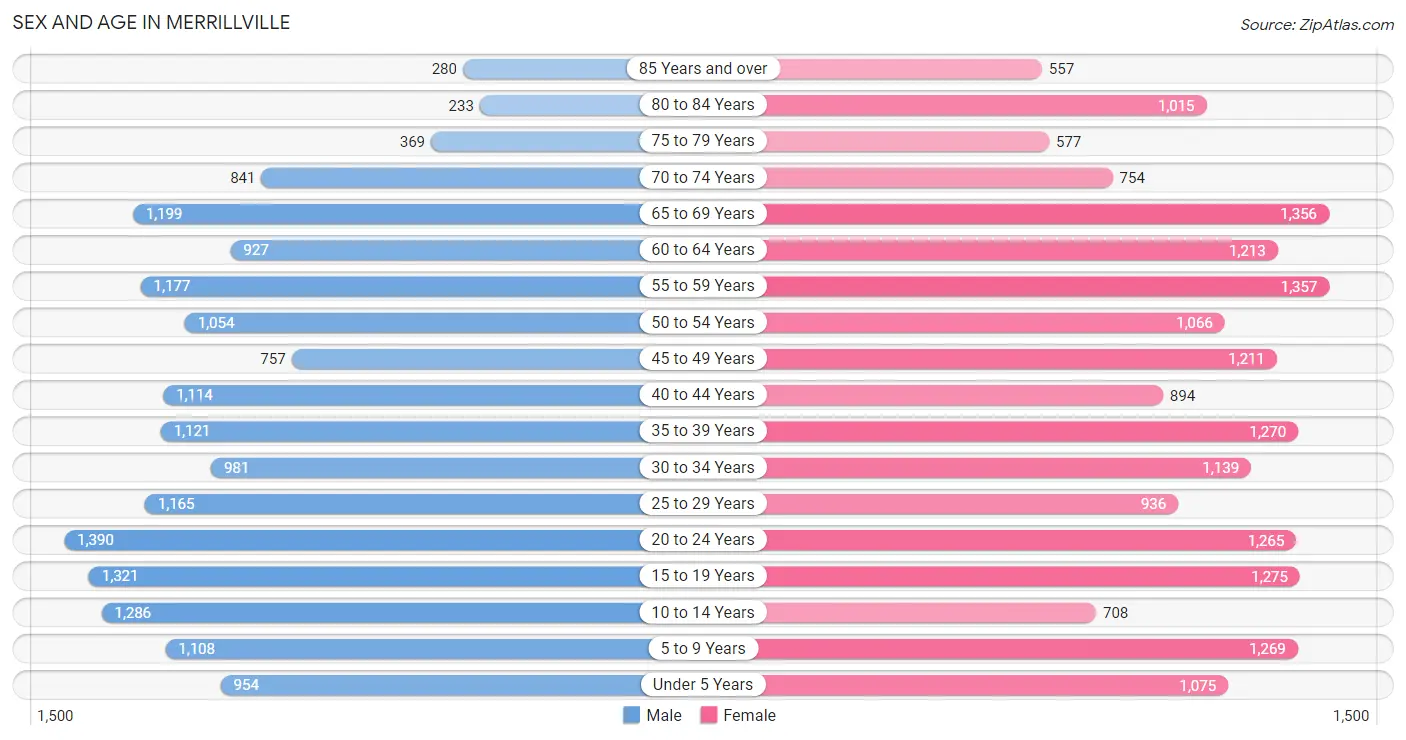
Sex and Age in Merrillville
Sex and Age in Merrillville
The most populous age groups in Merrillville are 20 to 24 Years (1,390 | 8.1%) for men and 55 to 59 Years (1,357 | 7.2%) for women.
| Age Bracket | Male | Female |
| Under 5 Years | 954 (5.5%) | 1,075 (5.7%) |
| 5 to 9 Years | 1,108 (6.4%) | 1,269 (6.7%) |
| 10 to 14 Years | 1,286 (7.4%) | 708 (3.7%) |
| 15 to 19 Years | 1,321 (7.6%) | 1,275 (6.7%) |
| 20 to 24 Years | 1,390 (8.1%) | 1,265 (6.7%) |
| 25 to 29 Years | 1,165 (6.7%) | 936 (4.9%) |
| 30 to 34 Years | 981 (5.7%) | 1,139 (6.0%) |
| 35 to 39 Years | 1,121 (6.5%) | 1,270 (6.7%) |
| 40 to 44 Years | 1,114 (6.5%) | 894 (4.7%) |
| 45 to 49 Years | 757 (4.4%) | 1,211 (6.4%) |
| 50 to 54 Years | 1,054 (6.1%) | 1,066 (5.6%) |
| 55 to 59 Years | 1,177 (6.8%) | 1,357 (7.2%) |
| 60 to 64 Years | 927 (5.4%) | 1,213 (6.4%) |
| 65 to 69 Years | 1,199 (6.9%) | 1,356 (7.2%) |
| 70 to 74 Years | 841 (4.9%) | 754 (4.0%) |
| 75 to 79 Years | 369 (2.1%) | 577 (3.0%) |
| 80 to 84 Years | 233 (1.3%) | 1,015 (5.4%) |
| 85 Years and over | 280 (1.6%) | 557 (2.9%) |
| Total | 17,277 (100.0%) | 18,937 (100.0%) |
Families and Households in Merrillville
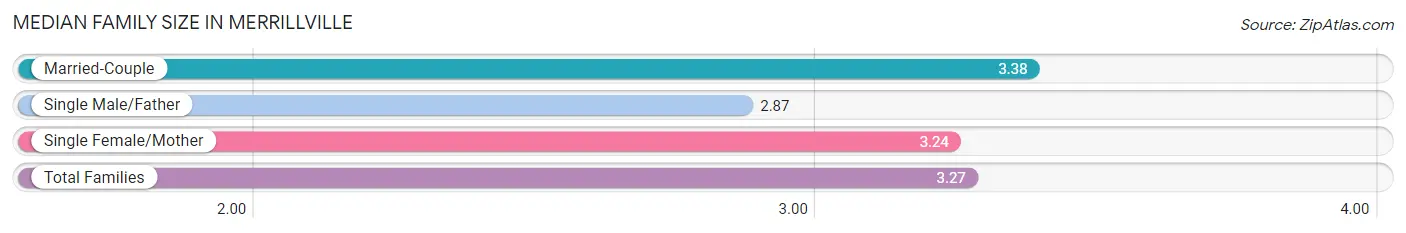
Median Family Size in Merrillville
The median family size in Merrillville is 3.27 persons per family, with married-couple families (4,937 | 59.0%) accounting for the largest median family size of 3.38 persons per family. On the other hand, single male/father families (1,138 | 13.6%) represent the smallest median family size with 2.87 persons per family.
| Family Type | # Families | Family Size |
| Married-Couple | 4,937 (59.0%) | 3.38 |
| Single Male/Father | 1,138 (13.6%) | 2.87 |
| Single Female/Mother | 2,299 (27.5%) | 3.24 |
| Total Families | 8,374 (100.0%) | 3.27 |
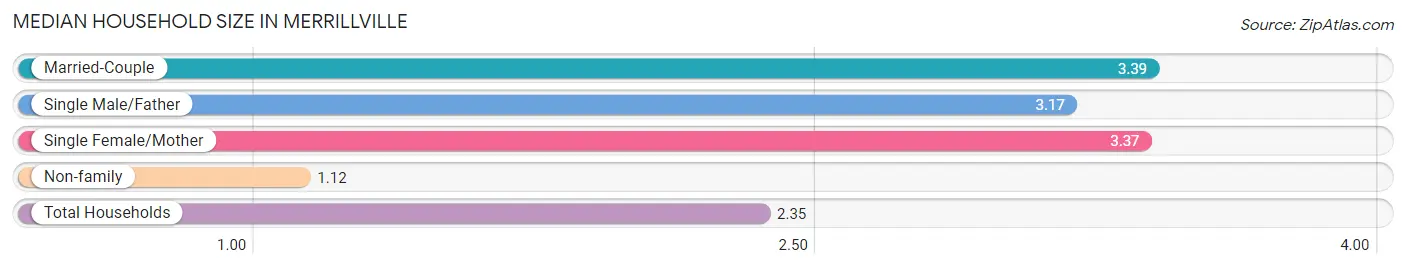
Median Household Size in Merrillville
The median household size in Merrillville is 2.35 persons per household, with married-couple households (4,937 | 32.5%) accounting for the largest median household size of 3.39 persons per household. non-family households (6,802 | 44.8%) represent the smallest median household size with 1.12 persons per household.
| Household Type | # Households | Household Size |
| Married-Couple | 4,937 (32.5%) | 3.39 |
| Single Male/Father | 1,138 (7.5%) | 3.17 |
| Single Female/Mother | 2,299 (15.1%) | 3.37 |
| Non-family | 6,802 (44.8%) | 1.12 |
| Total Households | 15,176 (100.0%) | 2.35 |
Household Size by Marriage Status in Merrillville
Out of a total of 15,176 households in Merrillville, 8,374 (55.2%) are family households, while 6,802 (44.8%) are nonfamily households. The most numerous type of family households are 2-person households, comprising 3,357, and the most common type of nonfamily households are 1-person households, comprising 6,002.
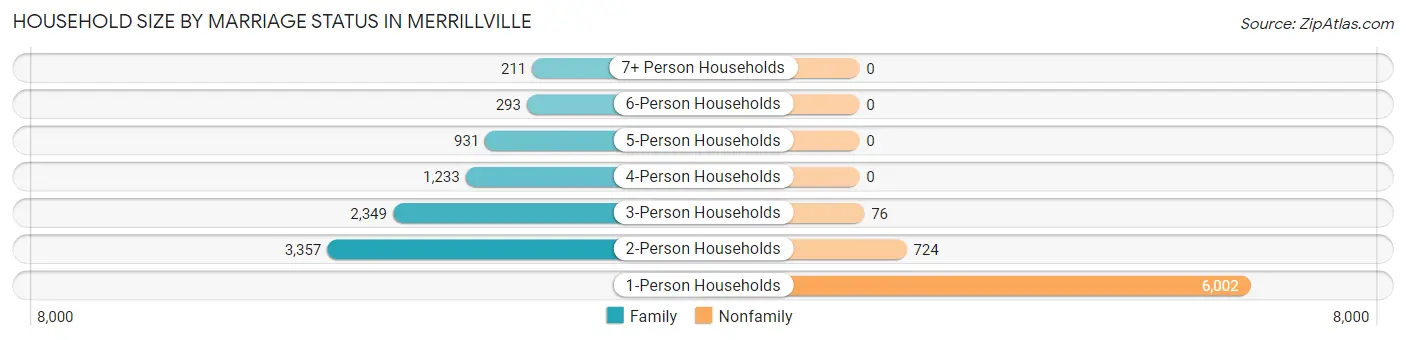
| Household Size | Family Households | Nonfamily Households |
| 1-Person Households | - | 6,002 (39.6%) |
| 2-Person Households | 3,357 (22.1%) | 724 (4.8%) |
| 3-Person Households | 2,349 (15.5%) | 76 (0.5%) |
| 4-Person Households | 1,233 (8.1%) | 0 (0.0%) |
| 5-Person Households | 931 (6.1%) | 0 (0.0%) |
| 6-Person Households | 293 (1.9%) | 0 (0.0%) |
| 7+ Person Households | 211 (1.4%) | 0 (0.0%) |
| Total | 8,374 (55.2%) | 6,802 (44.8%) |
Female Fertility in Merrillville
Fertility by Age in Merrillville
Average fertility rate in Merrillville is 62.0 births per 1,000 women. Women in the age bracket of 20 to 34 years have the highest fertility rate with 84.0 births per 1,000 women. Women in the age bracket of 20 to 34 years acount for 55.3% of all women with births.
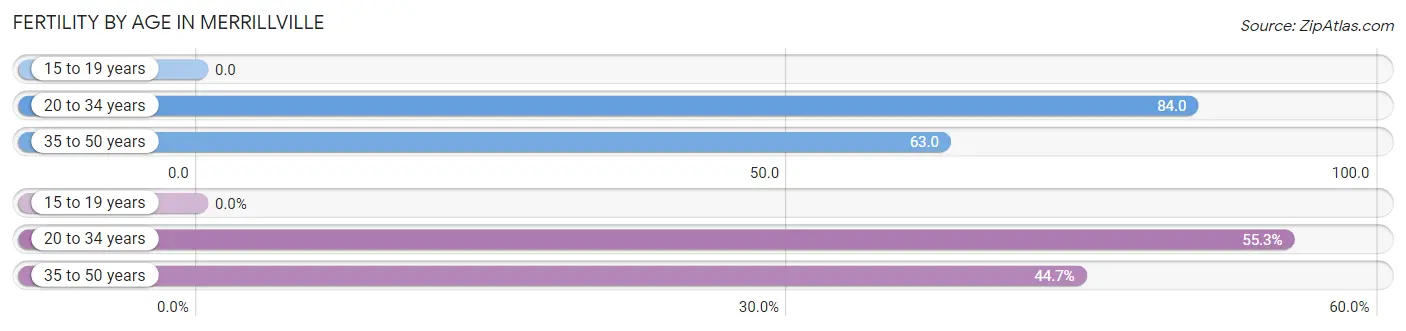
| Age Bracket | Women with Births | Births / 1,000 Women |
| 15 to 19 years | 0 (0.0%) | 0.0 |
| 20 to 34 years | 282 (55.3%) | 84.0 |
| 35 to 50 years | 228 (44.7%) | 63.0 |
| Total | 510 (100.0%) | 62.0 |
Fertility by Age by Marriage Status in Merrillville
58.4% of women with births (510) in Merrillville are married. The highest percentage of unmarried women with births falls into 35 to 50 years age bracket with 50.9% of them unmarried at the time of birth, while the lowest percentage of unmarried women with births belong to 20 to 34 years age bracket with 34.0% of them unmarried.
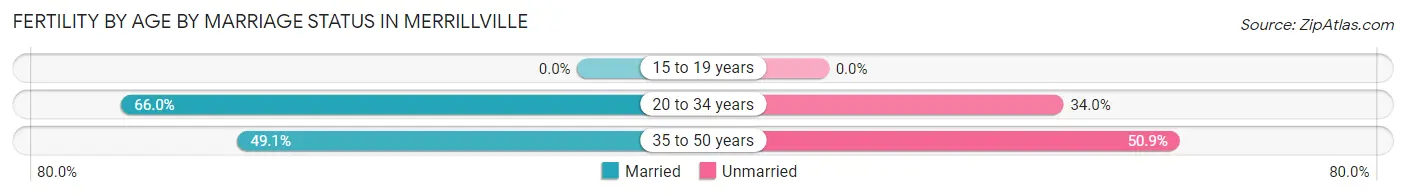
| Age Bracket | Married | Unmarried |
| 15 to 19 years | 0 (0.0%) | 0 (0.0%) |
| 20 to 34 years | 186 (66.0%) | 96 (34.0%) |
| 35 to 50 years | 112 (49.1%) | 116 (50.9%) |
| Total | 298 (58.4%) | 212 (41.6%) |
Fertility by Education in Merrillville
Average fertility rate in Merrillville is 62.0 births per 1,000 women. Women with the education attainment of graduate degree have the highest fertility rate of 104.0 births per 1,000 women, while women with the education attainment of less than high school have the lowest fertility at 31.0 births per 1,000 women. Women with the education attainment of college or associate's degree represent 33.7% of all women with births.
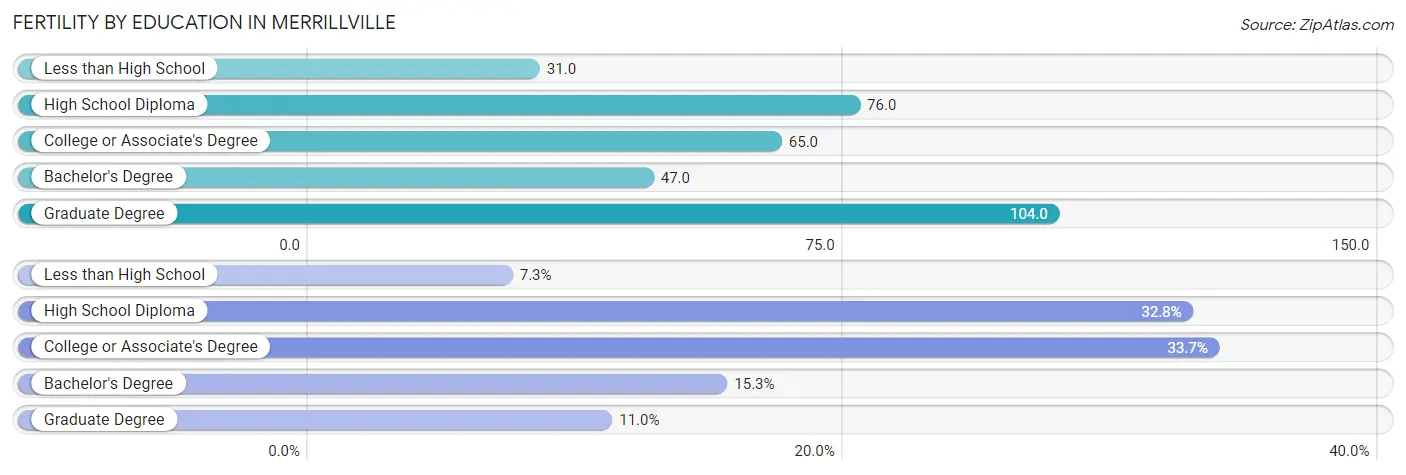
| Educational Attainment | Women with Births | Births / 1,000 Women |
| Less than High School | 37 (7.2%) | 31.0 |
| High School Diploma | 167 (32.8%) | 76.0 |
| College or Associate's Degree | 172 (33.7%) | 65.0 |
| Bachelor's Degree | 78 (15.3%) | 47.0 |
| Graduate Degree | 56 (11.0%) | 104.0 |
| Total | 510 (100.0%) | 62.0 |
Fertility by Education by Marriage Status in Merrillville
41.6% of women with births in Merrillville are unmarried. Women with the educational attainment of graduate degree are most likely to be married with 100.0% of them married at childbirth, while women with the educational attainment of less than high school are least likely to be married with 100.0% of them unmarried at childbirth.
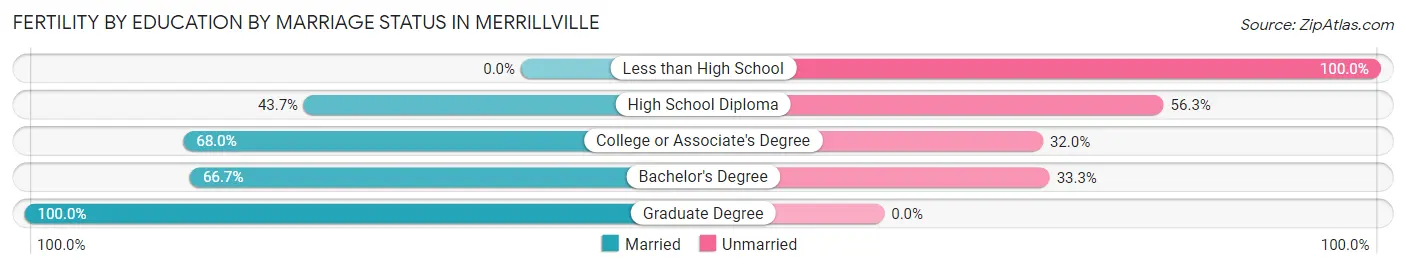
| Educational Attainment | Married | Unmarried |
| Less than High School | 0 (0.0%) | 37 (100.0%) |
| High School Diploma | 73 (43.7%) | 94 (56.3%) |
| College or Associate's Degree | 117 (68.0%) | 55 (32.0%) |
| Bachelor's Degree | 52 (66.7%) | 26 (33.3%) |
| Graduate Degree | 56 (100.0%) | 0 (0.0%) |
| Total | 298 (58.4%) | 212 (41.6%) |
Employment Characteristics in Merrillville
Employment by Class of Employer in Merrillville
Among the 16,307 employed individuals in Merrillville, private company employees (12,203 | 74.8%), not-for-profit organizations (1,248 | 7.6%), and self-employed (not incorporated) (907 | 5.6%) make up the most common classes of employment.
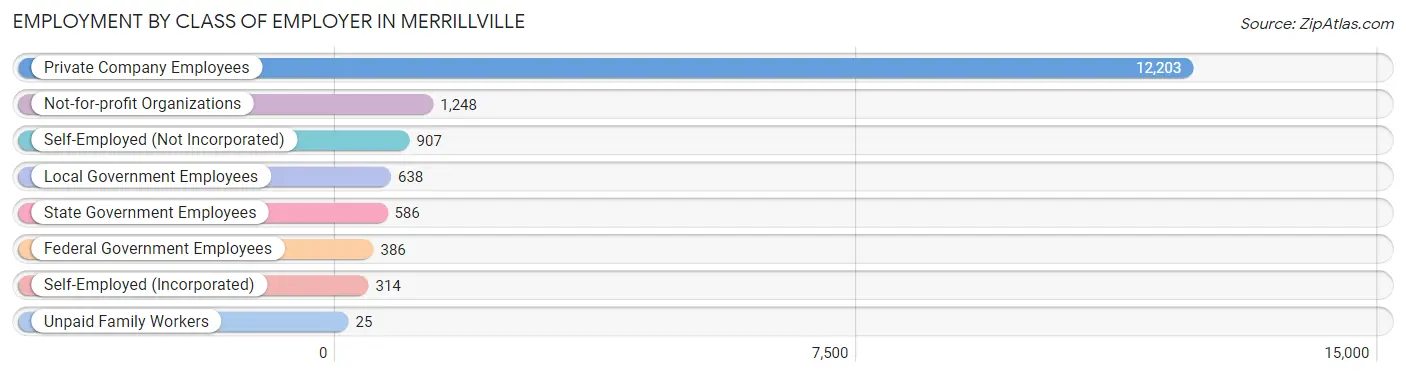
| Employer Class | # Employees | % Employees |
| Private Company Employees | 12,203 | 74.8% |
| Self-Employed (Incorporated) | 314 | 1.9% |
| Self-Employed (Not Incorporated) | 907 | 5.6% |
| Not-for-profit Organizations | 1,248 | 7.6% |
| Local Government Employees | 638 | 3.9% |
| State Government Employees | 586 | 3.6% |
| Federal Government Employees | 386 | 2.4% |
| Unpaid Family Workers | 25 | 0.2% |
| Total | 16,307 | 100.0% |
Employment Status by Age in Merrillville
According to the labor force statistics for Merrillville, out of the total population over 16 years of age (29,238), 61.5% or 17,981 individuals are in the labor force, with 8.2% or 1,474 of them unemployed. The age group with the highest labor force participation rate is 45 to 54 years, with 88.6% or 3,622 individuals in the labor force. Within the labor force, the 20 to 24 years age range has the highest percentage of unemployed individuals, with 21.0% or 465 of them being unemployed.
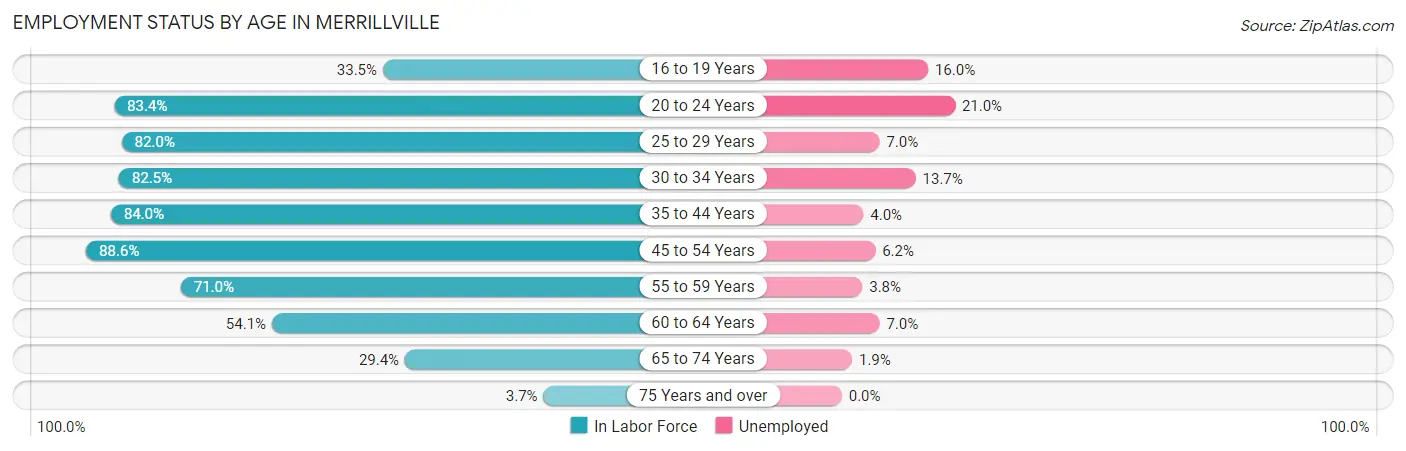
| Age Bracket | In Labor Force | Unemployed |
| 16 to 19 Years | 677 (33.5%) | 108 (16.0%) |
| 20 to 24 Years | 2,214 (83.4%) | 465 (21.0%) |
| 25 to 29 Years | 1,723 (82.0%) | 121 (7.0%) |
| 30 to 34 Years | 1,749 (82.5%) | 240 (13.7%) |
| 35 to 44 Years | 3,695 (84.0%) | 148 (4.0%) |
| 45 to 54 Years | 3,622 (88.6%) | 225 (6.2%) |
| 55 to 59 Years | 1,799 (71.0%) | 68 (3.8%) |
| 60 to 64 Years | 1,158 (54.1%) | 81 (7.0%) |
| 65 to 74 Years | 1,220 (29.4%) | 23 (1.9%) |
| 75 Years and over | 112 (3.7%) | 0 (0.0%) |
| Total | 17,981 (61.5%) | 1,474 (8.2%) |
Employment Status by Educational Attainment in Merrillville
According to labor force statistics for Merrillville, 79.1% of individuals (13,749) out of the total population between 25 and 64 years of age (17,382) are in the labor force, with 6.4% or 880 of them being unemployed. The group with the highest labor force participation rate are those with the educational attainment of bachelor's degree or higher, with 89.5% or 4,296 individuals in the labor force. Within the labor force, individuals with high school diploma education have the highest percentage of unemployment, with 8.3% or 352 of them being unemployed.
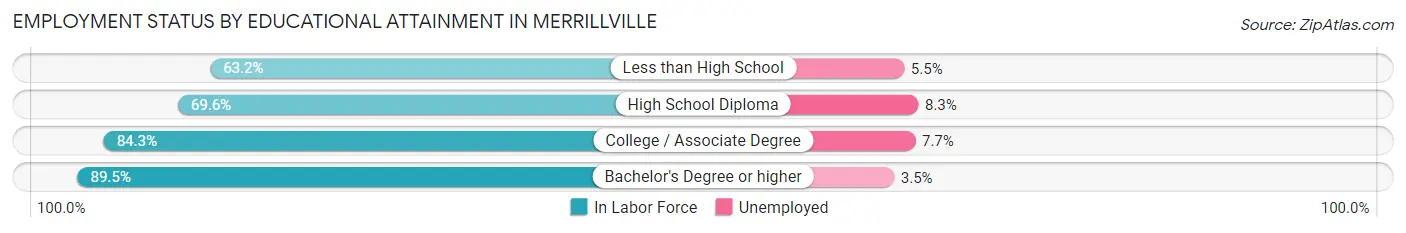
| Educational Attainment | In Labor Force | Unemployed |
| Less than High School | 768 (63.2%) | 67 (5.5%) |
| High School Diploma | 4,244 (69.6%) | 506 (8.3%) |
| College / Associate Degree | 4,443 (84.3%) | 406 (7.7%) |
| Bachelor's Degree or higher | 4,296 (89.5%) | 168 (3.5%) |
| Total | 13,749 (79.1%) | 1,112 (6.4%) |
Employment Occupations by Sex in Merrillville
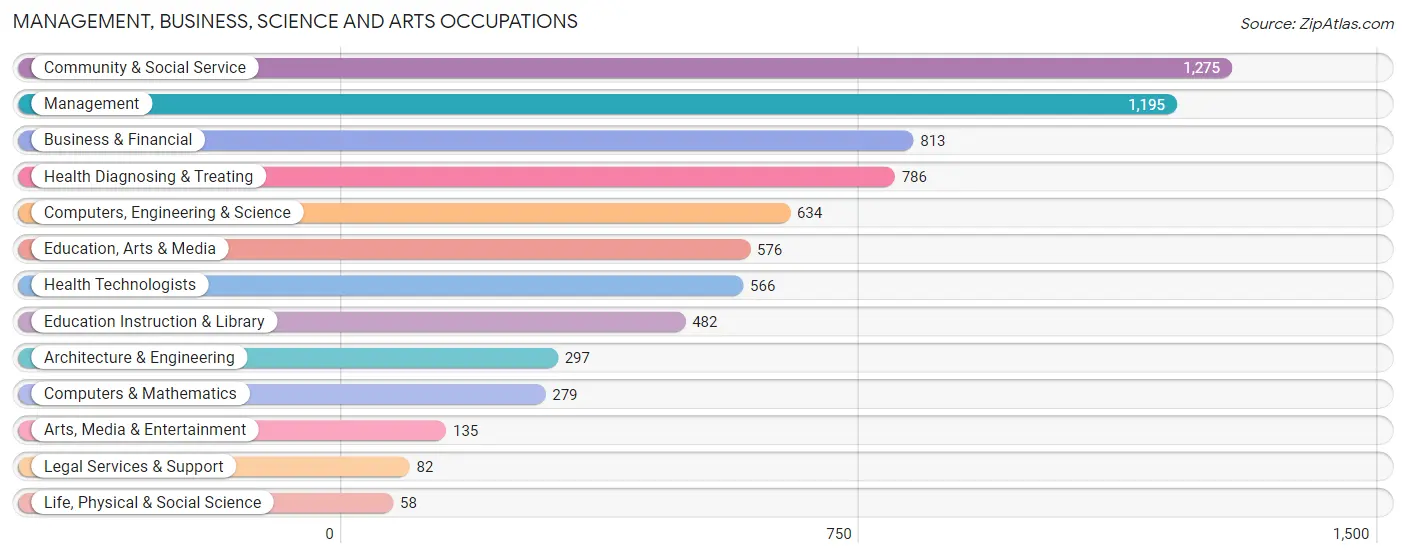
Management, Business, Science and Arts Occupations
The most common Management, Business, Science and Arts occupations in Merrillville are Community & Social Service (1,275 | 7.7%), Management (1,195 | 7.2%), Business & Financial (813 | 4.9%), Health Diagnosing & Treating (786 | 4.8%), and Computers, Engineering & Science (634 | 3.8%).
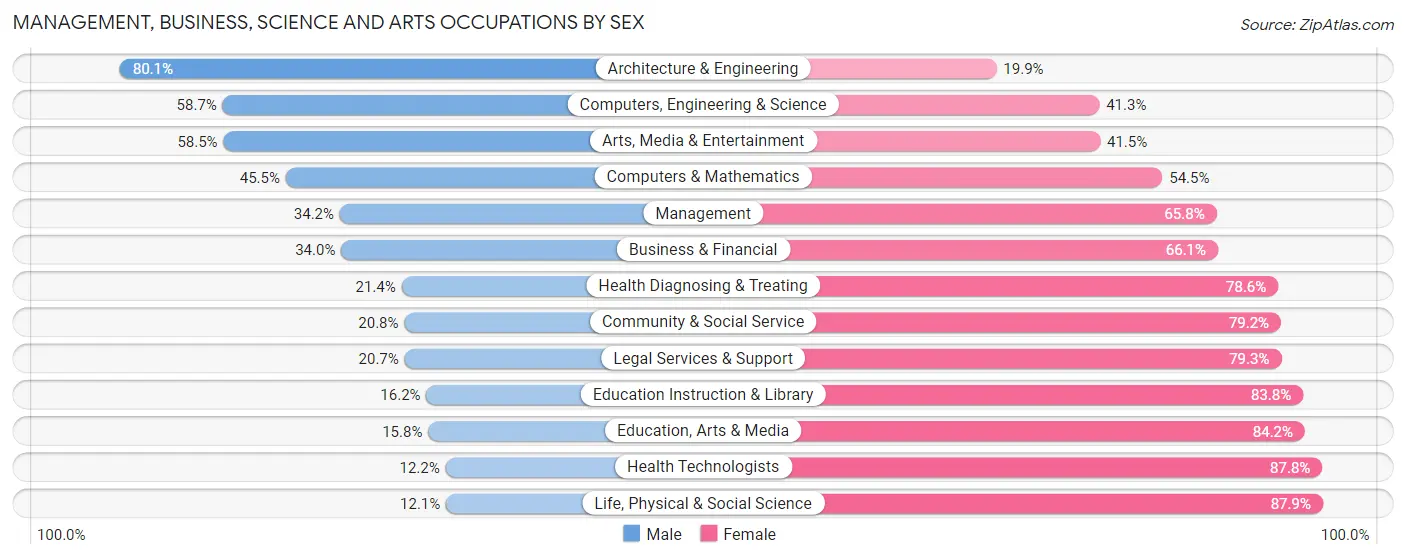
Management, Business, Science and Arts Occupations by Sex
Within the Management, Business, Science and Arts occupations in Merrillville, the most male-oriented occupations are Architecture & Engineering (80.1%), Computers, Engineering & Science (58.7%), and Arts, Media & Entertainment (58.5%), while the most female-oriented occupations are Life, Physical & Social Science (87.9%), Health Technologists (87.8%), and Education, Arts & Media (84.2%).
| Occupation | Male | Female |
| Management | 409 (34.2%) | 786 (65.8%) |
| Business & Financial | 276 (34.0%) | 537 (66.0%) |
| Computers, Engineering & Science | 372 (58.7%) | 262 (41.3%) |
| Computers & Mathematics | 127 (45.5%) | 152 (54.5%) |
| Architecture & Engineering | 238 (80.1%) | 59 (19.9%) |
| Life, Physical & Social Science | 7 (12.1%) | 51 (87.9%) |
| Community & Social Service | 265 (20.8%) | 1,010 (79.2%) |
| Education, Arts & Media | 91 (15.8%) | 485 (84.2%) |
| Legal Services & Support | 17 (20.7%) | 65 (79.3%) |
| Education Instruction & Library | 78 (16.2%) | 404 (83.8%) |
| Arts, Media & Entertainment | 79 (58.5%) | 56 (41.5%) |
| Health Diagnosing & Treating | 168 (21.4%) | 618 (78.6%) |
| Health Technologists | 69 (12.2%) | 497 (87.8%) |
| Total (Category) | 1,490 (31.7%) | 3,213 (68.3%) |
| Total (Overall) | 8,232 (49.9%) | 8,256 (50.1%) |
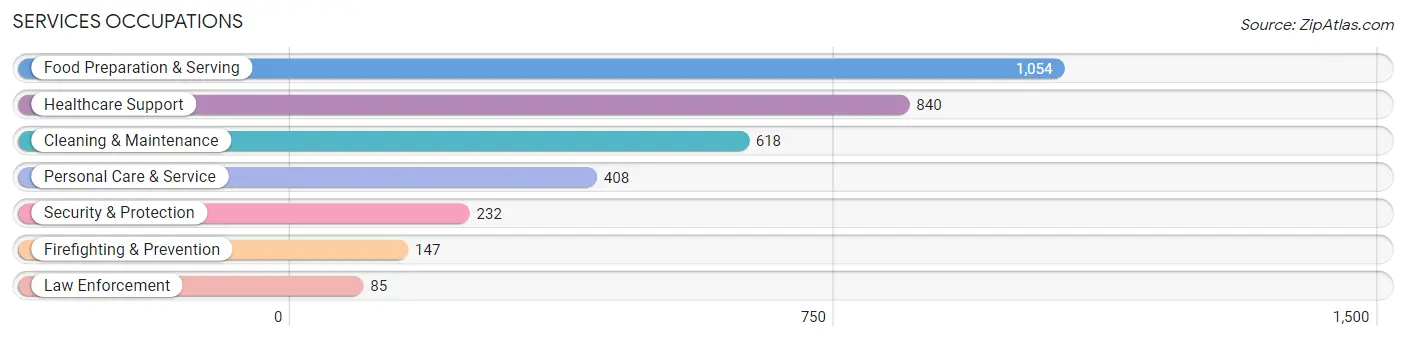
Services Occupations
The most common Services occupations in Merrillville are Food Preparation & Serving (1,054 | 6.4%), Healthcare Support (840 | 5.1%), Cleaning & Maintenance (618 | 3.7%), Personal Care & Service (408 | 2.5%), and Security & Protection (232 | 1.4%).
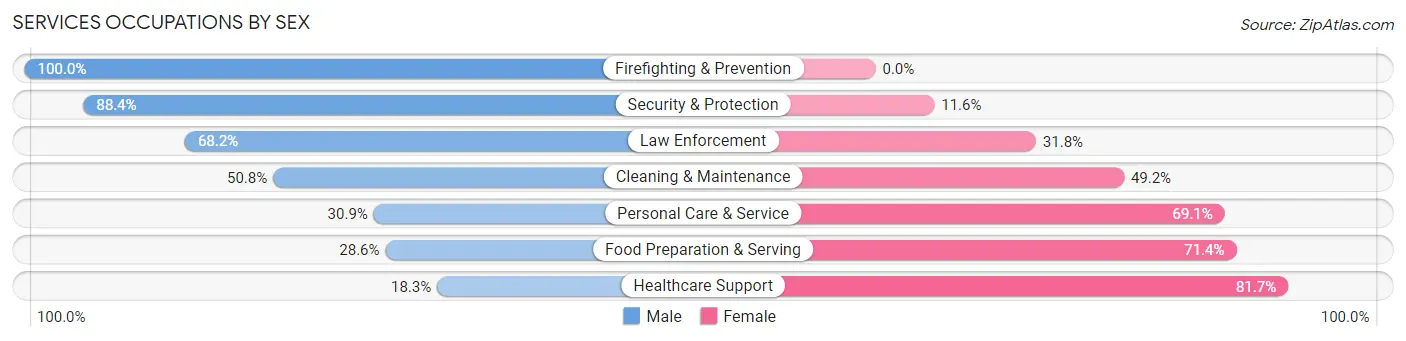
Services Occupations by Sex
Within the Services occupations in Merrillville, the most male-oriented occupations are Firefighting & Prevention (100.0%), Security & Protection (88.4%), and Law Enforcement (68.2%), while the most female-oriented occupations are Healthcare Support (81.7%), Food Preparation & Serving (71.4%), and Personal Care & Service (69.1%).
| Occupation | Male | Female |
| Healthcare Support | 154 (18.3%) | 686 (81.7%) |
| Security & Protection | 205 (88.4%) | 27 (11.6%) |
| Firefighting & Prevention | 147 (100.0%) | 0 (0.0%) |
| Law Enforcement | 58 (68.2%) | 27 (31.8%) |
| Food Preparation & Serving | 301 (28.6%) | 753 (71.4%) |
| Cleaning & Maintenance | 314 (50.8%) | 304 (49.2%) |
| Personal Care & Service | 126 (30.9%) | 282 (69.1%) |
| Total (Category) | 1,100 (34.9%) | 2,052 (65.1%) |
| Total (Overall) | 8,232 (49.9%) | 8,256 (50.1%) |
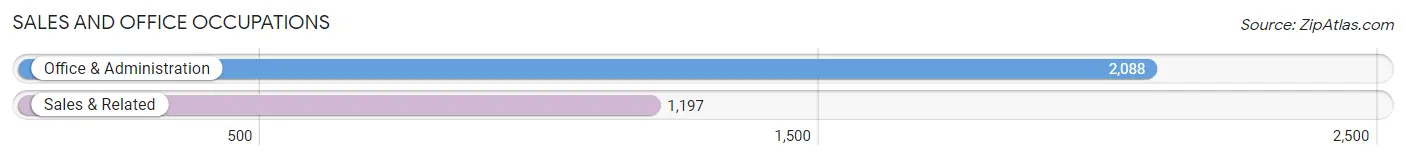
Sales and Office Occupations
The most common Sales and Office occupations in Merrillville are Office & Administration (2,088 | 12.7%), and Sales & Related (1,197 | 7.3%).
Sales and Office Occupations by Sex
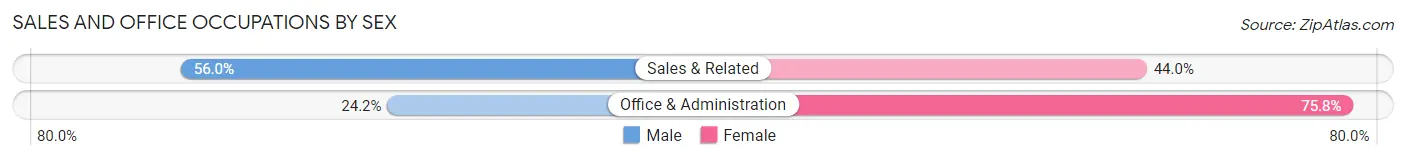
| Occupation | Male | Female |
| Sales & Related | 670 (56.0%) | 527 (44.0%) |
| Office & Administration | 505 (24.2%) | 1,583 (75.8%) |
| Total (Category) | 1,175 (35.8%) | 2,110 (64.2%) |
| Total (Overall) | 8,232 (49.9%) | 8,256 (50.1%) |
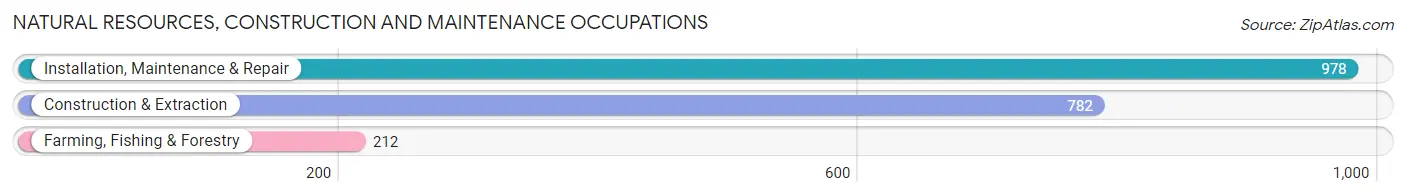
Natural Resources, Construction and Maintenance Occupations
The most common Natural Resources, Construction and Maintenance occupations in Merrillville are Installation, Maintenance & Repair (978 | 5.9%), Construction & Extraction (782 | 4.7%), and Farming, Fishing & Forestry (212 | 1.3%).
Natural Resources, Construction and Maintenance Occupations by Sex
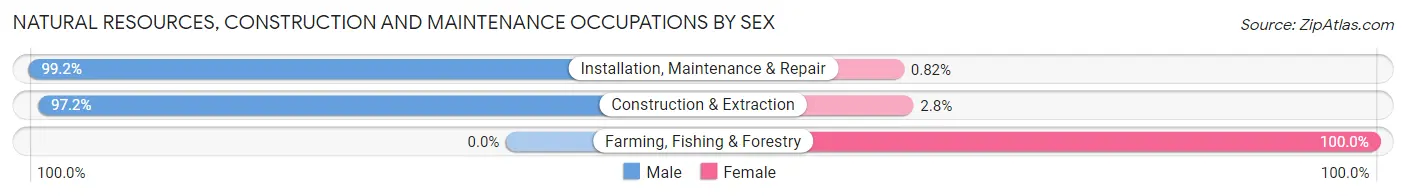
| Occupation | Male | Female |
| Farming, Fishing & Forestry | 0 (0.0%) | 212 (100.0%) |
| Construction & Extraction | 760 (97.2%) | 22 (2.8%) |
| Installation, Maintenance & Repair | 970 (99.2%) | 8 (0.8%) |
| Total (Category) | 1,730 (87.7%) | 242 (12.3%) |
| Total (Overall) | 8,232 (49.9%) | 8,256 (50.1%) |
Production, Transportation and Moving Occupations
The most common Production, Transportation and Moving occupations in Merrillville are Transportation (1,221 | 7.4%), Production (1,145 | 6.9%), and Material Moving (1,010 | 6.1%).
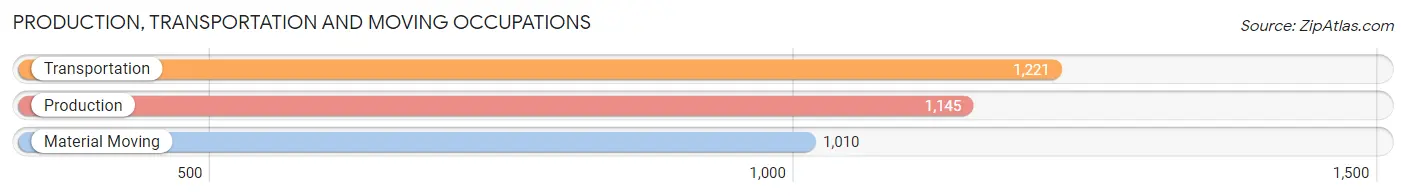
Production, Transportation and Moving Occupations by Sex
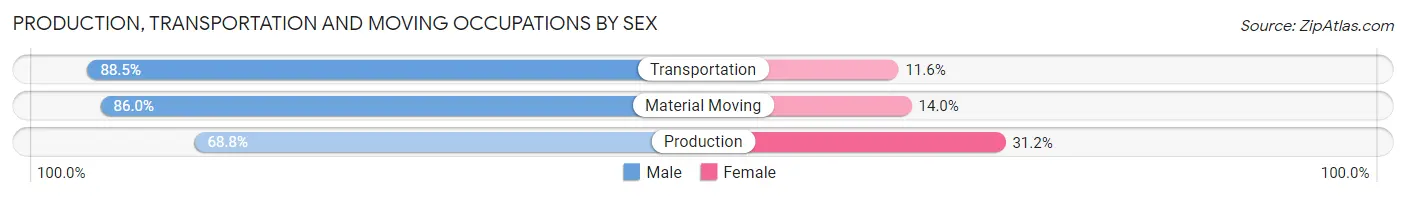
| Occupation | Male | Female |
| Production | 788 (68.8%) | 357 (31.2%) |
| Transportation | 1,080 (88.4%) | 141 (11.6%) |
| Material Moving | 869 (86.0%) | 141 (14.0%) |
| Total (Category) | 2,737 (81.1%) | 639 (18.9%) |
| Total (Overall) | 8,232 (49.9%) | 8,256 (50.1%) |
Employment Industries by Sex in Merrillville
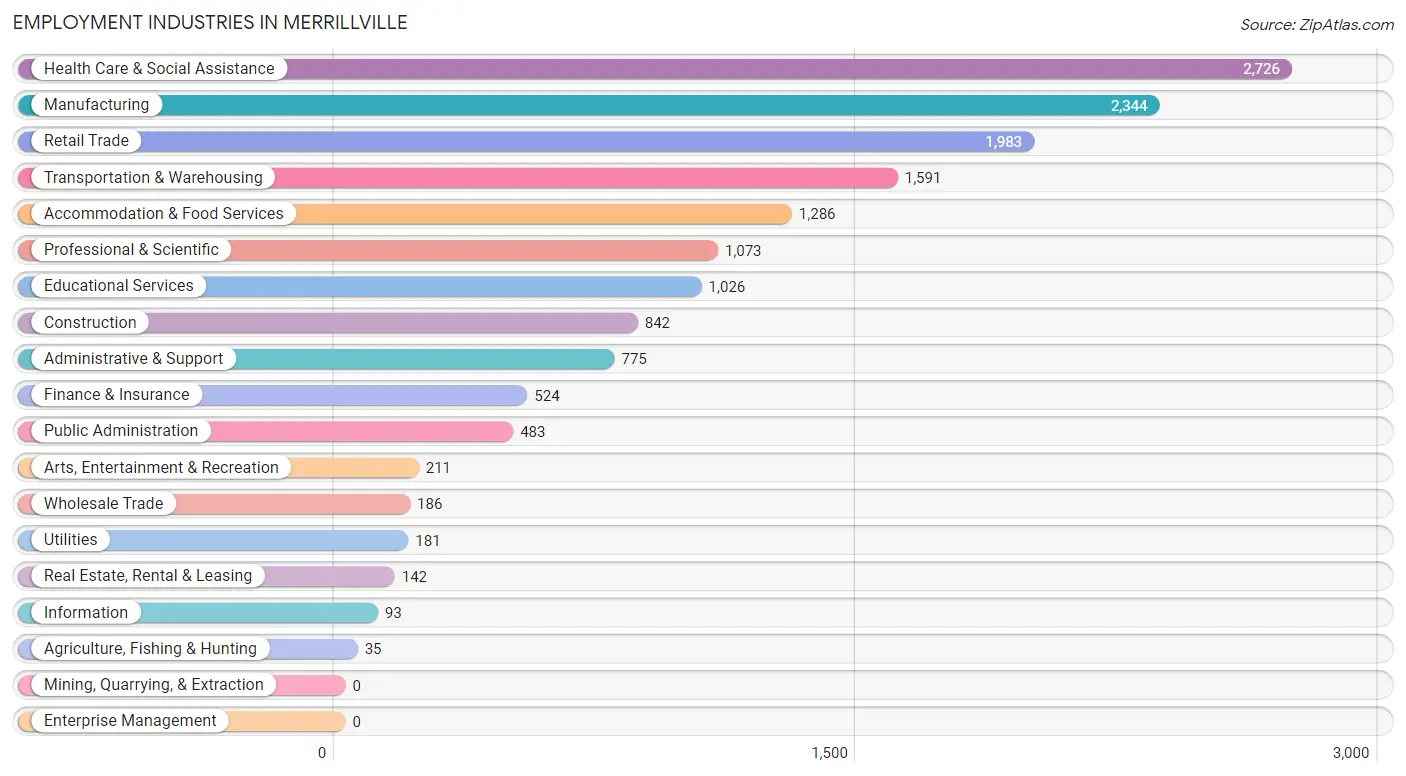
Employment Industries in Merrillville
The major employment industries in Merrillville include Health Care & Social Assistance (2,726 | 16.5%), Manufacturing (2,344 | 14.2%), Retail Trade (1,983 | 12.0%), Transportation & Warehousing (1,591 | 9.7%), and Accommodation & Food Services (1,286 | 7.8%).
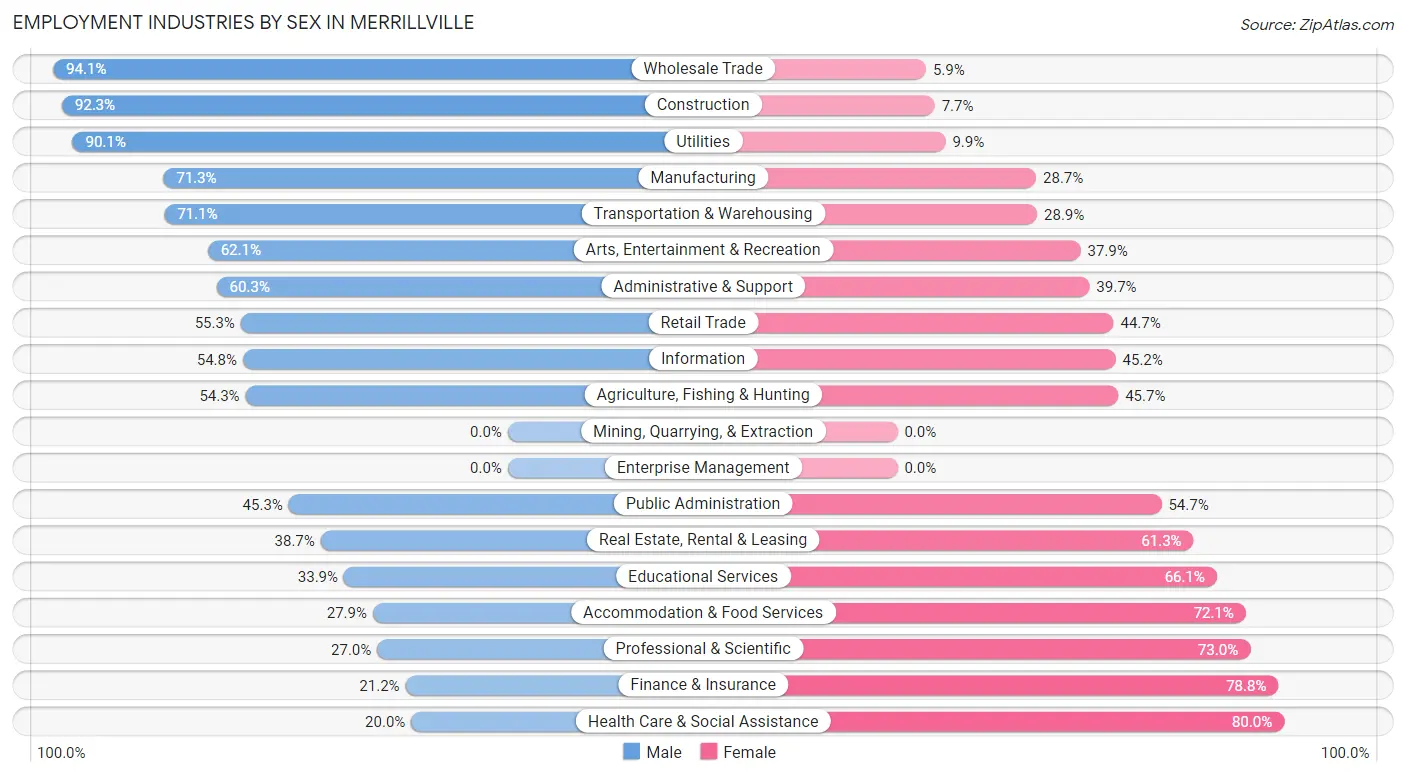
Employment Industries by Sex in Merrillville
The Merrillville industries that see more men than women are Wholesale Trade (94.1%), Construction (92.3%), and Utilities (90.1%), whereas the industries that tend to have a higher number of women are Health Care & Social Assistance (80.0%), Finance & Insurance (78.8%), and Professional & Scientific (73.0%).
| Industry | Male | Female |
| Agriculture, Fishing & Hunting | 19 (54.3%) | 16 (45.7%) |
| Mining, Quarrying, & Extraction | 0 (0.0%) | 0 (0.0%) |
| Construction | 777 (92.3%) | 65 (7.7%) |
| Manufacturing | 1,671 (71.3%) | 673 (28.7%) |
| Wholesale Trade | 175 (94.1%) | 11 (5.9%) |
| Retail Trade | 1,096 (55.3%) | 887 (44.7%) |
| Transportation & Warehousing | 1,131 (71.1%) | 460 (28.9%) |
| Utilities | 163 (90.1%) | 18 (9.9%) |
| Information | 51 (54.8%) | 42 (45.2%) |
| Finance & Insurance | 111 (21.2%) | 413 (78.8%) |
| Real Estate, Rental & Leasing | 55 (38.7%) | 87 (61.3%) |
| Professional & Scientific | 290 (27.0%) | 783 (73.0%) |
| Enterprise Management | 0 (0.0%) | 0 (0.0%) |
| Administrative & Support | 467 (60.3%) | 308 (39.7%) |
| Educational Services | 348 (33.9%) | 678 (66.1%) |
| Health Care & Social Assistance | 545 (20.0%) | 2,181 (80.0%) |
| Arts, Entertainment & Recreation | 131 (62.1%) | 80 (37.9%) |
| Accommodation & Food Services | 359 (27.9%) | 927 (72.1%) |
| Public Administration | 219 (45.3%) | 264 (54.7%) |
| Total | 8,232 (49.9%) | 8,256 (50.1%) |
Education in Merrillville
School Enrollment in Merrillville
The most common levels of schooling among the 8,101 students in Merrillville are high school (1,995 | 24.6%), elementary school (1,794 | 22.2%), and middle school (1,487 | 18.4%).
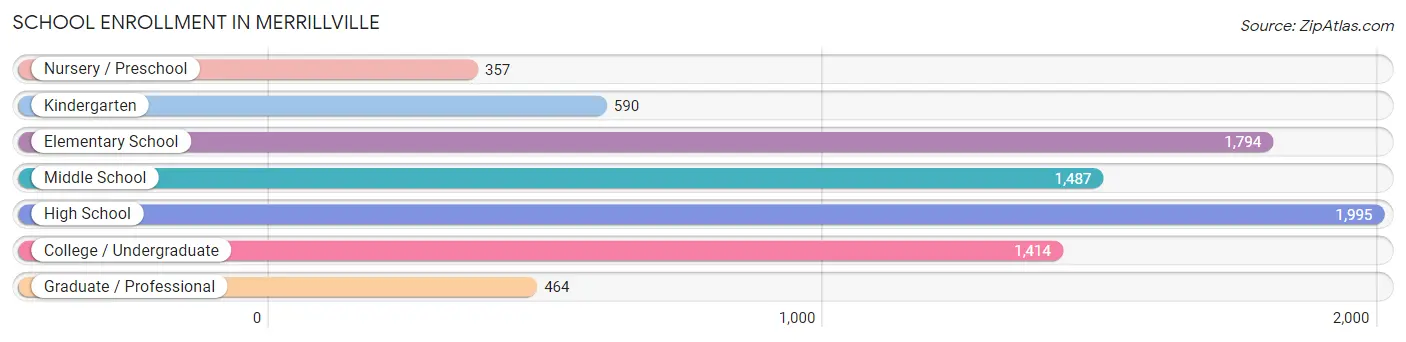
| School Level | # Students | % Students |
| Nursery / Preschool | 357 | 4.4% |
| Kindergarten | 590 | 7.3% |
| Elementary School | 1,794 | 22.2% |
| Middle School | 1,487 | 18.4% |
| High School | 1,995 | 24.6% |
| College / Undergraduate | 1,414 | 17.4% |
| Graduate / Professional | 464 | 5.7% |
| Total | 8,101 | 100.0% |
School Enrollment by Age by Funding Source in Merrillville
Out of a total of 8,101 students who are enrolled in schools in Merrillville, 778 (9.6%) attend a private institution, while the remaining 7,323 (90.4%) are enrolled in public schools. The age group of 25 to 34 year olds has the highest likelihood of being enrolled in private schools, with 153 (36.5% in the age bracket) enrolled. Conversely, the age group of 5 to 9 year old has the lowest likelihood of being enrolled in a private school, with 2,149 (97.4% in the age bracket) attending a public institution.
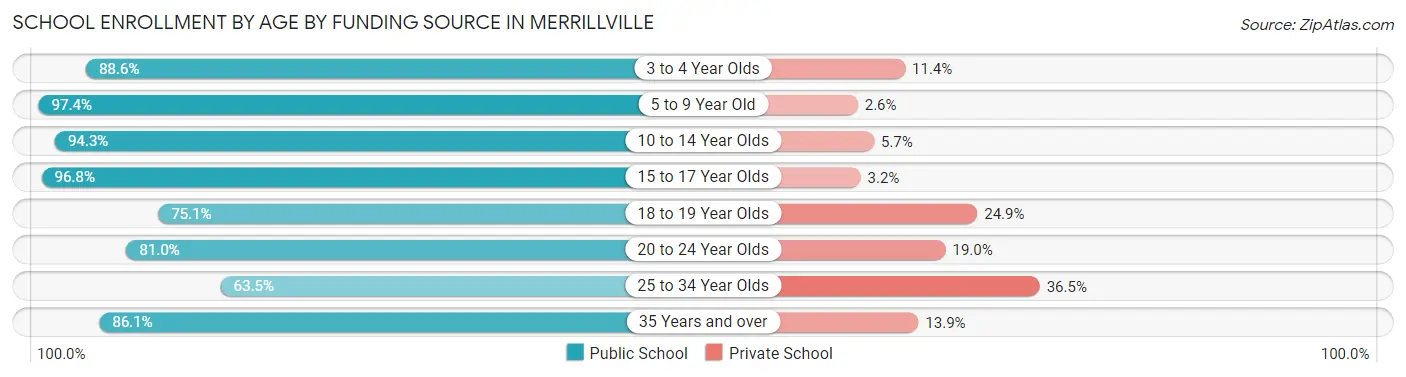
| Age Bracket | Public School | Private School |
| 3 to 4 Year Olds | 240 (88.6%) | 31 (11.4%) |
| 5 to 9 Year Old | 2,149 (97.4%) | 58 (2.6%) |
| 10 to 14 Year Olds | 1,684 (94.3%) | 101 (5.7%) |
| 15 to 17 Year Olds | 1,441 (96.8%) | 47 (3.2%) |
| 18 to 19 Year Olds | 501 (75.1%) | 166 (24.9%) |
| 20 to 24 Year Olds | 675 (81.0%) | 158 (19.0%) |
| 25 to 34 Year Olds | 266 (63.5%) | 153 (36.5%) |
| 35 Years and over | 371 (86.1%) | 60 (13.9%) |
| Total | 7,323 (90.4%) | 778 (9.6%) |
Educational Attainment by Field of Study in Merrillville
Business (1,485 | 23.2%), education (1,098 | 17.1%), science & technology (1,047 | 16.3%), social sciences (432 | 6.7%), and arts & humanities (429 | 6.7%) are the most common fields of study among 6,414 individuals in Merrillville who have obtained a bachelor's degree or higher.
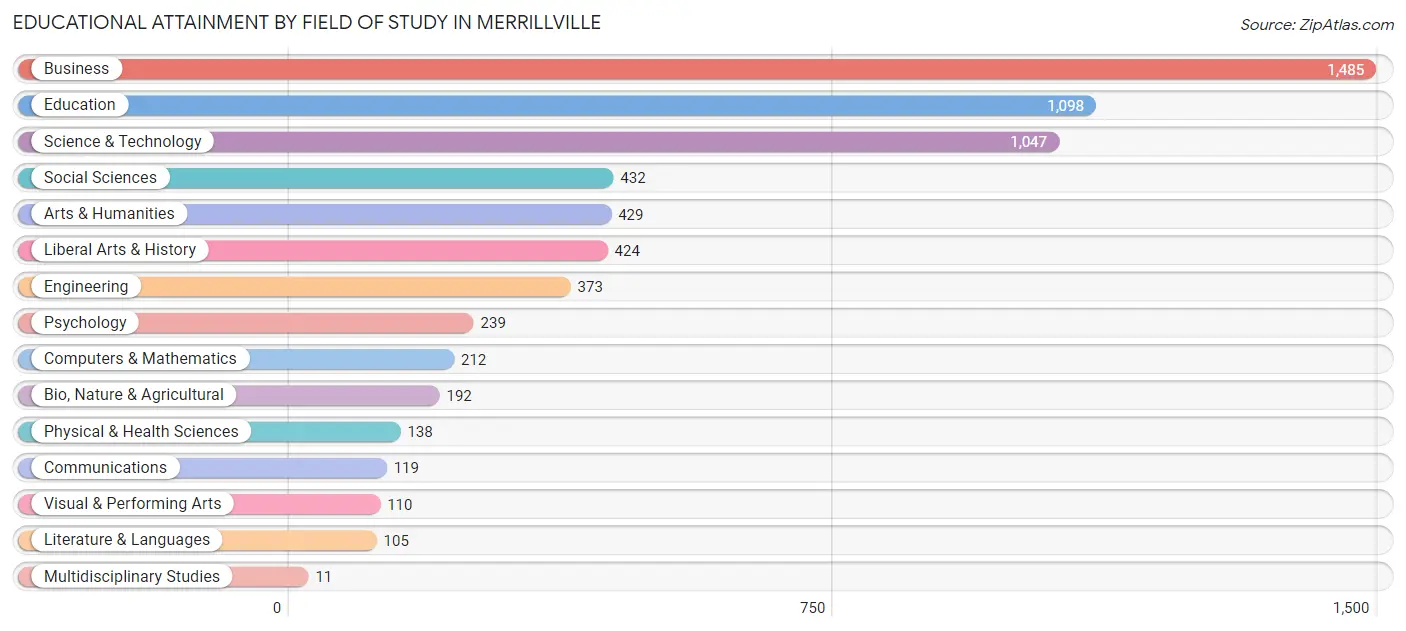
| Field of Study | # Graduates | % Graduates |
| Computers & Mathematics | 212 | 3.3% |
| Bio, Nature & Agricultural | 192 | 3.0% |
| Physical & Health Sciences | 138 | 2.1% |
| Psychology | 239 | 3.7% |
| Social Sciences | 432 | 6.7% |
| Engineering | 373 | 5.8% |
| Multidisciplinary Studies | 11 | 0.2% |
| Science & Technology | 1,047 | 16.3% |
| Business | 1,485 | 23.2% |
| Education | 1,098 | 17.1% |
| Literature & Languages | 105 | 1.6% |
| Liberal Arts & History | 424 | 6.6% |
| Visual & Performing Arts | 110 | 1.7% |
| Communications | 119 | 1.9% |
| Arts & Humanities | 429 | 6.7% |
| Total | 6,414 | 100.0% |
Transportation & Commute in Merrillville
Vehicle Availability by Sex in Merrillville
The most prevalent vehicle ownership categories in Merrillville are males with 2 vehicles (3,144, accounting for 38.5%) and females with 2 vehicles (3,108, making up 38.7%).
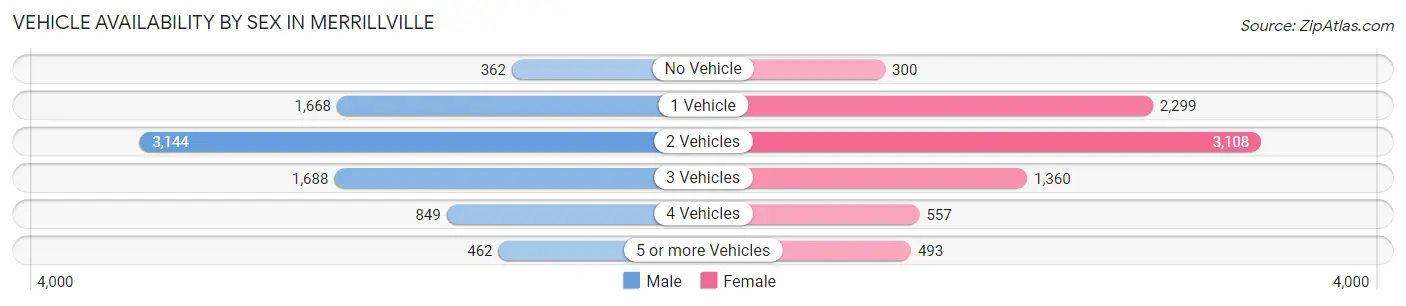
| Vehicles Available | Male | Female |
| No Vehicle | 362 (4.4%) | 300 (3.7%) |
| 1 Vehicle | 1,668 (20.4%) | 2,299 (28.3%) |
| 2 Vehicles | 3,144 (38.5%) | 3,108 (38.3%) |
| 3 Vehicles | 1,688 (20.6%) | 1,360 (16.8%) |
| 4 Vehicles | 849 (10.4%) | 557 (6.9%) |
| 5 or more Vehicles | 462 (5.7%) | 493 (6.1%) |
| Total | 8,173 (100.0%) | 8,117 (100.0%) |
Commute Time in Merrillville
The most frequently occuring commute durations in Merrillville are 30 to 34 minutes (2,450 commuters, 16.0%), 15 to 19 minutes (2,429 commuters, 15.9%), and 20 to 24 minutes (2,035 commuters, 13.3%).
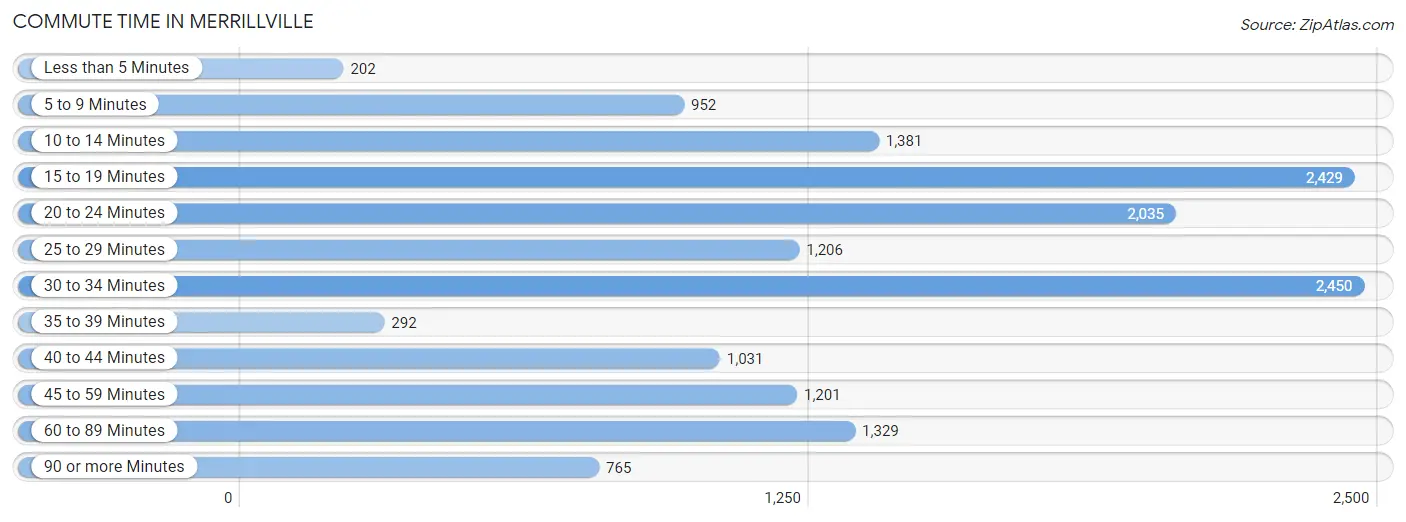
| Commute Time | # Commuters | % Commuters |
| Less than 5 Minutes | 202 | 1.3% |
| 5 to 9 Minutes | 952 | 6.2% |
| 10 to 14 Minutes | 1,381 | 9.0% |
| 15 to 19 Minutes | 2,429 | 15.9% |
| 20 to 24 Minutes | 2,035 | 13.3% |
| 25 to 29 Minutes | 1,206 | 7.9% |
| 30 to 34 Minutes | 2,450 | 16.0% |
| 35 to 39 Minutes | 292 | 1.9% |
| 40 to 44 Minutes | 1,031 | 6.8% |
| 45 to 59 Minutes | 1,201 | 7.9% |
| 60 to 89 Minutes | 1,329 | 8.7% |
| 90 or more Minutes | 765 | 5.0% |
Commute Time by Sex in Merrillville
The most common commute times in Merrillville are 30 to 34 minutes (1,338 commuters, 17.1%) for males and 15 to 19 minutes (1,287 commuters, 17.3%) for females.
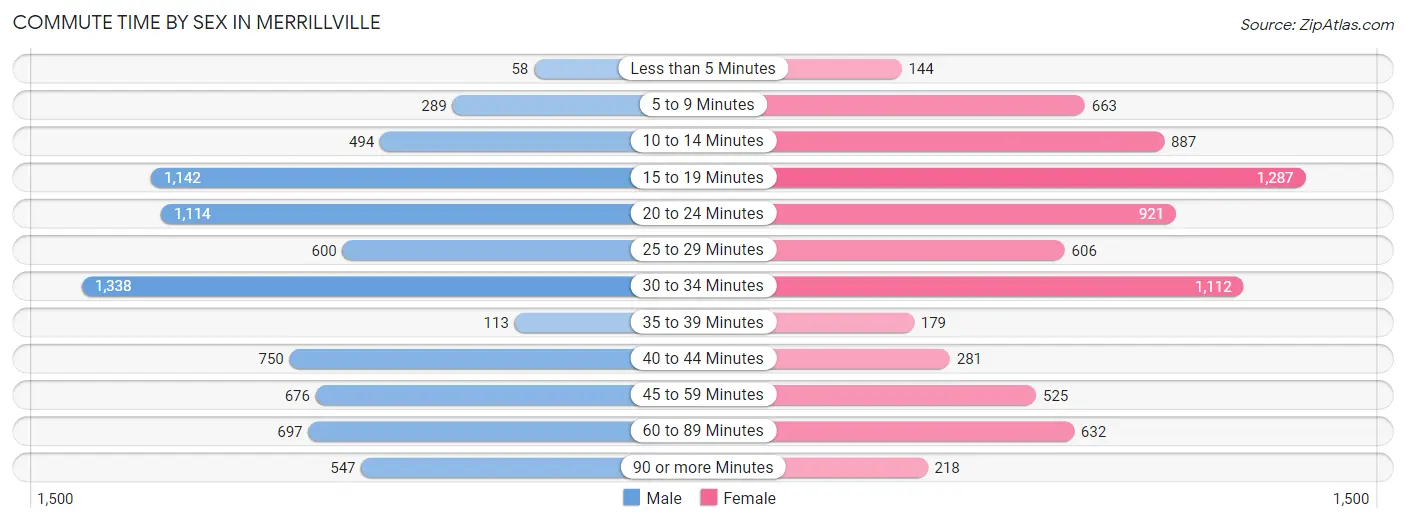
| Commute Time | Male | Female |
| Less than 5 Minutes | 58 (0.7%) | 144 (1.9%) |
| 5 to 9 Minutes | 289 (3.7%) | 663 (8.9%) |
| 10 to 14 Minutes | 494 (6.3%) | 887 (11.9%) |
| 15 to 19 Minutes | 1,142 (14.6%) | 1,287 (17.3%) |
| 20 to 24 Minutes | 1,114 (14.2%) | 921 (12.3%) |
| 25 to 29 Minutes | 600 (7.7%) | 606 (8.1%) |
| 30 to 34 Minutes | 1,338 (17.1%) | 1,112 (14.9%) |
| 35 to 39 Minutes | 113 (1.5%) | 179 (2.4%) |
| 40 to 44 Minutes | 750 (9.6%) | 281 (3.8%) |
| 45 to 59 Minutes | 676 (8.6%) | 525 (7.0%) |
| 60 to 89 Minutes | 697 (8.9%) | 632 (8.5%) |
| 90 or more Minutes | 547 (7.0%) | 218 (2.9%) |
Time of Departure to Work by Sex in Merrillville
The most frequent times of departure to work in Merrillville are 12:00 AM to 4:59 AM (916, 11.7%) for males and 7:30 AM to 7:59 AM (1,137, 15.2%) for females.
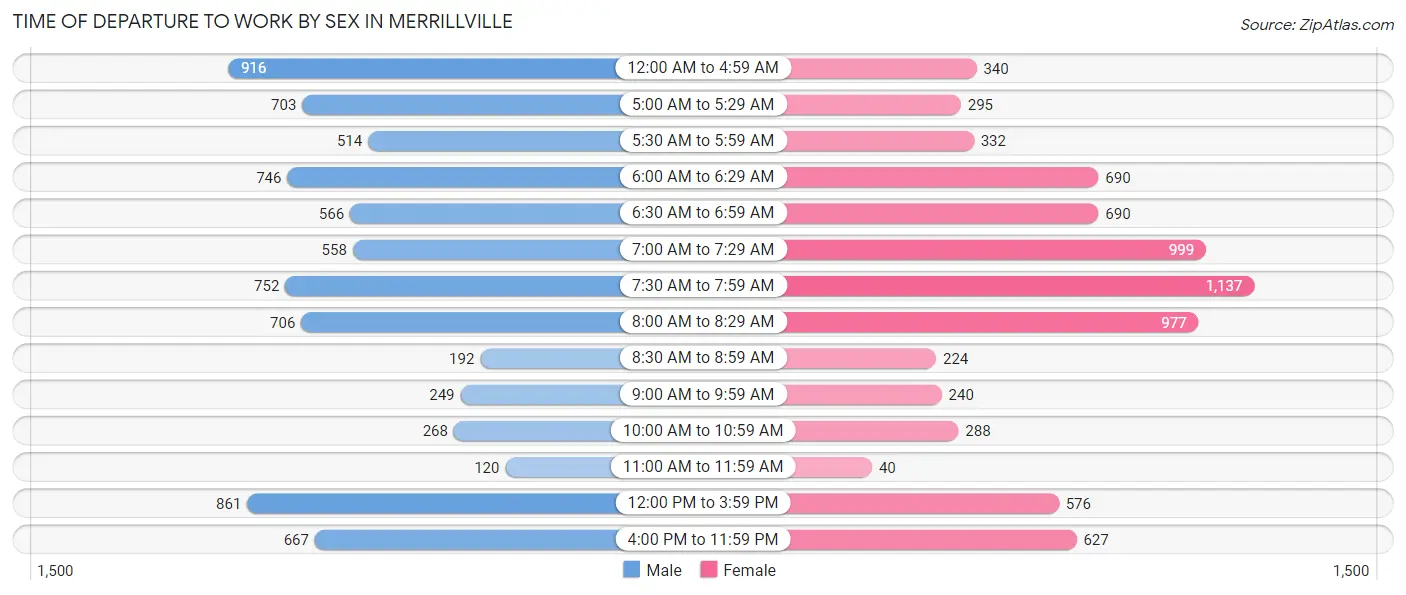
| Time of Departure | Male | Female |
| 12:00 AM to 4:59 AM | 916 (11.7%) | 340 (4.6%) |
| 5:00 AM to 5:29 AM | 703 (9.0%) | 295 (4.0%) |
| 5:30 AM to 5:59 AM | 514 (6.6%) | 332 (4.4%) |
| 6:00 AM to 6:29 AM | 746 (9.5%) | 690 (9.3%) |
| 6:30 AM to 6:59 AM | 566 (7.2%) | 690 (9.3%) |
| 7:00 AM to 7:29 AM | 558 (7.1%) | 999 (13.4%) |
| 7:30 AM to 7:59 AM | 752 (9.6%) | 1,137 (15.2%) |
| 8:00 AM to 8:29 AM | 706 (9.0%) | 977 (13.1%) |
| 8:30 AM to 8:59 AM | 192 (2.5%) | 224 (3.0%) |
| 9:00 AM to 9:59 AM | 249 (3.2%) | 240 (3.2%) |
| 10:00 AM to 10:59 AM | 268 (3.4%) | 288 (3.9%) |
| 11:00 AM to 11:59 AM | 120 (1.5%) | 40 (0.5%) |
| 12:00 PM to 3:59 PM | 861 (11.0%) | 576 (7.7%) |
| 4:00 PM to 11:59 PM | 667 (8.5%) | 627 (8.4%) |
| Total | 7,818 (100.0%) | 7,455 (100.0%) |
Housing Occupancy in Merrillville
Occupancy by Ownership in Merrillville
Of the total 15,176 dwellings in Merrillville, owner-occupied units account for 10,196 (67.2%), while renter-occupied units make up 4,980 (32.8%).
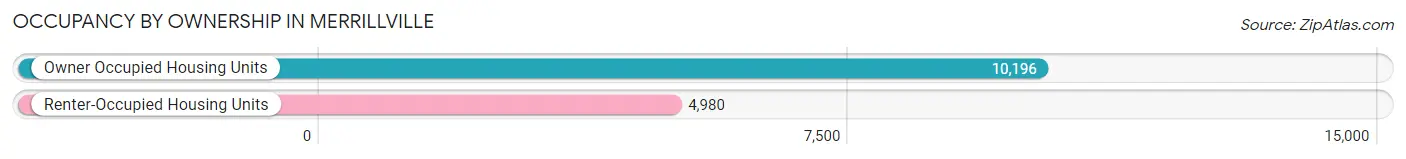
| Occupancy | # Housing Units | % Housing Units |
| Owner Occupied Housing Units | 10,196 | 67.2% |
| Renter-Occupied Housing Units | 4,980 | 32.8% |
| Total Occupied Housing Units | 15,176 | 100.0% |
Occupancy by Household Size in Merrillville
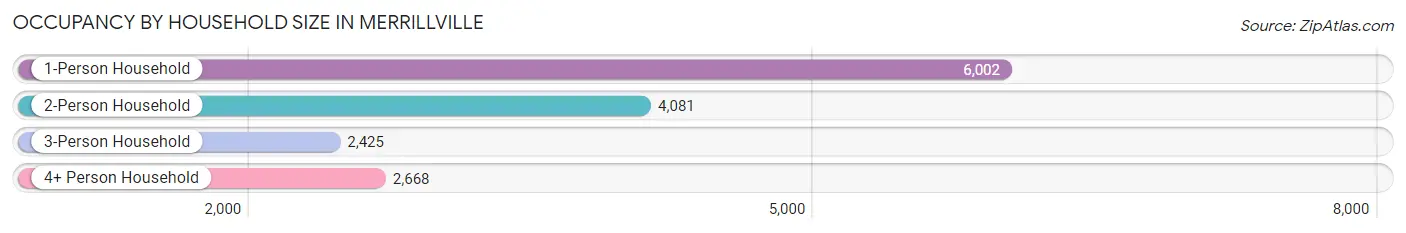
| Household Size | # Housing Units | % Housing Units |
| 1-Person Household | 6,002 | 39.6% |
| 2-Person Household | 4,081 | 26.9% |
| 3-Person Household | 2,425 | 16.0% |
| 4+ Person Household | 2,668 | 17.6% |
| Total Housing Units | 15,176 | 100.0% |
Occupancy by Ownership by Household Size in Merrillville
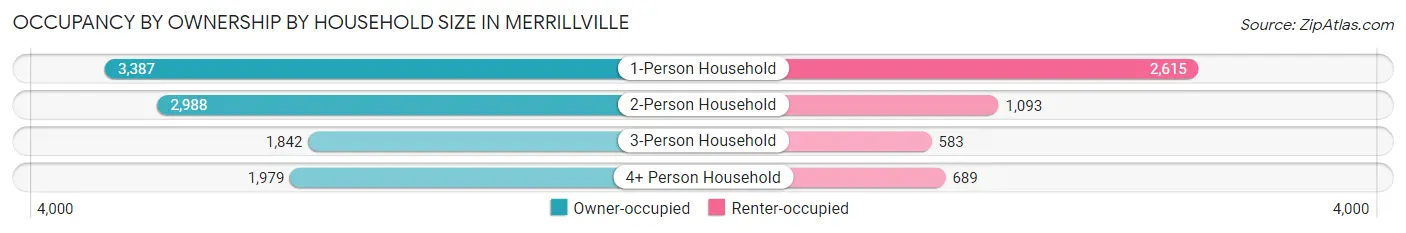
| Household Size | Owner-occupied | Renter-occupied |
| 1-Person Household | 3,387 (56.4%) | 2,615 (43.6%) |
| 2-Person Household | 2,988 (73.2%) | 1,093 (26.8%) |
| 3-Person Household | 1,842 (76.0%) | 583 (24.0%) |
| 4+ Person Household | 1,979 (74.2%) | 689 (25.8%) |
| Total Housing Units | 10,196 (67.2%) | 4,980 (32.8%) |
Occupancy by Educational Attainment in Merrillville
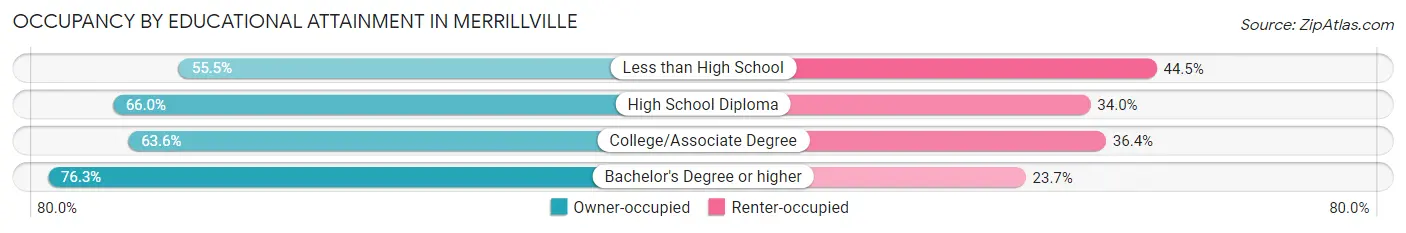
| Household Size | Owner-occupied | Renter-occupied |
| Less than High School | 618 (55.5%) | 495 (44.5%) |
| High School Diploma | 2,978 (66.0%) | 1,533 (34.0%) |
| College/Associate Degree | 3,432 (63.6%) | 1,968 (36.4%) |
| Bachelor's Degree or higher | 3,168 (76.3%) | 984 (23.7%) |
Occupancy by Age of Householder in Merrillville
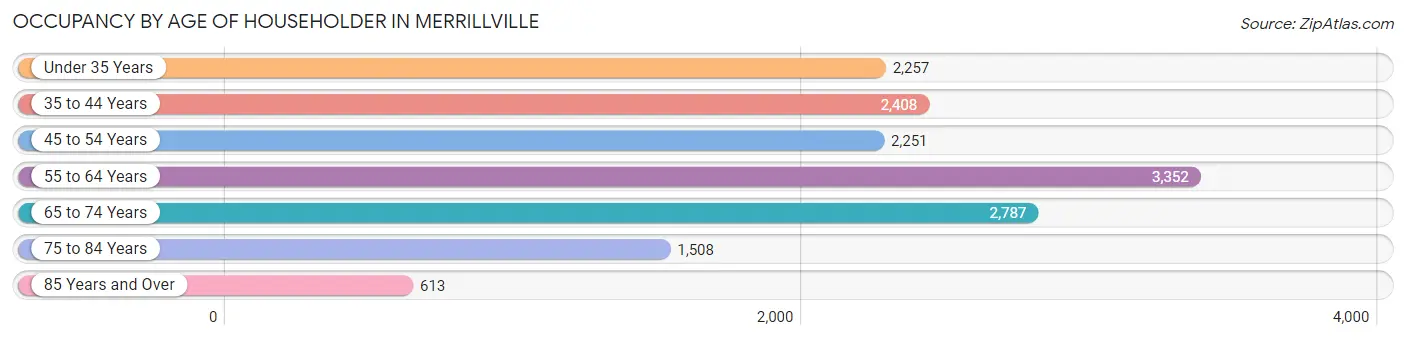
| Age Bracket | # Households | % Households |
| Under 35 Years | 2,257 | 14.9% |
| 35 to 44 Years | 2,408 | 15.9% |
| 45 to 54 Years | 2,251 | 14.8% |
| 55 to 64 Years | 3,352 | 22.1% |
| 65 to 74 Years | 2,787 | 18.4% |
| 75 to 84 Years | 1,508 | 9.9% |
| 85 Years and Over | 613 | 4.0% |
| Total | 15,176 | 100.0% |
Housing Finances in Merrillville
Median Income by Occupancy in Merrillville
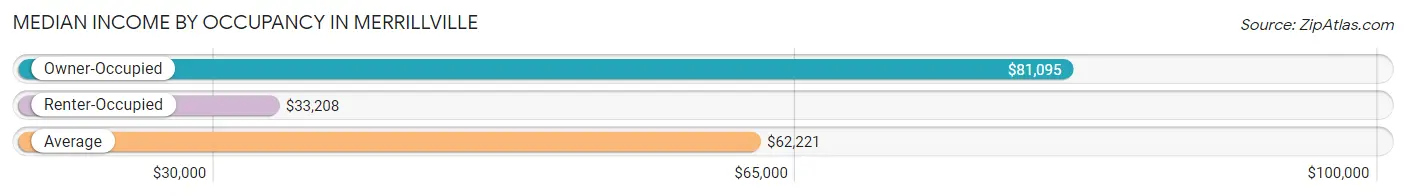
| Occupancy Type | # Households | Median Income |
| Owner-Occupied | 10,196 (67.2%) | $81,095 |
| Renter-Occupied | 4,980 (32.8%) | $33,208 |
| Average | 15,176 (100.0%) | $62,221 |
Occupancy by Householder Income Bracket in Merrillville
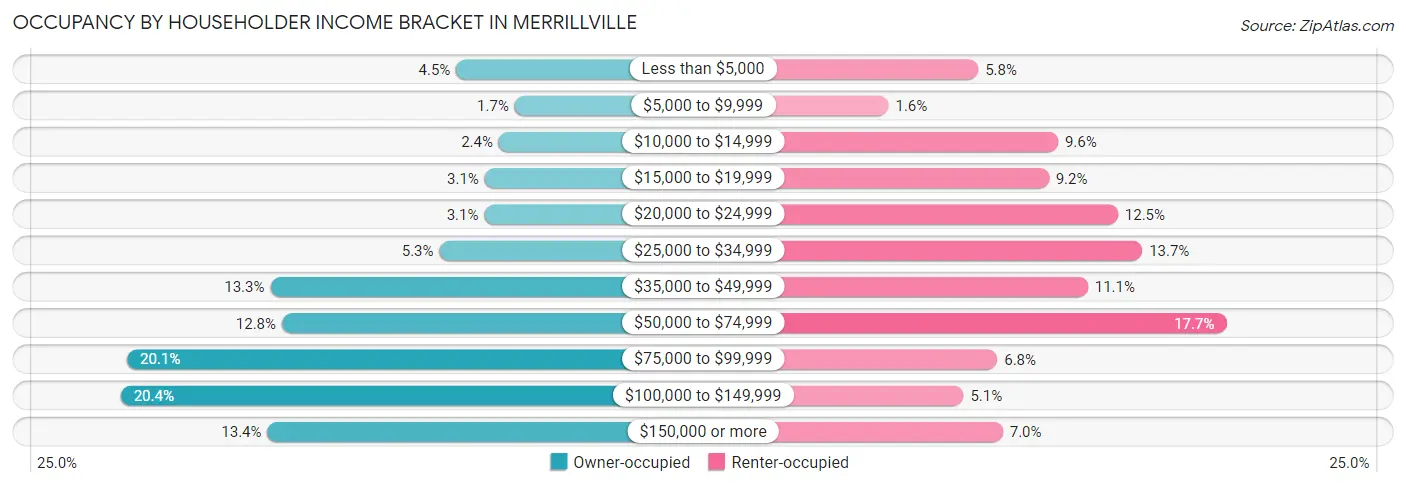
| Income Bracket | Owner-occupied | Renter-occupied |
| Less than $5,000 | 454 (4.4%) | 291 (5.8%) |
| $5,000 to $9,999 | 169 (1.7%) | 78 (1.6%) |
| $10,000 to $14,999 | 247 (2.4%) | 480 (9.6%) |
| $15,000 to $19,999 | 315 (3.1%) | 458 (9.2%) |
| $20,000 to $24,999 | 317 (3.1%) | 622 (12.5%) |
| $25,000 to $34,999 | 535 (5.2%) | 680 (13.7%) |
| $35,000 to $49,999 | 1,356 (13.3%) | 551 (11.1%) |
| $50,000 to $74,999 | 1,300 (12.8%) | 879 (17.6%) |
| $75,000 to $99,999 | 2,051 (20.1%) | 336 (6.8%) |
| $100,000 to $149,999 | 2,082 (20.4%) | 256 (5.1%) |
| $150,000 or more | 1,370 (13.4%) | 349 (7.0%) |
| Total | 10,196 (100.0%) | 4,980 (100.0%) |
Monthly Housing Cost Tiers in Merrillville
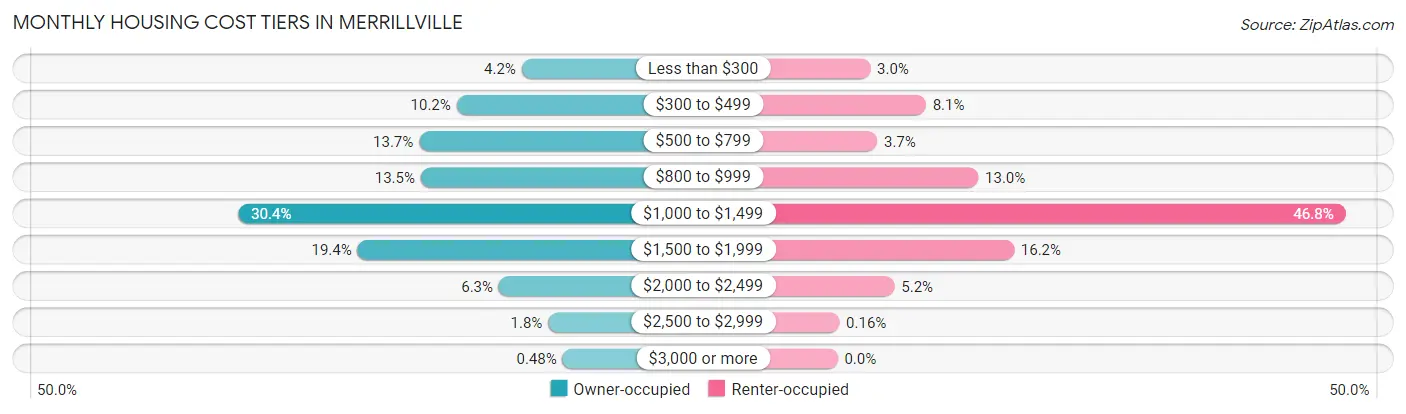
| Monthly Cost | Owner-occupied | Renter-occupied |
| Less than $300 | 432 (4.2%) | 150 (3.0%) |
| $300 to $499 | 1,043 (10.2%) | 405 (8.1%) |
| $500 to $799 | 1,395 (13.7%) | 182 (3.6%) |
| $800 to $999 | 1,380 (13.5%) | 645 (13.0%) |
| $1,000 to $1,499 | 3,094 (30.3%) | 2,329 (46.8%) |
| $1,500 to $1,999 | 1,973 (19.4%) | 809 (16.2%) |
| $2,000 to $2,499 | 646 (6.3%) | 261 (5.2%) |
| $2,500 to $2,999 | 184 (1.8%) | 8 (0.2%) |
| $3,000 or more | 49 (0.5%) | 0 (0.0%) |
| Total | 10,196 (100.0%) | 4,980 (100.0%) |
Physical Housing Characteristics in Merrillville
Housing Structures in Merrillville
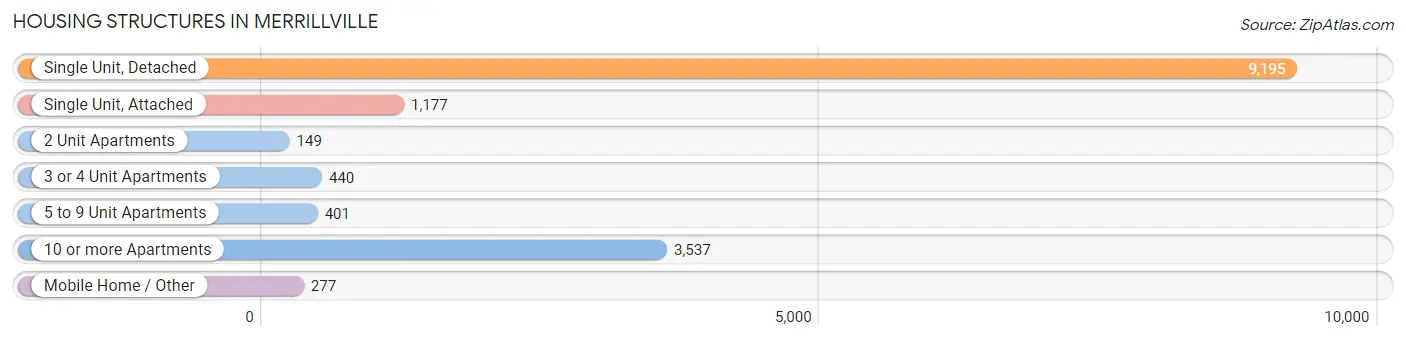
| Structure Type | # Housing Units | % Housing Units |
| Single Unit, Detached | 9,195 | 60.6% |
| Single Unit, Attached | 1,177 | 7.8% |
| 2 Unit Apartments | 149 | 1.0% |
| 3 or 4 Unit Apartments | 440 | 2.9% |
| 5 to 9 Unit Apartments | 401 | 2.6% |
| 10 or more Apartments | 3,537 | 23.3% |
| Mobile Home / Other | 277 | 1.8% |
| Total | 15,176 | 100.0% |
Housing Structures by Occupancy in Merrillville
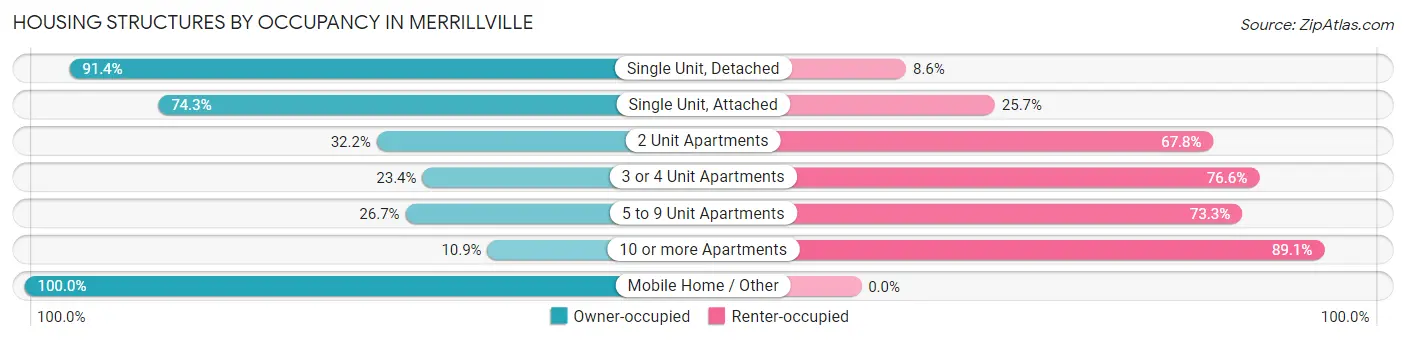
| Structure Type | Owner-occupied | Renter-occupied |
| Single Unit, Detached | 8,402 (91.4%) | 793 (8.6%) |
| Single Unit, Attached | 874 (74.3%) | 303 (25.7%) |
| 2 Unit Apartments | 48 (32.2%) | 101 (67.8%) |
| 3 or 4 Unit Apartments | 103 (23.4%) | 337 (76.6%) |
| 5 to 9 Unit Apartments | 107 (26.7%) | 294 (73.3%) |
| 10 or more Apartments | 385 (10.9%) | 3,152 (89.1%) |
| Mobile Home / Other | 277 (100.0%) | 0 (0.0%) |
| Total | 10,196 (67.2%) | 4,980 (32.8%) |
Housing Structures by Number of Rooms in Merrillville
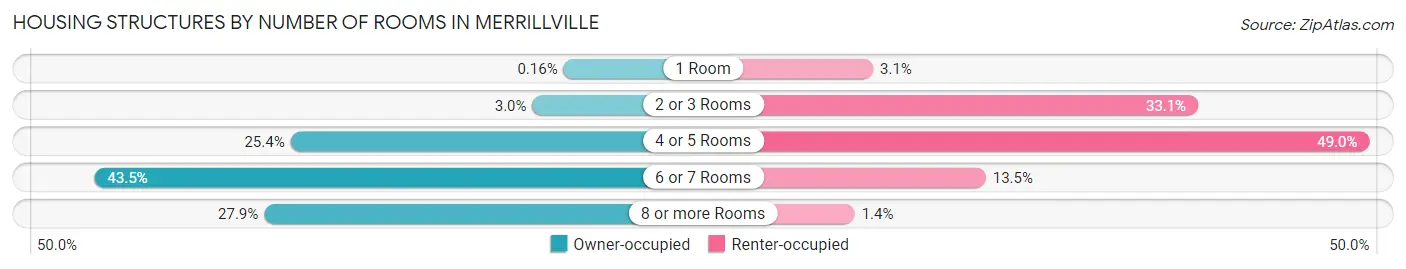
| Number of Rooms | Owner-occupied | Renter-occupied |
| 1 Room | 16 (0.2%) | 153 (3.1%) |
| 2 or 3 Rooms | 310 (3.0%) | 1,649 (33.1%) |
| 4 or 5 Rooms | 2,591 (25.4%) | 2,438 (49.0%) |
| 6 or 7 Rooms | 4,439 (43.5%) | 672 (13.5%) |
| 8 or more Rooms | 2,840 (27.9%) | 68 (1.4%) |
| Total | 10,196 (100.0%) | 4,980 (100.0%) |
Housing Structure by Heating Type in Merrillville
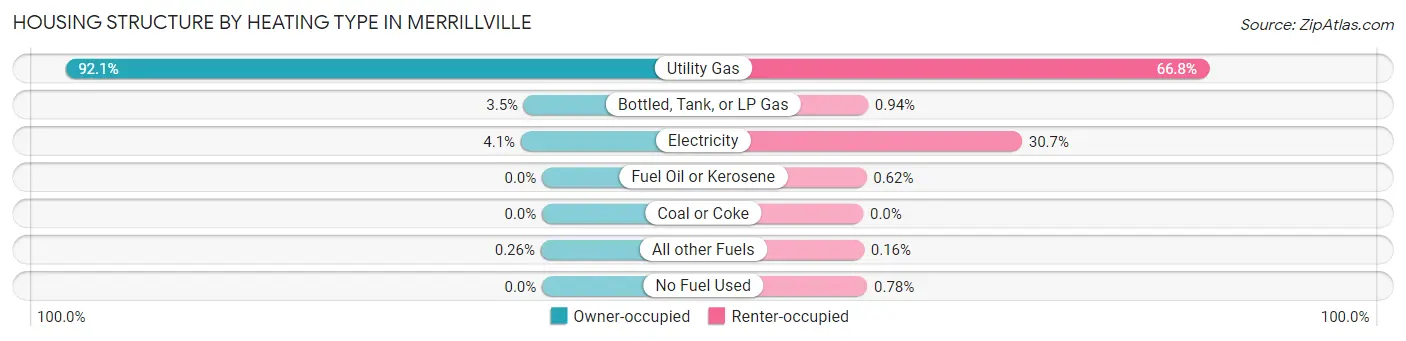
| Heating Type | Owner-occupied | Renter-occupied |
| Utility Gas | 9,395 (92.1%) | 3,327 (66.8%) |
| Bottled, Tank, or LP Gas | 358 (3.5%) | 47 (0.9%) |
| Electricity | 417 (4.1%) | 1,528 (30.7%) |
| Fuel Oil or Kerosene | 0 (0.0%) | 31 (0.6%) |
| Coal or Coke | 0 (0.0%) | 0 (0.0%) |
| All other Fuels | 26 (0.3%) | 8 (0.2%) |
| No Fuel Used | 0 (0.0%) | 39 (0.8%) |
| Total | 10,196 (100.0%) | 4,980 (100.0%) |
Household Vehicle Usage in Merrillville
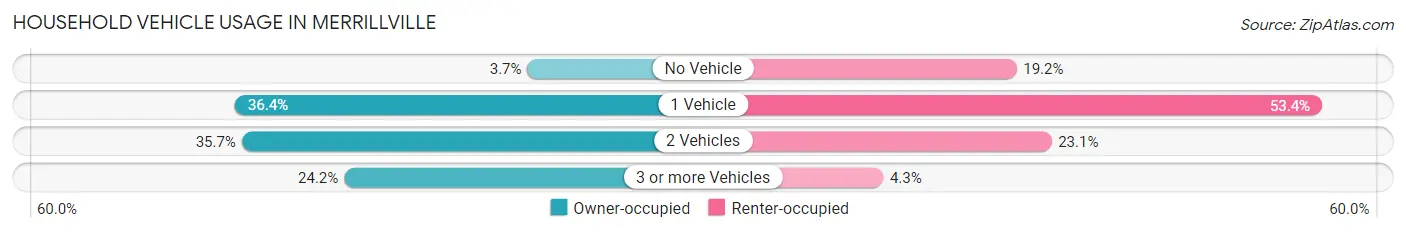
| Vehicles per Household | Owner-occupied | Renter-occupied |
| No Vehicle | 375 (3.7%) | 956 (19.2%) |
| 1 Vehicle | 3,715 (36.4%) | 2,661 (53.4%) |
| 2 Vehicles | 3,638 (35.7%) | 1,151 (23.1%) |
| 3 or more Vehicles | 2,468 (24.2%) | 212 (4.3%) |
| Total | 10,196 (100.0%) | 4,980 (100.0%) |
Real Estate & Mortgages in Merrillville
Real Estate and Mortgage Overview in Merrillville
| Characteristic | Without Mortgage | With Mortgage |
| Housing Units | 2,843 | 7,353 |
| Median Property Value | $165,700 | $179,900 |
| Median Household Income | $43,450 | $1,181 |
| Monthly Housing Costs | $503 | $39 |
| Real Estate Taxes | $1,684 | $87 |
Property Value by Mortgage Status in Merrillville
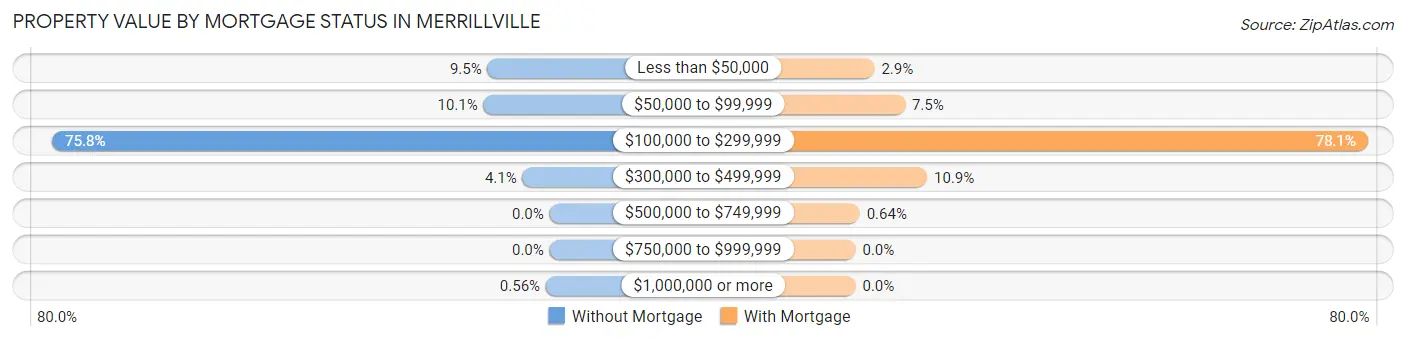
| Property Value | Without Mortgage | With Mortgage |
| Less than $50,000 | 269 (9.5%) | 212 (2.9%) |
| $50,000 to $99,999 | 286 (10.1%) | 554 (7.5%) |
| $100,000 to $299,999 | 2,155 (75.8%) | 5,739 (78.0%) |
| $300,000 to $499,999 | 117 (4.1%) | 801 (10.9%) |
| $500,000 to $749,999 | 0 (0.0%) | 47 (0.6%) |
| $750,000 to $999,999 | 0 (0.0%) | 0 (0.0%) |
| $1,000,000 or more | 16 (0.6%) | 0 (0.0%) |
| Total | 2,843 (100.0%) | 7,353 (100.0%) |
Household Income by Mortgage Status in Merrillville
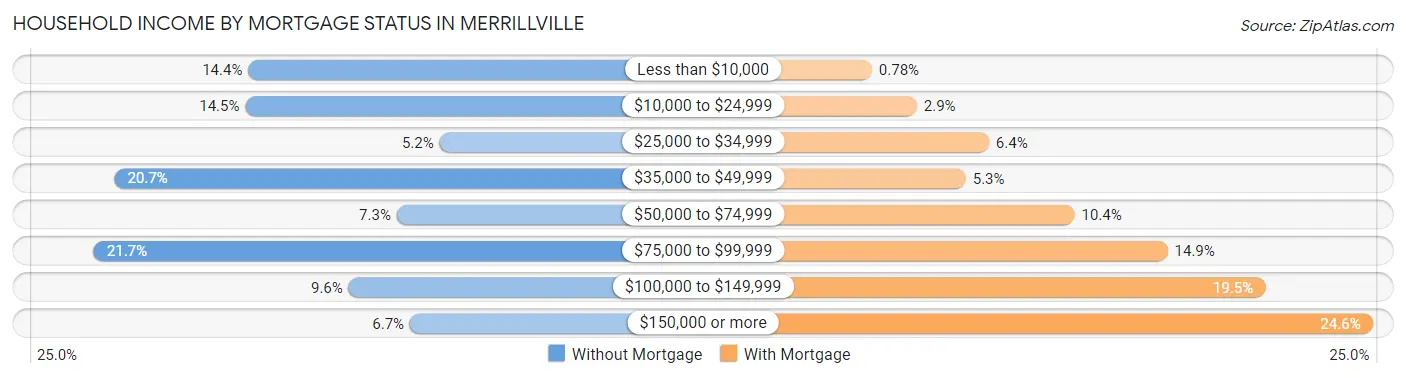
| Household Income | Without Mortgage | With Mortgage |
| Less than $10,000 | 408 (14.3%) | 57 (0.8%) |
| $10,000 to $24,999 | 412 (14.5%) | 215 (2.9%) |
| $25,000 to $34,999 | 149 (5.2%) | 467 (6.4%) |
| $35,000 to $49,999 | 589 (20.7%) | 386 (5.2%) |
| $50,000 to $74,999 | 207 (7.3%) | 767 (10.4%) |
| $75,000 to $99,999 | 617 (21.7%) | 1,093 (14.9%) |
| $100,000 to $149,999 | 272 (9.6%) | 1,434 (19.5%) |
| $150,000 or more | 189 (6.7%) | 1,810 (24.6%) |
| Total | 2,843 (100.0%) | 7,353 (100.0%) |
Property Value to Household Income Ratio in Merrillville
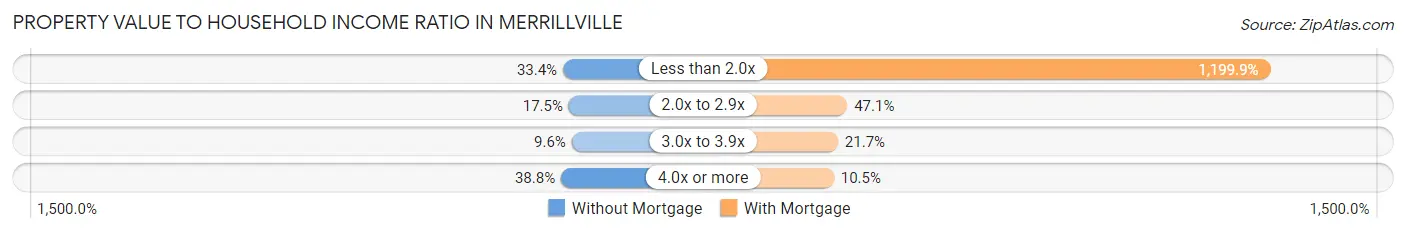
| Value-to-Income Ratio | Without Mortgage | With Mortgage |
| Less than 2.0x | 950 (33.4%) | 88,227 (1,199.9%) |
| 2.0x to 2.9x | 498 (17.5%) | 3,466 (47.1%) |
| 3.0x to 3.9x | 274 (9.6%) | 1,597 (21.7%) |
| 4.0x or more | 1,103 (38.8%) | 775 (10.5%) |
| Total | 2,843 (100.0%) | 7,353 (100.0%) |
Real Estate Taxes by Mortgage Status in Merrillville
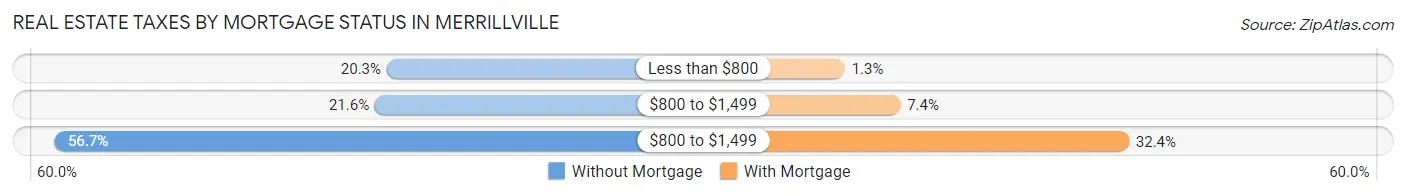
| Property Taxes | Without Mortgage | With Mortgage |
| Less than $800 | 577 (20.3%) | 94 (1.3%) |
| $800 to $1,499 | 614 (21.6%) | 541 (7.4%) |
| $800 to $1,499 | 1,611 (56.7%) | 2,384 (32.4%) |
| Total | 2,843 (100.0%) | 7,353 (100.0%) |
Health & Disability in Merrillville
Health Insurance Coverage by Age in Merrillville
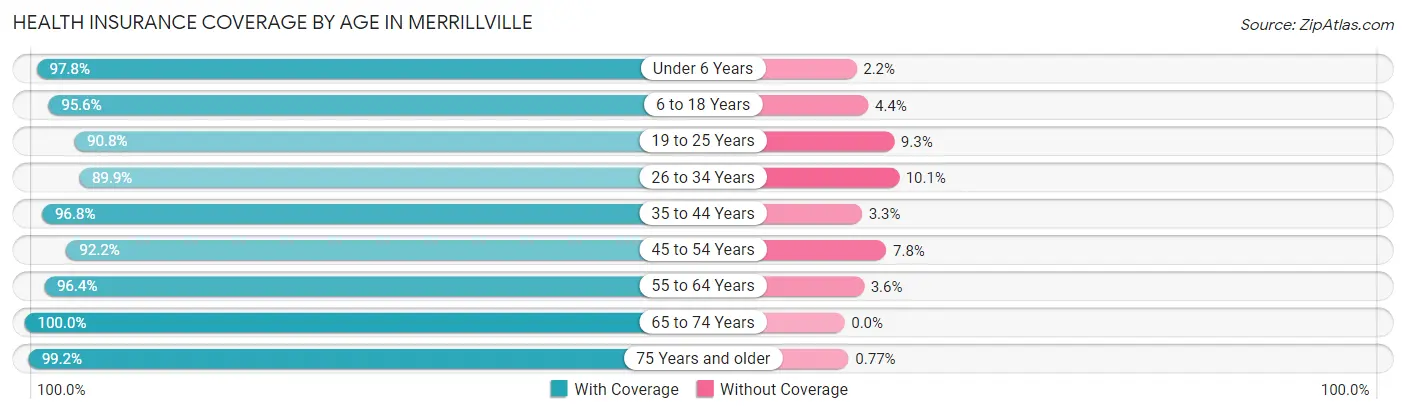
| Age Bracket | With Coverage | Without Coverage |
| Under 6 Years | 2,365 (97.8%) | 54 (2.2%) |
| 6 to 18 Years | 5,953 (95.6%) | 276 (4.4%) |
| 19 to 25 Years | 3,187 (90.7%) | 325 (9.2%) |
| 26 to 34 Years | 3,331 (89.9%) | 376 (10.1%) |
| 35 to 44 Years | 4,256 (96.8%) | 143 (3.3%) |
| 45 to 54 Years | 3,769 (92.2%) | 319 (7.8%) |
| 55 to 64 Years | 4,497 (96.4%) | 169 (3.6%) |
| 65 to 74 Years | 3,937 (100.0%) | 0 (0.0%) |
| 75 Years and older | 2,841 (99.2%) | 22 (0.8%) |
| Total | 34,136 (95.3%) | 1,684 (4.7%) |
Health Insurance Coverage by Citizenship Status in Merrillville
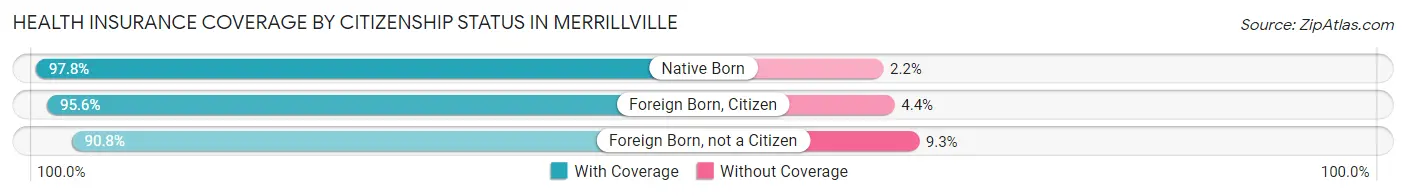
| Citizenship Status | With Coverage | Without Coverage |
| Native Born | 2,365 (97.8%) | 54 (2.2%) |
| Foreign Born, Citizen | 5,953 (95.6%) | 276 (4.4%) |
| Foreign Born, not a Citizen | 3,187 (90.7%) | 325 (9.2%) |
Health Insurance Coverage by Household Income in Merrillville
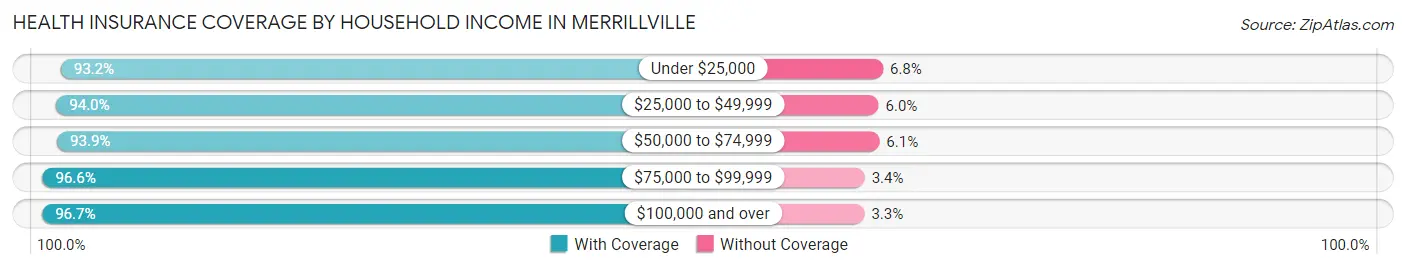
| Household Income | With Coverage | Without Coverage |
| Under $25,000 | 5,453 (93.2%) | 397 (6.8%) |
| $25,000 to $49,999 | 5,937 (94.0%) | 376 (6.0%) |
| $50,000 to $74,999 | 4,285 (93.9%) | 279 (6.1%) |
| $75,000 to $99,999 | 6,360 (96.6%) | 221 (3.4%) |
| $100,000 and over | 12,013 (96.7%) | 411 (3.3%) |
Public vs Private Health Insurance Coverage by Age in Merrillville
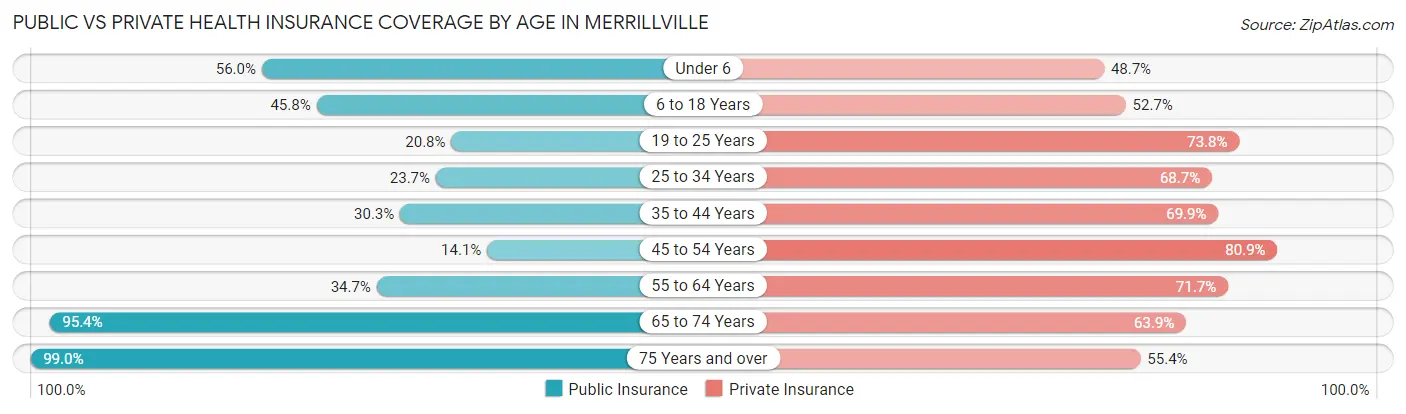
| Age Bracket | Public Insurance | Private Insurance |
| Under 6 | 1,354 (56.0%) | 1,177 (48.7%) |
| 6 to 18 Years | 2,854 (45.8%) | 3,282 (52.7%) |
| 19 to 25 Years | 730 (20.8%) | 2,591 (73.8%) |
| 25 to 34 Years | 877 (23.7%) | 2,547 (68.7%) |
| 35 to 44 Years | 1,333 (30.3%) | 3,074 (69.9%) |
| 45 to 54 Years | 578 (14.1%) | 3,305 (80.8%) |
| 55 to 64 Years | 1,617 (34.6%) | 3,346 (71.7%) |
| 65 to 74 Years | 3,756 (95.4%) | 2,516 (63.9%) |
| 75 Years and over | 2,833 (99.0%) | 1,587 (55.4%) |
| Total | 15,932 (44.5%) | 23,425 (65.4%) |
Disability Status by Sex by Age in Merrillville
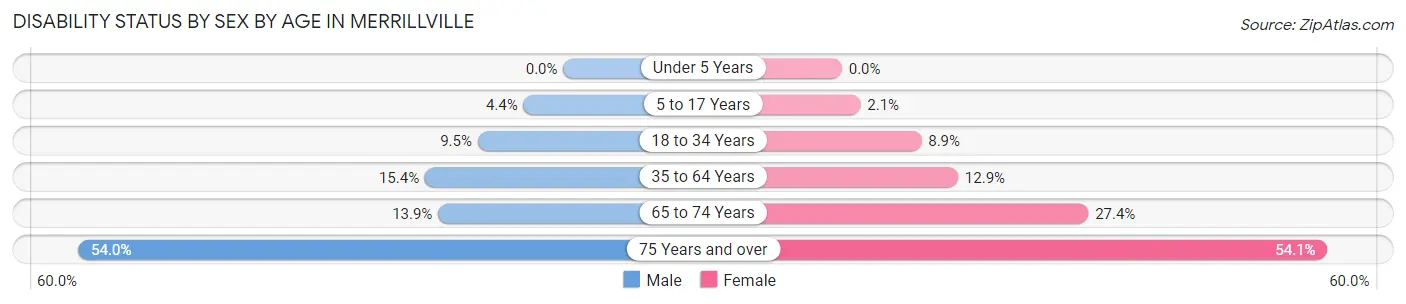
| Age Bracket | Male | Female |
| Under 5 Years | 0 (0.0%) | 0 (0.0%) |
| 5 to 17 Years | 148 (4.4%) | 57 (2.1%) |
| 18 to 34 Years | 372 (9.5%) | 340 (8.8%) |
| 35 to 64 Years | 947 (15.4%) | 906 (12.9%) |
| 65 to 74 Years | 277 (13.9%) | 535 (27.4%) |
| 75 Years and over | 441 (54.0%) | 1,107 (54.1%) |
Disability Class by Sex by Age in Merrillville
Disability Class: Hearing Difficulty
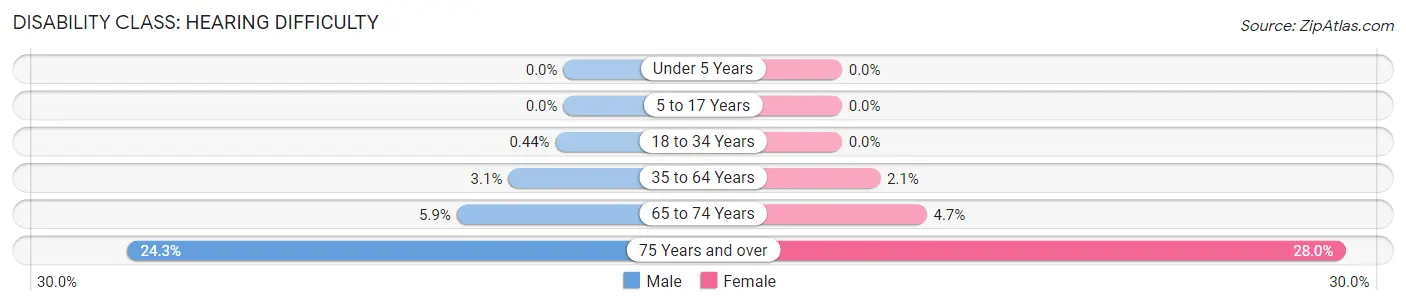
| Age Bracket | Male | Female |
| Under 5 Years | 0 (0.0%) | 0 (0.0%) |
| 5 to 17 Years | 0 (0.0%) | 0 (0.0%) |
| 18 to 34 Years | 17 (0.4%) | 0 (0.0%) |
| 35 to 64 Years | 189 (3.1%) | 149 (2.1%) |
| 65 to 74 Years | 118 (5.9%) | 92 (4.7%) |
| 75 Years and over | 198 (24.3%) | 574 (28.0%) |
Disability Class: Vision Difficulty
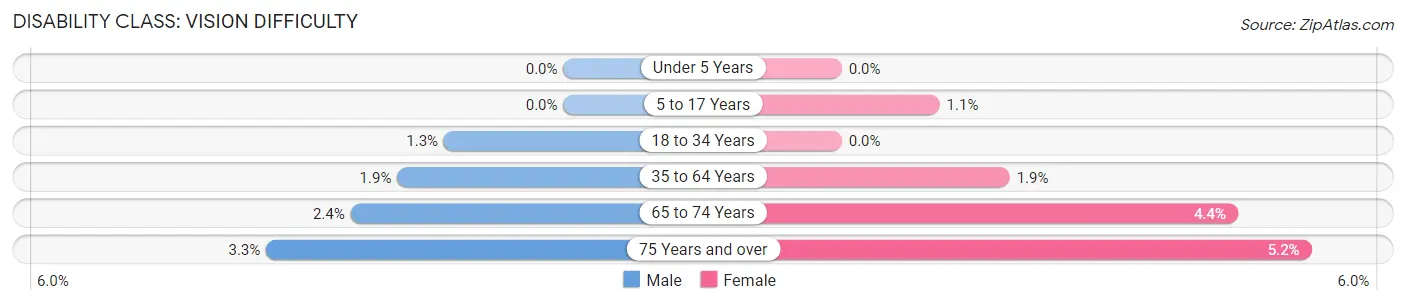
| Age Bracket | Male | Female |
| Under 5 Years | 0 (0.0%) | 0 (0.0%) |
| 5 to 17 Years | 0 (0.0%) | 30 (1.1%) |
| 18 to 34 Years | 52 (1.3%) | 0 (0.0%) |
| 35 to 64 Years | 114 (1.8%) | 131 (1.9%) |
| 65 to 74 Years | 47 (2.4%) | 86 (4.4%) |
| 75 Years and over | 27 (3.3%) | 107 (5.2%) |
Disability Class: Cognitive Difficulty
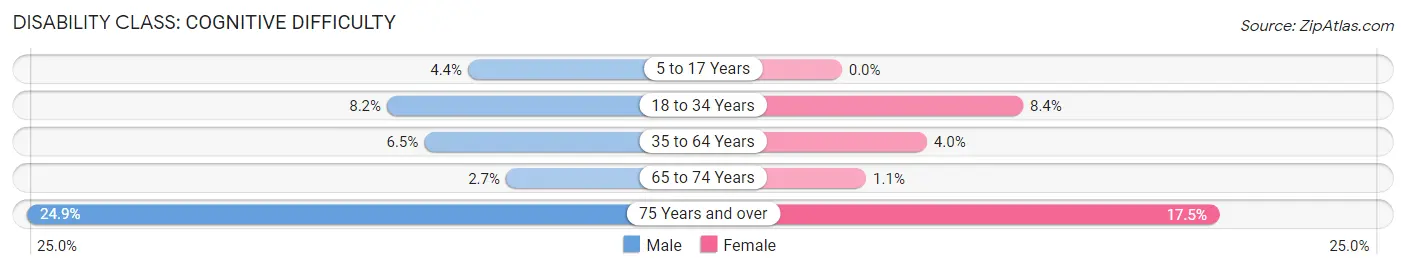
| Age Bracket | Male | Female |
| 5 to 17 Years | 148 (4.4%) | 0 (0.0%) |
| 18 to 34 Years | 320 (8.2%) | 323 (8.4%) |
| 35 to 64 Years | 397 (6.5%) | 277 (4.0%) |
| 65 to 74 Years | 53 (2.7%) | 22 (1.1%) |
| 75 Years and over | 203 (24.9%) | 358 (17.5%) |
Disability Class: Ambulatory Difficulty
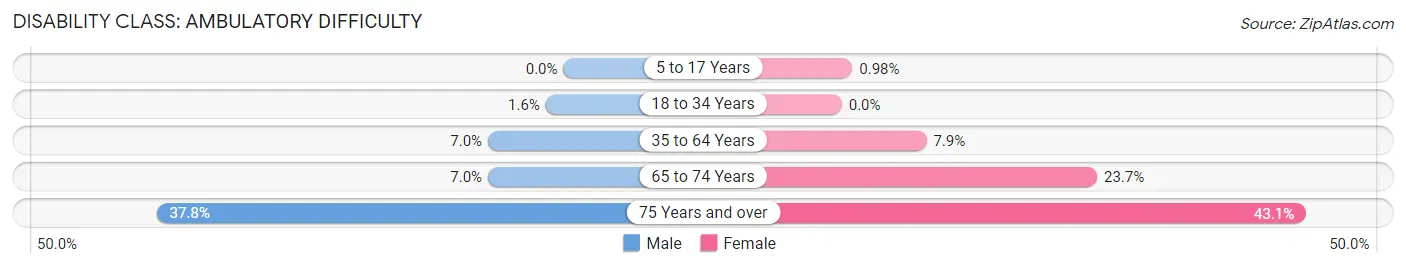
| Age Bracket | Male | Female |
| 5 to 17 Years | 0 (0.0%) | 27 (1.0%) |
| 18 to 34 Years | 64 (1.6%) | 0 (0.0%) |
| 35 to 64 Years | 430 (7.0%) | 551 (7.9%) |
| 65 to 74 Years | 139 (7.0%) | 462 (23.7%) |
| 75 Years and over | 308 (37.8%) | 882 (43.1%) |
Disability Class: Self-Care Difficulty
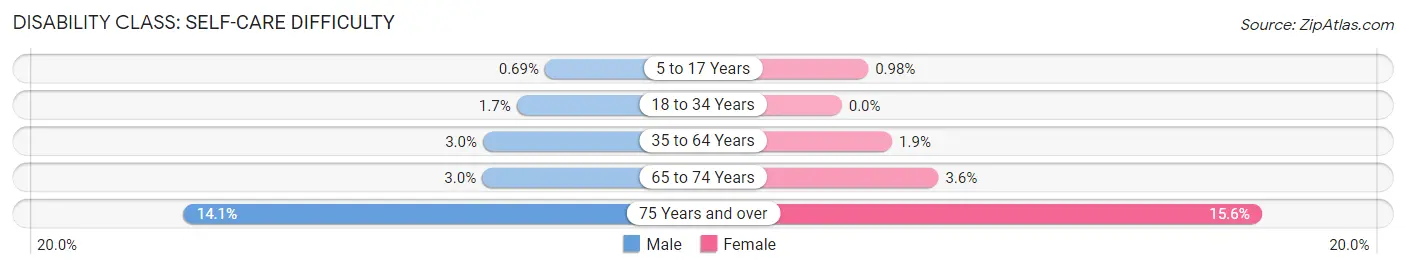
| Age Bracket | Male | Female |
| 5 to 17 Years | 23 (0.7%) | 27 (1.0%) |
| 18 to 34 Years | 68 (1.7%) | 0 (0.0%) |
| 35 to 64 Years | 184 (3.0%) | 131 (1.9%) |
| 65 to 74 Years | 60 (3.0%) | 70 (3.6%) |
| 75 Years and over | 115 (14.1%) | 319 (15.6%) |
Technology Access in Merrillville
Computing Device Access in Merrillville
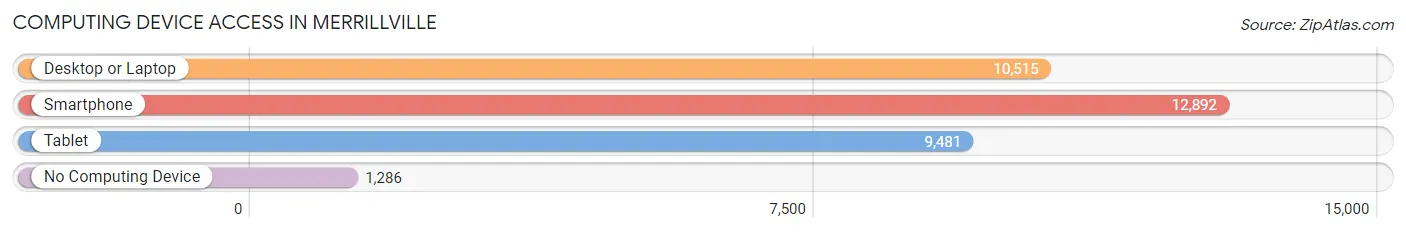
| Device Type | # Households | % Households |
| Desktop or Laptop | 10,515 | 69.3% |
| Smartphone | 12,892 | 85.0% |
| Tablet | 9,481 | 62.5% |
| No Computing Device | 1,286 | 8.5% |
| Total | 15,176 | 100.0% |
Internet Access in Merrillville
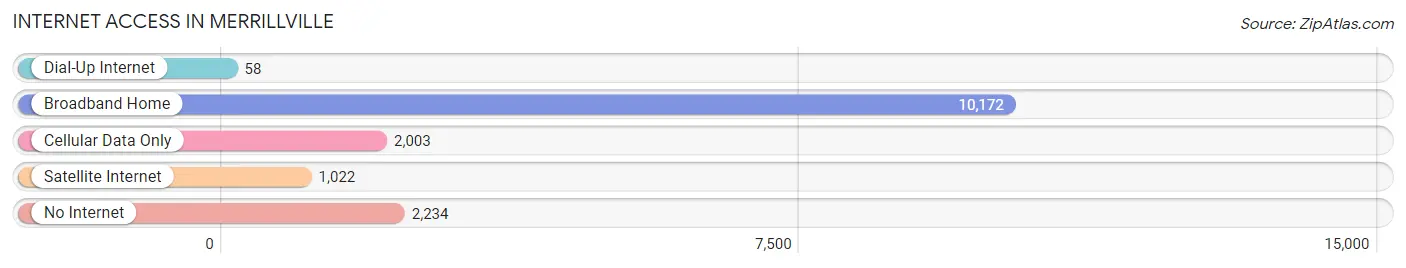
| Internet Type | # Households | % Households |
| Dial-Up Internet | 58 | 0.4% |
| Broadband Home | 10,172 | 67.0% |
| Cellular Data Only | 2,003 | 13.2% |
| Satellite Internet | 1,022 | 6.7% |
| No Internet | 2,234 | 14.7% |
| Total | 15,176 | 100.0% |
Merrillville Summary
Merrillville, Indiana is a town located in Lake County, Indiana, United States. It is part of the Chicago metropolitan area and is located approximately 25 miles southeast of downtown Chicago. The town was founded in 1834 and incorporated in 1971. As of the 2010 census, the town had a population of 35,246.
History
Merrillville was originally known as McGwinn Village, after the first settler, John McGwinn. The town was founded in 1834 and was originally part of Ross Township. In 1837, the town was renamed Merrillville after the first postmaster, William Merrill. The town was officially incorporated in 1971.
Geography
Merrillville is located in Lake County, Indiana, approximately 25 miles southeast of downtown Chicago. The town is situated on the southern shore of Lake Michigan and is bordered by the towns of Crown Point, Hobart, and Gary. The town has a total area of 16.3 square miles, of which 15.9 square miles is land and 0.4 square miles is water.
Economy
Merrillville is home to a variety of businesses and industries. The town is home to several large shopping malls, including the Southlake Mall, the Merrillville Town Center, and the Lake County Commons. The town is also home to a number of corporate headquarters, including NiSource, Centier Bank, and White Lodging. The town is also home to a number of manufacturing and industrial companies, including ArcelorMittal, U.S. Steel, and BP.
Demographics
As of the 2010 census, the town had a population of 35,246. The racial makeup of the town was 68.2% White, 19.3% African American, 0.4% Native American, 4.2% Asian, and 7.9% from other races. Hispanic or Latino of any race were 11.3% of the population. The median household income was $50,945 and the median family income was $60,945.
Conclusion
Merrillville, Indiana is a town located in Lake County, Indiana, United States. It is part of the Chicago metropolitan area and is located approximately 25 miles southeast of downtown Chicago. The town was founded in 1834 and incorporated in 1971. As of the 2010 census, the town had a population of 35,246. The town is home to a variety of businesses and industries, including several large shopping malls, corporate headquarters, and manufacturing and industrial companies. The racial makeup of the town was 68.2% White, 19.3% African American, 0.4% Native American, 4.2% Asian, and 7.9% from other races. The median household income was $50,945 and the median family income was $60,945.
Common Questions
What is Per Capita Income in Merrillville?
Per Capita income in Merrillville is $34,226.
What is the Median Family Income in Merrillville?
Median Family Income in Merrillville is $84,667.
What is the Median Household income in Merrillville?
Median Household Income in Merrillville is $62,221.
What is Income or Wage Gap in Merrillville?
Income or Wage Gap in Merrillville is 25.0%.
Women in Merrillville earn 75.0 cents for every dollar earned by a man.
What is Family Income Deficit in Merrillville?
Family Income Deficit in Merrillville is $12,137.
Families that are below poverty line in Merrillville earn $12,137 less on average than the poverty threshold level.
What is Inequality or Gini Index in Merrillville?
Inequality or Gini Index in Merrillville is 0.46.
What is the Total Population of Merrillville?
Total Population of Merrillville is 36,214.
What is the Total Male Population of Merrillville?
Total Male Population of Merrillville is 17,277.
What is the Total Female Population of Merrillville?
Total Female Population of Merrillville is 18,937.
What is the Ratio of Males per 100 Females in Merrillville?
There are 91.23 Males per 100 Females in Merrillville.
What is the Ratio of Females per 100 Males in Merrillville?
There are 109.61 Females per 100 Males in Merrillville.
What is the Median Population Age in Merrillville?
Median Population Age in Merrillville is 39.1 Years.
What is the Average Family Size in Merrillville
Average Family Size in Merrillville is 3.3 People.
What is the Average Household Size in Merrillville
Average Household Size in Merrillville is 2.4 People.
How Large is the Labor Force in Merrillville?
There are 17,981 People in the Labor Forcein in Merrillville.
What is the Percentage of People in the Labor Force in Merrillville?
61.5% of People are in the Labor Force in Merrillville.
What is the Unemployment Rate in Merrillville?
Unemployment Rate in Merrillville is 8.2%.