Hillburn, NY Map & Demographics
Hillburn Map
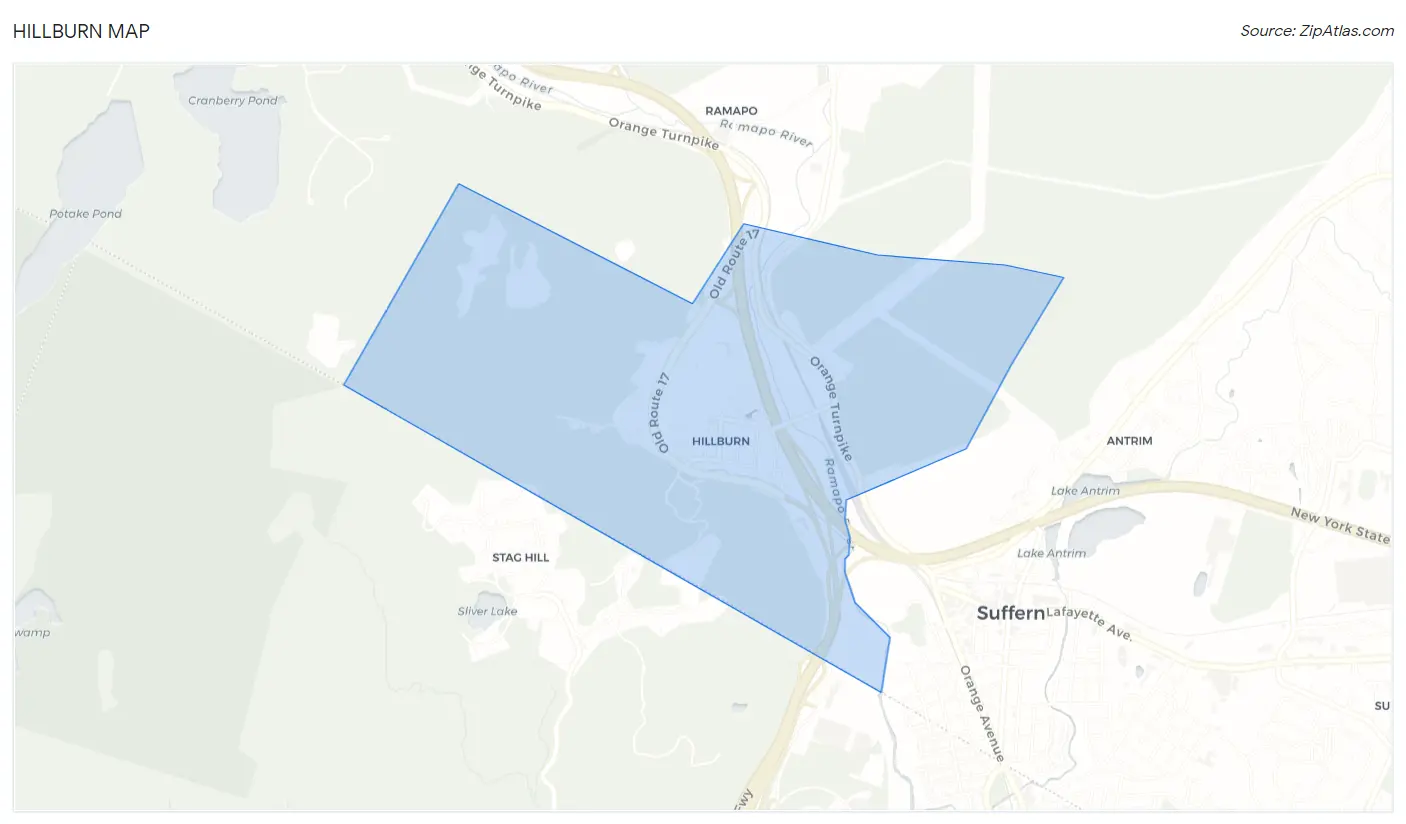
Hillburn Overview
$32,610
PER CAPITA INCOME
$91,518
AVG FAMILY INCOME
$79,688
AVG HOUSEHOLD INCOME
7.2%
WAGE / INCOME GAP [ % ]
92.8¢/ $1
WAGE / INCOME GAP [ $ ]
0.41
INEQUALITY / GINI INDEX
1,131
TOTAL POPULATION
505
MALE POPULATION
626
FEMALE POPULATION
80.67
MALES / 100 FEMALES
123.96
FEMALES / 100 MALES
32.6
MEDIAN AGE
3.9
AVG FAMILY SIZE
3.3
AVG HOUSEHOLD SIZE
499
LABOR FORCE [ PEOPLE ]
62.2%
PERCENT IN LABOR FORCE
8.8%
UNEMPLOYMENT RATE
Hillburn Zip Codes
Hillburn Area Codes
Income in Hillburn
Income Overview in Hillburn
Per Capita Income in Hillburn is $32,610, while median incomes of families and households are $91,518 and $79,688 respectively.
| Characteristic | Number | Measure |
| Per Capita Income | 1,131 | $32,610 |
| Median Family Income | 246 | $91,518 |
| Mean Family Income | 246 | $116,070 |
| Median Household Income | 343 | $79,688 |
| Mean Household Income | 343 | $102,573 |
| Income Deficit | 246 | $0 |
| Wage / Income Gap (%) | 1,131 | 7.25% |
| Wage / Income Gap ($) | 1,131 | 92.75¢ per $1 |
| Gini / Inequality Index | 1,131 | 0.41 |
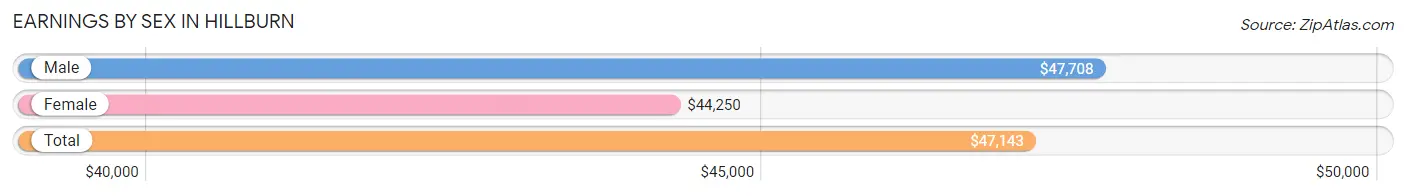
Earnings by Sex in Hillburn
Average Earnings in Hillburn are $47,143, $47,708 for men and $44,250 for women, a difference of 7.2%.
| Sex | Number | Average Earnings |
| Male | 325 (66.1%) | $47,708 |
| Female | 167 (33.9%) | $44,250 |
| Total | 492 (100.0%) | $47,143 |
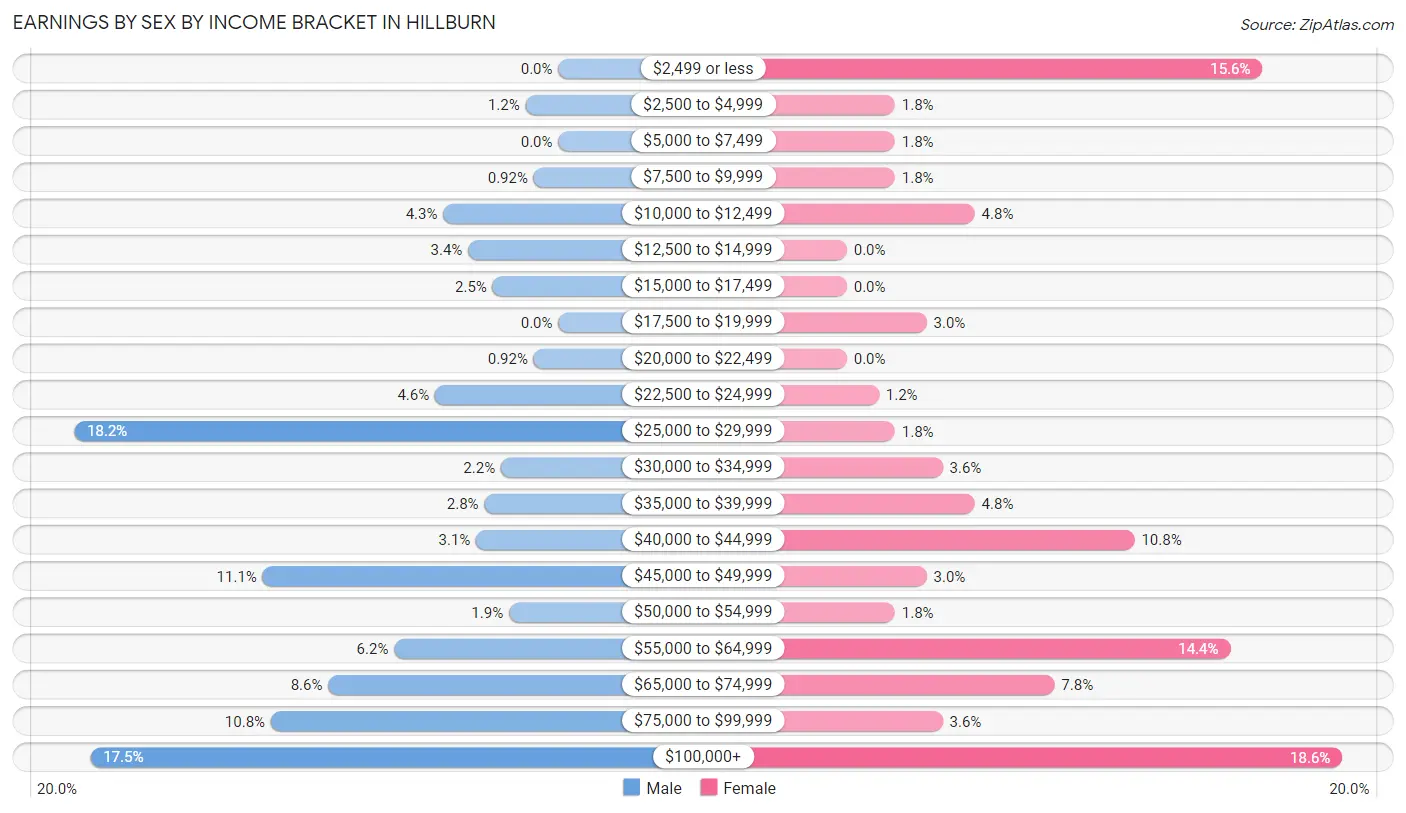
Earnings by Sex by Income Bracket in Hillburn
The most common earnings brackets in Hillburn are $25,000 to $29,999 for men (59 | 18.1%) and $100,000+ for women (31 | 18.6%).
| Income | Male | Female |
| $2,499 or less | 0 (0.0%) | 26 (15.6%) |
| $2,500 to $4,999 | 4 (1.2%) | 3 (1.8%) |
| $5,000 to $7,499 | 0 (0.0%) | 3 (1.8%) |
| $7,500 to $9,999 | 3 (0.9%) | 3 (1.8%) |
| $10,000 to $12,499 | 14 (4.3%) | 8 (4.8%) |
| $12,500 to $14,999 | 11 (3.4%) | 0 (0.0%) |
| $15,000 to $17,499 | 8 (2.5%) | 0 (0.0%) |
| $17,500 to $19,999 | 0 (0.0%) | 5 (3.0%) |
| $20,000 to $22,499 | 3 (0.9%) | 0 (0.0%) |
| $22,500 to $24,999 | 15 (4.6%) | 2 (1.2%) |
| $25,000 to $29,999 | 59 (18.1%) | 3 (1.8%) |
| $30,000 to $34,999 | 7 (2.1%) | 6 (3.6%) |
| $35,000 to $39,999 | 9 (2.8%) | 8 (4.8%) |
| $40,000 to $44,999 | 10 (3.1%) | 18 (10.8%) |
| $45,000 to $49,999 | 36 (11.1%) | 5 (3.0%) |
| $50,000 to $54,999 | 6 (1.8%) | 3 (1.8%) |
| $55,000 to $64,999 | 20 (6.1%) | 24 (14.4%) |
| $65,000 to $74,999 | 28 (8.6%) | 13 (7.8%) |
| $75,000 to $99,999 | 35 (10.8%) | 6 (3.6%) |
| $100,000+ | 57 (17.5%) | 31 (18.6%) |
| Total | 325 (100.0%) | 167 (100.0%) |
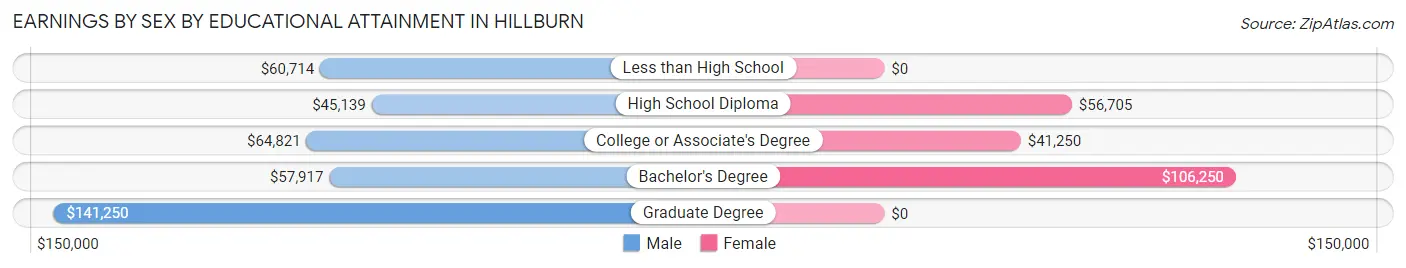
Earnings by Sex by Educational Attainment in Hillburn
Average earnings in Hillburn are $49,792 for men and $55,000 for women, a difference of 9.5%. Men with an educational attainment of graduate degree enjoy the highest average annual earnings of $141,250, while those with high school diploma education earn the least with $45,139. Women with an educational attainment of bachelor's degree earn the most with the average annual earnings of $106,250, while those with college or associate's degree education have the smallest earnings of $41,250.
| Educational Attainment | Male Income | Female Income |
| Less than High School | $60,714 | $0 |
| High School Diploma | $45,139 | $56,705 |
| College or Associate's Degree | $64,821 | $41,250 |
| Bachelor's Degree | $57,917 | $106,250 |
| Graduate Degree | $141,250 | $0 |
| Total | $49,792 | $55,000 |
Family Income in Hillburn
Family Income Brackets in Hillburn
According to the Hillburn family income data, there are 54 families falling into the $75,000 to $99,999 income range, which is the most common income bracket and makes up 22.0% of all families. Conversely, the $10,000 to $14,999 income bracket is the least frequent group with only 2 families (0.8%) belonging to this category.
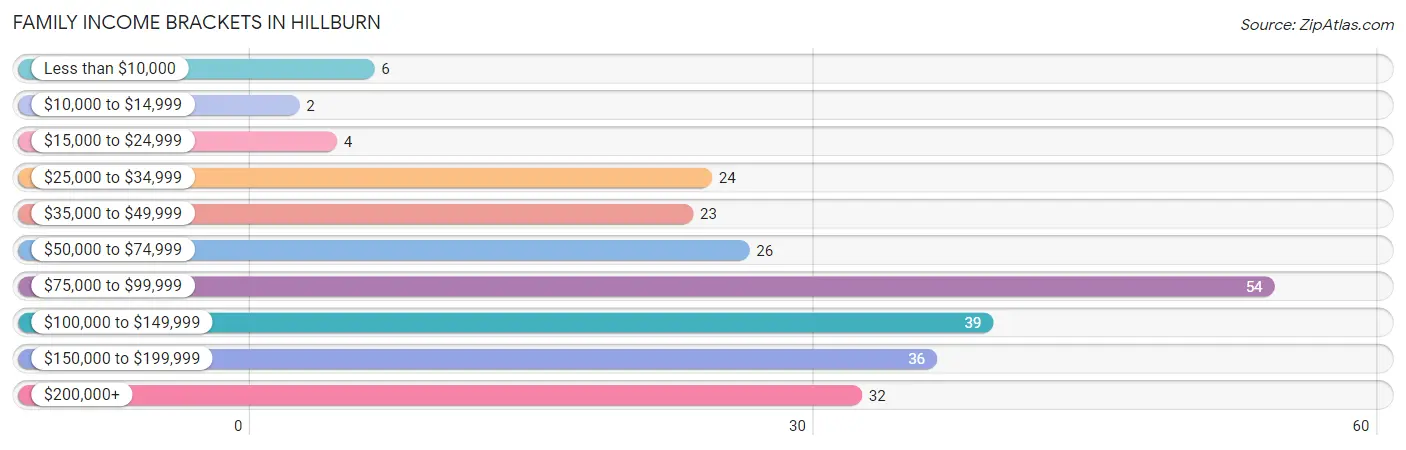
| Income Bracket | # Families | % Families |
| Less than $10,000 | 6 | 2.4% |
| $10,000 to $14,999 | 2 | 0.8% |
| $15,000 to $24,999 | 4 | 1.6% |
| $25,000 to $34,999 | 24 | 9.8% |
| $35,000 to $49,999 | 23 | 9.3% |
| $50,000 to $74,999 | 26 | 10.6% |
| $75,000 to $99,999 | 54 | 22.0% |
| $100,000 to $149,999 | 39 | 15.9% |
| $150,000 to $199,999 | 36 | 14.6% |
| $200,000+ | 32 | 13.0% |
Family Income by Famaliy Size in Hillburn
4-person families (65 | 26.4%) account for the highest median family income in Hillburn with $98,125 per family, while 2-person families (49 | 19.9%) have the highest median income of $48,542 per family member.
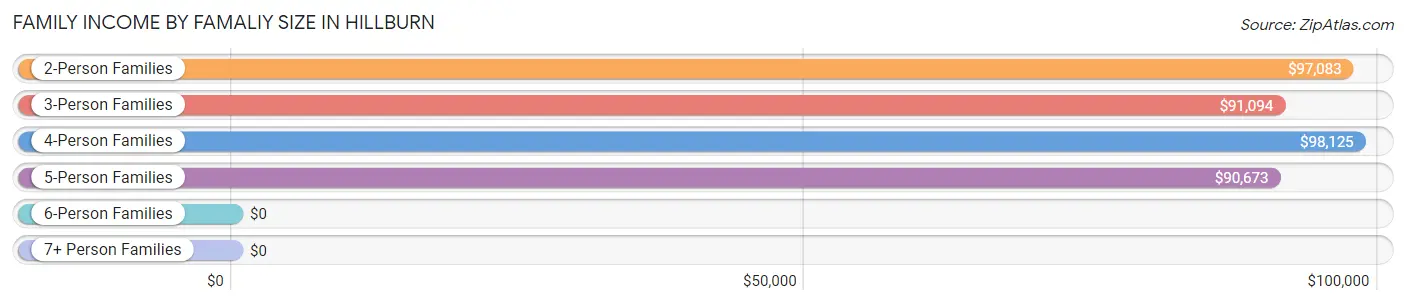
| Income Bracket | # Families | Median Income |
| 2-Person Families | 49 (19.9%) | $97,083 |
| 3-Person Families | 75 (30.5%) | $91,094 |
| 4-Person Families | 65 (26.4%) | $98,125 |
| 5-Person Families | 29 (11.8%) | $90,673 |
| 6-Person Families | 9 (3.7%) | $0 |
| 7+ Person Families | 19 (7.7%) | $0 |
| Total | 246 (100.0%) | $91,518 |
Family Income by Number of Earners in Hillburn
The median family income in Hillburn is $91,518, with families comprising 3+ earners (45) having the highest median family income of $194,219, while families with 1 earner (109) have the lowest median family income of $68,750, accounting for 18.3% and 44.3% of families, respectively.
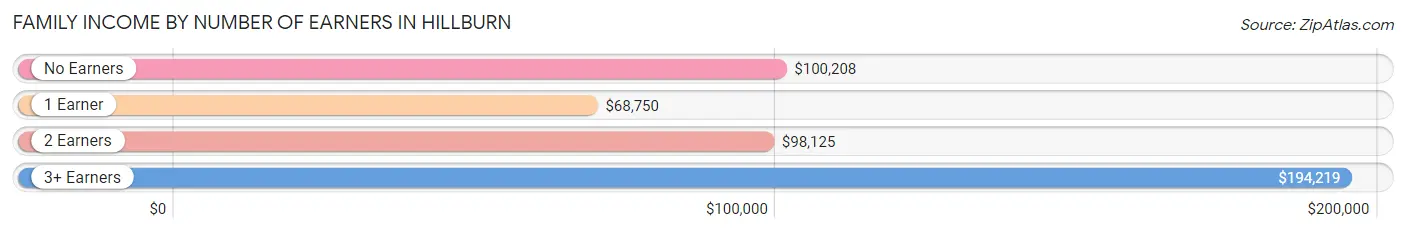
| Number of Earners | # Families | Median Income |
| No Earners | 19 (7.7%) | $100,208 |
| 1 Earner | 109 (44.3%) | $68,750 |
| 2 Earners | 73 (29.7%) | $98,125 |
| 3+ Earners | 45 (18.3%) | $194,219 |
| Total | 246 (100.0%) | $91,518 |
Household Income in Hillburn
Household Income Brackets in Hillburn
With 71 households falling in the category, the $75,000 to $99,999 income range is the most frequent in Hillburn, accounting for 20.7% of all households. In contrast, only 6 households (1.8%) fall into the less than $10,000 income bracket, making it the least populous group.
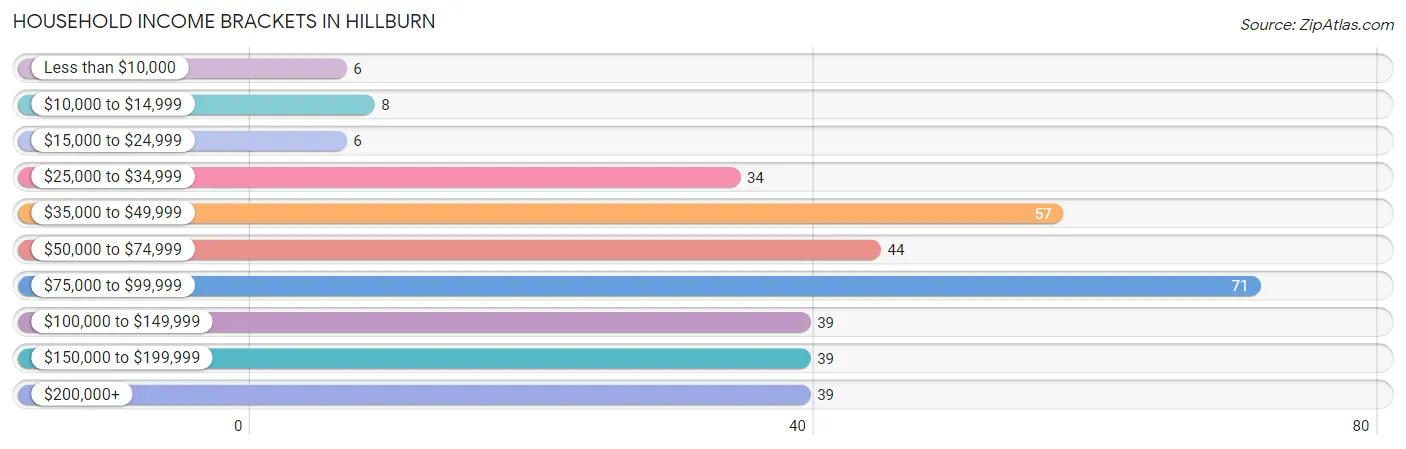
| Income Bracket | # Households | % Households |
| Less than $10,000 | 6 | 1.7% |
| $10,000 to $14,999 | 8 | 2.3% |
| $15,000 to $24,999 | 6 | 1.7% |
| $25,000 to $34,999 | 34 | 9.9% |
| $35,000 to $49,999 | 57 | 16.6% |
| $50,000 to $74,999 | 44 | 12.8% |
| $75,000 to $99,999 | 71 | 20.7% |
| $100,000 to $149,999 | 39 | 11.4% |
| $150,000 to $199,999 | 39 | 11.4% |
| $200,000+ | 39 | 11.4% |
Household Income by Householder Age in Hillburn
The median household income in Hillburn is $79,688, with the highest median household income of $141,667 found in the 45 to 64 years age bracket for the primary householder. A total of 104 households (30.3%) fall into this category. Meanwhile, the 15 to 24 years age bracket for the primary householder has the lowest median household income of $0, with 15 households (4.4%) in this group.
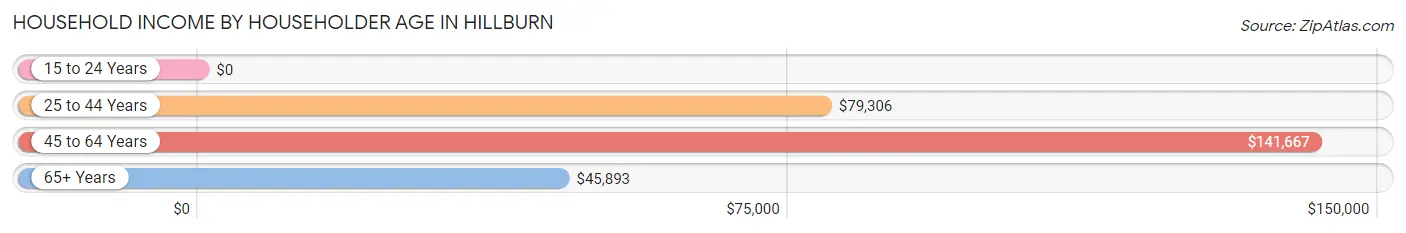
| Income Bracket | # Households | Median Income |
| 15 to 24 Years | 15 (4.4%) | $0 |
| 25 to 44 Years | 127 (37.0%) | $79,306 |
| 45 to 64 Years | 104 (30.3%) | $141,667 |
| 65+ Years | 97 (28.3%) | $45,893 |
| Total | 343 (100.0%) | $79,688 |
Poverty in Hillburn
Income Below Poverty by Sex and Age in Hillburn
With 11.7% poverty level for males and 12.9% for females among the residents of Hillburn, 18 to 24 year old males and under 5 year old females are the most vulnerable to poverty, with 24 males (30.0%) and 22 females (20.7%) in their respective age groups living below the poverty level.
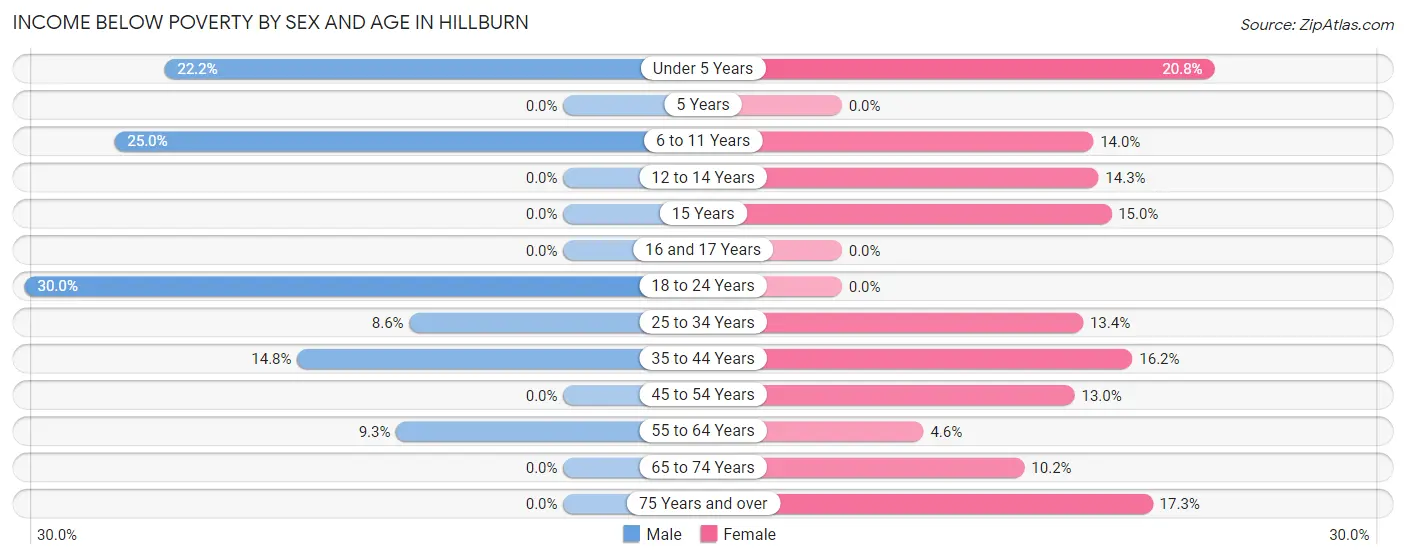
| Age Bracket | Male | Female |
| Under 5 Years | 6 (22.2%) | 22 (20.7%) |
| 5 Years | 0 (0.0%) | 0 (0.0%) |
| 6 to 11 Years | 7 (25.0%) | 7 (14.0%) |
| 12 to 14 Years | 0 (0.0%) | 5 (14.3%) |
| 15 Years | 0 (0.0%) | 3 (15.0%) |
| 16 and 17 Years | 0 (0.0%) | 0 (0.0%) |
| 18 to 24 Years | 24 (30.0%) | 0 (0.0%) |
| 25 to 34 Years | 6 (8.6%) | 9 (13.4%) |
| 35 to 44 Years | 12 (14.8%) | 11 (16.2%) |
| 45 to 54 Years | 0 (0.0%) | 7 (13.0%) |
| 55 to 64 Years | 4 (9.3%) | 2 (4.5%) |
| 65 to 74 Years | 0 (0.0%) | 6 (10.2%) |
| 75 Years and over | 0 (0.0%) | 9 (17.3%) |
| Total | 59 (11.7%) | 81 (12.9%) |
Income Above Poverty by Sex and Age in Hillburn
According to the poverty statistics in Hillburn, males aged 5 years and females aged 5 years are the age groups that are most secure financially, with 100.0% of males and 100.0% of females in these age groups living above the poverty line.
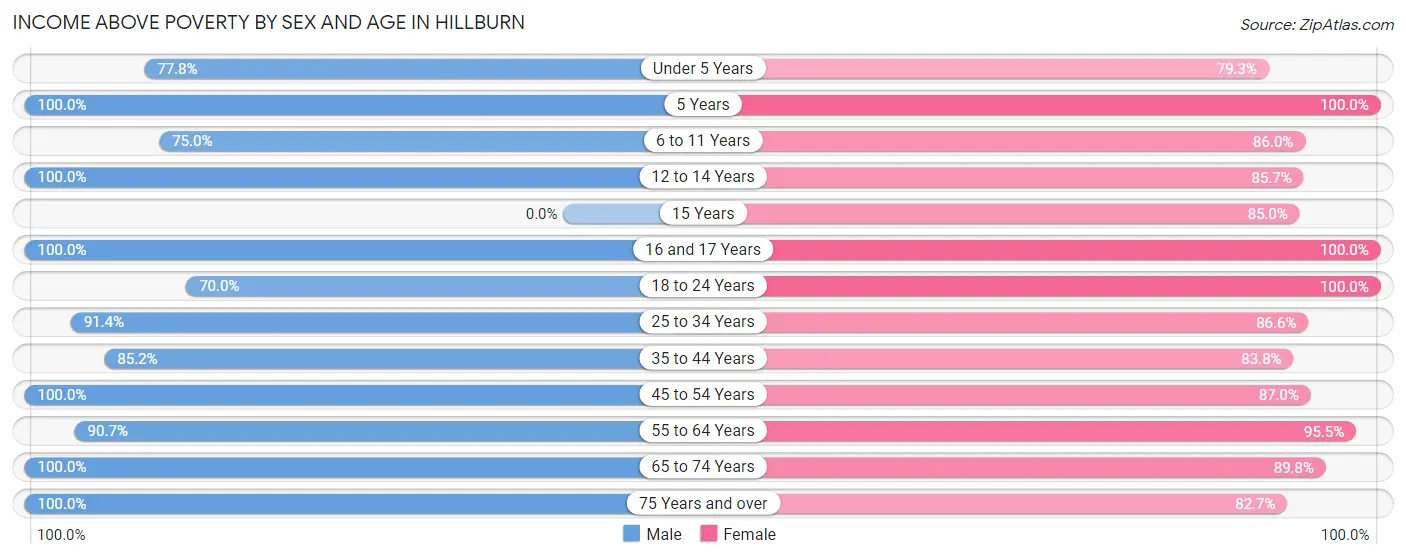
| Age Bracket | Male | Female |
| Under 5 Years | 21 (77.8%) | 84 (79.2%) |
| 5 Years | 5 (100.0%) | 28 (100.0%) |
| 6 to 11 Years | 21 (75.0%) | 43 (86.0%) |
| 12 to 14 Years | 30 (100.0%) | 30 (85.7%) |
| 15 Years | 0 (0.0%) | 17 (85.0%) |
| 16 and 17 Years | 10 (100.0%) | 31 (100.0%) |
| 18 to 24 Years | 56 (70.0%) | 12 (100.0%) |
| 25 to 34 Years | 64 (91.4%) | 58 (86.6%) |
| 35 to 44 Years | 69 (85.2%) | 57 (83.8%) |
| 45 to 54 Years | 82 (100.0%) | 47 (87.0%) |
| 55 to 64 Years | 39 (90.7%) | 42 (95.5%) |
| 65 to 74 Years | 25 (100.0%) | 53 (89.8%) |
| 75 Years and over | 24 (100.0%) | 43 (82.7%) |
| Total | 446 (88.3%) | 545 (87.1%) |
Income Below Poverty Among Married-Couple Families in Hillburn
The poverty statistics for married-couple families in Hillburn show that 5.4% or 10 of the total 184 families live below the poverty line. Families with 3 or 4 children have the highest poverty rate of 14.6%, comprising of 6 families. On the other hand, families with no children have the lowest poverty rate of 2.6%, which includes 2 families.
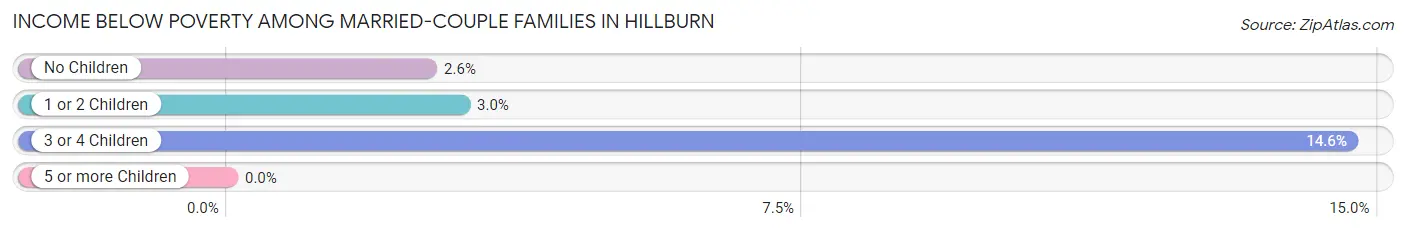
| Children | Above Poverty | Below Poverty |
| No Children | 75 (97.4%) | 2 (2.6%) |
| 1 or 2 Children | 64 (97.0%) | 2 (3.0%) |
| 3 or 4 Children | 35 (85.4%) | 6 (14.6%) |
| 5 or more Children | 0 (0.0%) | 0 (0.0%) |
| Total | 174 (94.6%) | 10 (5.4%) |
Income Below Poverty Among Single-Parent Households in Hillburn
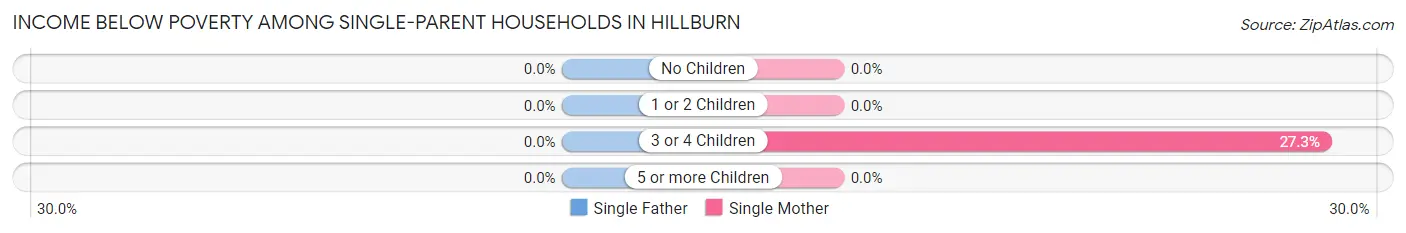
| Children | Single Father | Single Mother |
| No Children | 0 (0.0%) | 0 (0.0%) |
| 1 or 2 Children | 0 (0.0%) | 0 (0.0%) |
| 3 or 4 Children | 0 (0.0%) | 6 (27.3%) |
| 5 or more Children | 0 (0.0%) | 0 (0.0%) |
| Total | 0 (0.0%) | 6 (11.8%) |
Income Below Poverty Among Married-Couple vs Single-Parent Households in Hillburn
The poverty data for Hillburn shows that 10 of the married-couple family households (5.4%) and 6 of the single-parent households (9.7%) are living below the poverty level. Within the married-couple family households, those with 3 or 4 children have the highest poverty rate, with 6 households (14.6%) falling below the poverty line. Among the single-parent households, those with 3 or 4 children have the highest poverty rate, with 6 household (27.3%) living below poverty.
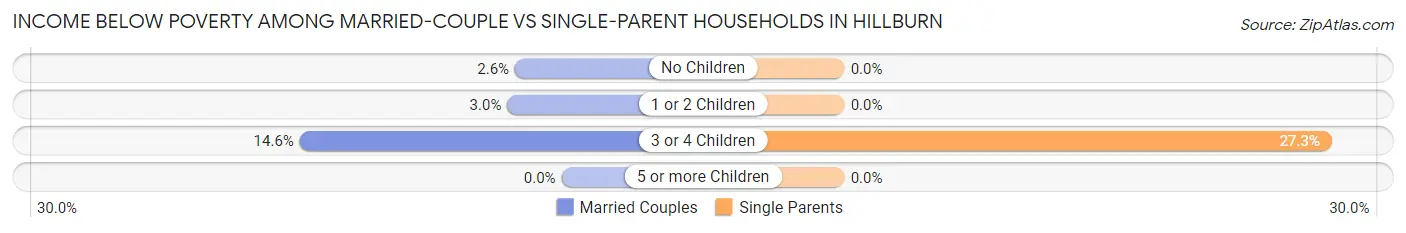
| Children | Married-Couple Families | Single-Parent Households |
| No Children | 2 (2.6%) | 0 (0.0%) |
| 1 or 2 Children | 2 (3.0%) | 0 (0.0%) |
| 3 or 4 Children | 6 (14.6%) | 6 (27.3%) |
| 5 or more Children | 0 (0.0%) | 0 (0.0%) |
| Total | 10 (5.4%) | 6 (9.7%) |
Race in Hillburn
The most populous races in Hillburn are White / Caucasian (444 | 39.3%), Hispanic or Latino (376 | 33.2%), and Some other Race (312 | 27.6%).
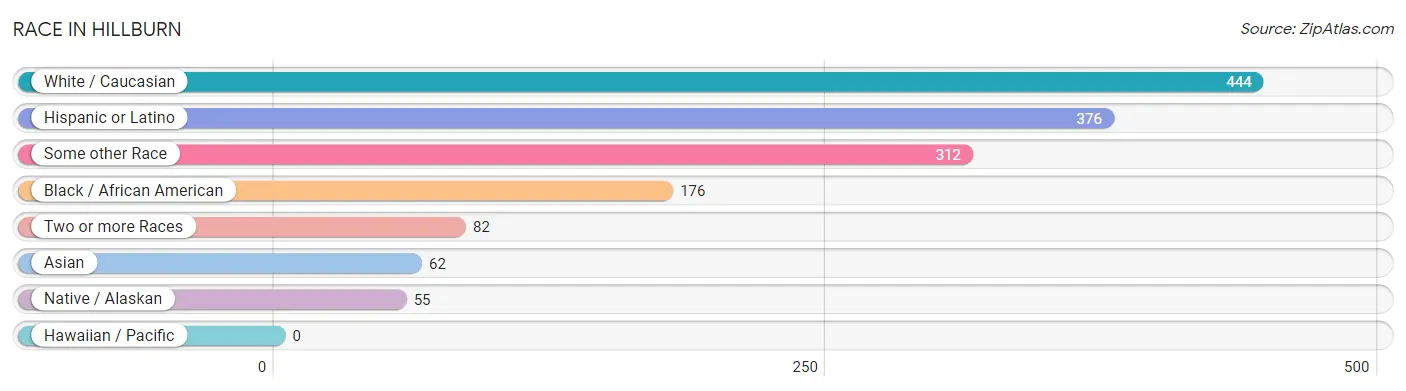
| Race | # Population | % Population |
| Asian | 62 | 5.5% |
| Black / African American | 176 | 15.6% |
| Hawaiian / Pacific | 0 | 0.0% |
| Hispanic or Latino | 376 | 33.2% |
| Native / Alaskan | 55 | 4.9% |
| White / Caucasian | 444 | 39.3% |
| Two or more Races | 82 | 7.2% |
| Some other Race | 312 | 27.6% |
| Total | 1,131 | 100.0% |
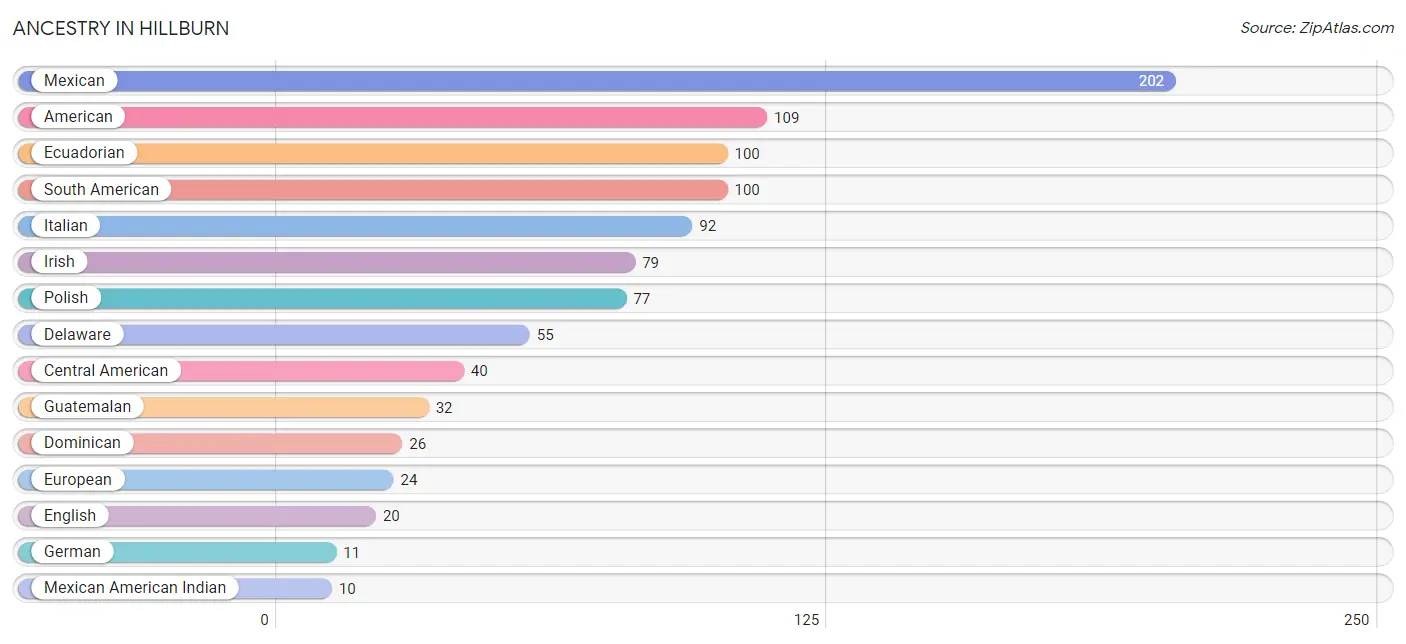
Ancestry in Hillburn
The most populous ancestries reported in Hillburn are Mexican (202 | 17.9%), American (109 | 9.6%), Ecuadorian (100 | 8.8%), South American (100 | 8.8%), and Italian (92 | 8.1%), together accounting for 53.3% of all Hillburn residents.
| Ancestry | # Population | % Population |
| American | 109 | 9.6% |
| Austrian | 2 | 0.2% |
| Burmese | 2 | 0.2% |
| Canadian | 8 | 0.7% |
| Central American | 40 | 3.5% |
| Cuban | 4 | 0.4% |
| Danish | 2 | 0.2% |
| Delaware | 55 | 4.9% |
| Dominican | 26 | 2.3% |
| Ecuadorian | 100 | 8.8% |
| English | 20 | 1.8% |
| European | 24 | 2.1% |
| French | 7 | 0.6% |
| German | 11 | 1.0% |
| Guatemalan | 32 | 2.8% |
| Honduran | 4 | 0.4% |
| Hungarian | 5 | 0.4% |
| Indian (Asian) | 2 | 0.2% |
| Irish | 79 | 7.0% |
| Italian | 92 | 8.1% |
| Korean | 4 | 0.4% |
| Mexican | 202 | 17.9% |
| Mexican American Indian | 10 | 0.9% |
| Polish | 77 | 6.8% |
| Puerto Rican | 4 | 0.4% |
| Russian | 9 | 0.8% |
| Salvadoran | 4 | 0.4% |
| South American | 100 | 8.8% |
| Swedish | 2 | 0.2% |
| Thai | 2 | 0.2% | View All 30 Rows |
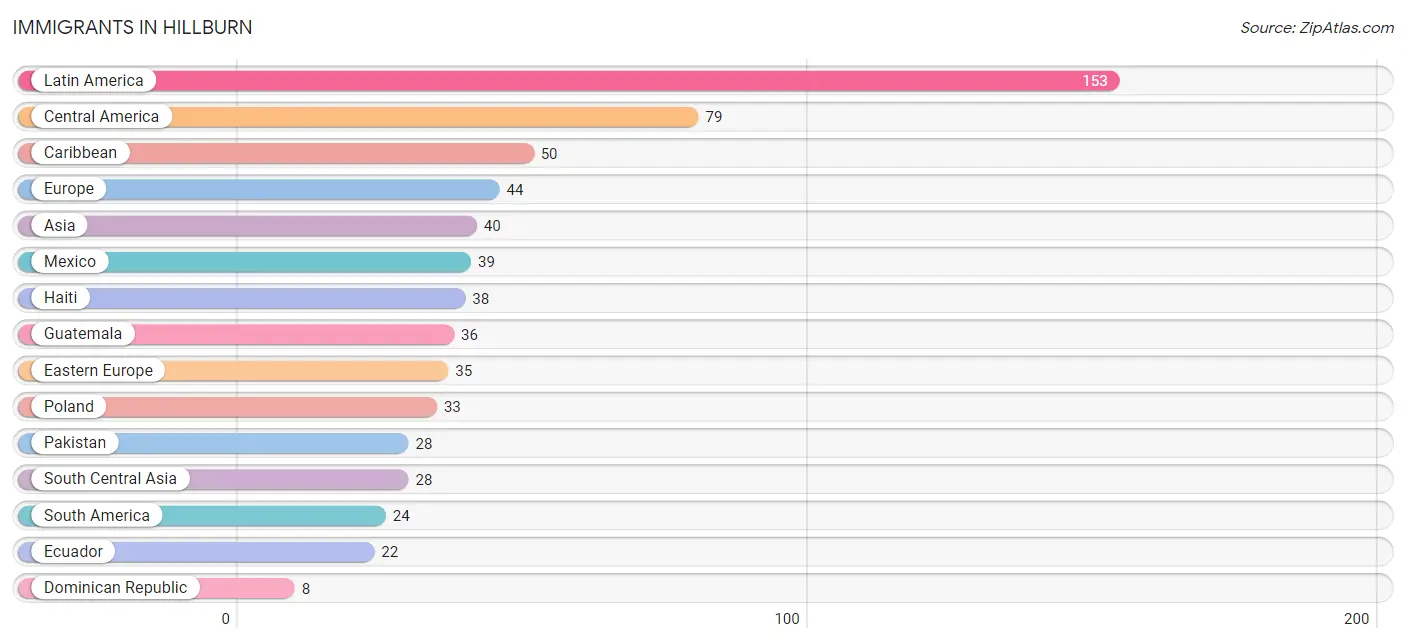
Immigrants in Hillburn
The most numerous immigrant groups reported in Hillburn came from Latin America (153 | 13.5%), Central America (79 | 7.0%), Caribbean (50 | 4.4%), Europe (44 | 3.9%), and Asia (40 | 3.5%), together accounting for 32.4% of all Hillburn residents.
| Immigration Origin | # Population | % Population |
| Asia | 40 | 3.5% |
| Caribbean | 50 | 4.4% |
| Central America | 79 | 7.0% |
| China | 2 | 0.2% |
| Dominican Republic | 8 | 0.7% |
| Eastern Asia | 4 | 0.4% |
| Eastern Europe | 35 | 3.1% |
| Ecuador | 22 | 1.9% |
| El Salvador | 4 | 0.4% |
| Europe | 44 | 3.9% |
| Germany | 2 | 0.2% |
| Guatemala | 36 | 3.2% |
| Guyana | 2 | 0.2% |
| Haiti | 38 | 3.4% |
| Ireland | 7 | 0.6% |
| Korea | 2 | 0.2% |
| Kuwait | 6 | 0.5% |
| Latin America | 153 | 13.5% |
| Mexico | 39 | 3.5% |
| Northern Europe | 7 | 0.6% |
| Pakistan | 28 | 2.5% |
| Philippines | 2 | 0.2% |
| Poland | 33 | 2.9% |
| Russia | 2 | 0.2% |
| South America | 24 | 2.1% |
| South Central Asia | 28 | 2.5% |
| South Eastern Asia | 2 | 0.2% |
| Taiwan | 2 | 0.2% |
| Trinidad and Tobago | 4 | 0.4% |
| Western Asia | 6 | 0.5% |
| Western Europe | 2 | 0.2% | View All 31 Rows |
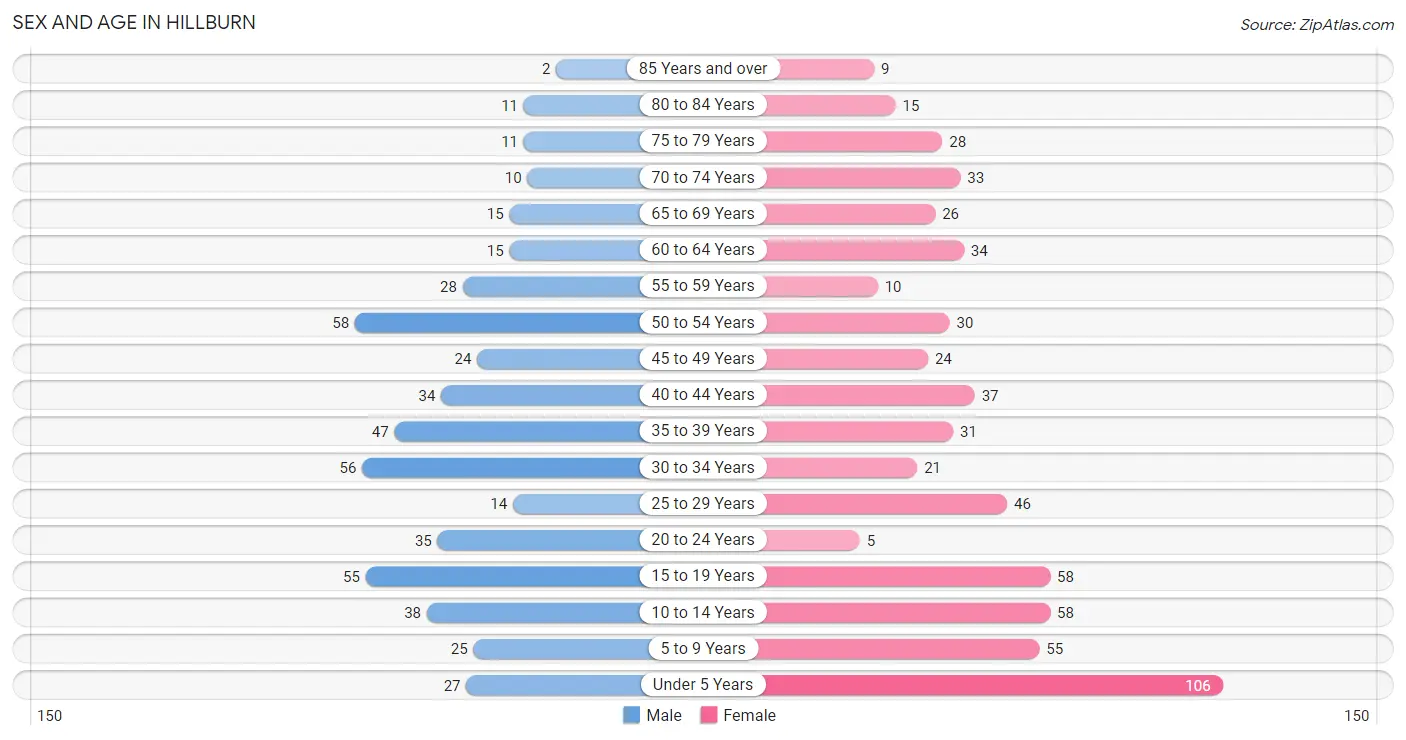
Sex and Age in Hillburn
Sex and Age in Hillburn
The most populous age groups in Hillburn are 50 to 54 Years (58 | 11.5%) for men and Under 5 Years (106 | 16.9%) for women.
| Age Bracket | Male | Female |
| Under 5 Years | 27 (5.3%) | 106 (16.9%) |
| 5 to 9 Years | 25 (5.0%) | 55 (8.8%) |
| 10 to 14 Years | 38 (7.5%) | 58 (9.3%) |
| 15 to 19 Years | 55 (10.9%) | 58 (9.3%) |
| 20 to 24 Years | 35 (6.9%) | 5 (0.8%) |
| 25 to 29 Years | 14 (2.8%) | 46 (7.3%) |
| 30 to 34 Years | 56 (11.1%) | 21 (3.4%) |
| 35 to 39 Years | 47 (9.3%) | 31 (5.0%) |
| 40 to 44 Years | 34 (6.7%) | 37 (5.9%) |
| 45 to 49 Years | 24 (4.8%) | 24 (3.8%) |
| 50 to 54 Years | 58 (11.5%) | 30 (4.8%) |
| 55 to 59 Years | 28 (5.5%) | 10 (1.6%) |
| 60 to 64 Years | 15 (3.0%) | 34 (5.4%) |
| 65 to 69 Years | 15 (3.0%) | 26 (4.2%) |
| 70 to 74 Years | 10 (2.0%) | 33 (5.3%) |
| 75 to 79 Years | 11 (2.2%) | 28 (4.5%) |
| 80 to 84 Years | 11 (2.2%) | 15 (2.4%) |
| 85 Years and over | 2 (0.4%) | 9 (1.4%) |
| Total | 505 (100.0%) | 626 (100.0%) |
Families and Households in Hillburn
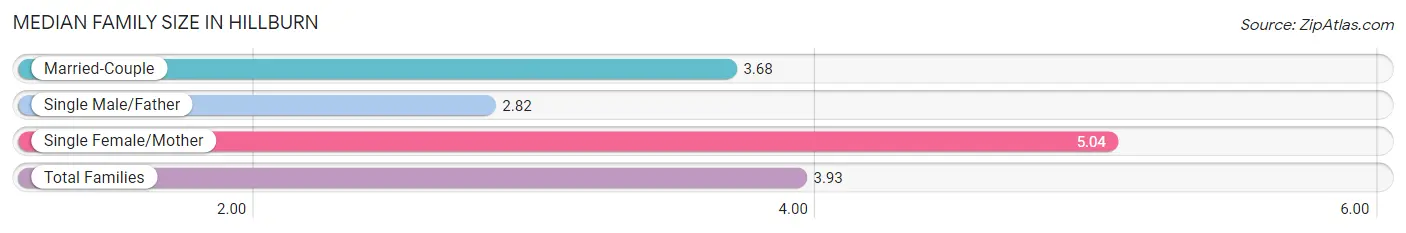
Median Family Size in Hillburn
The median family size in Hillburn is 3.93 persons per family, with single female/mother families (51 | 20.7%) accounting for the largest median family size of 5.04 persons per family. On the other hand, single male/father families (11 | 4.5%) represent the smallest median family size with 2.82 persons per family.
| Family Type | # Families | Family Size |
| Married-Couple | 184 (74.8%) | 3.68 |
| Single Male/Father | 11 (4.5%) | 2.82 |
| Single Female/Mother | 51 (20.7%) | 5.04 |
| Total Families | 246 (100.0%) | 3.93 |
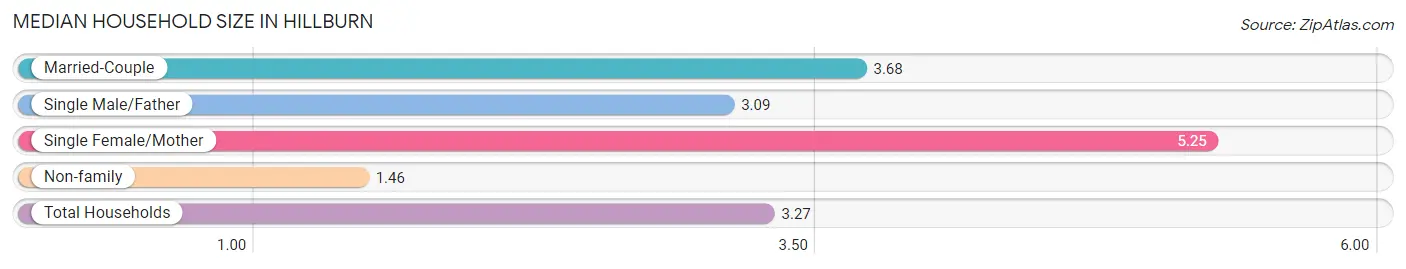
Median Household Size in Hillburn
The median household size in Hillburn is 3.27 persons per household, with single female/mother households (51 | 14.9%) accounting for the largest median household size of 5.25 persons per household. non-family households (97 | 28.3%) represent the smallest median household size with 1.46 persons per household.
| Household Type | # Households | Household Size |
| Married-Couple | 184 (53.6%) | 3.68 |
| Single Male/Father | 11 (3.2%) | 3.09 |
| Single Female/Mother | 51 (14.9%) | 5.25 |
| Non-family | 97 (28.3%) | 1.46 |
| Total Households | 343 (100.0%) | 3.27 |
Household Size by Marriage Status in Hillburn
Out of a total of 343 households in Hillburn, 246 (71.7%) are family households, while 97 (28.3%) are nonfamily households. The most numerous type of family households are 3-person households, comprising 77, and the most common type of nonfamily households are 1-person households, comprising 68.
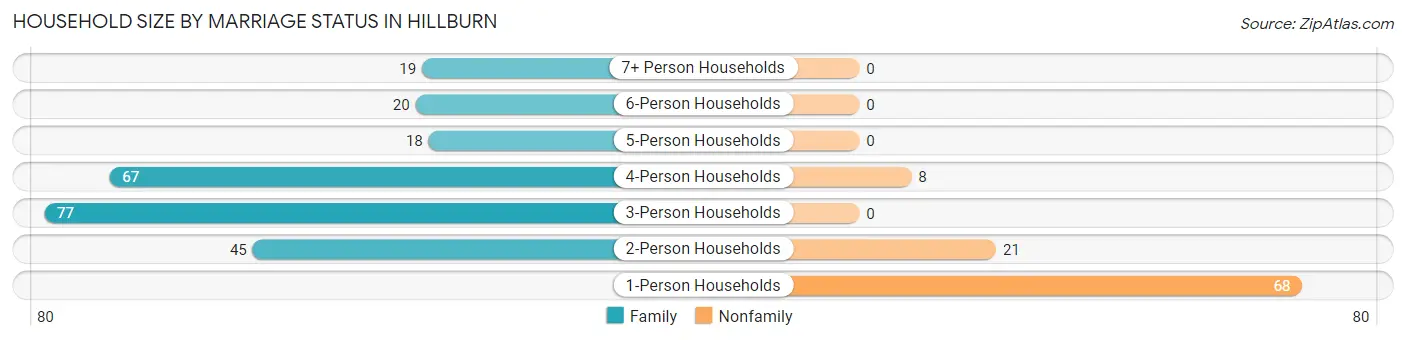
| Household Size | Family Households | Nonfamily Households |
| 1-Person Households | - | 68 (19.8%) |
| 2-Person Households | 45 (13.1%) | 21 (6.1%) |
| 3-Person Households | 77 (22.5%) | 0 (0.0%) |
| 4-Person Households | 67 (19.5%) | 8 (2.3%) |
| 5-Person Households | 18 (5.2%) | 0 (0.0%) |
| 6-Person Households | 20 (5.8%) | 0 (0.0%) |
| 7+ Person Households | 19 (5.5%) | 0 (0.0%) |
| Total | 246 (71.7%) | 97 (28.3%) |
Female Fertility in Hillburn
Fertility by Age in Hillburn
Average fertility rate in Hillburn is 22.0 births per 1,000 women. Women in the age bracket of 35 to 50 years have the highest fertility rate with 53.0 births per 1,000 women. Women in the age bracket of 35 to 50 years acount for 100.0% of all women with births.
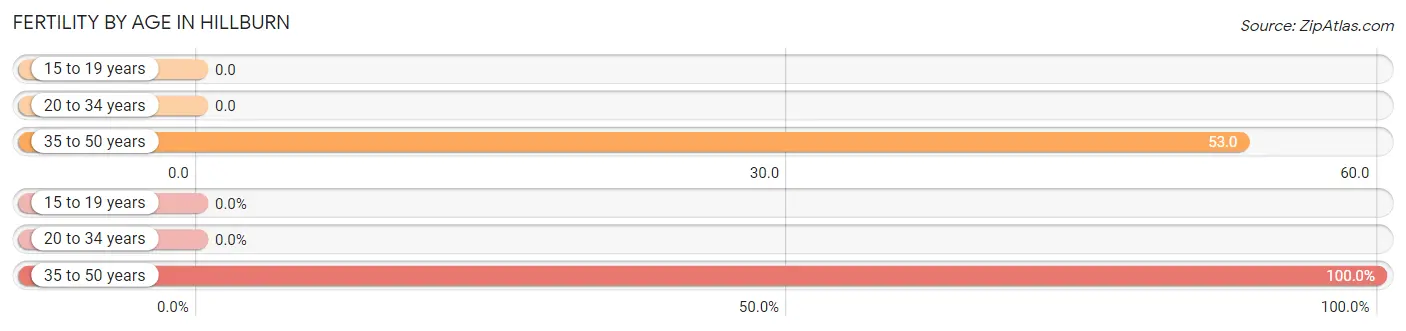
| Age Bracket | Women with Births | Births / 1,000 Women |
| 15 to 19 years | 0 (0.0%) | 0.0 |
| 20 to 34 years | 0 (0.0%) | 0.0 |
| 35 to 50 years | 5 (100.0%) | 53.0 |
| Total | 5 (100.0%) | 22.0 |
Fertility by Age by Marriage Status in Hillburn
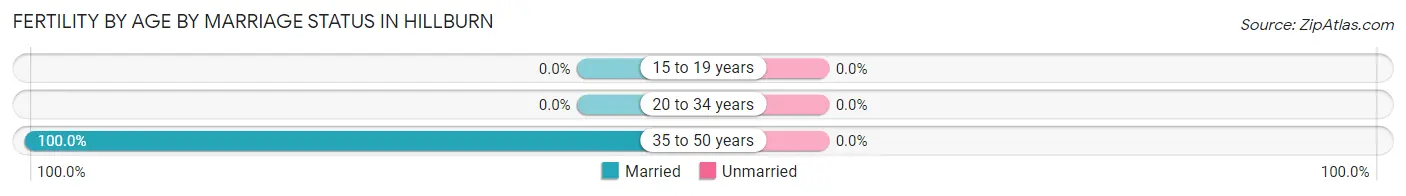
| Age Bracket | Married | Unmarried |
| 15 to 19 years | 0 (0.0%) | 0 (0.0%) |
| 20 to 34 years | 0 (0.0%) | 0 (0.0%) |
| 35 to 50 years | 5 (100.0%) | 0 (0.0%) |
| Total | 5 (100.0%) | 0 (0.0%) |
Fertility by Education in Hillburn
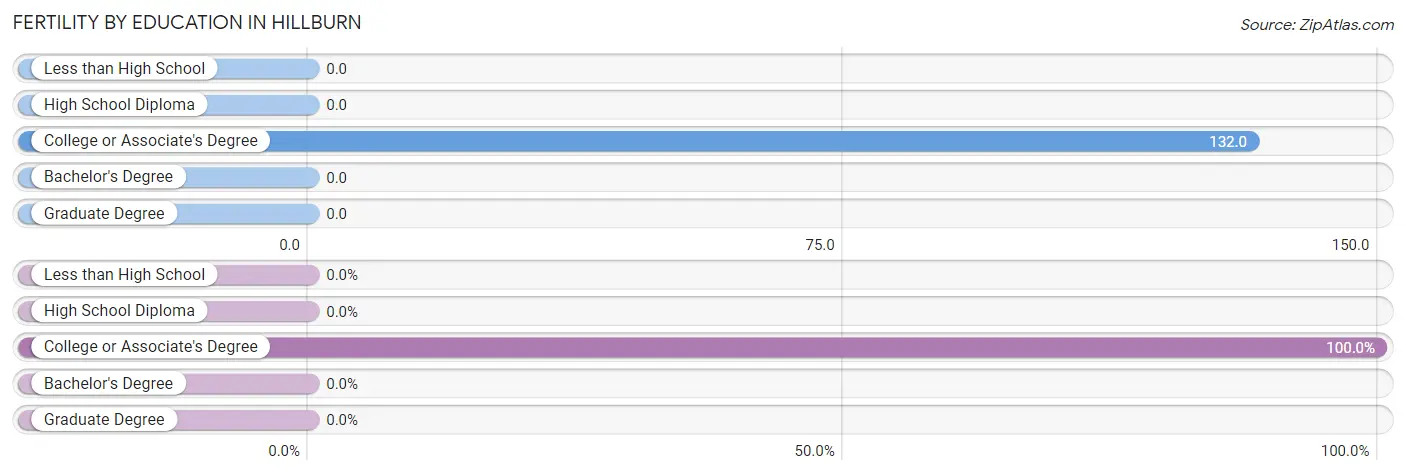
| Educational Attainment | Women with Births | Births / 1,000 Women |
| Less than High School | 0 (0.0%) | 0.0 |
| High School Diploma | 0 (0.0%) | 0.0 |
| College or Associate's Degree | 5 (100.0%) | 132.0 |
| Bachelor's Degree | 0 (0.0%) | 0.0 |
| Graduate Degree | 0 (0.0%) | 0.0 |
| Total | 5 (100.0%) | 22.0 |
Fertility by Education by Marriage Status in Hillburn
| Educational Attainment | Married | Unmarried |
| Less than High School | 0 (0.0%) | 0 (0.0%) |
| High School Diploma | 0 (0.0%) | 0 (0.0%) |
| College or Associate's Degree | 5 (100.0%) | 0 (0.0%) |
| Bachelor's Degree | 0 (0.0%) | 0 (0.0%) |
| Graduate Degree | 0 (0.0%) | 0 (0.0%) |
| Total | 5 (100.0%) | 0 (0.0%) |
Employment Characteristics in Hillburn
Employment by Class of Employer in Hillburn
Among the 440 employed individuals in Hillburn, private company employees (273 | 62.1%), not-for-profit organizations (66 | 15.0%), and local government employees (59 | 13.4%) make up the most common classes of employment.
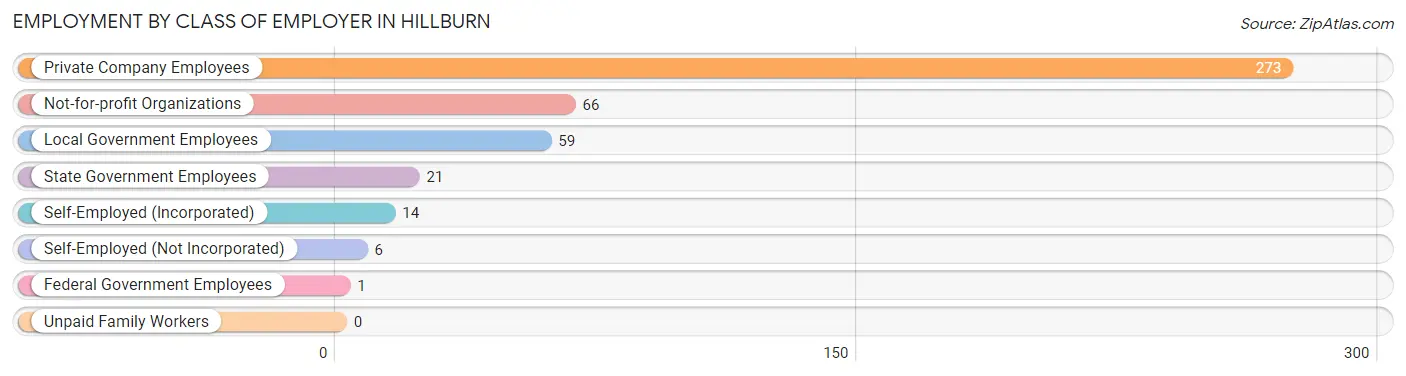
| Employer Class | # Employees | % Employees |
| Private Company Employees | 273 | 62.1% |
| Self-Employed (Incorporated) | 14 | 3.2% |
| Self-Employed (Not Incorporated) | 6 | 1.4% |
| Not-for-profit Organizations | 66 | 15.0% |
| Local Government Employees | 59 | 13.4% |
| State Government Employees | 21 | 4.8% |
| Federal Government Employees | 1 | 0.2% |
| Unpaid Family Workers | 0 | 0.0% |
| Total | 440 | 100.0% |
Employment Status by Age in Hillburn
According to the labor force statistics for Hillburn, out of the total population over 16 years of age (802), 62.2% or 499 individuals are in the labor force, with 8.8% or 44 of them unemployed. The age group with the highest labor force participation rate is 55 to 59 years, with 89.5% or 34 individuals in the labor force. Within the labor force, the 20 to 24 years age range has the highest percentage of unemployed individuals, with 23.8% or 5 of them being unemployed.
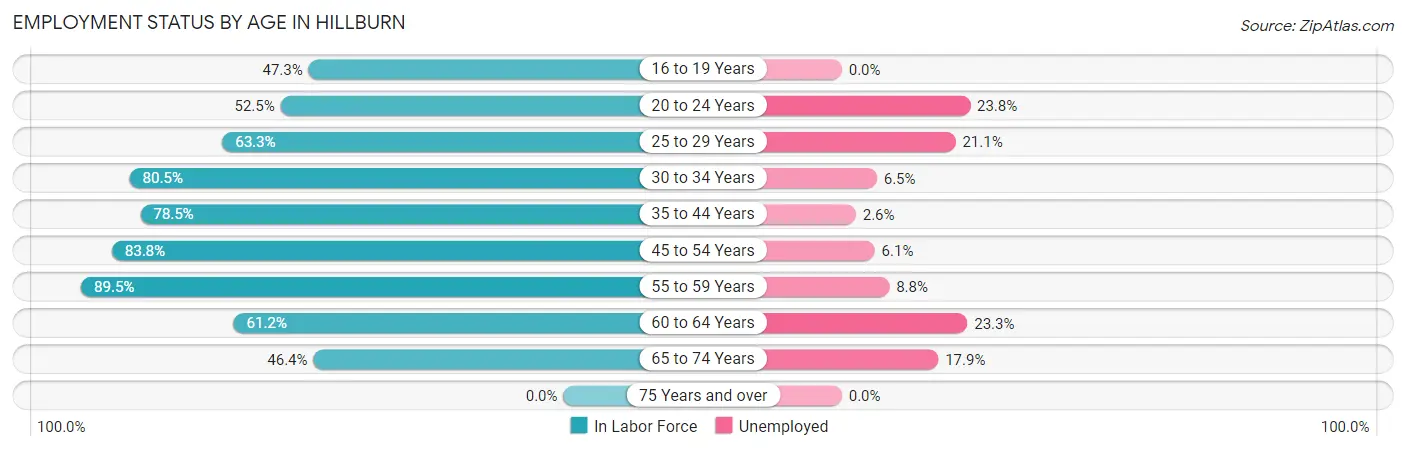
| Age Bracket | In Labor Force | Unemployed |
| 16 to 19 Years | 44 (47.3%) | 0 (0.0%) |
| 20 to 24 Years | 21 (52.5%) | 5 (23.8%) |
| 25 to 29 Years | 38 (63.3%) | 8 (21.1%) |
| 30 to 34 Years | 62 (80.5%) | 4 (6.5%) |
| 35 to 44 Years | 117 (78.5%) | 3 (2.6%) |
| 45 to 54 Years | 114 (83.8%) | 7 (6.1%) |
| 55 to 59 Years | 34 (89.5%) | 3 (8.8%) |
| 60 to 64 Years | 30 (61.2%) | 7 (23.3%) |
| 65 to 74 Years | 39 (46.4%) | 7 (17.9%) |
| 75 Years and over | 0 (0.0%) | 0 (0.0%) |
| Total | 499 (62.2%) | 44 (8.8%) |
Employment Status by Educational Attainment in Hillburn
According to labor force statistics for Hillburn, 77.6% of individuals (395) out of the total population between 25 and 64 years of age (509) are in the labor force, with 8.1% or 32 of them being unemployed. The group with the highest labor force participation rate are those with the educational attainment of bachelor's degree or higher, with 86.6% or 116 individuals in the labor force. Within the labor force, individuals with bachelor's degree or higher education have the highest percentage of unemployment, with 22.4% or 26 of them being unemployed.
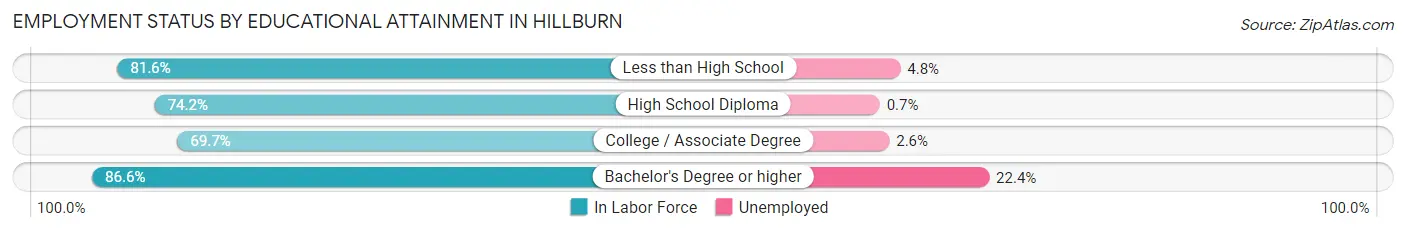
| Educational Attainment | In Labor Force | Unemployed |
| Less than High School | 62 (81.6%) | 4 (4.8%) |
| High School Diploma | 141 (74.2%) | 1 (0.7%) |
| College / Associate Degree | 76 (69.7%) | 3 (2.6%) |
| Bachelor's Degree or higher | 116 (86.6%) | 30 (22.4%) |
| Total | 395 (77.6%) | 41 (8.1%) |
Employment Occupations by Sex in Hillburn
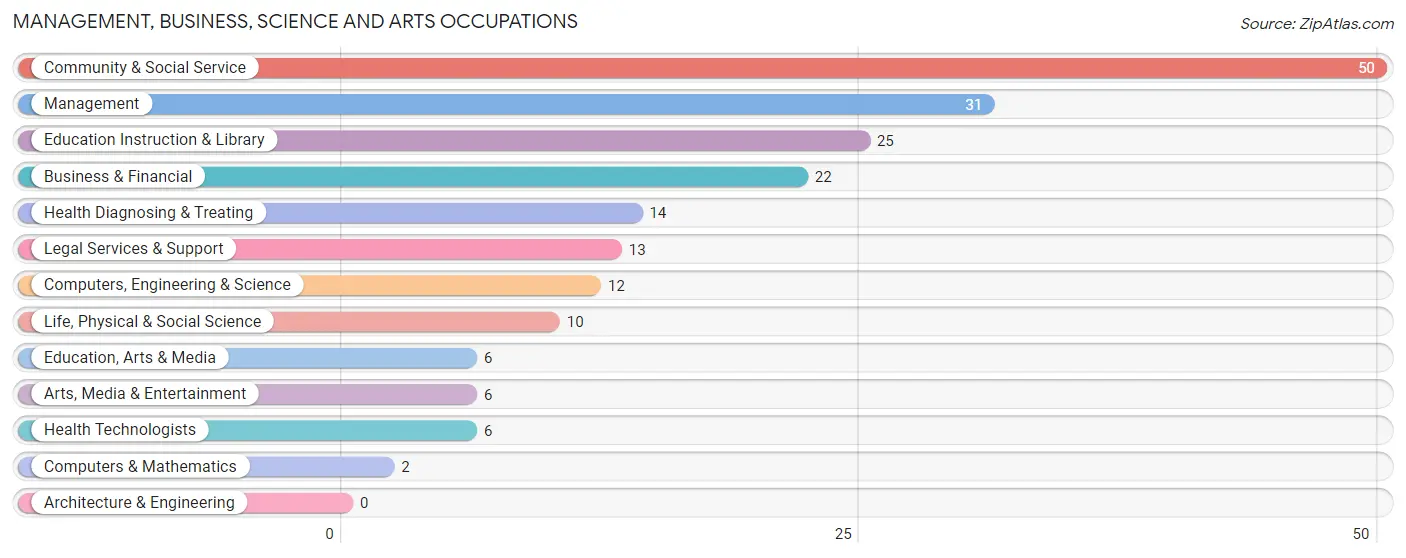
Management, Business, Science and Arts Occupations
The most common Management, Business, Science and Arts occupations in Hillburn are Community & Social Service (50 | 11.0%), Management (31 | 6.8%), Education Instruction & Library (25 | 5.5%), Business & Financial (22 | 4.8%), and Health Diagnosing & Treating (14 | 3.1%).
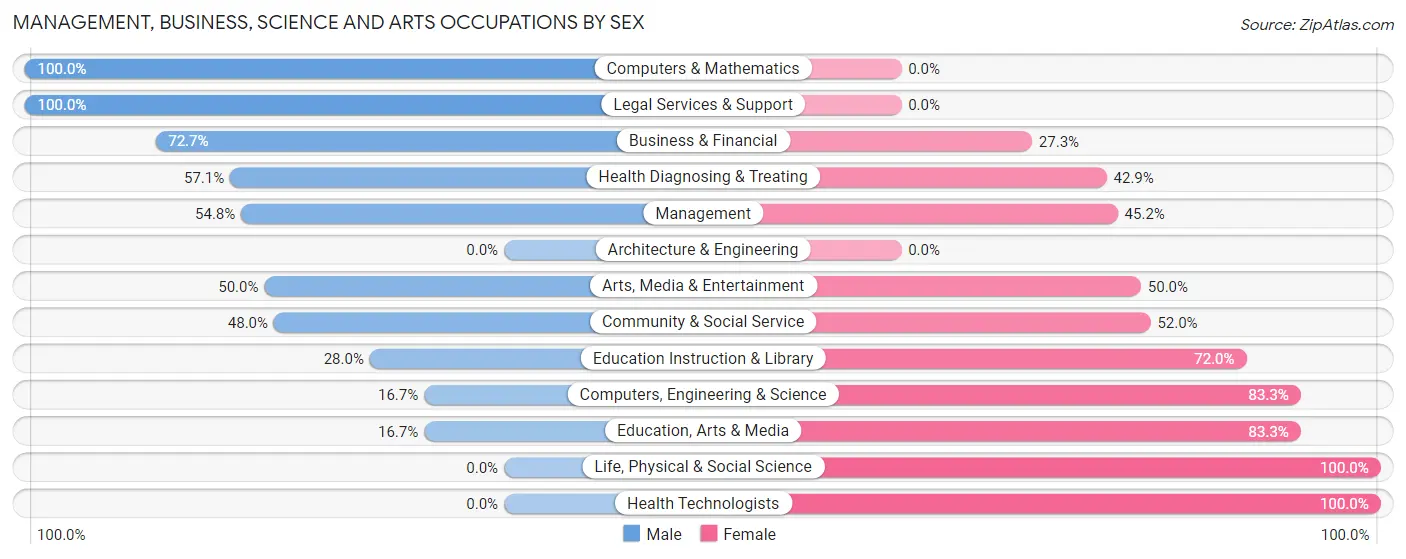
Management, Business, Science and Arts Occupations by Sex
Within the Management, Business, Science and Arts occupations in Hillburn, the most male-oriented occupations are Computers & Mathematics (100.0%), Legal Services & Support (100.0%), and Business & Financial (72.7%), while the most female-oriented occupations are Life, Physical & Social Science (100.0%), Health Technologists (100.0%), and Computers, Engineering & Science (83.3%).
| Occupation | Male | Female |
| Management | 17 (54.8%) | 14 (45.2%) |
| Business & Financial | 16 (72.7%) | 6 (27.3%) |
| Computers, Engineering & Science | 2 (16.7%) | 10 (83.3%) |
| Computers & Mathematics | 2 (100.0%) | 0 (0.0%) |
| Architecture & Engineering | 0 (0.0%) | 0 (0.0%) |
| Life, Physical & Social Science | 0 (0.0%) | 10 (100.0%) |
| Community & Social Service | 24 (48.0%) | 26 (52.0%) |
| Education, Arts & Media | 1 (16.7%) | 5 (83.3%) |
| Legal Services & Support | 13 (100.0%) | 0 (0.0%) |
| Education Instruction & Library | 7 (28.0%) | 18 (72.0%) |
| Arts, Media & Entertainment | 3 (50.0%) | 3 (50.0%) |
| Health Diagnosing & Treating | 8 (57.1%) | 6 (42.9%) |
| Health Technologists | 0 (0.0%) | 6 (100.0%) |
| Total (Category) | 67 (51.9%) | 62 (48.1%) |
| Total (Overall) | 301 (66.1%) | 154 (33.9%) |
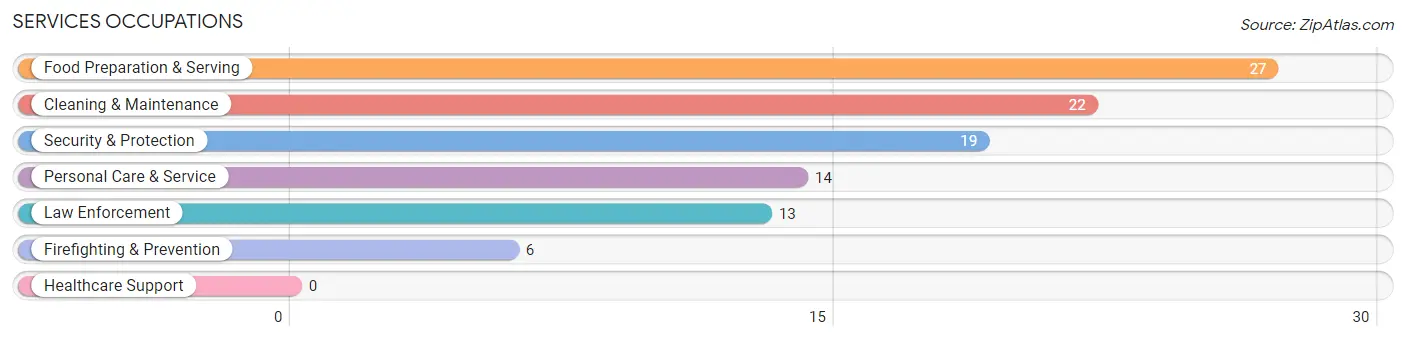
Services Occupations
The most common Services occupations in Hillburn are Food Preparation & Serving (27 | 5.9%), Cleaning & Maintenance (22 | 4.8%), Security & Protection (19 | 4.2%), Personal Care & Service (14 | 3.1%), and Law Enforcement (13 | 2.9%).
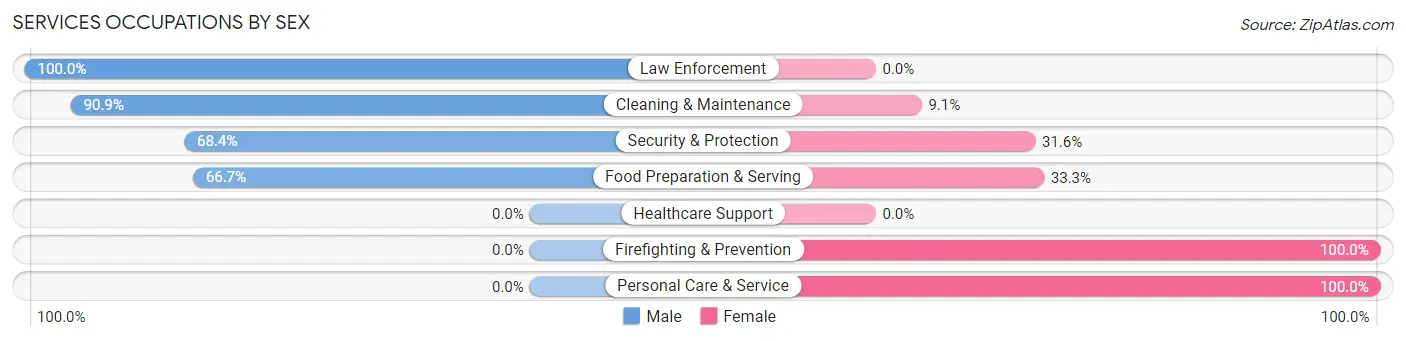
Services Occupations by Sex
Within the Services occupations in Hillburn, the most male-oriented occupations are Law Enforcement (100.0%), Cleaning & Maintenance (90.9%), and Security & Protection (68.4%), while the most female-oriented occupations are Firefighting & Prevention (100.0%), Personal Care & Service (100.0%), and Food Preparation & Serving (33.3%).
| Occupation | Male | Female |
| Healthcare Support | 0 (0.0%) | 0 (0.0%) |
| Security & Protection | 13 (68.4%) | 6 (31.6%) |
| Firefighting & Prevention | 0 (0.0%) | 6 (100.0%) |
| Law Enforcement | 13 (100.0%) | 0 (0.0%) |
| Food Preparation & Serving | 18 (66.7%) | 9 (33.3%) |
| Cleaning & Maintenance | 20 (90.9%) | 2 (9.1%) |
| Personal Care & Service | 0 (0.0%) | 14 (100.0%) |
| Total (Category) | 51 (62.2%) | 31 (37.8%) |
| Total (Overall) | 301 (66.1%) | 154 (33.9%) |
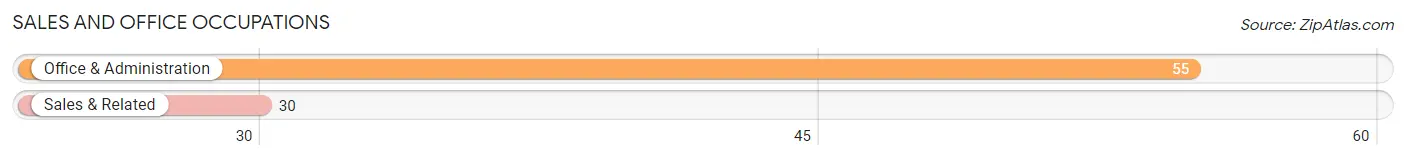
Sales and Office Occupations
The most common Sales and Office occupations in Hillburn are Office & Administration (55 | 12.1%), and Sales & Related (30 | 6.6%).
Sales and Office Occupations by Sex
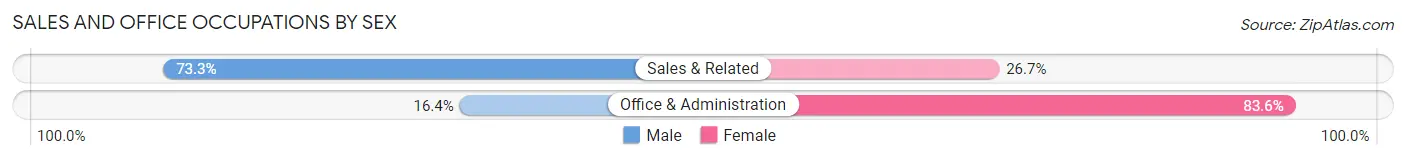
| Occupation | Male | Female |
| Sales & Related | 22 (73.3%) | 8 (26.7%) |
| Office & Administration | 9 (16.4%) | 46 (83.6%) |
| Total (Category) | 31 (36.5%) | 54 (63.5%) |
| Total (Overall) | 301 (66.1%) | 154 (33.9%) |
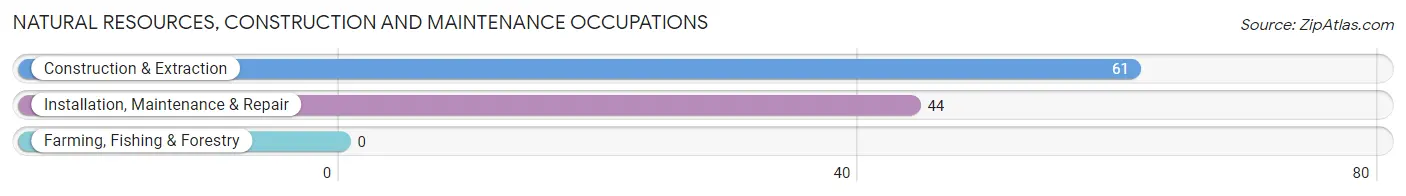
Natural Resources, Construction and Maintenance Occupations
The most common Natural Resources, Construction and Maintenance occupations in Hillburn are Construction & Extraction (61 | 13.4%), and Installation, Maintenance & Repair (44 | 9.7%).
Natural Resources, Construction and Maintenance Occupations by Sex
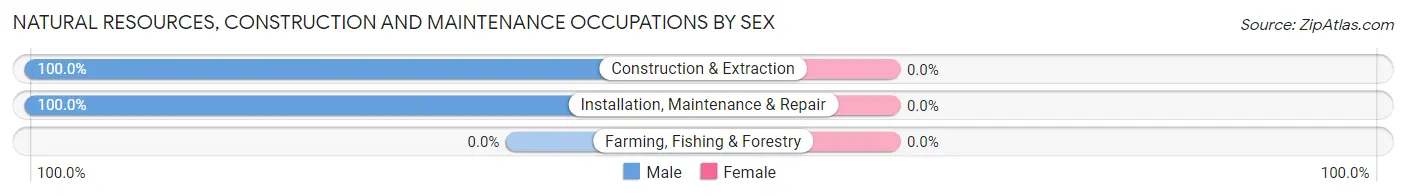
| Occupation | Male | Female |
| Farming, Fishing & Forestry | 0 (0.0%) | 0 (0.0%) |
| Construction & Extraction | 61 (100.0%) | 0 (0.0%) |
| Installation, Maintenance & Repair | 44 (100.0%) | 0 (0.0%) |
| Total (Category) | 105 (100.0%) | 0 (0.0%) |
| Total (Overall) | 301 (66.1%) | 154 (33.9%) |
Production, Transportation and Moving Occupations
The most common Production, Transportation and Moving occupations in Hillburn are Transportation (32 | 7.0%), Production (13 | 2.9%), and Material Moving (9 | 2.0%).
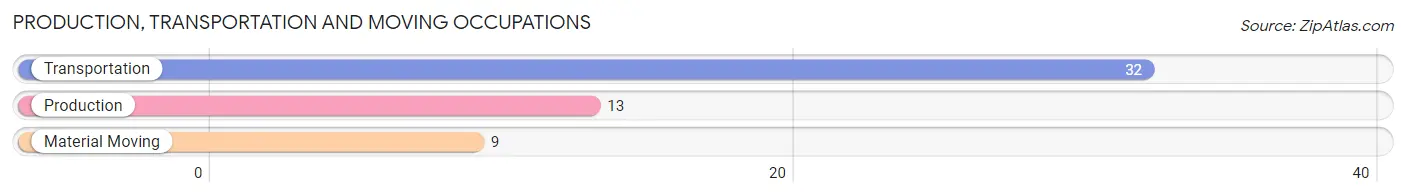
Production, Transportation and Moving Occupations by Sex
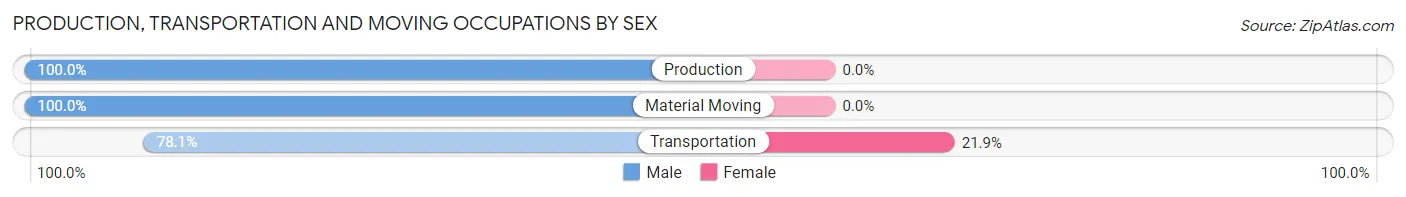
| Occupation | Male | Female |
| Production | 13 (100.0%) | 0 (0.0%) |
| Transportation | 25 (78.1%) | 7 (21.9%) |
| Material Moving | 9 (100.0%) | 0 (0.0%) |
| Total (Category) | 47 (87.0%) | 7 (13.0%) |
| Total (Overall) | 301 (66.1%) | 154 (33.9%) |
Employment Industries by Sex in Hillburn
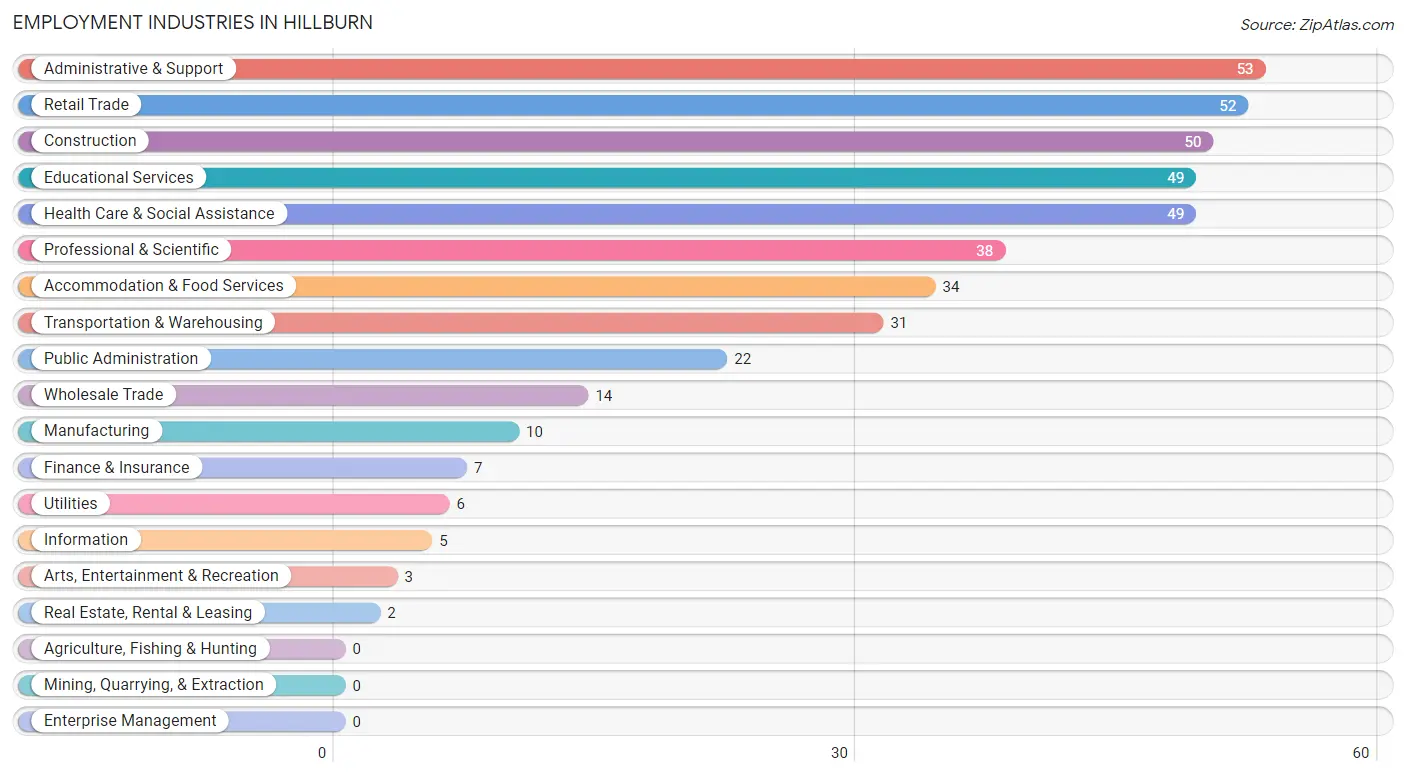
Employment Industries in Hillburn
The major employment industries in Hillburn include Administrative & Support (53 | 11.7%), Retail Trade (52 | 11.4%), Construction (50 | 11.0%), Educational Services (49 | 10.8%), and Health Care & Social Assistance (49 | 10.8%).
Employment Industries by Sex in Hillburn
The Hillburn industries that see more men than women are Manufacturing (100.0%), Wholesale Trade (100.0%), and Utilities (100.0%), whereas the industries that tend to have a higher number of women are Finance & Insurance (100.0%), Real Estate, Rental & Leasing (100.0%), and Information (60.0%).
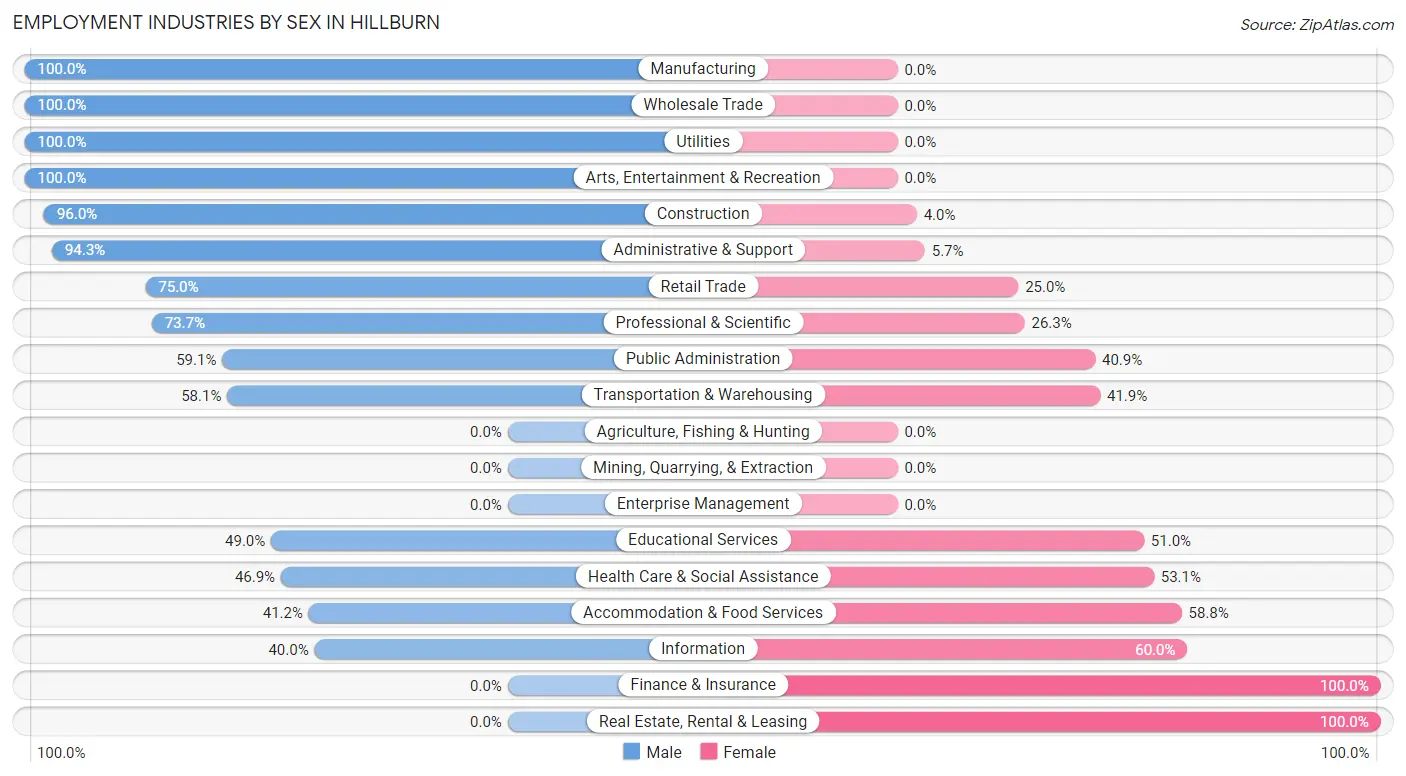
| Industry | Male | Female |
| Agriculture, Fishing & Hunting | 0 (0.0%) | 0 (0.0%) |
| Mining, Quarrying, & Extraction | 0 (0.0%) | 0 (0.0%) |
| Construction | 48 (96.0%) | 2 (4.0%) |
| Manufacturing | 10 (100.0%) | 0 (0.0%) |
| Wholesale Trade | 14 (100.0%) | 0 (0.0%) |
| Retail Trade | 39 (75.0%) | 13 (25.0%) |
| Transportation & Warehousing | 18 (58.1%) | 13 (41.9%) |
| Utilities | 6 (100.0%) | 0 (0.0%) |
| Information | 2 (40.0%) | 3 (60.0%) |
| Finance & Insurance | 0 (0.0%) | 7 (100.0%) |
| Real Estate, Rental & Leasing | 0 (0.0%) | 2 (100.0%) |
| Professional & Scientific | 28 (73.7%) | 10 (26.3%) |
| Enterprise Management | 0 (0.0%) | 0 (0.0%) |
| Administrative & Support | 50 (94.3%) | 3 (5.7%) |
| Educational Services | 24 (49.0%) | 25 (51.0%) |
| Health Care & Social Assistance | 23 (46.9%) | 26 (53.1%) |
| Arts, Entertainment & Recreation | 3 (100.0%) | 0 (0.0%) |
| Accommodation & Food Services | 14 (41.2%) | 20 (58.8%) |
| Public Administration | 13 (59.1%) | 9 (40.9%) |
| Total | 301 (66.1%) | 154 (33.9%) |
Education in Hillburn
School Enrollment in Hillburn
The most common levels of schooling among the 262 students in Hillburn are middle school (91 | 34.7%), high school (68 | 26.0%), and elementary school (47 | 17.9%).
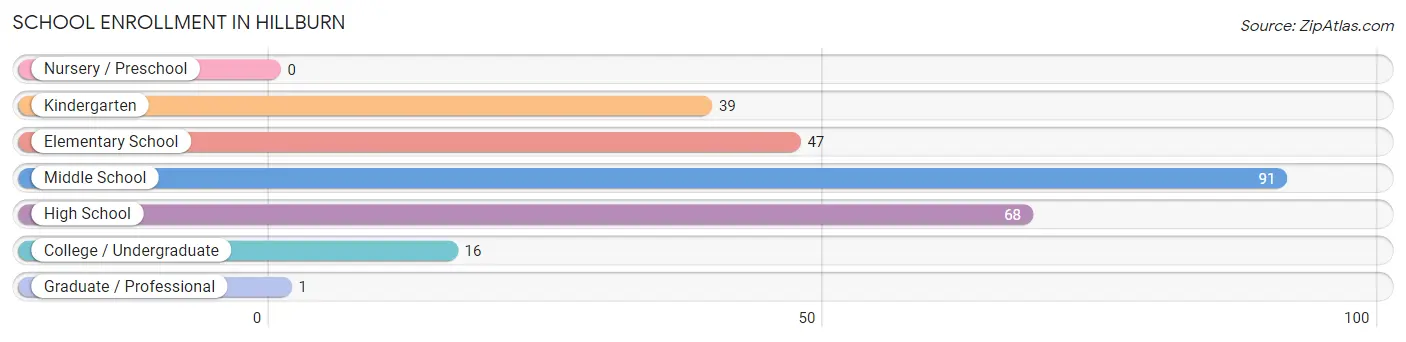
| School Level | # Students | % Students |
| Nursery / Preschool | 0 | 0.0% |
| Kindergarten | 39 | 14.9% |
| Elementary School | 47 | 17.9% |
| Middle School | 91 | 34.7% |
| High School | 68 | 26.0% |
| College / Undergraduate | 16 | 6.1% |
| Graduate / Professional | 1 | 0.4% |
| Total | 262 | 100.0% |
School Enrollment by Age by Funding Source in Hillburn
Out of a total of 262 students who are enrolled in schools in Hillburn, 18 (6.9%) attend a private institution, while the remaining 244 (93.1%) are enrolled in public schools. The age group of 18 to 19 year olds has the highest likelihood of being enrolled in private schools, with 8 (47.1% in the age bracket) enrolled. Conversely, the age group of 3 to 4 year olds has the lowest likelihood of being enrolled in a private school, with 6 (100.0% in the age bracket) attending a public institution.
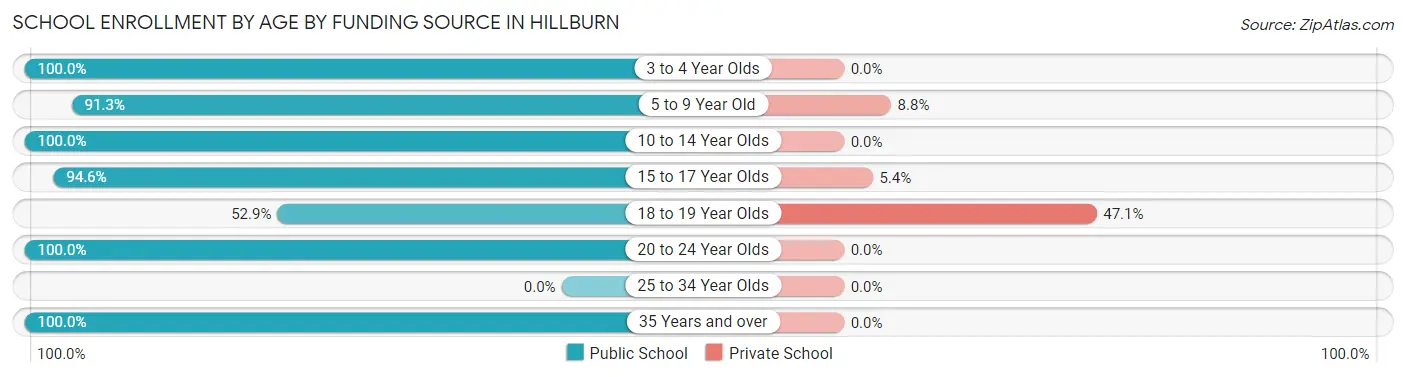
| Age Bracket | Public School | Private School |
| 3 to 4 Year Olds | 6 (100.0%) | 0 (0.0%) |
| 5 to 9 Year Old | 73 (91.2%) | 7 (8.7%) |
| 10 to 14 Year Olds | 96 (100.0%) | 0 (0.0%) |
| 15 to 17 Year Olds | 53 (94.6%) | 3 (5.4%) |
| 18 to 19 Year Olds | 9 (52.9%) | 8 (47.1%) |
| 20 to 24 Year Olds | 6 (100.0%) | 0 (0.0%) |
| 25 to 34 Year Olds | 0 (0.0%) | 0 (0.0%) |
| 35 Years and over | 1 (100.0%) | 0 (0.0%) |
| Total | 244 (93.1%) | 18 (6.9%) |
Educational Attainment by Field of Study in Hillburn
Education (77 | 41.2%), business (33 | 17.6%), engineering (15 | 8.0%), social sciences (14 | 7.5%), and liberal arts & history (10 | 5.3%) are the most common fields of study among 187 individuals in Hillburn who have obtained a bachelor's degree or higher.
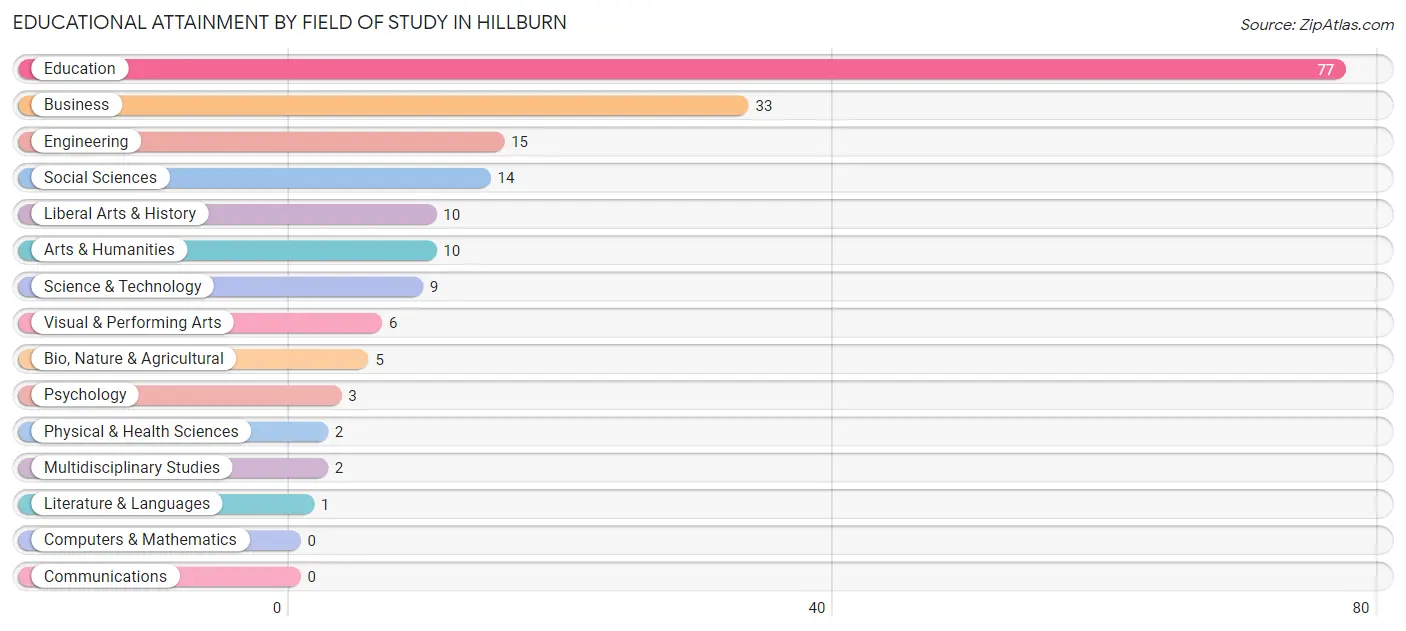
| Field of Study | # Graduates | % Graduates |
| Computers & Mathematics | 0 | 0.0% |
| Bio, Nature & Agricultural | 5 | 2.7% |
| Physical & Health Sciences | 2 | 1.1% |
| Psychology | 3 | 1.6% |
| Social Sciences | 14 | 7.5% |
| Engineering | 15 | 8.0% |
| Multidisciplinary Studies | 2 | 1.1% |
| Science & Technology | 9 | 4.8% |
| Business | 33 | 17.6% |
| Education | 77 | 41.2% |
| Literature & Languages | 1 | 0.5% |
| Liberal Arts & History | 10 | 5.3% |
| Visual & Performing Arts | 6 | 3.2% |
| Communications | 0 | 0.0% |
| Arts & Humanities | 10 | 5.3% |
| Total | 187 | 100.0% |
Transportation & Commute in Hillburn
Vehicle Availability by Sex in Hillburn
The most prevalent vehicle ownership categories in Hillburn are males with 2 vehicles (155, accounting for 51.7%) and females with 2 vehicles (58, making up 113.1%).
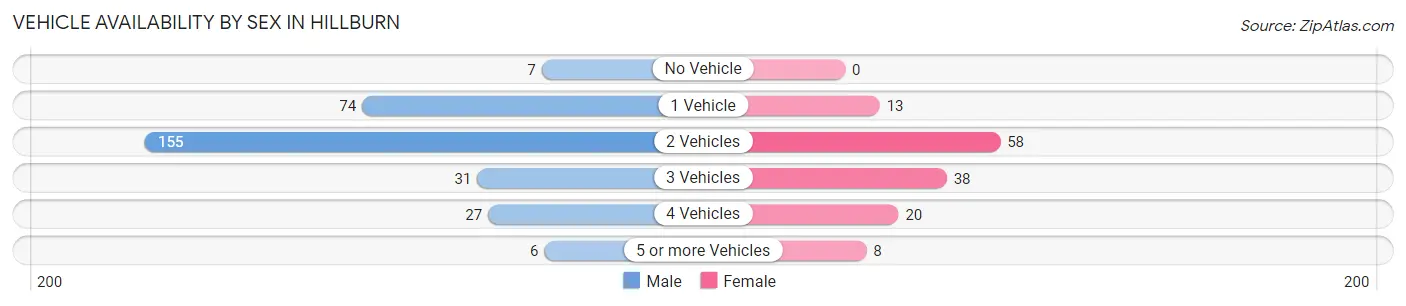
| Vehicles Available | Male | Female |
| No Vehicle | 7 (2.3%) | 0 (0.0%) |
| 1 Vehicle | 74 (24.7%) | 13 (9.5%) |
| 2 Vehicles | 155 (51.7%) | 58 (42.3%) |
| 3 Vehicles | 31 (10.3%) | 38 (27.7%) |
| 4 Vehicles | 27 (9.0%) | 20 (14.6%) |
| 5 or more Vehicles | 6 (2.0%) | 8 (5.8%) |
| Total | 300 (100.0%) | 137 (100.0%) |
Commute Time in Hillburn
The most frequently occuring commute durations in Hillburn are 30 to 34 minutes (90 commuters, 22.0%), 10 to 14 minutes (57 commuters, 13.9%), and 25 to 29 minutes (50 commuters, 12.2%).
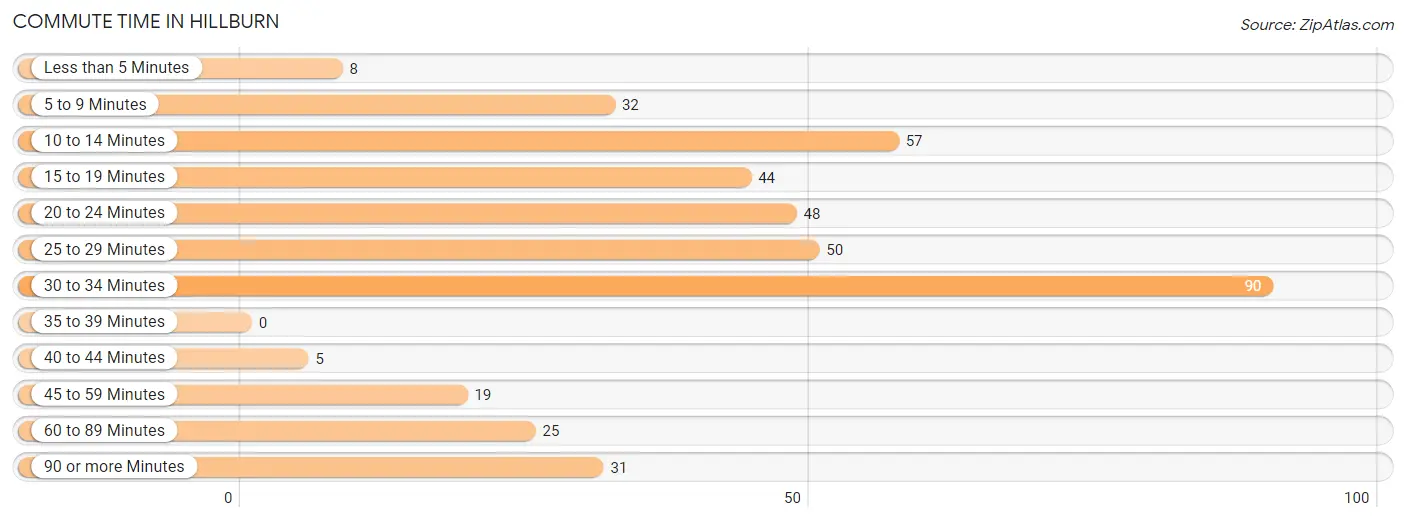
| Commute Time | # Commuters | % Commuters |
| Less than 5 Minutes | 8 | 2.0% |
| 5 to 9 Minutes | 32 | 7.8% |
| 10 to 14 Minutes | 57 | 13.9% |
| 15 to 19 Minutes | 44 | 10.8% |
| 20 to 24 Minutes | 48 | 11.7% |
| 25 to 29 Minutes | 50 | 12.2% |
| 30 to 34 Minutes | 90 | 22.0% |
| 35 to 39 Minutes | 0 | 0.0% |
| 40 to 44 Minutes | 5 | 1.2% |
| 45 to 59 Minutes | 19 | 4.6% |
| 60 to 89 Minutes | 25 | 6.1% |
| 90 or more Minutes | 31 | 7.6% |
Commute Time by Sex in Hillburn
The most common commute times in Hillburn are 30 to 34 minutes (59 commuters, 20.9%) for males and 30 to 34 minutes (31 commuters, 24.4%) for females.
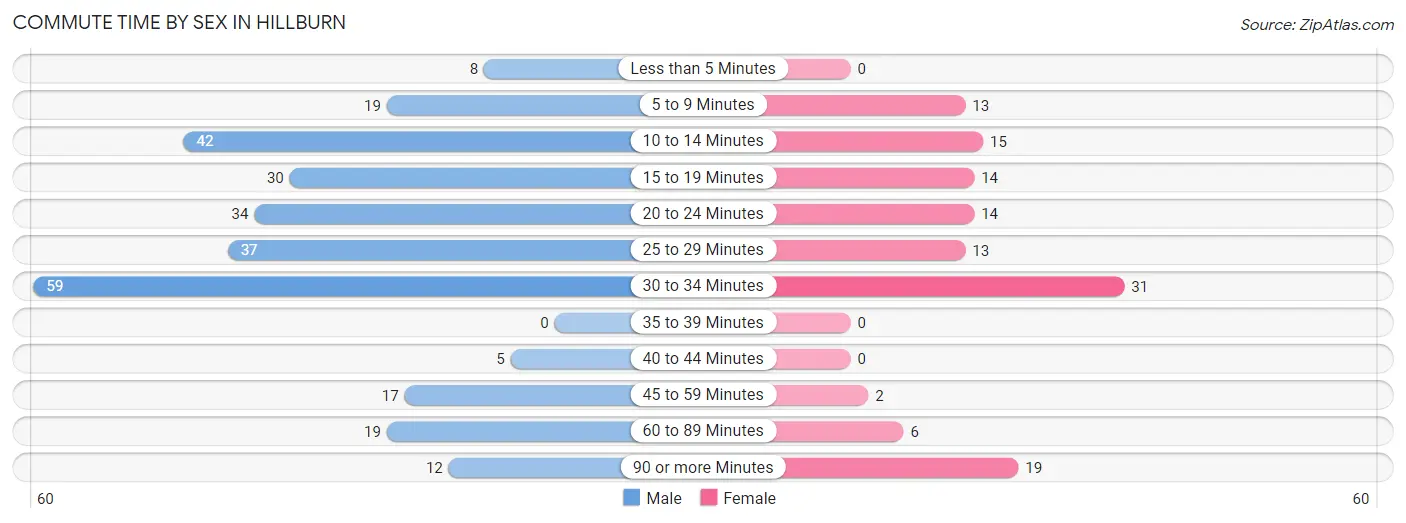
| Commute Time | Male | Female |
| Less than 5 Minutes | 8 (2.8%) | 0 (0.0%) |
| 5 to 9 Minutes | 19 (6.7%) | 13 (10.2%) |
| 10 to 14 Minutes | 42 (14.9%) | 15 (11.8%) |
| 15 to 19 Minutes | 30 (10.6%) | 14 (11.0%) |
| 20 to 24 Minutes | 34 (12.1%) | 14 (11.0%) |
| 25 to 29 Minutes | 37 (13.1%) | 13 (10.2%) |
| 30 to 34 Minutes | 59 (20.9%) | 31 (24.4%) |
| 35 to 39 Minutes | 0 (0.0%) | 0 (0.0%) |
| 40 to 44 Minutes | 5 (1.8%) | 0 (0.0%) |
| 45 to 59 Minutes | 17 (6.0%) | 2 (1.6%) |
| 60 to 89 Minutes | 19 (6.7%) | 6 (4.7%) |
| 90 or more Minutes | 12 (4.3%) | 19 (15.0%) |
Time of Departure to Work by Sex in Hillburn
The most frequent times of departure to work in Hillburn are 7:30 AM to 7:59 AM (57, 20.2%) for males and 8:30 AM to 8:59 AM (21, 16.5%) for females.
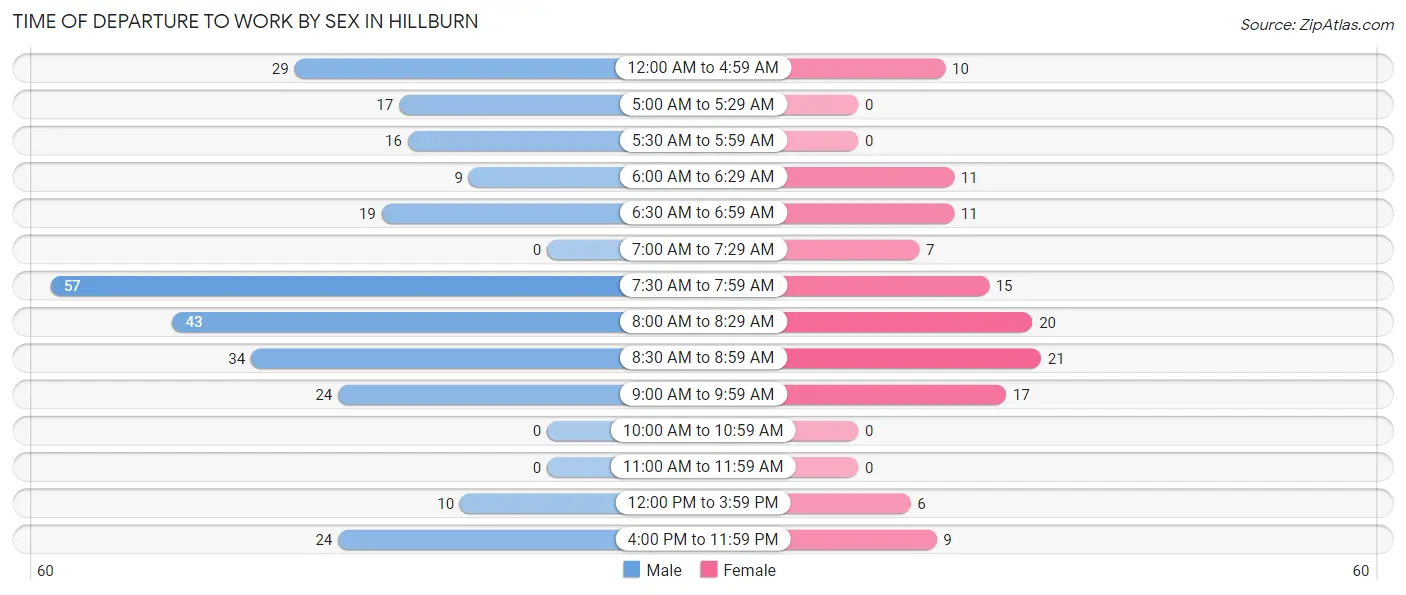
| Time of Departure | Male | Female |
| 12:00 AM to 4:59 AM | 29 (10.3%) | 10 (7.9%) |
| 5:00 AM to 5:29 AM | 17 (6.0%) | 0 (0.0%) |
| 5:30 AM to 5:59 AM | 16 (5.7%) | 0 (0.0%) |
| 6:00 AM to 6:29 AM | 9 (3.2%) | 11 (8.7%) |
| 6:30 AM to 6:59 AM | 19 (6.7%) | 11 (8.7%) |
| 7:00 AM to 7:29 AM | 0 (0.0%) | 7 (5.5%) |
| 7:30 AM to 7:59 AM | 57 (20.2%) | 15 (11.8%) |
| 8:00 AM to 8:29 AM | 43 (15.2%) | 20 (15.8%) |
| 8:30 AM to 8:59 AM | 34 (12.1%) | 21 (16.5%) |
| 9:00 AM to 9:59 AM | 24 (8.5%) | 17 (13.4%) |
| 10:00 AM to 10:59 AM | 0 (0.0%) | 0 (0.0%) |
| 11:00 AM to 11:59 AM | 0 (0.0%) | 0 (0.0%) |
| 12:00 PM to 3:59 PM | 10 (3.5%) | 6 (4.7%) |
| 4:00 PM to 11:59 PM | 24 (8.5%) | 9 (7.1%) |
| Total | 282 (100.0%) | 127 (100.0%) |
Housing Occupancy in Hillburn
Occupancy by Ownership in Hillburn
Of the total 343 dwellings in Hillburn, owner-occupied units account for 180 (52.5%), while renter-occupied units make up 163 (47.5%).
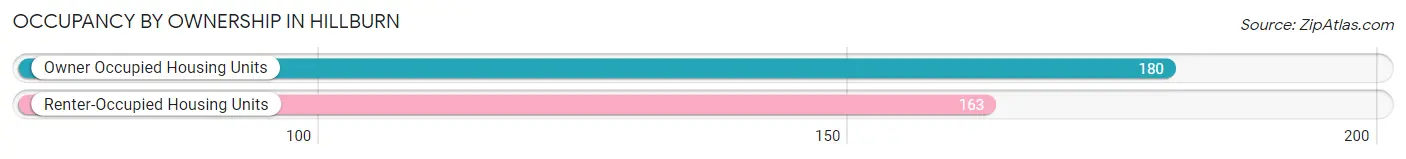
| Occupancy | # Housing Units | % Housing Units |
| Owner Occupied Housing Units | 180 | 52.5% |
| Renter-Occupied Housing Units | 163 | 47.5% |
| Total Occupied Housing Units | 343 | 100.0% |
Occupancy by Household Size in Hillburn
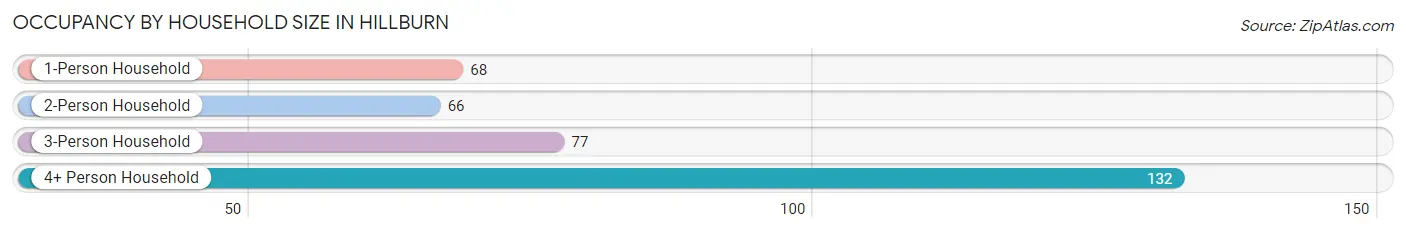
| Household Size | # Housing Units | % Housing Units |
| 1-Person Household | 68 | 19.8% |
| 2-Person Household | 66 | 19.2% |
| 3-Person Household | 77 | 22.5% |
| 4+ Person Household | 132 | 38.5% |
| Total Housing Units | 343 | 100.0% |
Occupancy by Ownership by Household Size in Hillburn
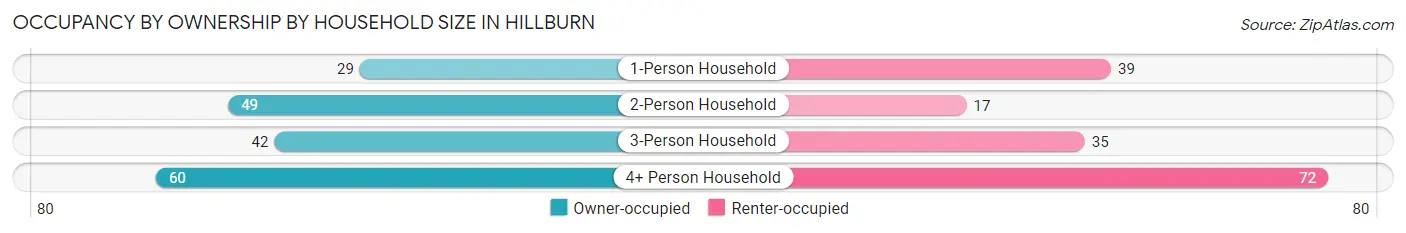
| Household Size | Owner-occupied | Renter-occupied |
| 1-Person Household | 29 (42.6%) | 39 (57.4%) |
| 2-Person Household | 49 (74.2%) | 17 (25.8%) |
| 3-Person Household | 42 (54.5%) | 35 (45.5%) |
| 4+ Person Household | 60 (45.5%) | 72 (54.5%) |
| Total Housing Units | 180 (52.5%) | 163 (47.5%) |
Occupancy by Educational Attainment in Hillburn
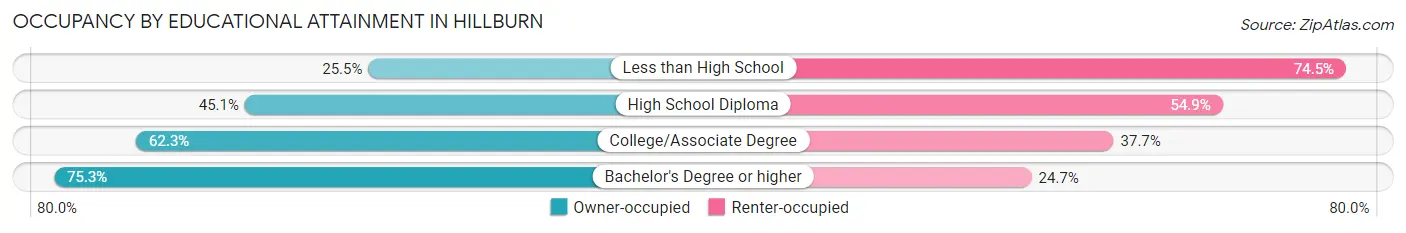
| Household Size | Owner-occupied | Renter-occupied |
| Less than High School | 13 (25.5%) | 38 (74.5%) |
| High School Diploma | 64 (45.1%) | 78 (54.9%) |
| College/Associate Degree | 48 (62.3%) | 29 (37.7%) |
| Bachelor's Degree or higher | 55 (75.3%) | 18 (24.7%) |
Occupancy by Age of Householder in Hillburn
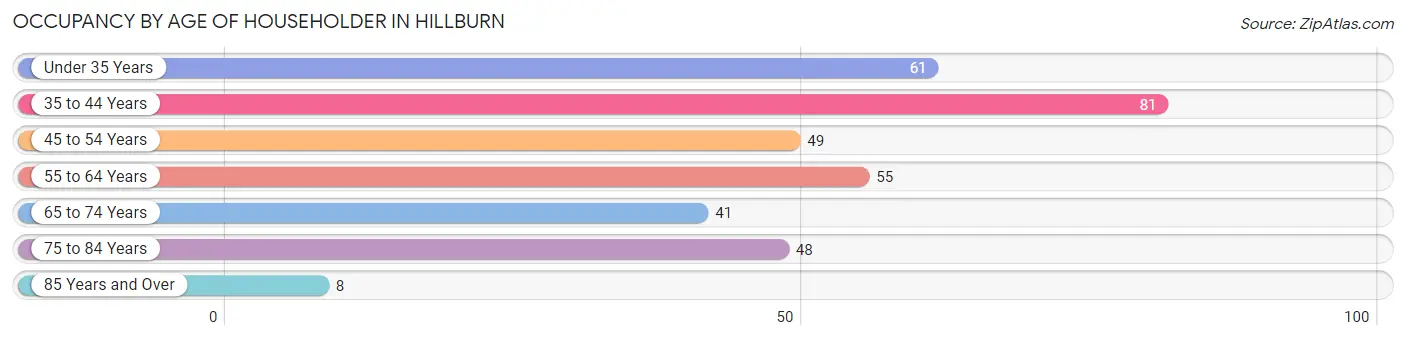
| Age Bracket | # Households | % Households |
| Under 35 Years | 61 | 17.8% |
| 35 to 44 Years | 81 | 23.6% |
| 45 to 54 Years | 49 | 14.3% |
| 55 to 64 Years | 55 | 16.0% |
| 65 to 74 Years | 41 | 11.9% |
| 75 to 84 Years | 48 | 14.0% |
| 85 Years and Over | 8 | 2.3% |
| Total | 343 | 100.0% |
Housing Finances in Hillburn
Median Income by Occupancy in Hillburn
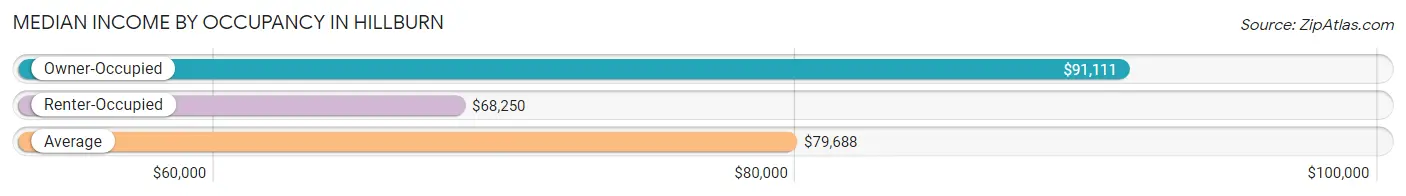
| Occupancy Type | # Households | Median Income |
| Owner-Occupied | 180 (52.5%) | $91,111 |
| Renter-Occupied | 163 (47.5%) | $68,250 |
| Average | 343 (100.0%) | $79,688 |
Occupancy by Householder Income Bracket in Hillburn
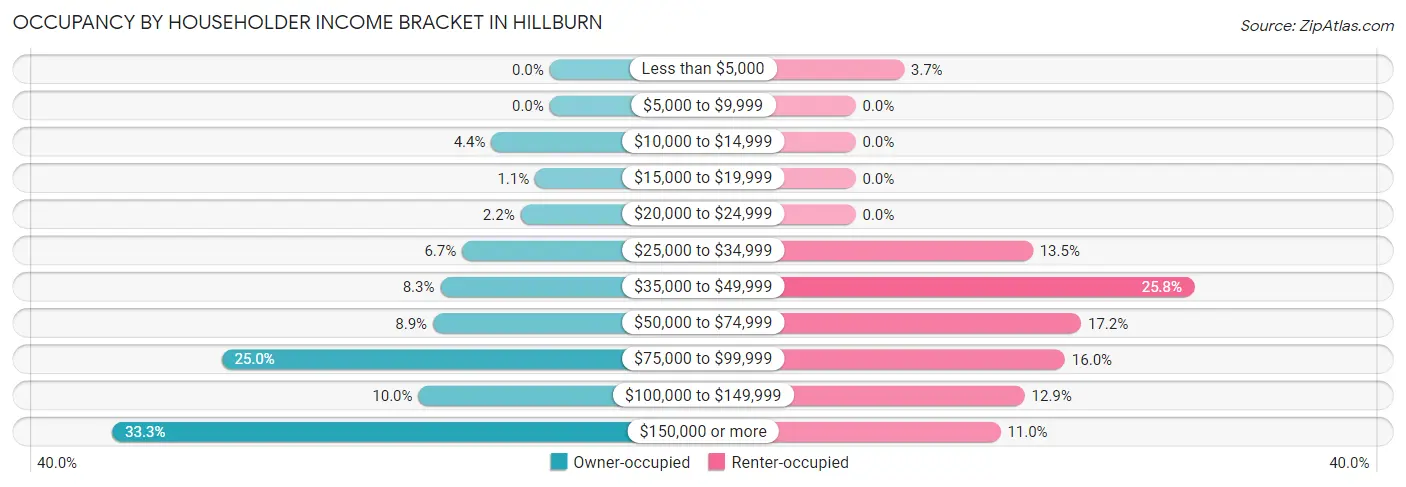
| Income Bracket | Owner-occupied | Renter-occupied |
| Less than $5,000 | 0 (0.0%) | 6 (3.7%) |
| $5,000 to $9,999 | 0 (0.0%) | 0 (0.0%) |
| $10,000 to $14,999 | 8 (4.4%) | 0 (0.0%) |
| $15,000 to $19,999 | 2 (1.1%) | 0 (0.0%) |
| $20,000 to $24,999 | 4 (2.2%) | 0 (0.0%) |
| $25,000 to $34,999 | 12 (6.7%) | 22 (13.5%) |
| $35,000 to $49,999 | 15 (8.3%) | 42 (25.8%) |
| $50,000 to $74,999 | 16 (8.9%) | 28 (17.2%) |
| $75,000 to $99,999 | 45 (25.0%) | 26 (16.0%) |
| $100,000 to $149,999 | 18 (10.0%) | 21 (12.9%) |
| $150,000 or more | 60 (33.3%) | 18 (11.0%) |
| Total | 180 (100.0%) | 163 (100.0%) |
Monthly Housing Cost Tiers in Hillburn
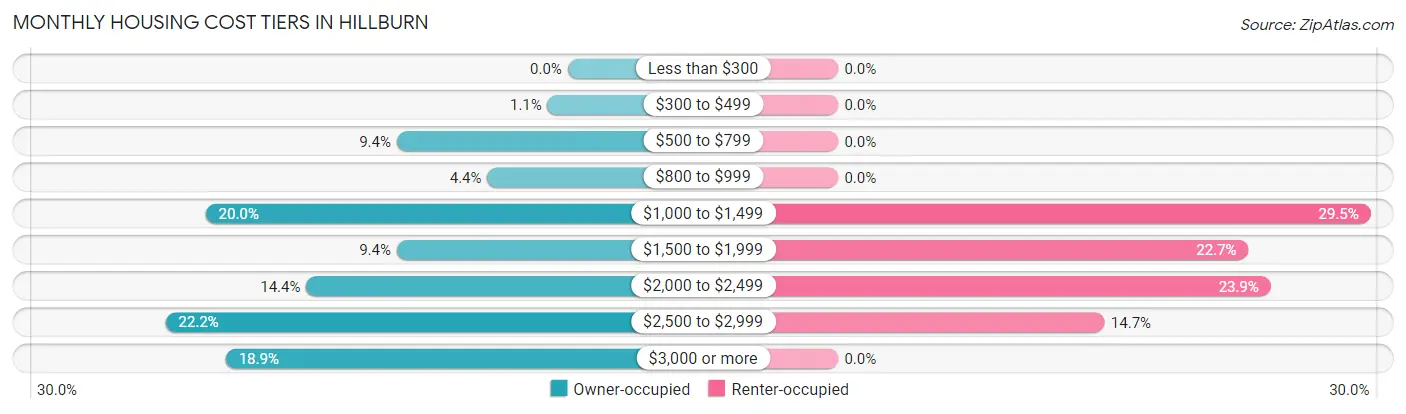
| Monthly Cost | Owner-occupied | Renter-occupied |
| Less than $300 | 0 (0.0%) | 0 (0.0%) |
| $300 to $499 | 2 (1.1%) | 0 (0.0%) |
| $500 to $799 | 17 (9.4%) | 0 (0.0%) |
| $800 to $999 | 8 (4.4%) | 0 (0.0%) |
| $1,000 to $1,499 | 36 (20.0%) | 48 (29.4%) |
| $1,500 to $1,999 | 17 (9.4%) | 37 (22.7%) |
| $2,000 to $2,499 | 26 (14.4%) | 39 (23.9%) |
| $2,500 to $2,999 | 40 (22.2%) | 24 (14.7%) |
| $3,000 or more | 34 (18.9%) | 0 (0.0%) |
| Total | 180 (100.0%) | 163 (100.0%) |
Physical Housing Characteristics in Hillburn
Housing Structures in Hillburn
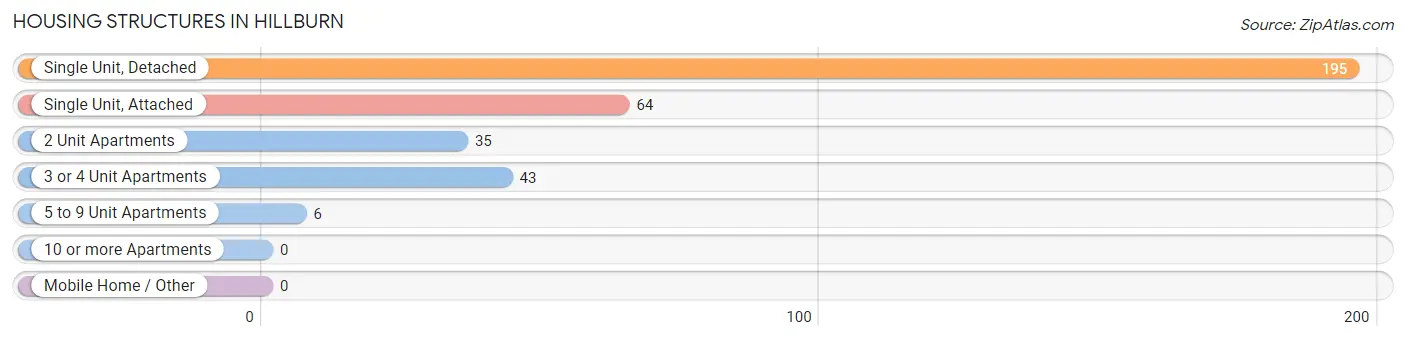
| Structure Type | # Housing Units | % Housing Units |
| Single Unit, Detached | 195 | 56.9% |
| Single Unit, Attached | 64 | 18.7% |
| 2 Unit Apartments | 35 | 10.2% |
| 3 or 4 Unit Apartments | 43 | 12.5% |
| 5 to 9 Unit Apartments | 6 | 1.8% |
| 10 or more Apartments | 0 | 0.0% |
| Mobile Home / Other | 0 | 0.0% |
| Total | 343 | 100.0% |
Housing Structures by Occupancy in Hillburn
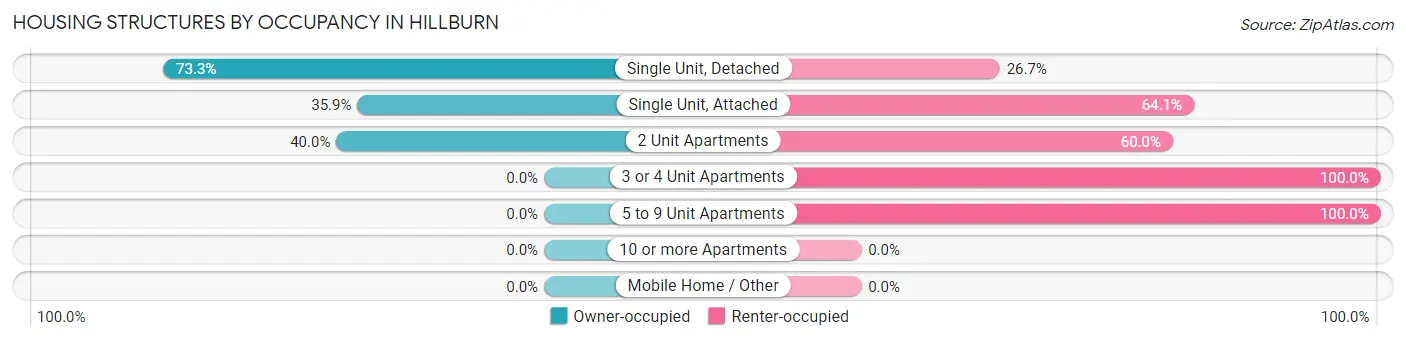
| Structure Type | Owner-occupied | Renter-occupied |
| Single Unit, Detached | 143 (73.3%) | 52 (26.7%) |
| Single Unit, Attached | 23 (35.9%) | 41 (64.1%) |
| 2 Unit Apartments | 14 (40.0%) | 21 (60.0%) |
| 3 or 4 Unit Apartments | 0 (0.0%) | 43 (100.0%) |
| 5 to 9 Unit Apartments | 0 (0.0%) | 6 (100.0%) |
| 10 or more Apartments | 0 (0.0%) | 0 (0.0%) |
| Mobile Home / Other | 0 (0.0%) | 0 (0.0%) |
| Total | 180 (52.5%) | 163 (47.5%) |
Housing Structures by Number of Rooms in Hillburn
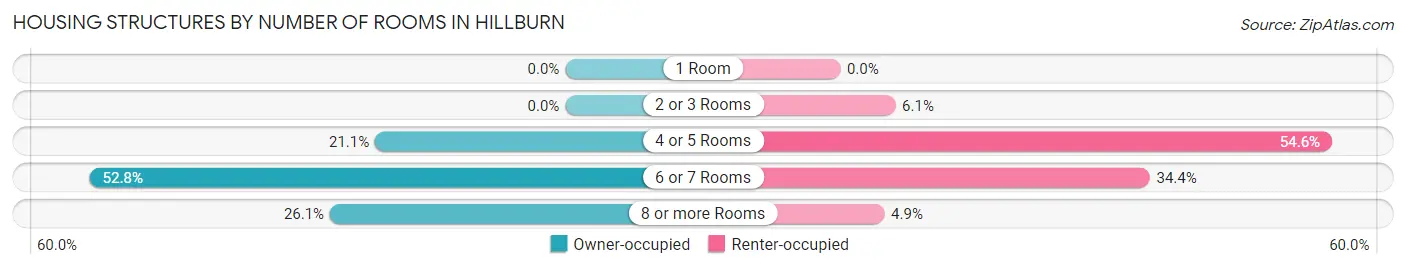
| Number of Rooms | Owner-occupied | Renter-occupied |
| 1 Room | 0 (0.0%) | 0 (0.0%) |
| 2 or 3 Rooms | 0 (0.0%) | 10 (6.1%) |
| 4 or 5 Rooms | 38 (21.1%) | 89 (54.6%) |
| 6 or 7 Rooms | 95 (52.8%) | 56 (34.4%) |
| 8 or more Rooms | 47 (26.1%) | 8 (4.9%) |
| Total | 180 (100.0%) | 163 (100.0%) |
Housing Structure by Heating Type in Hillburn
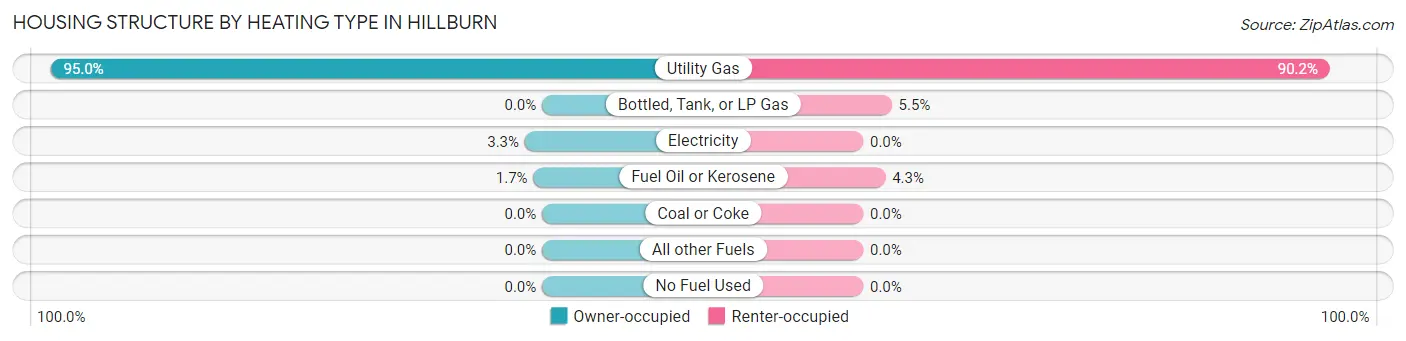
| Heating Type | Owner-occupied | Renter-occupied |
| Utility Gas | 171 (95.0%) | 147 (90.2%) |
| Bottled, Tank, or LP Gas | 0 (0.0%) | 9 (5.5%) |
| Electricity | 6 (3.3%) | 0 (0.0%) |
| Fuel Oil or Kerosene | 3 (1.7%) | 7 (4.3%) |
| Coal or Coke | 0 (0.0%) | 0 (0.0%) |
| All other Fuels | 0 (0.0%) | 0 (0.0%) |
| No Fuel Used | 0 (0.0%) | 0 (0.0%) |
| Total | 180 (100.0%) | 163 (100.0%) |
Household Vehicle Usage in Hillburn
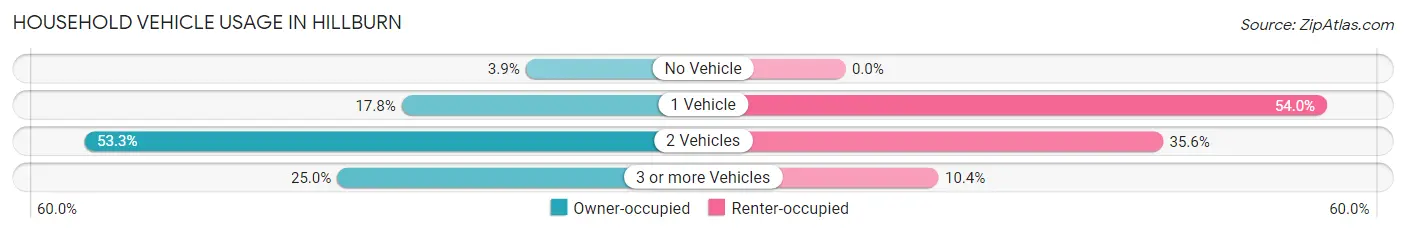
| Vehicles per Household | Owner-occupied | Renter-occupied |
| No Vehicle | 7 (3.9%) | 0 (0.0%) |
| 1 Vehicle | 32 (17.8%) | 88 (54.0%) |
| 2 Vehicles | 96 (53.3%) | 58 (35.6%) |
| 3 or more Vehicles | 45 (25.0%) | 17 (10.4%) |
| Total | 180 (100.0%) | 163 (100.0%) |
Real Estate & Mortgages in Hillburn
Real Estate and Mortgage Overview in Hillburn
| Characteristic | Without Mortgage | With Mortgage |
| Housing Units | 85 | 95 |
| Median Property Value | $404,700 | $483,300 |
| Median Household Income | $51,250 | $49 |
| Monthly Housing Costs | $1,279 | $34 |
| Real Estate Taxes | $8,977 | $0 |
Property Value by Mortgage Status in Hillburn
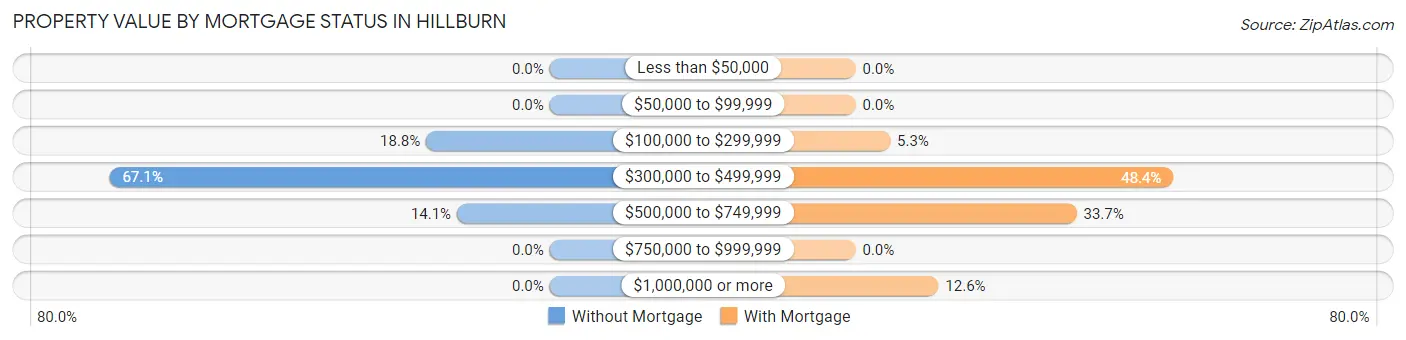
| Property Value | Without Mortgage | With Mortgage |
| Less than $50,000 | 0 (0.0%) | 0 (0.0%) |
| $50,000 to $99,999 | 0 (0.0%) | 0 (0.0%) |
| $100,000 to $299,999 | 16 (18.8%) | 5 (5.3%) |
| $300,000 to $499,999 | 57 (67.1%) | 46 (48.4%) |
| $500,000 to $749,999 | 12 (14.1%) | 32 (33.7%) |
| $750,000 to $999,999 | 0 (0.0%) | 0 (0.0%) |
| $1,000,000 or more | 0 (0.0%) | 12 (12.6%) |
| Total | 85 (100.0%) | 95 (100.0%) |
Household Income by Mortgage Status in Hillburn
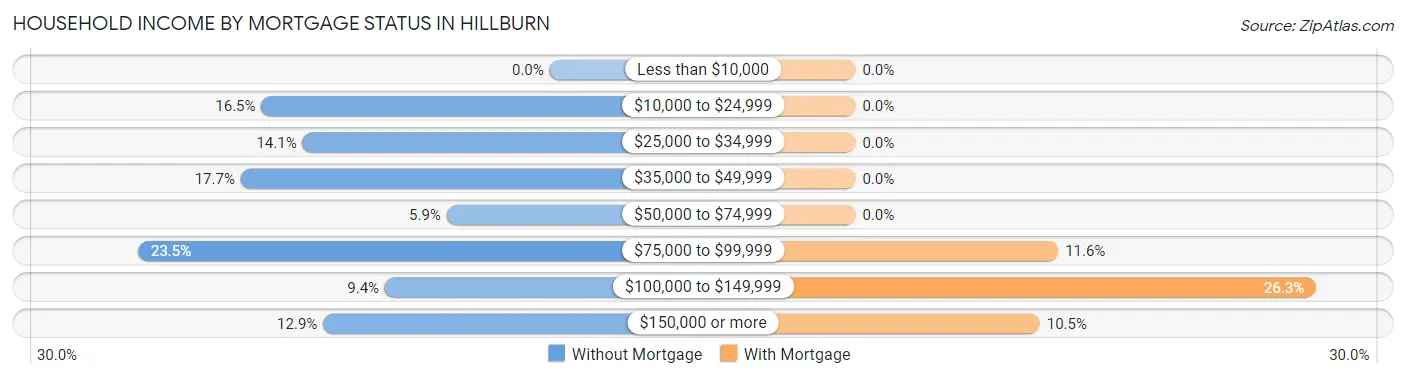
| Household Income | Without Mortgage | With Mortgage |
| Less than $10,000 | 0 (0.0%) | 0 (0.0%) |
| $10,000 to $24,999 | 14 (16.5%) | 0 (0.0%) |
| $25,000 to $34,999 | 12 (14.1%) | 0 (0.0%) |
| $35,000 to $49,999 | 15 (17.6%) | 0 (0.0%) |
| $50,000 to $74,999 | 5 (5.9%) | 0 (0.0%) |
| $75,000 to $99,999 | 20 (23.5%) | 11 (11.6%) |
| $100,000 to $149,999 | 8 (9.4%) | 25 (26.3%) |
| $150,000 or more | 11 (12.9%) | 10 (10.5%) |
| Total | 85 (100.0%) | 95 (100.0%) |
Property Value to Household Income Ratio in Hillburn
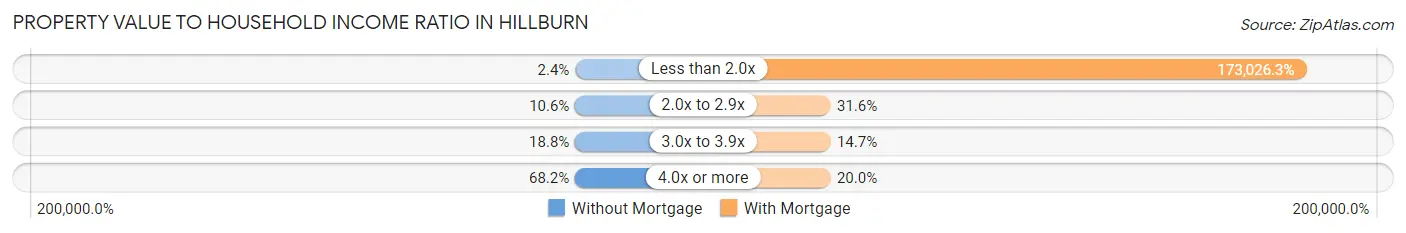
| Value-to-Income Ratio | Without Mortgage | With Mortgage |
| Less than 2.0x | 2 (2.4%) | 164,375 (173,026.3%) |
| 2.0x to 2.9x | 9 (10.6%) | 30 (31.6%) |
| 3.0x to 3.9x | 16 (18.8%) | 14 (14.7%) |
| 4.0x or more | 58 (68.2%) | 19 (20.0%) |
| Total | 85 (100.0%) | 95 (100.0%) |
Real Estate Taxes by Mortgage Status in Hillburn
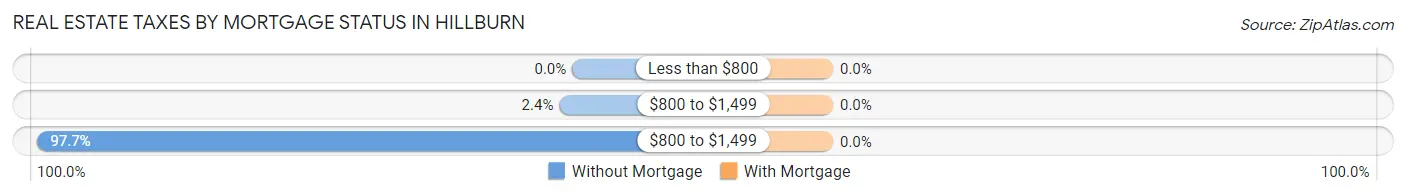
| Property Taxes | Without Mortgage | With Mortgage |
| Less than $800 | 0 (0.0%) | 0 (0.0%) |
| $800 to $1,499 | 2 (2.4%) | 0 (0.0%) |
| $800 to $1,499 | 83 (97.7%) | 0 (0.0%) |
| Total | 85 (100.0%) | 95 (100.0%) |
Health & Disability in Hillburn
Health Insurance Coverage by Age in Hillburn
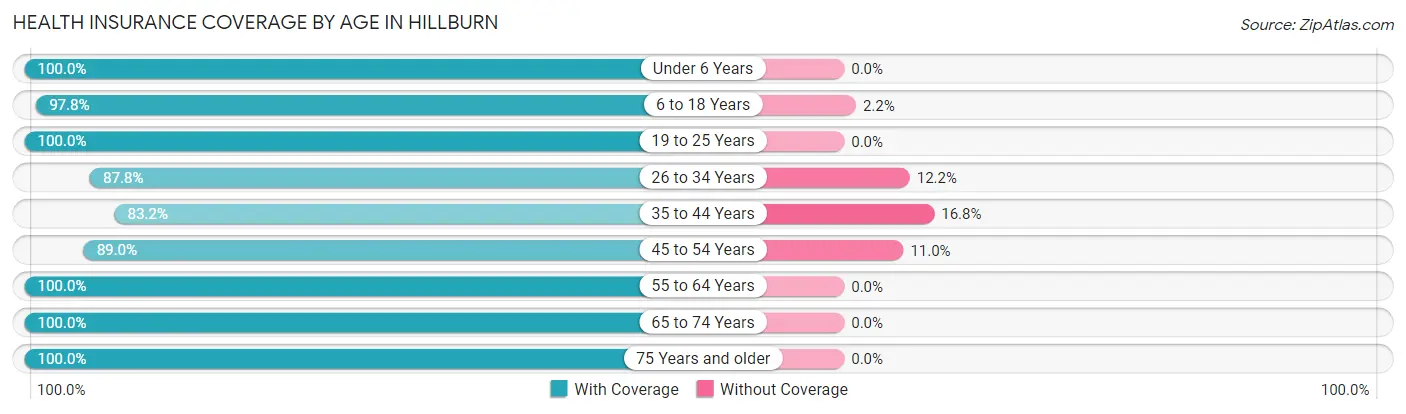
| Age Bracket | With Coverage | Without Coverage |
| Under 6 Years | 166 (100.0%) | 0 (0.0%) |
| 6 to 18 Years | 224 (97.8%) | 5 (2.2%) |
| 19 to 25 Years | 73 (100.0%) | 0 (0.0%) |
| 26 to 34 Years | 115 (87.8%) | 16 (12.2%) |
| 35 to 44 Years | 124 (83.2%) | 25 (16.8%) |
| 45 to 54 Years | 121 (89.0%) | 15 (11.0%) |
| 55 to 64 Years | 87 (100.0%) | 0 (0.0%) |
| 65 to 74 Years | 84 (100.0%) | 0 (0.0%) |
| 75 Years and older | 76 (100.0%) | 0 (0.0%) |
| Total | 1,070 (94.6%) | 61 (5.4%) |
Health Insurance Coverage by Citizenship Status in Hillburn
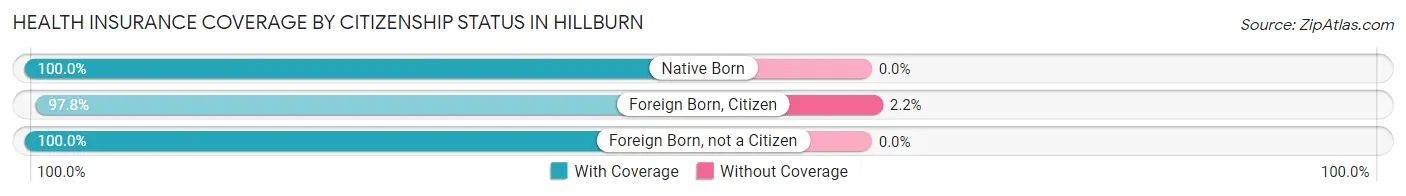
| Citizenship Status | With Coverage | Without Coverage |
| Native Born | 166 (100.0%) | 0 (0.0%) |
| Foreign Born, Citizen | 224 (97.8%) | 5 (2.2%) |
| Foreign Born, not a Citizen | 73 (100.0%) | 0 (0.0%) |
Health Insurance Coverage by Household Income in Hillburn
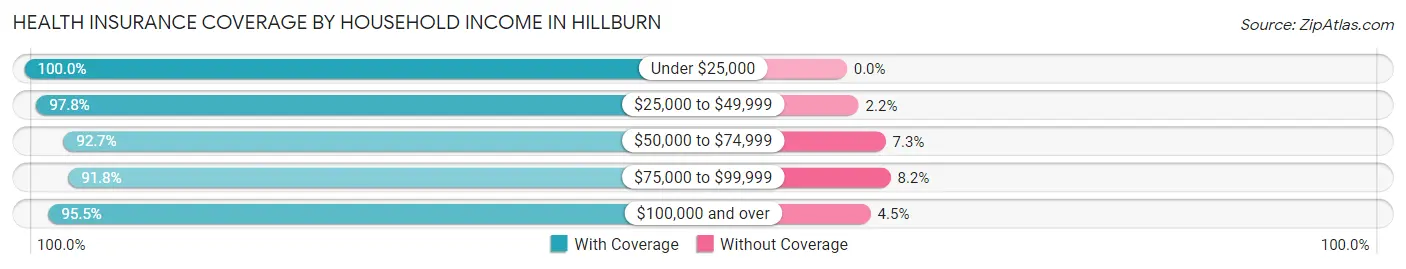
| Household Income | With Coverage | Without Coverage |
| Under $25,000 | 45 (100.0%) | 0 (0.0%) |
| $25,000 to $49,999 | 220 (97.8%) | 5 (2.2%) |
| $50,000 to $74,999 | 102 (92.7%) | 8 (7.3%) |
| $75,000 to $99,999 | 291 (91.8%) | 26 (8.2%) |
| $100,000 and over | 406 (95.5%) | 19 (4.5%) |
Public vs Private Health Insurance Coverage by Age in Hillburn
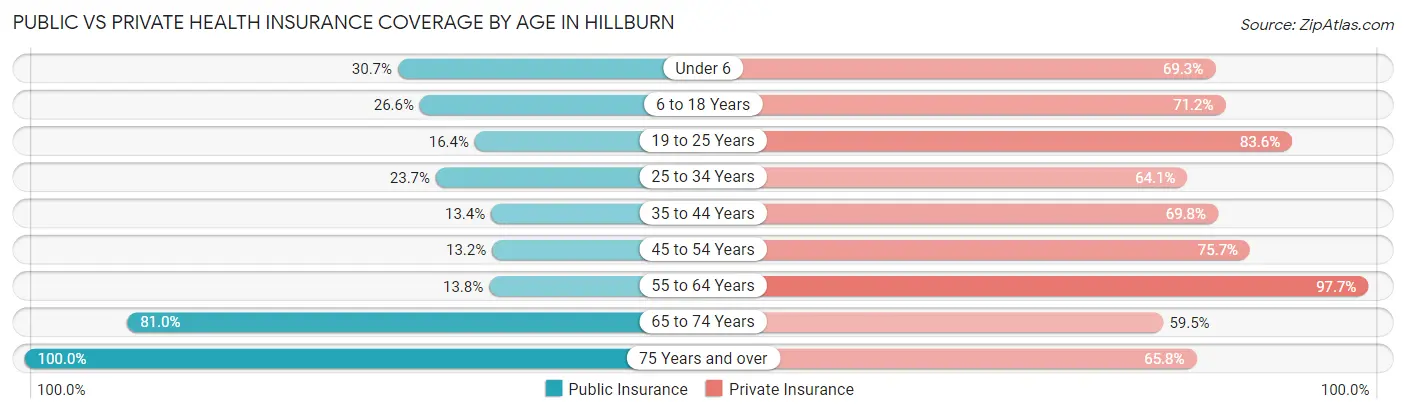
| Age Bracket | Public Insurance | Private Insurance |
| Under 6 | 51 (30.7%) | 115 (69.3%) |
| 6 to 18 Years | 61 (26.6%) | 163 (71.2%) |
| 19 to 25 Years | 12 (16.4%) | 61 (83.6%) |
| 25 to 34 Years | 31 (23.7%) | 84 (64.1%) |
| 35 to 44 Years | 20 (13.4%) | 104 (69.8%) |
| 45 to 54 Years | 18 (13.2%) | 103 (75.7%) |
| 55 to 64 Years | 12 (13.8%) | 85 (97.7%) |
| 65 to 74 Years | 68 (80.9%) | 50 (59.5%) |
| 75 Years and over | 76 (100.0%) | 50 (65.8%) |
| Total | 349 (30.9%) | 815 (72.1%) |
Disability Status by Sex by Age in Hillburn
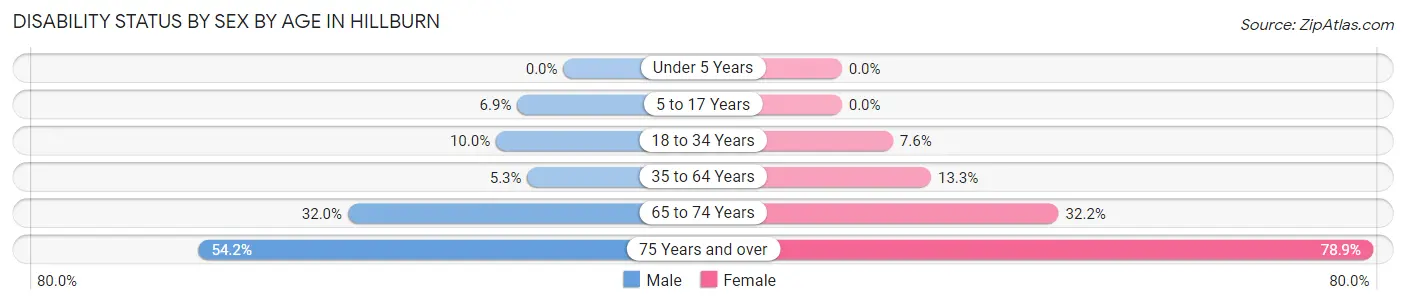
| Age Bracket | Male | Female |
| Under 5 Years | 0 (0.0%) | 0 (0.0%) |
| 5 to 17 Years | 5 (6.9%) | 0 (0.0%) |
| 18 to 34 Years | 15 (10.0%) | 6 (7.6%) |
| 35 to 64 Years | 11 (5.3%) | 22 (13.3%) |
| 65 to 74 Years | 8 (32.0%) | 19 (32.2%) |
| 75 Years and over | 13 (54.2%) | 41 (78.8%) |
Disability Class by Sex by Age in Hillburn
Disability Class: Hearing Difficulty
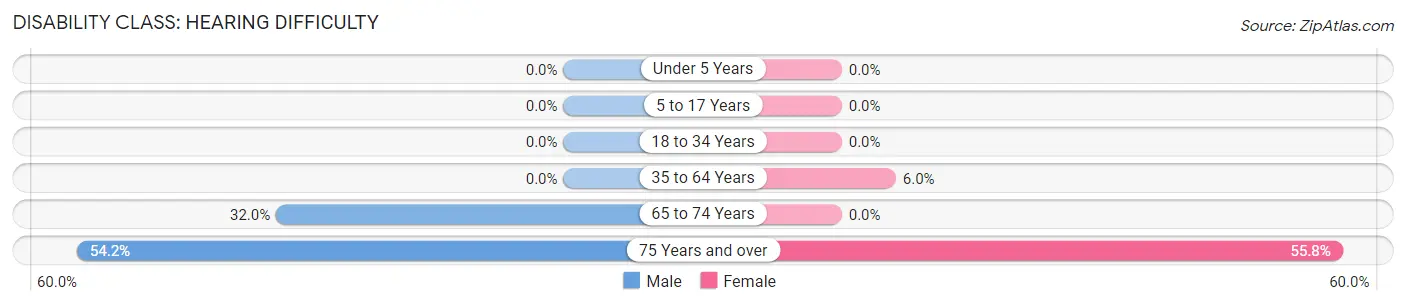
| Age Bracket | Male | Female |
| Under 5 Years | 0 (0.0%) | 0 (0.0%) |
| 5 to 17 Years | 0 (0.0%) | 0 (0.0%) |
| 18 to 34 Years | 0 (0.0%) | 0 (0.0%) |
| 35 to 64 Years | 0 (0.0%) | 10 (6.0%) |
| 65 to 74 Years | 8 (32.0%) | 0 (0.0%) |
| 75 Years and over | 13 (54.2%) | 29 (55.8%) |
Disability Class: Vision Difficulty
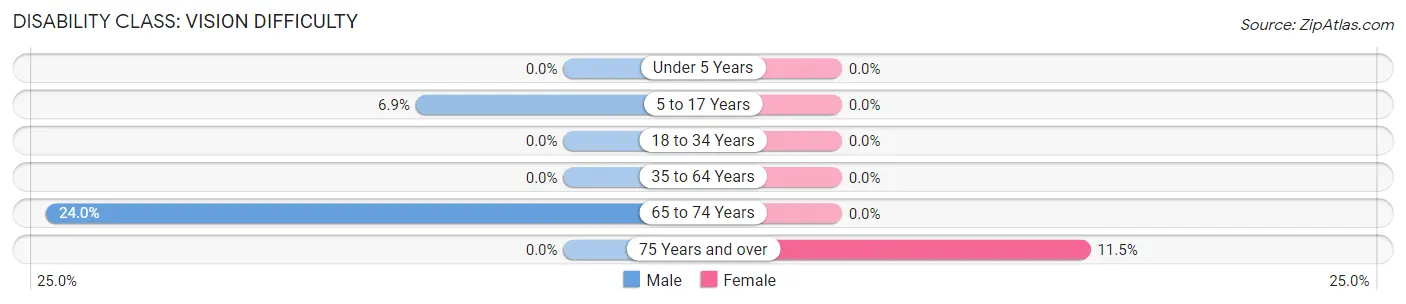
| Age Bracket | Male | Female |
| Under 5 Years | 0 (0.0%) | 0 (0.0%) |
| 5 to 17 Years | 5 (6.9%) | 0 (0.0%) |
| 18 to 34 Years | 0 (0.0%) | 0 (0.0%) |
| 35 to 64 Years | 0 (0.0%) | 0 (0.0%) |
| 65 to 74 Years | 6 (24.0%) | 0 (0.0%) |
| 75 Years and over | 0 (0.0%) | 6 (11.5%) |
Disability Class: Cognitive Difficulty
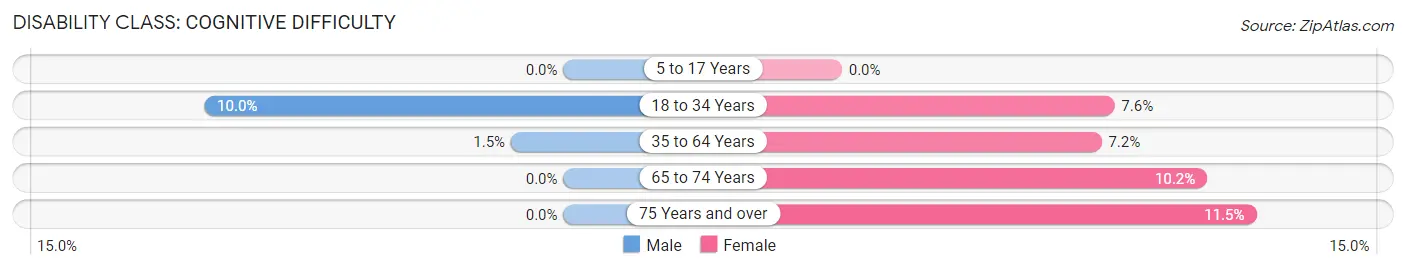
| Age Bracket | Male | Female |
| 5 to 17 Years | 0 (0.0%) | 0 (0.0%) |
| 18 to 34 Years | 15 (10.0%) | 6 (7.6%) |
| 35 to 64 Years | 3 (1.5%) | 12 (7.2%) |
| 65 to 74 Years | 0 (0.0%) | 6 (10.2%) |
| 75 Years and over | 0 (0.0%) | 6 (11.5%) |
Disability Class: Ambulatory Difficulty
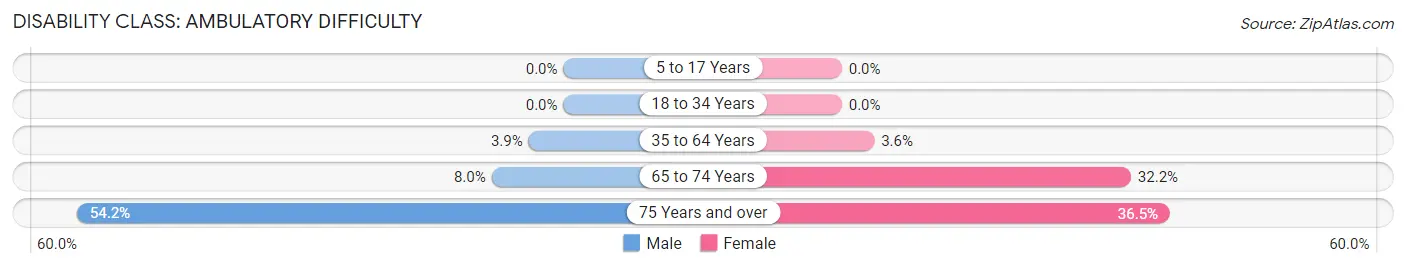
| Age Bracket | Male | Female |
| 5 to 17 Years | 0 (0.0%) | 0 (0.0%) |
| 18 to 34 Years | 0 (0.0%) | 0 (0.0%) |
| 35 to 64 Years | 8 (3.9%) | 6 (3.6%) |
| 65 to 74 Years | 2 (8.0%) | 19 (32.2%) |
| 75 Years and over | 13 (54.2%) | 19 (36.5%) |
Disability Class: Self-Care Difficulty
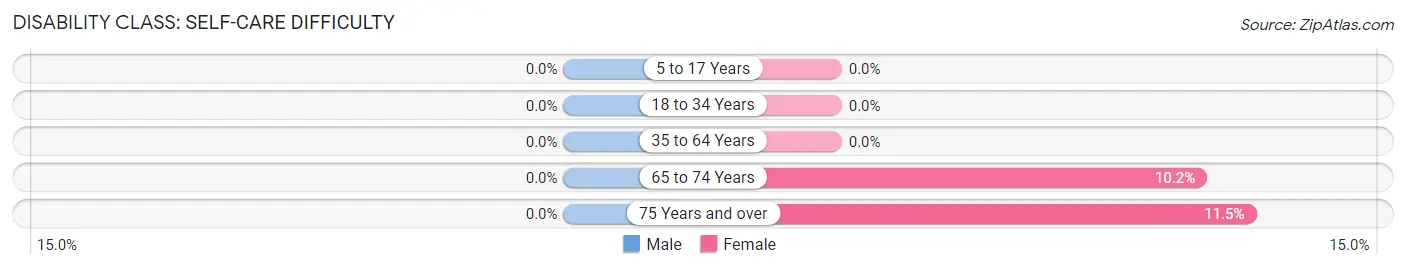
| Age Bracket | Male | Female |
| 5 to 17 Years | 0 (0.0%) | 0 (0.0%) |
| 18 to 34 Years | 0 (0.0%) | 0 (0.0%) |
| 35 to 64 Years | 0 (0.0%) | 0 (0.0%) |
| 65 to 74 Years | 0 (0.0%) | 6 (10.2%) |
| 75 Years and over | 0 (0.0%) | 6 (11.5%) |
Technology Access in Hillburn
Computing Device Access in Hillburn
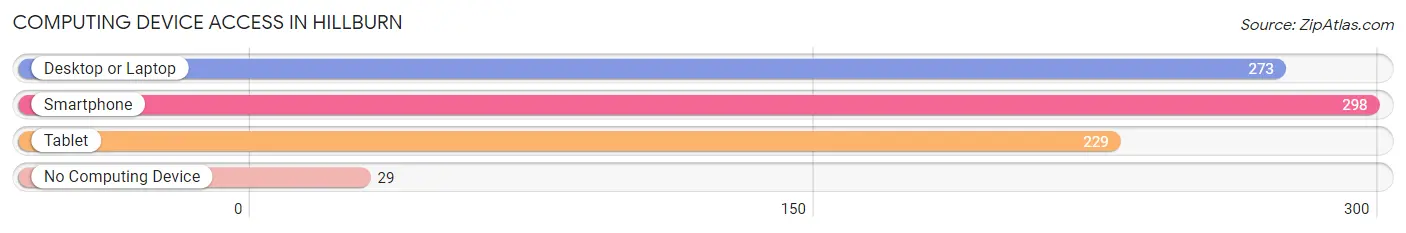
| Device Type | # Households | % Households |
| Desktop or Laptop | 273 | 79.6% |
| Smartphone | 298 | 86.9% |
| Tablet | 229 | 66.8% |
| No Computing Device | 29 | 8.5% |
| Total | 343 | 100.0% |
Internet Access in Hillburn
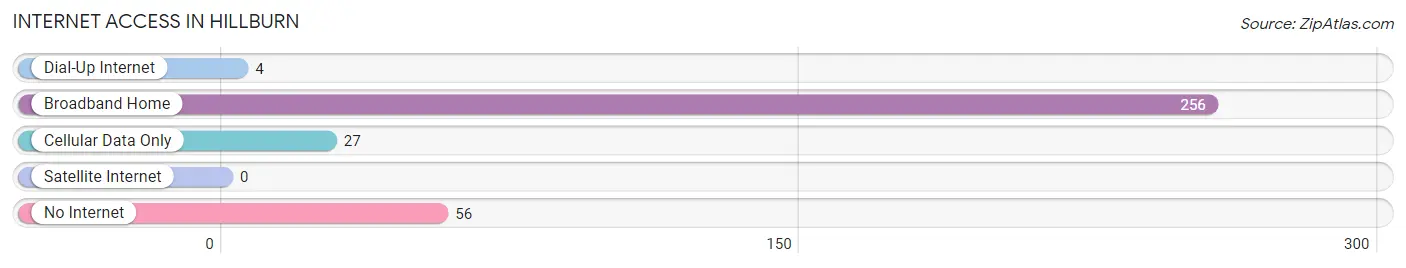
| Internet Type | # Households | % Households |
| Dial-Up Internet | 4 | 1.2% |
| Broadband Home | 256 | 74.6% |
| Cellular Data Only | 27 | 7.9% |
| Satellite Internet | 0 | 0.0% |
| No Internet | 56 | 16.3% |
| Total | 343 | 100.0% |
Hillburn Summary
Hillburn, NY is a small village located in the town of Ramapo in Rockland County, New York. It is situated in the foothills of the Ramapo Mountains, approximately 25 miles northwest of New York City. The village has a population of 1,717 as of the 2010 census.
History
The area that is now Hillburn was originally inhabited by the Munsee Indians, a branch of the Lenape tribe. The first European settlers arrived in the area in the late 1700s. The village was originally known as “Ramapo Corners” and was part of the town of Ramapo. In 1853, the village was renamed “Hillburn” after the Hillburn family, who were among the first settlers in the area.
In the late 1800s, the village was a popular summer resort destination for wealthy New Yorkers. The village was home to several grand hotels, including the Hillburn House, which was built in 1875 and was the largest hotel in the area. The village also had a large amusement park, which was a popular destination for visitors.
In the early 1900s, the village began to decline as a resort destination. The amusement park closed in the 1920s and the hotels were eventually demolished. The village began to transition to a residential community and by the 1950s, the population had grown to over 1,000.
Geography
Hillburn is located in the foothills of the Ramapo Mountains, approximately 25 miles northwest of New York City. The village is situated on the western edge of Rockland County, near the border with Orange County. The village is bordered by the towns of Ramapo, Haverstraw, and Stony Point.
The village is located on the Ramapo River, which flows through the village and is a popular destination for fishing and boating. The village is also home to several parks, including Hillburn Park, which features a playground, picnic area, and walking trails.
Economy
The economy of Hillburn is largely based on tourism and retail. The village is home to several small businesses, including restaurants, shops, and galleries. The village is also home to several small manufacturing companies, including a furniture manufacturer and a printing company.
The village is also home to several large employers, including a hospital, a nursing home, and a school district. The village is also home to several large retail stores, including a Walmart and a Target.
Demographics
As of the 2010 census, the population of Hillburn was 1,717. The population is largely white (90.2%) and the median household income is $68,958. The village is home to a large Hispanic population (7.3%) and a small African American population (1.2%).
The village is home to several religious institutions, including a Catholic church, a Methodist church, and a Jewish synagogue. The village is also home to several schools, including a public elementary school and a private high school.
Conclusion
Hillburn, NY is a small village located in the town of Ramapo in Rockland County, New York. The village has a population of 1,717 as of the 2010 census and is situated in the foothills of the Ramapo Mountains, approximately 25 miles northwest of New York City. The economy of Hillburn is largely based on tourism and retail and the population is largely white (90.2%) with a large Hispanic population (7.3%) and a small African American population (1.2%). The village is home to several religious institutions, schools, and businesses, making it a vibrant and diverse community.
Common Questions
What is Per Capita Income in Hillburn?
Per Capita income in Hillburn is $32,610.
What is the Median Family Income in Hillburn?
Median Family Income in Hillburn is $91,518.
What is the Median Household income in Hillburn?
Median Household Income in Hillburn is $79,688.
What is Income or Wage Gap in Hillburn?
Income or Wage Gap in Hillburn is 7.2%.
Women in Hillburn earn 92.8 cents for every dollar earned by a man.
What is Inequality or Gini Index in Hillburn?
Inequality or Gini Index in Hillburn is 0.41.
What is the Total Population of Hillburn?
Total Population of Hillburn is 1,131.
What is the Total Male Population of Hillburn?
Total Male Population of Hillburn is 505.
What is the Total Female Population of Hillburn?
Total Female Population of Hillburn is 626.
What is the Ratio of Males per 100 Females in Hillburn?
There are 80.67 Males per 100 Females in Hillburn.
What is the Ratio of Females per 100 Males in Hillburn?
There are 123.96 Females per 100 Males in Hillburn.
What is the Median Population Age in Hillburn?
Median Population Age in Hillburn is 32.6 Years.
What is the Average Family Size in Hillburn
Average Family Size in Hillburn is 3.9 People.
What is the Average Household Size in Hillburn
Average Household Size in Hillburn is 3.3 People.
How Large is the Labor Force in Hillburn?
There are 499 People in the Labor Forcein in Hillburn.
What is the Percentage of People in the Labor Force in Hillburn?
62.2% of People are in the Labor Force in Hillburn.
What is the Unemployment Rate in Hillburn?
Unemployment Rate in Hillburn is 8.8%.