Willow Springs, IL Map & Demographics
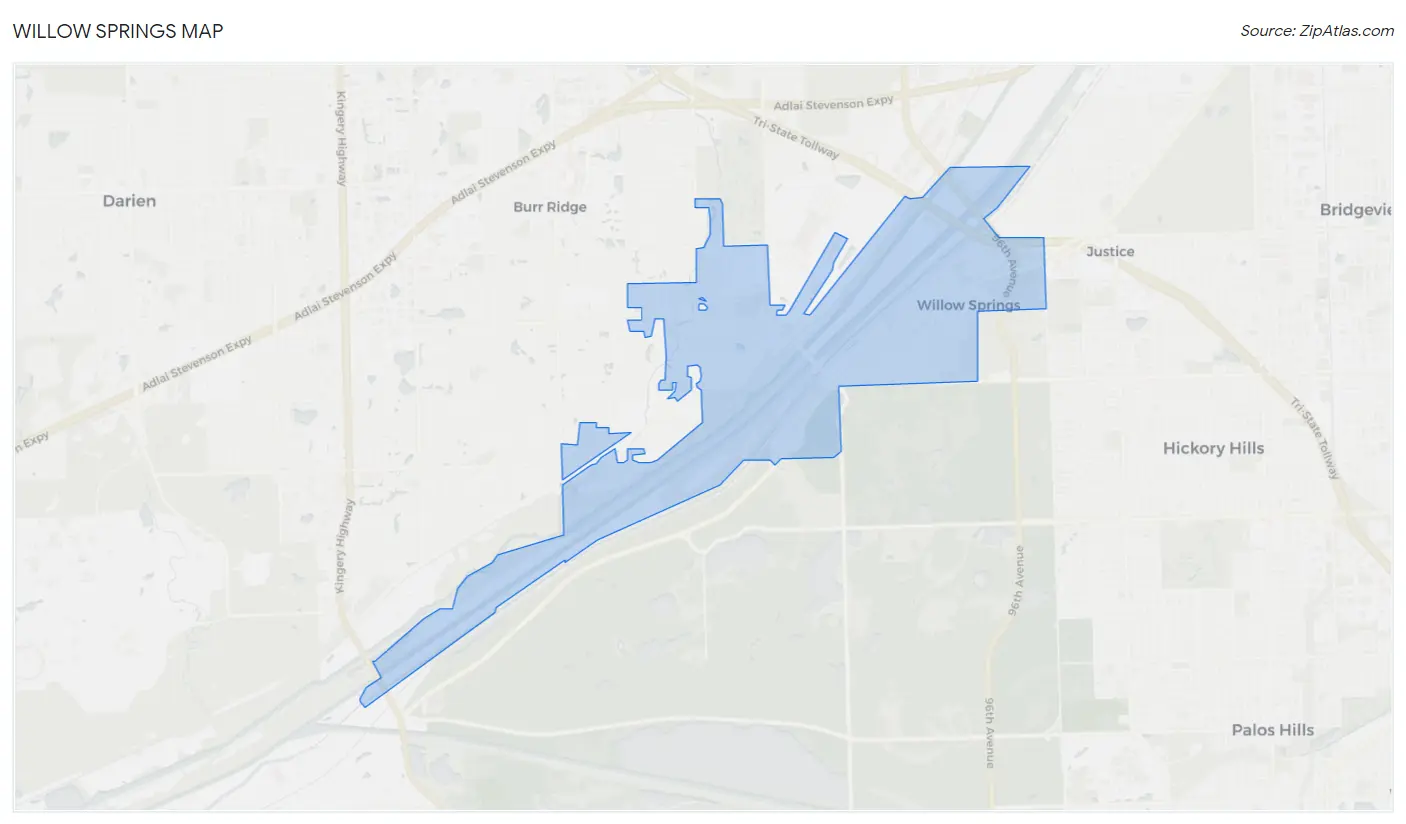
Willow Springs Map
Willow Springs Overview
$58,433
PER CAPITA INCOME
$109,758
AVG FAMILY INCOME
$100,775
AVG HOUSEHOLD INCOME
19.1%
WAGE / INCOME GAP [ % ]
80.9¢/ $1
WAGE / INCOME GAP [ $ ]
0.42
INEQUALITY / GINI INDEX
5,862
TOTAL POPULATION
2,958
MALE POPULATION
2,904
FEMALE POPULATION
101.86
MALES / 100 FEMALES
98.17
FEMALES / 100 MALES
45.7
MEDIAN AGE
2.9
AVG FAMILY SIZE
2.3
AVG HOUSEHOLD SIZE
3,233
LABOR FORCE [ PEOPLE ]
64.5%
PERCENT IN LABOR FORCE
4.7%
UNEMPLOYMENT RATE
Willow Springs Zip Codes
Willow Springs Area Codes
Income in Willow Springs
Income Overview in Willow Springs
Per Capita Income in Willow Springs is $58,433, while median incomes of families and households are $109,758 and $100,775 respectively.
| Characteristic | Number | Measure |
| Per Capita Income | 5,862 | $58,433 |
| Median Family Income | 1,626 | $109,758 |
| Mean Family Income | 1,626 | $146,591 |
| Median Household Income | 2,550 | $100,775 |
| Mean Household Income | 2,550 | $132,033 |
| Income Deficit | 1,626 | $0 |
| Wage / Income Gap (%) | 5,862 | 19.11% |
| Wage / Income Gap ($) | 5,862 | 80.89¢ per $1 |
| Gini / Inequality Index | 5,862 | 0.42 |
Earnings by Sex in Willow Springs
Average Earnings in Willow Springs are $58,464, $62,353 for men and $50,436 for women, a difference of 19.1%.
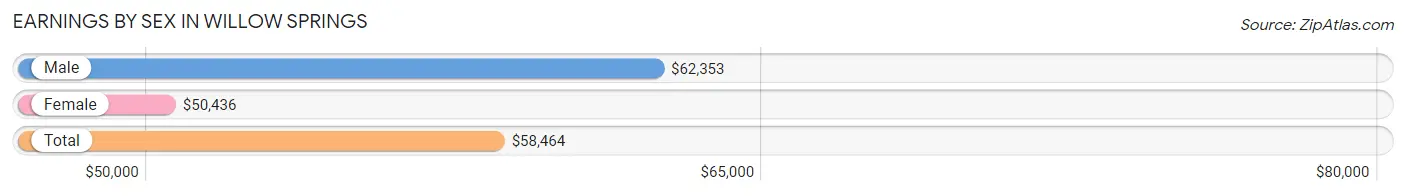
| Sex | Number | Average Earnings |
| Male | 1,660 (49.3%) | $62,353 |
| Female | 1,705 (50.7%) | $50,436 |
| Total | 3,365 (100.0%) | $58,464 |
Earnings by Sex by Income Bracket in Willow Springs
The most common earnings brackets in Willow Springs are $100,000+ for men (487 | 29.3%) and $100,000+ for women (388 | 22.8%).
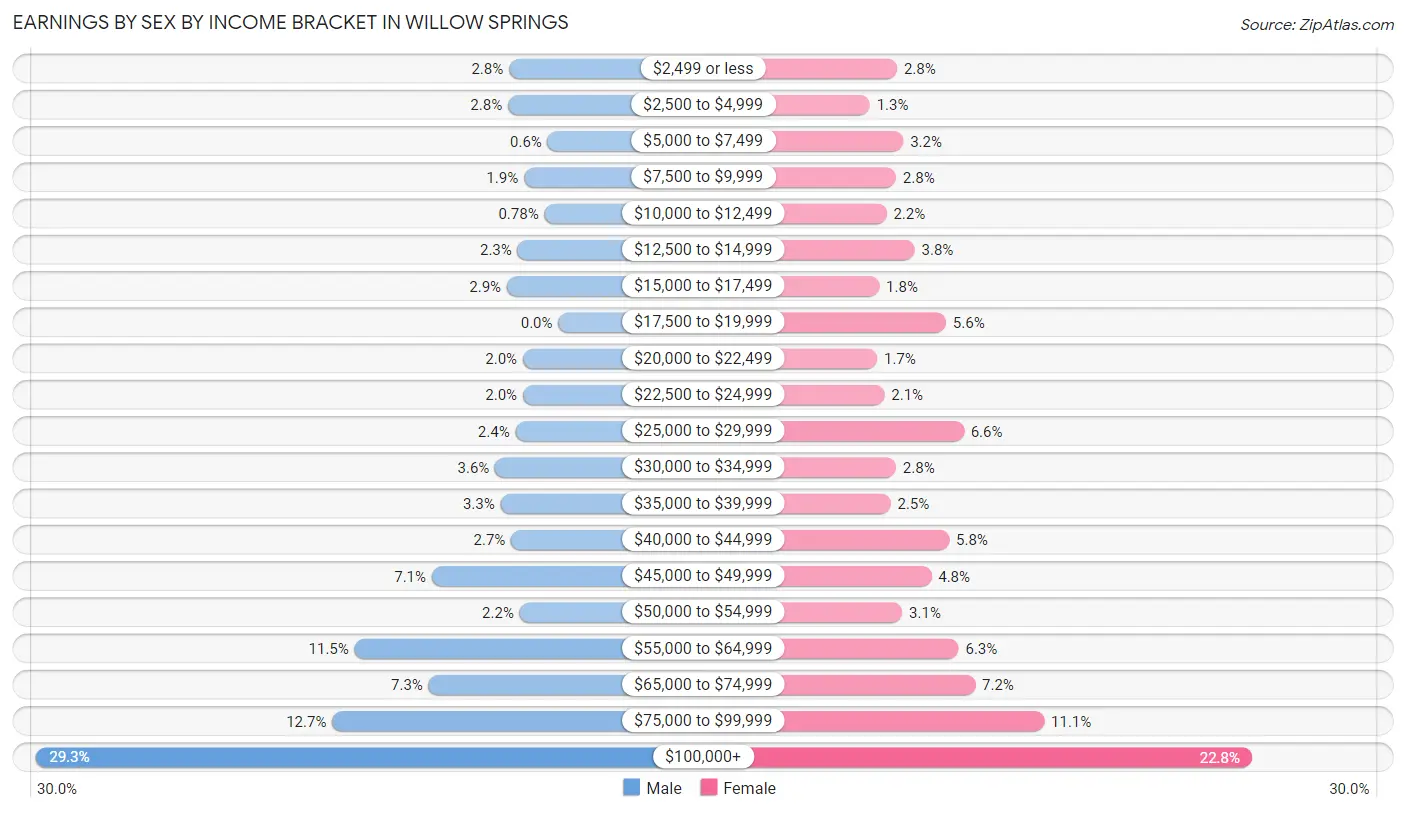
| Income | Male | Female |
| $2,499 or less | 46 (2.8%) | 48 (2.8%) |
| $2,500 to $4,999 | 47 (2.8%) | 22 (1.3%) |
| $5,000 to $7,499 | 10 (0.6%) | 54 (3.2%) |
| $7,500 to $9,999 | 32 (1.9%) | 47 (2.8%) |
| $10,000 to $12,499 | 13 (0.8%) | 38 (2.2%) |
| $12,500 to $14,999 | 38 (2.3%) | 65 (3.8%) |
| $15,000 to $17,499 | 48 (2.9%) | 31 (1.8%) |
| $17,500 to $19,999 | 0 (0.0%) | 95 (5.6%) |
| $20,000 to $22,499 | 33 (2.0%) | 29 (1.7%) |
| $22,500 to $24,999 | 33 (2.0%) | 36 (2.1%) |
| $25,000 to $29,999 | 40 (2.4%) | 112 (6.6%) |
| $30,000 to $34,999 | 59 (3.5%) | 47 (2.8%) |
| $35,000 to $39,999 | 54 (3.3%) | 42 (2.5%) |
| $40,000 to $44,999 | 44 (2.6%) | 98 (5.8%) |
| $45,000 to $49,999 | 118 (7.1%) | 81 (4.8%) |
| $50,000 to $54,999 | 36 (2.2%) | 53 (3.1%) |
| $55,000 to $64,999 | 190 (11.5%) | 107 (6.3%) |
| $65,000 to $74,999 | 121 (7.3%) | 123 (7.2%) |
| $75,000 to $99,999 | 211 (12.7%) | 189 (11.1%) |
| $100,000+ | 487 (29.3%) | 388 (22.8%) |
| Total | 1,660 (100.0%) | 1,705 (100.0%) |
Earnings by Sex by Educational Attainment in Willow Springs
Average earnings in Willow Springs are $71,051 for men and $56,429 for women, a difference of 20.6%. Men with an educational attainment of graduate degree enjoy the highest average annual earnings of $115,089, while those with less than high school education earn the least with $30,250. Women with an educational attainment of graduate degree earn the most with the average annual earnings of $93,531, while those with high school diploma education have the smallest earnings of $29,048.
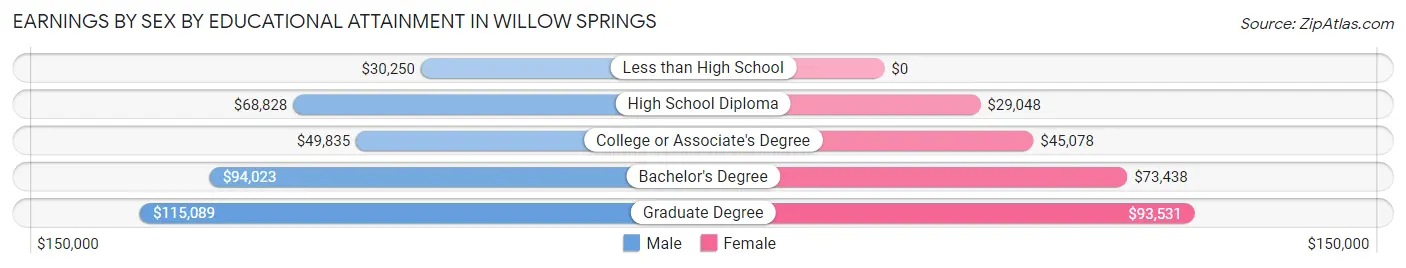
| Educational Attainment | Male Income | Female Income |
| Less than High School | $30,250 | $0 |
| High School Diploma | $68,828 | $29,048 |
| College or Associate's Degree | $49,835 | $45,078 |
| Bachelor's Degree | $94,023 | $73,438 |
| Graduate Degree | $115,089 | $93,531 |
| Total | $71,051 | $56,429 |
Family Income in Willow Springs
Family Income Brackets in Willow Springs
According to the Willow Springs family income data, there are 387 families falling into the $100,000 to $149,999 income range, which is the most common income bracket and makes up 23.8% of all families. Conversely, the less than $10,000 income bracket is the least frequent group with only 10 families (0.6%) belonging to this category.
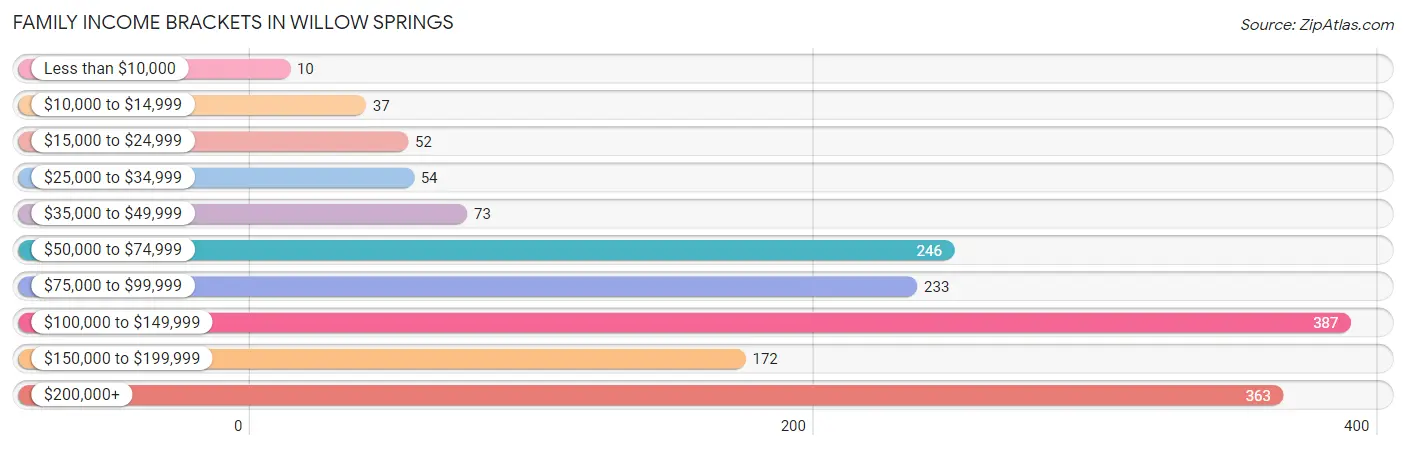
| Income Bracket | # Families | % Families |
| Less than $10,000 | 10 | 0.6% |
| $10,000 to $14,999 | 37 | 2.3% |
| $15,000 to $24,999 | 52 | 3.2% |
| $25,000 to $34,999 | 54 | 3.3% |
| $35,000 to $49,999 | 73 | 4.5% |
| $50,000 to $74,999 | 246 | 15.1% |
| $75,000 to $99,999 | 233 | 14.3% |
| $100,000 to $149,999 | 387 | 23.8% |
| $150,000 to $199,999 | 172 | 10.6% |
| $200,000+ | 363 | 22.3% |
Family Income by Famaliy Size in Willow Springs
5-person families (93 | 5.7%) account for the highest median family income in Willow Springs with $250,001 per family, while 3-person families (229 | 14.1%) have the highest median income of $50,365 per family member.
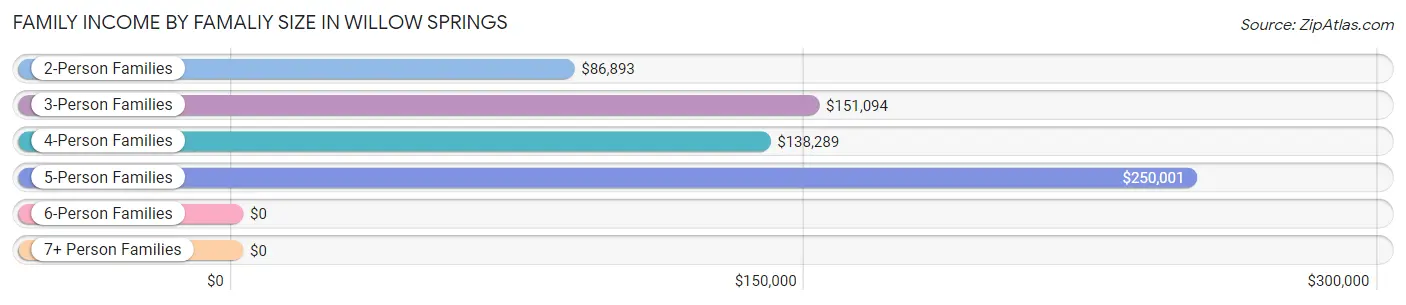
| Income Bracket | # Families | Median Income |
| 2-Person Families | 977 (60.1%) | $86,893 |
| 3-Person Families | 229 (14.1%) | $151,094 |
| 4-Person Families | 286 (17.6%) | $138,289 |
| 5-Person Families | 93 (5.7%) | $250,001 |
| 6-Person Families | 0 (0.0%) | $0 |
| 7+ Person Families | 41 (2.5%) | $0 |
| Total | 1,626 (100.0%) | $109,758 |
Family Income by Number of Earners in Willow Springs
The median family income in Willow Springs is $109,758, with families comprising 3+ earners (178) having the highest median family income of $161,121, while families with no earners (266) have the lowest median family income of $54,231, accounting for 11.0% and 16.4% of families, respectively.
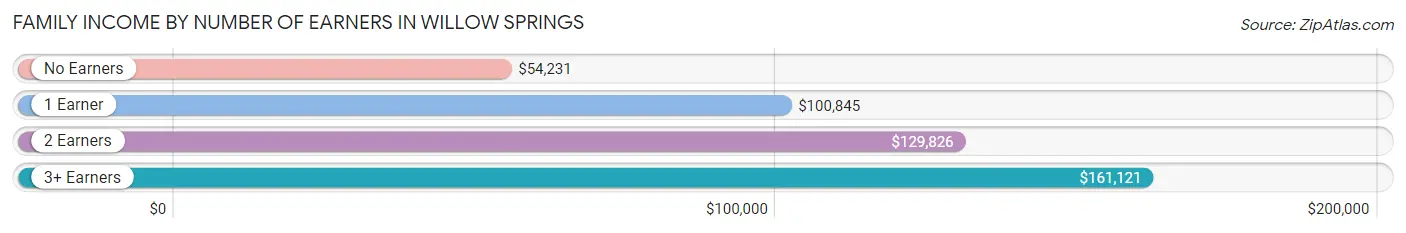
| Number of Earners | # Families | Median Income |
| No Earners | 266 (16.4%) | $54,231 |
| 1 Earner | 439 (27.0%) | $100,845 |
| 2 Earners | 743 (45.7%) | $129,826 |
| 3+ Earners | 178 (11.0%) | $161,121 |
| Total | 1,626 (100.0%) | $109,758 |
Household Income in Willow Springs
Household Income Brackets in Willow Springs
With 592 households falling in the category, the $100,000 to $149,999 income range is the most frequent in Willow Springs, accounting for 23.2% of all households. In contrast, only 18 households (0.7%) fall into the less than $10,000 income bracket, making it the least populous group.
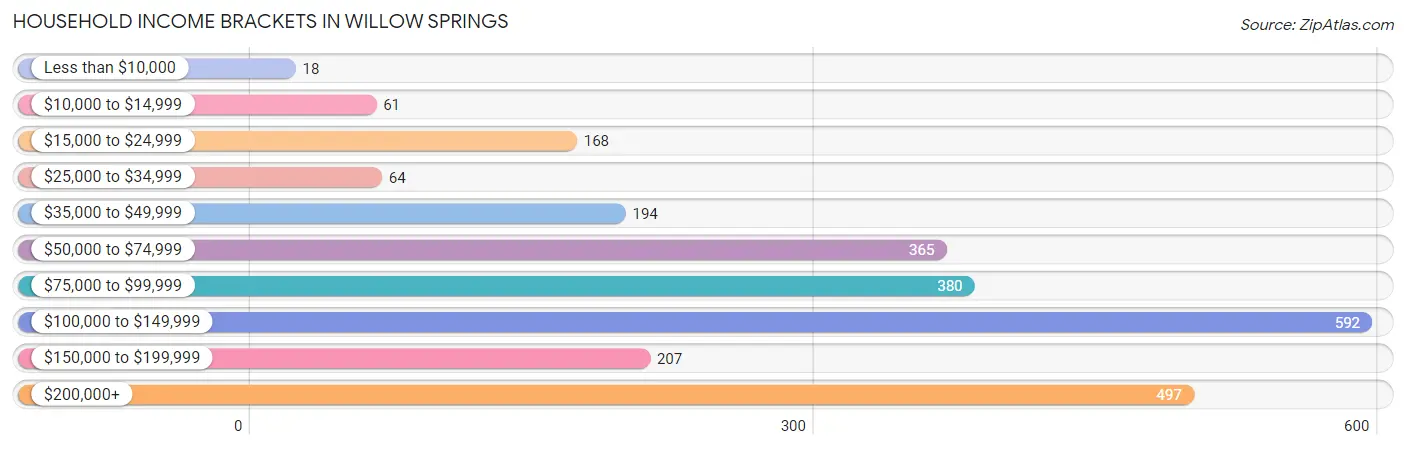
| Income Bracket | # Households | % Households |
| Less than $10,000 | 18 | 0.7% |
| $10,000 to $14,999 | 61 | 2.4% |
| $15,000 to $24,999 | 168 | 6.6% |
| $25,000 to $34,999 | 64 | 2.5% |
| $35,000 to $49,999 | 194 | 7.6% |
| $50,000 to $74,999 | 365 | 14.3% |
| $75,000 to $99,999 | 380 | 14.9% |
| $100,000 to $149,999 | 592 | 23.2% |
| $150,000 to $199,999 | 207 | 8.1% |
| $200,000+ | 497 | 19.5% |
Household Income by Householder Age in Willow Springs
The median household income in Willow Springs is $100,775, with the highest median household income of $116,000 found in the 25 to 44 years age bracket for the primary householder. A total of 720 households (28.2%) fall into this category. Meanwhile, the 15 to 24 years age bracket for the primary householder has the lowest median household income of $0, with 36 households (1.4%) in this group.
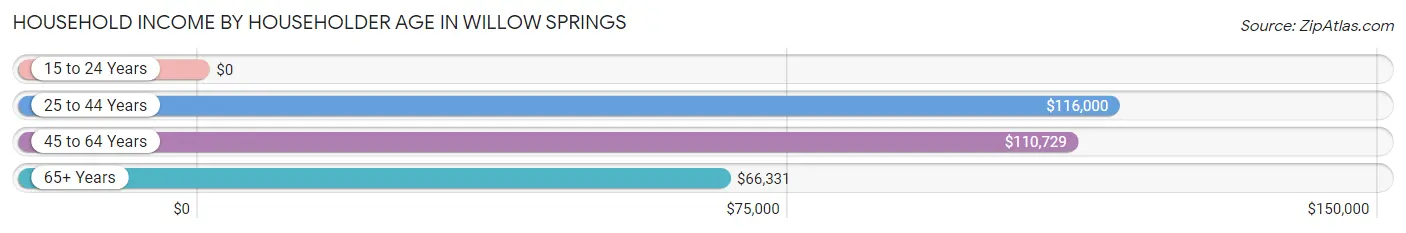
| Income Bracket | # Households | Median Income |
| 15 to 24 Years | 36 (1.4%) | $0 |
| 25 to 44 Years | 720 (28.2%) | $116,000 |
| 45 to 64 Years | 1,083 (42.5%) | $110,729 |
| 65+ Years | 711 (27.9%) | $66,331 |
| Total | 2,550 (100.0%) | $100,775 |
Poverty in Willow Springs
Income Below Poverty by Sex and Age in Willow Springs
With 1.8% poverty level for males and 5.8% for females among the residents of Willow Springs, 75 year old and over males and 12 to 14 year old females are the most vulnerable to poverty, with 10 males (4.1%) and 29 females (20.0%) in their respective age groups living below the poverty level.
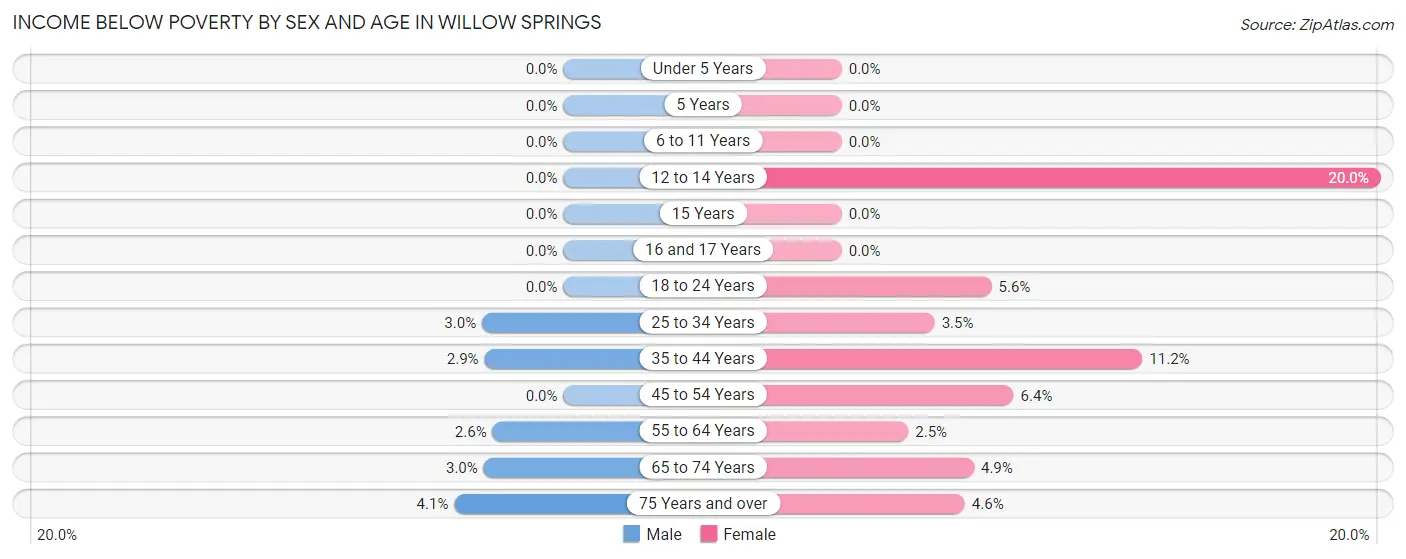
| Age Bracket | Male | Female |
| Under 5 Years | 0 (0.0%) | 0 (0.0%) |
| 5 Years | 0 (0.0%) | 0 (0.0%) |
| 6 to 11 Years | 0 (0.0%) | 0 (0.0%) |
| 12 to 14 Years | 0 (0.0%) | 29 (20.0%) |
| 15 Years | 0 (0.0%) | 0 (0.0%) |
| 16 and 17 Years | 0 (0.0%) | 0 (0.0%) |
| 18 to 24 Years | 0 (0.0%) | 9 (5.6%) |
| 25 to 34 Years | 9 (3.0%) | 9 (3.5%) |
| 35 to 44 Years | 12 (2.9%) | 50 (11.2%) |
| 45 to 54 Years | 0 (0.0%) | 30 (6.4%) |
| 55 to 64 Years | 13 (2.6%) | 11 (2.5%) |
| 65 to 74 Years | 10 (3.0%) | 21 (4.9%) |
| 75 Years and over | 10 (4.1%) | 10 (4.6%) |
| Total | 54 (1.8%) | 169 (5.8%) |
Income Above Poverty by Sex and Age in Willow Springs
According to the poverty statistics in Willow Springs, males aged under 5 years and females aged under 5 years are the age groups that are most secure financially, with 100.0% of males and 100.0% of females in these age groups living above the poverty line.
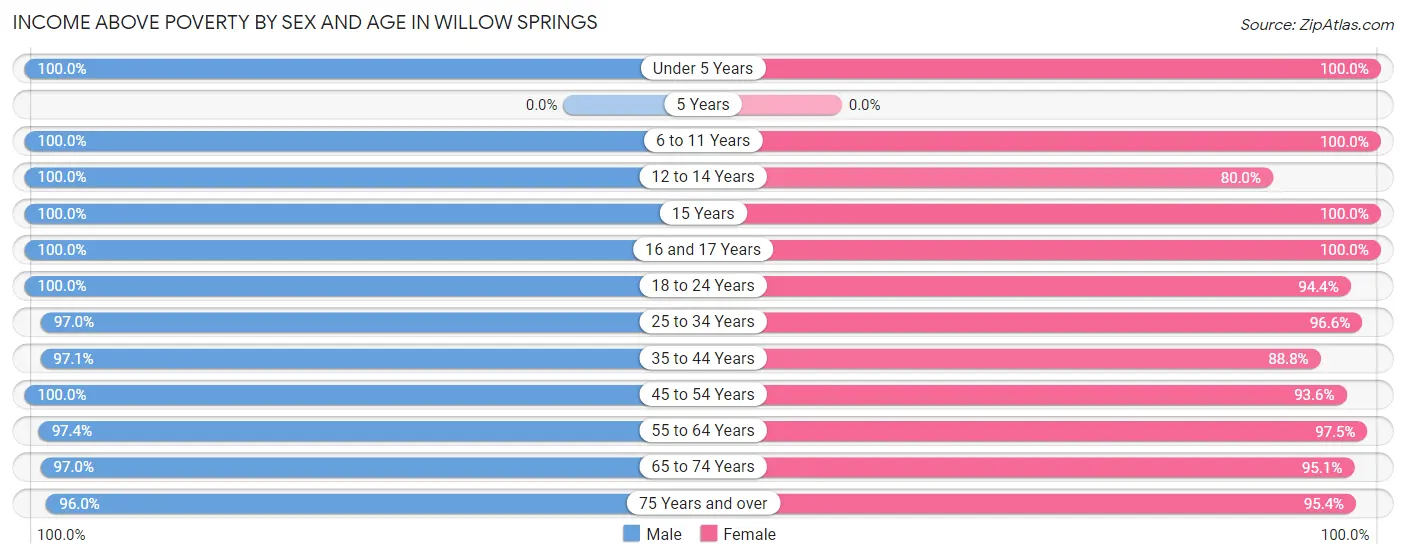
| Age Bracket | Male | Female |
| Under 5 Years | 102 (100.0%) | 27 (100.0%) |
| 5 Years | 0 (0.0%) | 0 (0.0%) |
| 6 to 11 Years | 227 (100.0%) | 188 (100.0%) |
| 12 to 14 Years | 23 (100.0%) | 116 (80.0%) |
| 15 Years | 58 (100.0%) | 80 (100.0%) |
| 16 and 17 Years | 164 (100.0%) | 30 (100.0%) |
| 18 to 24 Years | 213 (100.0%) | 153 (94.4%) |
| 25 to 34 Years | 289 (97.0%) | 252 (96.6%) |
| 35 to 44 Years | 397 (97.1%) | 398 (88.8%) |
| 45 to 54 Years | 384 (100.0%) | 440 (93.6%) |
| 55 to 64 Years | 482 (97.4%) | 435 (97.5%) |
| 65 to 74 Years | 328 (97.0%) | 407 (95.1%) |
| 75 Years and over | 237 (96.0%) | 209 (95.4%) |
| Total | 2,904 (98.2%) | 2,735 (94.2%) |
Income Below Poverty Among Married-Couple Families in Willow Springs
The poverty statistics for married-couple families in Willow Springs show that 2.3% or 29 of the total 1,277 families live below the poverty line. Families with no children have the highest poverty rate of 3.5%, comprising of 29 families. On the other hand, families with 1 or 2 children have the lowest poverty rate of 0.0%, which includes 0 families.
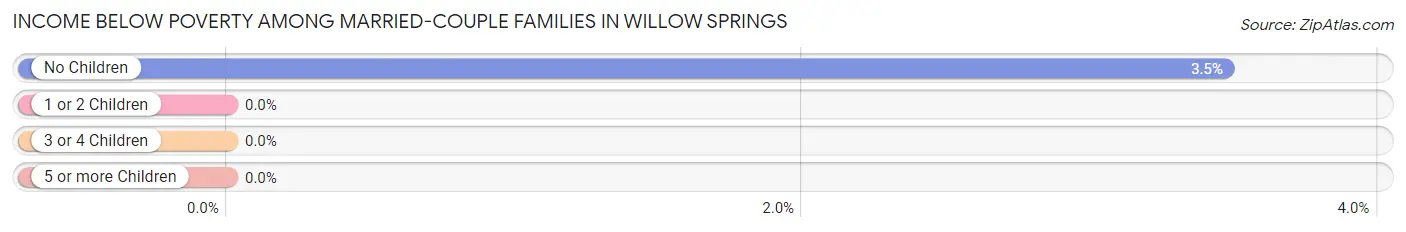
| Children | Above Poverty | Below Poverty |
| No Children | 807 (96.5%) | 29 (3.5%) |
| 1 or 2 Children | 349 (100.0%) | 0 (0.0%) |
| 3 or 4 Children | 92 (100.0%) | 0 (0.0%) |
| 5 or more Children | 0 (0.0%) | 0 (0.0%) |
| Total | 1,248 (97.7%) | 29 (2.3%) |
Income Below Poverty Among Single-Parent Households in Willow Springs
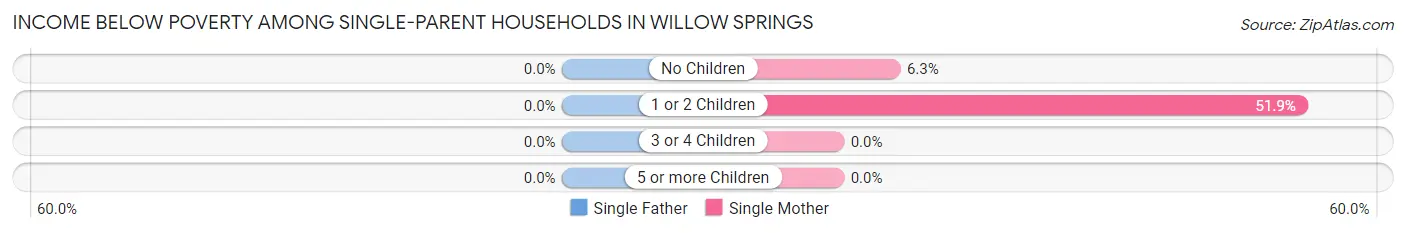
| Children | Single Father | Single Mother |
| No Children | 0 (0.0%) | 10 (6.3%) |
| 1 or 2 Children | 0 (0.0%) | 28 (51.8%) |
| 3 or 4 Children | 0 (0.0%) | 0 (0.0%) |
| 5 or more Children | 0 (0.0%) | 0 (0.0%) |
| Total | 0 (0.0%) | 38 (15.3%) |
Income Below Poverty Among Married-Couple vs Single-Parent Households in Willow Springs
The poverty data for Willow Springs shows that 29 of the married-couple family households (2.3%) and 38 of the single-parent households (10.9%) are living below the poverty level. Within the married-couple family households, those with no children have the highest poverty rate, with 29 households (3.5%) falling below the poverty line. Among the single-parent households, those with 1 or 2 children have the highest poverty rate, with 28 household (33.3%) living below poverty.
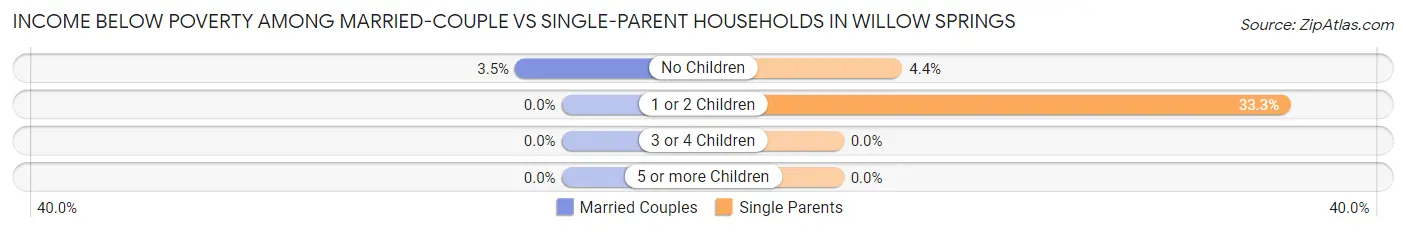
| Children | Married-Couple Families | Single-Parent Households |
| No Children | 29 (3.5%) | 10 (4.4%) |
| 1 or 2 Children | 0 (0.0%) | 28 (33.3%) |
| 3 or 4 Children | 0 (0.0%) | 0 (0.0%) |
| 5 or more Children | 0 (0.0%) | 0 (0.0%) |
| Total | 29 (2.3%) | 38 (10.9%) |
Race in Willow Springs
The most populous races in Willow Springs are White / Caucasian (5,229 | 89.2%), Hispanic or Latino (1,234 | 21.0%), and Two or more Races (357 | 6.1%).
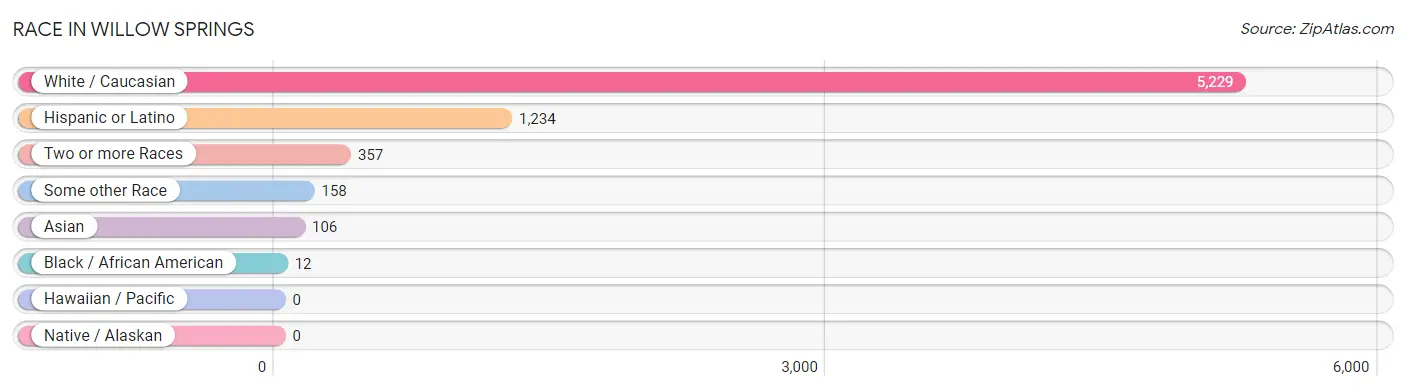
| Race | # Population | % Population |
| Asian | 106 | 1.8% |
| Black / African American | 12 | 0.2% |
| Hawaiian / Pacific | 0 | 0.0% |
| Hispanic or Latino | 1,234 | 21.0% |
| Native / Alaskan | 0 | 0.0% |
| White / Caucasian | 5,229 | 89.2% |
| Two or more Races | 357 | 6.1% |
| Some other Race | 158 | 2.7% |
| Total | 5,862 | 100.0% |
Ancestry in Willow Springs
The most populous ancestries reported in Willow Springs are Polish (1,190 | 20.3%), German (1,157 | 19.7%), Mexican (1,016 | 17.3%), Italian (902 | 15.4%), and Irish (754 | 12.9%), together accounting for 85.6% of all Willow Springs residents.
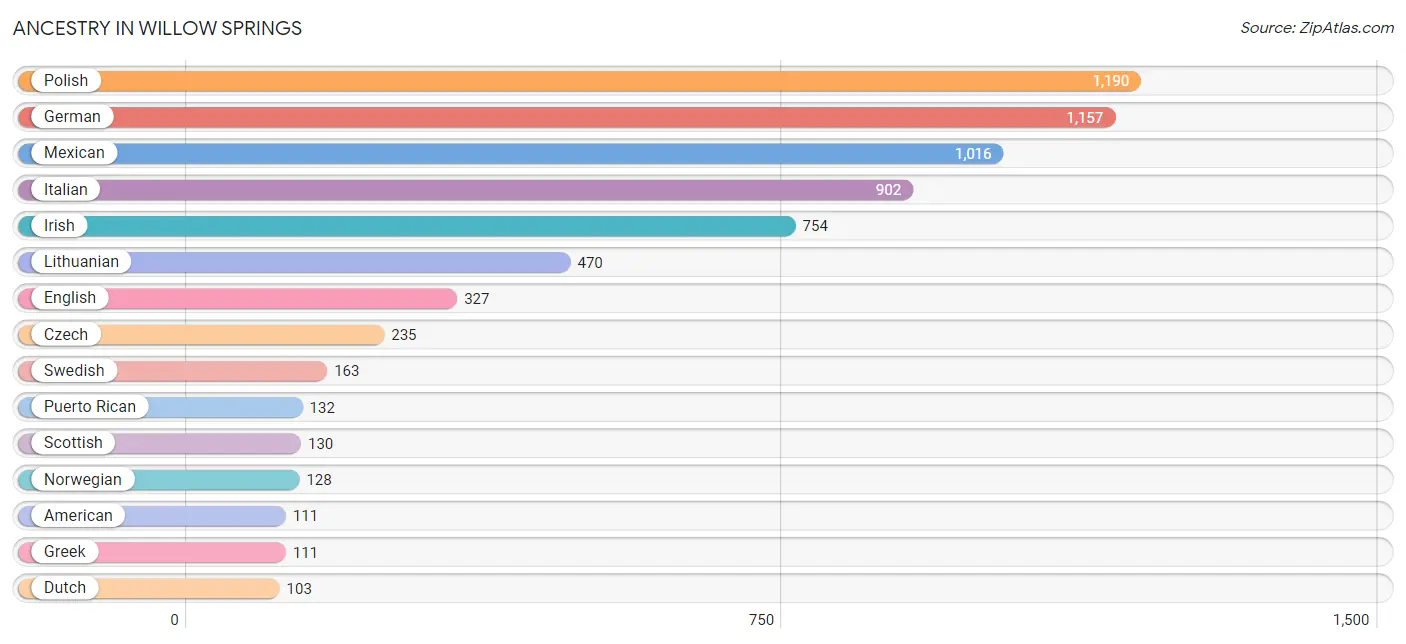
| Ancestry | # Population | % Population |
| African | 11 | 0.2% |
| American | 111 | 1.9% |
| Arab | 70 | 1.2% |
| Austrian | 10 | 0.2% |
| Bhutanese | 1 | 0.0% |
| Blackfeet | 11 | 0.2% |
| Colombian | 28 | 0.5% |
| Croatian | 96 | 1.6% |
| Cuban | 14 | 0.2% |
| Czech | 235 | 4.0% |
| Czechoslovakian | 36 | 0.6% |
| Danish | 22 | 0.4% |
| Dutch | 103 | 1.8% |
| Eastern European | 27 | 0.5% |
| Ecuadorian | 33 | 0.6% |
| English | 327 | 5.6% |
| European | 22 | 0.4% |
| French | 23 | 0.4% |
| French Canadian | 8 | 0.1% |
| German | 1,157 | 19.7% |
| Greek | 111 | 1.9% |
| Hungarian | 63 | 1.1% |
| Indian (Asian) | 31 | 0.5% |
| Irish | 754 | 12.9% |
| Italian | 902 | 15.4% |
| Korean | 10 | 0.2% |
| Lithuanian | 470 | 8.0% |
| Mexican | 1,016 | 17.3% |
| Mexican American Indian | 8 | 0.1% |
| Northern European | 11 | 0.2% |
| Norwegian | 128 | 2.2% |
| Pakistani | 12 | 0.2% |
| Palestinian | 60 | 1.0% |
| Polish | 1,190 | 20.3% |
| Puerto Rican | 132 | 2.2% |
| Romanian | 18 | 0.3% |
| Russian | 74 | 1.3% |
| Scotch-Irish | 17 | 0.3% |
| Scottish | 130 | 2.2% |
| Slovak | 48 | 0.8% |
| Slovene | 10 | 0.2% |
| South American | 61 | 1.0% |
| Spaniard | 11 | 0.2% |
| Subsaharan African | 11 | 0.2% |
| Swedish | 163 | 2.8% |
| Thai | 64 | 1.1% |
| Ukrainian | 48 | 0.8% |
| Welsh | 11 | 0.2% | View All 48 Rows |
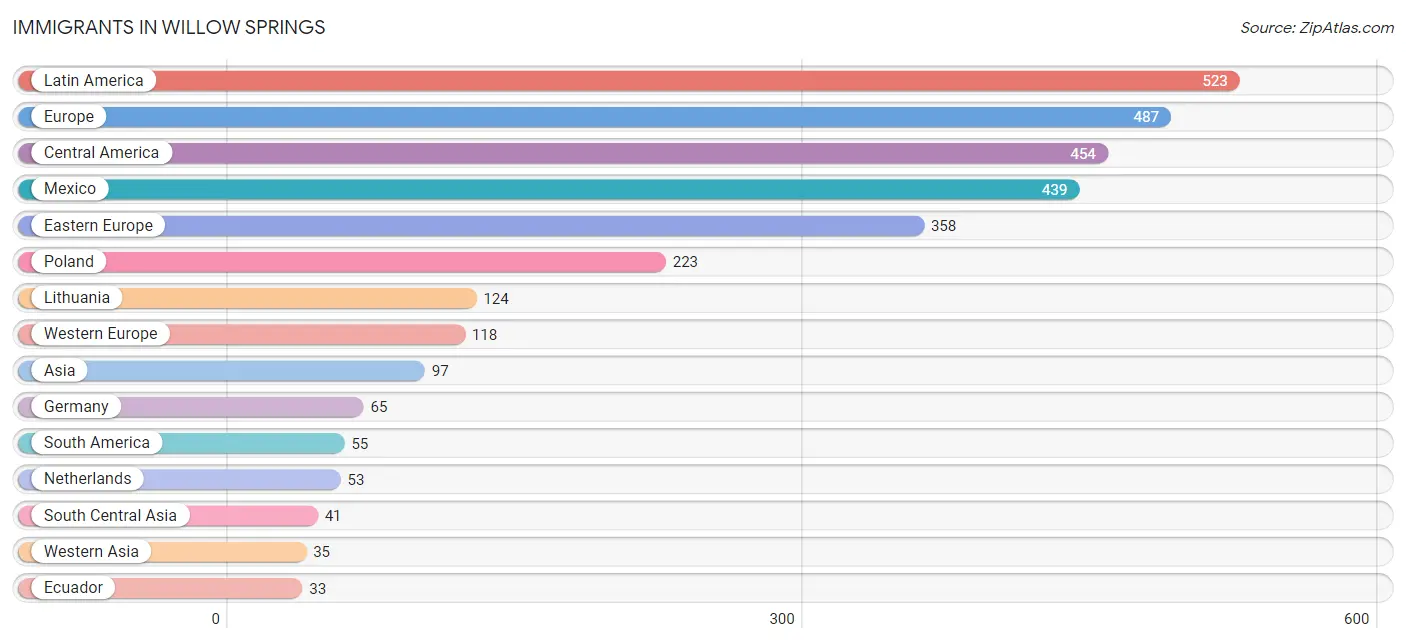
Immigrants in Willow Springs
The most numerous immigrant groups reported in Willow Springs came from Latin America (523 | 8.9%), Europe (487 | 8.3%), Central America (454 | 7.7%), Mexico (439 | 7.5%), and Eastern Europe (358 | 6.1%), together accounting for 38.6% of all Willow Springs residents.
| Immigration Origin | # Population | % Population |
| Asia | 97 | 1.7% |
| Caribbean | 14 | 0.2% |
| Central America | 454 | 7.7% |
| China | 21 | 0.4% |
| Colombia | 8 | 0.1% |
| Croatia | 11 | 0.2% |
| Cuba | 14 | 0.2% |
| Eastern Asia | 21 | 0.4% |
| Eastern Europe | 358 | 6.1% |
| Ecuador | 33 | 0.6% |
| Europe | 487 | 8.3% |
| Germany | 65 | 1.1% |
| Guatemala | 15 | 0.3% |
| India | 31 | 0.5% |
| Iran | 10 | 0.2% |
| Italy | 11 | 0.2% |
| Jordan | 11 | 0.2% |
| Kuwait | 24 | 0.4% |
| Latin America | 523 | 8.9% |
| Lithuania | 124 | 2.1% |
| Mexico | 439 | 7.5% |
| Netherlands | 53 | 0.9% |
| Poland | 223 | 3.8% |
| South America | 55 | 0.9% |
| South Central Asia | 41 | 0.7% |
| Southern Europe | 11 | 0.2% |
| Western Asia | 35 | 0.6% |
| Western Europe | 118 | 2.0% | View All 28 Rows |
Sex and Age in Willow Springs
Sex and Age in Willow Springs
The most populous age groups in Willow Springs are 15 to 19 Years (285 | 9.6%) for men and 65 to 69 Years (272 | 9.4%) for women.
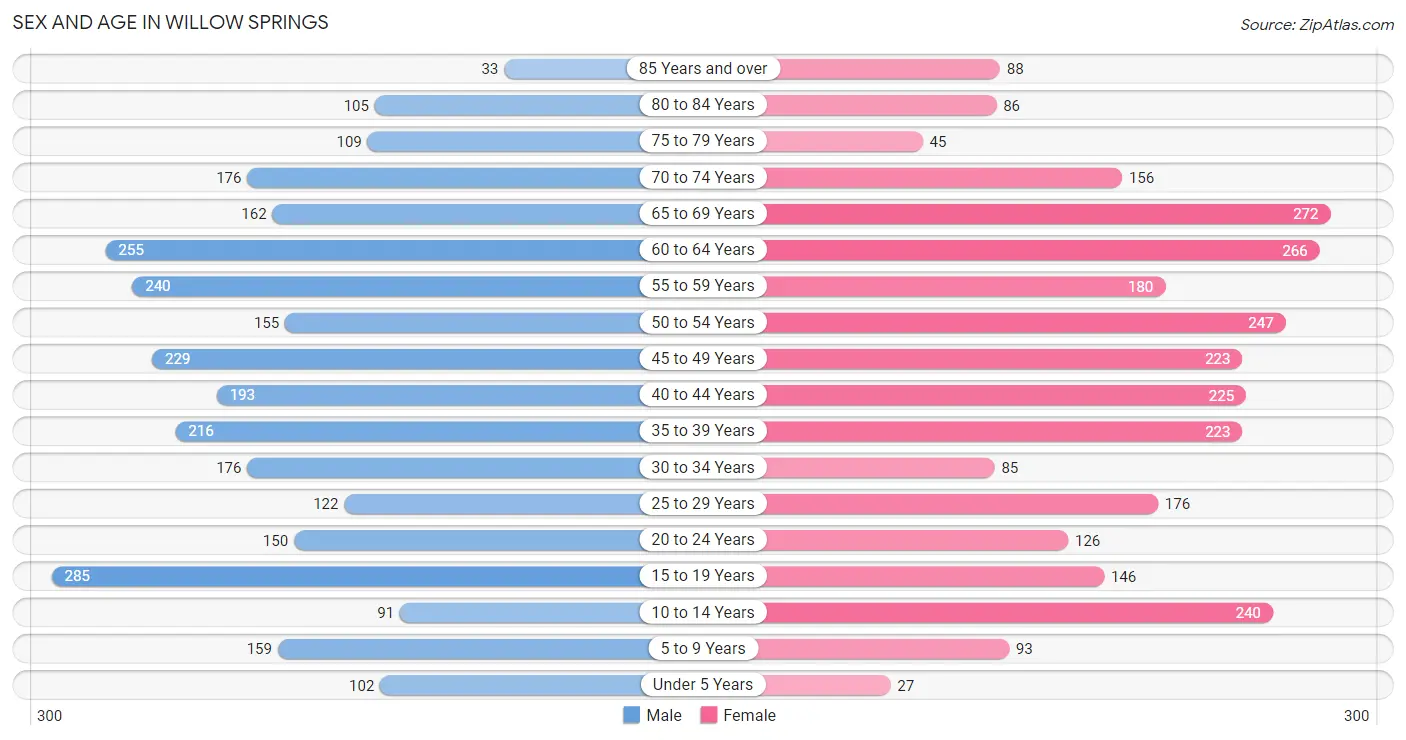
| Age Bracket | Male | Female |
| Under 5 Years | 102 (3.5%) | 27 (0.9%) |
| 5 to 9 Years | 159 (5.4%) | 93 (3.2%) |
| 10 to 14 Years | 91 (3.1%) | 240 (8.3%) |
| 15 to 19 Years | 285 (9.6%) | 146 (5.0%) |
| 20 to 24 Years | 150 (5.1%) | 126 (4.3%) |
| 25 to 29 Years | 122 (4.1%) | 176 (6.1%) |
| 30 to 34 Years | 176 (5.9%) | 85 (2.9%) |
| 35 to 39 Years | 216 (7.3%) | 223 (7.7%) |
| 40 to 44 Years | 193 (6.5%) | 225 (7.7%) |
| 45 to 49 Years | 229 (7.7%) | 223 (7.7%) |
| 50 to 54 Years | 155 (5.2%) | 247 (8.5%) |
| 55 to 59 Years | 240 (8.1%) | 180 (6.2%) |
| 60 to 64 Years | 255 (8.6%) | 266 (9.2%) |
| 65 to 69 Years | 162 (5.5%) | 272 (9.4%) |
| 70 to 74 Years | 176 (5.9%) | 156 (5.4%) |
| 75 to 79 Years | 109 (3.7%) | 45 (1.5%) |
| 80 to 84 Years | 105 (3.5%) | 86 (3.0%) |
| 85 Years and over | 33 (1.1%) | 88 (3.0%) |
| Total | 2,958 (100.0%) | 2,904 (100.0%) |
Families and Households in Willow Springs
Median Family Size in Willow Springs
The median family size in Willow Springs is 2.88 persons per family, with married-couple families (1,277 | 78.5%) accounting for the largest median family size of 3.01 persons per family. On the other hand, single male/father families (100 | 6.1%) represent the smallest median family size with 2.06 persons per family.
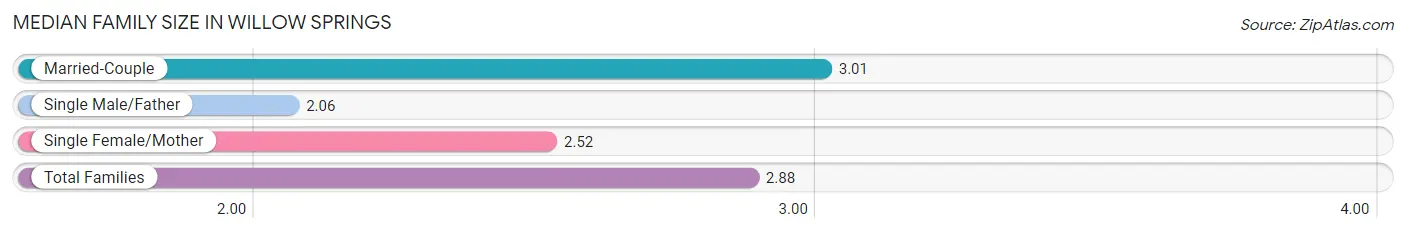
| Family Type | # Families | Family Size |
| Married-Couple | 1,277 (78.5%) | 3.01 |
| Single Male/Father | 100 (6.1%) | 2.06 |
| Single Female/Mother | 249 (15.3%) | 2.52 |
| Total Families | 1,626 (100.0%) | 2.88 |
Median Household Size in Willow Springs
The median household size in Willow Springs is 2.30 persons per household, with married-couple households (1,277 | 50.1%) accounting for the largest median household size of 3.01 persons per household. non-family households (924 | 36.2%) represent the smallest median household size with 1.21 persons per household.
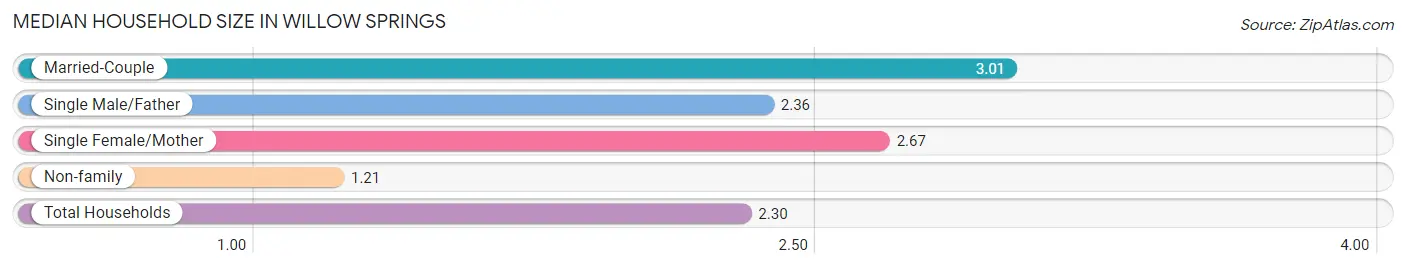
| Household Type | # Households | Household Size |
| Married-Couple | 1,277 (50.1%) | 3.01 |
| Single Male/Father | 100 (3.9%) | 2.36 |
| Single Female/Mother | 249 (9.8%) | 2.67 |
| Non-family | 924 (36.2%) | 1.21 |
| Total Households | 2,550 (100.0%) | 2.30 |
Household Size by Marriage Status in Willow Springs
Out of a total of 2,550 households in Willow Springs, 1,626 (63.8%) are family households, while 924 (36.2%) are nonfamily households. The most numerous type of family households are 2-person households, comprising 914, and the most common type of nonfamily households are 1-person households, comprising 737.
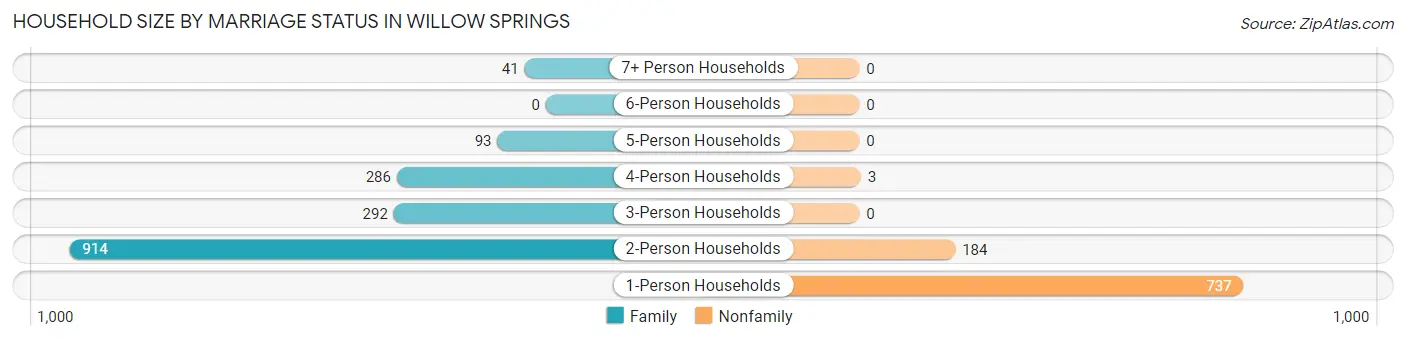
| Household Size | Family Households | Nonfamily Households |
| 1-Person Households | - | 737 (28.9%) |
| 2-Person Households | 914 (35.8%) | 184 (7.2%) |
| 3-Person Households | 292 (11.5%) | 0 (0.0%) |
| 4-Person Households | 286 (11.2%) | 3 (0.1%) |
| 5-Person Households | 93 (3.6%) | 0 (0.0%) |
| 6-Person Households | 0 (0.0%) | 0 (0.0%) |
| 7+ Person Households | 41 (1.6%) | 0 (0.0%) |
| Total | 1,626 (63.8%) | 924 (36.2%) |
Female Fertility in Willow Springs
Fertility by Age in Willow Springs
Average fertility rate in Willow Springs is 20.0 births per 1,000 women. Women in the age bracket of 20 to 34 years have the highest fertility rate with 39.0 births per 1,000 women. Women in the age bracket of 20 to 34 years acount for 57.7% of all women with births.
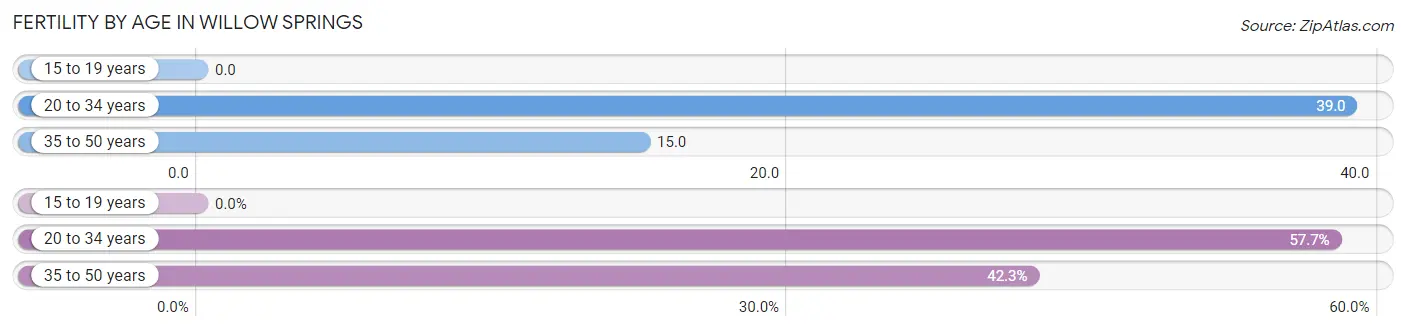
| Age Bracket | Women with Births | Births / 1,000 Women |
| 15 to 19 years | 0 (0.0%) | 0.0 |
| 20 to 34 years | 15 (57.7%) | 39.0 |
| 35 to 50 years | 11 (42.3%) | 15.0 |
| Total | 26 (100.0%) | 20.0 |
Fertility by Age by Marriage Status in Willow Springs
57.7% of women with births (26) in Willow Springs are married. The highest percentage of unmarried women with births falls into 35 to 50 years age bracket with 100.0% of them unmarried at the time of birth, while the lowest percentage of unmarried women with births belong to 20 to 34 years age bracket with 0.0% of them unmarried.
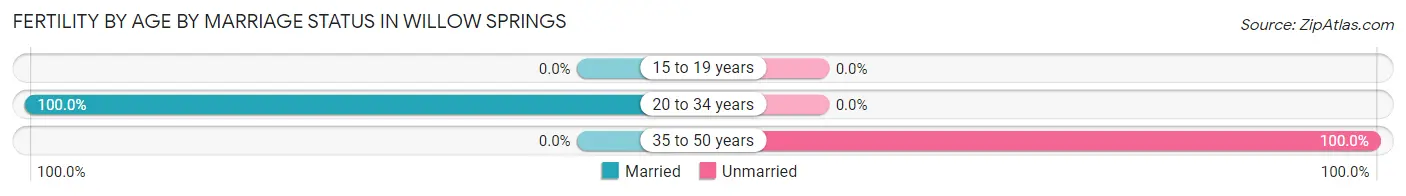
| Age Bracket | Married | Unmarried |
| 15 to 19 years | 0 (0.0%) | 0 (0.0%) |
| 20 to 34 years | 15 (100.0%) | 0 (0.0%) |
| 35 to 50 years | 0 (0.0%) | 11 (100.0%) |
| Total | 15 (57.7%) | 11 (42.3%) |
Fertility by Education in Willow Springs
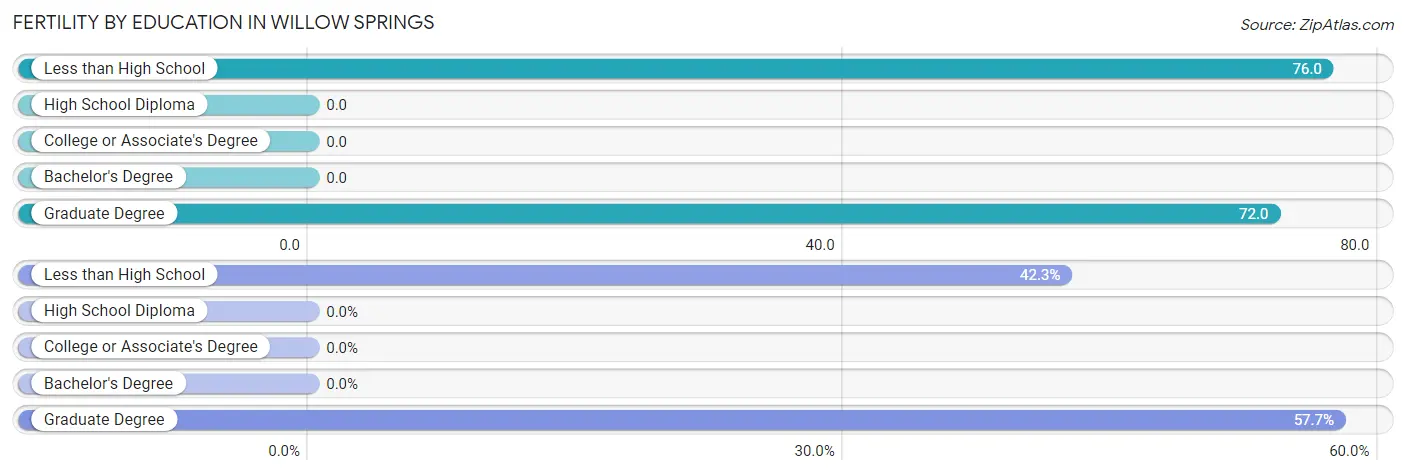
| Educational Attainment | Women with Births | Births / 1,000 Women |
| Less than High School | 11 (42.3%) | 76.0 |
| High School Diploma | 0 (0.0%) | 0.0 |
| College or Associate's Degree | 0 (0.0%) | 0.0 |
| Bachelor's Degree | 0 (0.0%) | 0.0 |
| Graduate Degree | 15 (57.7%) | 72.0 |
| Total | 26 (100.0%) | 20.0 |
Fertility by Education by Marriage Status in Willow Springs
42.3% of women with births in Willow Springs are unmarried. Women with the educational attainment of graduate degree are most likely to be married with 100.0% of them married at childbirth, while women with the educational attainment of less than high school are least likely to be married with 100.0% of them unmarried at childbirth.
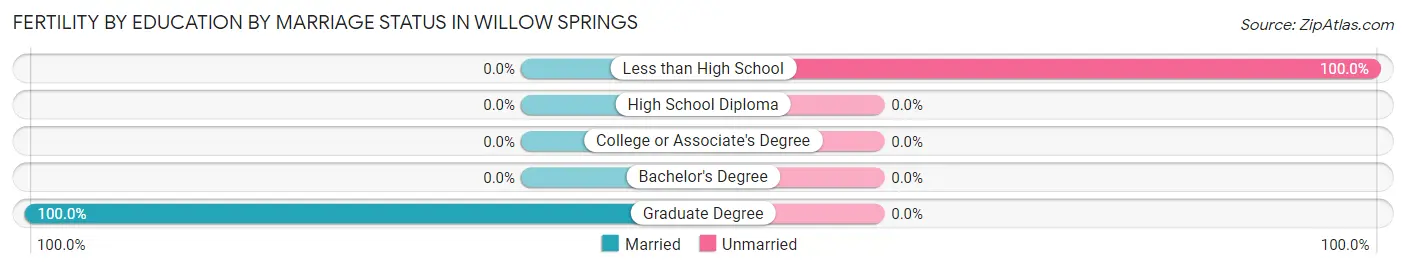
| Educational Attainment | Married | Unmarried |
| Less than High School | 0 (0.0%) | 11 (100.0%) |
| High School Diploma | 0 (0.0%) | 0 (0.0%) |
| College or Associate's Degree | 0 (0.0%) | 0 (0.0%) |
| Bachelor's Degree | 0 (0.0%) | 0 (0.0%) |
| Graduate Degree | 15 (100.0%) | 0 (0.0%) |
| Total | 15 (57.7%) | 11 (42.3%) |
Employment Characteristics in Willow Springs
Employment by Class of Employer in Willow Springs
Among the 3,060 employed individuals in Willow Springs, private company employees (1,840 | 60.1%), self-employed (incorporated) (383 | 12.5%), and local government employees (376 | 12.3%) make up the most common classes of employment.
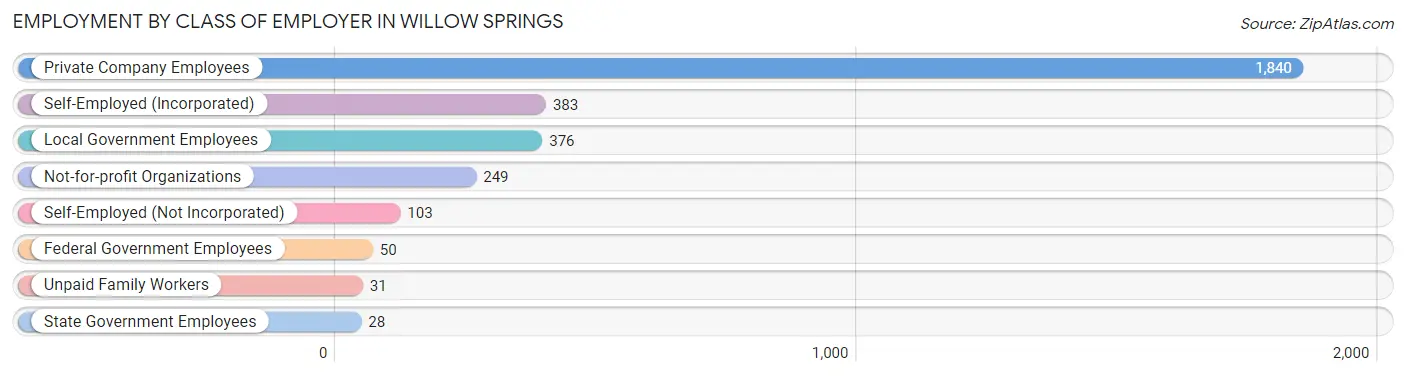
| Employer Class | # Employees | % Employees |
| Private Company Employees | 1,840 | 60.1% |
| Self-Employed (Incorporated) | 383 | 12.5% |
| Self-Employed (Not Incorporated) | 103 | 3.4% |
| Not-for-profit Organizations | 249 | 8.1% |
| Local Government Employees | 376 | 12.3% |
| State Government Employees | 28 | 0.9% |
| Federal Government Employees | 50 | 1.6% |
| Unpaid Family Workers | 31 | 1.0% |
| Total | 3,060 | 100.0% |
Employment Status by Age in Willow Springs
According to the labor force statistics for Willow Springs, out of the total population over 16 years of age (5,012), 64.5% or 3,233 individuals are in the labor force, with 4.7% or 152 of them unemployed. The age group with the highest labor force participation rate is 25 to 29 years, with 97.0% or 289 individuals in the labor force. Within the labor force, the 30 to 34 years age range has the highest percentage of unemployed individuals, with 13.1% or 33 of them being unemployed.
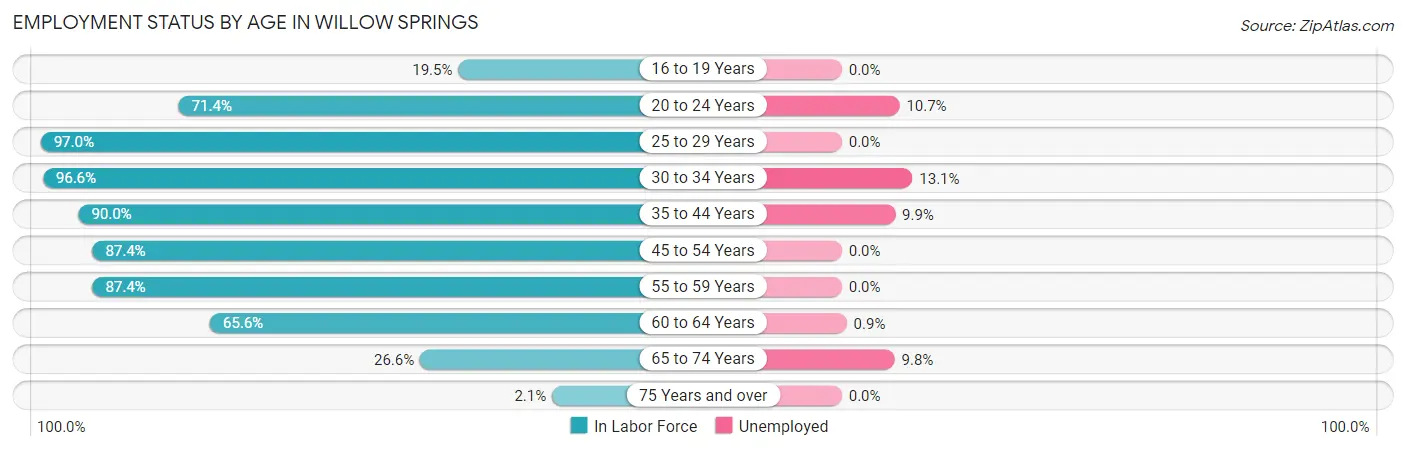
| Age Bracket | In Labor Force | Unemployed |
| 16 to 19 Years | 57 (19.5%) | 0 (0.0%) |
| 20 to 24 Years | 197 (71.4%) | 21 (10.7%) |
| 25 to 29 Years | 289 (97.0%) | 0 (0.0%) |
| 30 to 34 Years | 252 (96.6%) | 33 (13.1%) |
| 35 to 44 Years | 771 (90.0%) | 76 (9.9%) |
| 45 to 54 Years | 746 (87.4%) | 0 (0.0%) |
| 55 to 59 Years | 367 (87.4%) | 0 (0.0%) |
| 60 to 64 Years | 342 (65.6%) | 3 (0.9%) |
| 65 to 74 Years | 204 (26.6%) | 20 (9.8%) |
| 75 Years and over | 10 (2.1%) | 0 (0.0%) |
| Total | 3,233 (64.5%) | 152 (4.7%) |
Employment Status by Educational Attainment in Willow Springs
According to labor force statistics for Willow Springs, 86.2% of individuals (2,768) out of the total population between 25 and 64 years of age (3,211) are in the labor force, with 4.0% or 111 of them being unemployed. The group with the highest labor force participation rate are those with the educational attainment of bachelor's degree or higher, with 92.8% or 1,184 individuals in the labor force. Within the labor force, individuals with less than high school education have the highest percentage of unemployment, with 64.3% or 36 of them being unemployed.
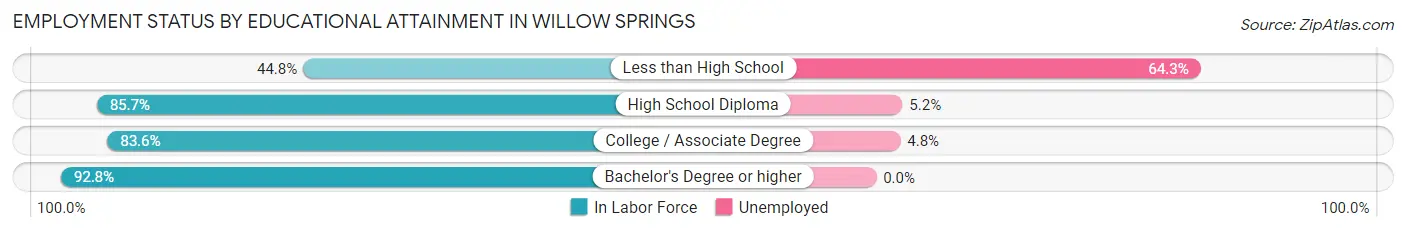
| Educational Attainment | In Labor Force | Unemployed |
| Less than High School | 56 (44.8%) | 80 (64.3%) |
| High School Diploma | 597 (85.7%) | 36 (5.2%) |
| College / Associate Degree | 930 (83.6%) | 53 (4.8%) |
| Bachelor's Degree or higher | 1,184 (92.8%) | 0 (0.0%) |
| Total | 2,768 (86.2%) | 128 (4.0%) |
Employment Occupations by Sex in Willow Springs
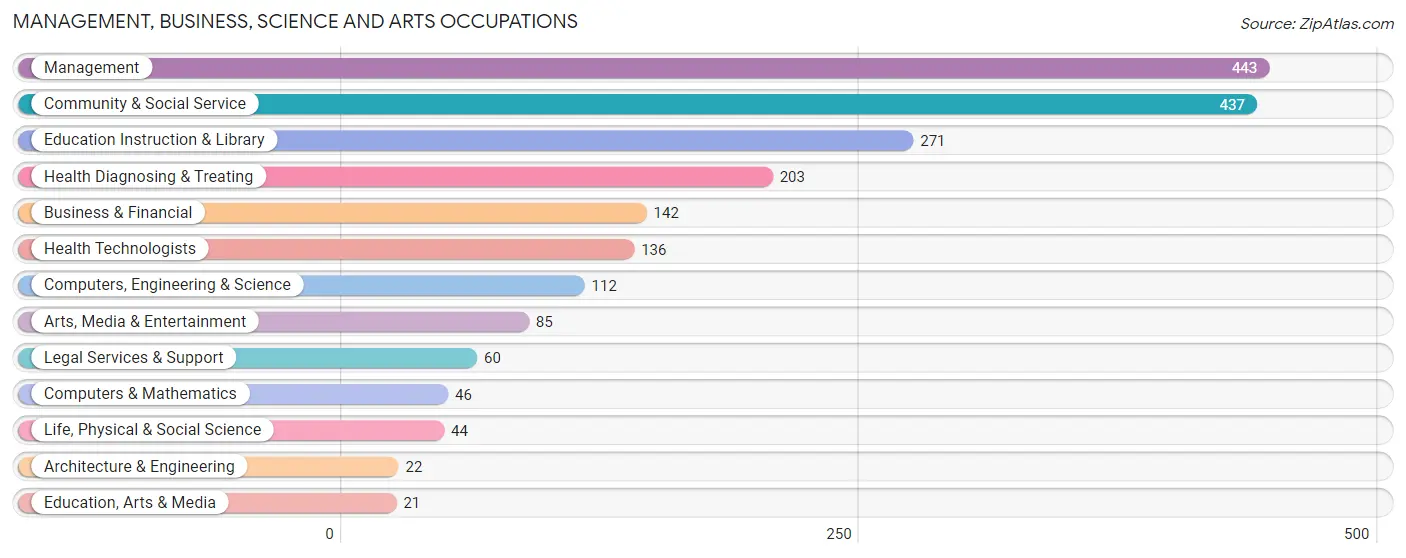
Management, Business, Science and Arts Occupations
The most common Management, Business, Science and Arts occupations in Willow Springs are Management (443 | 14.4%), Community & Social Service (437 | 14.2%), Education Instruction & Library (271 | 8.8%), Health Diagnosing & Treating (203 | 6.6%), and Business & Financial (142 | 4.6%).
Management, Business, Science and Arts Occupations by Sex
Within the Management, Business, Science and Arts occupations in Willow Springs, the most male-oriented occupations are Architecture & Engineering (100.0%), Arts, Media & Entertainment (85.9%), and Computers, Engineering & Science (74.1%), while the most female-oriented occupations are Education, Arts & Media (100.0%), Health Diagnosing & Treating (95.1%), and Health Technologists (92.6%).
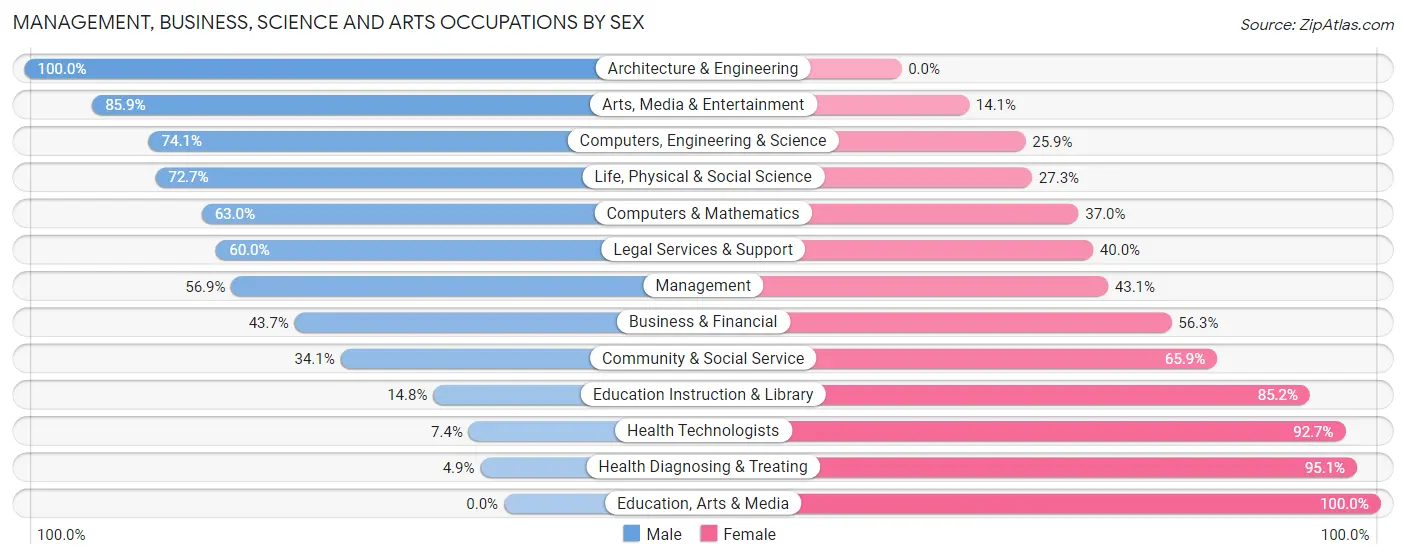
| Occupation | Male | Female |
| Management | 252 (56.9%) | 191 (43.1%) |
| Business & Financial | 62 (43.7%) | 80 (56.3%) |
| Computers, Engineering & Science | 83 (74.1%) | 29 (25.9%) |
| Computers & Mathematics | 29 (63.0%) | 17 (37.0%) |
| Architecture & Engineering | 22 (100.0%) | 0 (0.0%) |
| Life, Physical & Social Science | 32 (72.7%) | 12 (27.3%) |
| Community & Social Service | 149 (34.1%) | 288 (65.9%) |
| Education, Arts & Media | 0 (0.0%) | 21 (100.0%) |
| Legal Services & Support | 36 (60.0%) | 24 (40.0%) |
| Education Instruction & Library | 40 (14.8%) | 231 (85.2%) |
| Arts, Media & Entertainment | 73 (85.9%) | 12 (14.1%) |
| Health Diagnosing & Treating | 10 (4.9%) | 193 (95.1%) |
| Health Technologists | 10 (7.3%) | 126 (92.6%) |
| Total (Category) | 556 (41.6%) | 781 (58.4%) |
| Total (Overall) | 1,506 (48.9%) | 1,576 (51.1%) |
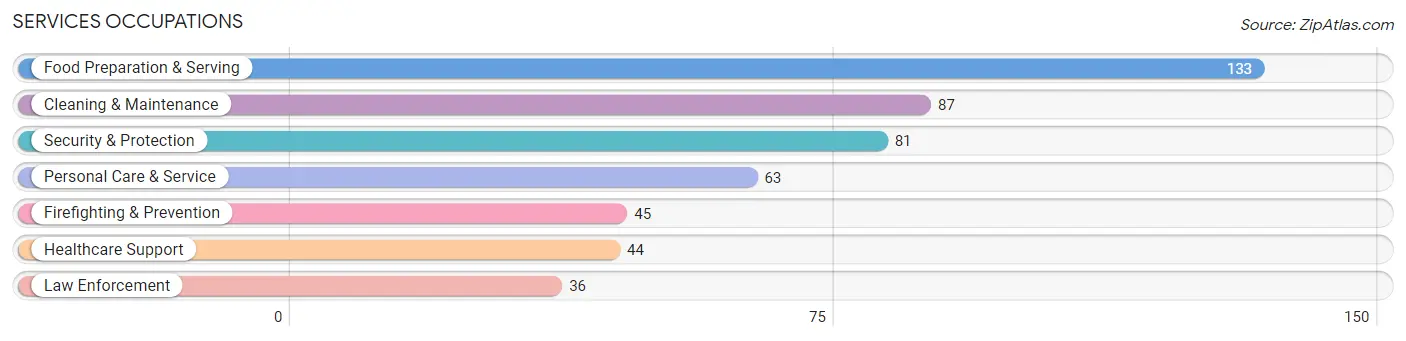
Services Occupations
The most common Services occupations in Willow Springs are Food Preparation & Serving (133 | 4.3%), Cleaning & Maintenance (87 | 2.8%), Security & Protection (81 | 2.6%), Personal Care & Service (63 | 2.0%), and Firefighting & Prevention (45 | 1.5%).
Services Occupations by Sex
Within the Services occupations in Willow Springs, the most male-oriented occupations are Law Enforcement (100.0%), Security & Protection (87.6%), and Firefighting & Prevention (77.8%), while the most female-oriented occupations are Personal Care & Service (100.0%), Cleaning & Maintenance (81.6%), and Healthcare Support (77.3%).
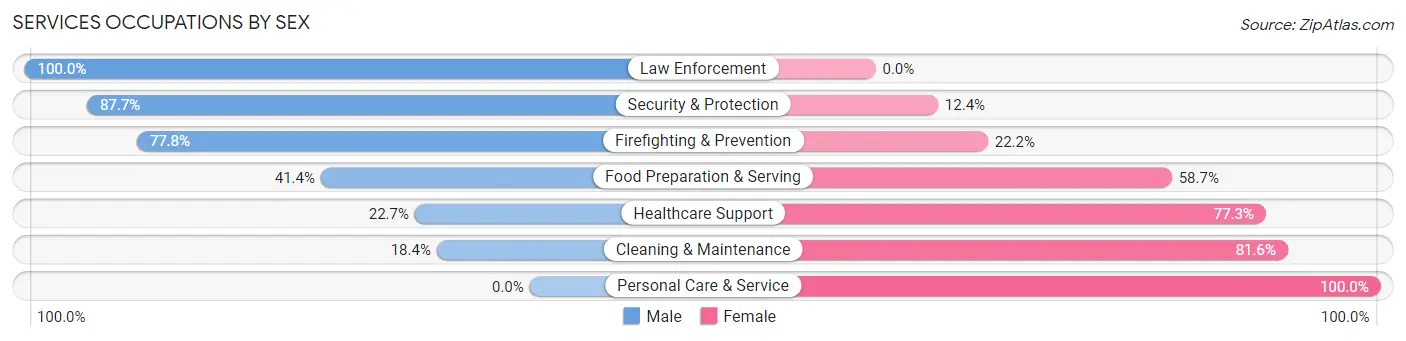
| Occupation | Male | Female |
| Healthcare Support | 10 (22.7%) | 34 (77.3%) |
| Security & Protection | 71 (87.6%) | 10 (12.3%) |
| Firefighting & Prevention | 35 (77.8%) | 10 (22.2%) |
| Law Enforcement | 36 (100.0%) | 0 (0.0%) |
| Food Preparation & Serving | 55 (41.3%) | 78 (58.7%) |
| Cleaning & Maintenance | 16 (18.4%) | 71 (81.6%) |
| Personal Care & Service | 0 (0.0%) | 63 (100.0%) |
| Total (Category) | 152 (37.2%) | 256 (62.7%) |
| Total (Overall) | 1,506 (48.9%) | 1,576 (51.1%) |
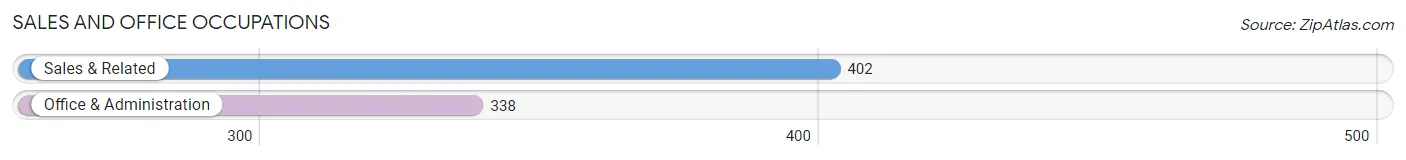
Sales and Office Occupations
The most common Sales and Office occupations in Willow Springs are Sales & Related (402 | 13.0%), and Office & Administration (338 | 11.0%).
Sales and Office Occupations by Sex
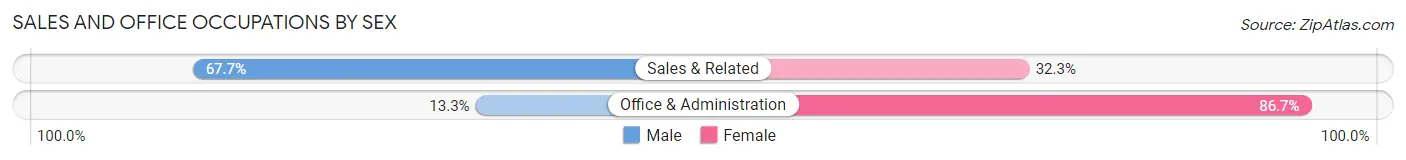
| Occupation | Male | Female |
| Sales & Related | 272 (67.7%) | 130 (32.3%) |
| Office & Administration | 45 (13.3%) | 293 (86.7%) |
| Total (Category) | 317 (42.8%) | 423 (57.2%) |
| Total (Overall) | 1,506 (48.9%) | 1,576 (51.1%) |
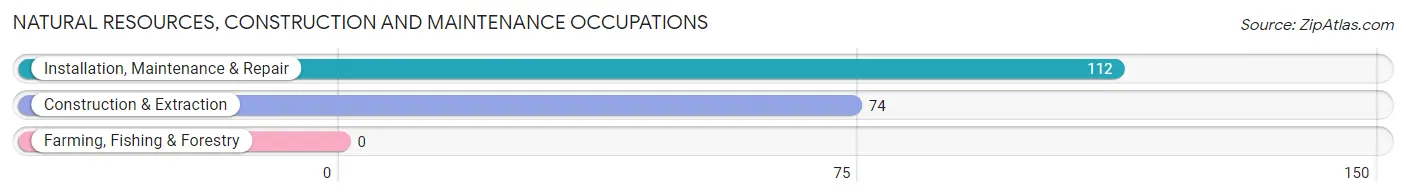
Natural Resources, Construction and Maintenance Occupations
The most common Natural Resources, Construction and Maintenance occupations in Willow Springs are Installation, Maintenance & Repair (112 | 3.6%), and Construction & Extraction (74 | 2.4%).
Natural Resources, Construction and Maintenance Occupations by Sex
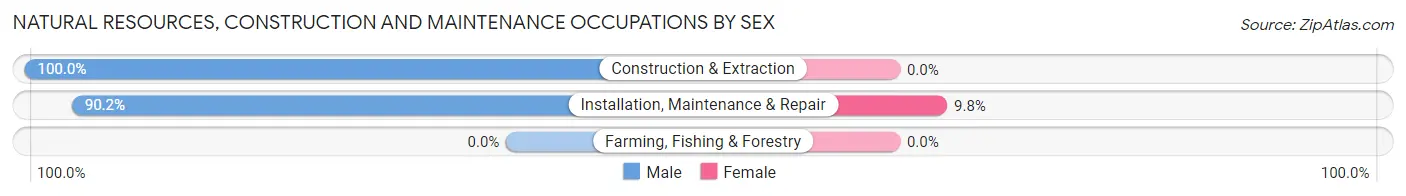
| Occupation | Male | Female |
| Farming, Fishing & Forestry | 0 (0.0%) | 0 (0.0%) |
| Construction & Extraction | 74 (100.0%) | 0 (0.0%) |
| Installation, Maintenance & Repair | 101 (90.2%) | 11 (9.8%) |
| Total (Category) | 175 (94.1%) | 11 (5.9%) |
| Total (Overall) | 1,506 (48.9%) | 1,576 (51.1%) |
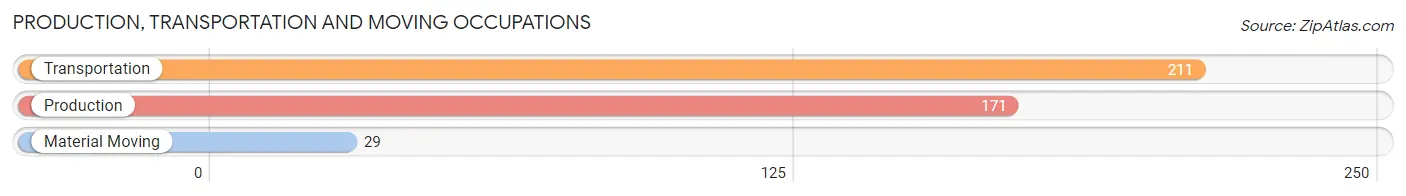
Production, Transportation and Moving Occupations
The most common Production, Transportation and Moving occupations in Willow Springs are Transportation (211 | 6.9%), Production (171 | 5.6%), and Material Moving (29 | 0.9%).
Production, Transportation and Moving Occupations by Sex
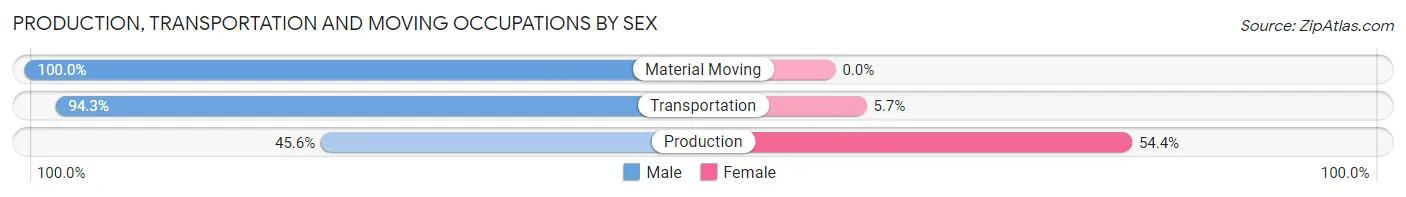
| Occupation | Male | Female |
| Production | 78 (45.6%) | 93 (54.4%) |
| Transportation | 199 (94.3%) | 12 (5.7%) |
| Material Moving | 29 (100.0%) | 0 (0.0%) |
| Total (Category) | 306 (74.5%) | 105 (25.6%) |
| Total (Overall) | 1,506 (48.9%) | 1,576 (51.1%) |
Employment Industries by Sex in Willow Springs
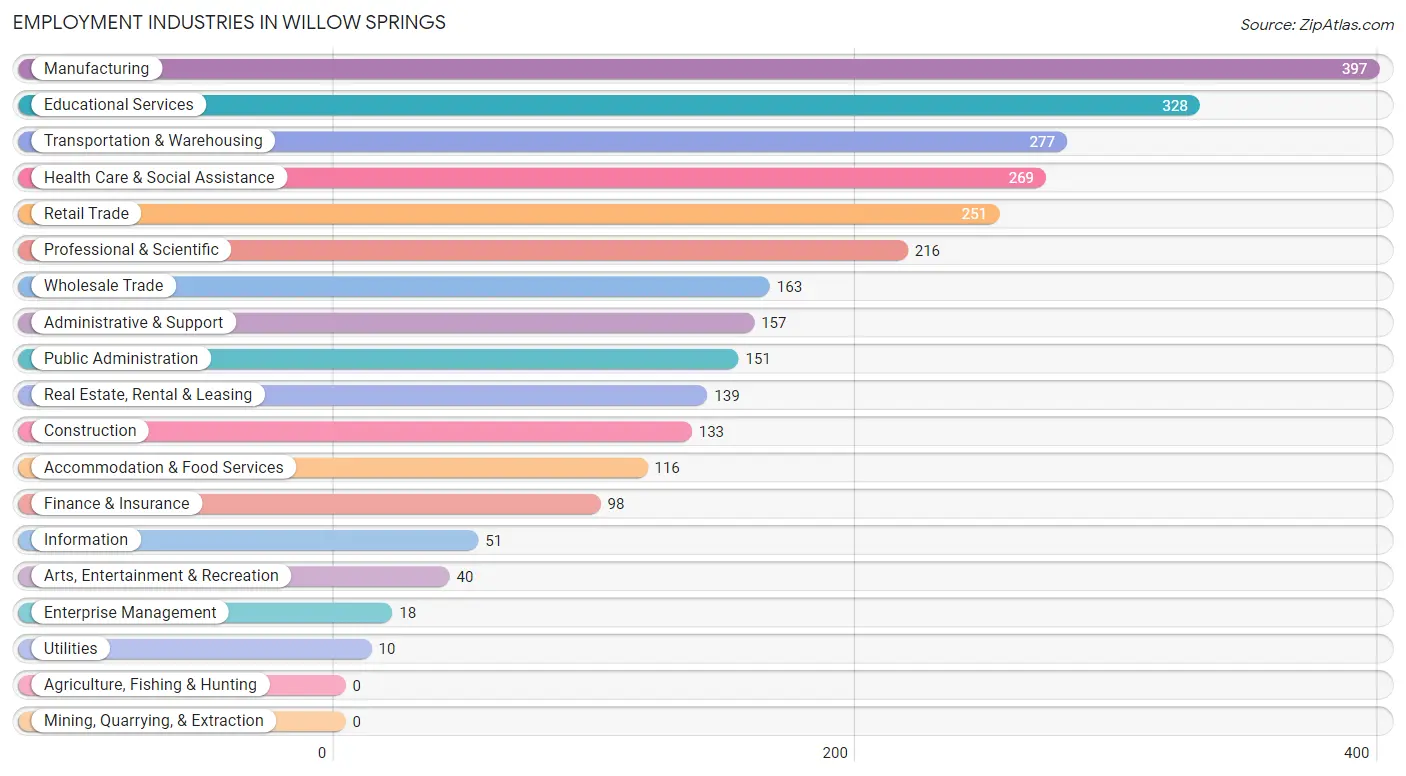
Employment Industries in Willow Springs
The major employment industries in Willow Springs include Manufacturing (397 | 12.9%), Educational Services (328 | 10.6%), Transportation & Warehousing (277 | 9.0%), Health Care & Social Assistance (269 | 8.7%), and Retail Trade (251 | 8.1%).
Employment Industries by Sex in Willow Springs
The Willow Springs industries that see more men than women are Utilities (100.0%), Enterprise Management (100.0%), and Construction (84.2%), whereas the industries that tend to have a higher number of women are Arts, Entertainment & Recreation (100.0%), Health Care & Social Assistance (88.5%), and Educational Services (84.2%).
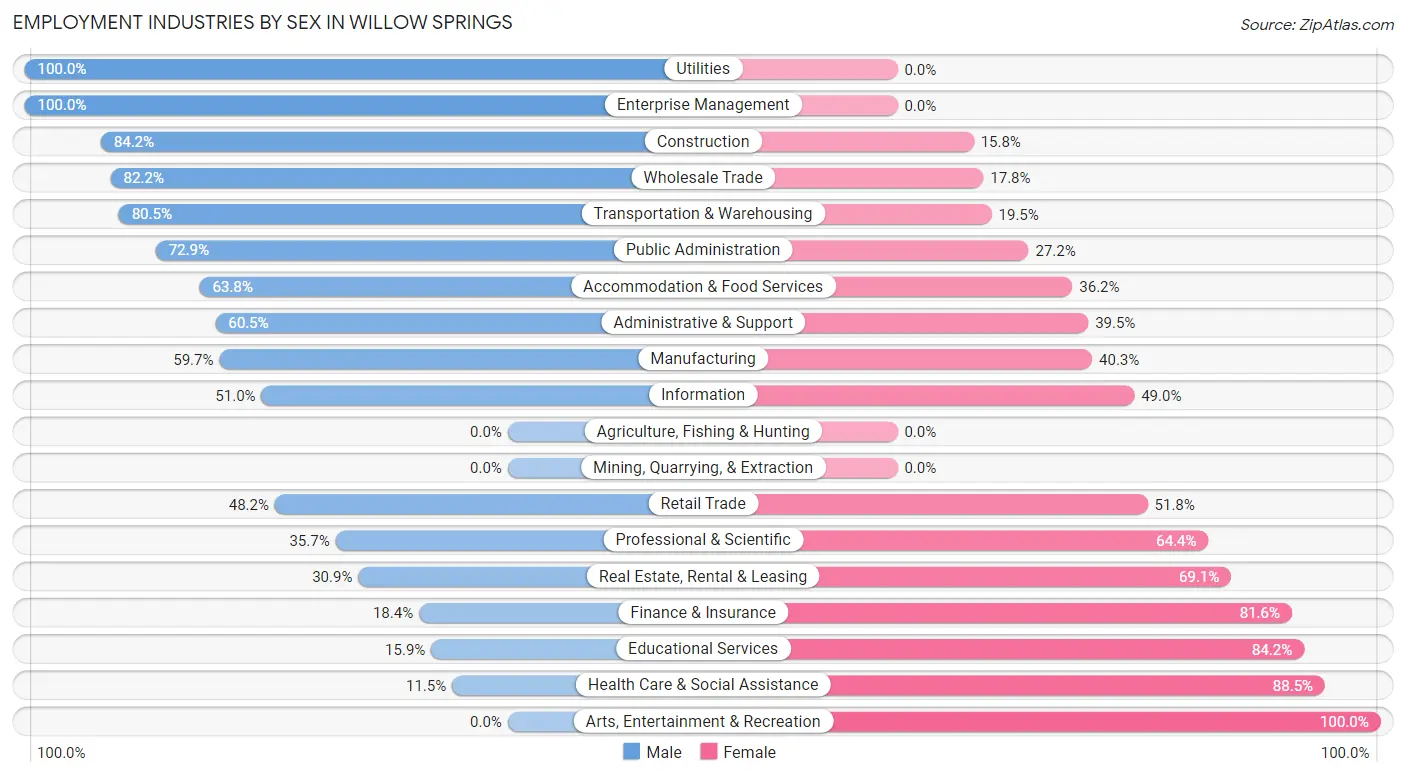
| Industry | Male | Female |
| Agriculture, Fishing & Hunting | 0 (0.0%) | 0 (0.0%) |
| Mining, Quarrying, & Extraction | 0 (0.0%) | 0 (0.0%) |
| Construction | 112 (84.2%) | 21 (15.8%) |
| Manufacturing | 237 (59.7%) | 160 (40.3%) |
| Wholesale Trade | 134 (82.2%) | 29 (17.8%) |
| Retail Trade | 121 (48.2%) | 130 (51.8%) |
| Transportation & Warehousing | 223 (80.5%) | 54 (19.5%) |
| Utilities | 10 (100.0%) | 0 (0.0%) |
| Information | 26 (51.0%) | 25 (49.0%) |
| Finance & Insurance | 18 (18.4%) | 80 (81.6%) |
| Real Estate, Rental & Leasing | 43 (30.9%) | 96 (69.1%) |
| Professional & Scientific | 77 (35.6%) | 139 (64.3%) |
| Enterprise Management | 18 (100.0%) | 0 (0.0%) |
| Administrative & Support | 95 (60.5%) | 62 (39.5%) |
| Educational Services | 52 (15.9%) | 276 (84.2%) |
| Health Care & Social Assistance | 31 (11.5%) | 238 (88.5%) |
| Arts, Entertainment & Recreation | 0 (0.0%) | 40 (100.0%) |
| Accommodation & Food Services | 74 (63.8%) | 42 (36.2%) |
| Public Administration | 110 (72.9%) | 41 (27.2%) |
| Total | 1,506 (48.9%) | 1,576 (51.1%) |
Education in Willow Springs
School Enrollment in Willow Springs
The most common levels of schooling among the 1,296 students in Willow Springs are high school (394 | 30.4%), middle school (335 | 25.9%), and elementary school (227 | 17.5%).
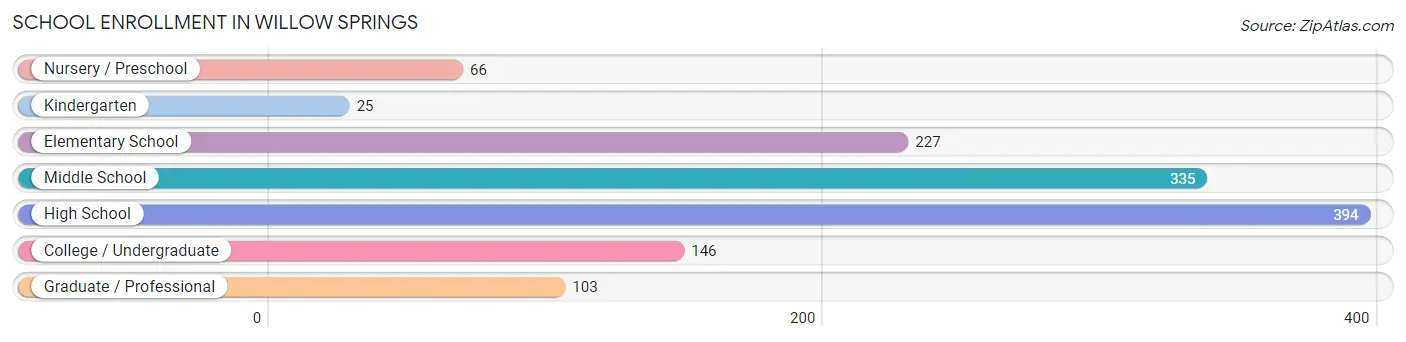
| School Level | # Students | % Students |
| Nursery / Preschool | 66 | 5.1% |
| Kindergarten | 25 | 1.9% |
| Elementary School | 227 | 17.5% |
| Middle School | 335 | 25.9% |
| High School | 394 | 30.4% |
| College / Undergraduate | 146 | 11.3% |
| Graduate / Professional | 103 | 8.0% |
| Total | 1,296 | 100.0% |
School Enrollment by Age by Funding Source in Willow Springs
Out of a total of 1,296 students who are enrolled in schools in Willow Springs, 258 (19.9%) attend a private institution, while the remaining 1,038 (80.1%) are enrolled in public schools. The age group of 20 to 24 year olds has the highest likelihood of being enrolled in private schools, with 53 (65.4% in the age bracket) enrolled. Conversely, the age group of 18 to 19 year olds has the lowest likelihood of being enrolled in a private school, with 86 (100.0% in the age bracket) attending a public institution.

| Age Bracket | Public School | Private School |
| 3 to 4 Year Olds | 46 (69.7%) | 20 (30.3%) |
| 5 to 9 Year Old | 204 (80.9%) | 48 (19.1%) |
| 10 to 14 Year Olds | 305 (92.1%) | 26 (7.9%) |
| 15 to 17 Year Olds | 282 (84.9%) | 50 (15.1%) |
| 18 to 19 Year Olds | 86 (100.0%) | 0 (0.0%) |
| 20 to 24 Year Olds | 28 (34.6%) | 53 (65.4%) |
| 25 to 34 Year Olds | 51 (100.0%) | 0 (0.0%) |
| 35 Years and over | 36 (37.1%) | 61 (62.9%) |
| Total | 1,038 (80.1%) | 258 (19.9%) |
Educational Attainment by Field of Study in Willow Springs
Business (487 | 26.9%), science & technology (183 | 10.1%), education (181 | 10.0%), social sciences (177 | 9.8%), and liberal arts & history (166 | 9.1%) are the most common fields of study among 1,814 individuals in Willow Springs who have obtained a bachelor's degree or higher.
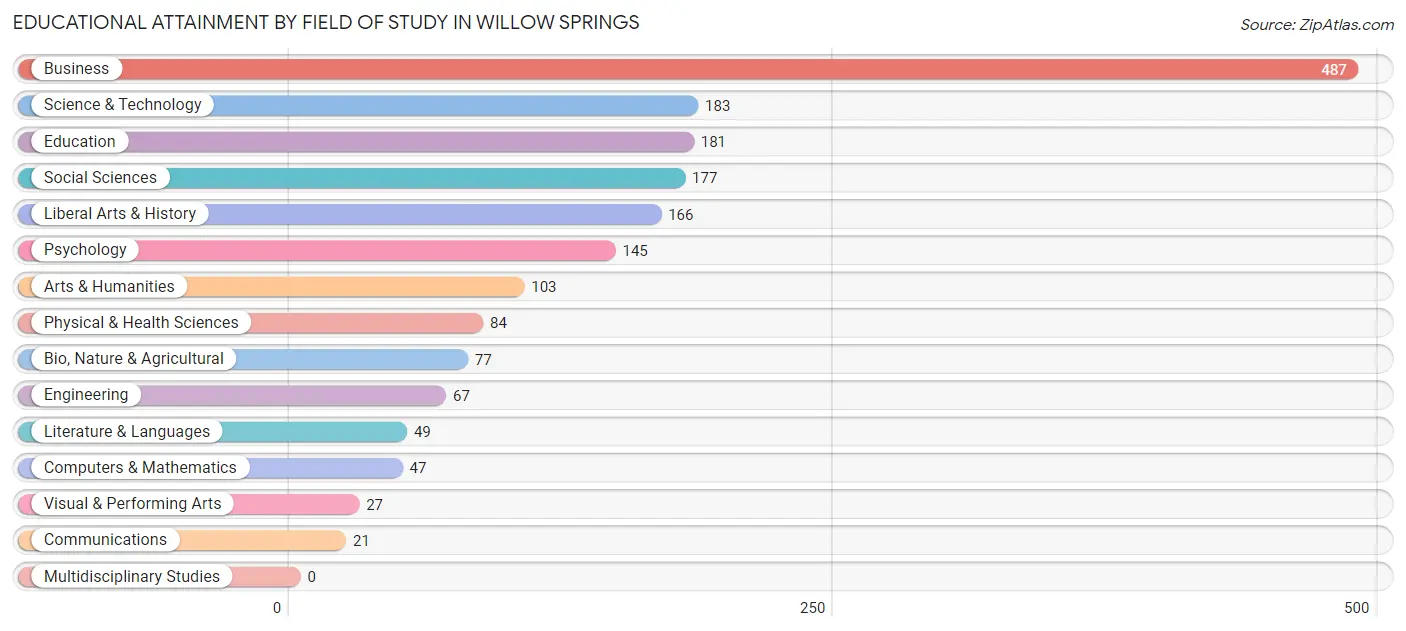
| Field of Study | # Graduates | % Graduates |
| Computers & Mathematics | 47 | 2.6% |
| Bio, Nature & Agricultural | 77 | 4.2% |
| Physical & Health Sciences | 84 | 4.6% |
| Psychology | 145 | 8.0% |
| Social Sciences | 177 | 9.8% |
| Engineering | 67 | 3.7% |
| Multidisciplinary Studies | 0 | 0.0% |
| Science & Technology | 183 | 10.1% |
| Business | 487 | 26.9% |
| Education | 181 | 10.0% |
| Literature & Languages | 49 | 2.7% |
| Liberal Arts & History | 166 | 9.1% |
| Visual & Performing Arts | 27 | 1.5% |
| Communications | 21 | 1.2% |
| Arts & Humanities | 103 | 5.7% |
| Total | 1,814 | 100.0% |
Transportation & Commute in Willow Springs
Vehicle Availability by Sex in Willow Springs
The most prevalent vehicle ownership categories in Willow Springs are males with 2 vehicles (734, accounting for 49.1%) and females with 2 vehicles (701, making up 46.9%).
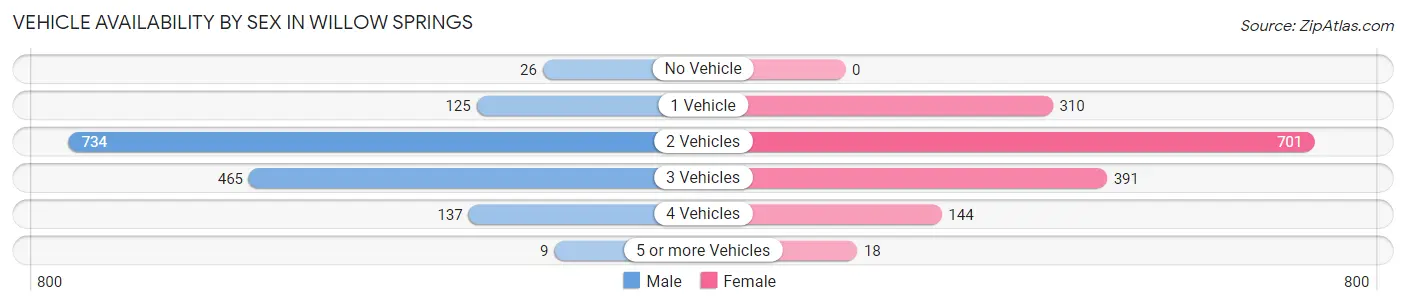
| Vehicles Available | Male | Female |
| No Vehicle | 26 (1.7%) | 0 (0.0%) |
| 1 Vehicle | 125 (8.4%) | 310 (19.8%) |
| 2 Vehicles | 734 (49.1%) | 701 (44.8%) |
| 3 Vehicles | 465 (31.1%) | 391 (25.0%) |
| 4 Vehicles | 137 (9.2%) | 144 (9.2%) |
| 5 or more Vehicles | 9 (0.6%) | 18 (1.1%) |
| Total | 1,496 (100.0%) | 1,564 (100.0%) |
Commute Time in Willow Springs
The most frequently occuring commute durations in Willow Springs are 15 to 19 minutes (471 commuters, 17.4%), 30 to 34 minutes (399 commuters, 14.7%), and 20 to 24 minutes (374 commuters, 13.8%).
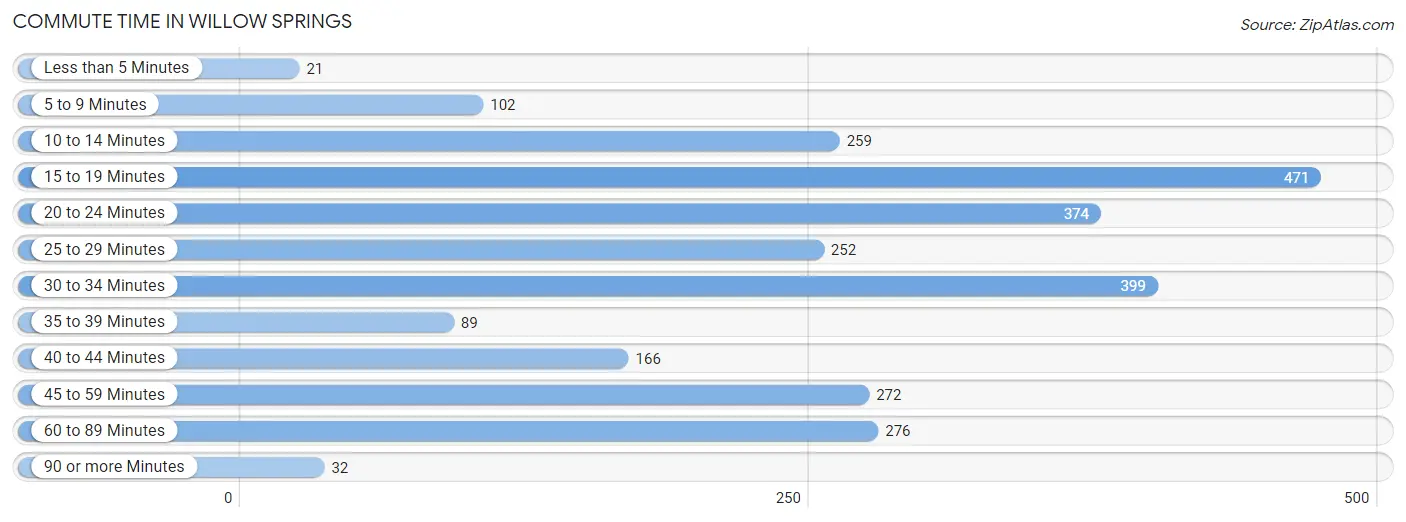
| Commute Time | # Commuters | % Commuters |
| Less than 5 Minutes | 21 | 0.8% |
| 5 to 9 Minutes | 102 | 3.8% |
| 10 to 14 Minutes | 259 | 9.6% |
| 15 to 19 Minutes | 471 | 17.4% |
| 20 to 24 Minutes | 374 | 13.8% |
| 25 to 29 Minutes | 252 | 9.3% |
| 30 to 34 Minutes | 399 | 14.7% |
| 35 to 39 Minutes | 89 | 3.3% |
| 40 to 44 Minutes | 166 | 6.1% |
| 45 to 59 Minutes | 272 | 10.0% |
| 60 to 89 Minutes | 276 | 10.2% |
| 90 or more Minutes | 32 | 1.2% |
Commute Time by Sex in Willow Springs
The most common commute times in Willow Springs are 20 to 24 minutes (211 commuters, 15.3%) for males and 15 to 19 minutes (332 commuters, 25.0%) for females.
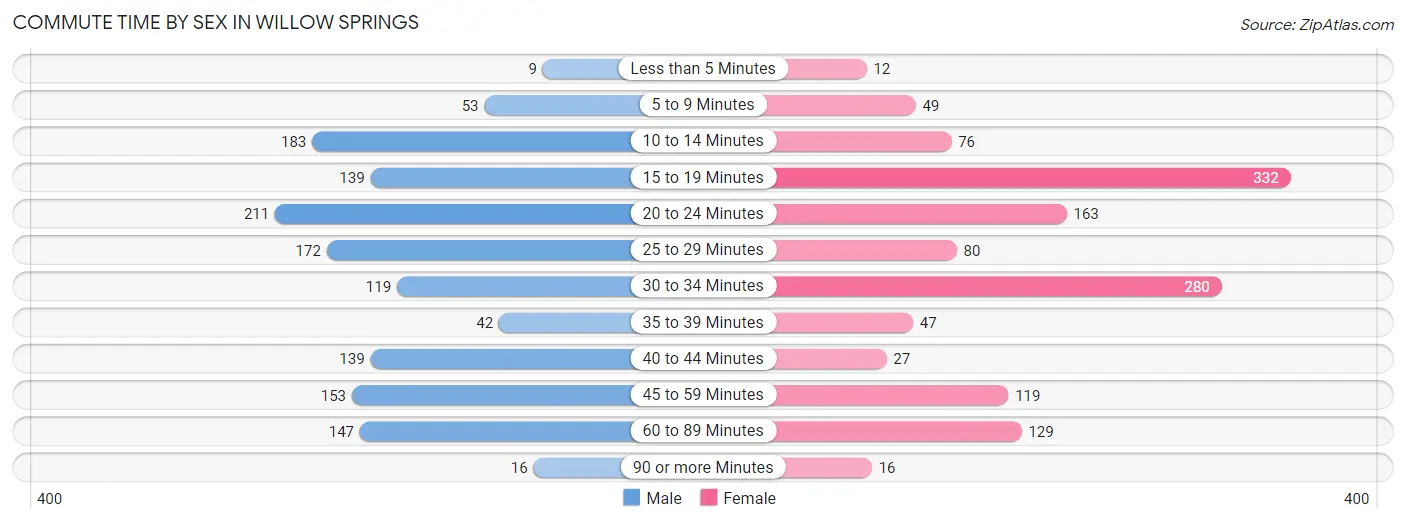
| Commute Time | Male | Female |
| Less than 5 Minutes | 9 (0.6%) | 12 (0.9%) |
| 5 to 9 Minutes | 53 (3.8%) | 49 (3.7%) |
| 10 to 14 Minutes | 183 (13.2%) | 76 (5.7%) |
| 15 to 19 Minutes | 139 (10.1%) | 332 (25.0%) |
| 20 to 24 Minutes | 211 (15.3%) | 163 (12.3%) |
| 25 to 29 Minutes | 172 (12.4%) | 80 (6.0%) |
| 30 to 34 Minutes | 119 (8.6%) | 280 (21.0%) |
| 35 to 39 Minutes | 42 (3.0%) | 47 (3.5%) |
| 40 to 44 Minutes | 139 (10.1%) | 27 (2.0%) |
| 45 to 59 Minutes | 153 (11.1%) | 119 (8.9%) |
| 60 to 89 Minutes | 147 (10.6%) | 129 (9.7%) |
| 90 or more Minutes | 16 (1.2%) | 16 (1.2%) |
Time of Departure to Work by Sex in Willow Springs
The most frequent times of departure to work in Willow Springs are 7:00 AM to 7:29 AM (181, 13.1%) for males and 7:00 AM to 7:29 AM (210, 15.8%) for females.
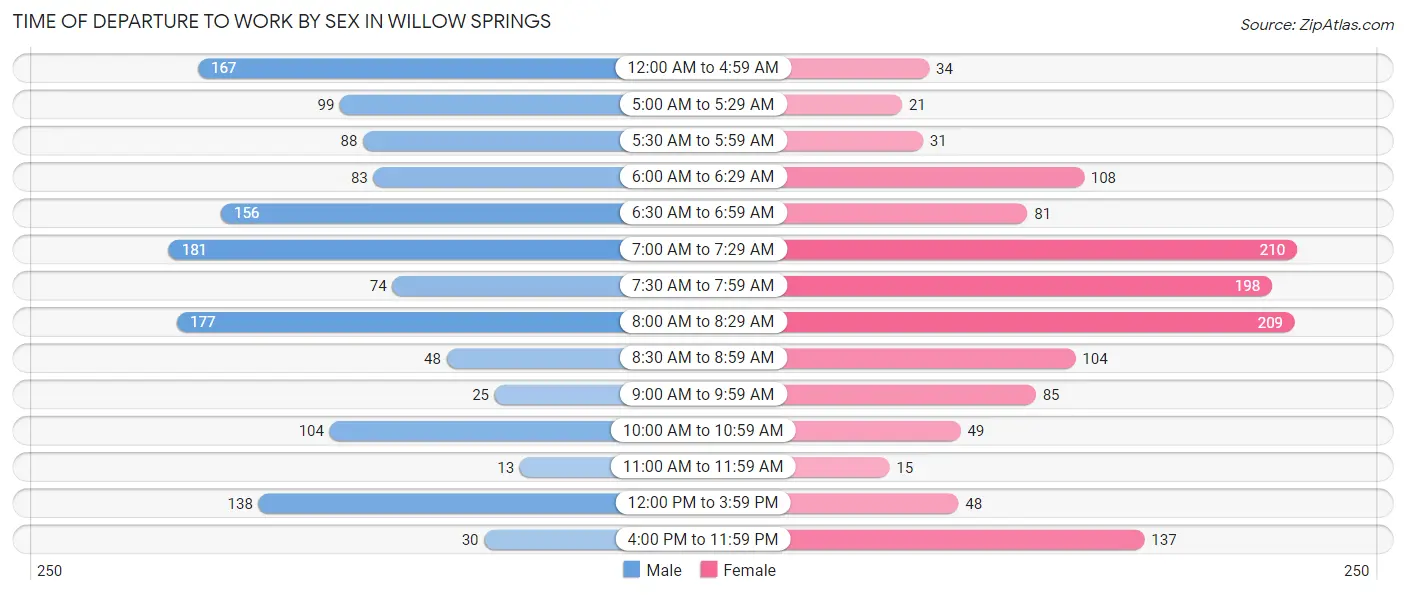
| Time of Departure | Male | Female |
| 12:00 AM to 4:59 AM | 167 (12.1%) | 34 (2.6%) |
| 5:00 AM to 5:29 AM | 99 (7.2%) | 21 (1.6%) |
| 5:30 AM to 5:59 AM | 88 (6.4%) | 31 (2.3%) |
| 6:00 AM to 6:29 AM | 83 (6.0%) | 108 (8.1%) |
| 6:30 AM to 6:59 AM | 156 (11.3%) | 81 (6.1%) |
| 7:00 AM to 7:29 AM | 181 (13.1%) | 210 (15.8%) |
| 7:30 AM to 7:59 AM | 74 (5.3%) | 198 (14.9%) |
| 8:00 AM to 8:29 AM | 177 (12.8%) | 209 (15.7%) |
| 8:30 AM to 8:59 AM | 48 (3.5%) | 104 (7.8%) |
| 9:00 AM to 9:59 AM | 25 (1.8%) | 85 (6.4%) |
| 10:00 AM to 10:59 AM | 104 (7.5%) | 49 (3.7%) |
| 11:00 AM to 11:59 AM | 13 (0.9%) | 15 (1.1%) |
| 12:00 PM to 3:59 PM | 138 (10.0%) | 48 (3.6%) |
| 4:00 PM to 11:59 PM | 30 (2.2%) | 137 (10.3%) |
| Total | 1,383 (100.0%) | 1,330 (100.0%) |
Housing Occupancy in Willow Springs
Occupancy by Ownership in Willow Springs
Of the total 2,550 dwellings in Willow Springs, owner-occupied units account for 2,145 (84.1%), while renter-occupied units make up 405 (15.9%).
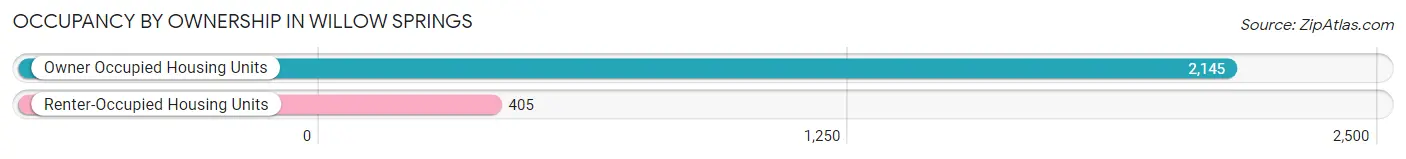
| Occupancy | # Housing Units | % Housing Units |
| Owner Occupied Housing Units | 2,145 | 84.1% |
| Renter-Occupied Housing Units | 405 | 15.9% |
| Total Occupied Housing Units | 2,550 | 100.0% |
Occupancy by Household Size in Willow Springs
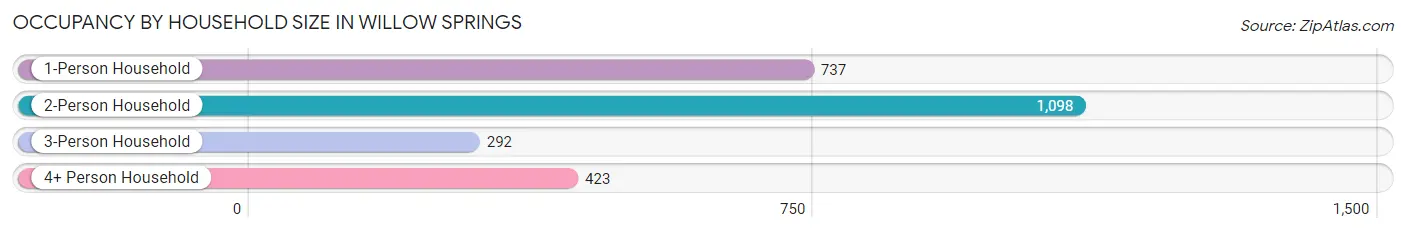
| Household Size | # Housing Units | % Housing Units |
| 1-Person Household | 737 | 28.9% |
| 2-Person Household | 1,098 | 43.1% |
| 3-Person Household | 292 | 11.5% |
| 4+ Person Household | 423 | 16.6% |
| Total Housing Units | 2,550 | 100.0% |
Occupancy by Ownership by Household Size in Willow Springs
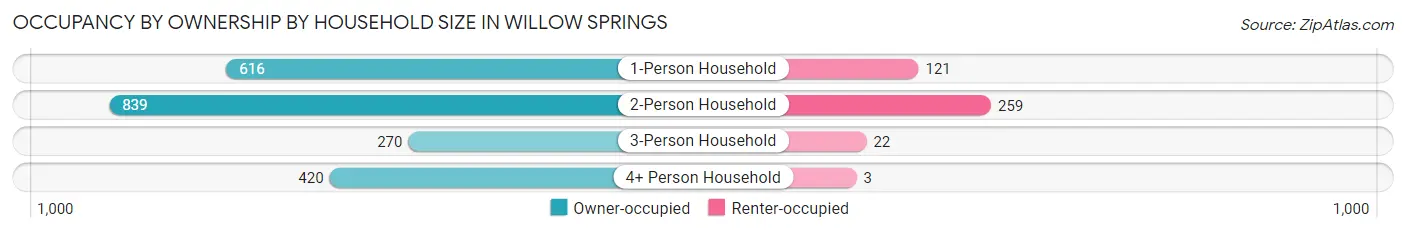
| Household Size | Owner-occupied | Renter-occupied |
| 1-Person Household | 616 (83.6%) | 121 (16.4%) |
| 2-Person Household | 839 (76.4%) | 259 (23.6%) |
| 3-Person Household | 270 (92.5%) | 22 (7.5%) |
| 4+ Person Household | 420 (99.3%) | 3 (0.7%) |
| Total Housing Units | 2,145 (84.1%) | 405 (15.9%) |
Occupancy by Educational Attainment in Willow Springs
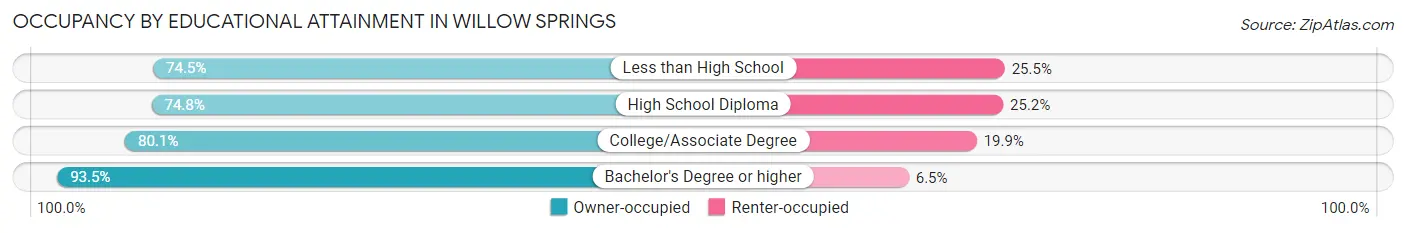
| Household Size | Owner-occupied | Renter-occupied |
| Less than High School | 76 (74.5%) | 26 (25.5%) |
| High School Diploma | 434 (74.8%) | 146 (25.2%) |
| College/Associate Degree | 667 (80.1%) | 166 (19.9%) |
| Bachelor's Degree or higher | 968 (93.5%) | 67 (6.5%) |
Occupancy by Age of Householder in Willow Springs
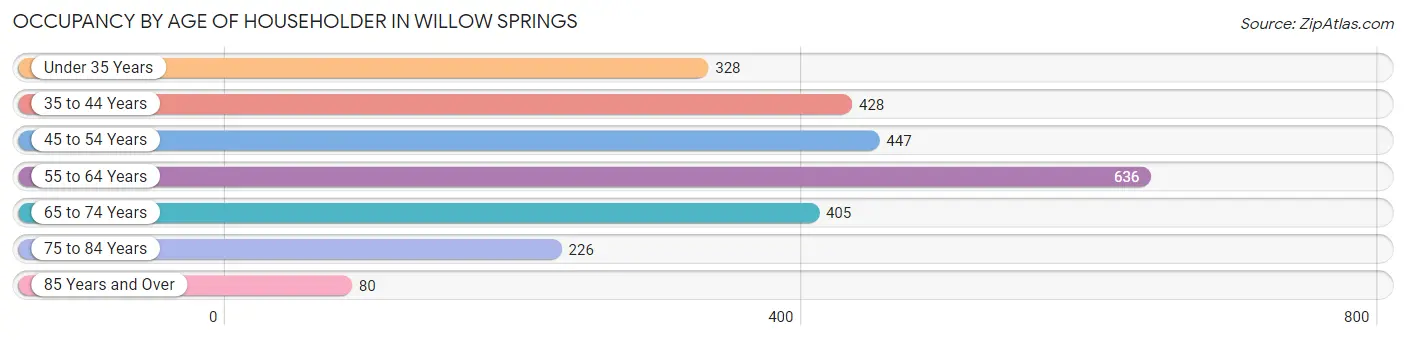
| Age Bracket | # Households | % Households |
| Under 35 Years | 328 | 12.9% |
| 35 to 44 Years | 428 | 16.8% |
| 45 to 54 Years | 447 | 17.5% |
| 55 to 64 Years | 636 | 24.9% |
| 65 to 74 Years | 405 | 15.9% |
| 75 to 84 Years | 226 | 8.9% |
| 85 Years and Over | 80 | 3.1% |
| Total | 2,550 | 100.0% |
Housing Finances in Willow Springs
Median Income by Occupancy in Willow Springs
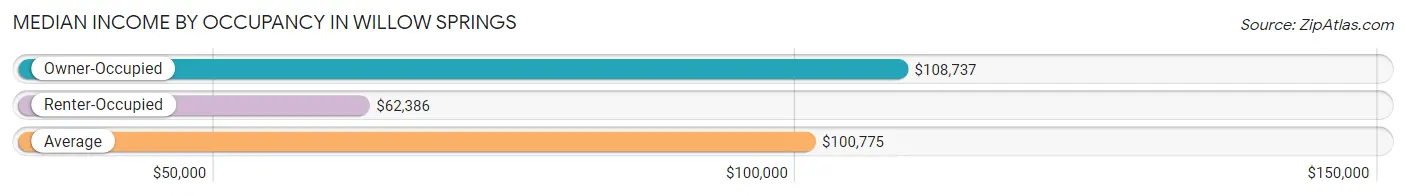
| Occupancy Type | # Households | Median Income |
| Owner-Occupied | 2,145 (84.1%) | $108,737 |
| Renter-Occupied | 405 (15.9%) | $62,386 |
| Average | 2,550 (100.0%) | $100,775 |
Occupancy by Householder Income Bracket in Willow Springs
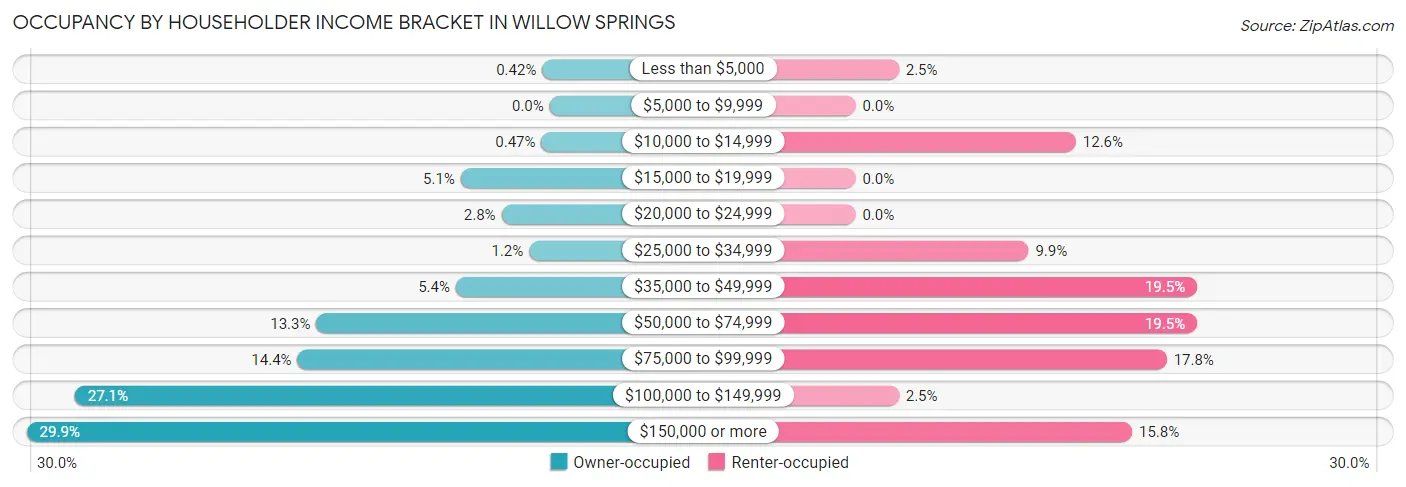
| Income Bracket | Owner-occupied | Renter-occupied |
| Less than $5,000 | 9 (0.4%) | 10 (2.5%) |
| $5,000 to $9,999 | 0 (0.0%) | 0 (0.0%) |
| $10,000 to $14,999 | 10 (0.5%) | 51 (12.6%) |
| $15,000 to $19,999 | 109 (5.1%) | 0 (0.0%) |
| $20,000 to $24,999 | 59 (2.8%) | 0 (0.0%) |
| $25,000 to $34,999 | 25 (1.2%) | 40 (9.9%) |
| $35,000 to $49,999 | 115 (5.4%) | 79 (19.5%) |
| $50,000 to $74,999 | 286 (13.3%) | 79 (19.5%) |
| $75,000 to $99,999 | 309 (14.4%) | 72 (17.8%) |
| $100,000 to $149,999 | 582 (27.1%) | 10 (2.5%) |
| $150,000 or more | 641 (29.9%) | 64 (15.8%) |
| Total | 2,145 (100.0%) | 405 (100.0%) |
Monthly Housing Cost Tiers in Willow Springs
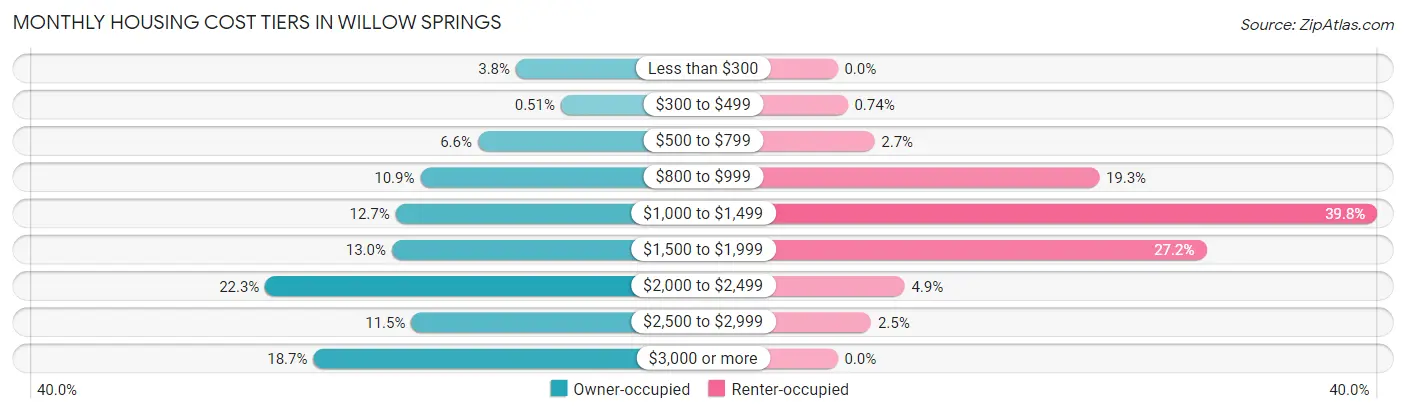
| Monthly Cost | Owner-occupied | Renter-occupied |
| Less than $300 | 82 (3.8%) | 0 (0.0%) |
| $300 to $499 | 11 (0.5%) | 3 (0.7%) |
| $500 to $799 | 142 (6.6%) | 11 (2.7%) |
| $800 to $999 | 233 (10.9%) | 78 (19.3%) |
| $1,000 to $1,499 | 272 (12.7%) | 161 (39.8%) |
| $1,500 to $1,999 | 278 (13.0%) | 110 (27.2%) |
| $2,000 to $2,499 | 478 (22.3%) | 20 (4.9%) |
| $2,500 to $2,999 | 247 (11.5%) | 10 (2.5%) |
| $3,000 or more | 402 (18.7%) | 0 (0.0%) |
| Total | 2,145 (100.0%) | 405 (100.0%) |
Physical Housing Characteristics in Willow Springs
Housing Structures in Willow Springs
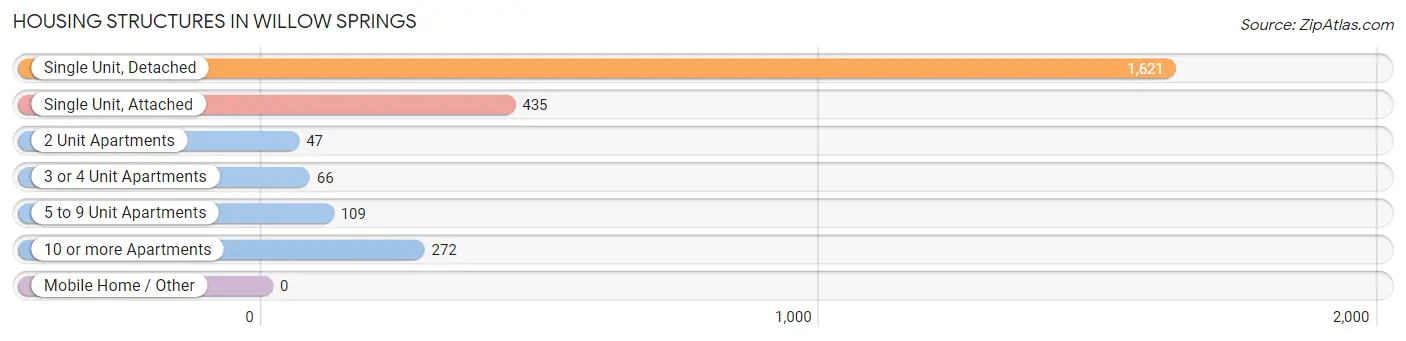
| Structure Type | # Housing Units | % Housing Units |
| Single Unit, Detached | 1,621 | 63.6% |
| Single Unit, Attached | 435 | 17.1% |
| 2 Unit Apartments | 47 | 1.8% |
| 3 or 4 Unit Apartments | 66 | 2.6% |
| 5 to 9 Unit Apartments | 109 | 4.3% |
| 10 or more Apartments | 272 | 10.7% |
| Mobile Home / Other | 0 | 0.0% |
| Total | 2,550 | 100.0% |
Housing Structures by Occupancy in Willow Springs
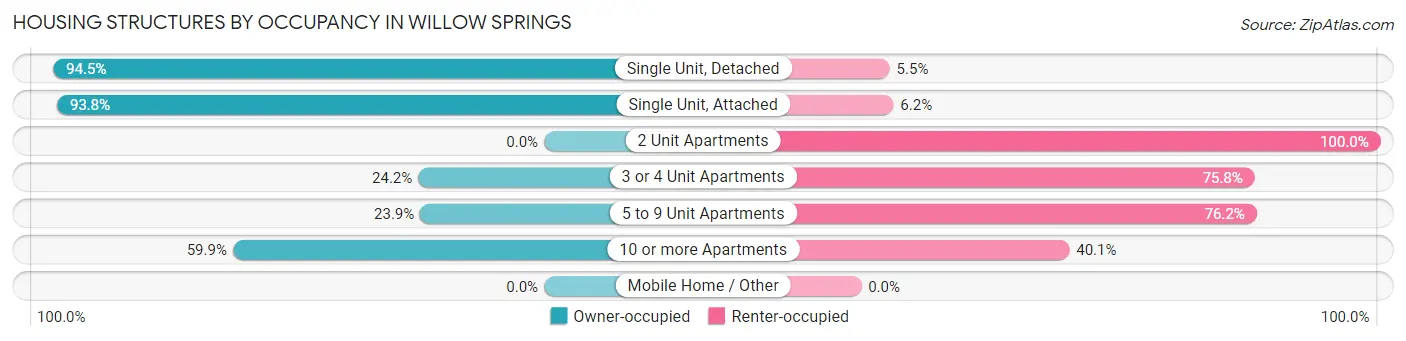
| Structure Type | Owner-occupied | Renter-occupied |
| Single Unit, Detached | 1,532 (94.5%) | 89 (5.5%) |
| Single Unit, Attached | 408 (93.8%) | 27 (6.2%) |
| 2 Unit Apartments | 0 (0.0%) | 47 (100.0%) |
| 3 or 4 Unit Apartments | 16 (24.2%) | 50 (75.8%) |
| 5 to 9 Unit Apartments | 26 (23.8%) | 83 (76.1%) |
| 10 or more Apartments | 163 (59.9%) | 109 (40.1%) |
| Mobile Home / Other | 0 (0.0%) | 0 (0.0%) |
| Total | 2,145 (84.1%) | 405 (15.9%) |
Housing Structures by Number of Rooms in Willow Springs
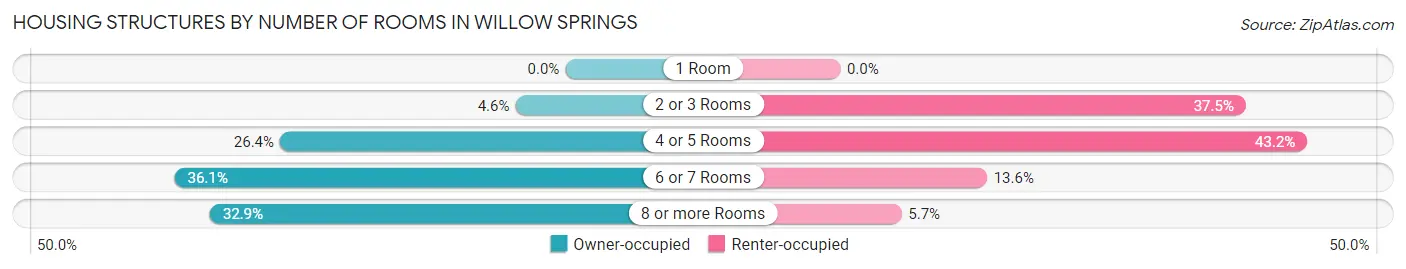
| Number of Rooms | Owner-occupied | Renter-occupied |
| 1 Room | 0 (0.0%) | 0 (0.0%) |
| 2 or 3 Rooms | 99 (4.6%) | 152 (37.5%) |
| 4 or 5 Rooms | 566 (26.4%) | 175 (43.2%) |
| 6 or 7 Rooms | 775 (36.1%) | 55 (13.6%) |
| 8 or more Rooms | 705 (32.9%) | 23 (5.7%) |
| Total | 2,145 (100.0%) | 405 (100.0%) |
Housing Structure by Heating Type in Willow Springs
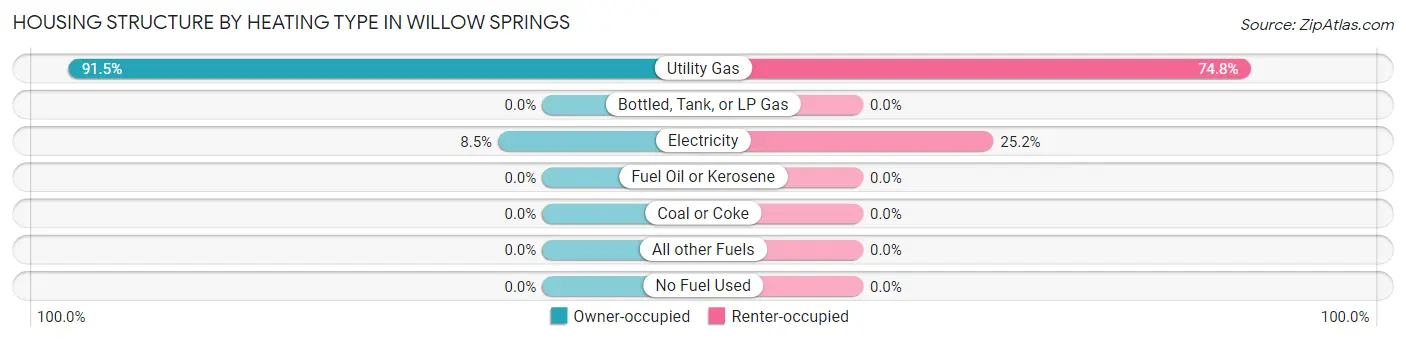
| Heating Type | Owner-occupied | Renter-occupied |
| Utility Gas | 1,962 (91.5%) | 303 (74.8%) |
| Bottled, Tank, or LP Gas | 0 (0.0%) | 0 (0.0%) |
| Electricity | 183 (8.5%) | 102 (25.2%) |
| Fuel Oil or Kerosene | 0 (0.0%) | 0 (0.0%) |
| Coal or Coke | 0 (0.0%) | 0 (0.0%) |
| All other Fuels | 0 (0.0%) | 0 (0.0%) |
| No Fuel Used | 0 (0.0%) | 0 (0.0%) |
| Total | 2,145 (100.0%) | 405 (100.0%) |
Household Vehicle Usage in Willow Springs
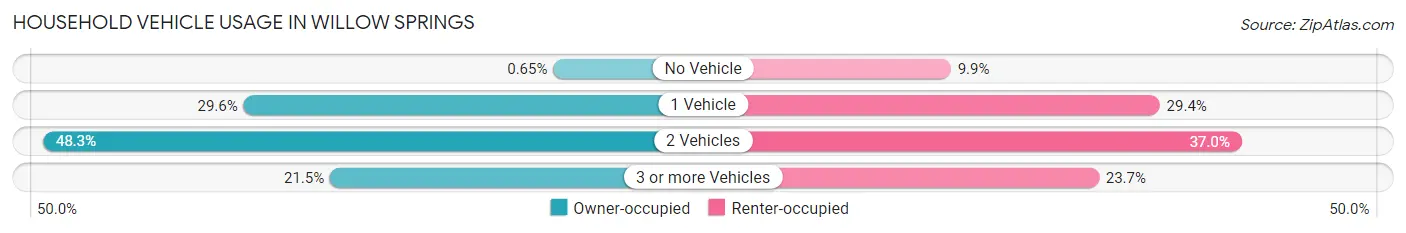
| Vehicles per Household | Owner-occupied | Renter-occupied |
| No Vehicle | 14 (0.6%) | 40 (9.9%) |
| 1 Vehicle | 634 (29.6%) | 119 (29.4%) |
| 2 Vehicles | 1,036 (48.3%) | 150 (37.0%) |
| 3 or more Vehicles | 461 (21.5%) | 96 (23.7%) |
| Total | 2,145 (100.0%) | 405 (100.0%) |
Real Estate & Mortgages in Willow Springs
Real Estate and Mortgage Overview in Willow Springs
| Characteristic | Without Mortgage | With Mortgage |
| Housing Units | 727 | 1,418 |
| Median Property Value | $333,700 | $374,900 |
| Median Household Income | $75,066 | $476 |
| Monthly Housing Costs | $943 | $396 |
| Real Estate Taxes | $7,148 | $11 |
Property Value by Mortgage Status in Willow Springs
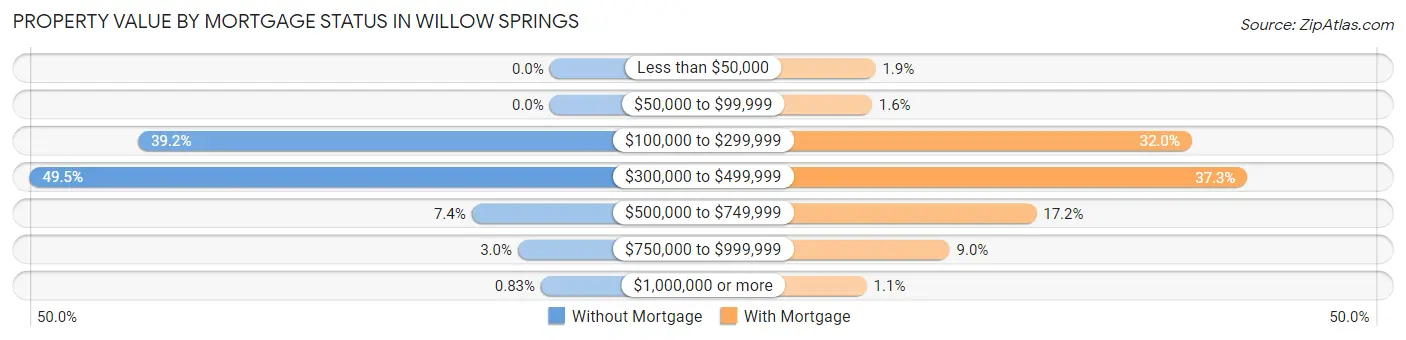
| Property Value | Without Mortgage | With Mortgage |
| Less than $50,000 | 0 (0.0%) | 27 (1.9%) |
| $50,000 to $99,999 | 0 (0.0%) | 22 (1.5%) |
| $100,000 to $299,999 | 285 (39.2%) | 454 (32.0%) |
| $300,000 to $499,999 | 360 (49.5%) | 529 (37.3%) |
| $500,000 to $749,999 | 54 (7.4%) | 244 (17.2%) |
| $750,000 to $999,999 | 22 (3.0%) | 127 (9.0%) |
| $1,000,000 or more | 6 (0.8%) | 15 (1.1%) |
| Total | 727 (100.0%) | 1,418 (100.0%) |
Household Income by Mortgage Status in Willow Springs
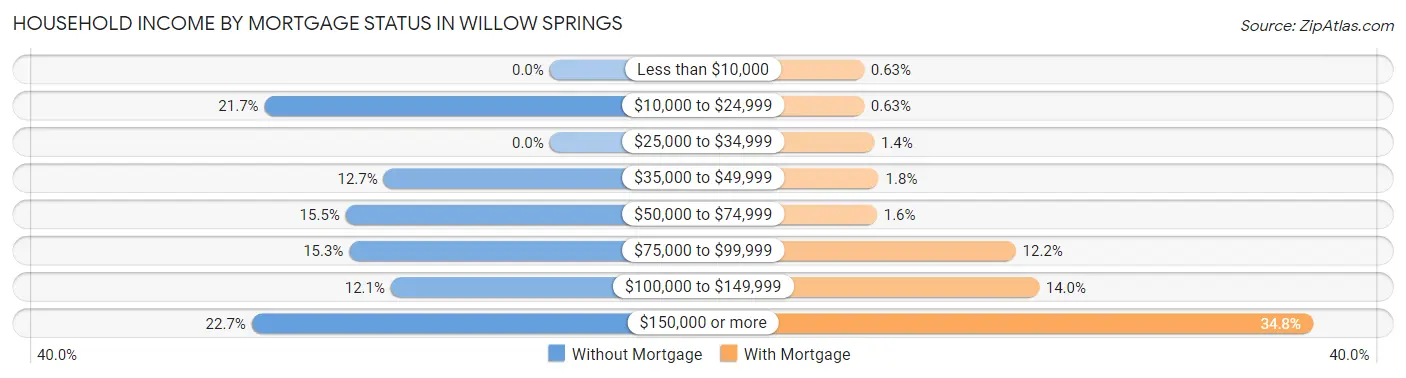
| Household Income | Without Mortgage | With Mortgage |
| Less than $10,000 | 0 (0.0%) | 9 (0.6%) |
| $10,000 to $24,999 | 158 (21.7%) | 9 (0.6%) |
| $25,000 to $34,999 | 0 (0.0%) | 20 (1.4%) |
| $35,000 to $49,999 | 92 (12.7%) | 25 (1.8%) |
| $50,000 to $74,999 | 113 (15.5%) | 23 (1.6%) |
| $75,000 to $99,999 | 111 (15.3%) | 173 (12.2%) |
| $100,000 to $149,999 | 88 (12.1%) | 198 (14.0%) |
| $150,000 or more | 165 (22.7%) | 494 (34.8%) |
| Total | 727 (100.0%) | 1,418 (100.0%) |
Property Value to Household Income Ratio in Willow Springs
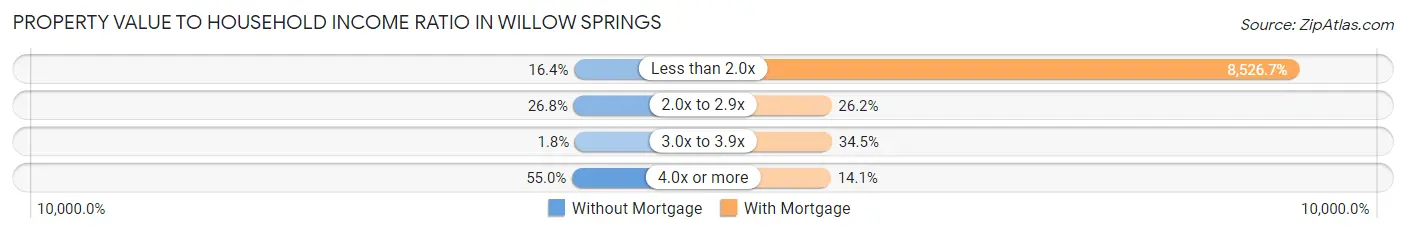
| Value-to-Income Ratio | Without Mortgage | With Mortgage |
| Less than 2.0x | 119 (16.4%) | 120,909 (8,526.7%) |
| 2.0x to 2.9x | 195 (26.8%) | 372 (26.2%) |
| 3.0x to 3.9x | 13 (1.8%) | 489 (34.5%) |
| 4.0x or more | 400 (55.0%) | 200 (14.1%) |
| Total | 727 (100.0%) | 1,418 (100.0%) |
Real Estate Taxes by Mortgage Status in Willow Springs
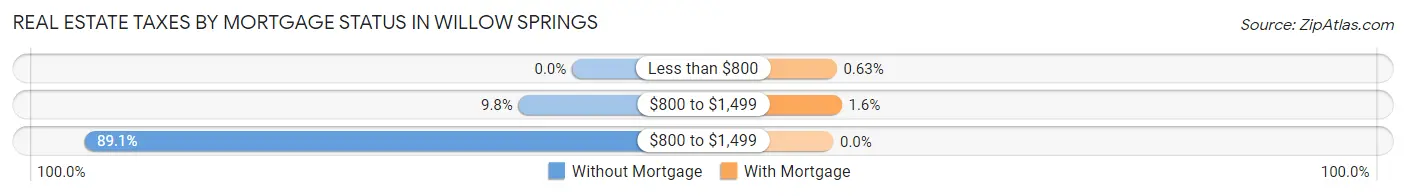
| Property Taxes | Without Mortgage | With Mortgage |
| Less than $800 | 0 (0.0%) | 9 (0.6%) |
| $800 to $1,499 | 71 (9.8%) | 22 (1.5%) |
| $800 to $1,499 | 648 (89.1%) | 0 (0.0%) |
| Total | 727 (100.0%) | 1,418 (100.0%) |
Health & Disability in Willow Springs
Health Insurance Coverage by Age in Willow Springs
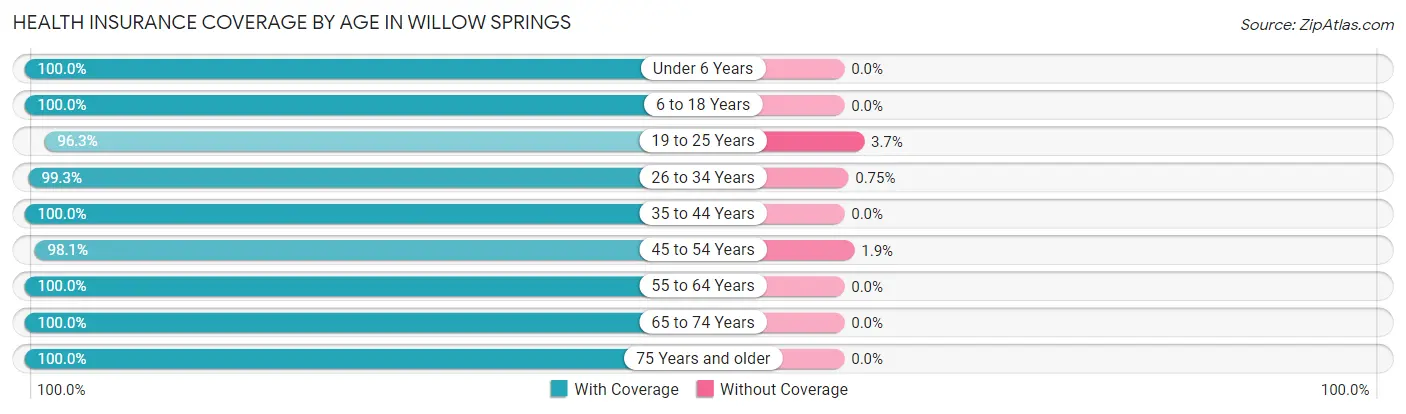
| Age Bracket | With Coverage | Without Coverage |
| Under 6 Years | 129 (100.0%) | 0 (0.0%) |
| 6 to 18 Years | 1,014 (100.0%) | 0 (0.0%) |
| 19 to 25 Years | 288 (96.3%) | 11 (3.7%) |
| 26 to 34 Years | 532 (99.3%) | 4 (0.7%) |
| 35 to 44 Years | 857 (100.0%) | 0 (0.0%) |
| 45 to 54 Years | 838 (98.1%) | 16 (1.9%) |
| 55 to 64 Years | 941 (100.0%) | 0 (0.0%) |
| 65 to 74 Years | 766 (100.0%) | 0 (0.0%) |
| 75 Years and older | 466 (100.0%) | 0 (0.0%) |
| Total | 5,831 (99.5%) | 31 (0.5%) |
Health Insurance Coverage by Citizenship Status in Willow Springs
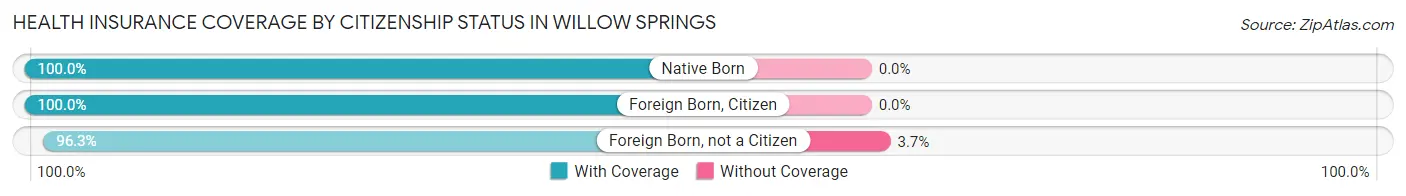
| Citizenship Status | With Coverage | Without Coverage |
| Native Born | 129 (100.0%) | 0 (0.0%) |
| Foreign Born, Citizen | 1,014 (100.0%) | 0 (0.0%) |
| Foreign Born, not a Citizen | 288 (96.3%) | 11 (3.7%) |
Health Insurance Coverage by Household Income in Willow Springs
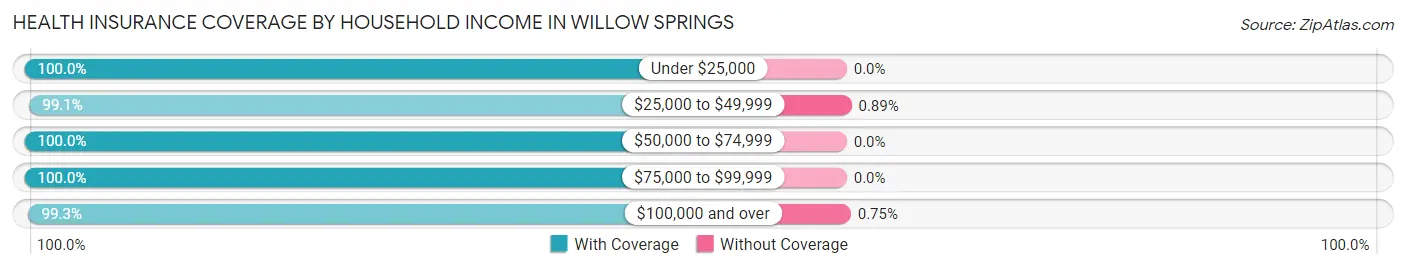
| Household Income | With Coverage | Without Coverage |
| Under $25,000 | 360 (100.0%) | 0 (0.0%) |
| $25,000 to $49,999 | 443 (99.1%) | 4 (0.9%) |
| $50,000 to $74,999 | 686 (100.0%) | 0 (0.0%) |
| $75,000 to $99,999 | 767 (100.0%) | 0 (0.0%) |
| $100,000 and over | 3,575 (99.3%) | 27 (0.7%) |
Public vs Private Health Insurance Coverage by Age in Willow Springs
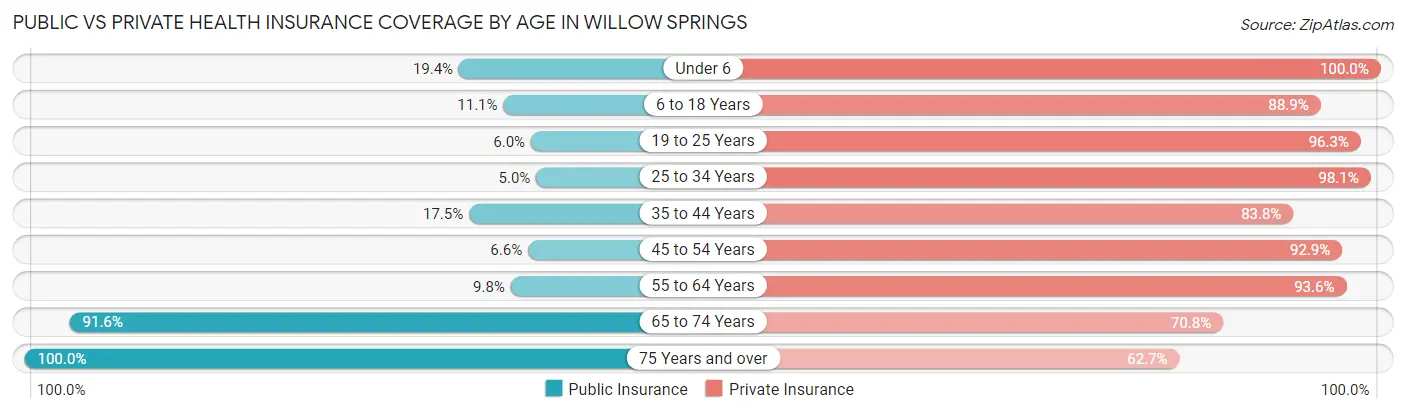
| Age Bracket | Public Insurance | Private Insurance |
| Under 6 | 25 (19.4%) | 129 (100.0%) |
| 6 to 18 Years | 113 (11.1%) | 901 (88.9%) |
| 19 to 25 Years | 18 (6.0%) | 288 (96.3%) |
| 25 to 34 Years | 27 (5.0%) | 526 (98.1%) |
| 35 to 44 Years | 150 (17.5%) | 718 (83.8%) |
| 45 to 54 Years | 56 (6.6%) | 793 (92.9%) |
| 55 to 64 Years | 92 (9.8%) | 881 (93.6%) |
| 65 to 74 Years | 702 (91.6%) | 542 (70.8%) |
| 75 Years and over | 466 (100.0%) | 292 (62.7%) |
| Total | 1,649 (28.1%) | 5,070 (86.5%) |
Disability Status by Sex by Age in Willow Springs
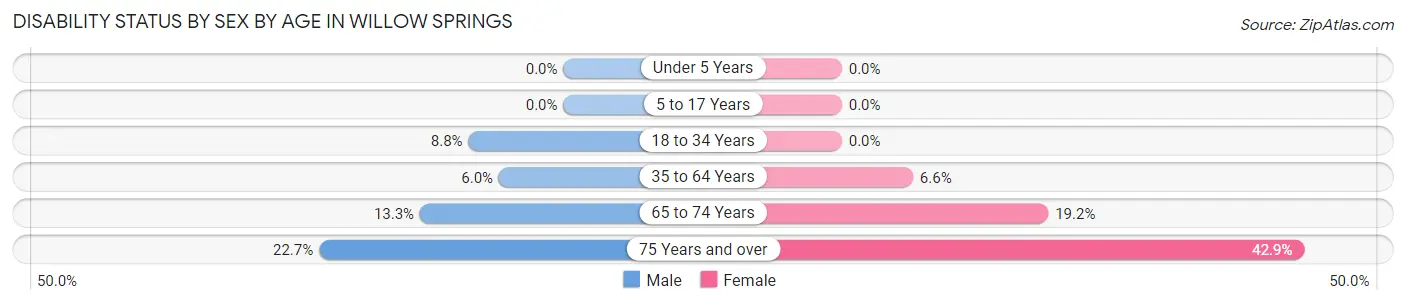
| Age Bracket | Male | Female |
| Under 5 Years | 0 (0.0%) | 0 (0.0%) |
| 5 to 17 Years | 0 (0.0%) | 0 (0.0%) |
| 18 to 34 Years | 45 (8.8%) | 0 (0.0%) |
| 35 to 64 Years | 77 (6.0%) | 90 (6.6%) |
| 65 to 74 Years | 45 (13.3%) | 82 (19.2%) |
| 75 Years and over | 56 (22.7%) | 94 (42.9%) |
Disability Class by Sex by Age in Willow Springs
Disability Class: Hearing Difficulty
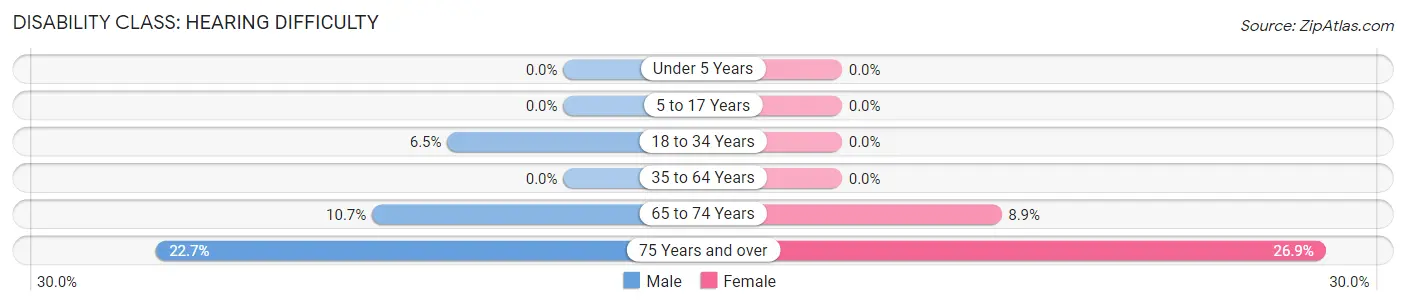
| Age Bracket | Male | Female |
| Under 5 Years | 0 (0.0%) | 0 (0.0%) |
| 5 to 17 Years | 0 (0.0%) | 0 (0.0%) |
| 18 to 34 Years | 33 (6.5%) | 0 (0.0%) |
| 35 to 64 Years | 0 (0.0%) | 0 (0.0%) |
| 65 to 74 Years | 36 (10.6%) | 38 (8.9%) |
| 75 Years and over | 56 (22.7%) | 59 (26.9%) |
Disability Class: Vision Difficulty
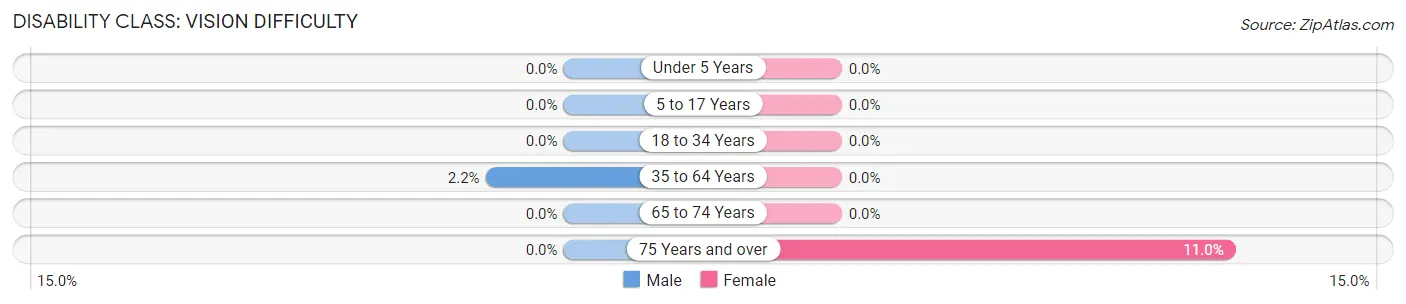
| Age Bracket | Male | Female |
| Under 5 Years | 0 (0.0%) | 0 (0.0%) |
| 5 to 17 Years | 0 (0.0%) | 0 (0.0%) |
| 18 to 34 Years | 0 (0.0%) | 0 (0.0%) |
| 35 to 64 Years | 28 (2.2%) | 0 (0.0%) |
| 65 to 74 Years | 0 (0.0%) | 0 (0.0%) |
| 75 Years and over | 0 (0.0%) | 24 (11.0%) |
Disability Class: Cognitive Difficulty
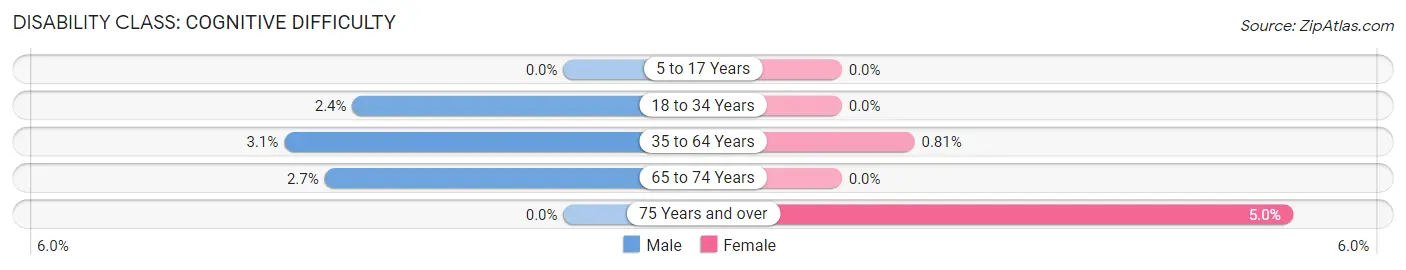
| Age Bracket | Male | Female |
| 5 to 17 Years | 0 (0.0%) | 0 (0.0%) |
| 18 to 34 Years | 12 (2.4%) | 0 (0.0%) |
| 35 to 64 Years | 40 (3.1%) | 11 (0.8%) |
| 65 to 74 Years | 9 (2.7%) | 0 (0.0%) |
| 75 Years and over | 0 (0.0%) | 11 (5.0%) |
Disability Class: Ambulatory Difficulty
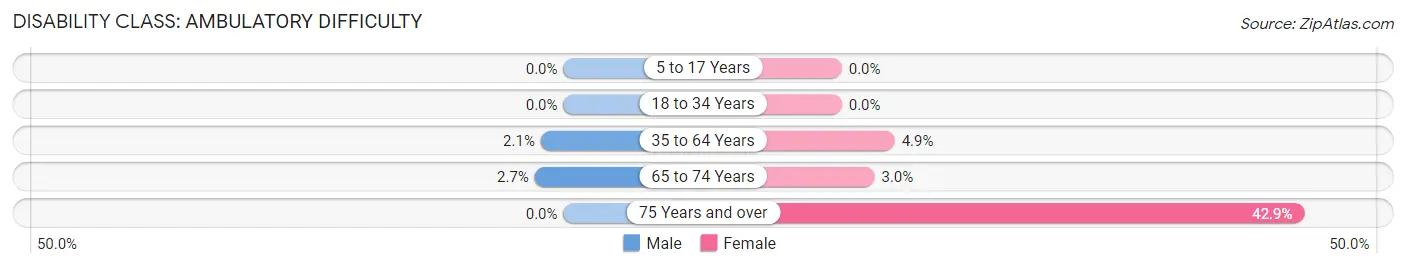
| Age Bracket | Male | Female |
| 5 to 17 Years | 0 (0.0%) | 0 (0.0%) |
| 18 to 34 Years | 0 (0.0%) | 0 (0.0%) |
| 35 to 64 Years | 27 (2.1%) | 67 (4.9%) |
| 65 to 74 Years | 9 (2.7%) | 13 (3.0%) |
| 75 Years and over | 0 (0.0%) | 94 (42.9%) |
Disability Class: Self-Care Difficulty
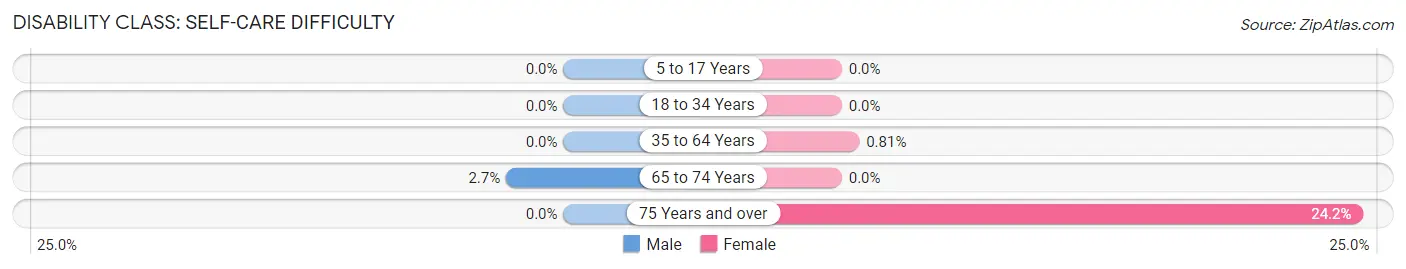
| Age Bracket | Male | Female |
| 5 to 17 Years | 0 (0.0%) | 0 (0.0%) |
| 18 to 34 Years | 0 (0.0%) | 0 (0.0%) |
| 35 to 64 Years | 0 (0.0%) | 11 (0.8%) |
| 65 to 74 Years | 9 (2.7%) | 0 (0.0%) |
| 75 Years and over | 0 (0.0%) | 53 (24.2%) |
Technology Access in Willow Springs
Computing Device Access in Willow Springs
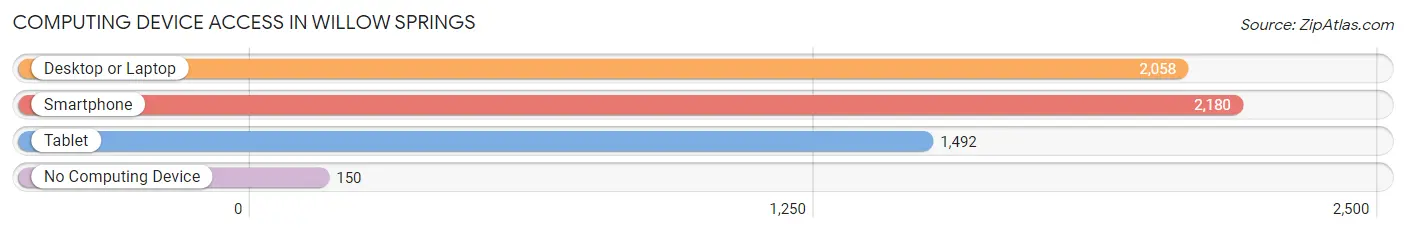
| Device Type | # Households | % Households |
| Desktop or Laptop | 2,058 | 80.7% |
| Smartphone | 2,180 | 85.5% |
| Tablet | 1,492 | 58.5% |
| No Computing Device | 150 | 5.9% |
| Total | 2,550 | 100.0% |
Internet Access in Willow Springs
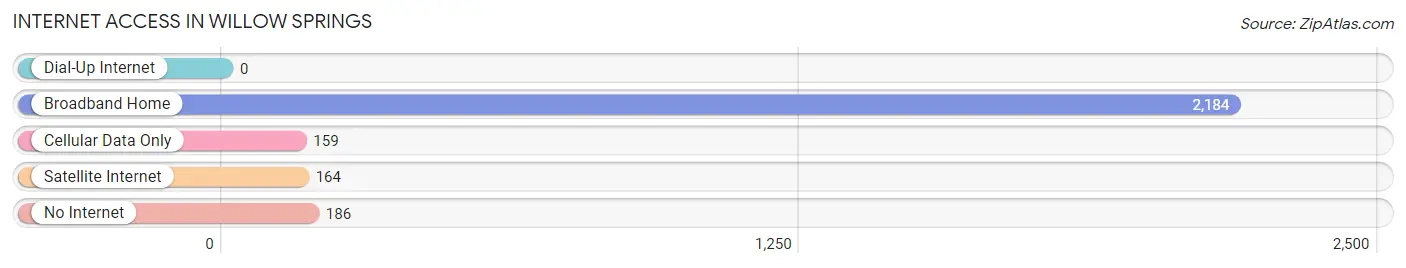
| Internet Type | # Households | % Households |
| Dial-Up Internet | 0 | 0.0% |
| Broadband Home | 2,184 | 85.7% |
| Cellular Data Only | 159 | 6.2% |
| Satellite Internet | 164 | 6.4% |
| No Internet | 186 | 7.3% |
| Total | 2,550 | 100.0% |
Willow Springs Summary
Willow Springs is a village located in Cook County, Illinois, United States. It is a suburb of Chicago, located approximately 25 miles southwest of the city. The population was 5,524 at the 2010 census.
History
Willow Springs was first settled in the 1830s by a group of German immigrants. The village was originally known as “Willow Creek” and was incorporated in 1892. The name was changed to Willow Springs in 1895.
The village was home to a number of industries, including a brickyard, a coal mine, and a quarry. The village was also home to a number of farms, which provided food for the local population.
In the early 20th century, the village was home to a number of resorts, including the Willow Springs Hotel, which was a popular destination for Chicagoans looking to escape the city. The hotel was destroyed by a fire in the 1950s.
Geography
Willow Springs is located at 41°44′N 87°48′W (41.735, -87.800). According to the 2010 census, the village has a total area of 4.2 square miles (10.8 km2), all land.
The village is located in the western suburbs of Chicago, and is bordered by the villages of Burr Ridge, Hodgkins, Indian Head Park, and La Grange Park.
Economy
Willow Springs is home to a number of businesses, including a number of restaurants, retail stores, and professional services. The village is also home to a number of industrial and manufacturing businesses.
The village is home to a number of parks, including the Willow Springs Park District, which offers a variety of recreational activities, including swimming, tennis, and golf.
Demographics
As of the 2010 census, the village had a population of 5,524. The racial makeup of the village was 94.2% White, 0.7% African American, 0.2% Native American, 1.7% Asian, 0.1% Pacific Islander, 1.7% from other races, and 1.5% from two or more races. Hispanic or Latino of any race were 5.2% of the population.
The median income for a household in the village was $68,958, and the median income for a family was $77,917. The per capita income for the village was $30,945. About 3.2% of families and 4.2% of the population were below the poverty line, including 5.2% of those under age 18 and 4.2% of those age 65 or over.
Common Questions
What is Per Capita Income in Willow Springs?
Per Capita income in Willow Springs is $58,433.
What is the Median Family Income in Willow Springs?
Median Family Income in Willow Springs is $109,758.
What is the Median Household income in Willow Springs?
Median Household Income in Willow Springs is $100,775.
What is Income or Wage Gap in Willow Springs?
Income or Wage Gap in Willow Springs is 19.1%.
Women in Willow Springs earn 80.9 cents for every dollar earned by a man.
What is Inequality or Gini Index in Willow Springs?
Inequality or Gini Index in Willow Springs is 0.42.
What is the Total Population of Willow Springs?
Total Population of Willow Springs is 5,862.
What is the Total Male Population of Willow Springs?
Total Male Population of Willow Springs is 2,958.
What is the Total Female Population of Willow Springs?
Total Female Population of Willow Springs is 2,904.
What is the Ratio of Males per 100 Females in Willow Springs?
There are 101.86 Males per 100 Females in Willow Springs.
What is the Ratio of Females per 100 Males in Willow Springs?
There are 98.17 Females per 100 Males in Willow Springs.
What is the Median Population Age in Willow Springs?
Median Population Age in Willow Springs is 45.7 Years.
What is the Average Family Size in Willow Springs
Average Family Size in Willow Springs is 2.9 People.
What is the Average Household Size in Willow Springs
Average Household Size in Willow Springs is 2.3 People.
How Large is the Labor Force in Willow Springs?
There are 3,233 People in the Labor Forcein in Willow Springs.
What is the Percentage of People in the Labor Force in Willow Springs?
64.5% of People are in the Labor Force in Willow Springs.
What is the Unemployment Rate in Willow Springs?
Unemployment Rate in Willow Springs is 4.7%.