Crownsville, MD Map & Demographics
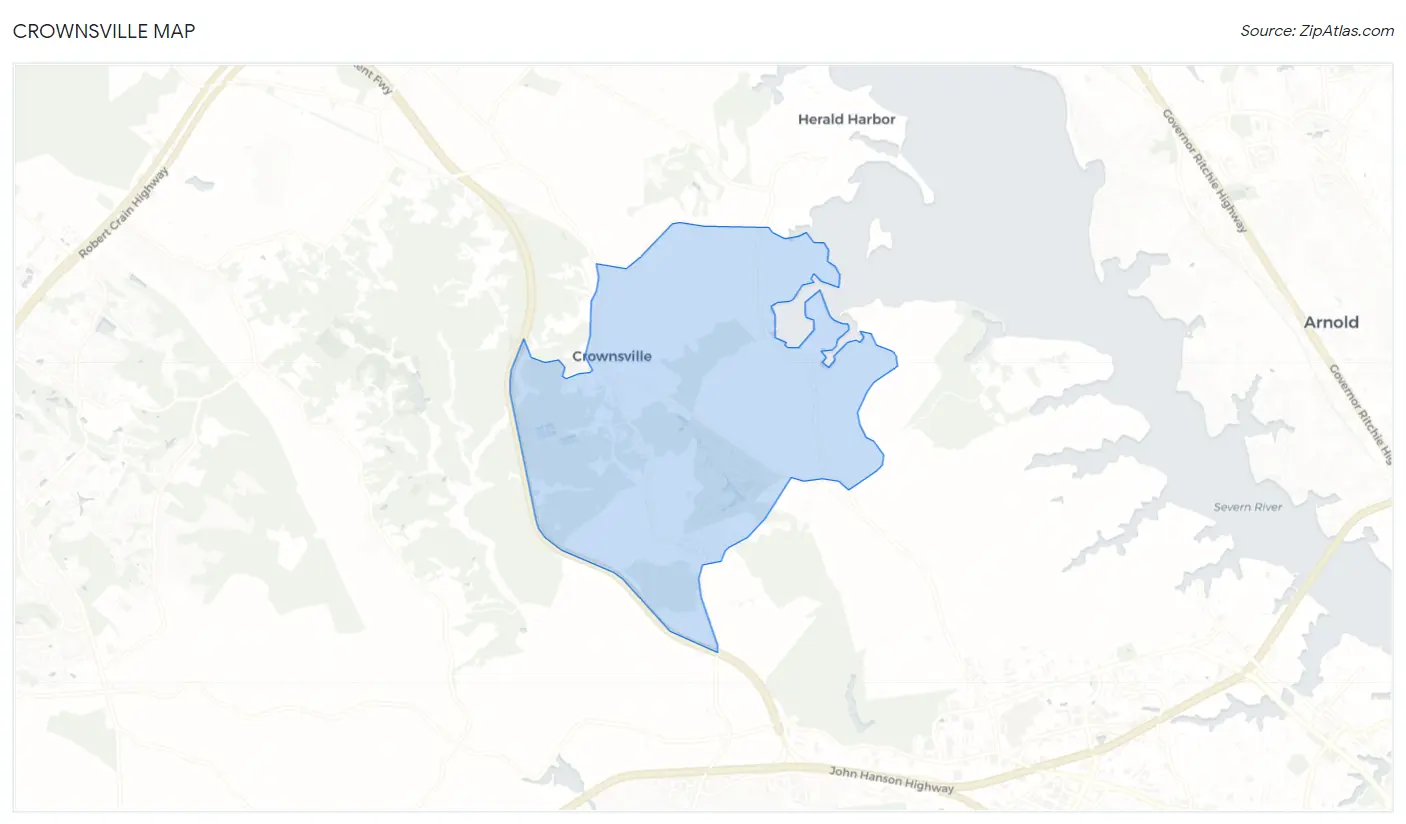
Crownsville Map
Crownsville Overview
$55,236
PER CAPITA INCOME
$134,565
AVG FAMILY INCOME
$112,411
AVG HOUSEHOLD INCOME
0.38
INEQUALITY / GINI INDEX
1,363
TOTAL POPULATION
633
MALE POPULATION
730
FEMALE POPULATION
86.71
MALES / 100 FEMALES
115.32
FEMALES / 100 MALES
58.9
MEDIAN AGE
2.7
AVG FAMILY SIZE
2.4
AVG HOUSEHOLD SIZE
581
LABOR FORCE [ PEOPLE ]
48.7%
PERCENT IN LABOR FORCE
3.4%
UNEMPLOYMENT RATE
Crownsville Zip Codes
Crownsville Area Codes
Income in Crownsville
Income Overview in Crownsville
Per Capita Income in Crownsville is $55,236, while median incomes of families and households are $134,565 and $112,411 respectively.
| Characteristic | Number | Measure |
| Per Capita Income | 1,363 | $55,236 |
| Median Family Income | 396 | $134,565 |
| Mean Family Income | 396 | $161,471 |
| Median Household Income | 503 | $112,411 |
| Mean Household Income | 503 | $150,837 |
| Income Deficit | 396 | $0 |
| Wage / Income Gap (%) | 1,363 | 0.00% |
| Wage / Income Gap ($) | 1,363 | 100.00¢ per $1 |
| Gini / Inequality Index | 1,363 | 0.38 |
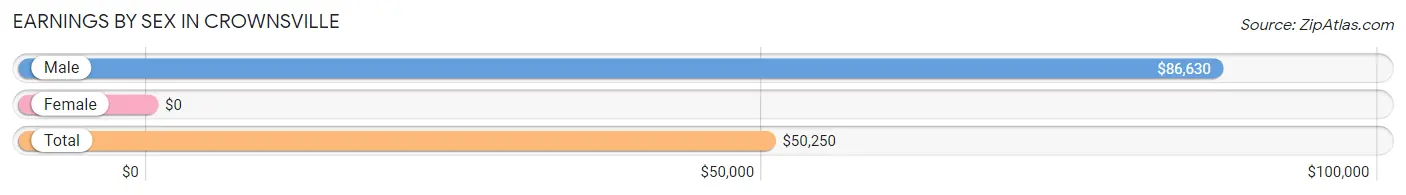
Earnings by Sex in Crownsville
| Sex | Number | Average Earnings |
| Male | 302 (48.9%) | $86,630 |
| Female | 315 (51.0%) | $0 |
| Total | 617 (100.0%) | $50,250 |
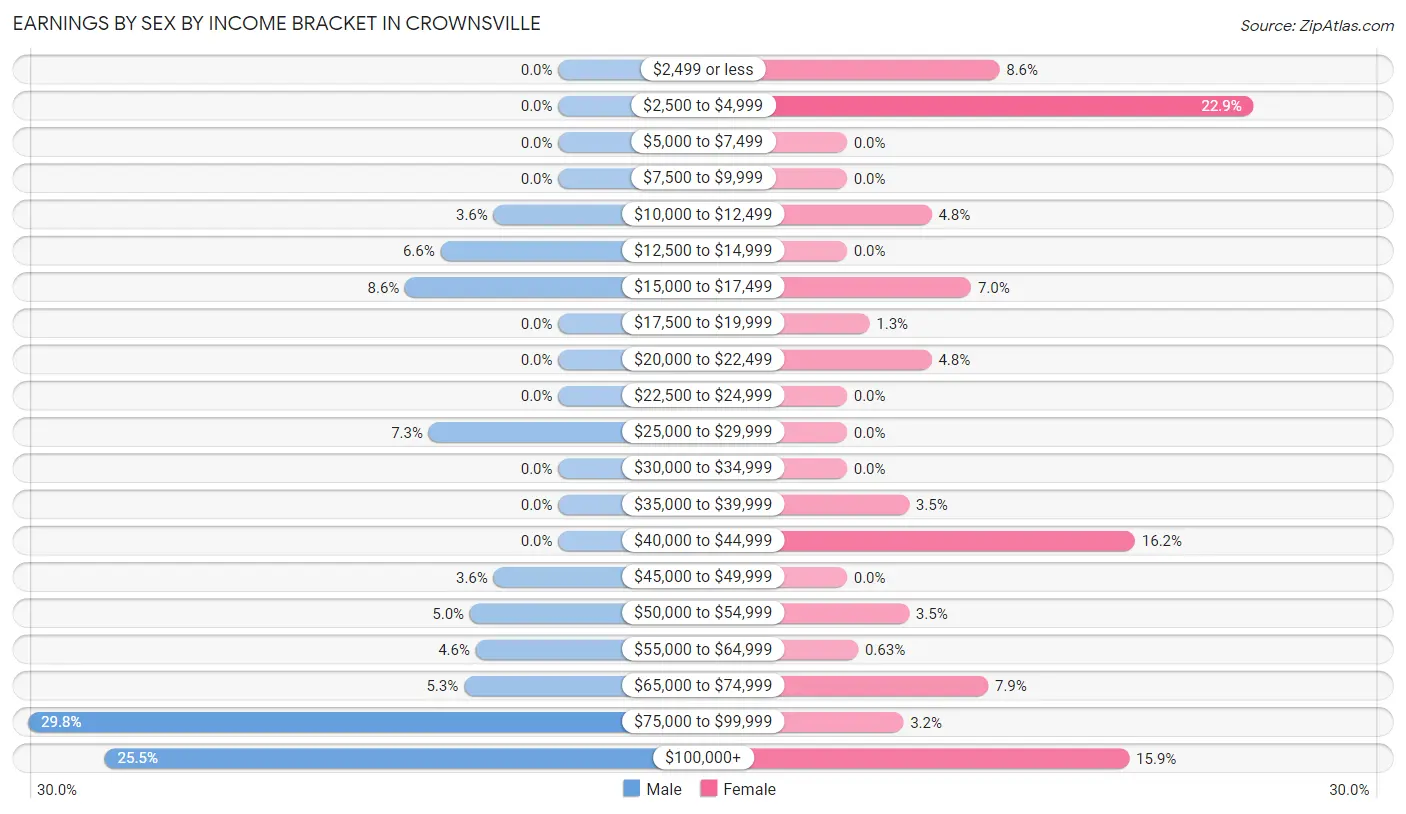
Earnings by Sex by Income Bracket in Crownsville
The most common earnings brackets in Crownsville are $75,000 to $99,999 for men (90 | 29.8%) and $2,500 to $4,999 for women (72 | 22.9%).
| Income | Male | Female |
| $2,499 or less | 0 (0.0%) | 27 (8.6%) |
| $2,500 to $4,999 | 0 (0.0%) | 72 (22.9%) |
| $5,000 to $7,499 | 0 (0.0%) | 0 (0.0%) |
| $7,500 to $9,999 | 0 (0.0%) | 0 (0.0%) |
| $10,000 to $12,499 | 11 (3.6%) | 15 (4.8%) |
| $12,500 to $14,999 | 20 (6.6%) | 0 (0.0%) |
| $15,000 to $17,499 | 26 (8.6%) | 22 (7.0%) |
| $17,500 to $19,999 | 0 (0.0%) | 4 (1.3%) |
| $20,000 to $22,499 | 0 (0.0%) | 15 (4.8%) |
| $22,500 to $24,999 | 0 (0.0%) | 0 (0.0%) |
| $25,000 to $29,999 | 22 (7.3%) | 0 (0.0%) |
| $30,000 to $34,999 | 0 (0.0%) | 0 (0.0%) |
| $35,000 to $39,999 | 0 (0.0%) | 11 (3.5%) |
| $40,000 to $44,999 | 0 (0.0%) | 51 (16.2%) |
| $45,000 to $49,999 | 11 (3.6%) | 0 (0.0%) |
| $50,000 to $54,999 | 15 (5.0%) | 11 (3.5%) |
| $55,000 to $64,999 | 14 (4.6%) | 2 (0.6%) |
| $65,000 to $74,999 | 16 (5.3%) | 25 (7.9%) |
| $75,000 to $99,999 | 90 (29.8%) | 10 (3.2%) |
| $100,000+ | 77 (25.5%) | 50 (15.9%) |
| Total | 302 (100.0%) | 315 (100.0%) |
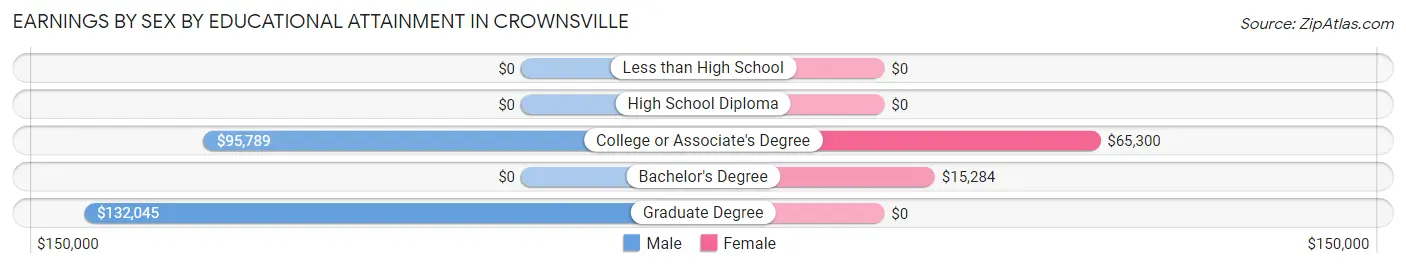
Earnings by Sex by Educational Attainment in Crownsville
Average earnings in Crownsville are $92,946 for men and $40,893 for women, a difference of 56.0%. Men with an educational attainment of graduate degree enjoy the highest average annual earnings of $132,045, while those with college or associate's degree education earn the least with $95,789. Women with an educational attainment of college or associate's degree earn the most with the average annual earnings of $65,300, while those with bachelor's degree education have the smallest earnings of $15,284.
| Educational Attainment | Male Income | Female Income |
| Less than High School | - | - |
| High School Diploma | - | - |
| College or Associate's Degree | $95,789 | $65,300 |
| Bachelor's Degree | - | - |
| Graduate Degree | $132,045 | $0 |
| Total | $92,946 | $40,893 |
Family Income in Crownsville
Family Income Brackets in Crownsville
According to the Crownsville family income data, there are 141 families falling into the $200,000+ income range, which is the most common income bracket and makes up 35.6% of all families.
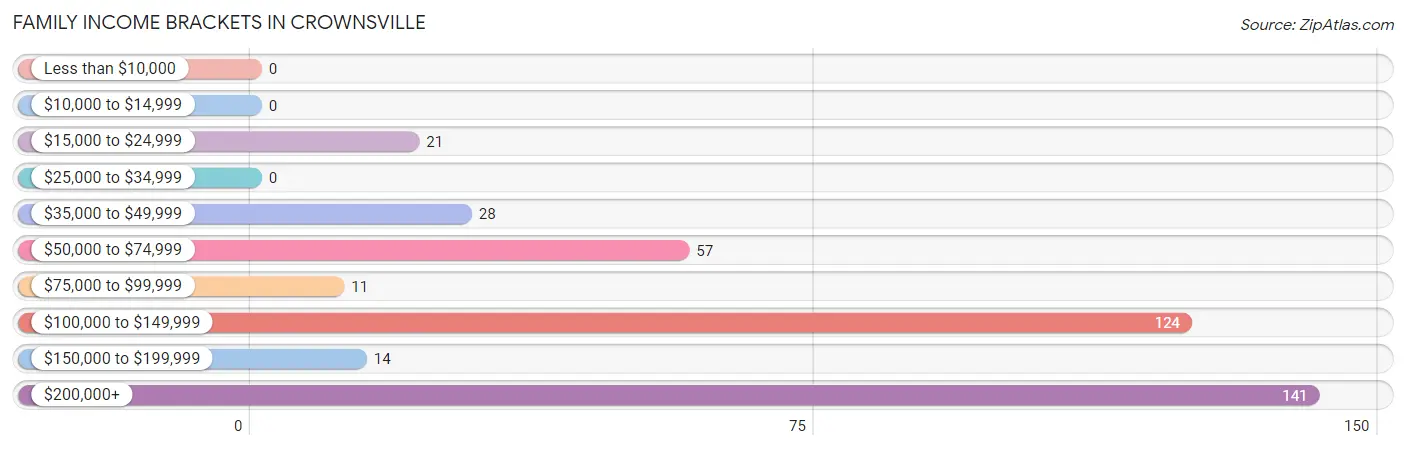
| Income Bracket | # Families | % Families |
| Less than $10,000 | 0 | 0.0% |
| $10,000 to $14,999 | 0 | 0.0% |
| $15,000 to $24,999 | 21 | 5.3% |
| $25,000 to $34,999 | 0 | 0.0% |
| $35,000 to $49,999 | 28 | 7.1% |
| $50,000 to $74,999 | 57 | 14.4% |
| $75,000 to $99,999 | 11 | 2.8% |
| $100,000 to $149,999 | 124 | 31.3% |
| $150,000 to $199,999 | 14 | 3.5% |
| $200,000+ | 141 | 35.6% |
Family Income by Famaliy Size in Crownsville
4-person families (95 | 24.0%) account for the highest median family income in Crownsville with $211,319 per family, while 2-person families (256 | 64.6%) have the highest median income of $53,581 per family member.
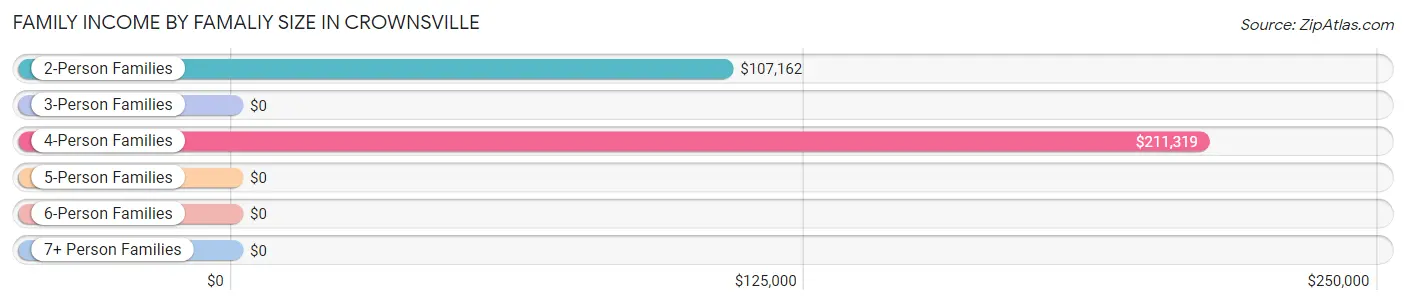
| Income Bracket | # Families | Median Income |
| 2-Person Families | 256 (64.6%) | $107,162 |
| 3-Person Families | 21 (5.3%) | $0 |
| 4-Person Families | 95 (24.0%) | $211,319 |
| 5-Person Families | 23 (5.8%) | $0 |
| 6-Person Families | 0 (0.0%) | $0 |
| 7+ Person Families | 1 (0.3%) | $0 |
| Total | 396 (100.0%) | $134,565 |
Family Income by Number of Earners in Crownsville
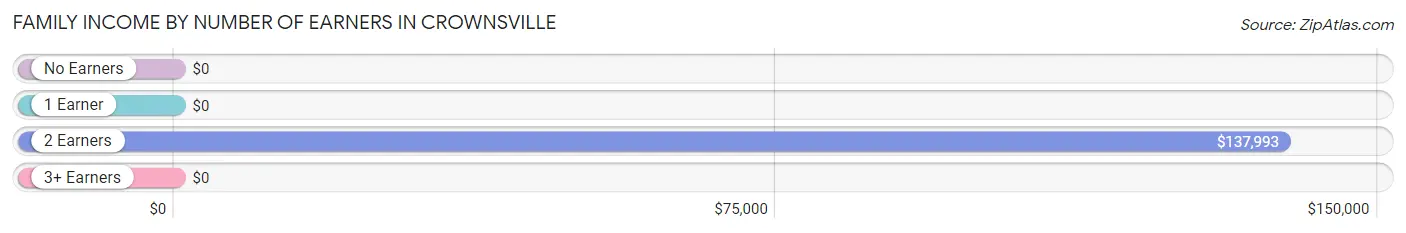
| Number of Earners | # Families | Median Income |
| No Earners | 131 (33.1%) | $0 |
| 1 Earner | 65 (16.4%) | $0 |
| 2 Earners | 149 (37.6%) | $137,993 |
| 3+ Earners | 51 (12.9%) | $0 |
| Total | 396 (100.0%) | $134,565 |
Household Income in Crownsville
Household Income Brackets in Crownsville
With 152 households falling in the category, the $200,000+ income range is the most frequent in Crownsville, accounting for 30.2% of all households.
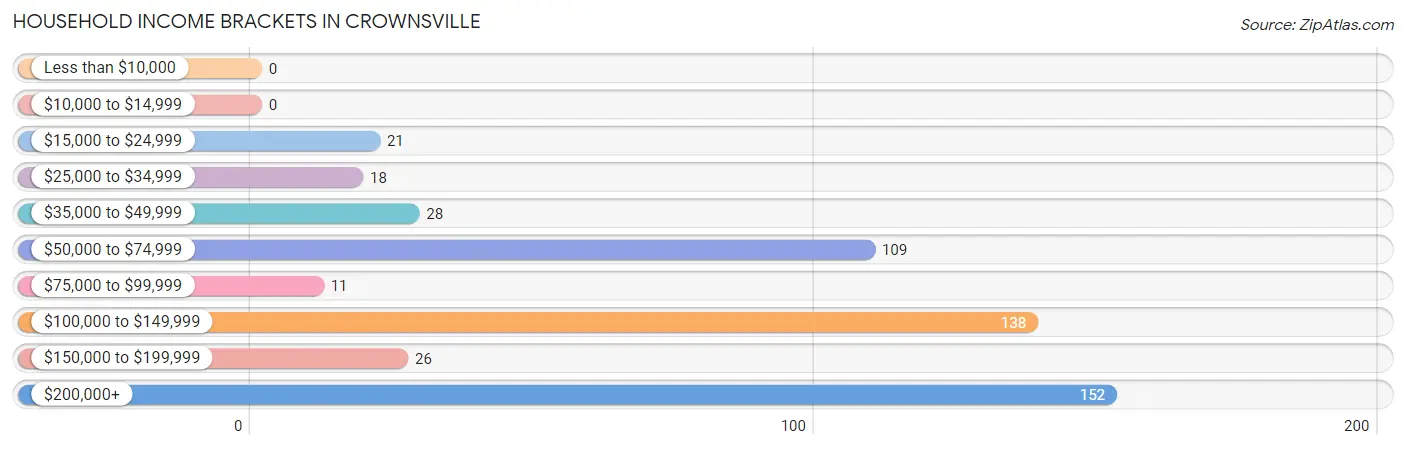
| Income Bracket | # Households | % Households |
| Less than $10,000 | 0 | 0.0% |
| $10,000 to $14,999 | 0 | 0.0% |
| $15,000 to $24,999 | 21 | 4.2% |
| $25,000 to $34,999 | 18 | 3.6% |
| $35,000 to $49,999 | 28 | 5.6% |
| $50,000 to $74,999 | 109 | 21.7% |
| $75,000 to $99,999 | 11 | 2.2% |
| $100,000 to $149,999 | 138 | 27.4% |
| $150,000 to $199,999 | 26 | 5.2% |
| $200,000+ | 152 | 30.2% |
Household Income by Householder Age in Crownsville
The median household income in Crownsville is $112,411, with the highest median household income of $133,641 found in the 45 to 64 years age bracket for the primary householder. A total of 219 households (43.5%) fall into this category.
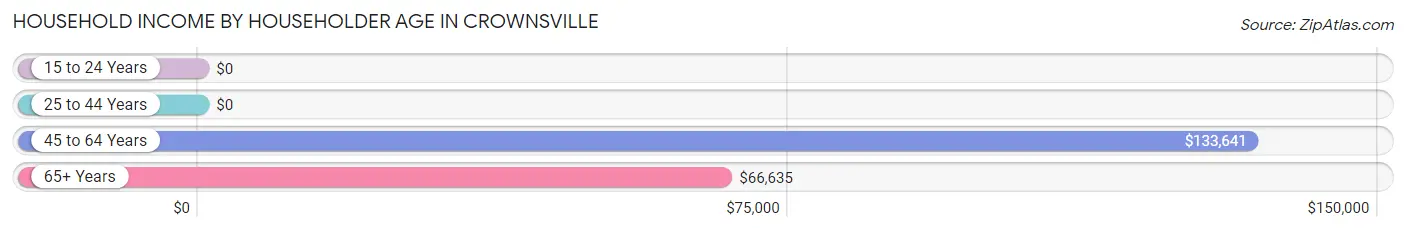
| Income Bracket | # Households | Median Income |
| 15 to 24 Years | 0 (0.0%) | $0 |
| 25 to 44 Years | 67 (13.3%) | $0 |
| 45 to 64 Years | 219 (43.5%) | $133,641 |
| 65+ Years | 217 (43.1%) | $66,635 |
| Total | 503 (100.0%) | $112,411 |
Poverty in Crownsville
Income Below Poverty by Sex and Age in Crownsville
With 13.7% poverty level for males and 7.4% for females among the residents of Crownsville, 25 to 34 year old males and 25 to 34 year old females are the most vulnerable to poverty, with 23 males (100.0%) and 17 females (37.8%) in their respective age groups living below the poverty level.
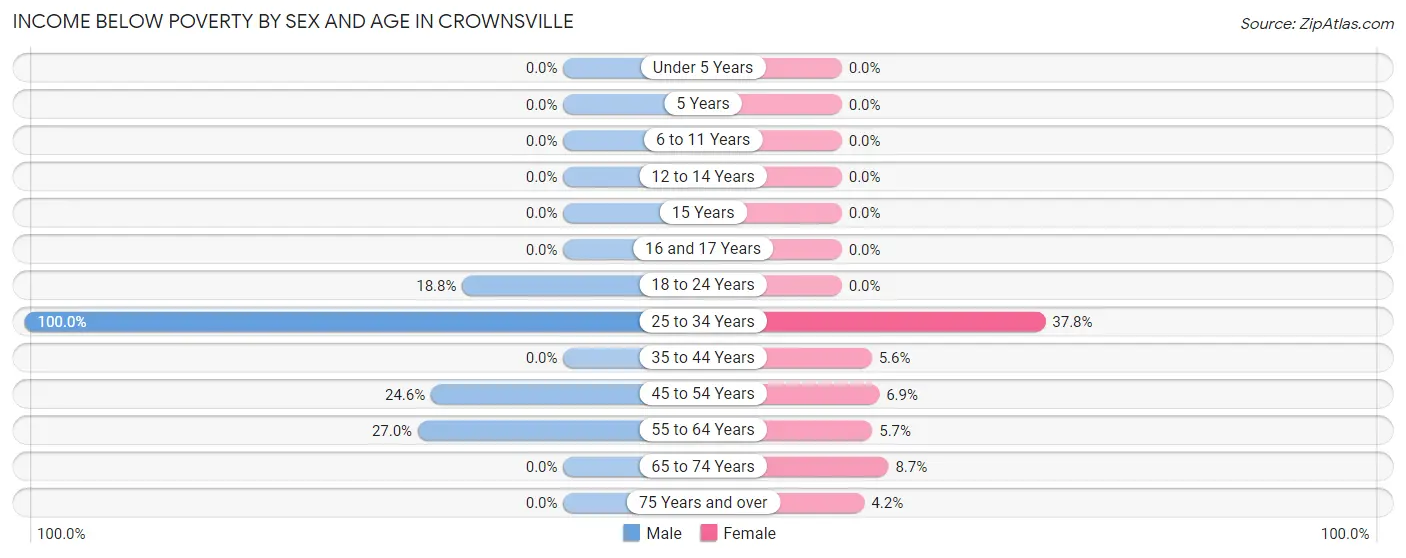
| Age Bracket | Male | Female |
| Under 5 Years | 0 (0.0%) | 0 (0.0%) |
| 5 Years | 0 (0.0%) | 0 (0.0%) |
| 6 to 11 Years | 0 (0.0%) | 0 (0.0%) |
| 12 to 14 Years | 0 (0.0%) | 0 (0.0%) |
| 15 Years | 0 (0.0%) | 0 (0.0%) |
| 16 and 17 Years | 0 (0.0%) | 0 (0.0%) |
| 18 to 24 Years | 6 (18.8%) | 0 (0.0%) |
| 25 to 34 Years | 23 (100.0%) | 17 (37.8%) |
| 35 to 44 Years | 0 (0.0%) | 4 (5.6%) |
| 45 to 54 Years | 14 (24.6%) | 5 (6.9%) |
| 55 to 64 Years | 44 (27.0%) | 9 (5.7%) |
| 65 to 74 Years | 0 (0.0%) | 13 (8.7%) |
| 75 Years and over | 0 (0.0%) | 5 (4.2%) |
| Total | 87 (13.7%) | 53 (7.4%) |
Income Above Poverty by Sex and Age in Crownsville
According to the poverty statistics in Crownsville, males aged 6 to 11 years and females aged under 5 years are the age groups that are most secure financially, with 100.0% of males and 100.0% of females in these age groups living above the poverty line.
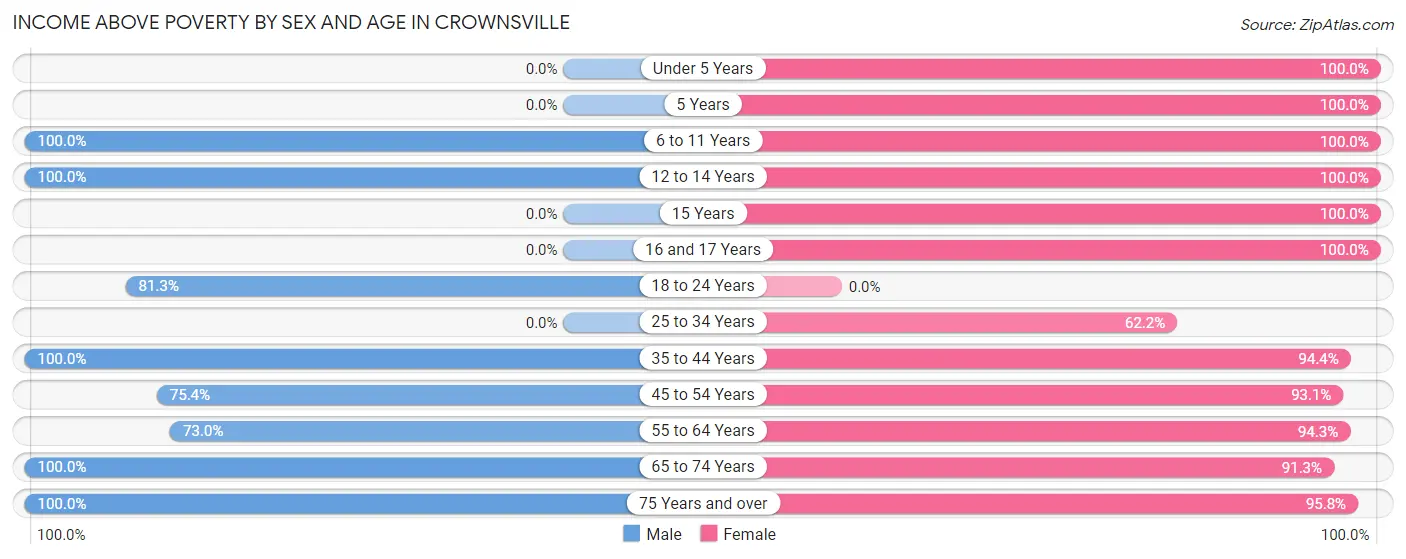
| Age Bracket | Male | Female |
| Under 5 Years | 0 (0.0%) | 2 (100.0%) |
| 5 Years | 0 (0.0%) | 2 (100.0%) |
| 6 to 11 Years | 65 (100.0%) | 6 (100.0%) |
| 12 to 14 Years | 18 (100.0%) | 40 (100.0%) |
| 15 Years | 0 (0.0%) | 19 (100.0%) |
| 16 and 17 Years | 0 (0.0%) | 27 (100.0%) |
| 18 to 24 Years | 26 (81.2%) | 0 (0.0%) |
| 25 to 34 Years | 0 (0.0%) | 28 (62.2%) |
| 35 to 44 Years | 67 (100.0%) | 68 (94.4%) |
| 45 to 54 Years | 43 (75.4%) | 67 (93.1%) |
| 55 to 64 Years | 119 (73.0%) | 150 (94.3%) |
| 65 to 74 Years | 82 (100.0%) | 137 (91.3%) |
| 75 Years and over | 126 (100.0%) | 114 (95.8%) |
| Total | 546 (86.3%) | 660 (92.6%) |
Income Below Poverty Among Married-Couple Families in Crownsville
The poverty statistics for married-couple families in Crownsville show that 5.3% or 21 of the total 396 families live below the poverty line. Families with no children have the highest poverty rate of 7.3%, comprising of 21 families. On the other hand, families with 1 or 2 children have the lowest poverty rate of 0.0%, which includes 0 families.
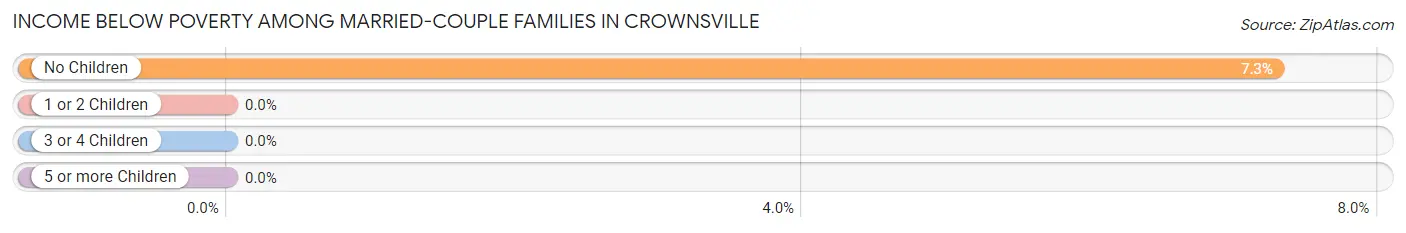
| Children | Above Poverty | Below Poverty |
| No Children | 267 (92.7%) | 21 (7.3%) |
| 1 or 2 Children | 107 (100.0%) | 0 (0.0%) |
| 3 or 4 Children | 0 (0.0%) | 0 (0.0%) |
| 5 or more Children | 1 (100.0%) | 0 (0.0%) |
| Total | 375 (94.7%) | 21 (5.3%) |
Income Below Poverty Among Single-Parent Households in Crownsville
| Children | Single Father | Single Mother |
| No Children | 0 (0.0%) | 0 (0.0%) |
| 1 or 2 Children | 0 (0.0%) | 0 (0.0%) |
| 3 or 4 Children | 0 (0.0%) | 0 (0.0%) |
| 5 or more Children | 0 (0.0%) | 0 (0.0%) |
| Total | 0 (0.0%) | 0 (0.0%) |
Income Below Poverty Among Married-Couple vs Single-Parent Households in Crownsville
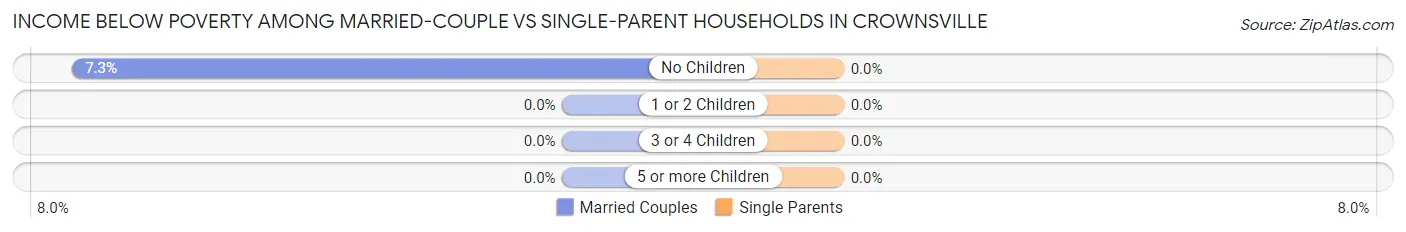
| Children | Married-Couple Families | Single-Parent Households |
| No Children | 21 (7.3%) | 0 (0.0%) |
| 1 or 2 Children | 0 (0.0%) | 0 (0.0%) |
| 3 or 4 Children | 0 (0.0%) | 0 (0.0%) |
| 5 or more Children | 0 (0.0%) | 0 (0.0%) |
| Total | 21 (5.3%) | 0 (0.0%) |
Race in Crownsville
The most populous races in Crownsville are White / Caucasian (1,239 | 90.9%), Two or more Races (72 | 5.3%), and Hispanic or Latino (68 | 5.0%).
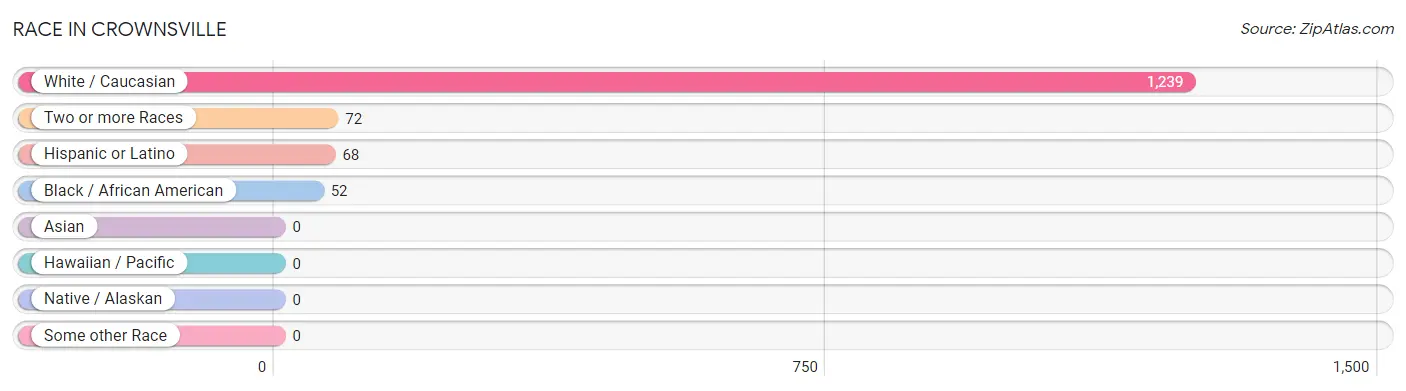
| Race | # Population | % Population |
| Asian | 0 | 0.0% |
| Black / African American | 52 | 3.8% |
| Hawaiian / Pacific | 0 | 0.0% |
| Hispanic or Latino | 68 | 5.0% |
| Native / Alaskan | 0 | 0.0% |
| White / Caucasian | 1,239 | 90.9% |
| Two or more Races | 72 | 5.3% |
| Some other Race | 0 | 0.0% |
| Total | 1,363 | 100.0% |
Ancestry in Crownsville
The most populous ancestries reported in Crownsville are German (231 | 17.0%), English (203 | 14.9%), Irish (193 | 14.2%), Russian (135 | 9.9%), and Italian (94 | 6.9%), together accounting for 62.8% of all Crownsville residents.
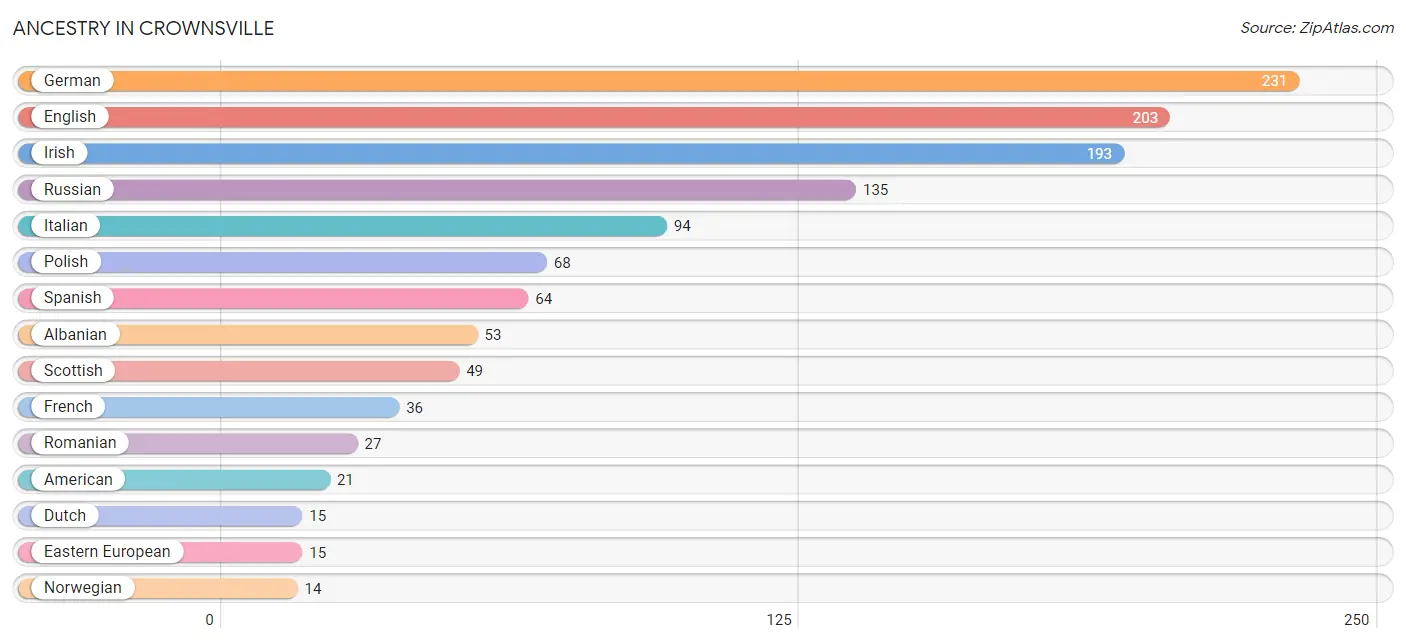
| Ancestry | # Population | % Population |
| Albanian | 53 | 3.9% |
| American | 21 | 1.5% |
| Czech | 13 | 0.9% |
| Dutch | 15 | 1.1% |
| Eastern European | 15 | 1.1% |
| English | 203 | 14.9% |
| Estonian | 12 | 0.9% |
| European | 11 | 0.8% |
| Finnish | 13 | 0.9% |
| French | 36 | 2.6% |
| German | 231 | 17.0% |
| Irish | 193 | 14.2% |
| Italian | 94 | 6.9% |
| Norwegian | 14 | 1.0% |
| Polish | 68 | 5.0% |
| Puerto Rican | 4 | 0.3% |
| Romanian | 27 | 2.0% |
| Russian | 135 | 9.9% |
| Scottish | 49 | 3.6% |
| Spanish | 64 | 4.7% |
| Sri Lankan | 8 | 0.6% |
| Swedish | 10 | 0.7% |
| Welsh | 13 | 0.9% | View All 23 Rows |
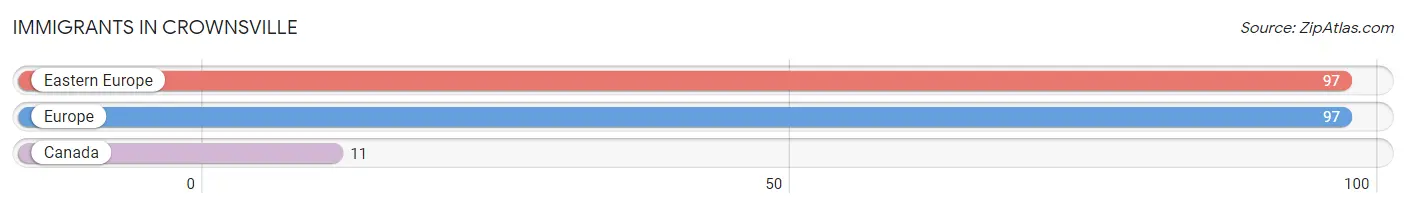
Immigrants in Crownsville
The most numerous immigrant groups reported in Crownsville came from Eastern Europe (97 | 7.1%), Europe (97 | 7.1%), and Canada (11 | 0.8%), together accounting for 15.0% of all Crownsville residents.
| Immigration Origin | # Population | % Population |
| Canada | 11 | 0.8% |
| Eastern Europe | 97 | 7.1% |
| Europe | 97 | 7.1% | View All 3 Rows |
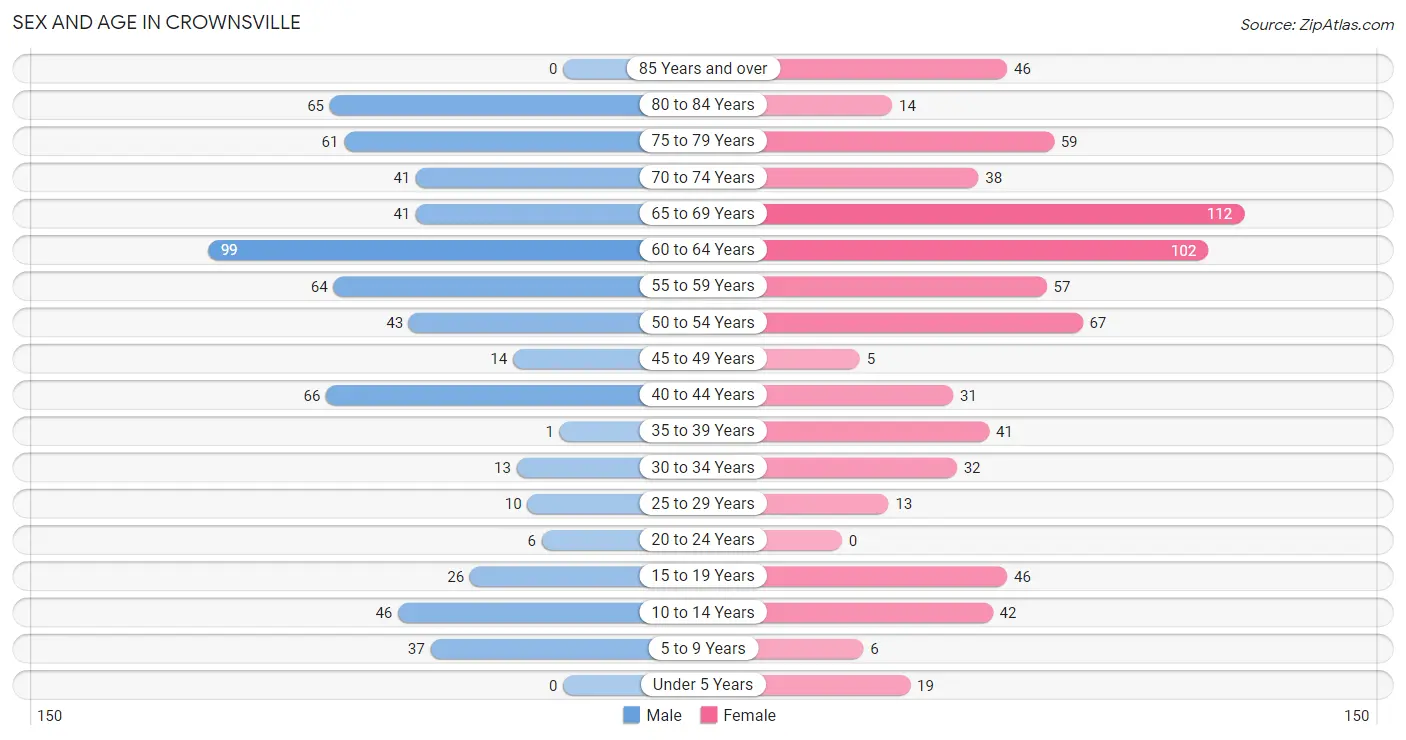
Sex and Age in Crownsville
Sex and Age in Crownsville
The most populous age groups in Crownsville are 60 to 64 Years (99 | 15.6%) for men and 65 to 69 Years (112 | 15.3%) for women.
| Age Bracket | Male | Female |
| Under 5 Years | 0 (0.0%) | 19 (2.6%) |
| 5 to 9 Years | 37 (5.9%) | 6 (0.8%) |
| 10 to 14 Years | 46 (7.3%) | 42 (5.8%) |
| 15 to 19 Years | 26 (4.1%) | 46 (6.3%) |
| 20 to 24 Years | 6 (0.9%) | 0 (0.0%) |
| 25 to 29 Years | 10 (1.6%) | 13 (1.8%) |
| 30 to 34 Years | 13 (2.1%) | 32 (4.4%) |
| 35 to 39 Years | 1 (0.2%) | 41 (5.6%) |
| 40 to 44 Years | 66 (10.4%) | 31 (4.3%) |
| 45 to 49 Years | 14 (2.2%) | 5 (0.7%) |
| 50 to 54 Years | 43 (6.8%) | 67 (9.2%) |
| 55 to 59 Years | 64 (10.1%) | 57 (7.8%) |
| 60 to 64 Years | 99 (15.6%) | 102 (14.0%) |
| 65 to 69 Years | 41 (6.5%) | 112 (15.3%) |
| 70 to 74 Years | 41 (6.5%) | 38 (5.2%) |
| 75 to 79 Years | 61 (9.6%) | 59 (8.1%) |
| 80 to 84 Years | 65 (10.3%) | 14 (1.9%) |
| 85 Years and over | 0 (0.0%) | 46 (6.3%) |
| Total | 633 (100.0%) | 730 (100.0%) |
Families and Households in Crownsville
Median Family Size in Crownsville
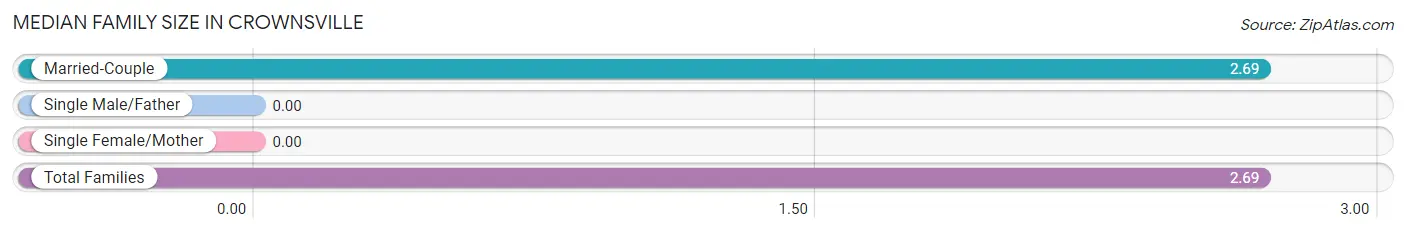
| Family Type | # Families | Family Size |
| Married-Couple | 396 (100.0%) | 2.69 |
| Single Male/Father | 0 (0.0%) | - |
| Single Female/Mother | 0 (0.0%) | - |
| Total Families | 396 (100.0%) | 2.69 |
Median Household Size in Crownsville
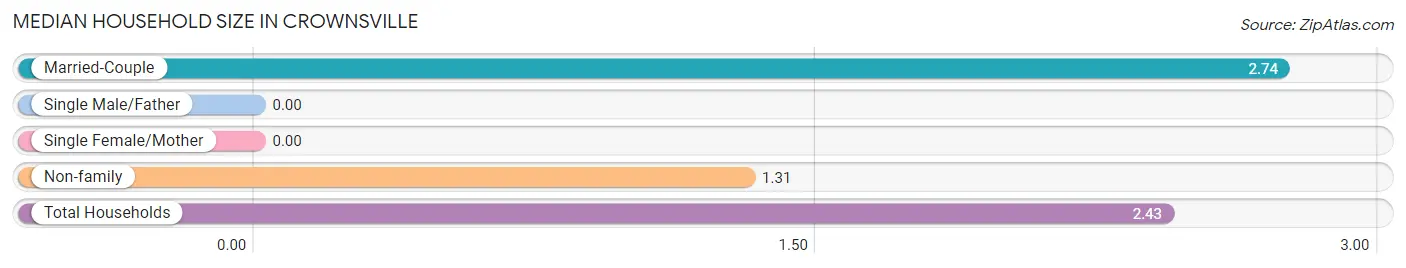
| Household Type | # Households | Household Size |
| Married-Couple | 396 (78.7%) | 2.74 |
| Single Male/Father | 0 (0.0%) | - |
| Single Female/Mother | 0 (0.0%) | - |
| Non-family | 107 (21.3%) | 1.31 |
| Total Households | 503 (100.0%) | 2.43 |
Household Size by Marriage Status in Crownsville
Out of a total of 503 households in Crownsville, 396 (78.7%) are family households, while 107 (21.3%) are nonfamily households. The most numerous type of family households are 2-person households, comprising 256, and the most common type of nonfamily households are 1-person households, comprising 73.
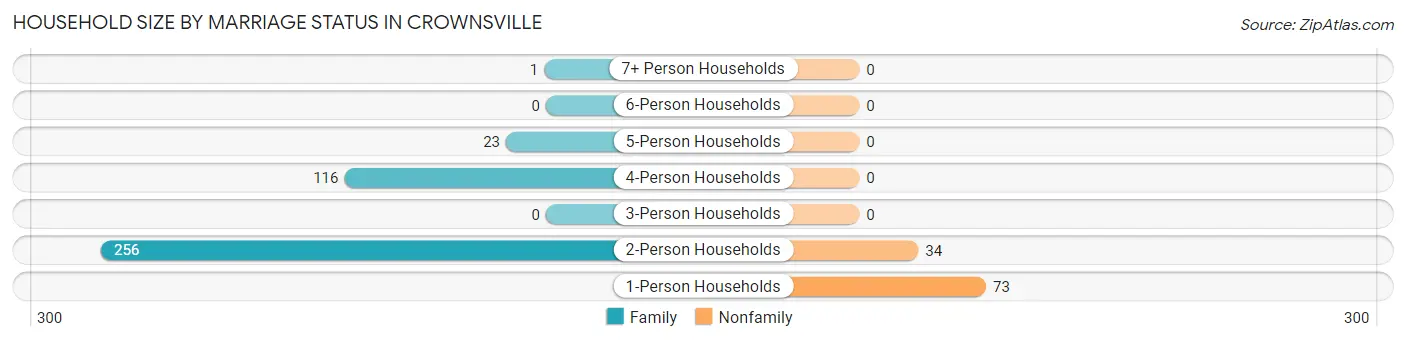
| Household Size | Family Households | Nonfamily Households |
| 1-Person Households | - | 73 (14.5%) |
| 2-Person Households | 256 (50.9%) | 34 (6.8%) |
| 3-Person Households | 0 (0.0%) | 0 (0.0%) |
| 4-Person Households | 116 (23.1%) | 0 (0.0%) |
| 5-Person Households | 23 (4.6%) | 0 (0.0%) |
| 6-Person Households | 0 (0.0%) | 0 (0.0%) |
| 7+ Person Households | 1 (0.2%) | 0 (0.0%) |
| Total | 396 (78.7%) | 107 (21.3%) |
Female Fertility in Crownsville
Fertility by Age in Crownsville
Average fertility rate in Crownsville is 21.0 births per 1,000 women. Women in the age bracket of 20 to 34 years have the highest fertility rate with 89.0 births per 1,000 women. Women in the age bracket of 20 to 34 years acount for 100.0% of all women with births.
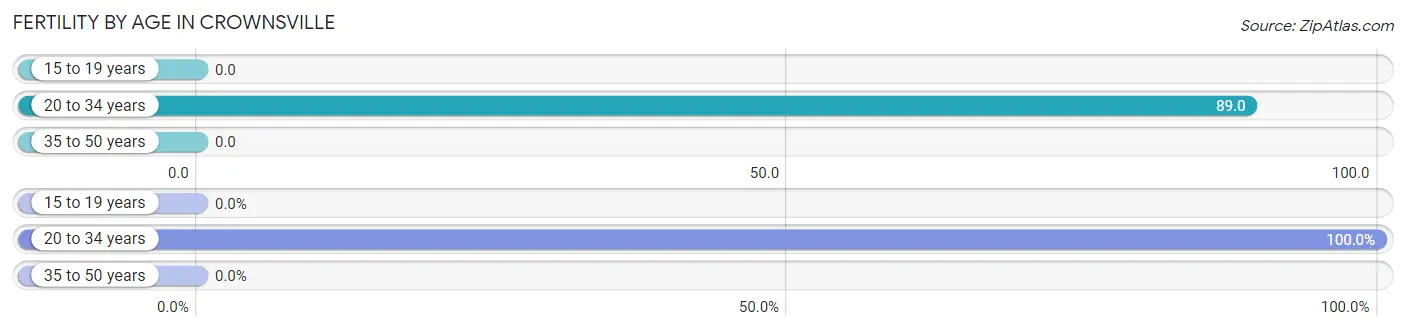
| Age Bracket | Women with Births | Births / 1,000 Women |
| 15 to 19 years | 0 (0.0%) | 0.0 |
| 20 to 34 years | 4 (100.0%) | 89.0 |
| 35 to 50 years | 0 (0.0%) | 0.0 |
| Total | 4 (100.0%) | 21.0 |
Fertility by Age by Marriage Status in Crownsville
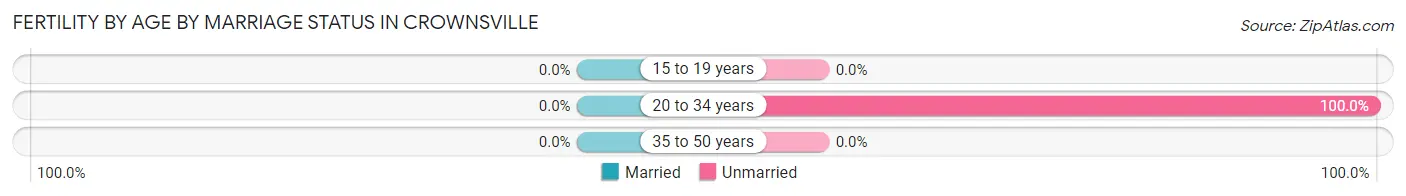
| Age Bracket | Married | Unmarried |
| 15 to 19 years | 0 (0.0%) | 0 (0.0%) |
| 20 to 34 years | 0 (0.0%) | 4 (100.0%) |
| 35 to 50 years | 0 (0.0%) | 0 (0.0%) |
| Total | 0 (0.0%) | 4 (100.0%) |
Fertility by Education in Crownsville
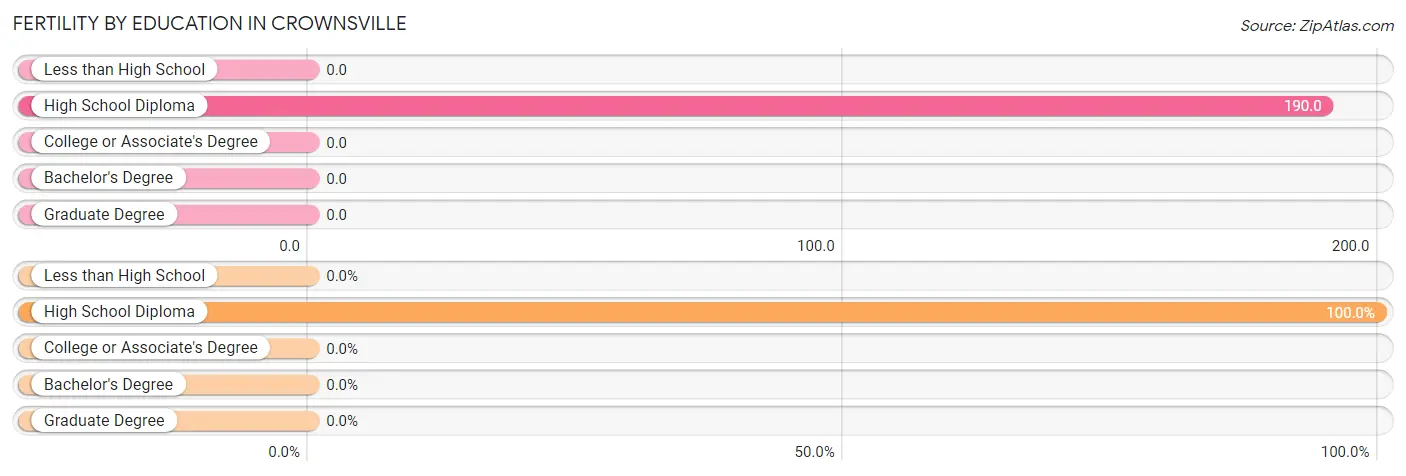
| Educational Attainment | Women with Births | Births / 1,000 Women |
| Less than High School | 0 (0.0%) | 0.0 |
| High School Diploma | 4 (100.0%) | 190.0 |
| College or Associate's Degree | 0 (0.0%) | 0.0 |
| Bachelor's Degree | 0 (0.0%) | 0.0 |
| Graduate Degree | 0 (0.0%) | 0.0 |
| Total | 4 (100.0%) | 21.0 |
Fertility by Education by Marriage Status in Crownsville
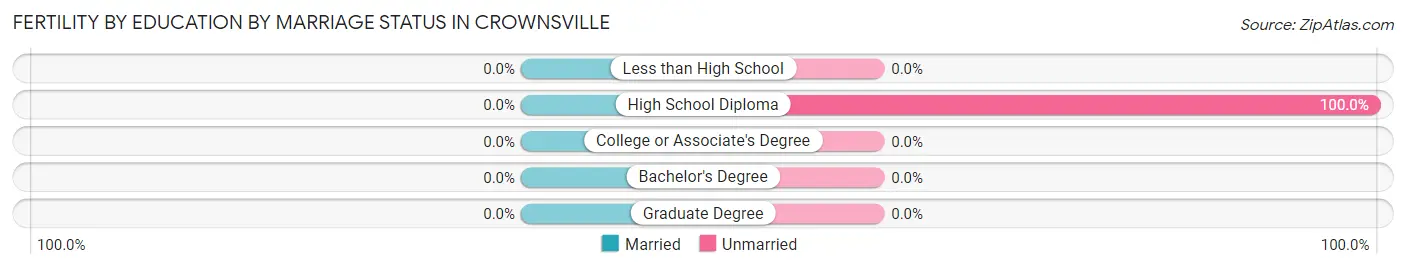
| Educational Attainment | Married | Unmarried |
| Less than High School | 0 (0.0%) | 0 (0.0%) |
| High School Diploma | 0 (0.0%) | 4 (100.0%) |
| College or Associate's Degree | 0 (0.0%) | 0 (0.0%) |
| Bachelor's Degree | 0 (0.0%) | 0 (0.0%) |
| Graduate Degree | 0 (0.0%) | 0 (0.0%) |
| Total | 0 (0.0%) | 4 (100.0%) |
Employment Characteristics in Crownsville
Employment by Class of Employer in Crownsville
Among the 561 employed individuals in Crownsville, private company employees (299 | 53.3%), self-employed (incorporated) (103 | 18.4%), and local government employees (80 | 14.3%) make up the most common classes of employment.
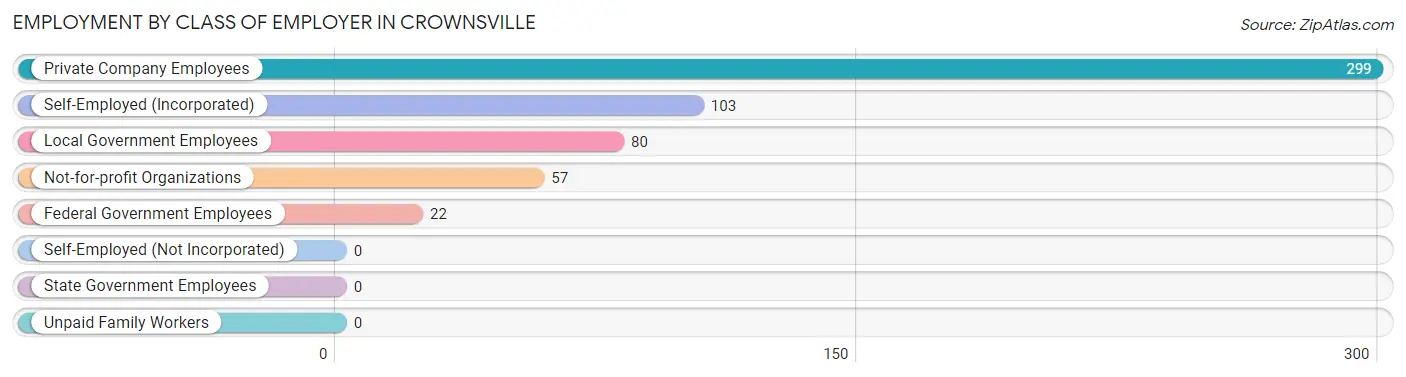
| Employer Class | # Employees | % Employees |
| Private Company Employees | 299 | 53.3% |
| Self-Employed (Incorporated) | 103 | 18.4% |
| Self-Employed (Not Incorporated) | 0 | 0.0% |
| Not-for-profit Organizations | 57 | 10.2% |
| Local Government Employees | 80 | 14.3% |
| State Government Employees | 0 | 0.0% |
| Federal Government Employees | 22 | 3.9% |
| Unpaid Family Workers | 0 | 0.0% |
| Total | 561 | 100.0% |
Employment Status by Age in Crownsville
According to the labor force statistics for Crownsville, out of the total population over 16 years of age (1,194), 48.7% or 581 individuals are in the labor force, with 3.4% or 20 of them unemployed. The age group with the highest labor force participation rate is 16 to 19 years, with 100.0% or 53 individuals in the labor force. Within the labor force, the 55 to 59 years age range has the highest percentage of unemployed individuals, with 16.5% or 16 of them being unemployed.
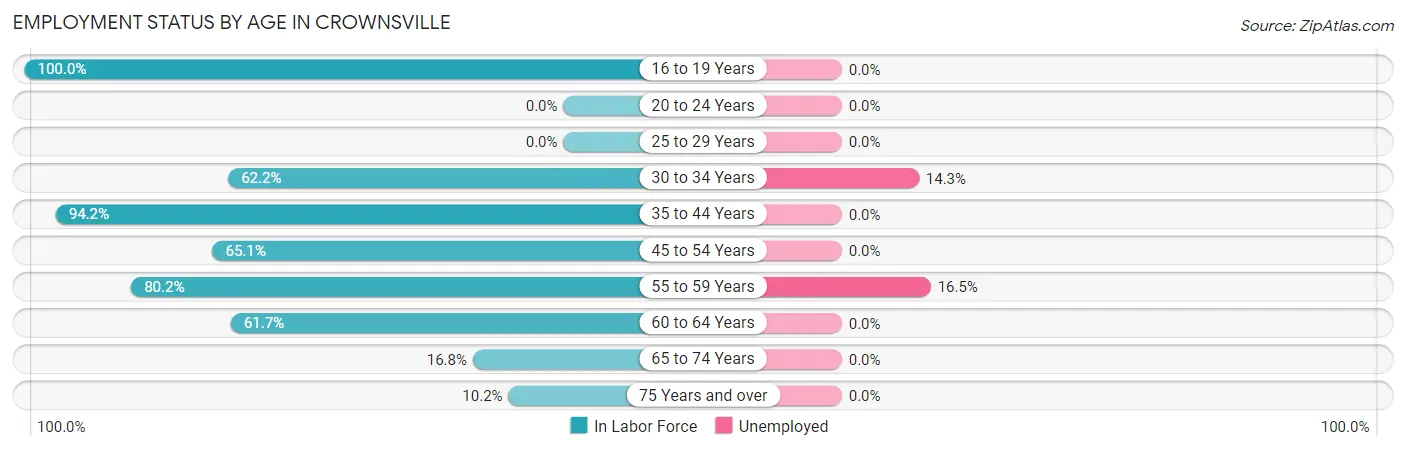
| Age Bracket | In Labor Force | Unemployed |
| 16 to 19 Years | 53 (100.0%) | 0 (0.0%) |
| 20 to 24 Years | 0 (0.0%) | 0 (0.0%) |
| 25 to 29 Years | 0 (0.0%) | 0 (0.0%) |
| 30 to 34 Years | 28 (62.2%) | 4 (14.3%) |
| 35 to 44 Years | 131 (94.2%) | 0 (0.0%) |
| 45 to 54 Years | 84 (65.1%) | 0 (0.0%) |
| 55 to 59 Years | 97 (80.2%) | 16 (16.5%) |
| 60 to 64 Years | 124 (61.7%) | 0 (0.0%) |
| 65 to 74 Years | 39 (16.8%) | 0 (0.0%) |
| 75 Years and over | 25 (10.2%) | 0 (0.0%) |
| Total | 581 (48.7%) | 20 (3.4%) |
Employment Status by Educational Attainment in Crownsville
According to labor force statistics for Crownsville, 70.5% of individuals (464) out of the total population between 25 and 64 years of age (658) are in the labor force, with 4.3% or 20 of them being unemployed. The group with the highest labor force participation rate are those with the educational attainment of bachelor's degree or higher, with 77.9% or 183 individuals in the labor force. Within the labor force, individuals with college / associate degree education have the highest percentage of unemployment, with 6.5% or 11 of them being unemployed.
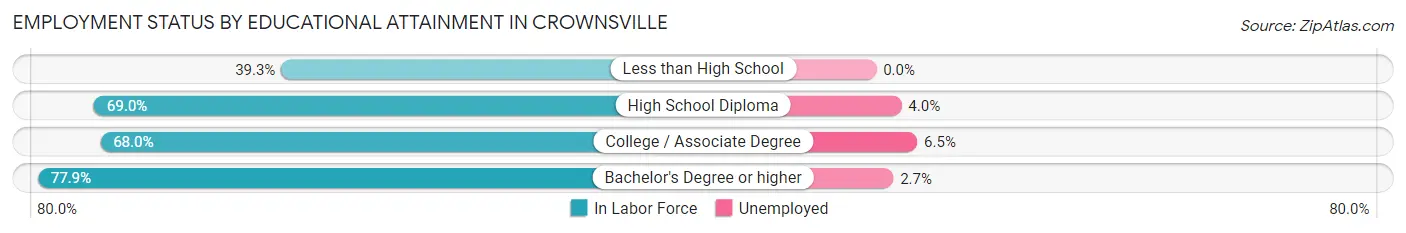
| Educational Attainment | In Labor Force | Unemployed |
| Less than High School | 11 (39.3%) | 0 (0.0%) |
| High School Diploma | 100 (69.0%) | 6 (4.0%) |
| College / Associate Degree | 170 (68.0%) | 16 (6.5%) |
| Bachelor's Degree or higher | 183 (77.9%) | 6 (2.7%) |
| Total | 464 (70.5%) | 28 (4.3%) |
Employment Occupations by Sex in Crownsville
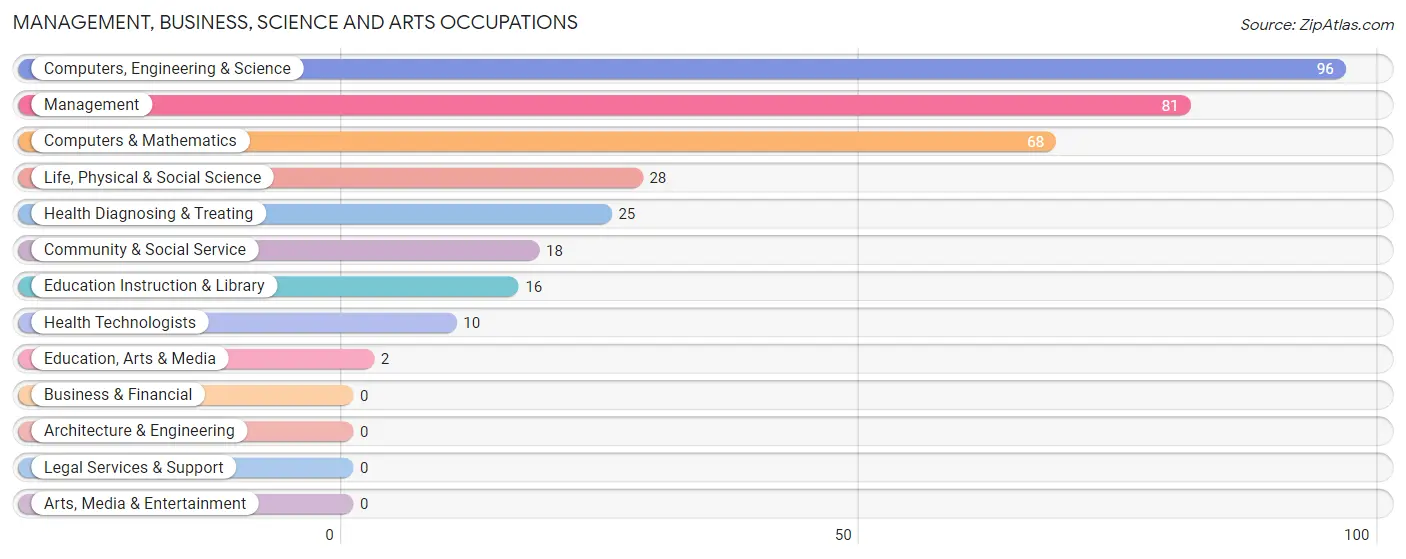
Management, Business, Science and Arts Occupations
The most common Management, Business, Science and Arts occupations in Crownsville are Computers, Engineering & Science (96 | 17.1%), Management (81 | 14.4%), Computers & Mathematics (68 | 12.1%), Life, Physical & Social Science (28 | 5.0%), and Health Diagnosing & Treating (25 | 4.5%).
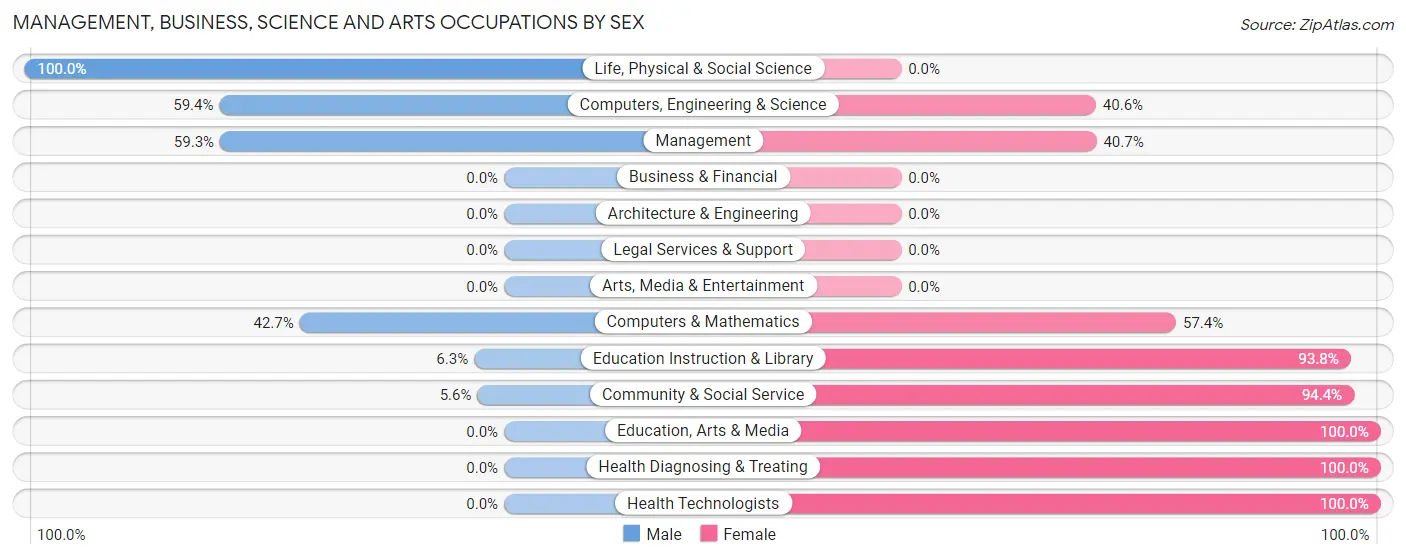
Management, Business, Science and Arts Occupations by Sex
Within the Management, Business, Science and Arts occupations in Crownsville, the most male-oriented occupations are Life, Physical & Social Science (100.0%), Computers, Engineering & Science (59.4%), and Management (59.3%), while the most female-oriented occupations are Education, Arts & Media (100.0%), Health Diagnosing & Treating (100.0%), and Health Technologists (100.0%).
| Occupation | Male | Female |
| Management | 48 (59.3%) | 33 (40.7%) |
| Business & Financial | 0 (0.0%) | 0 (0.0%) |
| Computers, Engineering & Science | 57 (59.4%) | 39 (40.6%) |
| Computers & Mathematics | 29 (42.6%) | 39 (57.4%) |
| Architecture & Engineering | 0 (0.0%) | 0 (0.0%) |
| Life, Physical & Social Science | 28 (100.0%) | 0 (0.0%) |
| Community & Social Service | 1 (5.6%) | 17 (94.4%) |
| Education, Arts & Media | 0 (0.0%) | 2 (100.0%) |
| Legal Services & Support | 0 (0.0%) | 0 (0.0%) |
| Education Instruction & Library | 1 (6.2%) | 15 (93.8%) |
| Arts, Media & Entertainment | 0 (0.0%) | 0 (0.0%) |
| Health Diagnosing & Treating | 0 (0.0%) | 25 (100.0%) |
| Health Technologists | 0 (0.0%) | 10 (100.0%) |
| Total (Category) | 106 (48.2%) | 114 (51.8%) |
| Total (Overall) | 280 (49.9%) | 281 (50.1%) |
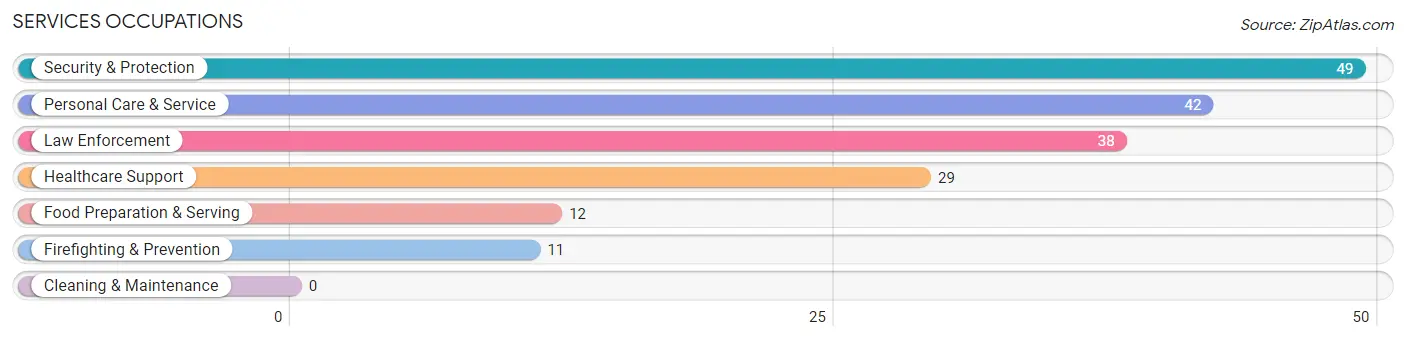
Services Occupations
The most common Services occupations in Crownsville are Security & Protection (49 | 8.7%), Personal Care & Service (42 | 7.5%), Law Enforcement (38 | 6.8%), Healthcare Support (29 | 5.2%), and Food Preparation & Serving (12 | 2.1%).
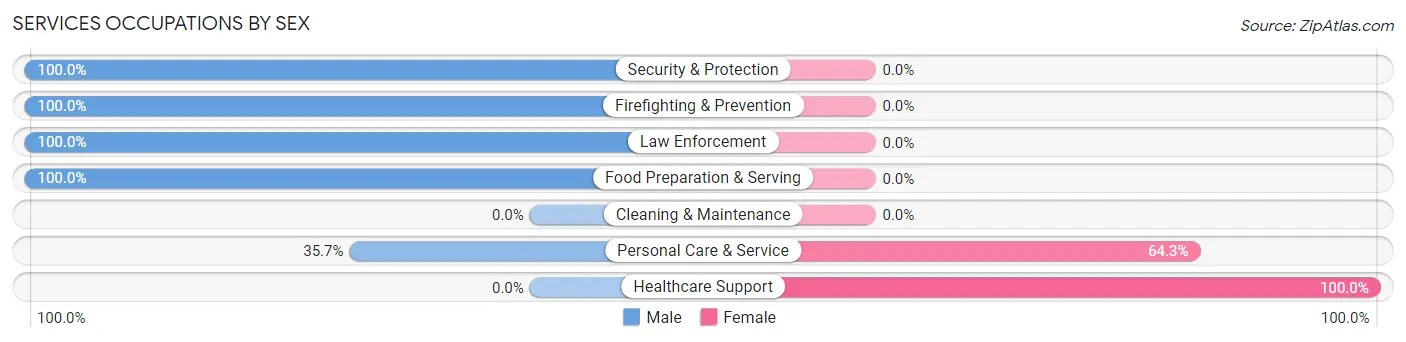
Services Occupations by Sex
Within the Services occupations in Crownsville, the most male-oriented occupations are Security & Protection (100.0%), Firefighting & Prevention (100.0%), and Law Enforcement (100.0%), while the most female-oriented occupations are Healthcare Support (100.0%), and Personal Care & Service (64.3%).
| Occupation | Male | Female |
| Healthcare Support | 0 (0.0%) | 29 (100.0%) |
| Security & Protection | 49 (100.0%) | 0 (0.0%) |
| Firefighting & Prevention | 11 (100.0%) | 0 (0.0%) |
| Law Enforcement | 38 (100.0%) | 0 (0.0%) |
| Food Preparation & Serving | 12 (100.0%) | 0 (0.0%) |
| Cleaning & Maintenance | 0 (0.0%) | 0 (0.0%) |
| Personal Care & Service | 15 (35.7%) | 27 (64.3%) |
| Total (Category) | 76 (57.6%) | 56 (42.4%) |
| Total (Overall) | 280 (49.9%) | 281 (50.1%) |
Sales and Office Occupations
The most common Sales and Office occupations in Crownsville are Office & Administration (59 | 10.5%), and Sales & Related (52 | 9.3%).
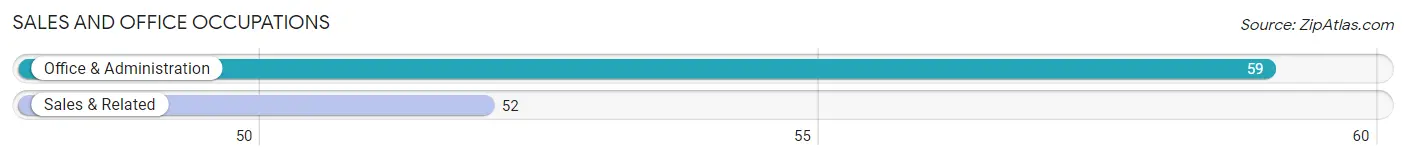
Sales and Office Occupations by Sex
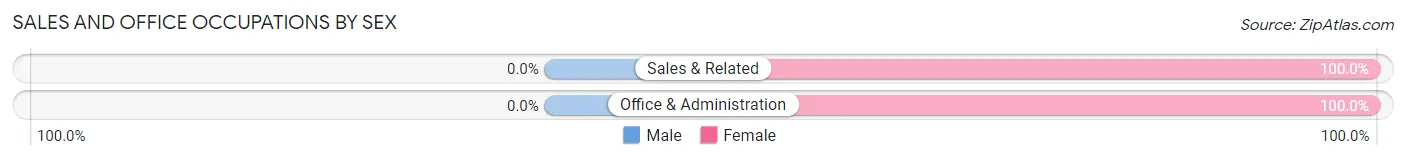
| Occupation | Male | Female |
| Sales & Related | 0 (0.0%) | 52 (100.0%) |
| Office & Administration | 0 (0.0%) | 59 (100.0%) |
| Total (Category) | 0 (0.0%) | 111 (100.0%) |
| Total (Overall) | 280 (49.9%) | 281 (50.1%) |
Natural Resources, Construction and Maintenance Occupations
The most common Natural Resources, Construction and Maintenance occupations in Crownsville are , and Construction & Extraction (36 | 6.4%).
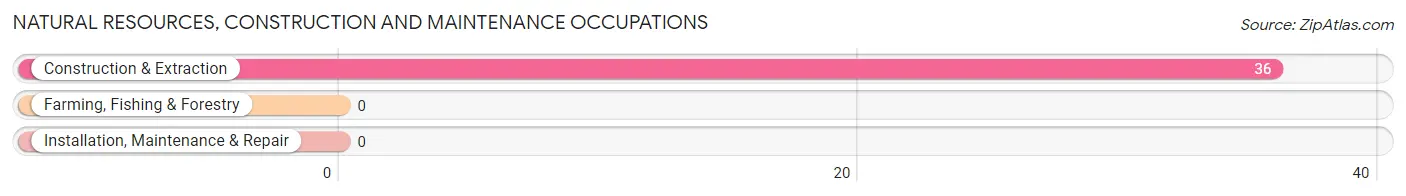
Natural Resources, Construction and Maintenance Occupations by Sex
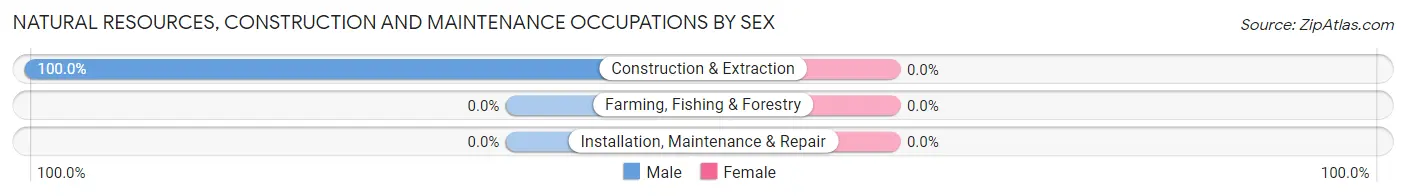
| Occupation | Male | Female |
| Farming, Fishing & Forestry | 0 (0.0%) | 0 (0.0%) |
| Construction & Extraction | 36 (100.0%) | 0 (0.0%) |
| Installation, Maintenance & Repair | 0 (0.0%) | 0 (0.0%) |
| Total (Category) | 36 (100.0%) | 0 (0.0%) |
| Total (Overall) | 280 (49.9%) | 281 (50.1%) |
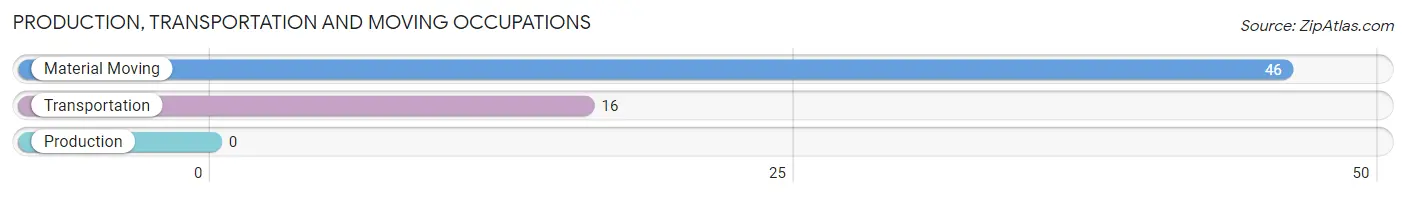
Production, Transportation and Moving Occupations
The most common Production, Transportation and Moving occupations in Crownsville are Material Moving (46 | 8.2%), and Transportation (16 | 2.9%).
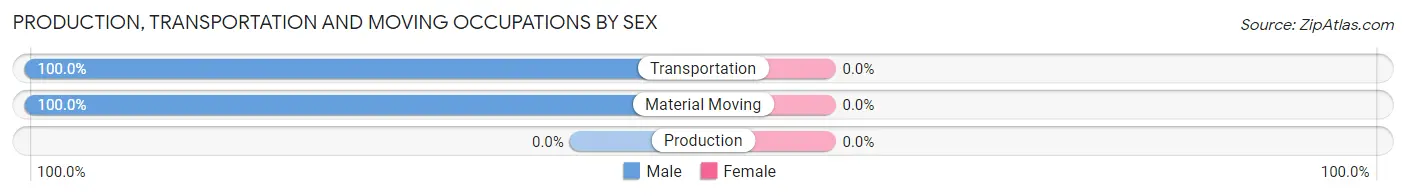
Production, Transportation and Moving Occupations by Sex
| Occupation | Male | Female |
| Production | 0 (0.0%) | 0 (0.0%) |
| Transportation | 16 (100.0%) | 0 (0.0%) |
| Material Moving | 46 (100.0%) | 0 (0.0%) |
| Total (Category) | 62 (100.0%) | 0 (0.0%) |
| Total (Overall) | 280 (49.9%) | 281 (50.1%) |
Employment Industries by Sex in Crownsville
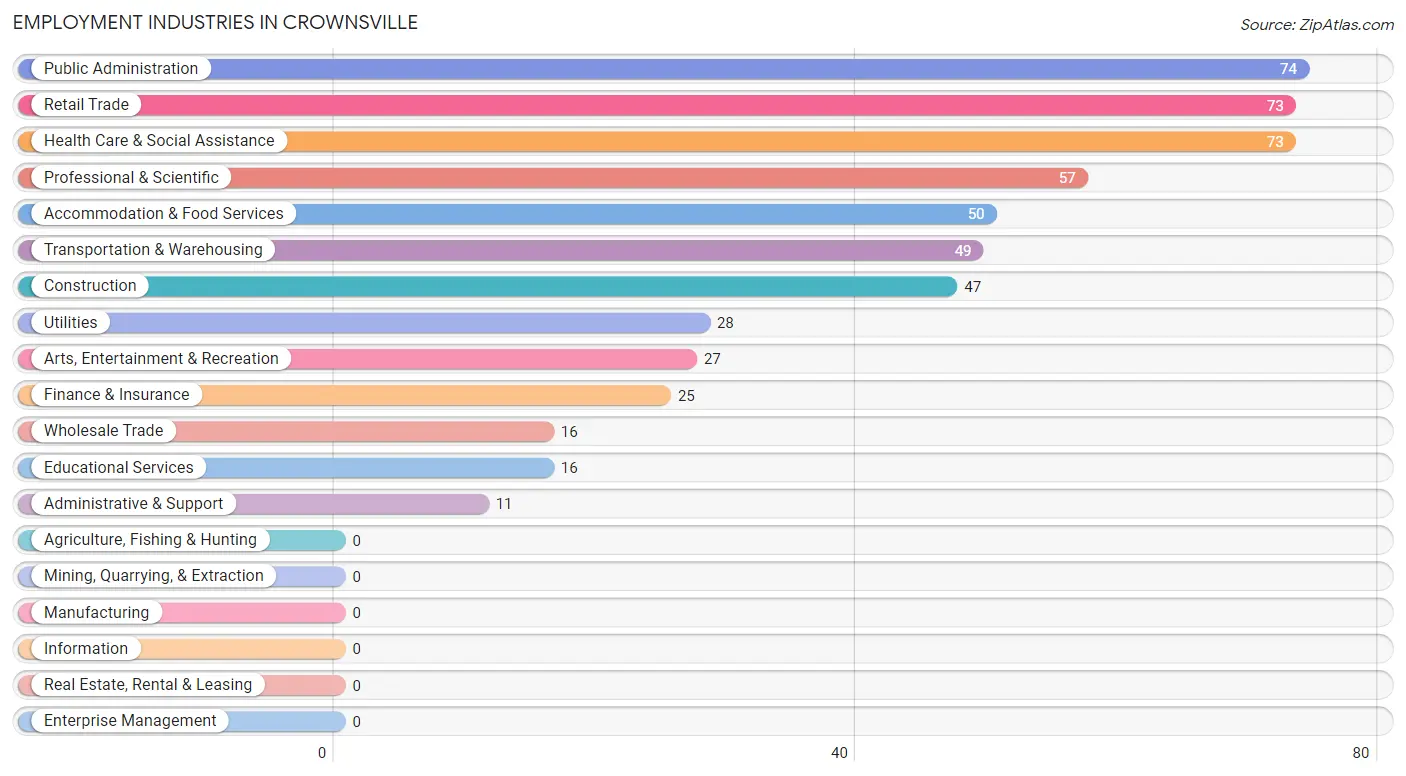
Employment Industries in Crownsville
The major employment industries in Crownsville include Public Administration (74 | 13.2%), Retail Trade (73 | 13.0%), Health Care & Social Assistance (73 | 13.0%), Professional & Scientific (57 | 10.2%), and Accommodation & Food Services (50 | 8.9%).
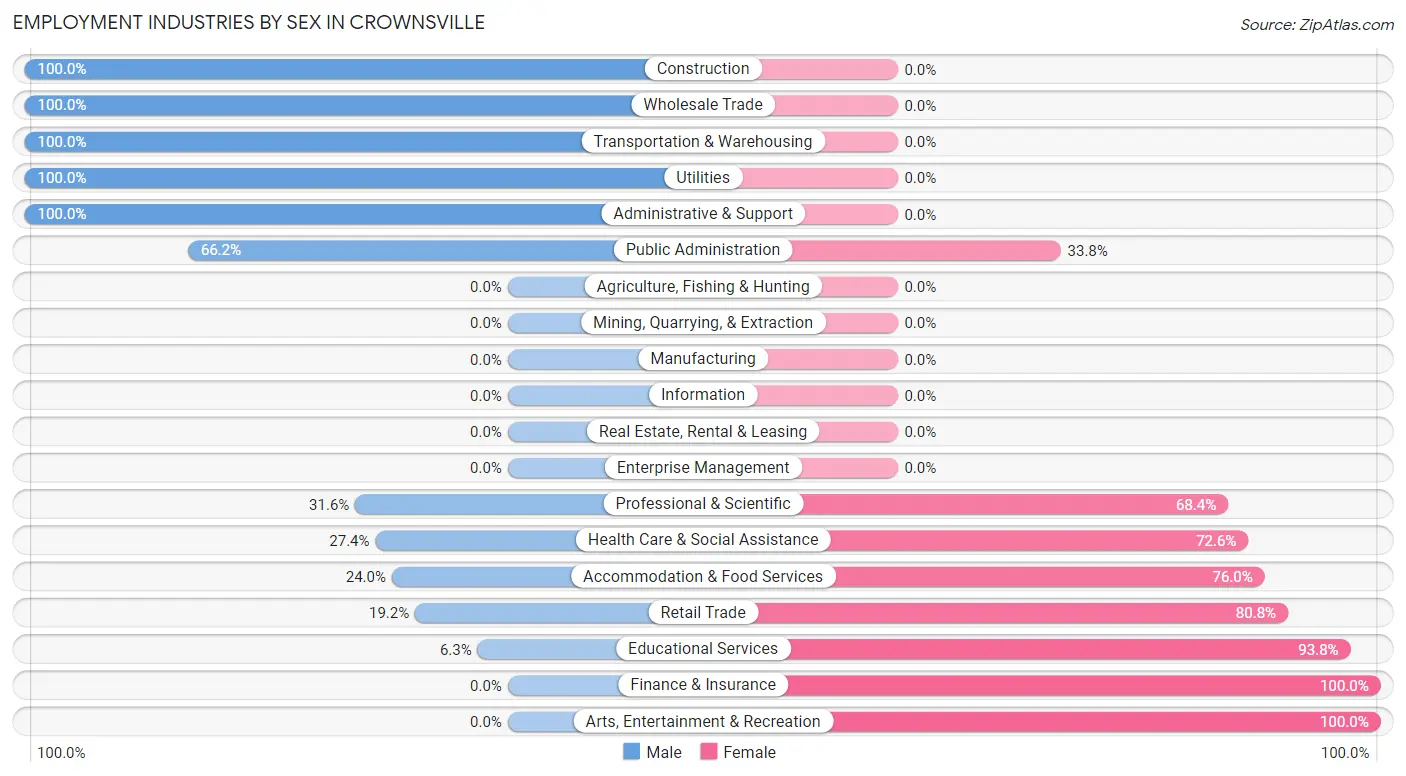
Employment Industries by Sex in Crownsville
The Crownsville industries that see more men than women are Construction (100.0%), Wholesale Trade (100.0%), and Transportation & Warehousing (100.0%), whereas the industries that tend to have a higher number of women are Finance & Insurance (100.0%), Arts, Entertainment & Recreation (100.0%), and Educational Services (93.8%).
| Industry | Male | Female |
| Agriculture, Fishing & Hunting | 0 (0.0%) | 0 (0.0%) |
| Mining, Quarrying, & Extraction | 0 (0.0%) | 0 (0.0%) |
| Construction | 47 (100.0%) | 0 (0.0%) |
| Manufacturing | 0 (0.0%) | 0 (0.0%) |
| Wholesale Trade | 16 (100.0%) | 0 (0.0%) |
| Retail Trade | 14 (19.2%) | 59 (80.8%) |
| Transportation & Warehousing | 49 (100.0%) | 0 (0.0%) |
| Utilities | 28 (100.0%) | 0 (0.0%) |
| Information | 0 (0.0%) | 0 (0.0%) |
| Finance & Insurance | 0 (0.0%) | 25 (100.0%) |
| Real Estate, Rental & Leasing | 0 (0.0%) | 0 (0.0%) |
| Professional & Scientific | 18 (31.6%) | 39 (68.4%) |
| Enterprise Management | 0 (0.0%) | 0 (0.0%) |
| Administrative & Support | 11 (100.0%) | 0 (0.0%) |
| Educational Services | 1 (6.2%) | 15 (93.8%) |
| Health Care & Social Assistance | 20 (27.4%) | 53 (72.6%) |
| Arts, Entertainment & Recreation | 0 (0.0%) | 27 (100.0%) |
| Accommodation & Food Services | 12 (24.0%) | 38 (76.0%) |
| Public Administration | 49 (66.2%) | 25 (33.8%) |
| Total | 280 (49.9%) | 281 (50.1%) |
Education in Crownsville
School Enrollment in Crownsville
The most common levels of schooling among the 177 students in Crownsville are middle school (88 | 49.7%), high school (46 | 26.0%), and elementary school (41 | 23.2%).
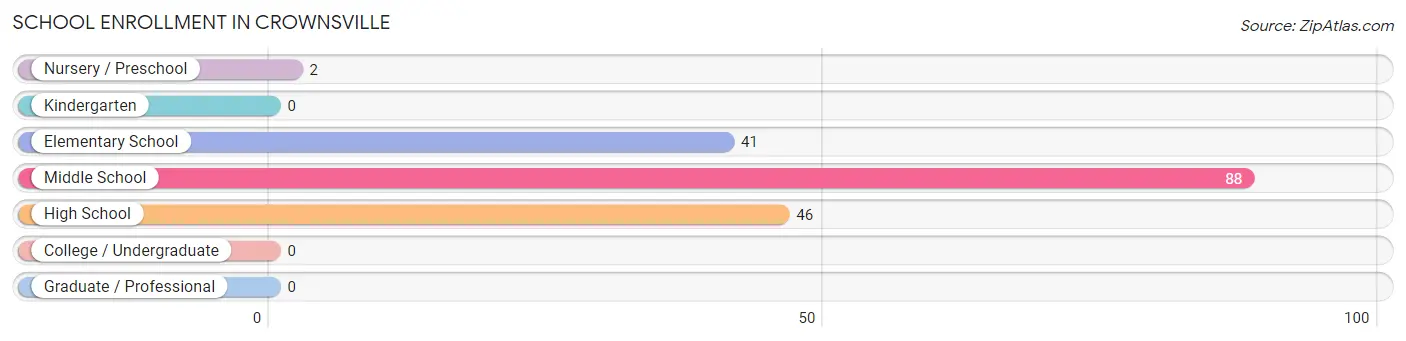
| School Level | # Students | % Students |
| Nursery / Preschool | 2 | 1.1% |
| Kindergarten | 0 | 0.0% |
| Elementary School | 41 | 23.2% |
| Middle School | 88 | 49.7% |
| High School | 46 | 26.0% |
| College / Undergraduate | 0 | 0.0% |
| Graduate / Professional | 0 | 0.0% |
| Total | 177 | 100.0% |
School Enrollment by Age by Funding Source in Crownsville
Out of a total of 177 students who are enrolled in schools in Crownsville, 41 (23.2%) attend a private institution, while the remaining 136 (76.8%) are enrolled in public schools. The age group of 15 to 17 year olds has the highest likelihood of being enrolled in private schools, with 19 (41.3% in the age bracket) enrolled. Conversely, the age group of 3 to 4 year olds has the lowest likelihood of being enrolled in a private school, with 2 (100.0% in the age bracket) attending a public institution.
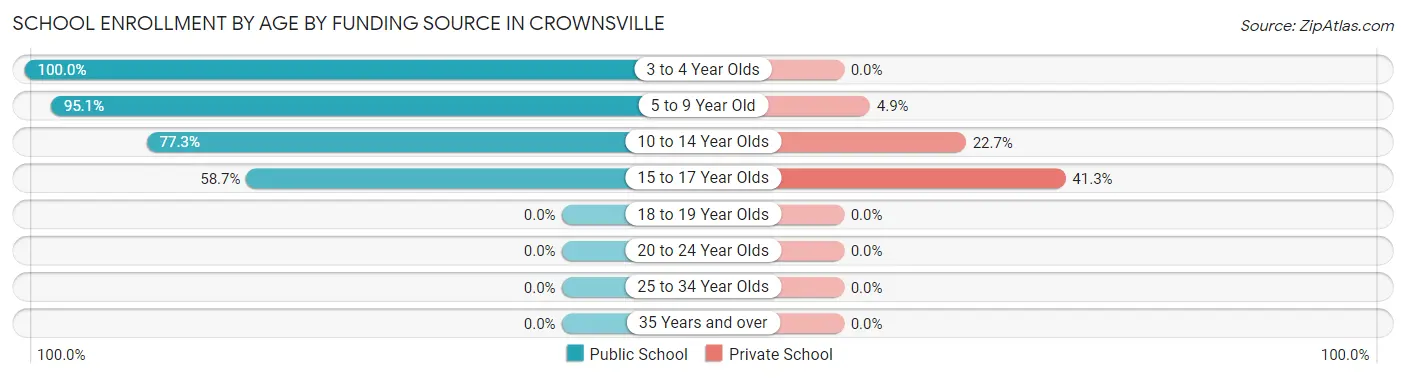
| Age Bracket | Public School | Private School |
| 3 to 4 Year Olds | 2 (100.0%) | 0 (0.0%) |
| 5 to 9 Year Old | 39 (95.1%) | 2 (4.9%) |
| 10 to 14 Year Olds | 68 (77.3%) | 20 (22.7%) |
| 15 to 17 Year Olds | 27 (58.7%) | 19 (41.3%) |
| 18 to 19 Year Olds | 0 (0.0%) | 0 (0.0%) |
| 20 to 24 Year Olds | 0 (0.0%) | 0 (0.0%) |
| 25 to 34 Year Olds | 0 (0.0%) | 0 (0.0%) |
| 35 Years and over | 0 (0.0%) | 0 (0.0%) |
| Total | 136 (76.8%) | 41 (23.2%) |
Educational Attainment by Field of Study in Crownsville
Business (85 | 17.7%), bio, nature & agricultural (83 | 17.3%), arts & humanities (72 | 15.0%), science & technology (71 | 14.8%), and social sciences (65 | 13.5%) are the most common fields of study among 481 individuals in Crownsville who have obtained a bachelor's degree or higher.
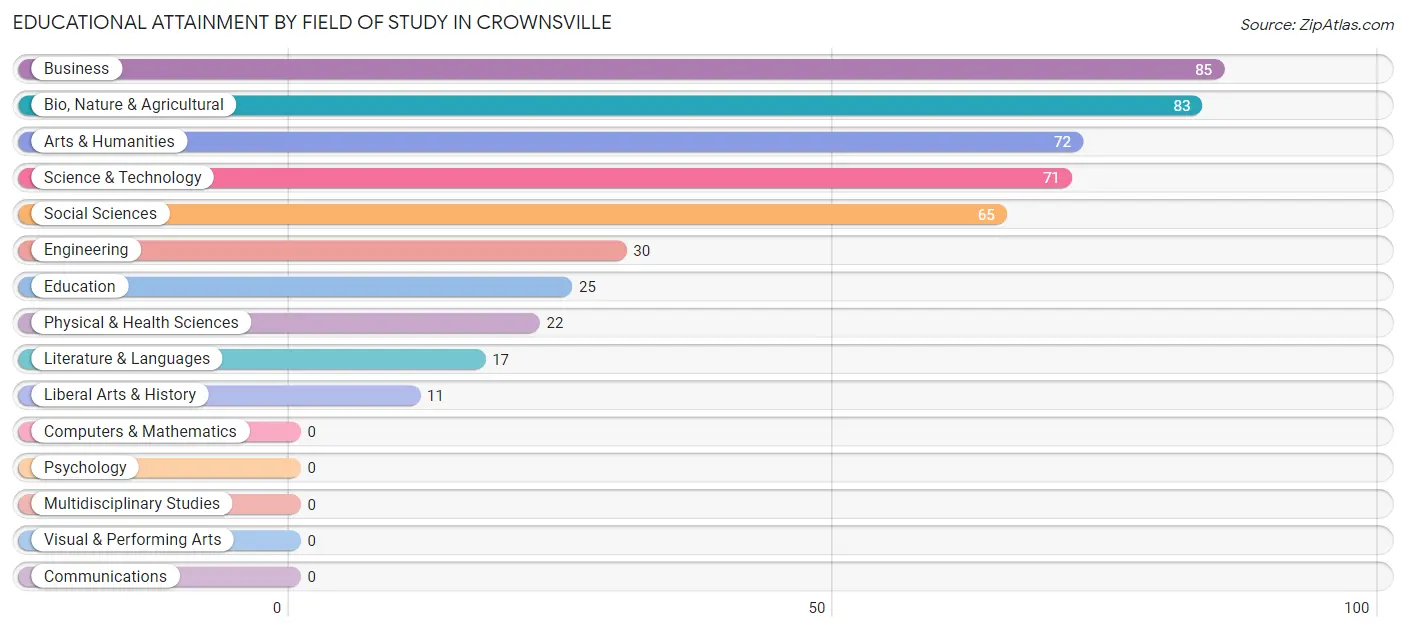
| Field of Study | # Graduates | % Graduates |
| Computers & Mathematics | 0 | 0.0% |
| Bio, Nature & Agricultural | 83 | 17.3% |
| Physical & Health Sciences | 22 | 4.6% |
| Psychology | 0 | 0.0% |
| Social Sciences | 65 | 13.5% |
| Engineering | 30 | 6.2% |
| Multidisciplinary Studies | 0 | 0.0% |
| Science & Technology | 71 | 14.8% |
| Business | 85 | 17.7% |
| Education | 25 | 5.2% |
| Literature & Languages | 17 | 3.5% |
| Liberal Arts & History | 11 | 2.3% |
| Visual & Performing Arts | 0 | 0.0% |
| Communications | 0 | 0.0% |
| Arts & Humanities | 72 | 15.0% |
| Total | 481 | 100.0% |
Transportation & Commute in Crownsville
Vehicle Availability by Sex in Crownsville
The most prevalent vehicle ownership categories in Crownsville are males with 3 vehicles (130, accounting for 50.0%) and females with 3 vehicles (130, making up 46.3%).
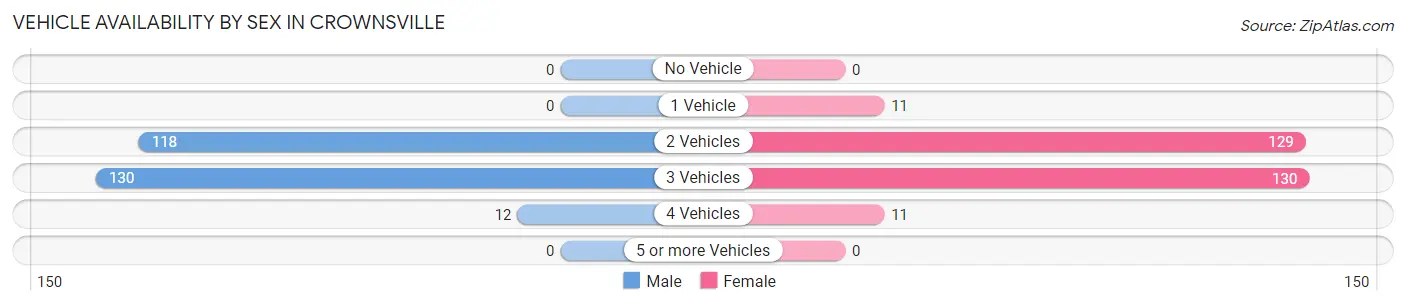
| Vehicles Available | Male | Female |
| No Vehicle | 0 (0.0%) | 0 (0.0%) |
| 1 Vehicle | 0 (0.0%) | 11 (3.9%) |
| 2 Vehicles | 118 (45.4%) | 129 (45.9%) |
| 3 Vehicles | 130 (50.0%) | 130 (46.3%) |
| 4 Vehicles | 12 (4.6%) | 11 (3.9%) |
| 5 or more Vehicles | 0 (0.0%) | 0 (0.0%) |
| Total | 260 (100.0%) | 281 (100.0%) |
Commute Time in Crownsville
The most frequently occuring commute durations in Crownsville are 20 to 24 minutes (106 commuters, 22.4%), 15 to 19 minutes (100 commuters, 21.1%), and 30 to 34 minutes (67 commuters, 14.2%).
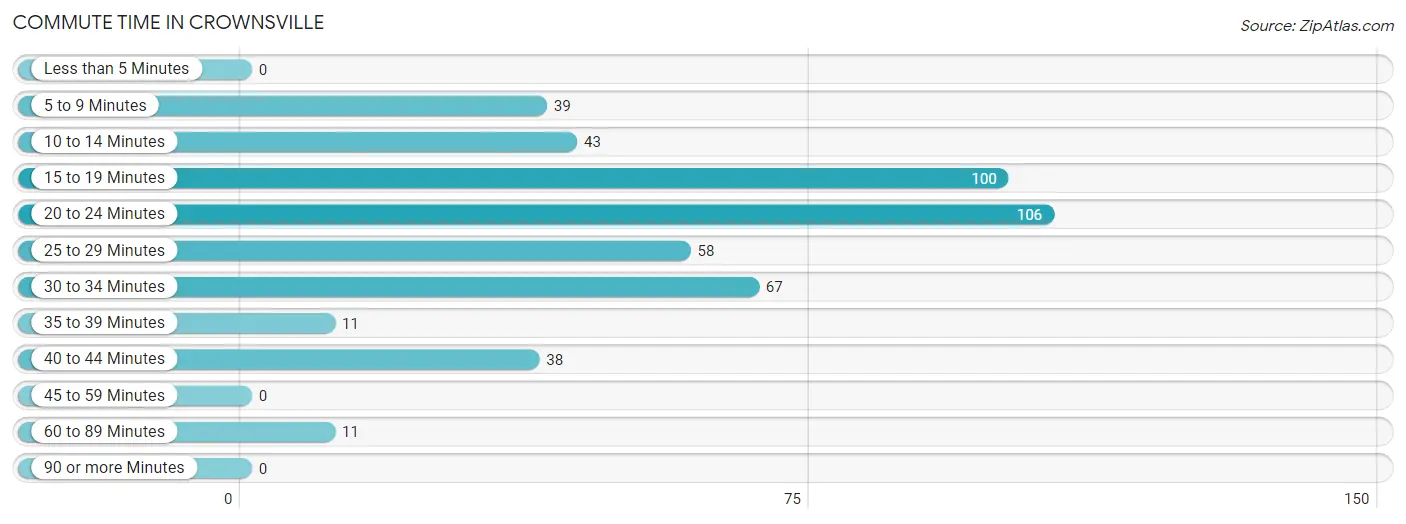
| Commute Time | # Commuters | % Commuters |
| Less than 5 Minutes | 0 | 0.0% |
| 5 to 9 Minutes | 39 | 8.3% |
| 10 to 14 Minutes | 43 | 9.1% |
| 15 to 19 Minutes | 100 | 21.1% |
| 20 to 24 Minutes | 106 | 22.4% |
| 25 to 29 Minutes | 58 | 12.3% |
| 30 to 34 Minutes | 67 | 14.2% |
| 35 to 39 Minutes | 11 | 2.3% |
| 40 to 44 Minutes | 38 | 8.0% |
| 45 to 59 Minutes | 0 | 0.0% |
| 60 to 89 Minutes | 11 | 2.3% |
| 90 or more Minutes | 0 | 0.0% |
Commute Time by Sex in Crownsville
The most common commute times in Crownsville are 20 to 24 minutes (55 commuters, 20.7%) for males and 15 to 19 minutes (67 commuters, 32.4%) for females.
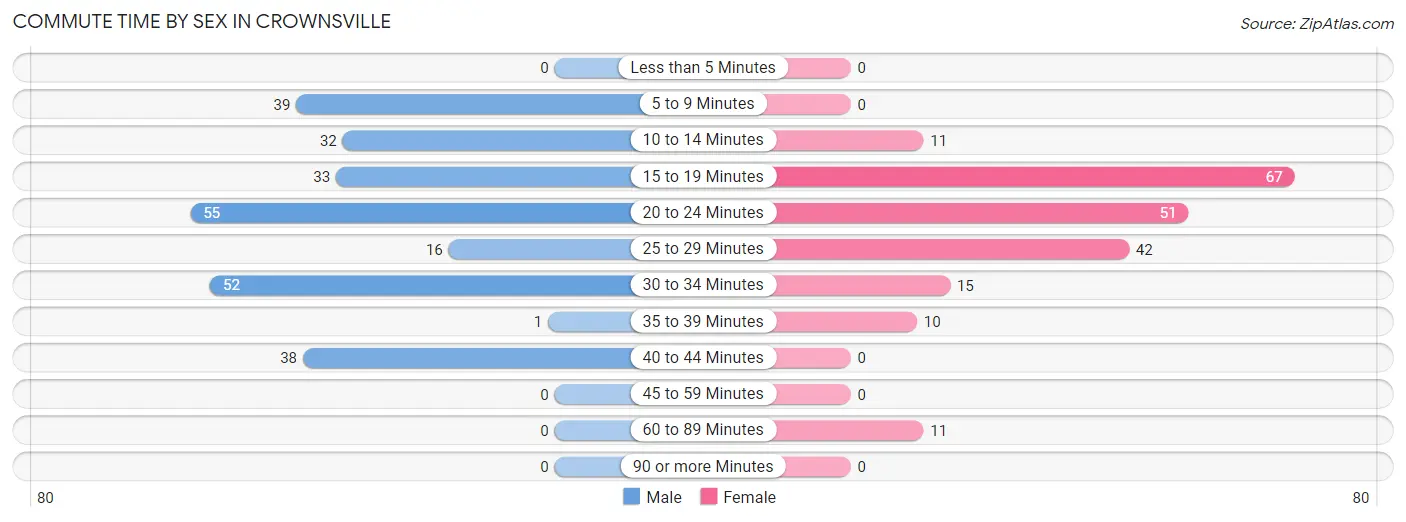
| Commute Time | Male | Female |
| Less than 5 Minutes | 0 (0.0%) | 0 (0.0%) |
| 5 to 9 Minutes | 39 (14.7%) | 0 (0.0%) |
| 10 to 14 Minutes | 32 (12.0%) | 11 (5.3%) |
| 15 to 19 Minutes | 33 (12.4%) | 67 (32.4%) |
| 20 to 24 Minutes | 55 (20.7%) | 51 (24.6%) |
| 25 to 29 Minutes | 16 (6.0%) | 42 (20.3%) |
| 30 to 34 Minutes | 52 (19.6%) | 15 (7.2%) |
| 35 to 39 Minutes | 1 (0.4%) | 10 (4.8%) |
| 40 to 44 Minutes | 38 (14.3%) | 0 (0.0%) |
| 45 to 59 Minutes | 0 (0.0%) | 0 (0.0%) |
| 60 to 89 Minutes | 0 (0.0%) | 11 (5.3%) |
| 90 or more Minutes | 0 (0.0%) | 0 (0.0%) |
Time of Departure to Work by Sex in Crownsville
The most frequent times of departure to work in Crownsville are 5:30 AM to 5:59 AM (39, 14.7%) for males and 4:00 PM to 11:59 PM (59, 28.5%) for females.
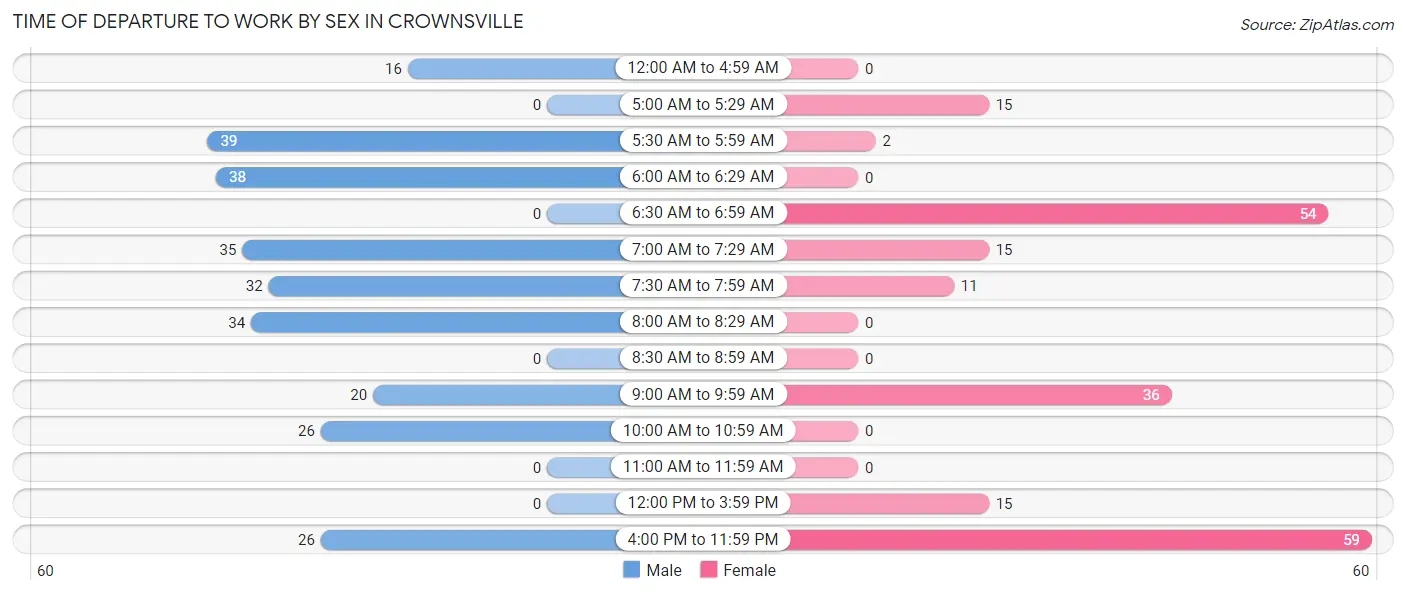
| Time of Departure | Male | Female |
| 12:00 AM to 4:59 AM | 16 (6.0%) | 0 (0.0%) |
| 5:00 AM to 5:29 AM | 0 (0.0%) | 15 (7.2%) |
| 5:30 AM to 5:59 AM | 39 (14.7%) | 2 (1.0%) |
| 6:00 AM to 6:29 AM | 38 (14.3%) | 0 (0.0%) |
| 6:30 AM to 6:59 AM | 0 (0.0%) | 54 (26.1%) |
| 7:00 AM to 7:29 AM | 35 (13.2%) | 15 (7.2%) |
| 7:30 AM to 7:59 AM | 32 (12.0%) | 11 (5.3%) |
| 8:00 AM to 8:29 AM | 34 (12.8%) | 0 (0.0%) |
| 8:30 AM to 8:59 AM | 0 (0.0%) | 0 (0.0%) |
| 9:00 AM to 9:59 AM | 20 (7.5%) | 36 (17.4%) |
| 10:00 AM to 10:59 AM | 26 (9.8%) | 0 (0.0%) |
| 11:00 AM to 11:59 AM | 0 (0.0%) | 0 (0.0%) |
| 12:00 PM to 3:59 PM | 0 (0.0%) | 15 (7.2%) |
| 4:00 PM to 11:59 PM | 26 (9.8%) | 59 (28.5%) |
| Total | 266 (100.0%) | 207 (100.0%) |
Housing Occupancy in Crownsville
Occupancy by Ownership in Crownsville
Of the total 503 dwellings in Crownsville, owner-occupied units account for 503 (100.0%), while renter-occupied units make up 0 (0.0%).
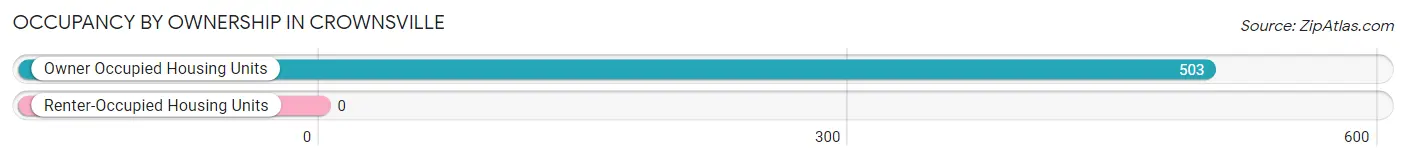
| Occupancy | # Housing Units | % Housing Units |
| Owner Occupied Housing Units | 503 | 100.0% |
| Renter-Occupied Housing Units | 0 | 0.0% |
| Total Occupied Housing Units | 503 | 100.0% |
Occupancy by Household Size in Crownsville
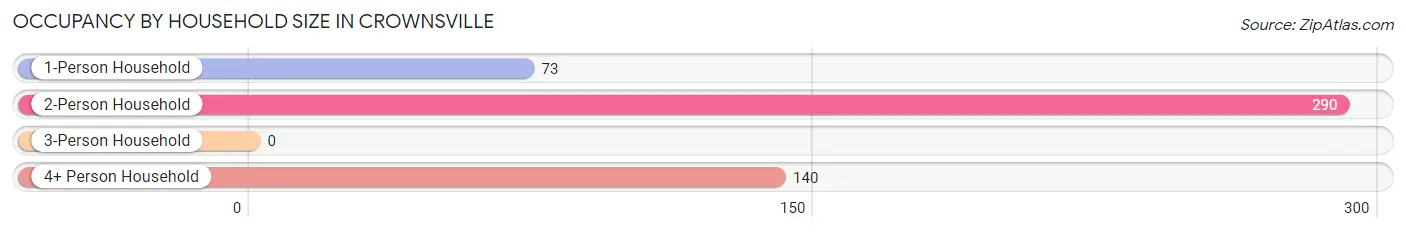
| Household Size | # Housing Units | % Housing Units |
| 1-Person Household | 73 | 14.5% |
| 2-Person Household | 290 | 57.7% |
| 3-Person Household | 0 | 0.0% |
| 4+ Person Household | 140 | 27.8% |
| Total Housing Units | 503 | 100.0% |
Occupancy by Ownership by Household Size in Crownsville
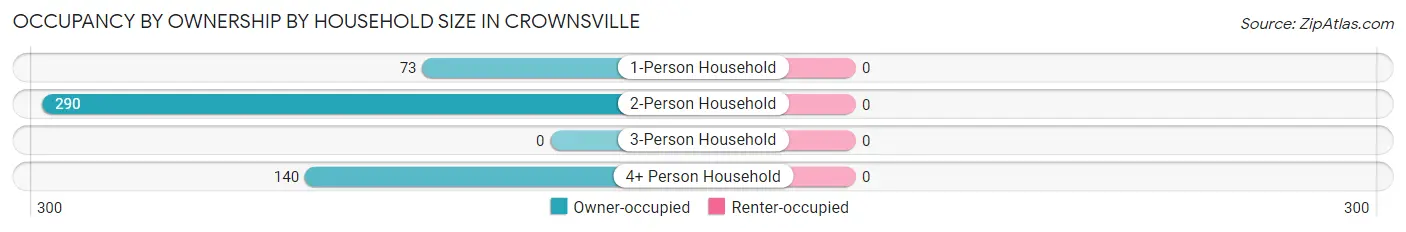
| Household Size | Owner-occupied | Renter-occupied |
| 1-Person Household | 73 (100.0%) | 0 (0.0%) |
| 2-Person Household | 290 (100.0%) | 0 (0.0%) |
| 3-Person Household | 0 (0.0%) | 0 (0.0%) |
| 4+ Person Household | 140 (100.0%) | 0 (0.0%) |
| Total Housing Units | 503 (100.0%) | 0 (0.0%) |
Occupancy by Educational Attainment in Crownsville
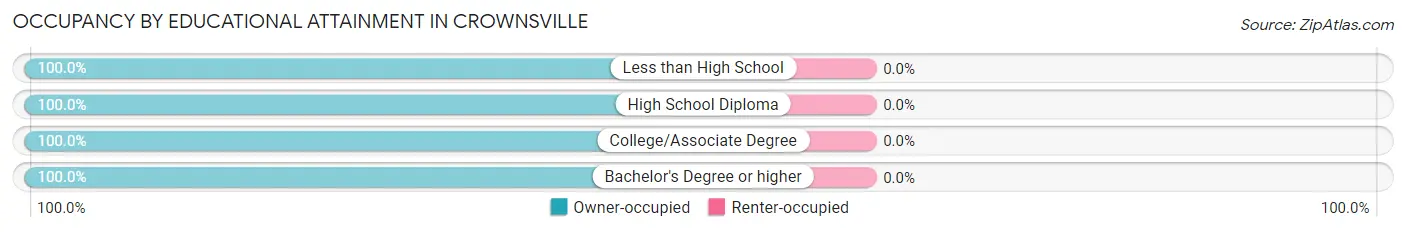
| Household Size | Owner-occupied | Renter-occupied |
| Less than High School | 25 (100.0%) | 0 (0.0%) |
| High School Diploma | 80 (100.0%) | 0 (0.0%) |
| College/Associate Degree | 144 (100.0%) | 0 (0.0%) |
| Bachelor's Degree or higher | 254 (100.0%) | 0 (0.0%) |
Occupancy by Age of Householder in Crownsville
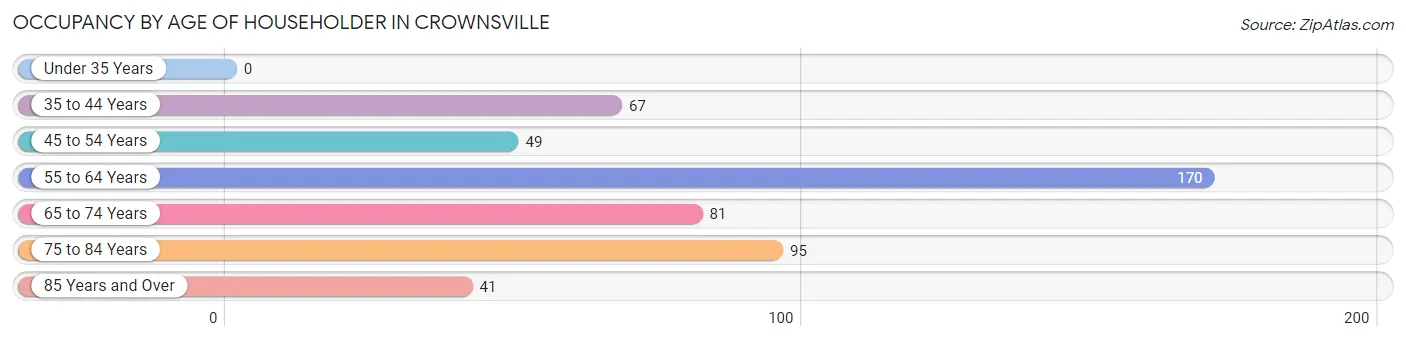
| Age Bracket | # Households | % Households |
| Under 35 Years | 0 | 0.0% |
| 35 to 44 Years | 67 | 13.3% |
| 45 to 54 Years | 49 | 9.7% |
| 55 to 64 Years | 170 | 33.8% |
| 65 to 74 Years | 81 | 16.1% |
| 75 to 84 Years | 95 | 18.9% |
| 85 Years and Over | 41 | 8.2% |
| Total | 503 | 100.0% |
Housing Finances in Crownsville
Median Income by Occupancy in Crownsville
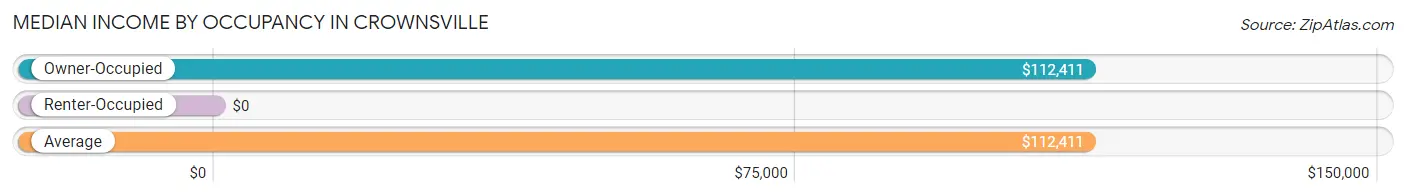
| Occupancy Type | # Households | Median Income |
| Owner-Occupied | 503 (100.0%) | $112,411 |
| Renter-Occupied | 0 (0.0%) | $0 |
| Average | 503 (100.0%) | $112,411 |
Occupancy by Householder Income Bracket in Crownsville
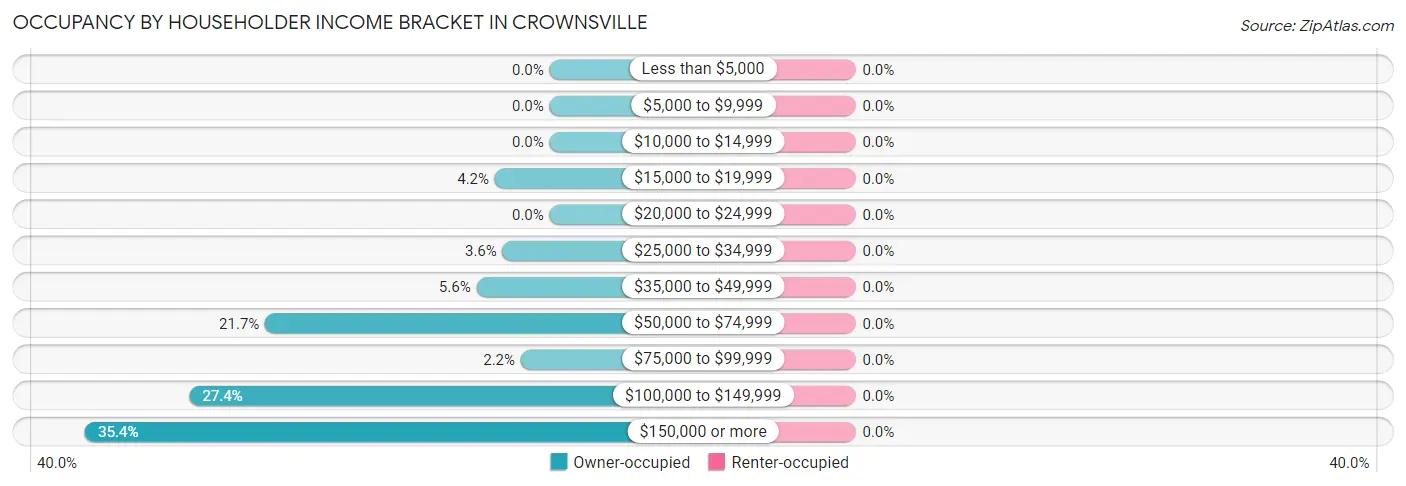
| Income Bracket | Owner-occupied | Renter-occupied |
| Less than $5,000 | 0 (0.0%) | 0 (0.0%) |
| $5,000 to $9,999 | 0 (0.0%) | 0 (0.0%) |
| $10,000 to $14,999 | 0 (0.0%) | 0 (0.0%) |
| $15,000 to $19,999 | 21 (4.2%) | 0 (0.0%) |
| $20,000 to $24,999 | 0 (0.0%) | 0 (0.0%) |
| $25,000 to $34,999 | 18 (3.6%) | 0 (0.0%) |
| $35,000 to $49,999 | 28 (5.6%) | 0 (0.0%) |
| $50,000 to $74,999 | 109 (21.7%) | 0 (0.0%) |
| $75,000 to $99,999 | 11 (2.2%) | 0 (0.0%) |
| $100,000 to $149,999 | 138 (27.4%) | 0 (0.0%) |
| $150,000 or more | 178 (35.4%) | 0 (0.0%) |
| Total | 503 (100.0%) | 0 (0.0%) |
Monthly Housing Cost Tiers in Crownsville
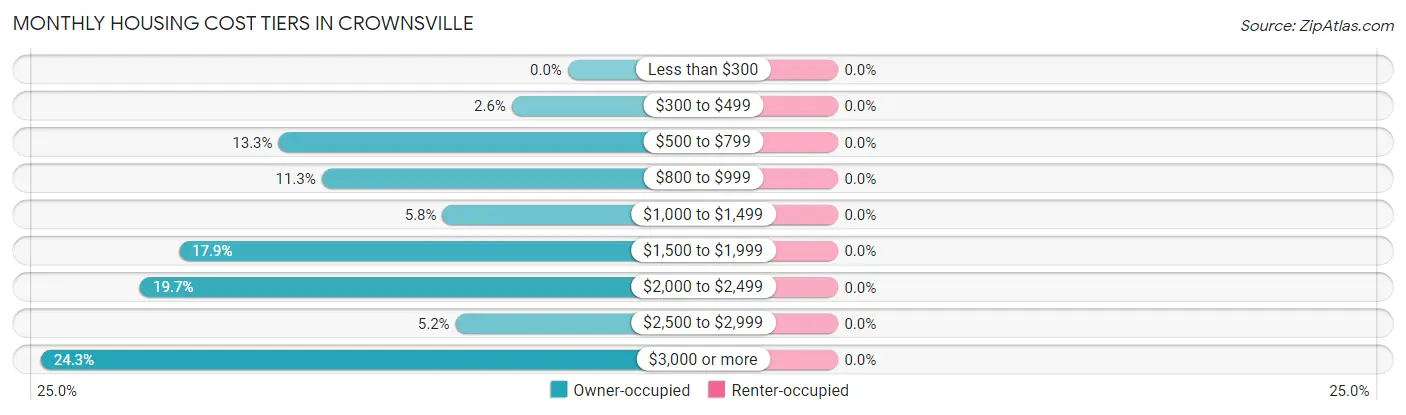
| Monthly Cost | Owner-occupied | Renter-occupied |
| Less than $300 | 0 (0.0%) | 0 (0.0%) |
| $300 to $499 | 13 (2.6%) | 0 (0.0%) |
| $500 to $799 | 67 (13.3%) | 0 (0.0%) |
| $800 to $999 | 57 (11.3%) | 0 (0.0%) |
| $1,000 to $1,499 | 29 (5.8%) | 0 (0.0%) |
| $1,500 to $1,999 | 90 (17.9%) | 0 (0.0%) |
| $2,000 to $2,499 | 99 (19.7%) | 0 (0.0%) |
| $2,500 to $2,999 | 26 (5.2%) | 0 (0.0%) |
| $3,000 or more | 122 (24.2%) | 0 (0.0%) |
| Total | 503 (100.0%) | 0 (0.0%) |
Physical Housing Characteristics in Crownsville
Housing Structures in Crownsville
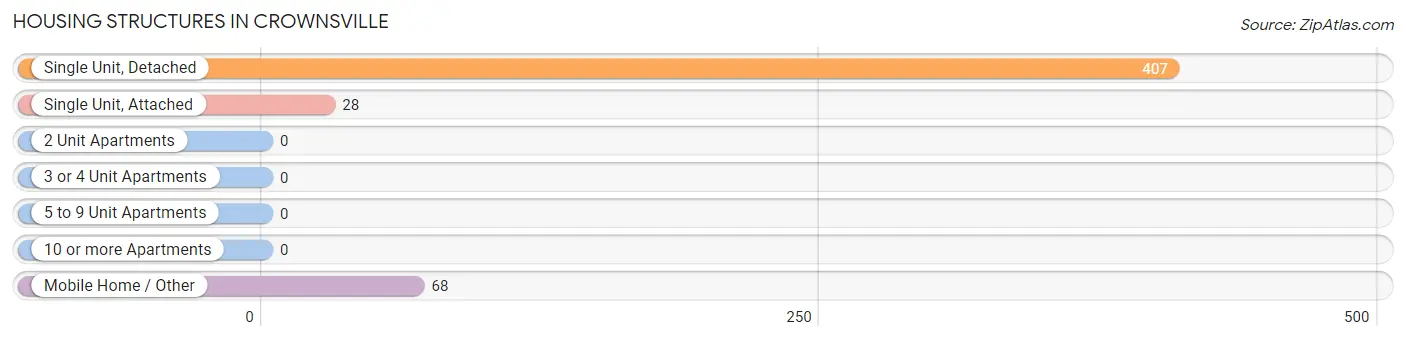
| Structure Type | # Housing Units | % Housing Units |
| Single Unit, Detached | 407 | 80.9% |
| Single Unit, Attached | 28 | 5.6% |
| 2 Unit Apartments | 0 | 0.0% |
| 3 or 4 Unit Apartments | 0 | 0.0% |
| 5 to 9 Unit Apartments | 0 | 0.0% |
| 10 or more Apartments | 0 | 0.0% |
| Mobile Home / Other | 68 | 13.5% |
| Total | 503 | 100.0% |
Housing Structures by Occupancy in Crownsville
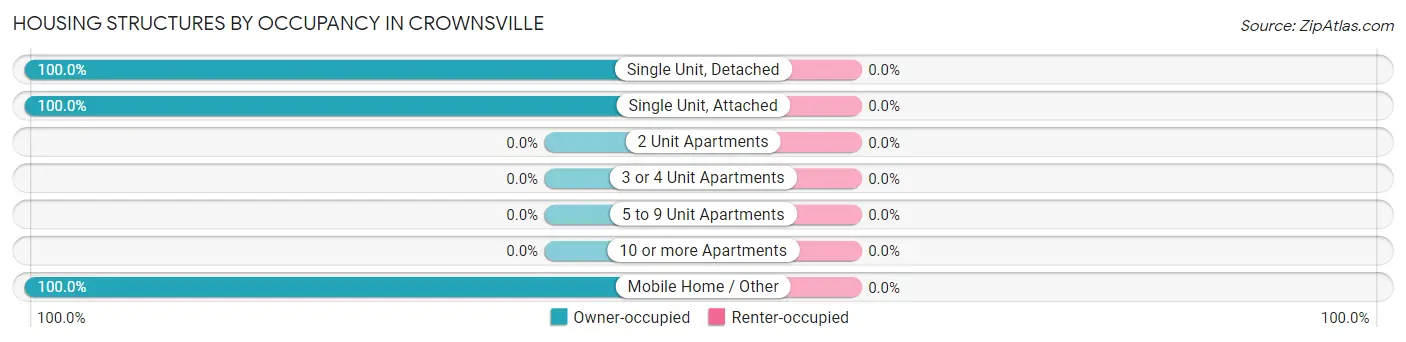
| Structure Type | Owner-occupied | Renter-occupied |
| Single Unit, Detached | 407 (100.0%) | 0 (0.0%) |
| Single Unit, Attached | 28 (100.0%) | 0 (0.0%) |
| 2 Unit Apartments | 0 (0.0%) | 0 (0.0%) |
| 3 or 4 Unit Apartments | 0 (0.0%) | 0 (0.0%) |
| 5 to 9 Unit Apartments | 0 (0.0%) | 0 (0.0%) |
| 10 or more Apartments | 0 (0.0%) | 0 (0.0%) |
| Mobile Home / Other | 68 (100.0%) | 0 (0.0%) |
| Total | 503 (100.0%) | 0 (0.0%) |
Housing Structures by Number of Rooms in Crownsville
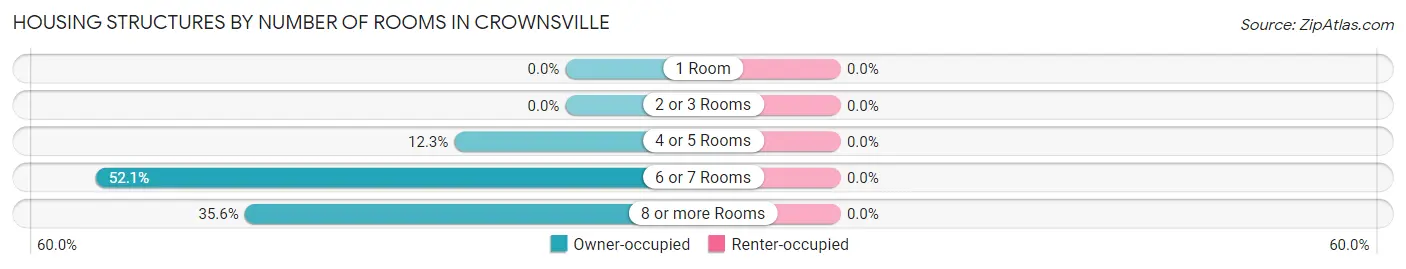
| Number of Rooms | Owner-occupied | Renter-occupied |
| 1 Room | 0 (0.0%) | 0 (0.0%) |
| 2 or 3 Rooms | 0 (0.0%) | 0 (0.0%) |
| 4 or 5 Rooms | 62 (12.3%) | 0 (0.0%) |
| 6 or 7 Rooms | 262 (52.1%) | 0 (0.0%) |
| 8 or more Rooms | 179 (35.6%) | 0 (0.0%) |
| Total | 503 (100.0%) | 0 (0.0%) |
Housing Structure by Heating Type in Crownsville
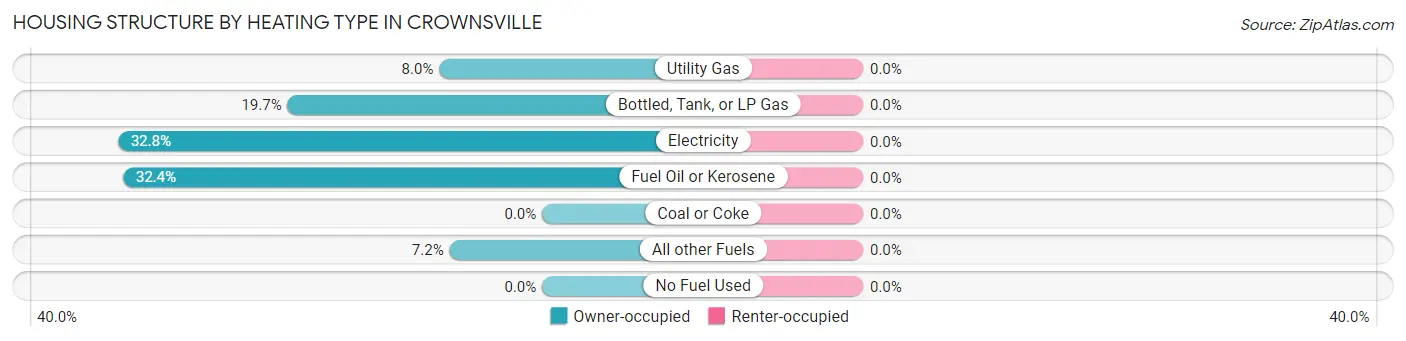
| Heating Type | Owner-occupied | Renter-occupied |
| Utility Gas | 40 (8.0%) | 0 (0.0%) |
| Bottled, Tank, or LP Gas | 99 (19.7%) | 0 (0.0%) |
| Electricity | 165 (32.8%) | 0 (0.0%) |
| Fuel Oil or Kerosene | 163 (32.4%) | 0 (0.0%) |
| Coal or Coke | 0 (0.0%) | 0 (0.0%) |
| All other Fuels | 36 (7.2%) | 0 (0.0%) |
| No Fuel Used | 0 (0.0%) | 0 (0.0%) |
| Total | 503 (100.0%) | 0 (0.0%) |
Household Vehicle Usage in Crownsville
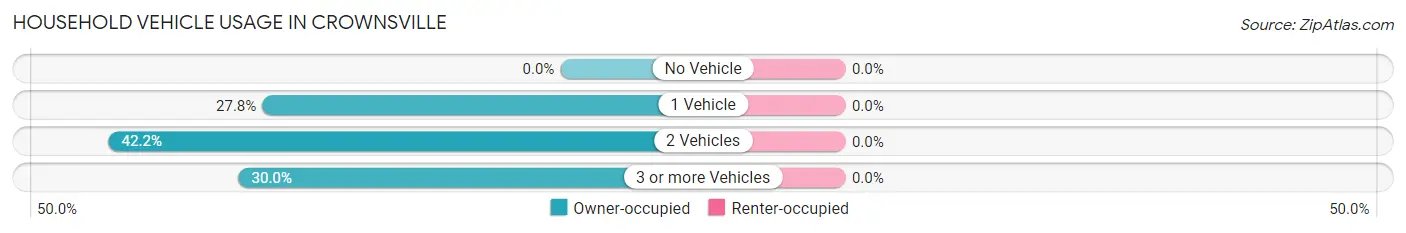
| Vehicles per Household | Owner-occupied | Renter-occupied |
| No Vehicle | 0 (0.0%) | 0 (0.0%) |
| 1 Vehicle | 140 (27.8%) | 0 (0.0%) |
| 2 Vehicles | 212 (42.1%) | 0 (0.0%) |
| 3 or more Vehicles | 151 (30.0%) | 0 (0.0%) |
| Total | 503 (100.0%) | 0 (0.0%) |
Real Estate & Mortgages in Crownsville
Real Estate and Mortgage Overview in Crownsville
| Characteristic | Without Mortgage | With Mortgage |
| Housing Units | 155 | 348 |
| Median Property Value | $647,700 | $574,200 |
| Median Household Income | - | - |
| Monthly Housing Costs | $782 | $122 |
| Real Estate Taxes | $4,060 | $0 |
Property Value by Mortgage Status in Crownsville
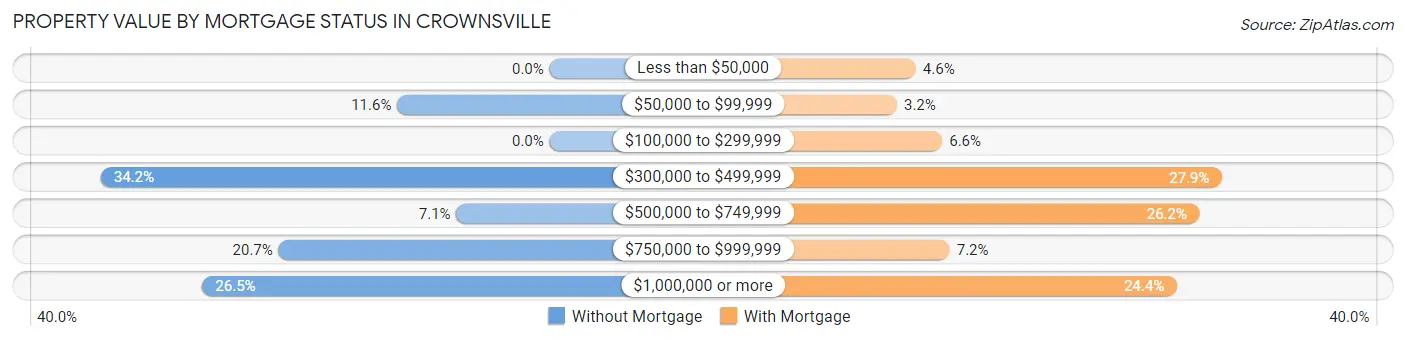
| Property Value | Without Mortgage | With Mortgage |
| Less than $50,000 | 0 (0.0%) | 16 (4.6%) |
| $50,000 to $99,999 | 18 (11.6%) | 11 (3.2%) |
| $100,000 to $299,999 | 0 (0.0%) | 23 (6.6%) |
| $300,000 to $499,999 | 53 (34.2%) | 97 (27.9%) |
| $500,000 to $749,999 | 11 (7.1%) | 91 (26.2%) |
| $750,000 to $999,999 | 32 (20.6%) | 25 (7.2%) |
| $1,000,000 or more | 41 (26.5%) | 85 (24.4%) |
| Total | 155 (100.0%) | 348 (100.0%) |
Household Income by Mortgage Status in Crownsville
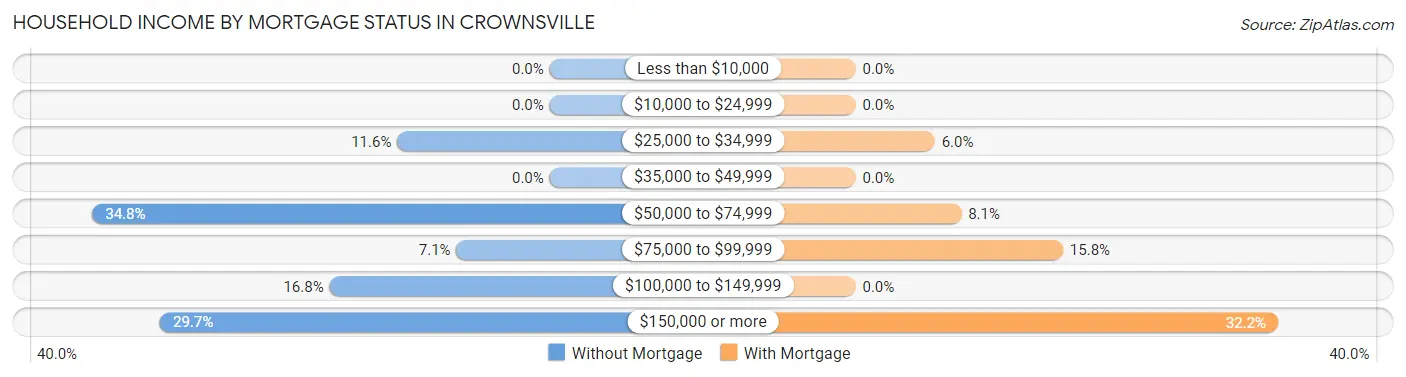
| Household Income | Without Mortgage | With Mortgage |
| Less than $10,000 | 0 (0.0%) | 0 (0.0%) |
| $10,000 to $24,999 | 0 (0.0%) | 0 (0.0%) |
| $25,000 to $34,999 | 18 (11.6%) | 21 (6.0%) |
| $35,000 to $49,999 | 0 (0.0%) | 0 (0.0%) |
| $50,000 to $74,999 | 54 (34.8%) | 28 (8.1%) |
| $75,000 to $99,999 | 11 (7.1%) | 55 (15.8%) |
| $100,000 to $149,999 | 26 (16.8%) | 0 (0.0%) |
| $150,000 or more | 46 (29.7%) | 112 (32.2%) |
| Total | 155 (100.0%) | 348 (100.0%) |
Property Value to Household Income Ratio in Crownsville
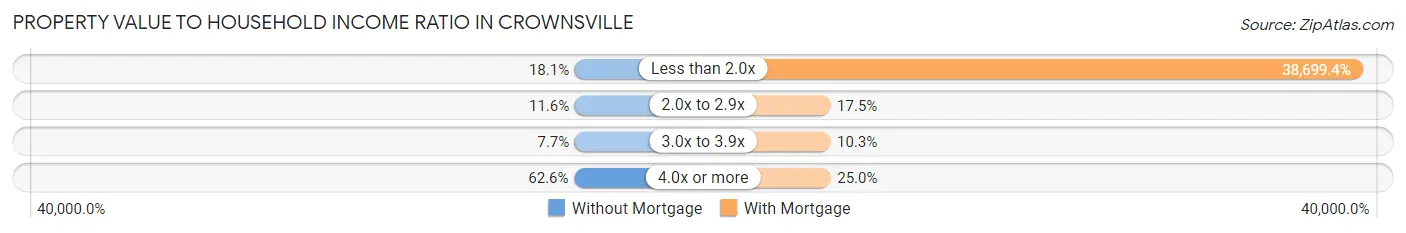
| Value-to-Income Ratio | Without Mortgage | With Mortgage |
| Less than 2.0x | 28 (18.1%) | 134,674 (38,699.4%) |
| 2.0x to 2.9x | 18 (11.6%) | 61 (17.5%) |
| 3.0x to 3.9x | 12 (7.7%) | 36 (10.3%) |
| 4.0x or more | 97 (62.6%) | 87 (25.0%) |
| Total | 155 (100.0%) | 348 (100.0%) |
Real Estate Taxes by Mortgage Status in Crownsville
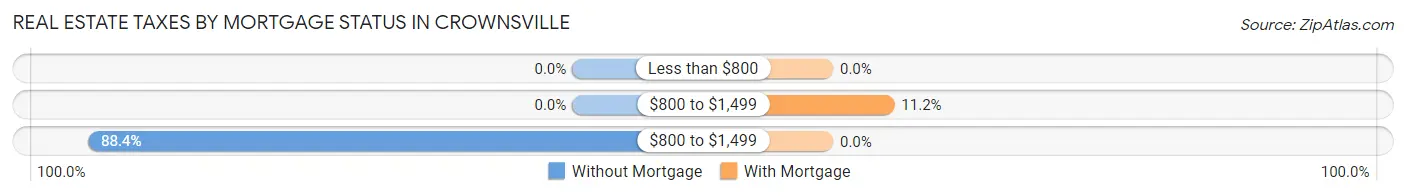
| Property Taxes | Without Mortgage | With Mortgage |
| Less than $800 | 0 (0.0%) | 0 (0.0%) |
| $800 to $1,499 | 0 (0.0%) | 39 (11.2%) |
| $800 to $1,499 | 137 (88.4%) | 0 (0.0%) |
| Total | 155 (100.0%) | 348 (100.0%) |
Health & Disability in Crownsville
Health Insurance Coverage by Age in Crownsville
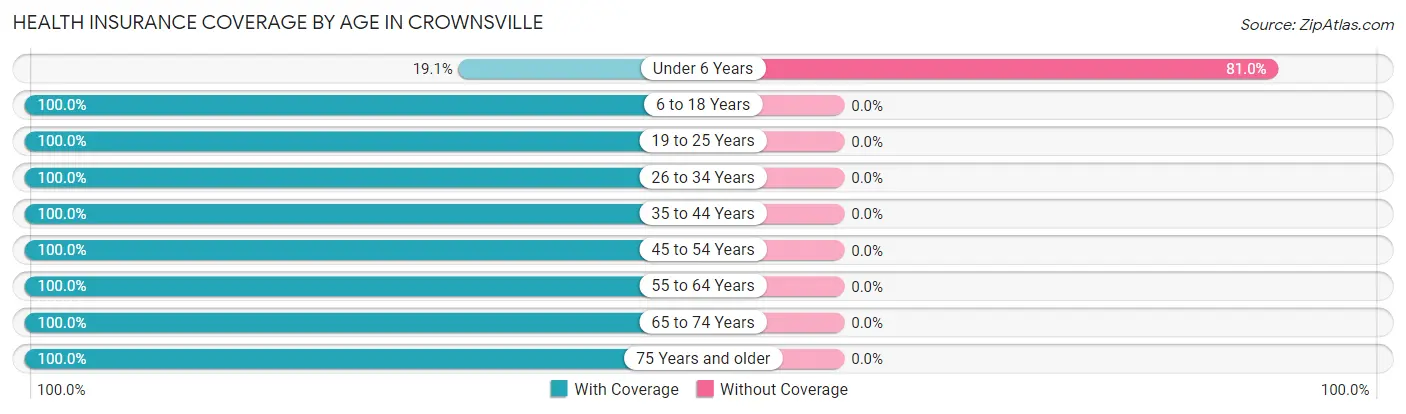
| Age Bracket | With Coverage | Without Coverage |
| Under 6 Years | 4 (19.1%) | 17 (80.9%) |
| 6 to 18 Years | 201 (100.0%) | 0 (0.0%) |
| 19 to 25 Years | 6 (100.0%) | 0 (0.0%) |
| 26 to 34 Years | 68 (100.0%) | 0 (0.0%) |
| 35 to 44 Years | 139 (100.0%) | 0 (0.0%) |
| 45 to 54 Years | 129 (100.0%) | 0 (0.0%) |
| 55 to 64 Years | 322 (100.0%) | 0 (0.0%) |
| 65 to 74 Years | 232 (100.0%) | 0 (0.0%) |
| 75 Years and older | 245 (100.0%) | 0 (0.0%) |
| Total | 1,346 (98.8%) | 17 (1.3%) |
Health Insurance Coverage by Citizenship Status in Crownsville
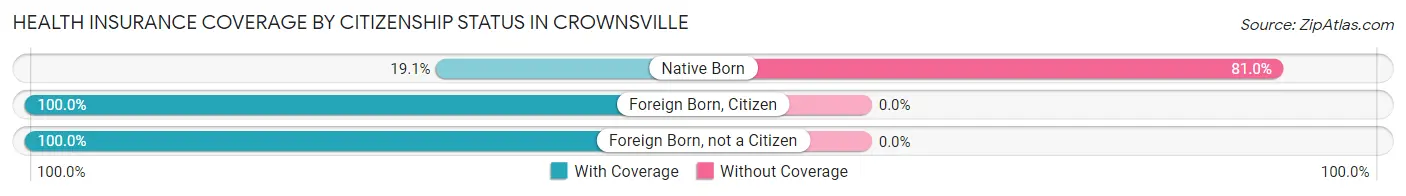
| Citizenship Status | With Coverage | Without Coverage |
| Native Born | 4 (19.1%) | 17 (80.9%) |
| Foreign Born, Citizen | 201 (100.0%) | 0 (0.0%) |
| Foreign Born, not a Citizen | 6 (100.0%) | 0 (0.0%) |
Health Insurance Coverage by Household Income in Crownsville
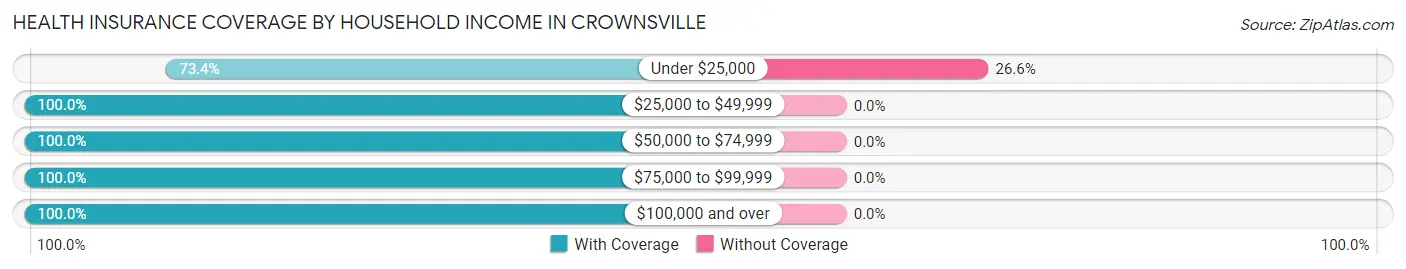
| Household Income | With Coverage | Without Coverage |
| Under $25,000 | 47 (73.4%) | 17 (26.6%) |
| $25,000 to $49,999 | 73 (100.0%) | 0 (0.0%) |
| $50,000 to $74,999 | 180 (100.0%) | 0 (0.0%) |
| $75,000 to $99,999 | 23 (100.0%) | 0 (0.0%) |
| $100,000 and over | 884 (100.0%) | 0 (0.0%) |
Public vs Private Health Insurance Coverage by Age in Crownsville
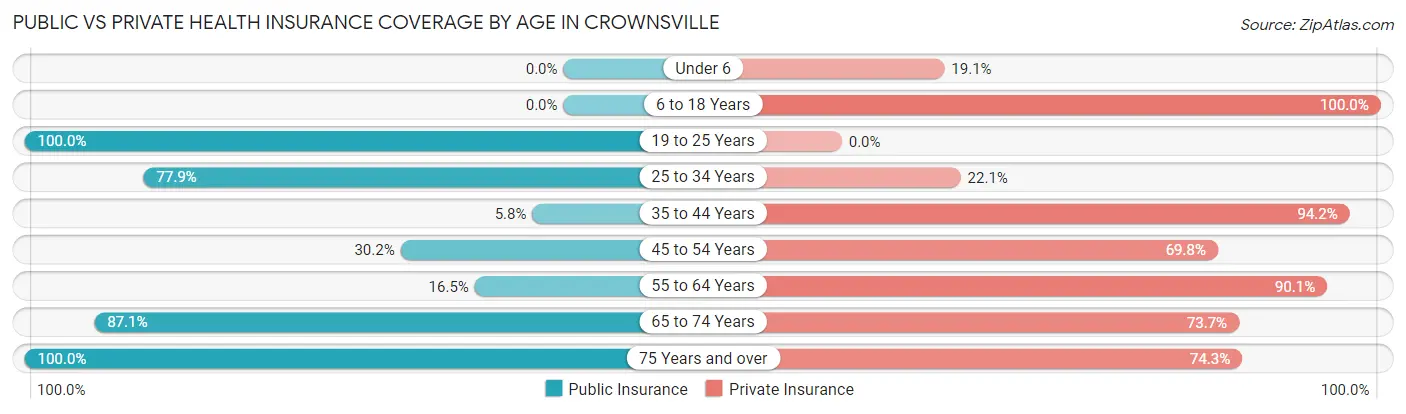
| Age Bracket | Public Insurance | Private Insurance |
| Under 6 | 0 (0.0%) | 4 (19.1%) |
| 6 to 18 Years | 0 (0.0%) | 201 (100.0%) |
| 19 to 25 Years | 6 (100.0%) | 0 (0.0%) |
| 25 to 34 Years | 53 (77.9%) | 15 (22.1%) |
| 35 to 44 Years | 8 (5.8%) | 131 (94.2%) |
| 45 to 54 Years | 39 (30.2%) | 90 (69.8%) |
| 55 to 64 Years | 53 (16.5%) | 290 (90.1%) |
| 65 to 74 Years | 202 (87.1%) | 171 (73.7%) |
| 75 Years and over | 245 (100.0%) | 182 (74.3%) |
| Total | 606 (44.5%) | 1,084 (79.5%) |
Disability Status by Sex by Age in Crownsville
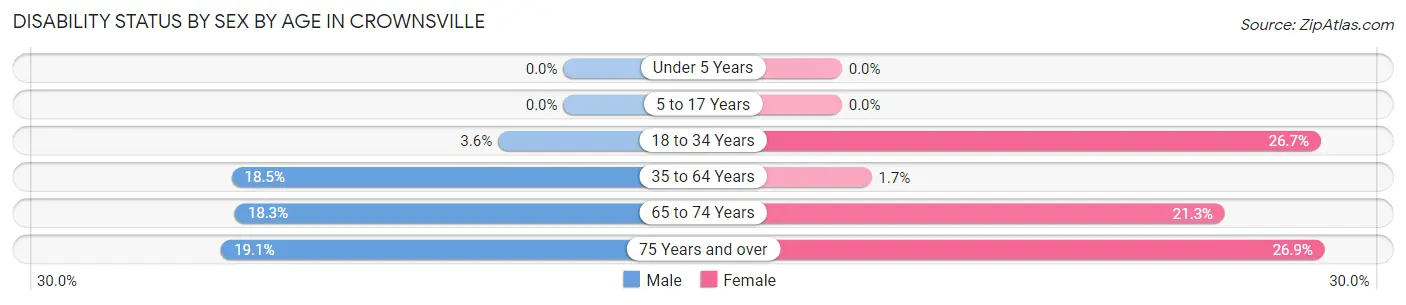
| Age Bracket | Male | Female |
| Under 5 Years | 0 (0.0%) | 0 (0.0%) |
| 5 to 17 Years | 0 (0.0%) | 0 (0.0%) |
| 18 to 34 Years | 2 (3.6%) | 12 (26.7%) |
| 35 to 64 Years | 53 (18.5%) | 5 (1.7%) |
| 65 to 74 Years | 15 (18.3%) | 32 (21.3%) |
| 75 Years and over | 24 (19.1%) | 32 (26.9%) |
Disability Class by Sex by Age in Crownsville
Disability Class: Hearing Difficulty
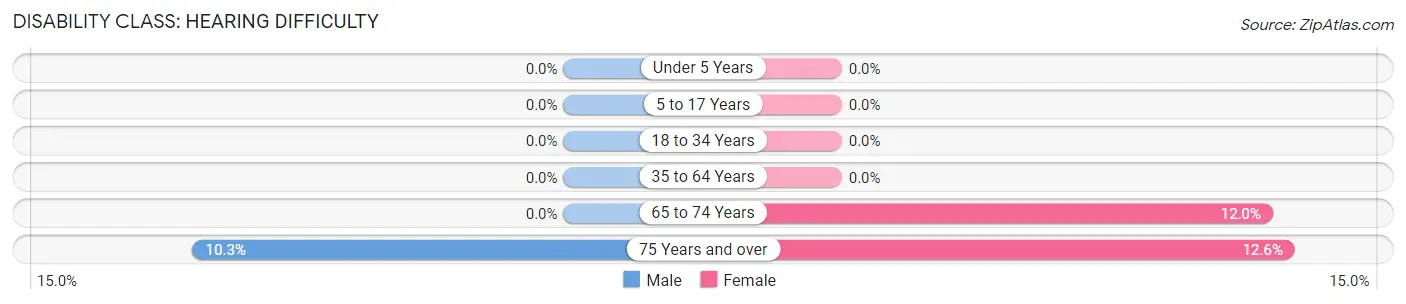
| Age Bracket | Male | Female |
| Under 5 Years | 0 (0.0%) | 0 (0.0%) |
| 5 to 17 Years | 0 (0.0%) | 0 (0.0%) |
| 18 to 34 Years | 0 (0.0%) | 0 (0.0%) |
| 35 to 64 Years | 0 (0.0%) | 0 (0.0%) |
| 65 to 74 Years | 0 (0.0%) | 18 (12.0%) |
| 75 Years and over | 13 (10.3%) | 15 (12.6%) |
Disability Class: Vision Difficulty
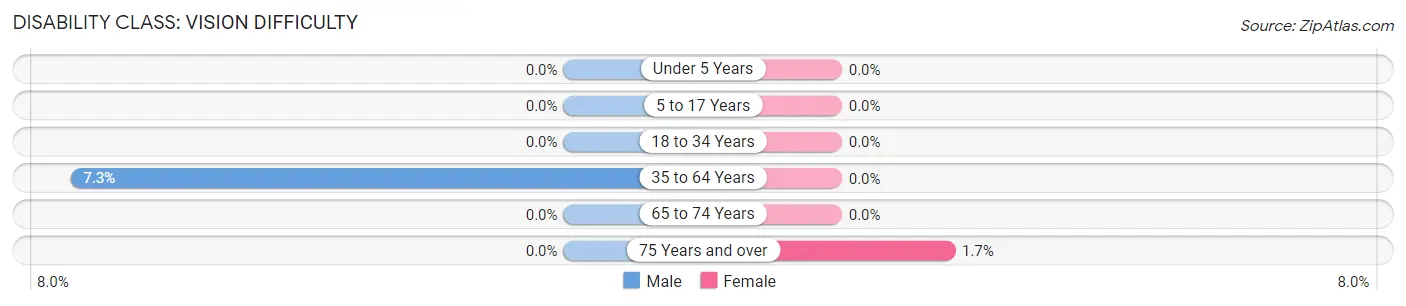
| Age Bracket | Male | Female |
| Under 5 Years | 0 (0.0%) | 0 (0.0%) |
| 5 to 17 Years | 0 (0.0%) | 0 (0.0%) |
| 18 to 34 Years | 0 (0.0%) | 0 (0.0%) |
| 35 to 64 Years | 21 (7.3%) | 0 (0.0%) |
| 65 to 74 Years | 0 (0.0%) | 0 (0.0%) |
| 75 Years and over | 0 (0.0%) | 2 (1.7%) |
Disability Class: Cognitive Difficulty
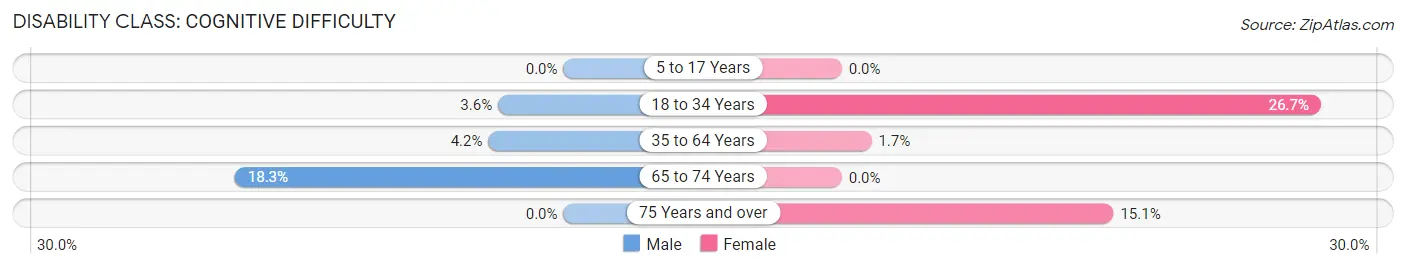
| Age Bracket | Male | Female |
| 5 to 17 Years | 0 (0.0%) | 0 (0.0%) |
| 18 to 34 Years | 2 (3.6%) | 12 (26.7%) |
| 35 to 64 Years | 12 (4.2%) | 5 (1.7%) |
| 65 to 74 Years | 15 (18.3%) | 0 (0.0%) |
| 75 Years and over | 0 (0.0%) | 18 (15.1%) |
Disability Class: Ambulatory Difficulty
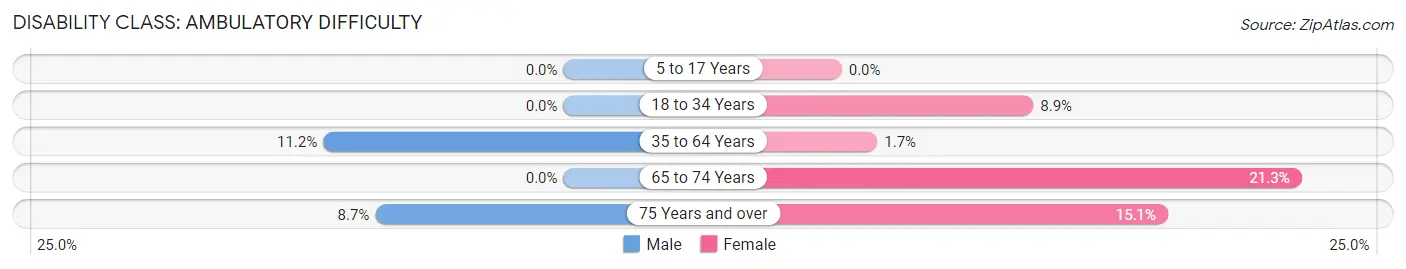
| Age Bracket | Male | Female |
| 5 to 17 Years | 0 (0.0%) | 0 (0.0%) |
| 18 to 34 Years | 0 (0.0%) | 4 (8.9%) |
| 35 to 64 Years | 32 (11.2%) | 5 (1.7%) |
| 65 to 74 Years | 0 (0.0%) | 32 (21.3%) |
| 75 Years and over | 11 (8.7%) | 18 (15.1%) |
Disability Class: Self-Care Difficulty
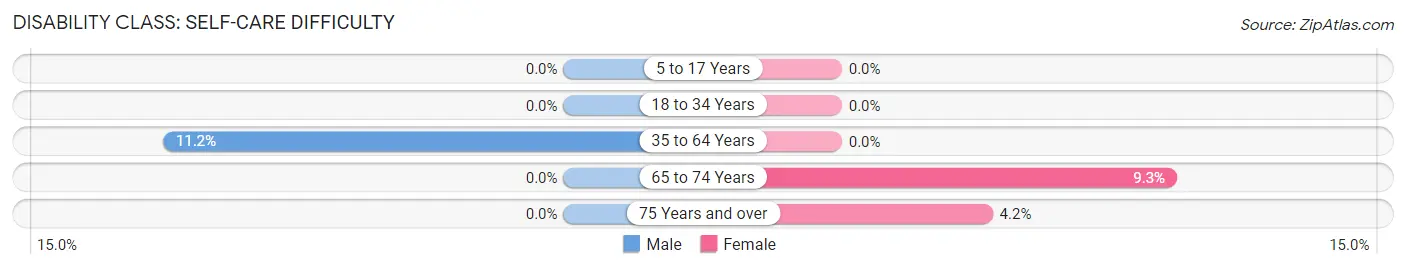
| Age Bracket | Male | Female |
| 5 to 17 Years | 0 (0.0%) | 0 (0.0%) |
| 18 to 34 Years | 0 (0.0%) | 0 (0.0%) |
| 35 to 64 Years | 32 (11.2%) | 0 (0.0%) |
| 65 to 74 Years | 0 (0.0%) | 14 (9.3%) |
| 75 Years and over | 0 (0.0%) | 5 (4.2%) |
Technology Access in Crownsville
Computing Device Access in Crownsville
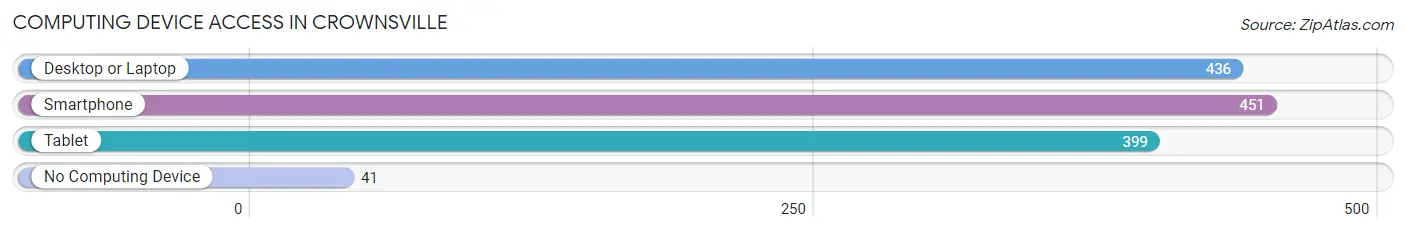
| Device Type | # Households | % Households |
| Desktop or Laptop | 436 | 86.7% |
| Smartphone | 451 | 89.7% |
| Tablet | 399 | 79.3% |
| No Computing Device | 41 | 8.2% |
| Total | 503 | 100.0% |
Internet Access in Crownsville
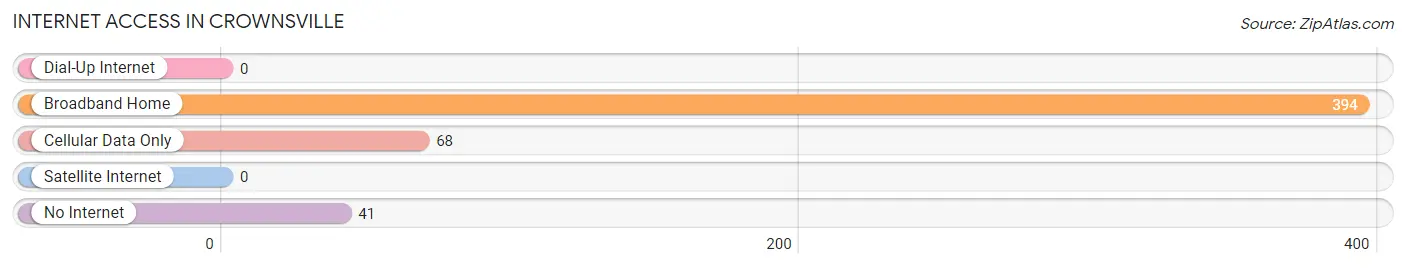
| Internet Type | # Households | % Households |
| Dial-Up Internet | 0 | 0.0% |
| Broadband Home | 394 | 78.3% |
| Cellular Data Only | 68 | 13.5% |
| Satellite Internet | 0 | 0.0% |
| No Internet | 41 | 8.2% |
| Total | 503 | 100.0% |
Crownsville Summary
Crownsville is an unincorporated community located in Anne Arundel County, Maryland, United States. It is situated between the cities of Annapolis and Baltimore, and is part of the Baltimore-Washington metropolitan area. The population of Crownsville was 2,936 at the 2010 census.
History
The area now known as Crownsville was originally inhabited by the Piscataway Indians. The first European settlers arrived in the area in the 1650s, and the town was officially established in 1783. The town was named after the Crown family, who were among the first settlers.
In the 19th century, Crownsville was a thriving agricultural community, with many farms and plantations. The town was also home to a number of mills, including a grist mill, a saw mill, and a paper mill.
In the early 20th century, Crownsville began to experience a period of growth and development. The town was home to a number of businesses, including a hotel, a general store, a post office, and a movie theater.
In the 1950s, the Maryland State Hospital was established in Crownsville. The hospital was a psychiatric facility that served the state of Maryland until it was closed in 2004.
Geography
Crownsville is located in Anne Arundel County, Maryland, at 39°02'N 76°35'W. The town is situated between the cities of Annapolis and Baltimore, and is part of the Baltimore-Washington metropolitan area.
The town is bordered to the north by the Severn River, to the east by the South River, to the south by the Patuxent River, and to the west by the Chesapeake Bay.
Economy
Crownsville is primarily a residential community, with a few small businesses located in the town. The town is home to a number of restaurants, including the Crownsville Diner, the Crownsville Tavern, and the Crownsville Pizza & Subs.
The town is also home to a number of retail stores, including a grocery store, a hardware store, and a pharmacy.
Demographics
As of the 2010 census, the population of Crownsville was 2,936. The racial makeup of the town was 79.3% White, 14.2% African American, 0.7% Native American, 1.2% Asian, 0.1% Pacific Islander, 1.7% from other races, and 2.9% from two or more races. Hispanic or Latino of any race were 4.2% of the population.
The median household income in Crownsville was $76,944, and the median family income was $87,813. The per capita income for the town was $35,945. About 4.3% of families and 5.7% of the population were below the poverty line, including 8.2% of those under age 18 and 4.2% of those age 65 or over.
Common Questions
What is Per Capita Income in Crownsville?
Per Capita income in Crownsville is $55,236.
What is the Median Family Income in Crownsville?
Median Family Income in Crownsville is $134,565.
What is the Median Household income in Crownsville?
Median Household Income in Crownsville is $112,411.
What is Inequality or Gini Index in Crownsville?
Inequality or Gini Index in Crownsville is 0.38.
What is the Total Population of Crownsville?
Total Population of Crownsville is 1,363.
What is the Total Male Population of Crownsville?
Total Male Population of Crownsville is 633.
What is the Total Female Population of Crownsville?
Total Female Population of Crownsville is 730.
What is the Ratio of Males per 100 Females in Crownsville?
There are 86.71 Males per 100 Females in Crownsville.
What is the Ratio of Females per 100 Males in Crownsville?
There are 115.32 Females per 100 Males in Crownsville.
What is the Median Population Age in Crownsville?
Median Population Age in Crownsville is 58.9 Years.
What is the Average Family Size in Crownsville
Average Family Size in Crownsville is 2.7 People.
What is the Average Household Size in Crownsville
Average Household Size in Crownsville is 2.4 People.
How Large is the Labor Force in Crownsville?
There are 581 People in the Labor Forcein in Crownsville.
What is the Percentage of People in the Labor Force in Crownsville?
48.7% of People are in the Labor Force in Crownsville.
What is the Unemployment Rate in Crownsville?
Unemployment Rate in Crownsville is 3.4%.