Butler, MO Map & Demographics
Butler Map
Butler Overview
$20,640
PER CAPITA INCOME
$42,386
AVG FAMILY INCOME
$33,548
AVG HOUSEHOLD INCOME
19.2%
WAGE / INCOME GAP [ % ]
80.8¢/ $1
WAGE / INCOME GAP [ $ ]
0.47
INEQUALITY / GINI INDEX
4,541
TOTAL POPULATION
2,319
MALE POPULATION
2,222
FEMALE POPULATION
104.37
MALES / 100 FEMALES
95.82
FEMALES / 100 MALES
36.7
MEDIAN AGE
3.4
AVG FAMILY SIZE
2.6
AVG HOUSEHOLD SIZE
1,607
LABOR FORCE [ PEOPLE ]
46.5%
PERCENT IN LABOR FORCE
14.7%
UNEMPLOYMENT RATE
Butler Zip Codes
Butler Area Codes
Income in Butler
Income Overview in Butler
Per Capita Income in Butler is $20,640, while median incomes of families and households are $42,386 and $33,548 respectively.
| Characteristic | Number | Measure |
| Per Capita Income | 4,541 | $20,640 |
| Median Family Income | 947 | $42,386 |
| Mean Family Income | 947 | $67,338 |
| Median Household Income | 1,649 | $33,548 |
| Mean Household Income | 1,649 | $51,714 |
| Income Deficit | 947 | $0 |
| Wage / Income Gap (%) | 4,541 | 19.24% |
| Wage / Income Gap ($) | 4,541 | 80.76¢ per $1 |
| Gini / Inequality Index | 4,541 | 0.47 |
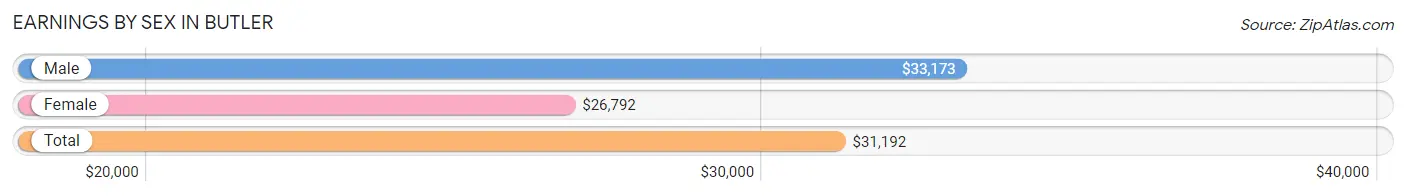
Earnings by Sex in Butler
Average Earnings in Butler are $31,192, $33,173 for men and $26,792 for women, a difference of 19.2%.
| Sex | Number | Average Earnings |
| Male | 903 (56.5%) | $33,173 |
| Female | 694 (43.5%) | $26,792 |
| Total | 1,597 (100.0%) | $31,192 |
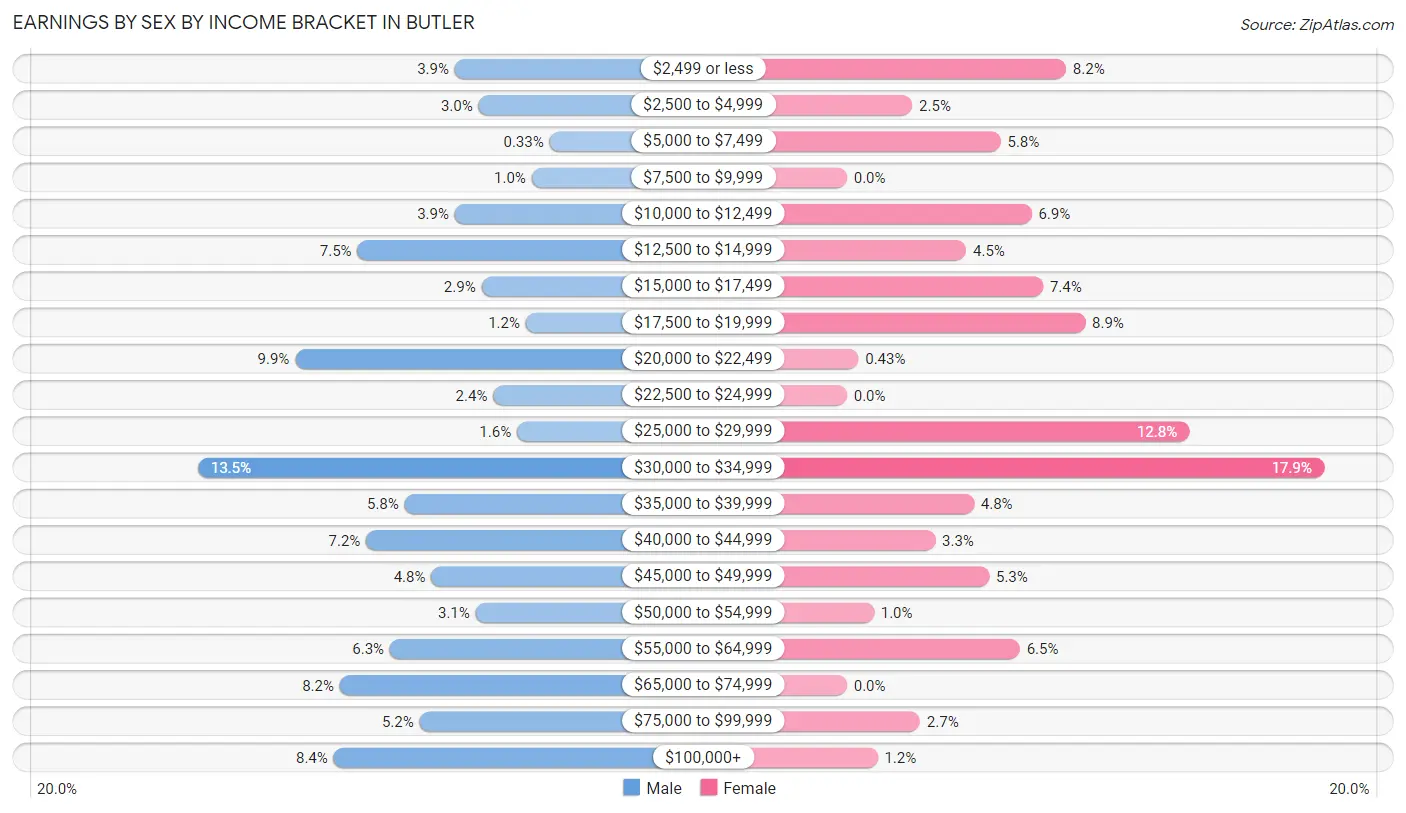
Earnings by Sex by Income Bracket in Butler
The most common earnings brackets in Butler are $30,000 to $34,999 for men (122 | 13.5%) and $30,000 to $34,999 for women (124 | 17.9%).
| Income | Male | Female |
| $2,499 or less | 35 (3.9%) | 57 (8.2%) |
| $2,500 to $4,999 | 27 (3.0%) | 17 (2.5%) |
| $5,000 to $7,499 | 3 (0.3%) | 40 (5.8%) |
| $7,500 to $9,999 | 9 (1.0%) | 0 (0.0%) |
| $10,000 to $12,499 | 35 (3.9%) | 48 (6.9%) |
| $12,500 to $14,999 | 68 (7.5%) | 31 (4.5%) |
| $15,000 to $17,499 | 26 (2.9%) | 51 (7.3%) |
| $17,500 to $19,999 | 11 (1.2%) | 62 (8.9%) |
| $20,000 to $22,499 | 89 (9.9%) | 3 (0.4%) |
| $22,500 to $24,999 | 22 (2.4%) | 0 (0.0%) |
| $25,000 to $29,999 | 14 (1.5%) | 89 (12.8%) |
| $30,000 to $34,999 | 122 (13.5%) | 124 (17.9%) |
| $35,000 to $39,999 | 52 (5.8%) | 33 (4.8%) |
| $40,000 to $44,999 | 65 (7.2%) | 23 (3.3%) |
| $45,000 to $49,999 | 43 (4.8%) | 37 (5.3%) |
| $50,000 to $54,999 | 28 (3.1%) | 7 (1.0%) |
| $55,000 to $64,999 | 57 (6.3%) | 45 (6.5%) |
| $65,000 to $74,999 | 74 (8.2%) | 0 (0.0%) |
| $75,000 to $99,999 | 47 (5.2%) | 19 (2.7%) |
| $100,000+ | 76 (8.4%) | 8 (1.1%) |
| Total | 903 (100.0%) | 694 (100.0%) |
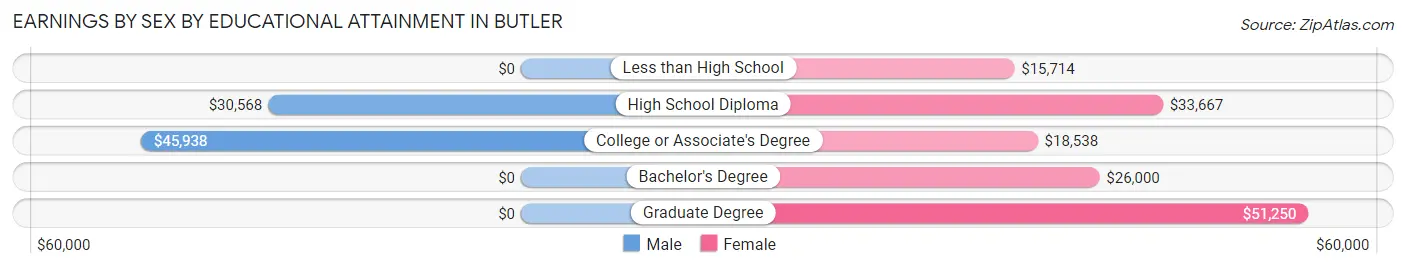
Earnings by Sex by Educational Attainment in Butler
Average earnings in Butler are $38,397 for men and $27,569 for women, a difference of 28.2%. Men with an educational attainment of college or associate's degree enjoy the highest average annual earnings of $45,938, while those with high school diploma education earn the least with $30,568. Women with an educational attainment of graduate degree earn the most with the average annual earnings of $51,250, while those with less than high school education have the smallest earnings of $15,714.
| Educational Attainment | Male Income | Female Income |
| Less than High School | - | - |
| High School Diploma | $30,568 | $33,667 |
| College or Associate's Degree | $45,938 | $18,538 |
| Bachelor's Degree | - | - |
| Graduate Degree | - | - |
| Total | $38,397 | $27,569 |
Family Income in Butler
Family Income Brackets in Butler
According to the Butler family income data, there are 234 families falling into the $25,000 to $34,999 income range, which is the most common income bracket and makes up 24.7% of all families. Conversely, the $150,000 to $199,999 income bracket is the least frequent group with only 19 families (2.0%) belonging to this category.
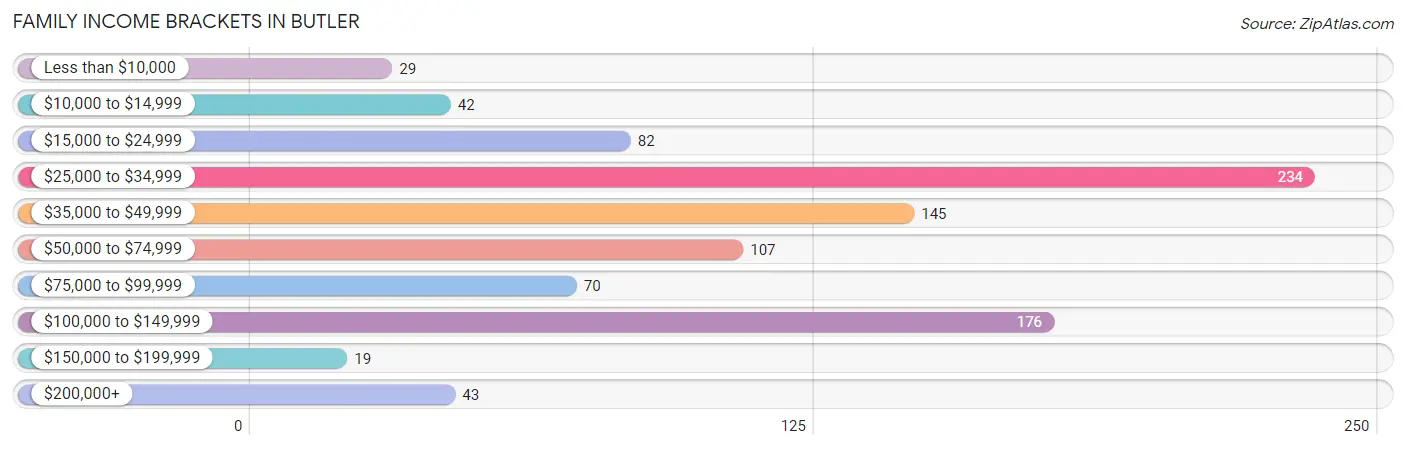
| Income Bracket | # Families | % Families |
| Less than $10,000 | 29 | 3.1% |
| $10,000 to $14,999 | 42 | 4.4% |
| $15,000 to $24,999 | 82 | 8.7% |
| $25,000 to $34,999 | 234 | 24.7% |
| $35,000 to $49,999 | 145 | 15.3% |
| $50,000 to $74,999 | 107 | 11.3% |
| $75,000 to $99,999 | 70 | 7.4% |
| $100,000 to $149,999 | 176 | 18.6% |
| $150,000 to $199,999 | 19 | 2.0% |
| $200,000+ | 43 | 4.5% |
Family Income by Famaliy Size in Butler
2-person families (422 | 44.6%) account for the highest median family income in Butler with $55,438 per family, while 2-person families (422 | 44.6%) have the highest median income of $27,719 per family member.
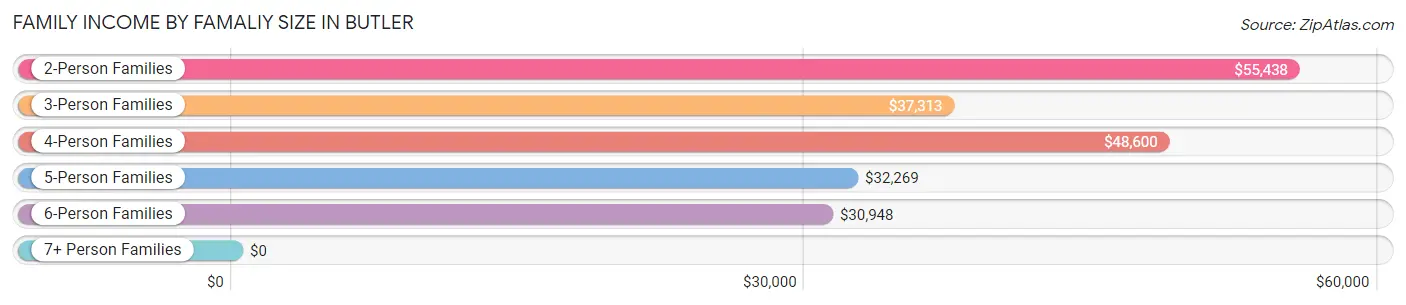
| Income Bracket | # Families | Median Income |
| 2-Person Families | 422 (44.6%) | $55,438 |
| 3-Person Families | 202 (21.3%) | $37,313 |
| 4-Person Families | 110 (11.6%) | $48,600 |
| 5-Person Families | 75 (7.9%) | $32,269 |
| 6-Person Families | 105 (11.1%) | $30,948 |
| 7+ Person Families | 33 (3.5%) | $0 |
| Total | 947 (100.0%) | $42,386 |
Family Income by Number of Earners in Butler
The median family income in Butler is $42,386, with families comprising 3+ earners (33) having the highest median family income of $106,688, while families with no earners (255) have the lowest median family income of $31,179, accounting for 3.5% and 26.9% of families, respectively.
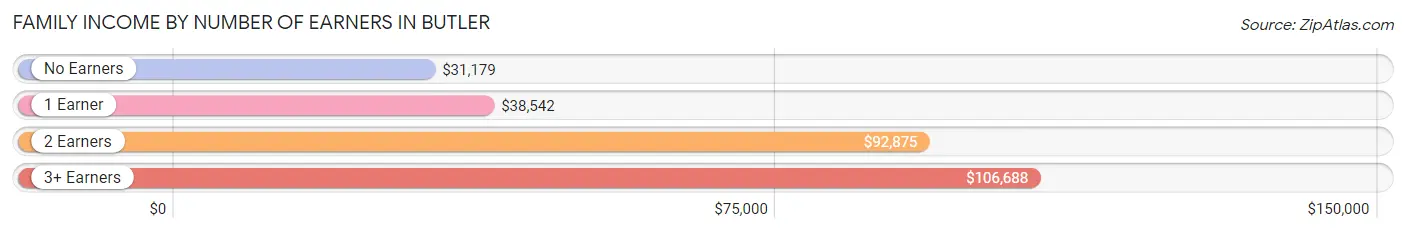
| Number of Earners | # Families | Median Income |
| No Earners | 255 (26.9%) | $31,179 |
| 1 Earner | 382 (40.3%) | $38,542 |
| 2 Earners | 277 (29.2%) | $92,875 |
| 3+ Earners | 33 (3.5%) | $106,688 |
| Total | 947 (100.0%) | $42,386 |
Household Income in Butler
Household Income Brackets in Butler
With 303 households falling in the category, the $25,000 to $34,999 income range is the most frequent in Butler, accounting for 18.4% of all households. In contrast, only 26 households (1.6%) fall into the $150,000 to $199,999 income bracket, making it the least populous group.
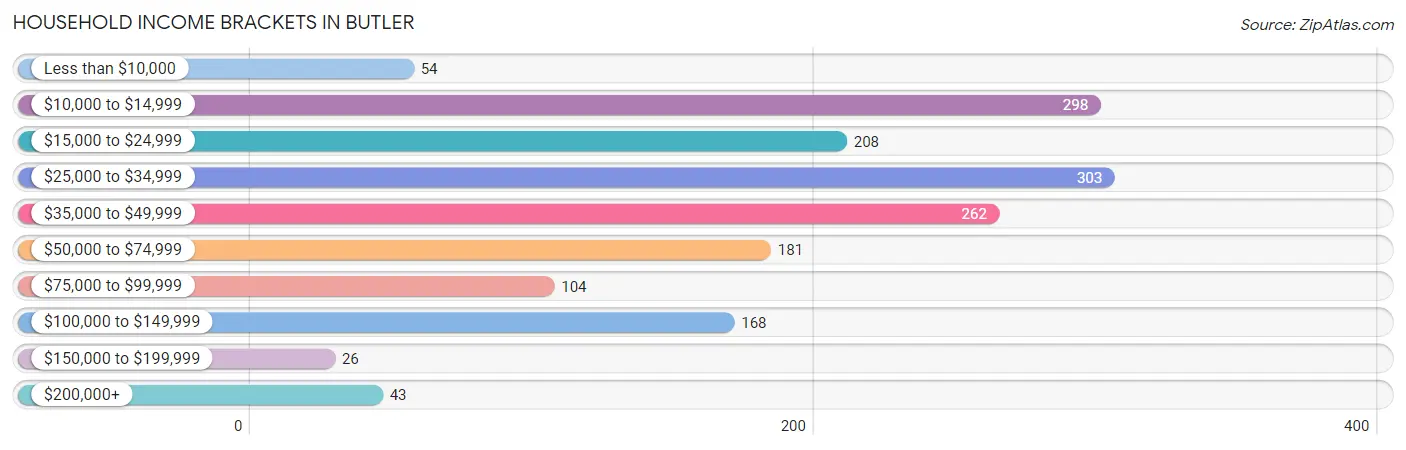
| Income Bracket | # Households | % Households |
| Less than $10,000 | 54 | 3.3% |
| $10,000 to $14,999 | 298 | 18.1% |
| $15,000 to $24,999 | 208 | 12.6% |
| $25,000 to $34,999 | 303 | 18.4% |
| $35,000 to $49,999 | 262 | 15.9% |
| $50,000 to $74,999 | 181 | 11.0% |
| $75,000 to $99,999 | 104 | 6.3% |
| $100,000 to $149,999 | 168 | 10.2% |
| $150,000 to $199,999 | 26 | 1.6% |
| $200,000+ | 43 | 2.6% |
Household Income by Householder Age in Butler
The median household income in Butler is $33,548, with the highest median household income of $45,523 found in the 25 to 44 years age bracket for the primary householder. A total of 472 households (28.6%) fall into this category. Meanwhile, the 15 to 24 years age bracket for the primary householder has the lowest median household income of $0, with 53 households (3.2%) in this group.
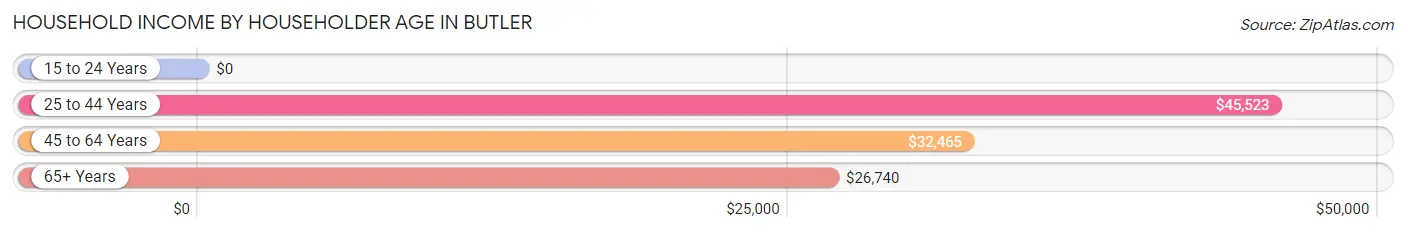
| Income Bracket | # Households | Median Income |
| 15 to 24 Years | 53 (3.2%) | $0 |
| 25 to 44 Years | 472 (28.6%) | $45,523 |
| 45 to 64 Years | 561 (34.0%) | $32,465 |
| 65+ Years | 563 (34.1%) | $26,740 |
| Total | 1,649 (100.0%) | $33,548 |
Poverty in Butler
Income Below Poverty by Sex and Age in Butler
With 28.2% poverty level for males and 36.7% for females among the residents of Butler, 5 year old males and 5 year old females are the most vulnerable to poverty, with 30 males (100.0%) and 32 females (100.0%) in their respective age groups living below the poverty level.
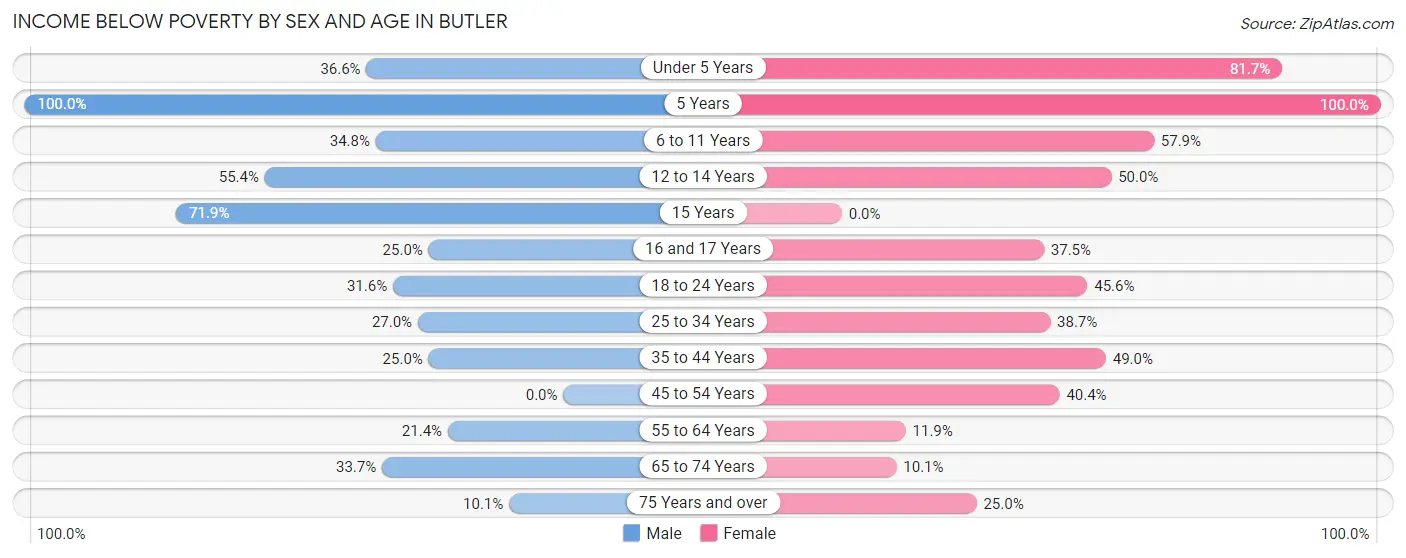
| Age Bracket | Male | Female |
| Under 5 Years | 53 (36.5%) | 85 (81.7%) |
| 5 Years | 30 (100.0%) | 32 (100.0%) |
| 6 to 11 Years | 102 (34.8%) | 106 (57.9%) |
| 12 to 14 Years | 41 (55.4%) | 33 (50.0%) |
| 15 Years | 23 (71.9%) | 0 (0.0%) |
| 16 and 17 Years | 22 (25.0%) | 15 (37.5%) |
| 18 to 24 Years | 43 (31.6%) | 36 (45.6%) |
| 25 to 34 Years | 95 (27.0%) | 116 (38.7%) |
| 35 to 44 Years | 55 (25.0%) | 124 (49.0%) |
| 45 to 54 Years | 0 (0.0%) | 101 (40.4%) |
| 55 to 64 Years | 54 (21.4%) | 34 (11.8%) |
| 65 to 74 Years | 69 (33.7%) | 24 (10.1%) |
| 75 Years and over | 15 (10.1%) | 49 (25.0%) |
| Total | 602 (28.2%) | 755 (36.7%) |
Income Above Poverty by Sex and Age in Butler
According to the poverty statistics in Butler, males aged 45 to 54 years and females aged 15 years are the age groups that are most secure financially, with 100.0% of males and 100.0% of females in these age groups living above the poverty line.
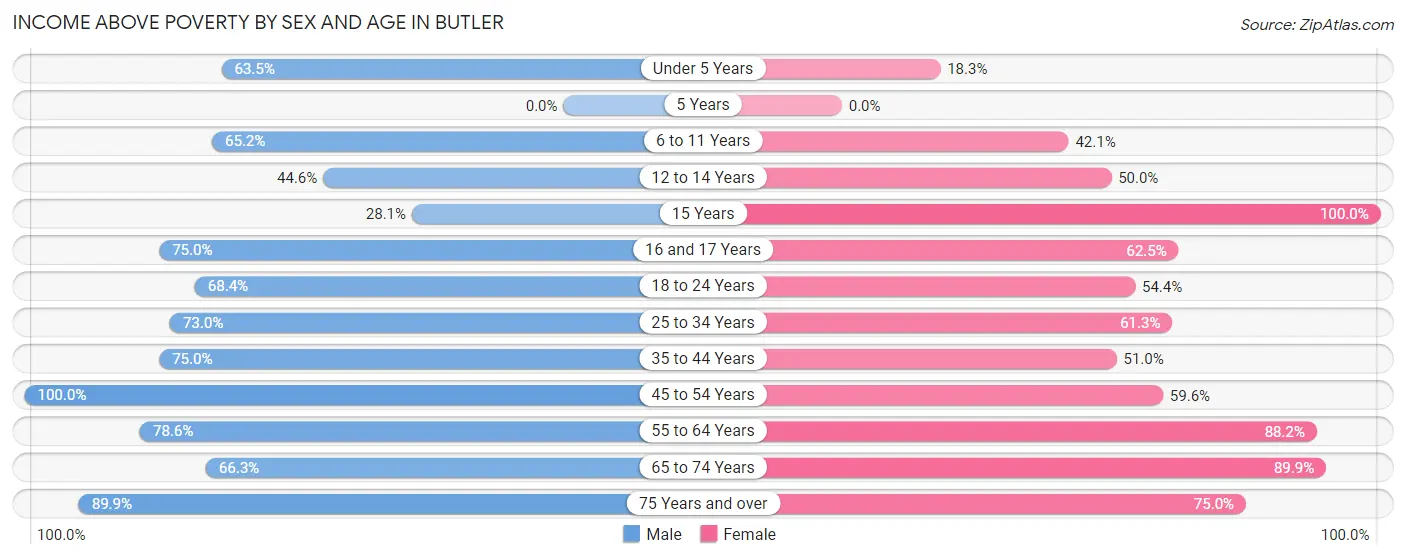
| Age Bracket | Male | Female |
| Under 5 Years | 92 (63.4%) | 19 (18.3%) |
| 5 Years | 0 (0.0%) | 0 (0.0%) |
| 6 to 11 Years | 191 (65.2%) | 77 (42.1%) |
| 12 to 14 Years | 33 (44.6%) | 33 (50.0%) |
| 15 Years | 9 (28.1%) | 28 (100.0%) |
| 16 and 17 Years | 66 (75.0%) | 25 (62.5%) |
| 18 to 24 Years | 93 (68.4%) | 43 (54.4%) |
| 25 to 34 Years | 257 (73.0%) | 184 (61.3%) |
| 35 to 44 Years | 165 (75.0%) | 129 (51.0%) |
| 45 to 54 Years | 159 (100.0%) | 149 (59.6%) |
| 55 to 64 Years | 198 (78.6%) | 253 (88.1%) |
| 65 to 74 Years | 136 (66.3%) | 213 (89.9%) |
| 75 Years and over | 134 (89.9%) | 147 (75.0%) |
| Total | 1,533 (71.8%) | 1,300 (63.3%) |
Income Below Poverty Among Married-Couple Families in Butler
The poverty statistics for married-couple families in Butler show that 15.7% or 104 of the total 664 families live below the poverty line. Families with 3 or 4 children have the highest poverty rate of 72.4%, comprising of 89 families. On the other hand, families with 1 or 2 children have the lowest poverty rate of 0.0%, which includes 0 families.
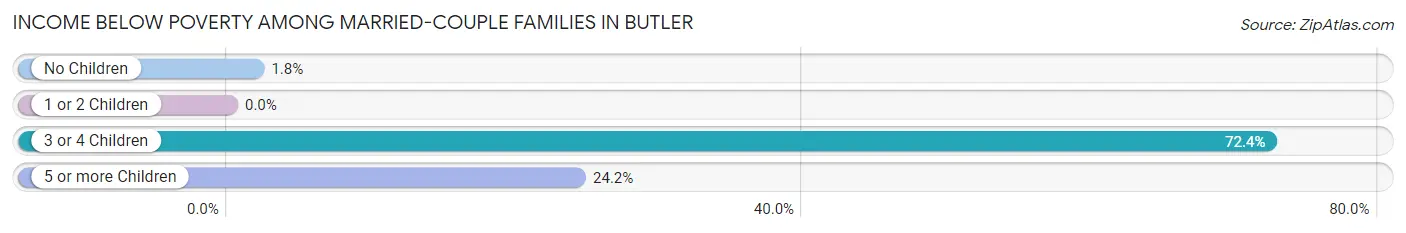
| Children | Above Poverty | Below Poverty |
| No Children | 374 (98.2%) | 7 (1.8%) |
| 1 or 2 Children | 127 (100.0%) | 0 (0.0%) |
| 3 or 4 Children | 34 (27.6%) | 89 (72.4%) |
| 5 or more Children | 25 (75.8%) | 8 (24.2%) |
| Total | 560 (84.3%) | 104 (15.7%) |
Income Below Poverty Among Single-Parent Households in Butler
According to the poverty data in Butler, 37.8% or 34 single-father households and 44.6% or 86 single-mother households are living below the poverty line. Among single-father households, those with 1 or 2 children have the highest poverty rate, with 34 households (45.3%) experiencing poverty. Likewise, among single-mother households, those with 5 or more children have the highest poverty rate, with 29 households (100.0%) falling below the poverty line.
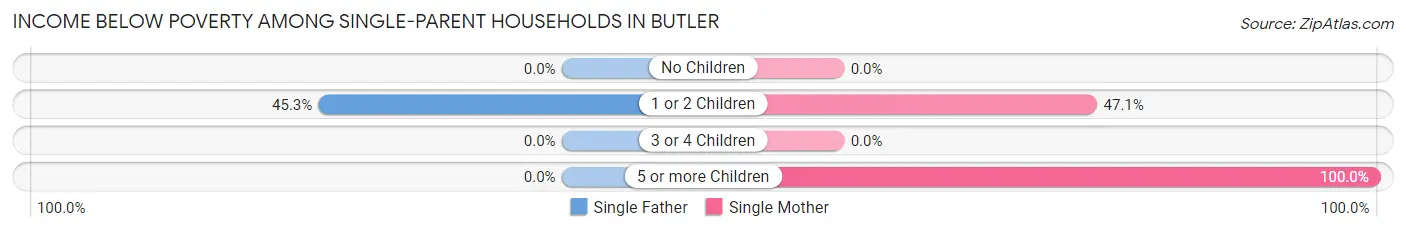
| Children | Single Father | Single Mother |
| No Children | 0 (0.0%) | 0 (0.0%) |
| 1 or 2 Children | 34 (45.3%) | 57 (47.1%) |
| 3 or 4 Children | 0 (0.0%) | 0 (0.0%) |
| 5 or more Children | 0 (0.0%) | 29 (100.0%) |
| Total | 34 (37.8%) | 86 (44.6%) |
Income Below Poverty Among Married-Couple vs Single-Parent Households in Butler
The poverty data for Butler shows that 104 of the married-couple family households (15.7%) and 120 of the single-parent households (42.4%) are living below the poverty level. Within the married-couple family households, those with 3 or 4 children have the highest poverty rate, with 89 households (72.4%) falling below the poverty line. Among the single-parent households, those with 5 or more children have the highest poverty rate, with 29 household (100.0%) living below poverty.
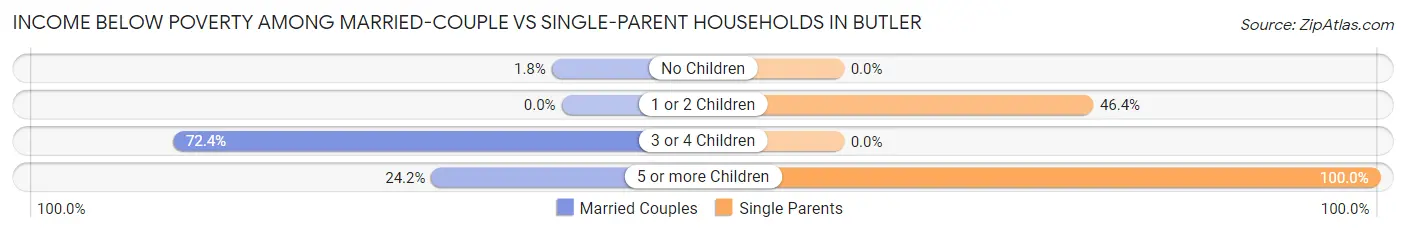
| Children | Married-Couple Families | Single-Parent Households |
| No Children | 7 (1.8%) | 0 (0.0%) |
| 1 or 2 Children | 0 (0.0%) | 91 (46.4%) |
| 3 or 4 Children | 89 (72.4%) | 0 (0.0%) |
| 5 or more Children | 8 (24.2%) | 29 (100.0%) |
| Total | 104 (15.7%) | 120 (42.4%) |
Race in Butler
The most populous races in Butler are White / Caucasian (4,111 | 90.5%), Black / African American (239 | 5.3%), and Two or more Races (122 | 2.7%).
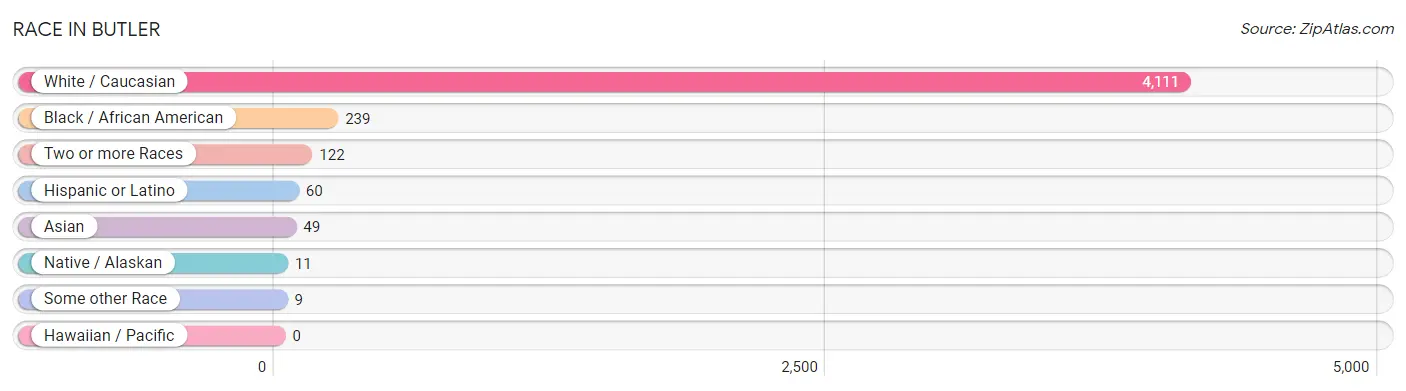
| Race | # Population | % Population |
| Asian | 49 | 1.1% |
| Black / African American | 239 | 5.3% |
| Hawaiian / Pacific | 0 | 0.0% |
| Hispanic or Latino | 60 | 1.3% |
| Native / Alaskan | 11 | 0.2% |
| White / Caucasian | 4,111 | 90.5% |
| Two or more Races | 122 | 2.7% |
| Some other Race | 9 | 0.2% |
| Total | 4,541 | 100.0% |
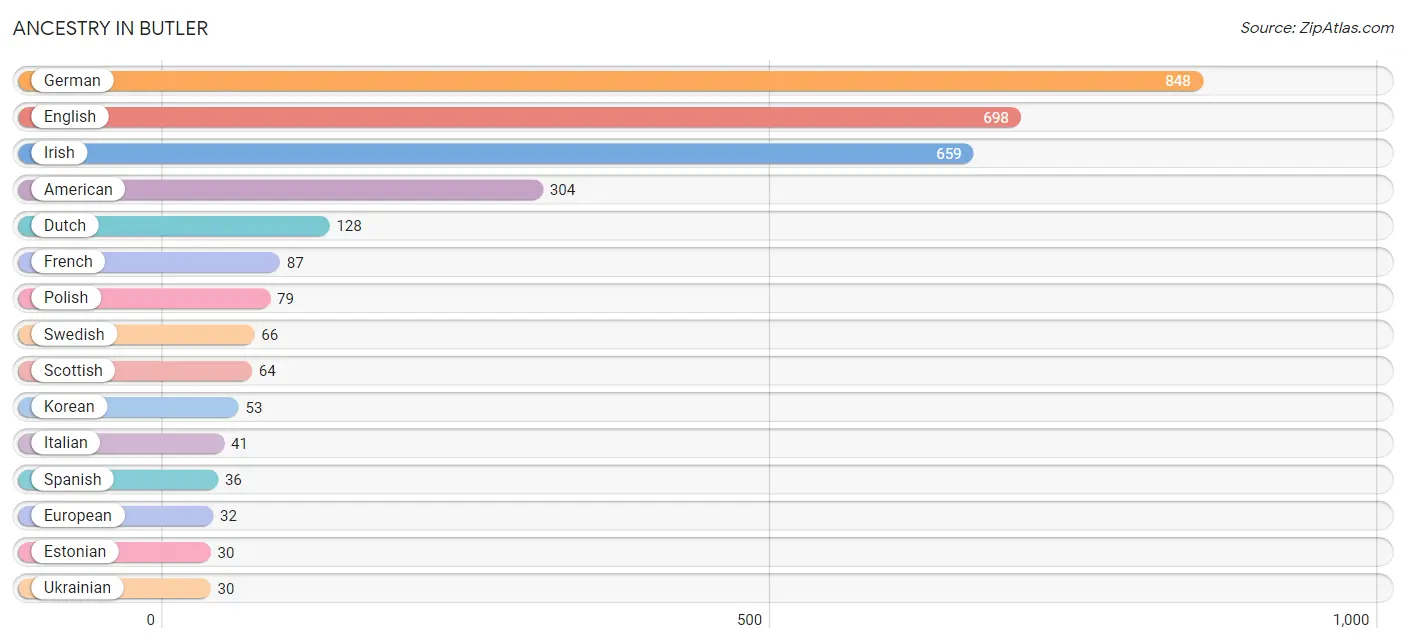
Ancestry in Butler
The most populous ancestries reported in Butler are German (848 | 18.7%), English (698 | 15.4%), Irish (659 | 14.5%), American (304 | 6.7%), and Dutch (128 | 2.8%), together accounting for 58.1% of all Butler residents.
| Ancestry | # Population | % Population |
| African | 4 | 0.1% |
| American | 304 | 6.7% |
| Blackfeet | 2 | 0.0% |
| Central American | 9 | 0.2% |
| Cherokee | 9 | 0.2% |
| Czech | 5 | 0.1% |
| Dutch | 128 | 2.8% |
| English | 698 | 15.4% |
| Estonian | 30 | 0.7% |
| European | 32 | 0.7% |
| French | 87 | 1.9% |
| French Canadian | 9 | 0.2% |
| German | 848 | 18.7% |
| Honduran | 9 | 0.2% |
| Indian (Asian) | 5 | 0.1% |
| Irish | 659 | 14.5% |
| Italian | 41 | 0.9% |
| Korean | 53 | 1.2% |
| Mexican | 12 | 0.3% |
| Peruvian | 3 | 0.1% |
| Polish | 79 | 1.7% |
| Scotch-Irish | 8 | 0.2% |
| Scottish | 64 | 1.4% |
| Sioux | 11 | 0.2% |
| South American | 3 | 0.1% |
| Spanish | 36 | 0.8% |
| Subsaharan African | 4 | 0.1% |
| Swedish | 66 | 1.5% |
| Swiss | 8 | 0.2% |
| Ukrainian | 30 | 0.7% |
| Welsh | 26 | 0.6% | View All 31 Rows |
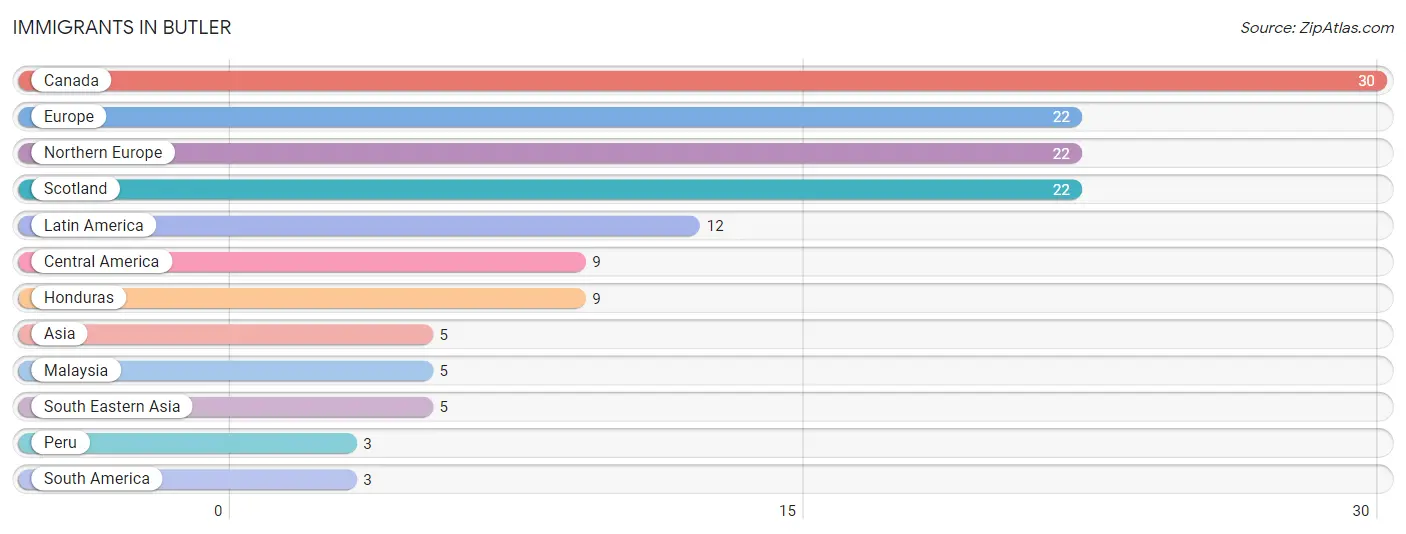
Immigrants in Butler
The most numerous immigrant groups reported in Butler came from Canada (30 | 0.7%), Europe (22 | 0.5%), Northern Europe (22 | 0.5%), Scotland (22 | 0.5%), and Latin America (12 | 0.3%), together accounting for 2.4% of all Butler residents.
| Immigration Origin | # Population | % Population |
| Asia | 5 | 0.1% |
| Canada | 30 | 0.7% |
| Central America | 9 | 0.2% |
| Europe | 22 | 0.5% |
| Honduras | 9 | 0.2% |
| Latin America | 12 | 0.3% |
| Malaysia | 5 | 0.1% |
| Northern Europe | 22 | 0.5% |
| Peru | 3 | 0.1% |
| Scotland | 22 | 0.5% |
| South America | 3 | 0.1% |
| South Eastern Asia | 5 | 0.1% | View All 12 Rows |
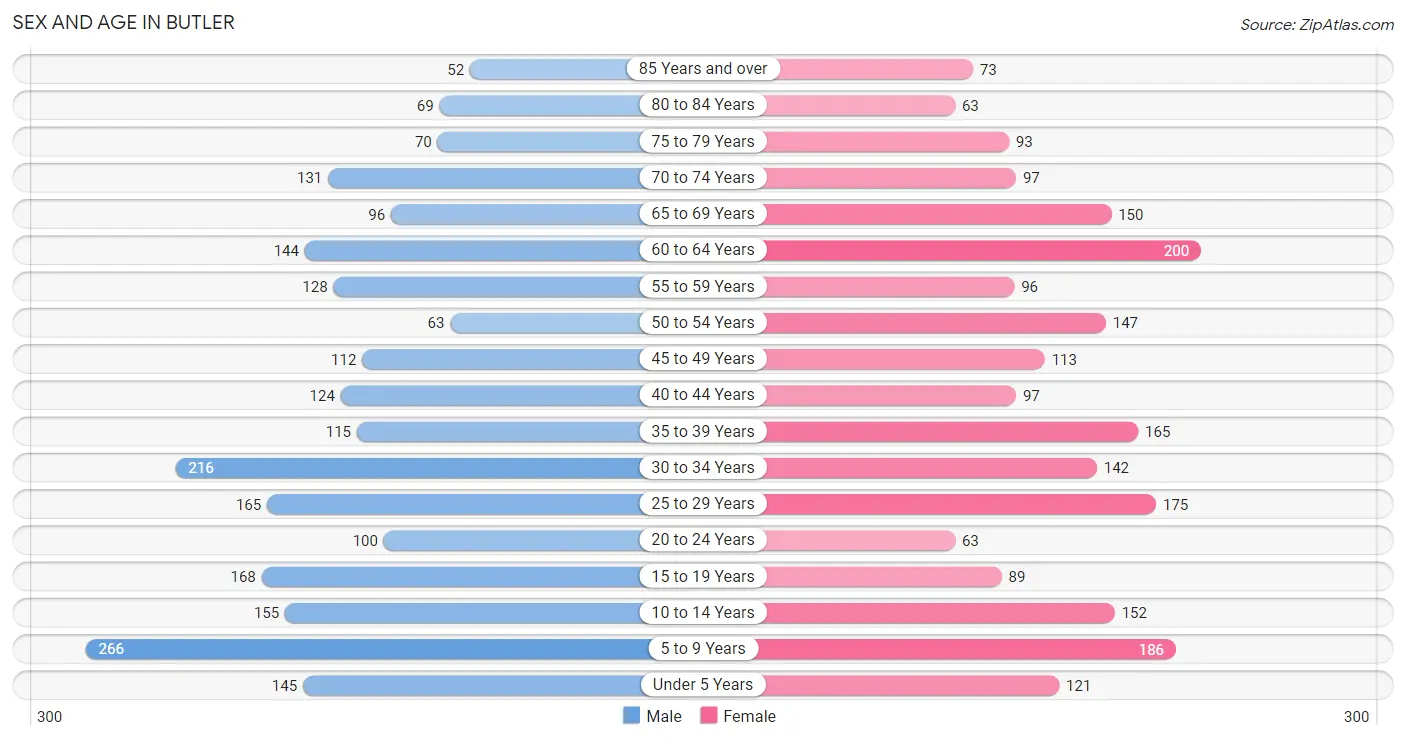
Sex and Age in Butler
Sex and Age in Butler
The most populous age groups in Butler are 5 to 9 Years (266 | 11.5%) for men and 60 to 64 Years (200 | 9.0%) for women.
| Age Bracket | Male | Female |
| Under 5 Years | 145 (6.2%) | 121 (5.4%) |
| 5 to 9 Years | 266 (11.5%) | 186 (8.4%) |
| 10 to 14 Years | 155 (6.7%) | 152 (6.8%) |
| 15 to 19 Years | 168 (7.2%) | 89 (4.0%) |
| 20 to 24 Years | 100 (4.3%) | 63 (2.8%) |
| 25 to 29 Years | 165 (7.1%) | 175 (7.9%) |
| 30 to 34 Years | 216 (9.3%) | 142 (6.4%) |
| 35 to 39 Years | 115 (5.0%) | 165 (7.4%) |
| 40 to 44 Years | 124 (5.3%) | 97 (4.4%) |
| 45 to 49 Years | 112 (4.8%) | 113 (5.1%) |
| 50 to 54 Years | 63 (2.7%) | 147 (6.6%) |
| 55 to 59 Years | 128 (5.5%) | 96 (4.3%) |
| 60 to 64 Years | 144 (6.2%) | 200 (9.0%) |
| 65 to 69 Years | 96 (4.1%) | 150 (6.8%) |
| 70 to 74 Years | 131 (5.7%) | 97 (4.4%) |
| 75 to 79 Years | 70 (3.0%) | 93 (4.2%) |
| 80 to 84 Years | 69 (3.0%) | 63 (2.8%) |
| 85 Years and over | 52 (2.2%) | 73 (3.3%) |
| Total | 2,319 (100.0%) | 2,222 (100.0%) |
Families and Households in Butler
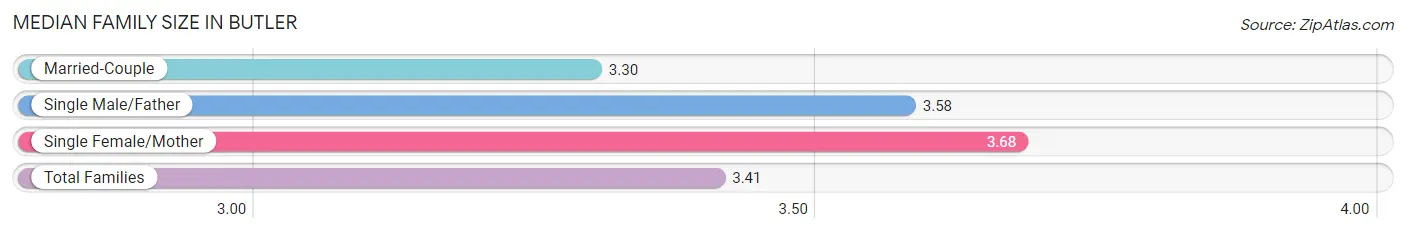
Median Family Size in Butler
The median family size in Butler is 3.41 persons per family, with single female/mother families (193 | 20.4%) accounting for the largest median family size of 3.68 persons per family. On the other hand, married-couple families (664 | 70.1%) represent the smallest median family size with 3.30 persons per family.
| Family Type | # Families | Family Size |
| Married-Couple | 664 (70.1%) | 3.30 |
| Single Male/Father | 90 (9.5%) | 3.58 |
| Single Female/Mother | 193 (20.4%) | 3.68 |
| Total Families | 947 (100.0%) | 3.41 |
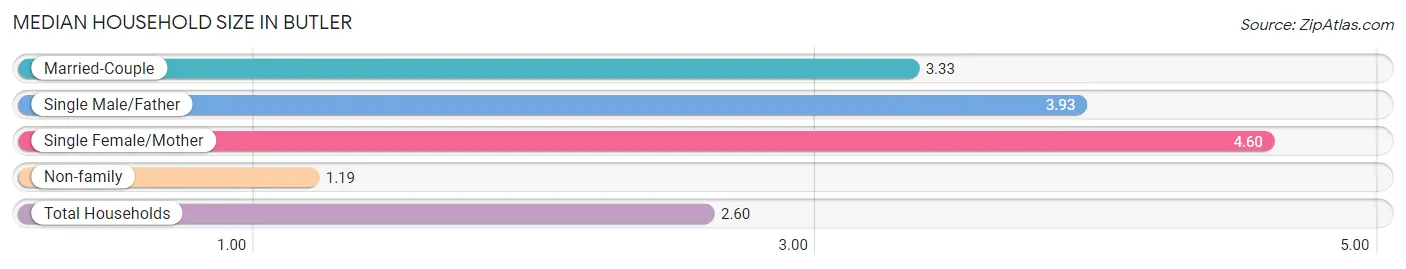
Median Household Size in Butler
The median household size in Butler is 2.60 persons per household, with single female/mother households (193 | 11.7%) accounting for the largest median household size of 4.6 persons per household. non-family households (702 | 42.6%) represent the smallest median household size with 1.19 persons per household.
| Household Type | # Households | Household Size |
| Married-Couple | 664 (40.3%) | 3.33 |
| Single Male/Father | 90 (5.5%) | 3.93 |
| Single Female/Mother | 193 (11.7%) | 4.60 |
| Non-family | 702 (42.6%) | 1.19 |
| Total Households | 1,649 (100.0%) | 2.60 |
Household Size by Marriage Status in Butler
Out of a total of 1,649 households in Butler, 947 (57.4%) are family households, while 702 (42.6%) are nonfamily households. The most numerous type of family households are 2-person households, comprising 347, and the most common type of nonfamily households are 1-person households, comprising 585.
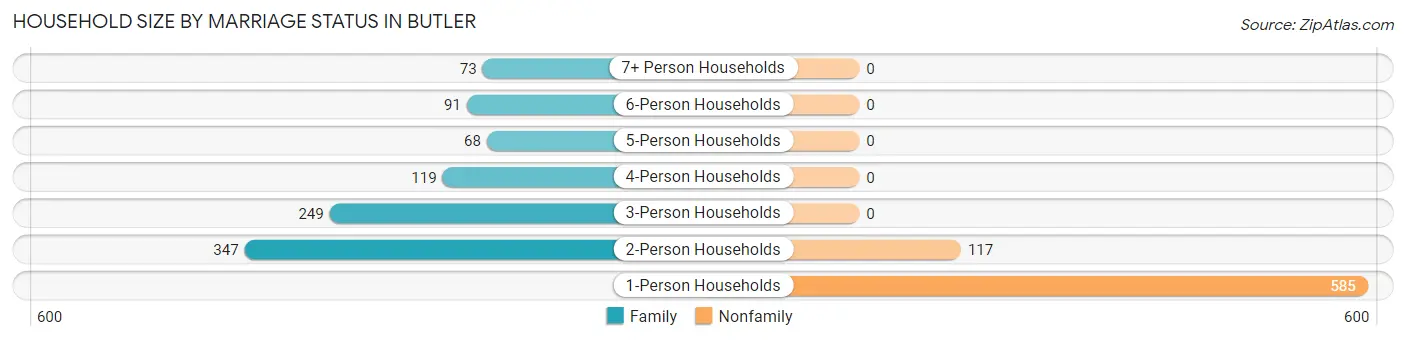
| Household Size | Family Households | Nonfamily Households |
| 1-Person Households | - | 585 (35.5%) |
| 2-Person Households | 347 (21.0%) | 117 (7.1%) |
| 3-Person Households | 249 (15.1%) | 0 (0.0%) |
| 4-Person Households | 119 (7.2%) | 0 (0.0%) |
| 5-Person Households | 68 (4.1%) | 0 (0.0%) |
| 6-Person Households | 91 (5.5%) | 0 (0.0%) |
| 7+ Person Households | 73 (4.4%) | 0 (0.0%) |
| Total | 947 (57.4%) | 702 (42.6%) |
Female Fertility in Butler
Fertility by Age in Butler
Average fertility rate in Butler is 46.0 births per 1,000 women. Women in the age bracket of 20 to 34 years have the highest fertility rate with 111.0 births per 1,000 women. Women in the age bracket of 20 to 34 years acount for 100.0% of all women with births.
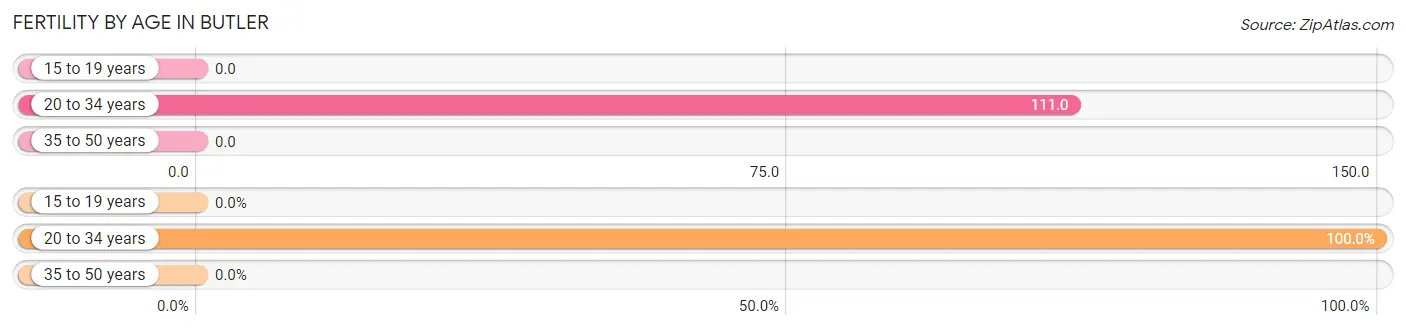
| Age Bracket | Women with Births | Births / 1,000 Women |
| 15 to 19 years | 0 (0.0%) | 0.0 |
| 20 to 34 years | 42 (100.0%) | 111.0 |
| 35 to 50 years | 0 (0.0%) | 0.0 |
| Total | 42 (100.0%) | 46.0 |
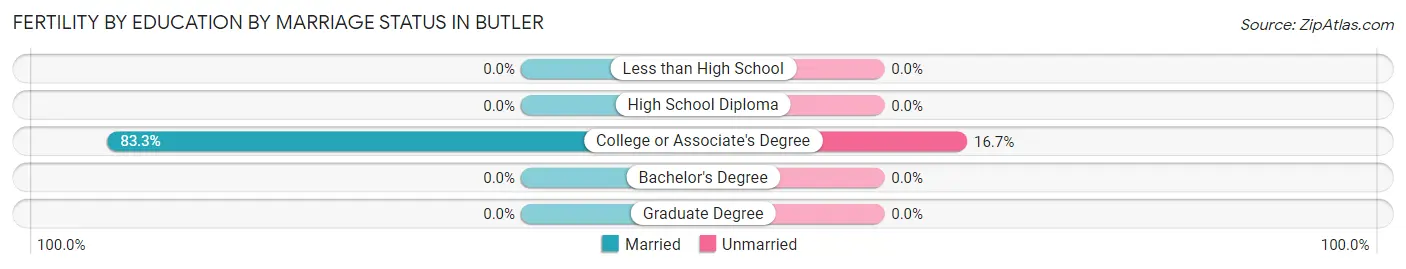
Fertility by Age by Marriage Status in Butler
83.3% of women with births (42) in Butler are married. The highest percentage of unmarried women with births falls into 20 to 34 years age bracket with 16.7% of them unmarried at the time of birth, while the lowest percentage of unmarried women with births belong to 20 to 34 years age bracket with 16.7% of them unmarried.
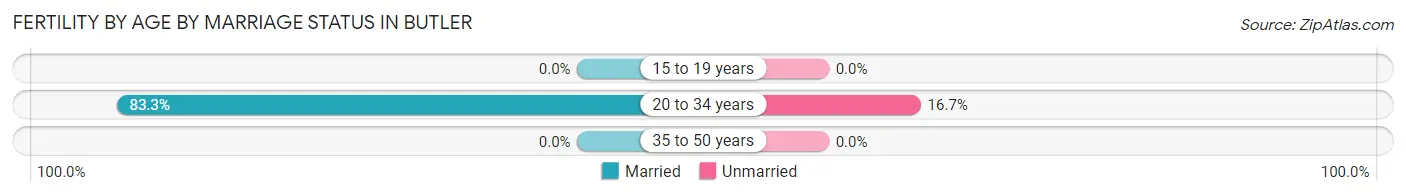
| Age Bracket | Married | Unmarried |
| 15 to 19 years | 0 (0.0%) | 0 (0.0%) |
| 20 to 34 years | 35 (83.3%) | 7 (16.7%) |
| 35 to 50 years | 0 (0.0%) | 0 (0.0%) |
| Total | 35 (83.3%) | 7 (16.7%) |
Fertility by Education in Butler
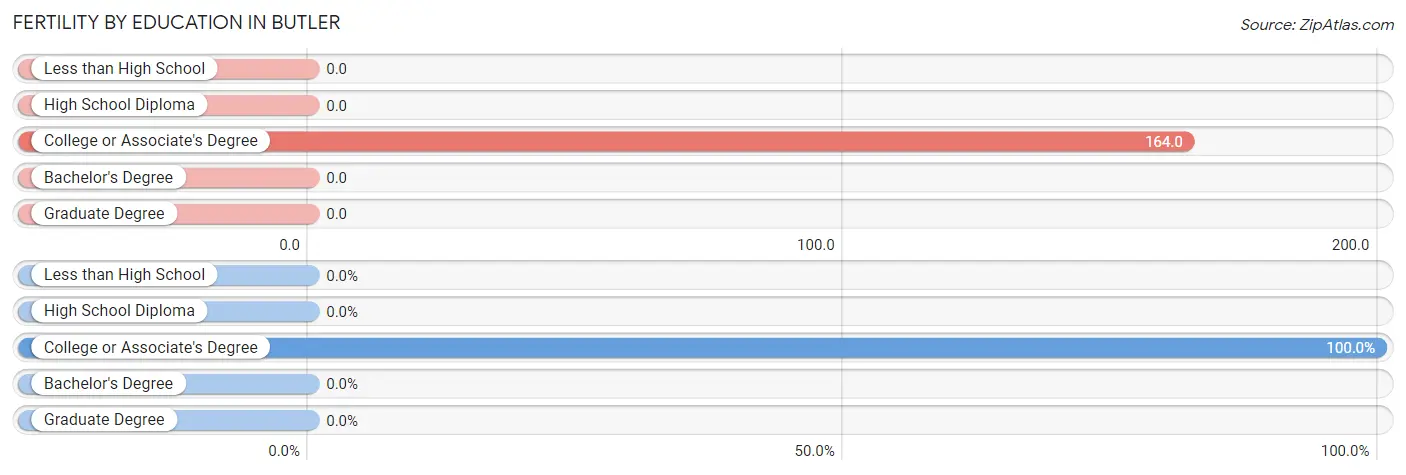
| Educational Attainment | Women with Births | Births / 1,000 Women |
| Less than High School | 0 (0.0%) | 0.0 |
| High School Diploma | 0 (0.0%) | 0.0 |
| College or Associate's Degree | 42 (100.0%) | 164.0 |
| Bachelor's Degree | 0 (0.0%) | 0.0 |
| Graduate Degree | 0 (0.0%) | 0.0 |
| Total | 42 (100.0%) | 46.0 |
Fertility by Education by Marriage Status in Butler
16.7% of women with births in Butler are unmarried. Women with the educational attainment of college or associate's degree are most likely to be married with 83.3% of them married at childbirth, while women with the educational attainment of college or associate's degree are least likely to be married with 16.7% of them unmarried at childbirth.
| Educational Attainment | Married | Unmarried |
| Less than High School | 0 (0.0%) | 0 (0.0%) |
| High School Diploma | 0 (0.0%) | 0 (0.0%) |
| College or Associate's Degree | 35 (83.3%) | 7 (16.7%) |
| Bachelor's Degree | 0 (0.0%) | 0 (0.0%) |
| Graduate Degree | 0 (0.0%) | 0 (0.0%) |
| Total | 35 (83.3%) | 7 (16.7%) |
Employment Characteristics in Butler
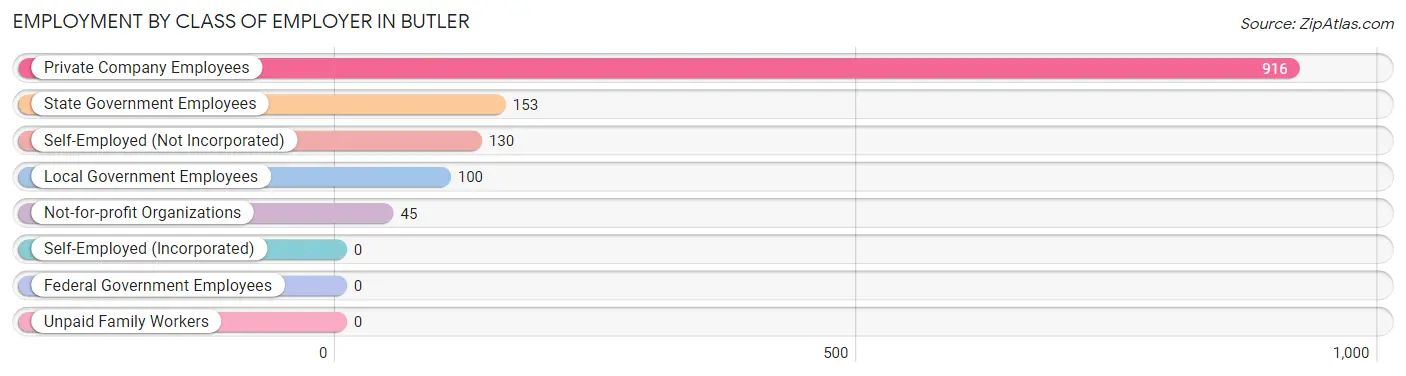
Employment by Class of Employer in Butler
Among the 1,344 employed individuals in Butler, private company employees (916 | 68.1%), state government employees (153 | 11.4%), and self-employed (not incorporated) (130 | 9.7%) make up the most common classes of employment.
| Employer Class | # Employees | % Employees |
| Private Company Employees | 916 | 68.1% |
| Self-Employed (Incorporated) | 0 | 0.0% |
| Self-Employed (Not Incorporated) | 130 | 9.7% |
| Not-for-profit Organizations | 45 | 3.4% |
| Local Government Employees | 100 | 7.4% |
| State Government Employees | 153 | 11.4% |
| Federal Government Employees | 0 | 0.0% |
| Unpaid Family Workers | 0 | 0.0% |
| Total | 1,344 | 100.0% |
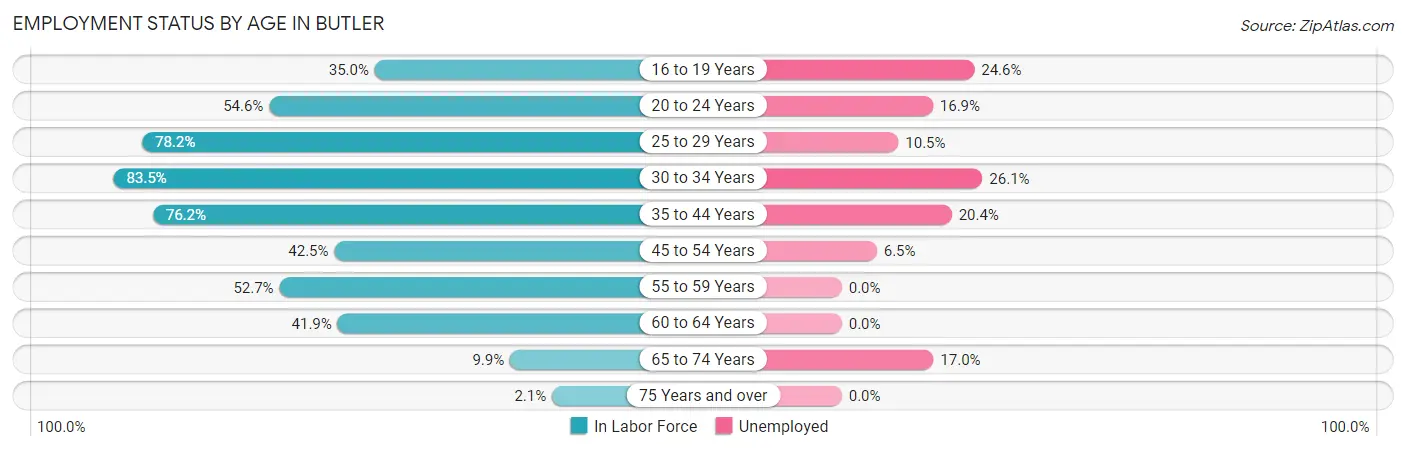
Employment Status by Age in Butler
According to the labor force statistics for Butler, out of the total population over 16 years of age (3,456), 46.5% or 1,607 individuals are in the labor force, with 14.7% or 236 of them unemployed. The age group with the highest labor force participation rate is 30 to 34 years, with 83.5% or 299 individuals in the labor force. Within the labor force, the 30 to 34 years age range has the highest percentage of unemployed individuals, with 26.1% or 78 of them being unemployed.
| Age Bracket | In Labor Force | Unemployed |
| 16 to 19 Years | 69 (35.0%) | 17 (24.6%) |
| 20 to 24 Years | 89 (54.6%) | 15 (16.9%) |
| 25 to 29 Years | 266 (78.2%) | 28 (10.5%) |
| 30 to 34 Years | 299 (83.5%) | 78 (26.1%) |
| 35 to 44 Years | 382 (76.2%) | 78 (20.4%) |
| 45 to 54 Years | 185 (42.5%) | 12 (6.5%) |
| 55 to 59 Years | 118 (52.7%) | 0 (0.0%) |
| 60 to 64 Years | 144 (41.9%) | 0 (0.0%) |
| 65 to 74 Years | 47 (9.9%) | 8 (17.0%) |
| 75 Years and over | 9 (2.1%) | 0 (0.0%) |
| Total | 1,607 (46.5%) | 236 (14.7%) |
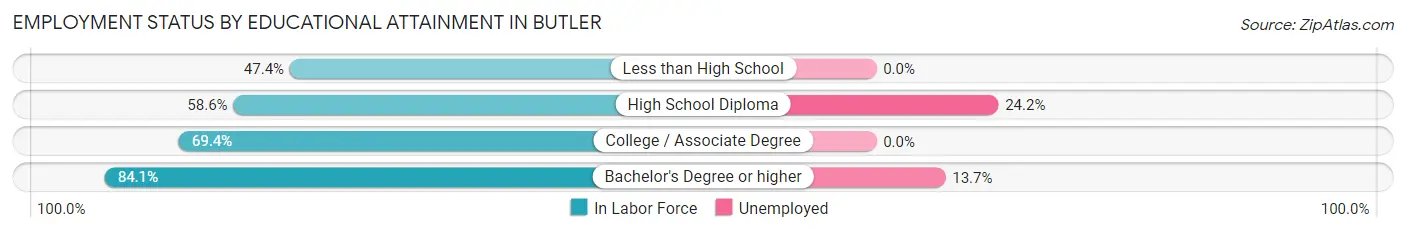
Employment Status by Educational Attainment in Butler
According to labor force statistics for Butler, 63.3% of individuals (1,394) out of the total population between 25 and 64 years of age (2,202) are in the labor force, with 14.1% or 197 of them being unemployed. The group with the highest labor force participation rate are those with the educational attainment of bachelor's degree or higher, with 84.1% or 175 individuals in the labor force. Within the labor force, individuals with high school diploma education have the highest percentage of unemployment, with 24.2% or 172 of them being unemployed.
| Educational Attainment | In Labor Force | Unemployed |
| Less than High School | 72 (47.4%) | 0 (0.0%) |
| High School Diploma | 711 (58.6%) | 294 (24.2%) |
| College / Associate Degree | 436 (69.4%) | 0 (0.0%) |
| Bachelor's Degree or higher | 175 (84.1%) | 28 (13.7%) |
| Total | 1,394 (63.3%) | 310 (14.1%) |
Employment Occupations by Sex in Butler
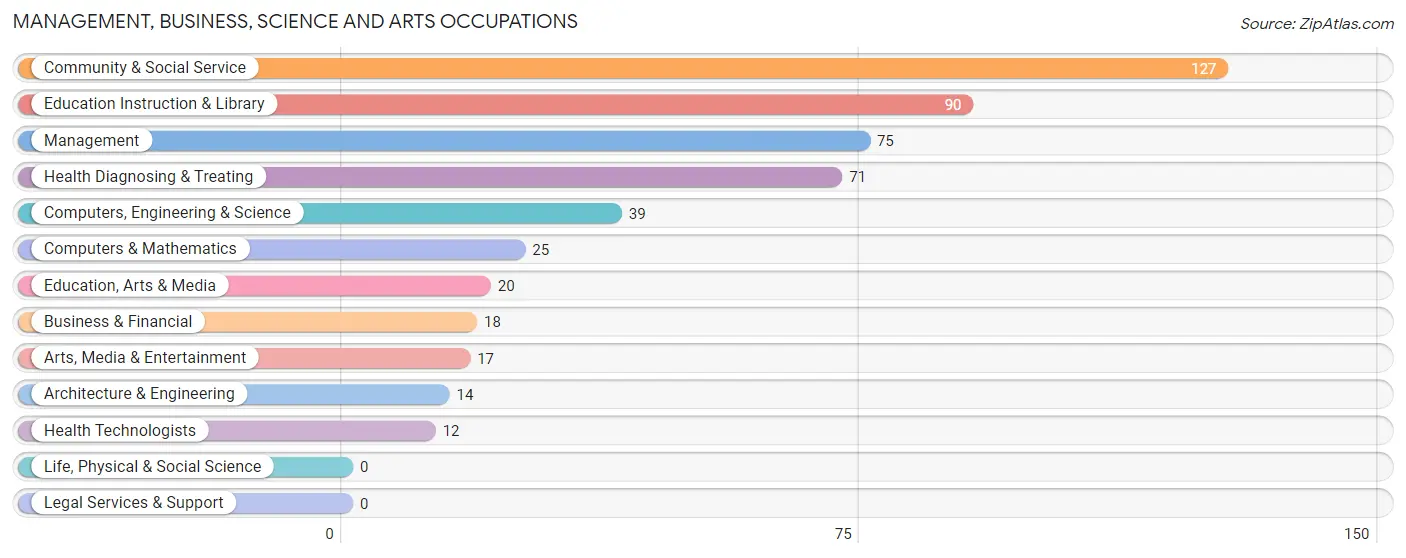
Management, Business, Science and Arts Occupations
The most common Management, Business, Science and Arts occupations in Butler are Community & Social Service (127 | 9.3%), Education Instruction & Library (90 | 6.6%), Management (75 | 5.5%), Health Diagnosing & Treating (71 | 5.2%), and Computers, Engineering & Science (39 | 2.8%).
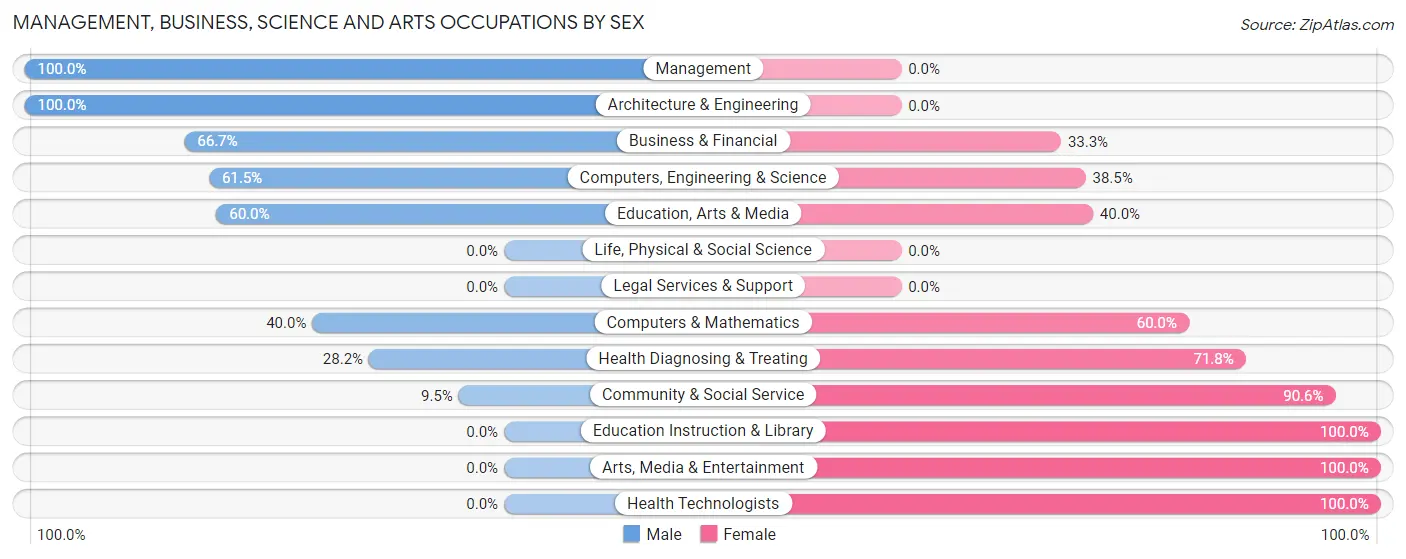
Management, Business, Science and Arts Occupations by Sex
Within the Management, Business, Science and Arts occupations in Butler, the most male-oriented occupations are Management (100.0%), Architecture & Engineering (100.0%), and Business & Financial (66.7%), while the most female-oriented occupations are Education Instruction & Library (100.0%), Arts, Media & Entertainment (100.0%), and Health Technologists (100.0%).
| Occupation | Male | Female |
| Management | 75 (100.0%) | 0 (0.0%) |
| Business & Financial | 12 (66.7%) | 6 (33.3%) |
| Computers, Engineering & Science | 24 (61.5%) | 15 (38.5%) |
| Computers & Mathematics | 10 (40.0%) | 15 (60.0%) |
| Architecture & Engineering | 14 (100.0%) | 0 (0.0%) |
| Life, Physical & Social Science | 0 (0.0%) | 0 (0.0%) |
| Community & Social Service | 12 (9.5%) | 115 (90.5%) |
| Education, Arts & Media | 12 (60.0%) | 8 (40.0%) |
| Legal Services & Support | 0 (0.0%) | 0 (0.0%) |
| Education Instruction & Library | 0 (0.0%) | 90 (100.0%) |
| Arts, Media & Entertainment | 0 (0.0%) | 17 (100.0%) |
| Health Diagnosing & Treating | 20 (28.2%) | 51 (71.8%) |
| Health Technologists | 0 (0.0%) | 12 (100.0%) |
| Total (Category) | 143 (43.3%) | 187 (56.7%) |
| Total (Overall) | 795 (57.9%) | 577 (42.1%) |
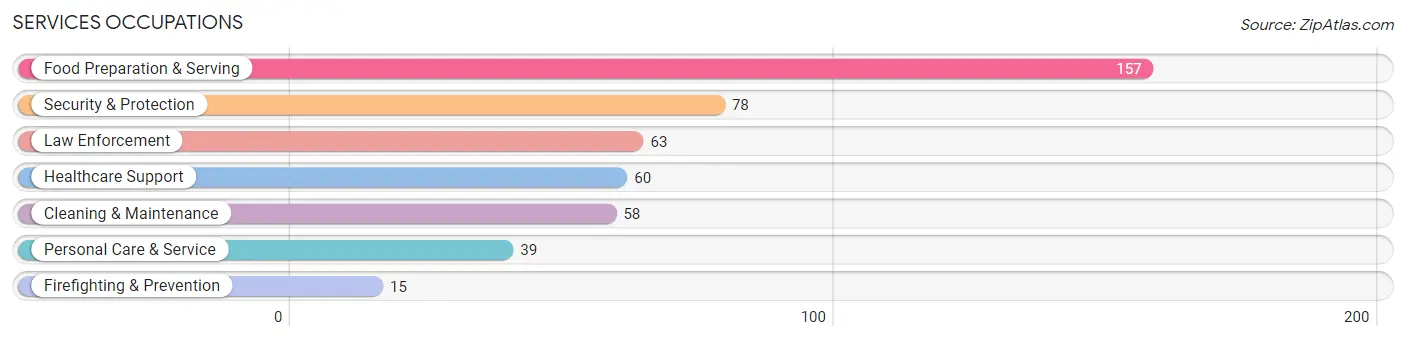
Services Occupations
The most common Services occupations in Butler are Food Preparation & Serving (157 | 11.4%), Security & Protection (78 | 5.7%), Law Enforcement (63 | 4.6%), Healthcare Support (60 | 4.4%), and Cleaning & Maintenance (58 | 4.2%).
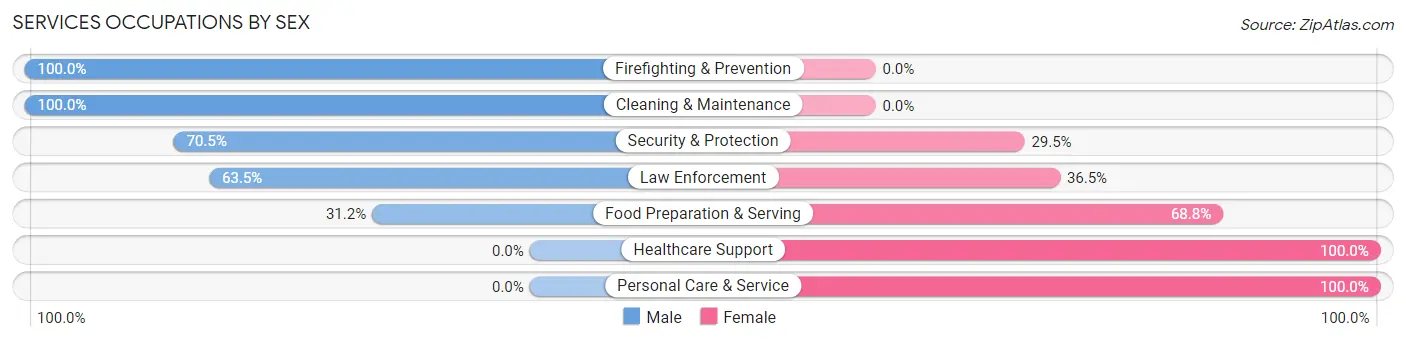
Services Occupations by Sex
Within the Services occupations in Butler, the most male-oriented occupations are Firefighting & Prevention (100.0%), Cleaning & Maintenance (100.0%), and Security & Protection (70.5%), while the most female-oriented occupations are Healthcare Support (100.0%), Personal Care & Service (100.0%), and Food Preparation & Serving (68.8%).
| Occupation | Male | Female |
| Healthcare Support | 0 (0.0%) | 60 (100.0%) |
| Security & Protection | 55 (70.5%) | 23 (29.5%) |
| Firefighting & Prevention | 15 (100.0%) | 0 (0.0%) |
| Law Enforcement | 40 (63.5%) | 23 (36.5%) |
| Food Preparation & Serving | 49 (31.2%) | 108 (68.8%) |
| Cleaning & Maintenance | 58 (100.0%) | 0 (0.0%) |
| Personal Care & Service | 0 (0.0%) | 39 (100.0%) |
| Total (Category) | 162 (41.3%) | 230 (58.7%) |
| Total (Overall) | 795 (57.9%) | 577 (42.1%) |
Sales and Office Occupations
The most common Sales and Office occupations in Butler are Sales & Related (153 | 11.2%), and Office & Administration (48 | 3.5%).
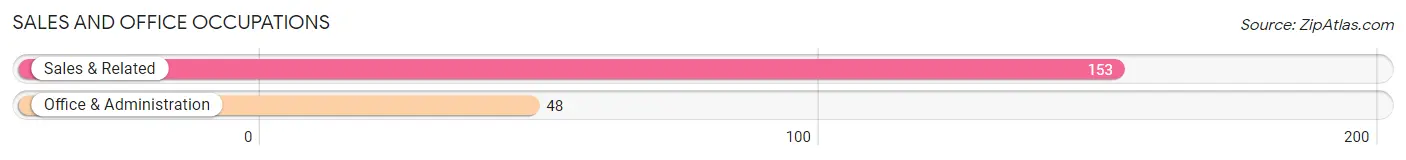
Sales and Office Occupations by Sex
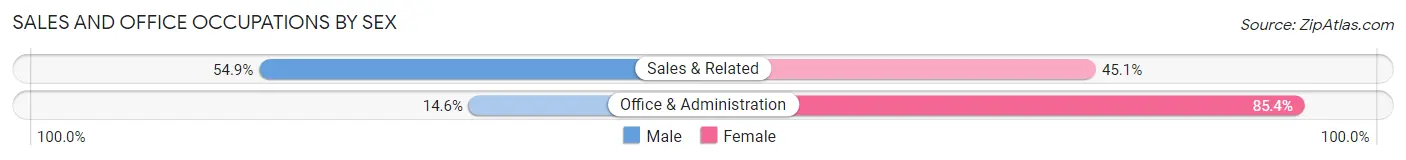
| Occupation | Male | Female |
| Sales & Related | 84 (54.9%) | 69 (45.1%) |
| Office & Administration | 7 (14.6%) | 41 (85.4%) |
| Total (Category) | 91 (45.3%) | 110 (54.7%) |
| Total (Overall) | 795 (57.9%) | 577 (42.1%) |
Natural Resources, Construction and Maintenance Occupations
The most common Natural Resources, Construction and Maintenance occupations in Butler are Construction & Extraction (194 | 14.1%), Installation, Maintenance & Repair (80 | 5.8%), and Farming, Fishing & Forestry (33 | 2.4%).
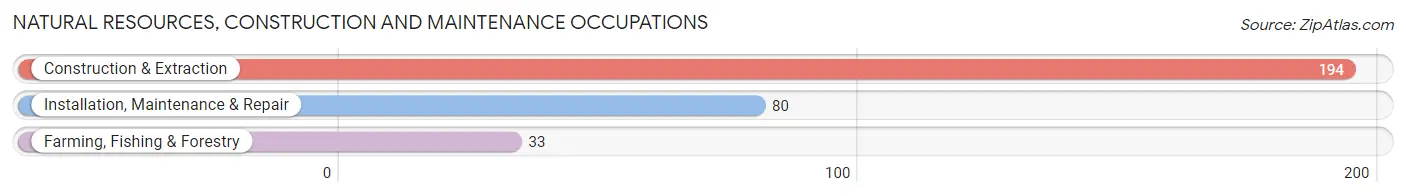
Natural Resources, Construction and Maintenance Occupations by Sex
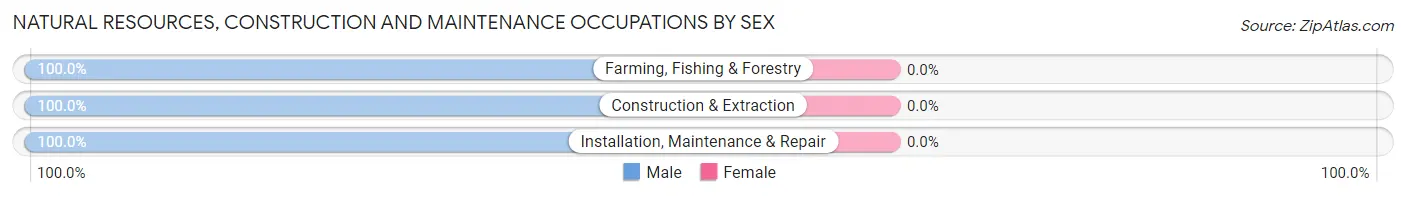
| Occupation | Male | Female |
| Farming, Fishing & Forestry | 33 (100.0%) | 0 (0.0%) |
| Construction & Extraction | 194 (100.0%) | 0 (0.0%) |
| Installation, Maintenance & Repair | 80 (100.0%) | 0 (0.0%) |
| Total (Category) | 307 (100.0%) | 0 (0.0%) |
| Total (Overall) | 795 (57.9%) | 577 (42.1%) |
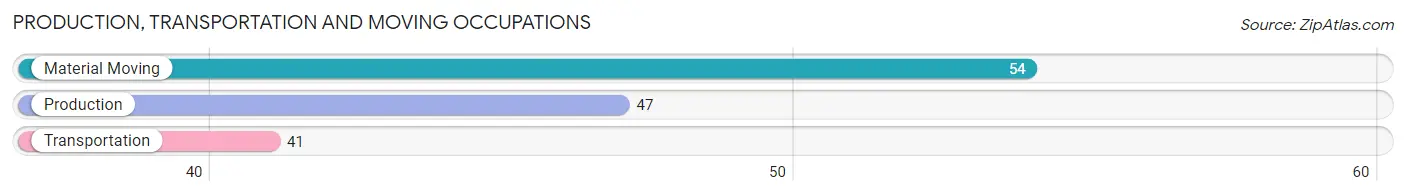
Production, Transportation and Moving Occupations
The most common Production, Transportation and Moving occupations in Butler are Material Moving (54 | 3.9%), Production (47 | 3.4%), and Transportation (41 | 3.0%).
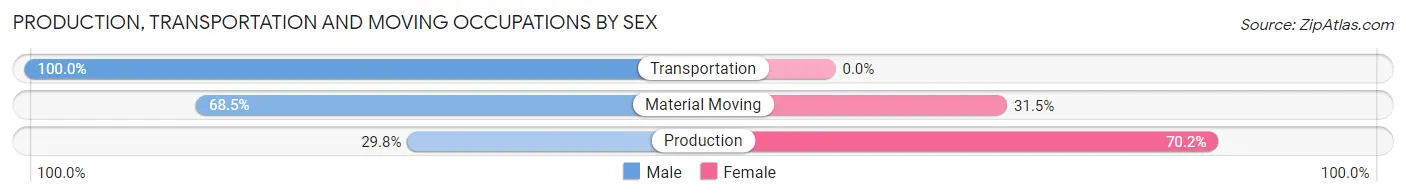
Production, Transportation and Moving Occupations by Sex
| Occupation | Male | Female |
| Production | 14 (29.8%) | 33 (70.2%) |
| Transportation | 41 (100.0%) | 0 (0.0%) |
| Material Moving | 37 (68.5%) | 17 (31.5%) |
| Total (Category) | 92 (64.8%) | 50 (35.2%) |
| Total (Overall) | 795 (57.9%) | 577 (42.1%) |
Employment Industries by Sex in Butler
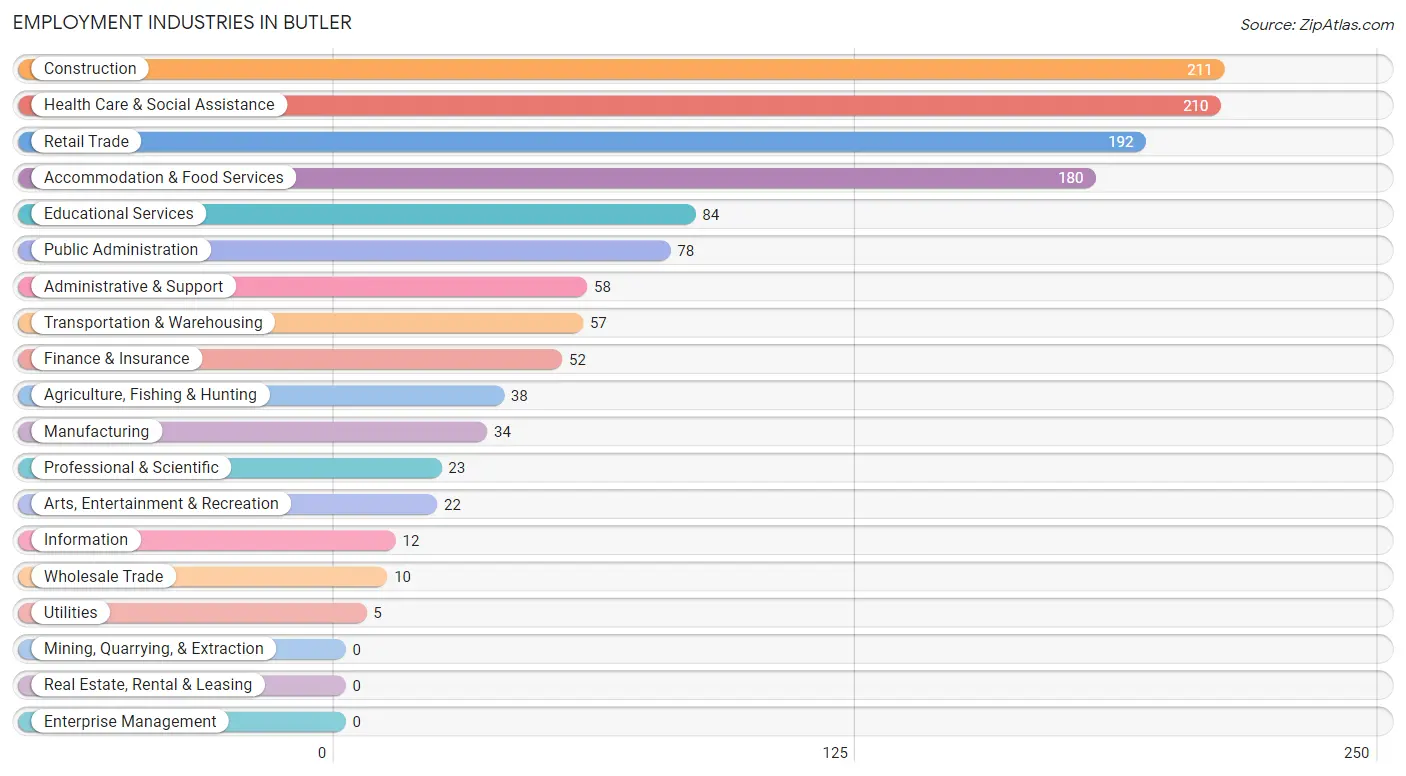
Employment Industries in Butler
The major employment industries in Butler include Construction (211 | 15.4%), Health Care & Social Assistance (210 | 15.3%), Retail Trade (192 | 14.0%), Accommodation & Food Services (180 | 13.1%), and Educational Services (84 | 6.1%).
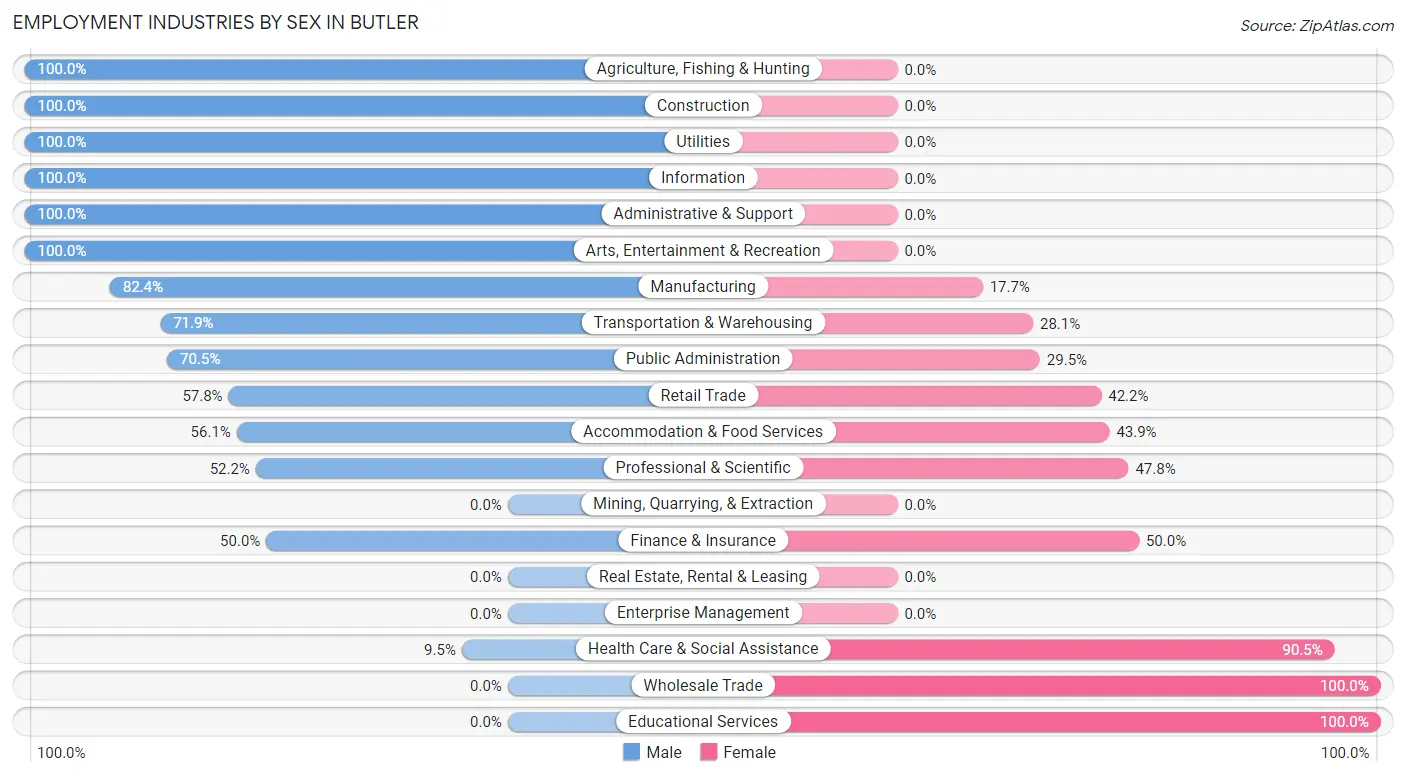
Employment Industries by Sex in Butler
The Butler industries that see more men than women are Agriculture, Fishing & Hunting (100.0%), Construction (100.0%), and Utilities (100.0%), whereas the industries that tend to have a higher number of women are Wholesale Trade (100.0%), Educational Services (100.0%), and Health Care & Social Assistance (90.5%).
| Industry | Male | Female |
| Agriculture, Fishing & Hunting | 38 (100.0%) | 0 (0.0%) |
| Mining, Quarrying, & Extraction | 0 (0.0%) | 0 (0.0%) |
| Construction | 211 (100.0%) | 0 (0.0%) |
| Manufacturing | 28 (82.4%) | 6 (17.6%) |
| Wholesale Trade | 0 (0.0%) | 10 (100.0%) |
| Retail Trade | 111 (57.8%) | 81 (42.2%) |
| Transportation & Warehousing | 41 (71.9%) | 16 (28.1%) |
| Utilities | 5 (100.0%) | 0 (0.0%) |
| Information | 12 (100.0%) | 0 (0.0%) |
| Finance & Insurance | 26 (50.0%) | 26 (50.0%) |
| Real Estate, Rental & Leasing | 0 (0.0%) | 0 (0.0%) |
| Professional & Scientific | 12 (52.2%) | 11 (47.8%) |
| Enterprise Management | 0 (0.0%) | 0 (0.0%) |
| Administrative & Support | 58 (100.0%) | 0 (0.0%) |
| Educational Services | 0 (0.0%) | 84 (100.0%) |
| Health Care & Social Assistance | 20 (9.5%) | 190 (90.5%) |
| Arts, Entertainment & Recreation | 22 (100.0%) | 0 (0.0%) |
| Accommodation & Food Services | 101 (56.1%) | 79 (43.9%) |
| Public Administration | 55 (70.5%) | 23 (29.5%) |
| Total | 795 (57.9%) | 577 (42.1%) |
Education in Butler
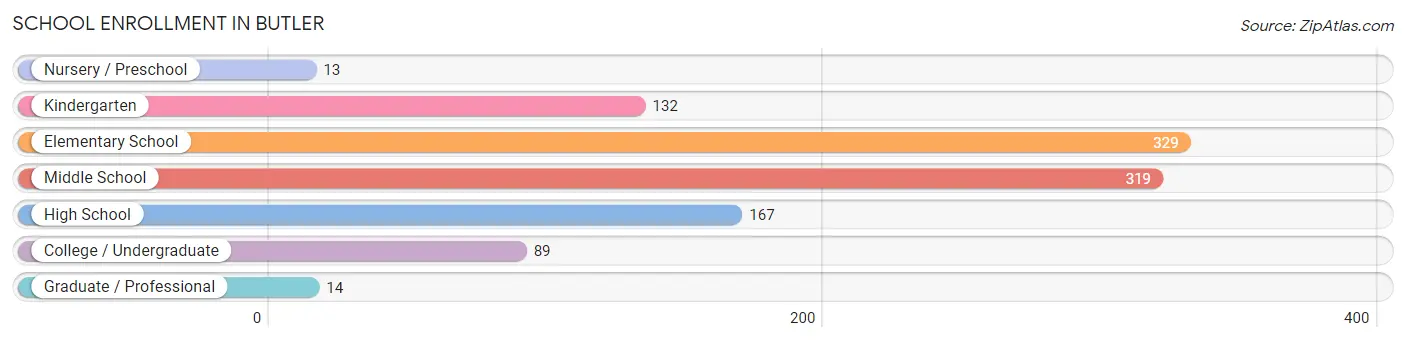
School Enrollment in Butler
The most common levels of schooling among the 1,063 students in Butler are elementary school (329 | 30.9%), middle school (319 | 30.0%), and high school (167 | 15.7%).
| School Level | # Students | % Students |
| Nursery / Preschool | 13 | 1.2% |
| Kindergarten | 132 | 12.4% |
| Elementary School | 329 | 30.9% |
| Middle School | 319 | 30.0% |
| High School | 167 | 15.7% |
| College / Undergraduate | 89 | 8.4% |
| Graduate / Professional | 14 | 1.3% |
| Total | 1,063 | 100.0% |
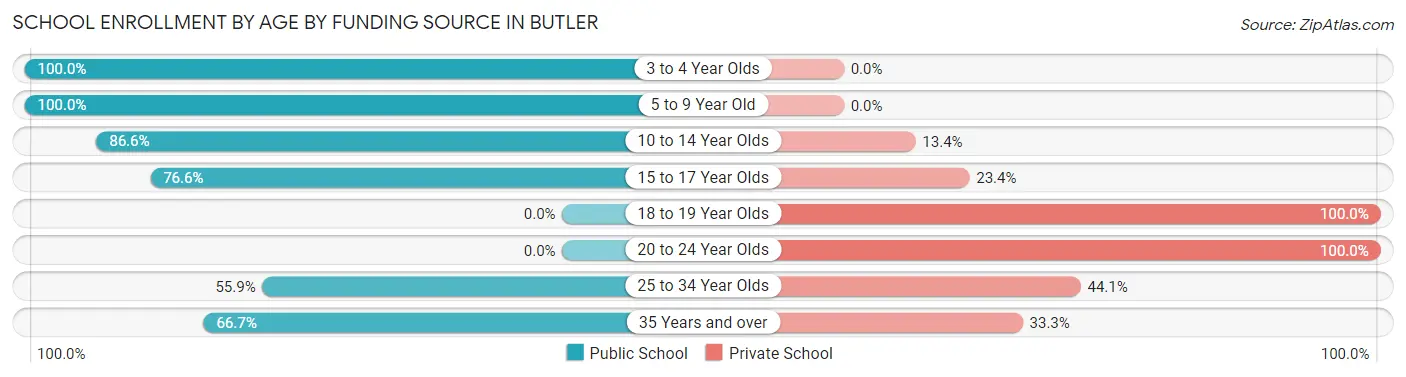
School Enrollment by Age by Funding Source in Butler
Out of a total of 1,063 students who are enrolled in schools in Butler, 157 (14.8%) attend a private institution, while the remaining 906 (85.2%) are enrolled in public schools. The age group of 18 to 19 year olds has the highest likelihood of being enrolled in private schools, with 26 (100.0% in the age bracket) enrolled. Conversely, the age group of 3 to 4 year olds has the lowest likelihood of being enrolled in a private school, with 13 (100.0% in the age bracket) attending a public institution.
| Age Bracket | Public School | Private School |
| 3 to 4 Year Olds | 13 (100.0%) | 0 (0.0%) |
| 5 to 9 Year Old | 452 (100.0%) | 0 (0.0%) |
| 10 to 14 Year Olds | 266 (86.6%) | 41 (13.4%) |
| 15 to 17 Year Olds | 144 (76.6%) | 44 (23.4%) |
| 18 to 19 Year Olds | 0 (0.0%) | 26 (100.0%) |
| 20 to 24 Year Olds | 0 (0.0%) | 25 (100.0%) |
| 25 to 34 Year Olds | 19 (55.9%) | 15 (44.1%) |
| 35 Years and over | 12 (66.7%) | 6 (33.3%) |
| Total | 906 (85.2%) | 157 (14.8%) |
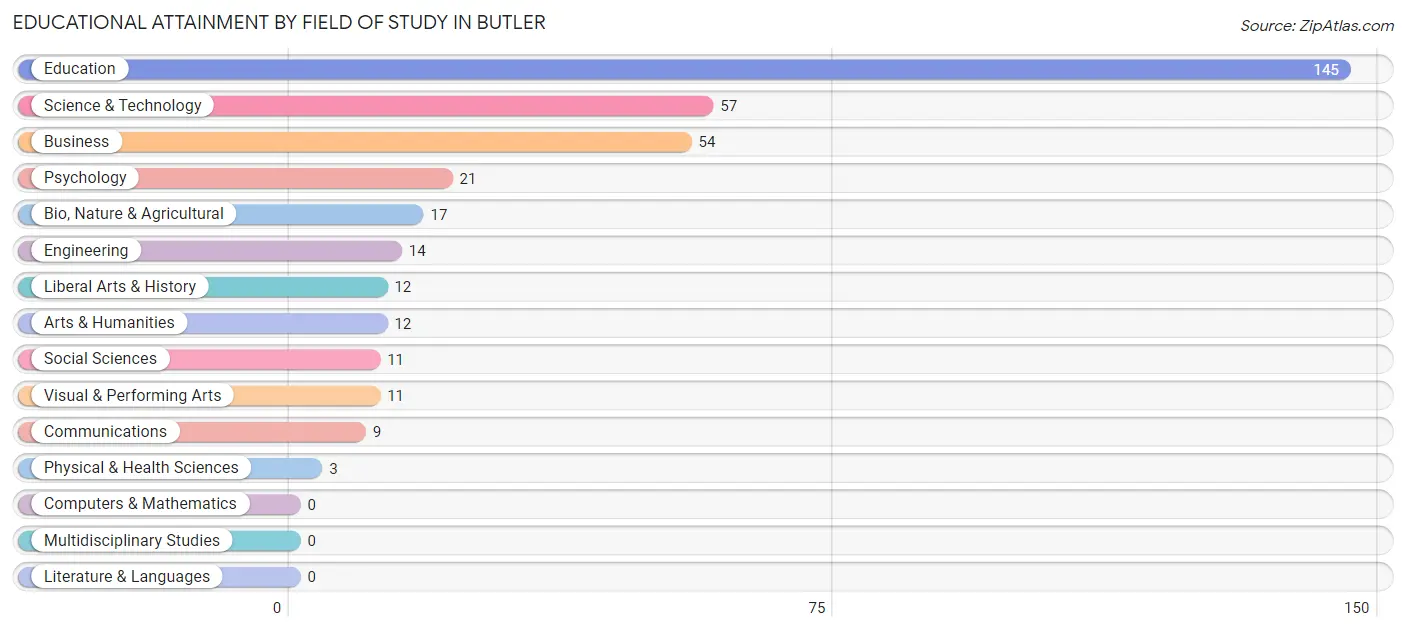
Educational Attainment by Field of Study in Butler
Education (145 | 39.6%), science & technology (57 | 15.6%), business (54 | 14.7%), psychology (21 | 5.7%), and bio, nature & agricultural (17 | 4.6%) are the most common fields of study among 366 individuals in Butler who have obtained a bachelor's degree or higher.
| Field of Study | # Graduates | % Graduates |
| Computers & Mathematics | 0 | 0.0% |
| Bio, Nature & Agricultural | 17 | 4.6% |
| Physical & Health Sciences | 3 | 0.8% |
| Psychology | 21 | 5.7% |
| Social Sciences | 11 | 3.0% |
| Engineering | 14 | 3.8% |
| Multidisciplinary Studies | 0 | 0.0% |
| Science & Technology | 57 | 15.6% |
| Business | 54 | 14.7% |
| Education | 145 | 39.6% |
| Literature & Languages | 0 | 0.0% |
| Liberal Arts & History | 12 | 3.3% |
| Visual & Performing Arts | 11 | 3.0% |
| Communications | 9 | 2.5% |
| Arts & Humanities | 12 | 3.3% |
| Total | 366 | 100.0% |
Transportation & Commute in Butler
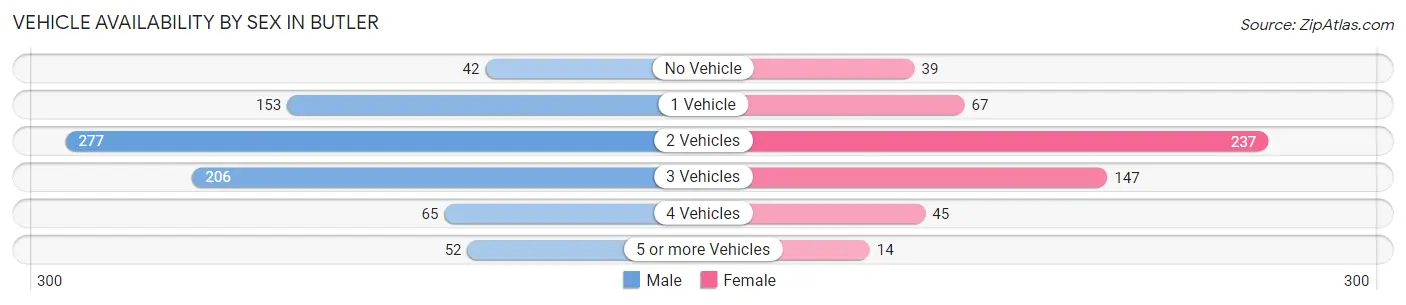
Vehicle Availability by Sex in Butler
The most prevalent vehicle ownership categories in Butler are males with 2 vehicles (277, accounting for 34.8%) and females with 2 vehicles (237, making up 50.5%).
| Vehicles Available | Male | Female |
| No Vehicle | 42 (5.3%) | 39 (7.1%) |
| 1 Vehicle | 153 (19.3%) | 67 (12.2%) |
| 2 Vehicles | 277 (34.8%) | 237 (43.2%) |
| 3 Vehicles | 206 (25.9%) | 147 (26.8%) |
| 4 Vehicles | 65 (8.2%) | 45 (8.2%) |
| 5 or more Vehicles | 52 (6.5%) | 14 (2.5%) |
| Total | 795 (100.0%) | 549 (100.0%) |
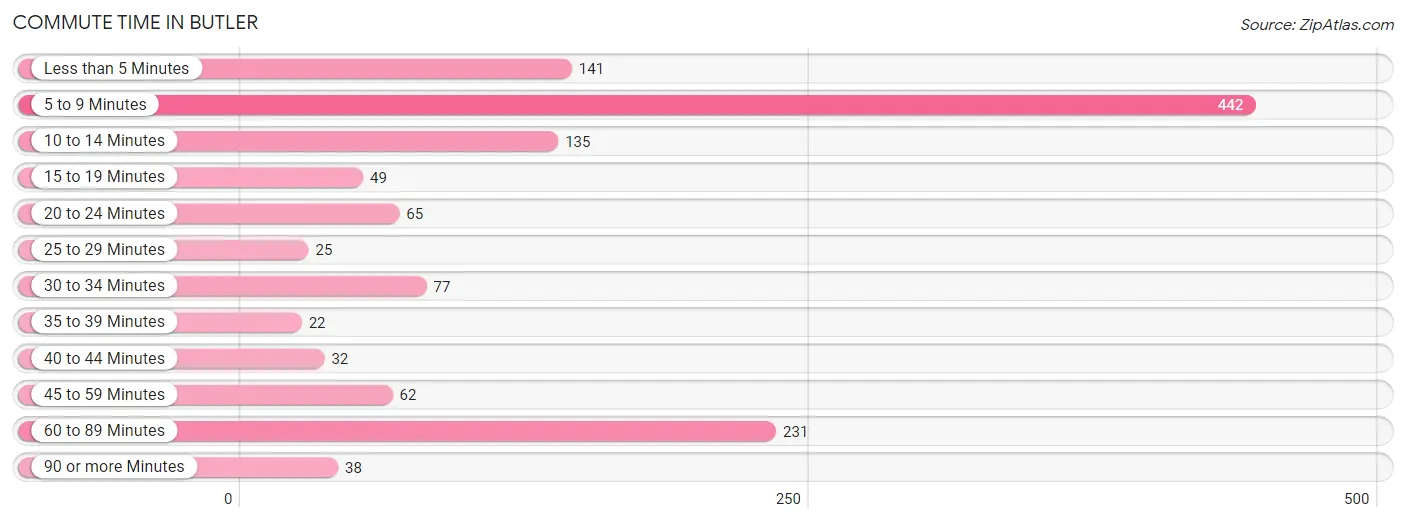
Commute Time in Butler
The most frequently occuring commute durations in Butler are 5 to 9 minutes (442 commuters, 33.5%), 60 to 89 minutes (231 commuters, 17.5%), and less than 5 minutes (141 commuters, 10.7%).
| Commute Time | # Commuters | % Commuters |
| Less than 5 Minutes | 141 | 10.7% |
| 5 to 9 Minutes | 442 | 33.5% |
| 10 to 14 Minutes | 135 | 10.2% |
| 15 to 19 Minutes | 49 | 3.7% |
| 20 to 24 Minutes | 65 | 4.9% |
| 25 to 29 Minutes | 25 | 1.9% |
| 30 to 34 Minutes | 77 | 5.8% |
| 35 to 39 Minutes | 22 | 1.7% |
| 40 to 44 Minutes | 32 | 2.4% |
| 45 to 59 Minutes | 62 | 4.7% |
| 60 to 89 Minutes | 231 | 17.5% |
| 90 or more Minutes | 38 | 2.9% |
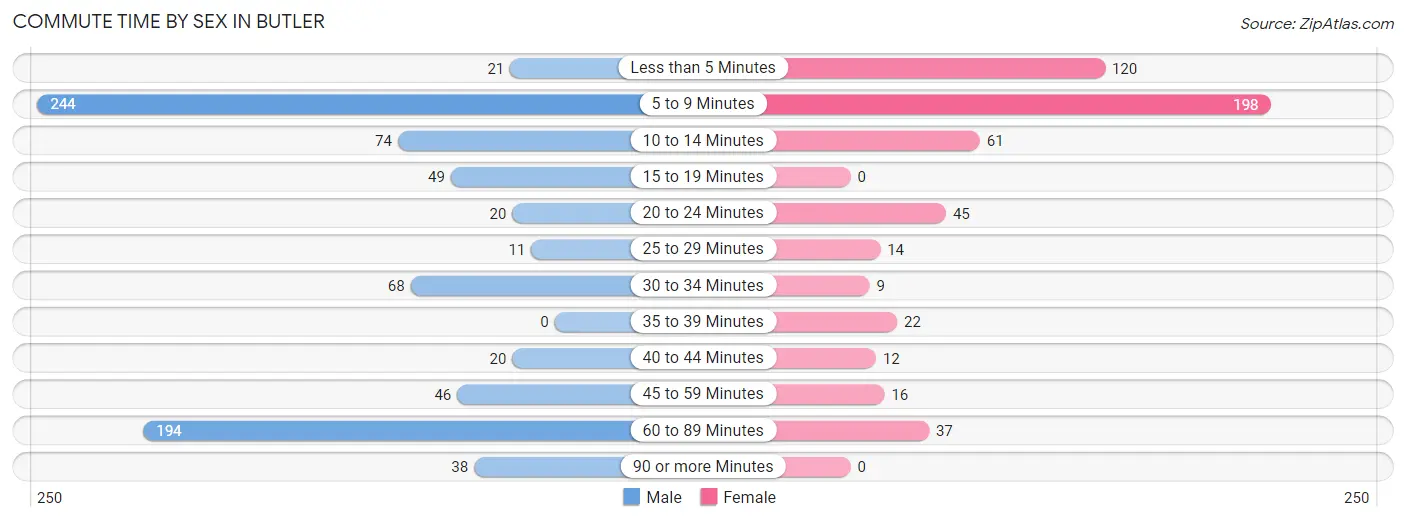
Commute Time by Sex in Butler
The most common commute times in Butler are 5 to 9 minutes (244 commuters, 31.1%) for males and 5 to 9 minutes (198 commuters, 37.1%) for females.
| Commute Time | Male | Female |
| Less than 5 Minutes | 21 (2.7%) | 120 (22.5%) |
| 5 to 9 Minutes | 244 (31.1%) | 198 (37.1%) |
| 10 to 14 Minutes | 74 (9.4%) | 61 (11.4%) |
| 15 to 19 Minutes | 49 (6.2%) | 0 (0.0%) |
| 20 to 24 Minutes | 20 (2.5%) | 45 (8.4%) |
| 25 to 29 Minutes | 11 (1.4%) | 14 (2.6%) |
| 30 to 34 Minutes | 68 (8.7%) | 9 (1.7%) |
| 35 to 39 Minutes | 0 (0.0%) | 22 (4.1%) |
| 40 to 44 Minutes | 20 (2.5%) | 12 (2.2%) |
| 45 to 59 Minutes | 46 (5.9%) | 16 (3.0%) |
| 60 to 89 Minutes | 194 (24.7%) | 37 (6.9%) |
| 90 or more Minutes | 38 (4.8%) | 0 (0.0%) |
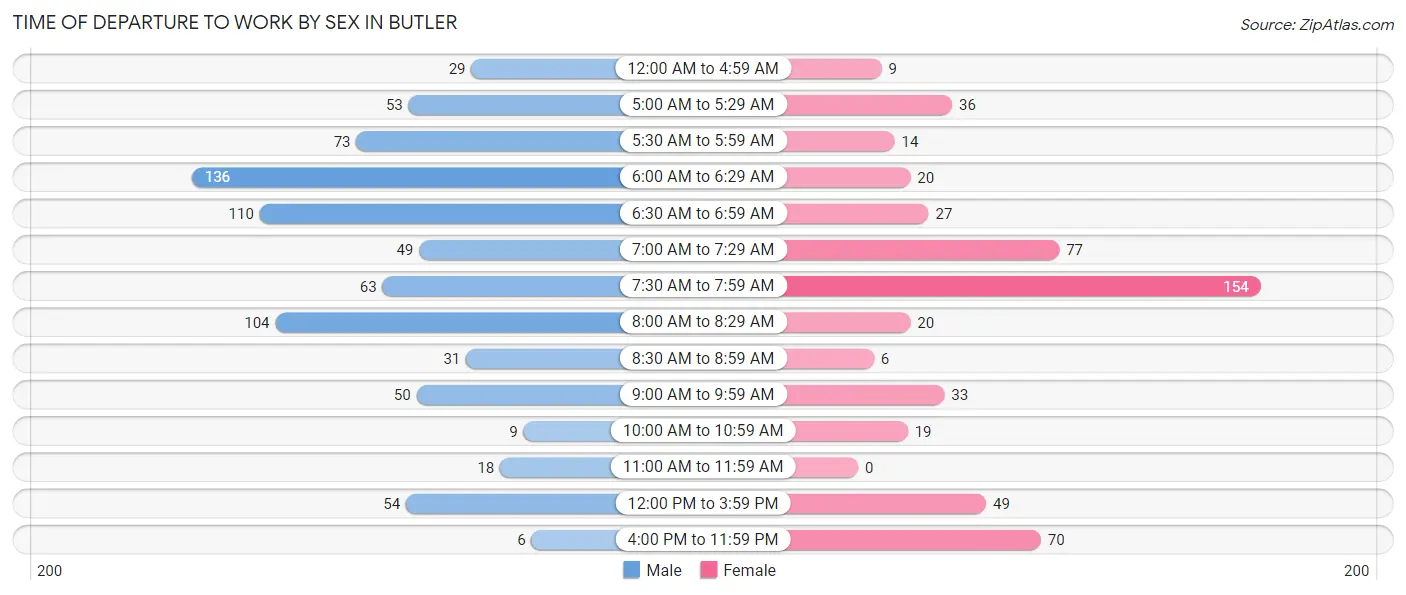
Time of Departure to Work by Sex in Butler
The most frequent times of departure to work in Butler are 6:00 AM to 6:29 AM (136, 17.3%) for males and 7:30 AM to 7:59 AM (154, 28.8%) for females.
| Time of Departure | Male | Female |
| 12:00 AM to 4:59 AM | 29 (3.7%) | 9 (1.7%) |
| 5:00 AM to 5:29 AM | 53 (6.8%) | 36 (6.7%) |
| 5:30 AM to 5:59 AM | 73 (9.3%) | 14 (2.6%) |
| 6:00 AM to 6:29 AM | 136 (17.3%) | 20 (3.7%) |
| 6:30 AM to 6:59 AM | 110 (14.0%) | 27 (5.1%) |
| 7:00 AM to 7:29 AM | 49 (6.2%) | 77 (14.4%) |
| 7:30 AM to 7:59 AM | 63 (8.0%) | 154 (28.8%) |
| 8:00 AM to 8:29 AM | 104 (13.3%) | 20 (3.7%) |
| 8:30 AM to 8:59 AM | 31 (4.0%) | 6 (1.1%) |
| 9:00 AM to 9:59 AM | 50 (6.4%) | 33 (6.2%) |
| 10:00 AM to 10:59 AM | 9 (1.1%) | 19 (3.6%) |
| 11:00 AM to 11:59 AM | 18 (2.3%) | 0 (0.0%) |
| 12:00 PM to 3:59 PM | 54 (6.9%) | 49 (9.2%) |
| 4:00 PM to 11:59 PM | 6 (0.8%) | 70 (13.1%) |
| Total | 785 (100.0%) | 534 (100.0%) |
Housing Occupancy in Butler
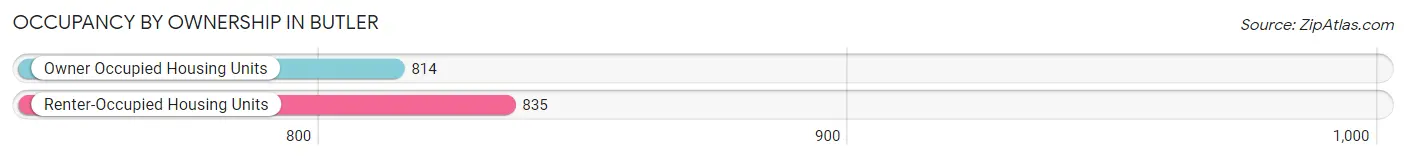
Occupancy by Ownership in Butler
Of the total 1,649 dwellings in Butler, owner-occupied units account for 814 (49.4%), while renter-occupied units make up 835 (50.6%).
| Occupancy | # Housing Units | % Housing Units |
| Owner Occupied Housing Units | 814 | 49.4% |
| Renter-Occupied Housing Units | 835 | 50.6% |
| Total Occupied Housing Units | 1,649 | 100.0% |
Occupancy by Household Size in Butler
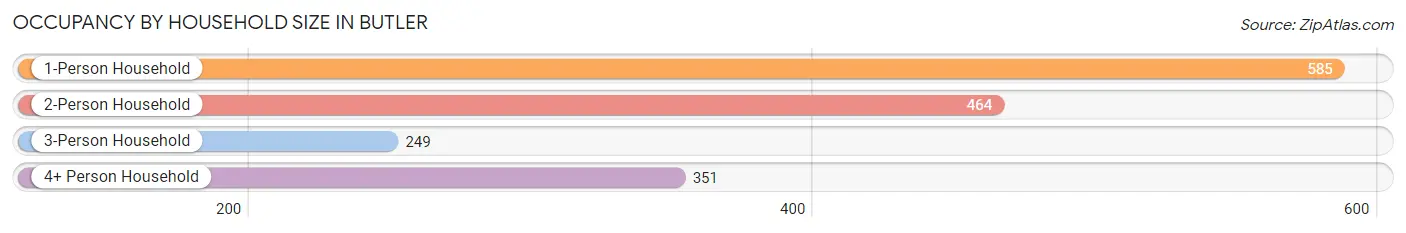
| Household Size | # Housing Units | % Housing Units |
| 1-Person Household | 585 | 35.5% |
| 2-Person Household | 464 | 28.1% |
| 3-Person Household | 249 | 15.1% |
| 4+ Person Household | 351 | 21.3% |
| Total Housing Units | 1,649 | 100.0% |
Occupancy by Ownership by Household Size in Butler
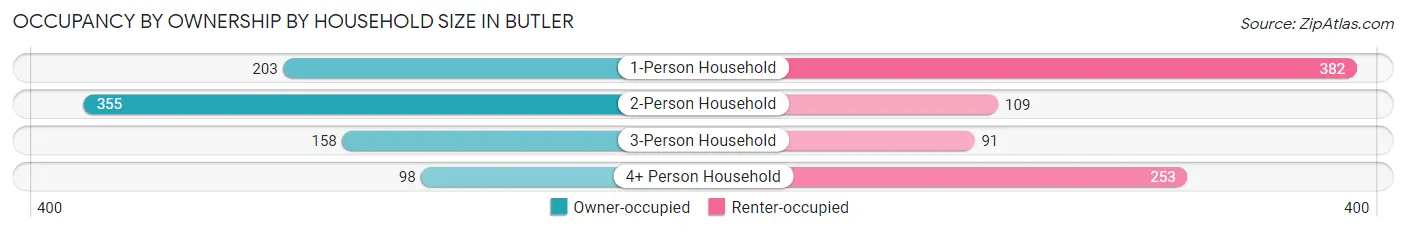
| Household Size | Owner-occupied | Renter-occupied |
| 1-Person Household | 203 (34.7%) | 382 (65.3%) |
| 2-Person Household | 355 (76.5%) | 109 (23.5%) |
| 3-Person Household | 158 (63.4%) | 91 (36.5%) |
| 4+ Person Household | 98 (27.9%) | 253 (72.1%) |
| Total Housing Units | 814 (49.4%) | 835 (50.6%) |
Occupancy by Educational Attainment in Butler
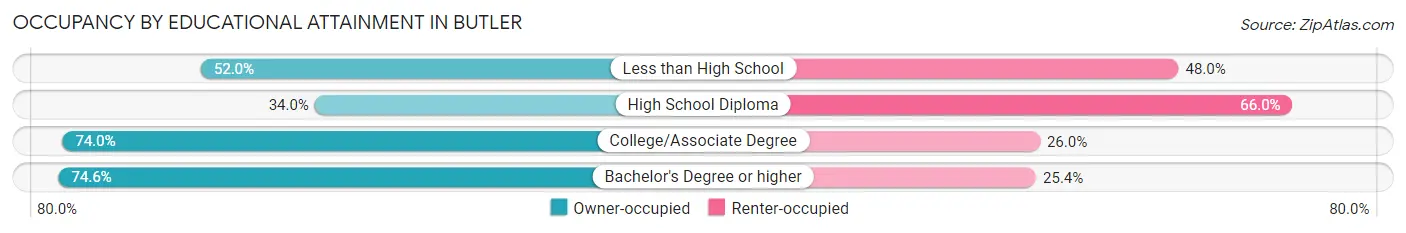
| Household Size | Owner-occupied | Renter-occupied |
| Less than High School | 51 (52.0%) | 47 (48.0%) |
| High School Diploma | 328 (34.0%) | 637 (66.0%) |
| College/Associate Degree | 282 (74.0%) | 99 (26.0%) |
| Bachelor's Degree or higher | 153 (74.6%) | 52 (25.4%) |
Occupancy by Age of Householder in Butler
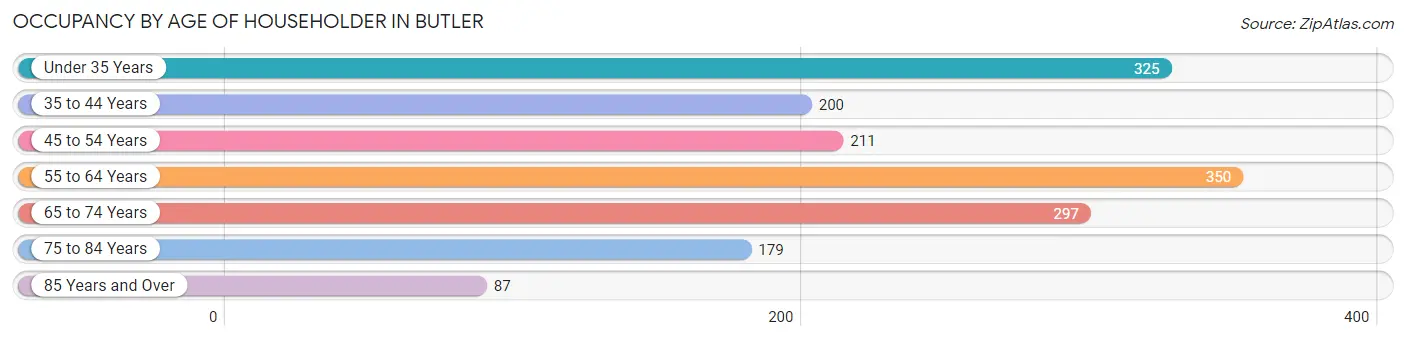
| Age Bracket | # Households | % Households |
| Under 35 Years | 325 | 19.7% |
| 35 to 44 Years | 200 | 12.1% |
| 45 to 54 Years | 211 | 12.8% |
| 55 to 64 Years | 350 | 21.2% |
| 65 to 74 Years | 297 | 18.0% |
| 75 to 84 Years | 179 | 10.9% |
| 85 Years and Over | 87 | 5.3% |
| Total | 1,649 | 100.0% |
Housing Finances in Butler
Median Income by Occupancy in Butler
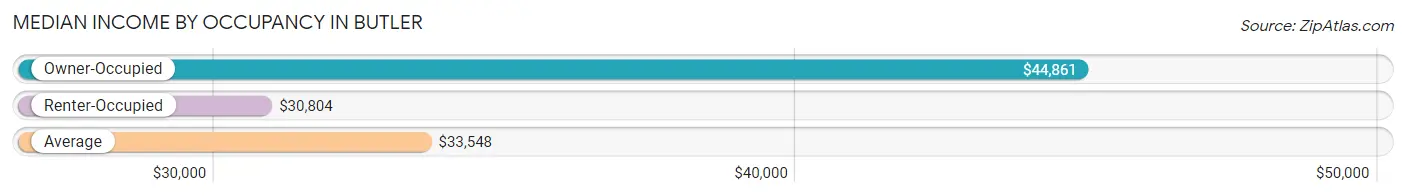
| Occupancy Type | # Households | Median Income |
| Owner-Occupied | 814 (49.4%) | $44,861 |
| Renter-Occupied | 835 (50.6%) | $30,804 |
| Average | 1,649 (100.0%) | $33,548 |
Occupancy by Householder Income Bracket in Butler
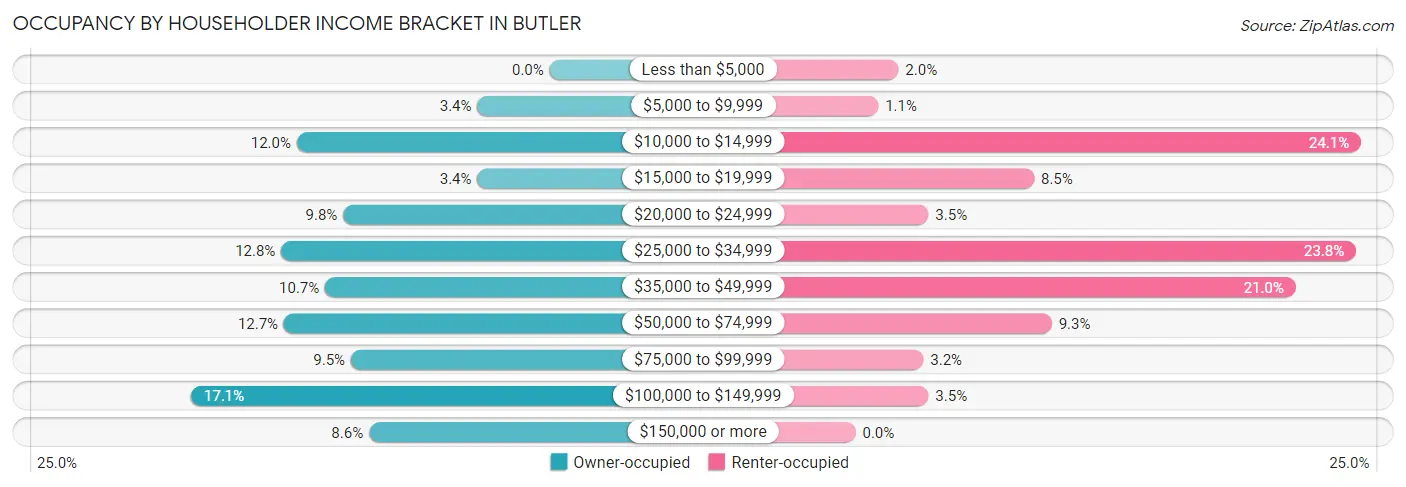
| Income Bracket | Owner-occupied | Renter-occupied |
| Less than $5,000 | 0 (0.0%) | 17 (2.0%) |
| $5,000 to $9,999 | 28 (3.4%) | 9 (1.1%) |
| $10,000 to $14,999 | 98 (12.0%) | 201 (24.1%) |
| $15,000 to $19,999 | 28 (3.4%) | 71 (8.5%) |
| $20,000 to $24,999 | 80 (9.8%) | 29 (3.5%) |
| $25,000 to $34,999 | 104 (12.8%) | 199 (23.8%) |
| $35,000 to $49,999 | 87 (10.7%) | 175 (21.0%) |
| $50,000 to $74,999 | 103 (12.7%) | 78 (9.3%) |
| $75,000 to $99,999 | 77 (9.5%) | 27 (3.2%) |
| $100,000 to $149,999 | 139 (17.1%) | 29 (3.5%) |
| $150,000 or more | 70 (8.6%) | 0 (0.0%) |
| Total | 814 (100.0%) | 835 (100.0%) |
Monthly Housing Cost Tiers in Butler
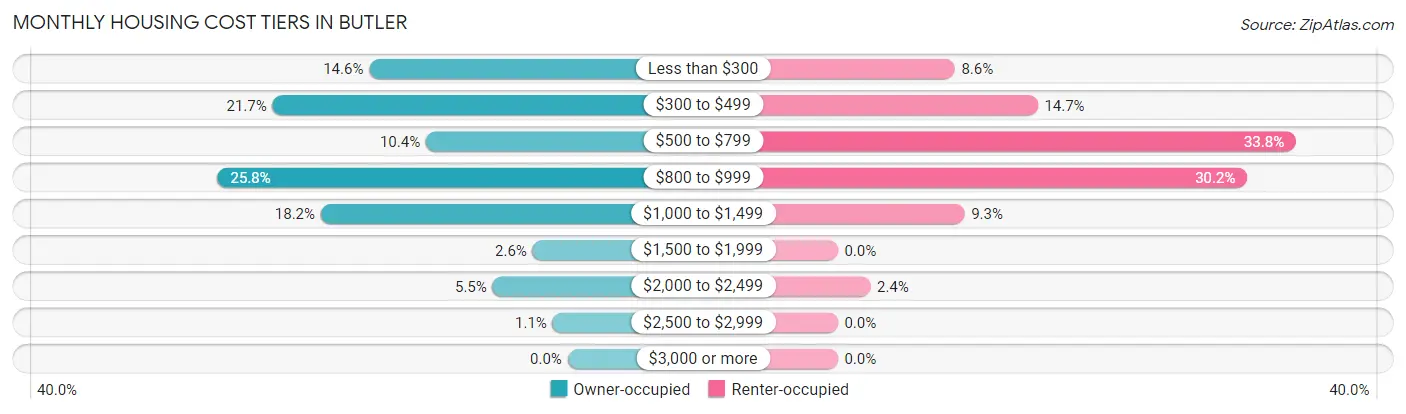
| Monthly Cost | Owner-occupied | Renter-occupied |
| Less than $300 | 119 (14.6%) | 72 (8.6%) |
| $300 to $499 | 177 (21.7%) | 123 (14.7%) |
| $500 to $799 | 85 (10.4%) | 282 (33.8%) |
| $800 to $999 | 210 (25.8%) | 252 (30.2%) |
| $1,000 to $1,499 | 148 (18.2%) | 78 (9.3%) |
| $1,500 to $1,999 | 21 (2.6%) | 0 (0.0%) |
| $2,000 to $2,499 | 45 (5.5%) | 20 (2.4%) |
| $2,500 to $2,999 | 9 (1.1%) | 0 (0.0%) |
| $3,000 or more | 0 (0.0%) | 0 (0.0%) |
| Total | 814 (100.0%) | 835 (100.0%) |
Physical Housing Characteristics in Butler
Housing Structures in Butler
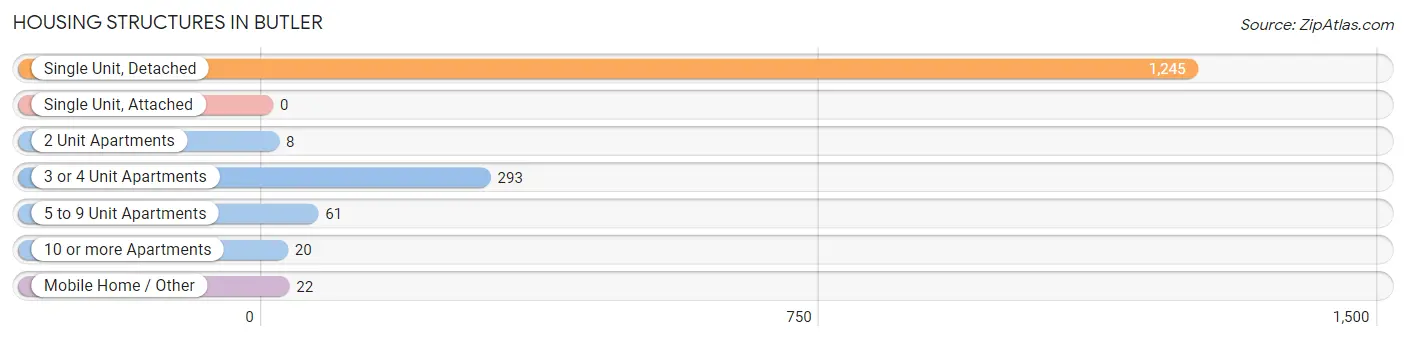
| Structure Type | # Housing Units | % Housing Units |
| Single Unit, Detached | 1,245 | 75.5% |
| Single Unit, Attached | 0 | 0.0% |
| 2 Unit Apartments | 8 | 0.5% |
| 3 or 4 Unit Apartments | 293 | 17.8% |
| 5 to 9 Unit Apartments | 61 | 3.7% |
| 10 or more Apartments | 20 | 1.2% |
| Mobile Home / Other | 22 | 1.3% |
| Total | 1,649 | 100.0% |
Housing Structures by Occupancy in Butler
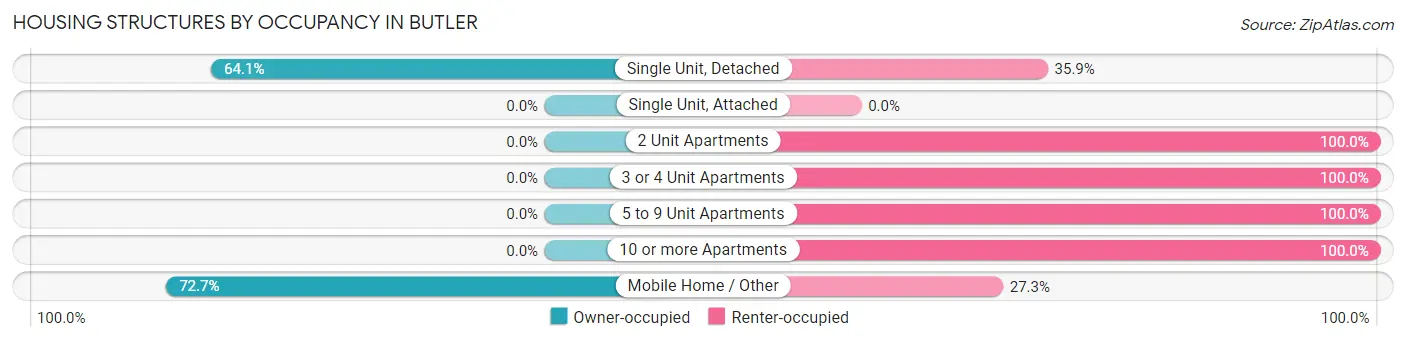
| Structure Type | Owner-occupied | Renter-occupied |
| Single Unit, Detached | 798 (64.1%) | 447 (35.9%) |
| Single Unit, Attached | 0 (0.0%) | 0 (0.0%) |
| 2 Unit Apartments | 0 (0.0%) | 8 (100.0%) |
| 3 or 4 Unit Apartments | 0 (0.0%) | 293 (100.0%) |
| 5 to 9 Unit Apartments | 0 (0.0%) | 61 (100.0%) |
| 10 or more Apartments | 0 (0.0%) | 20 (100.0%) |
| Mobile Home / Other | 16 (72.7%) | 6 (27.3%) |
| Total | 814 (49.4%) | 835 (50.6%) |
Housing Structures by Number of Rooms in Butler
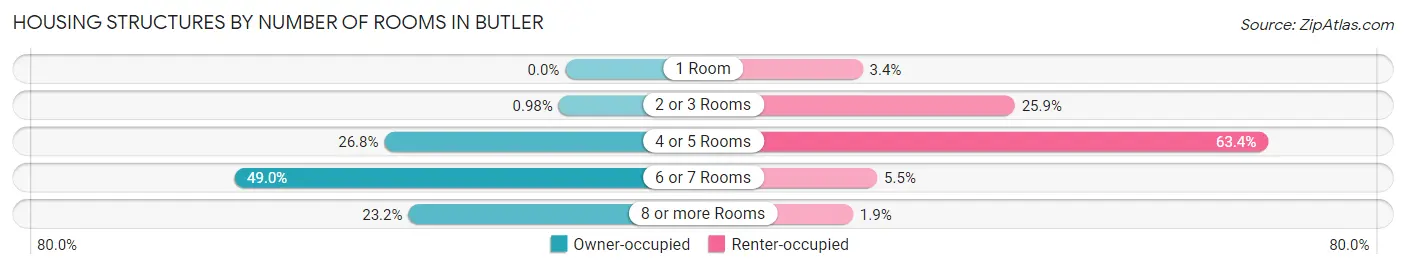
| Number of Rooms | Owner-occupied | Renter-occupied |
| 1 Room | 0 (0.0%) | 28 (3.4%) |
| 2 or 3 Rooms | 8 (1.0%) | 216 (25.9%) |
| 4 or 5 Rooms | 218 (26.8%) | 529 (63.3%) |
| 6 or 7 Rooms | 399 (49.0%) | 46 (5.5%) |
| 8 or more Rooms | 189 (23.2%) | 16 (1.9%) |
| Total | 814 (100.0%) | 835 (100.0%) |
Housing Structure by Heating Type in Butler
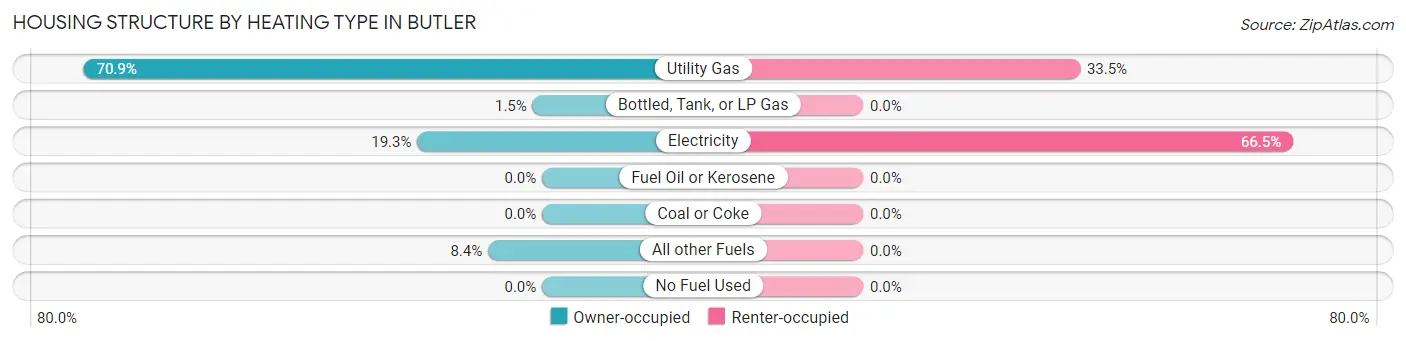
| Heating Type | Owner-occupied | Renter-occupied |
| Utility Gas | 577 (70.9%) | 280 (33.5%) |
| Bottled, Tank, or LP Gas | 12 (1.5%) | 0 (0.0%) |
| Electricity | 157 (19.3%) | 555 (66.5%) |
| Fuel Oil or Kerosene | 0 (0.0%) | 0 (0.0%) |
| Coal or Coke | 0 (0.0%) | 0 (0.0%) |
| All other Fuels | 68 (8.4%) | 0 (0.0%) |
| No Fuel Used | 0 (0.0%) | 0 (0.0%) |
| Total | 814 (100.0%) | 835 (100.0%) |
Household Vehicle Usage in Butler
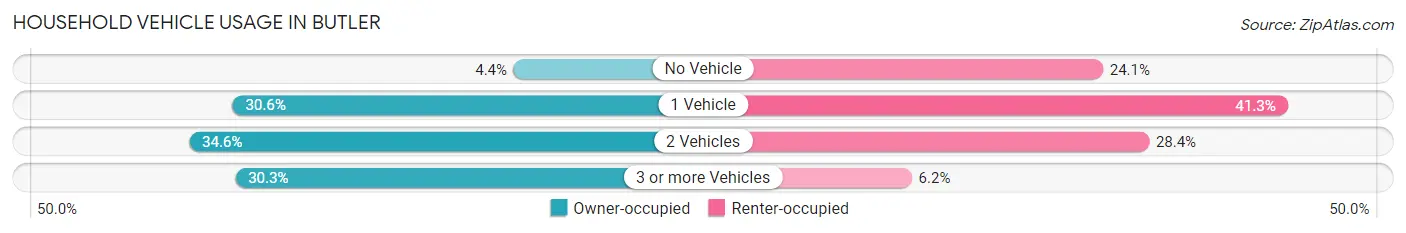
| Vehicles per Household | Owner-occupied | Renter-occupied |
| No Vehicle | 36 (4.4%) | 201 (24.1%) |
| 1 Vehicle | 249 (30.6%) | 345 (41.3%) |
| 2 Vehicles | 282 (34.6%) | 237 (28.4%) |
| 3 or more Vehicles | 247 (30.3%) | 52 (6.2%) |
| Total | 814 (100.0%) | 835 (100.0%) |
Real Estate & Mortgages in Butler
Real Estate and Mortgage Overview in Butler
| Characteristic | Without Mortgage | With Mortgage |
| Housing Units | 371 | 443 |
| Median Property Value | $90,600 | $146,400 |
| Median Household Income | $32,243 | $70 |
| Monthly Housing Costs | $424 | $0 |
| Real Estate Taxes | $879 | $6 |
Property Value by Mortgage Status in Butler
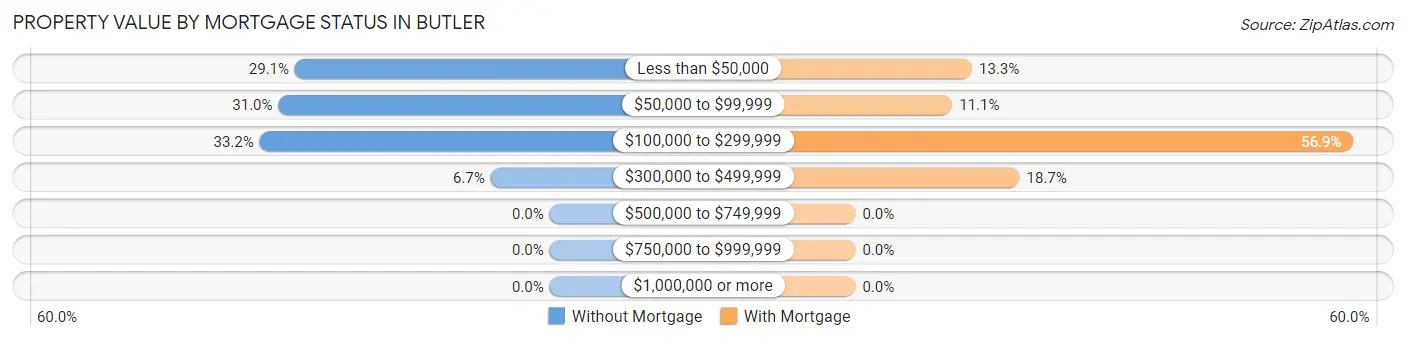
| Property Value | Without Mortgage | With Mortgage |
| Less than $50,000 | 108 (29.1%) | 59 (13.3%) |
| $50,000 to $99,999 | 115 (31.0%) | 49 (11.1%) |
| $100,000 to $299,999 | 123 (33.2%) | 252 (56.9%) |
| $300,000 to $499,999 | 25 (6.7%) | 83 (18.7%) |
| $500,000 to $749,999 | 0 (0.0%) | 0 (0.0%) |
| $750,000 to $999,999 | 0 (0.0%) | 0 (0.0%) |
| $1,000,000 or more | 0 (0.0%) | 0 (0.0%) |
| Total | 371 (100.0%) | 443 (100.0%) |
Household Income by Mortgage Status in Butler
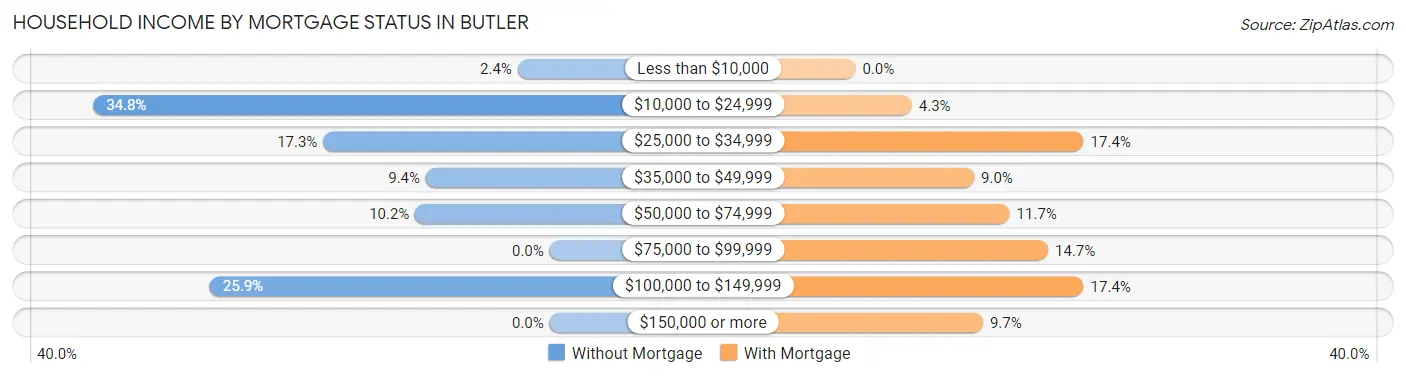
| Household Income | Without Mortgage | With Mortgage |
| Less than $10,000 | 9 (2.4%) | 0 (0.0%) |
| $10,000 to $24,999 | 129 (34.8%) | 19 (4.3%) |
| $25,000 to $34,999 | 64 (17.2%) | 77 (17.4%) |
| $35,000 to $49,999 | 35 (9.4%) | 40 (9.0%) |
| $50,000 to $74,999 | 38 (10.2%) | 52 (11.7%) |
| $75,000 to $99,999 | 0 (0.0%) | 65 (14.7%) |
| $100,000 to $149,999 | 96 (25.9%) | 77 (17.4%) |
| $150,000 or more | 0 (0.0%) | 43 (9.7%) |
| Total | 371 (100.0%) | 443 (100.0%) |
Property Value to Household Income Ratio in Butler
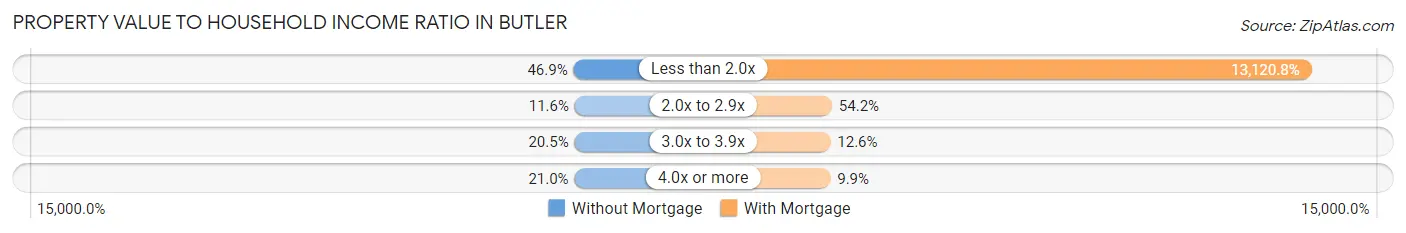
| Value-to-Income Ratio | Without Mortgage | With Mortgage |
| Less than 2.0x | 174 (46.9%) | 58,125 (13,120.8%) |
| 2.0x to 2.9x | 43 (11.6%) | 240 (54.2%) |
| 3.0x to 3.9x | 76 (20.5%) | 56 (12.6%) |
| 4.0x or more | 78 (21.0%) | 44 (9.9%) |
| Total | 371 (100.0%) | 443 (100.0%) |
Real Estate Taxes by Mortgage Status in Butler
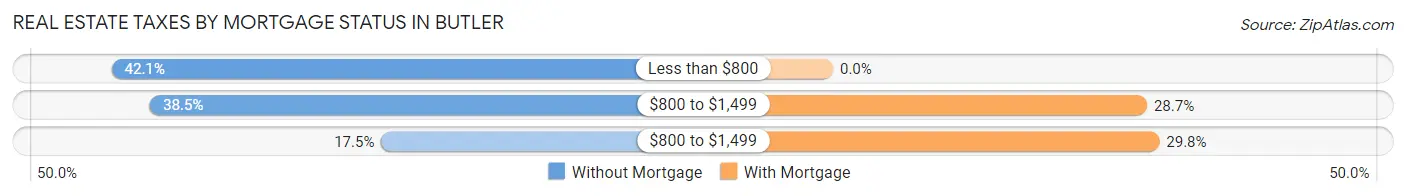
| Property Taxes | Without Mortgage | With Mortgage |
| Less than $800 | 156 (42.0%) | 0 (0.0%) |
| $800 to $1,499 | 143 (38.5%) | 127 (28.7%) |
| $800 to $1,499 | 65 (17.5%) | 132 (29.8%) |
| Total | 371 (100.0%) | 443 (100.0%) |
Health & Disability in Butler
Health Insurance Coverage by Age in Butler
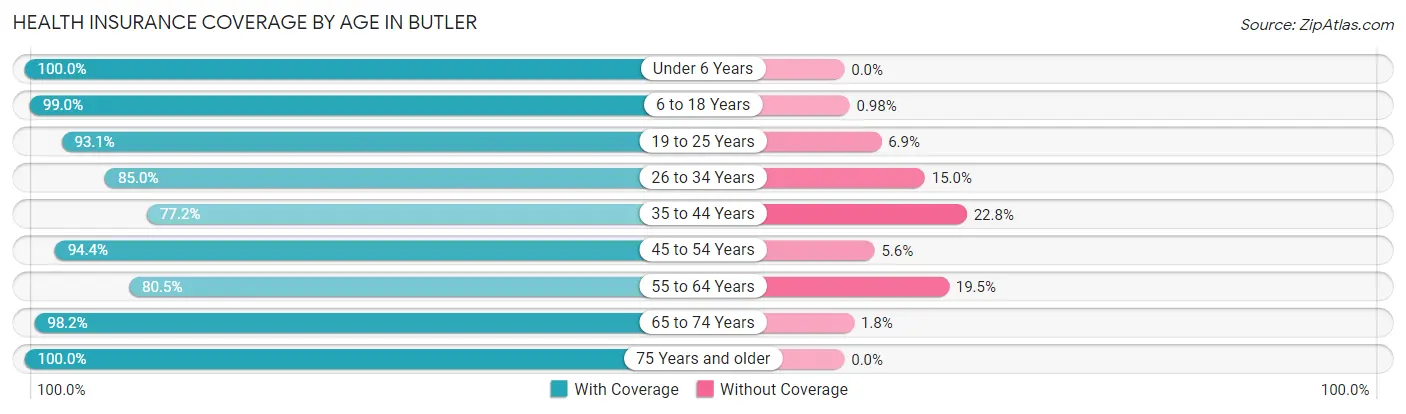
| Age Bracket | With Coverage | Without Coverage |
| Under 6 Years | 340 (100.0%) | 0 (0.0%) |
| 6 to 18 Years | 907 (99.0%) | 9 (1.0%) |
| 19 to 25 Years | 203 (93.1%) | 15 (6.9%) |
| 26 to 34 Years | 515 (85.0%) | 91 (15.0%) |
| 35 to 44 Years | 365 (77.2%) | 108 (22.8%) |
| 45 to 54 Years | 386 (94.4%) | 23 (5.6%) |
| 55 to 64 Years | 434 (80.5%) | 105 (19.5%) |
| 65 to 74 Years | 434 (98.2%) | 8 (1.8%) |
| 75 Years and older | 345 (100.0%) | 0 (0.0%) |
| Total | 3,929 (91.6%) | 359 (8.4%) |
Health Insurance Coverage by Citizenship Status in Butler
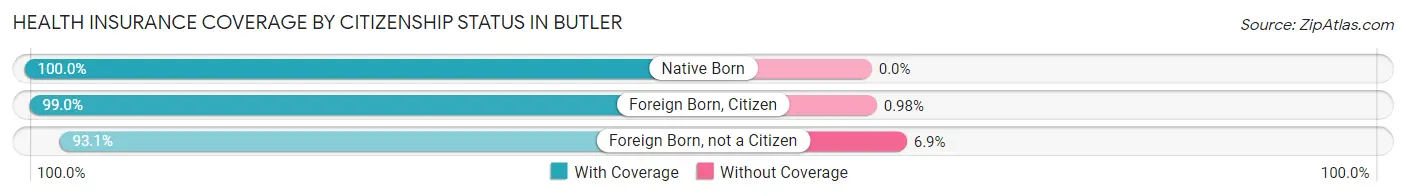
| Citizenship Status | With Coverage | Without Coverage |
| Native Born | 340 (100.0%) | 0 (0.0%) |
| Foreign Born, Citizen | 907 (99.0%) | 9 (1.0%) |
| Foreign Born, not a Citizen | 203 (93.1%) | 15 (6.9%) |
Health Insurance Coverage by Household Income in Butler
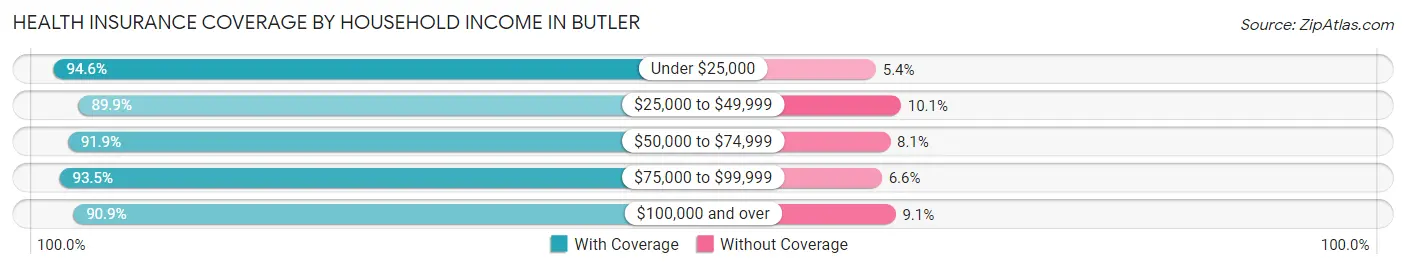
| Household Income | With Coverage | Without Coverage |
| Under $25,000 | 888 (94.6%) | 51 (5.4%) |
| $25,000 to $49,999 | 1,394 (89.9%) | 157 (10.1%) |
| $50,000 to $74,999 | 499 (91.9%) | 44 (8.1%) |
| $75,000 to $99,999 | 371 (93.4%) | 26 (6.6%) |
| $100,000 and over | 777 (90.9%) | 78 (9.1%) |
Public vs Private Health Insurance Coverage by Age in Butler
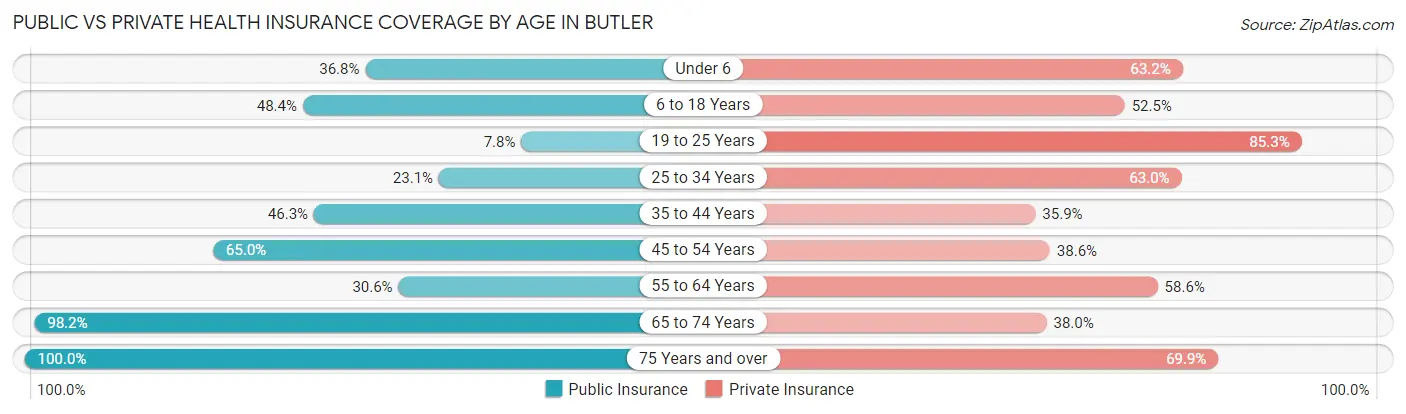
| Age Bracket | Public Insurance | Private Insurance |
| Under 6 | 125 (36.8%) | 215 (63.2%) |
| 6 to 18 Years | 443 (48.4%) | 481 (52.5%) |
| 19 to 25 Years | 17 (7.8%) | 186 (85.3%) |
| 25 to 34 Years | 140 (23.1%) | 382 (63.0%) |
| 35 to 44 Years | 219 (46.3%) | 170 (35.9%) |
| 45 to 54 Years | 266 (65.0%) | 158 (38.6%) |
| 55 to 64 Years | 165 (30.6%) | 316 (58.6%) |
| 65 to 74 Years | 434 (98.2%) | 168 (38.0%) |
| 75 Years and over | 345 (100.0%) | 241 (69.9%) |
| Total | 2,154 (50.2%) | 2,317 (54.0%) |
Disability Status by Sex by Age in Butler
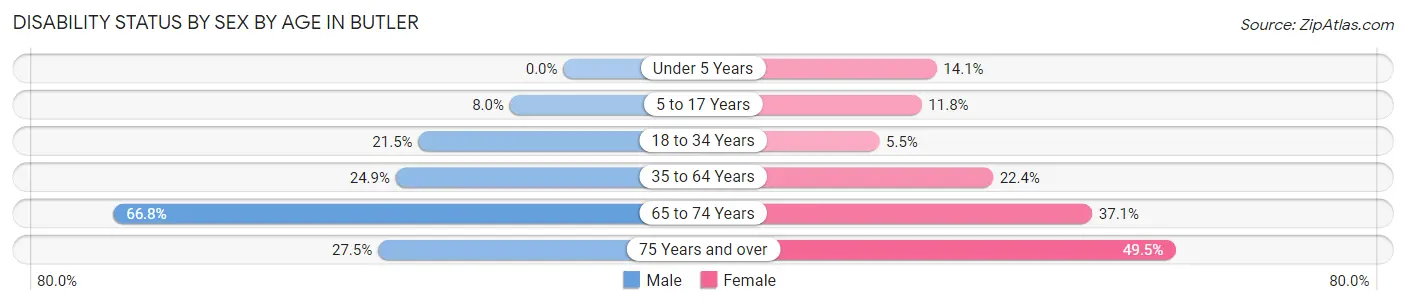
| Age Bracket | Male | Female |
| Under 5 Years | 0 (0.0%) | 17 (14.1%) |
| 5 to 17 Years | 43 (8.0%) | 48 (11.8%) |
| 18 to 34 Years | 105 (21.5%) | 21 (5.5%) |
| 35 to 64 Years | 157 (24.9%) | 177 (22.4%) |
| 65 to 74 Years | 137 (66.8%) | 88 (37.1%) |
| 75 Years and over | 41 (27.5%) | 97 (49.5%) |
Disability Class by Sex by Age in Butler
Disability Class: Hearing Difficulty
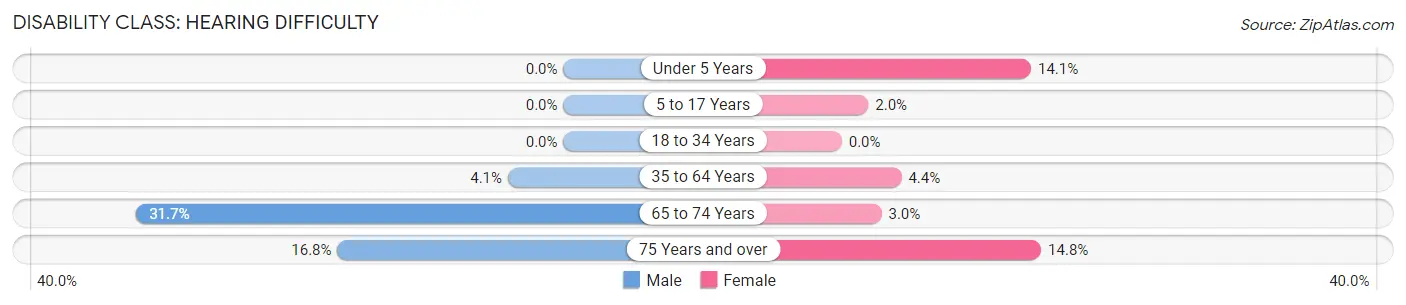
| Age Bracket | Male | Female |
| Under 5 Years | 0 (0.0%) | 17 (14.1%) |
| 5 to 17 Years | 0 (0.0%) | 8 (2.0%) |
| 18 to 34 Years | 0 (0.0%) | 0 (0.0%) |
| 35 to 64 Years | 26 (4.1%) | 35 (4.4%) |
| 65 to 74 Years | 65 (31.7%) | 7 (2.9%) |
| 75 Years and over | 25 (16.8%) | 29 (14.8%) |
Disability Class: Vision Difficulty
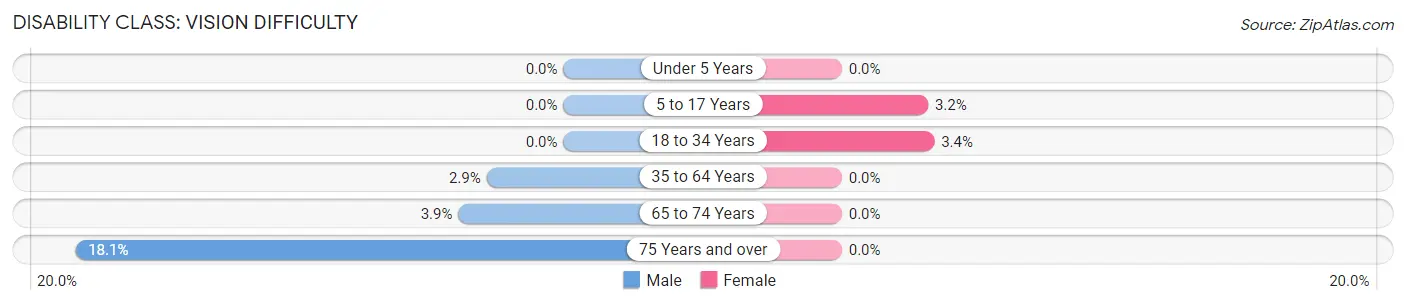
| Age Bracket | Male | Female |
| Under 5 Years | 0 (0.0%) | 0 (0.0%) |
| 5 to 17 Years | 0 (0.0%) | 13 (3.2%) |
| 18 to 34 Years | 0 (0.0%) | 13 (3.4%) |
| 35 to 64 Years | 18 (2.9%) | 0 (0.0%) |
| 65 to 74 Years | 8 (3.9%) | 0 (0.0%) |
| 75 Years and over | 27 (18.1%) | 0 (0.0%) |
Disability Class: Cognitive Difficulty
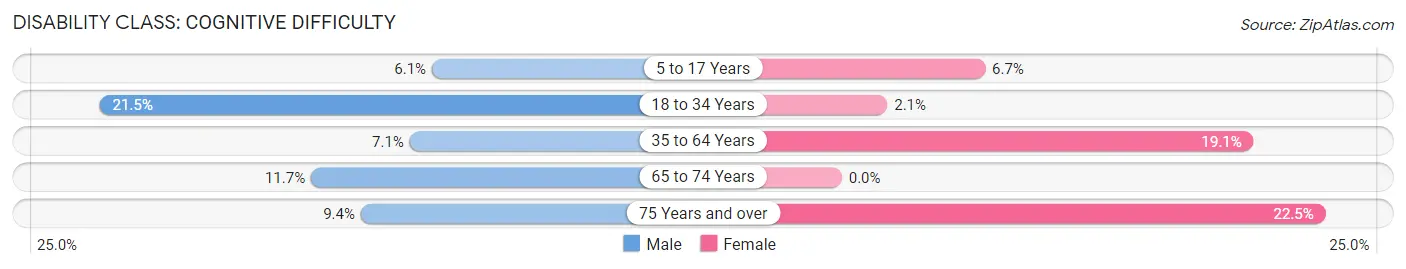
| Age Bracket | Male | Female |
| 5 to 17 Years | 33 (6.1%) | 27 (6.7%) |
| 18 to 34 Years | 105 (21.5%) | 8 (2.1%) |
| 35 to 64 Years | 45 (7.1%) | 151 (19.1%) |
| 65 to 74 Years | 24 (11.7%) | 0 (0.0%) |
| 75 Years and over | 14 (9.4%) | 44 (22.5%) |
Disability Class: Ambulatory Difficulty
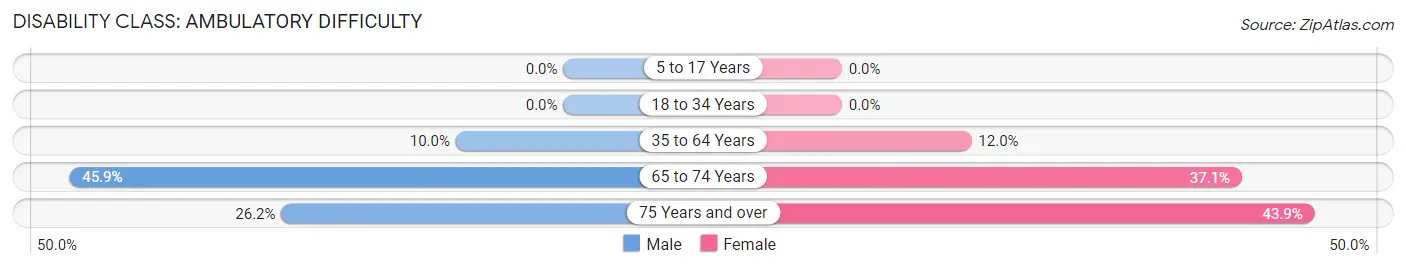
| Age Bracket | Male | Female |
| 5 to 17 Years | 0 (0.0%) | 0 (0.0%) |
| 18 to 34 Years | 0 (0.0%) | 0 (0.0%) |
| 35 to 64 Years | 63 (10.0%) | 95 (12.0%) |
| 65 to 74 Years | 94 (45.9%) | 88 (37.1%) |
| 75 Years and over | 39 (26.2%) | 86 (43.9%) |
Disability Class: Self-Care Difficulty
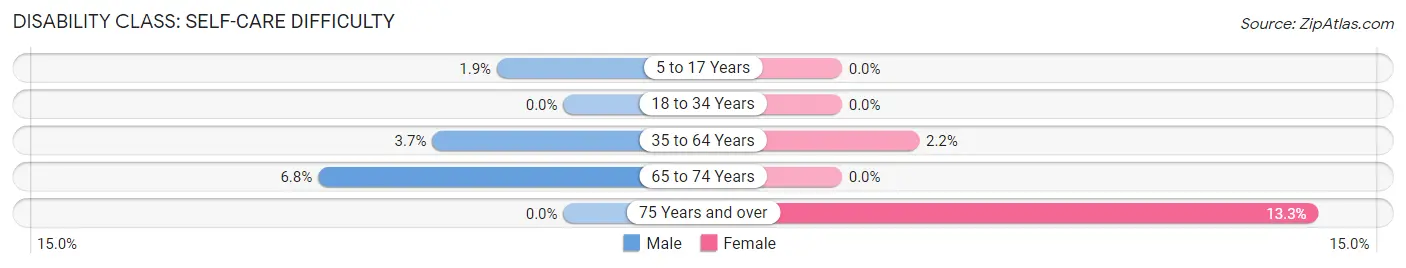
| Age Bracket | Male | Female |
| 5 to 17 Years | 10 (1.8%) | 0 (0.0%) |
| 18 to 34 Years | 0 (0.0%) | 0 (0.0%) |
| 35 to 64 Years | 23 (3.6%) | 17 (2.1%) |
| 65 to 74 Years | 14 (6.8%) | 0 (0.0%) |
| 75 Years and over | 0 (0.0%) | 26 (13.3%) |
Technology Access in Butler
Computing Device Access in Butler
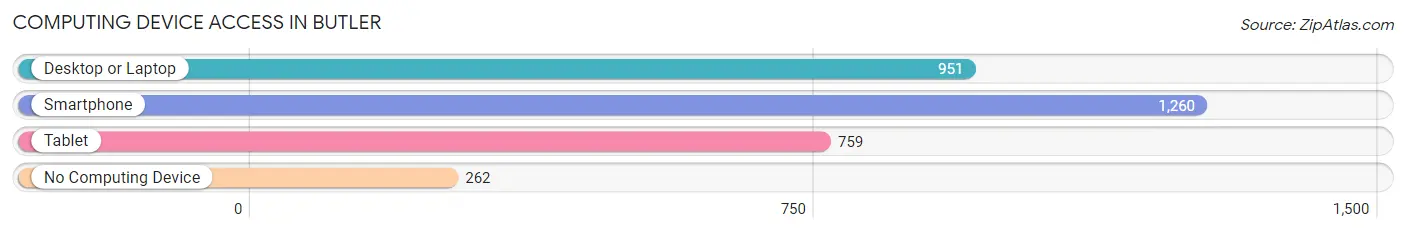
| Device Type | # Households | % Households |
| Desktop or Laptop | 951 | 57.7% |
| Smartphone | 1,260 | 76.4% |
| Tablet | 759 | 46.0% |
| No Computing Device | 262 | 15.9% |
| Total | 1,649 | 100.0% |
Internet Access in Butler
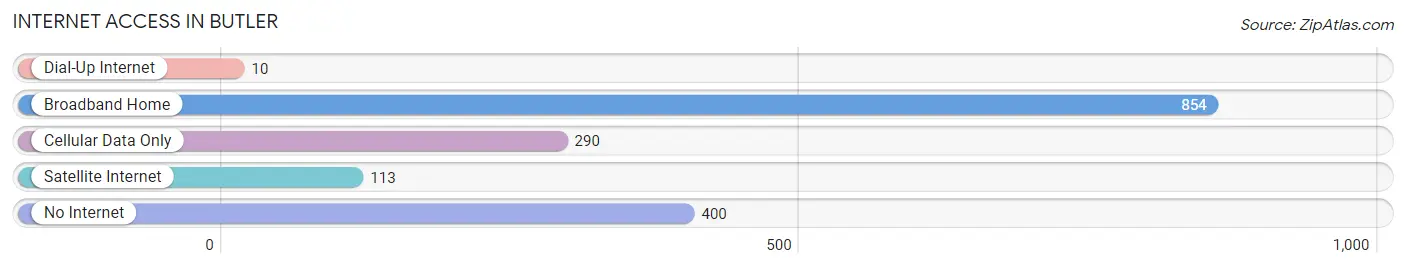
| Internet Type | # Households | % Households |
| Dial-Up Internet | 10 | 0.6% |
| Broadband Home | 854 | 51.8% |
| Cellular Data Only | 290 | 17.6% |
| Satellite Internet | 113 | 6.9% |
| No Internet | 400 | 24.3% |
| Total | 1,649 | 100.0% |
Butler Summary
Butler, Missouri is a small town located in Bates County, Missouri. It is situated in the southwestern part of the state, approximately 50 miles south of Kansas City. The town was founded in 1856 and has a population of approximately 2,500 people.
History
Butler was founded in 1856 by a group of settlers from Kentucky and Tennessee. The town was named after William O. Butler, a prominent politician from Kentucky. The town was originally a farming community, but it soon developed into a small manufacturing center. The first industry in Butler was a sawmill, which was built in 1858. The sawmill was followed by a gristmill, a woolen mill, and a flour mill.
In the late 19th century, Butler became a major railroad hub. The town was served by the Missouri Pacific Railroad, the St. Louis & San Francisco Railroad, and the Kansas City, Fort Scott & Memphis Railroad. The railroads brought new businesses and industries to the town, including a brickyard, a furniture factory, and a canning factory.
Geography
Butler is located in the southwestern part of Missouri, approximately 50 miles south of Kansas City. The town is situated in the rolling hills of the Ozark Plateau. The town is located on the banks of the Marais des Cygnes River, which flows through the town. The town is surrounded by farmland and woodlands.
Economy
Butler’s economy is largely based on agriculture and manufacturing. The town is home to several large farms, which produce corn, soybeans, wheat, and hay. The town is also home to several manufacturing companies, including a furniture factory, a canning factory, and a brickyard.
Demographics
As of the 2010 census, the population of Butler was 2,500. The town is predominantly white, with approximately 95% of the population being white. The median household income in Butler is $37,000, and the median home value is $90,000.
Conclusion
Butler, Missouri is a small town located in Bates County, Missouri. It was founded in 1856 and has a population of approximately 2,500 people. The town’s economy is largely based on agriculture and manufacturing. The town is predominantly white, with approximately 95% of the population being white. The median household income in Butler is $37,000, and the median home value is $90,000.
Common Questions
What is Per Capita Income in Butler?
Per Capita income in Butler is $20,640.
What is the Median Family Income in Butler?
Median Family Income in Butler is $42,386.
What is the Median Household income in Butler?
Median Household Income in Butler is $33,548.
What is Income or Wage Gap in Butler?
Income or Wage Gap in Butler is 19.2%.
Women in Butler earn 80.8 cents for every dollar earned by a man.
What is Inequality or Gini Index in Butler?
Inequality or Gini Index in Butler is 0.47.
What is the Total Population of Butler?
Total Population of Butler is 4,541.
What is the Total Male Population of Butler?
Total Male Population of Butler is 2,319.
What is the Total Female Population of Butler?
Total Female Population of Butler is 2,222.
What is the Ratio of Males per 100 Females in Butler?
There are 104.37 Males per 100 Females in Butler.
What is the Ratio of Females per 100 Males in Butler?
There are 95.82 Females per 100 Males in Butler.
What is the Median Population Age in Butler?
Median Population Age in Butler is 36.7 Years.
What is the Average Family Size in Butler
Average Family Size in Butler is 3.4 People.
What is the Average Household Size in Butler
Average Household Size in Butler is 2.6 People.
How Large is the Labor Force in Butler?
There are 1,607 People in the Labor Forcein in Butler.
What is the Percentage of People in the Labor Force in Butler?
46.5% of People are in the Labor Force in Butler.
What is the Unemployment Rate in Butler?
Unemployment Rate in Butler is 14.7%.