Lake Wilson, MN Map & Demographics
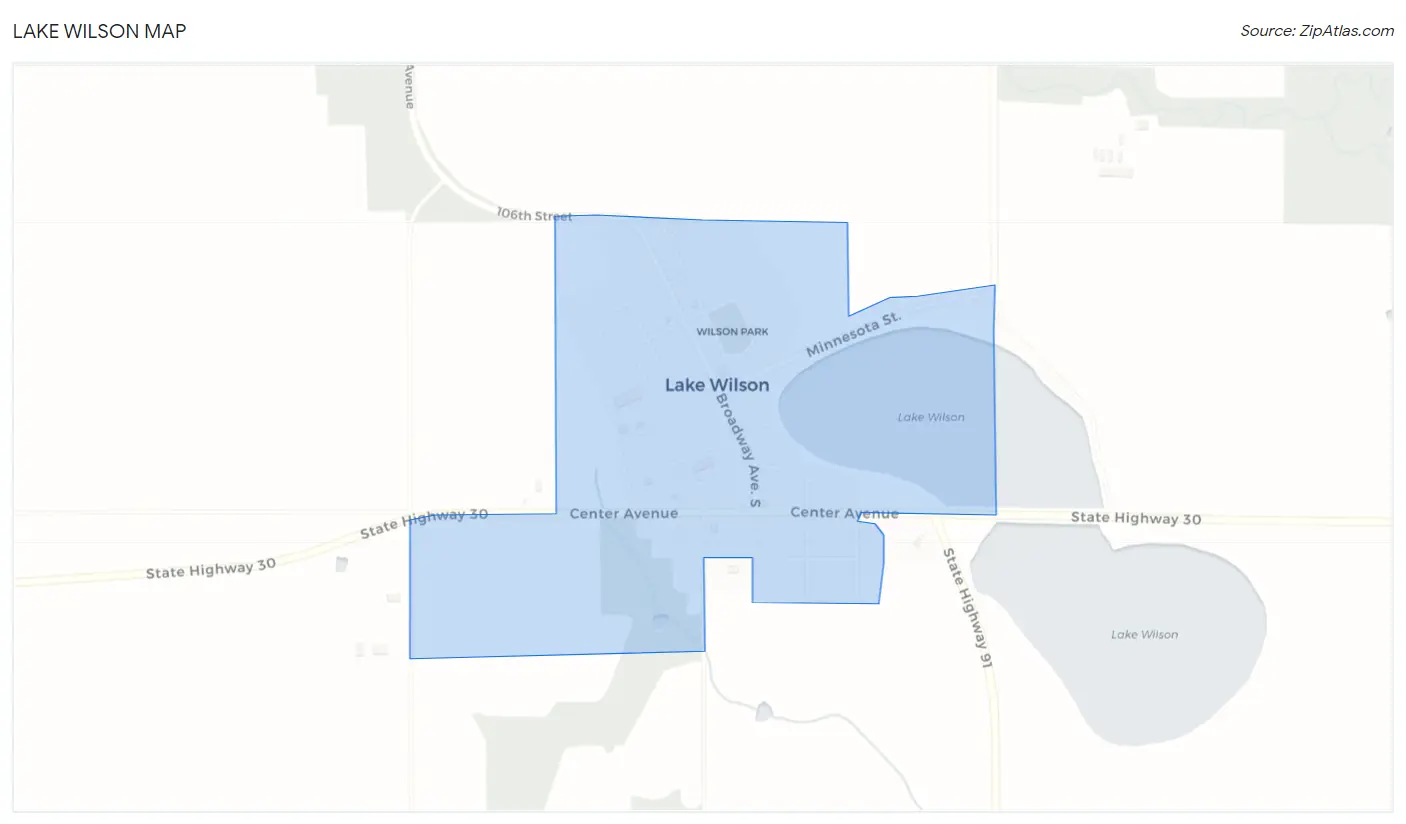
Lake Wilson Map
Lake Wilson Overview
$37,236
PER CAPITA INCOME
$82,500
AVG FAMILY INCOME
$64,375
AVG HOUSEHOLD INCOME
46.6%
WAGE / INCOME GAP [ % ]
53.4¢/ $1
WAGE / INCOME GAP [ $ ]
0.35
INEQUALITY / GINI INDEX
213
TOTAL POPULATION
110
MALE POPULATION
103
FEMALE POPULATION
106.80
MALES / 100 FEMALES
93.64
FEMALES / 100 MALES
54.8
MEDIAN AGE
2.3
AVG FAMILY SIZE
1.9
AVG HOUSEHOLD SIZE
106
LABOR FORCE [ PEOPLE ]
57.3%
PERCENT IN LABOR FORCE
Lake Wilson Zip Codes
Lake Wilson Area Codes
Income in Lake Wilson
Income Overview in Lake Wilson
Per Capita Income in Lake Wilson is $37,236, while median incomes of families and households are $82,500 and $64,375 respectively.
| Characteristic | Number | Measure |
| Per Capita Income | 213 | $37,236 |
| Median Family Income | 68 | $82,500 |
| Mean Family Income | 68 | $87,097 |
| Median Household Income | 113 | $64,375 |
| Mean Household Income | 113 | $70,581 |
| Income Deficit | 68 | $0 |
| Wage / Income Gap (%) | 213 | 46.63% |
| Wage / Income Gap ($) | 213 | 53.37¢ per $1 |
| Gini / Inequality Index | 213 | 0.35 |
Earnings by Sex in Lake Wilson
Average Earnings in Lake Wilson are $42,500, $50,938 for men and $27,188 for women, a difference of 46.6%.
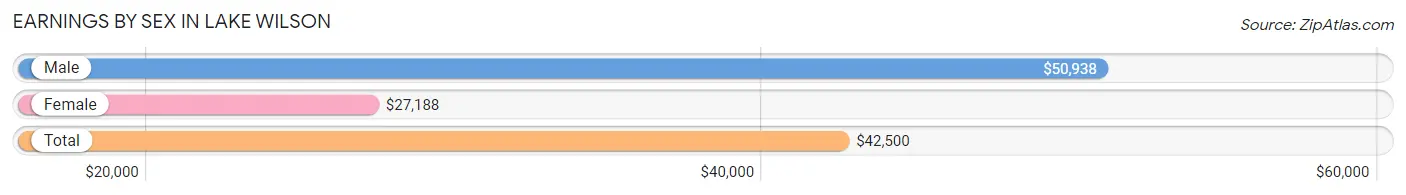
| Sex | Number | Average Earnings |
| Male | 69 (59.5%) | $50,938 |
| Female | 47 (40.5%) | $27,188 |
| Total | 116 (100.0%) | $42,500 |
Earnings by Sex by Income Bracket in Lake Wilson
The most common earnings brackets in Lake Wilson are $55,000 to $64,999 for men (11 | 15.9%) and $30,000 to $34,999 for women (6 | 12.8%).
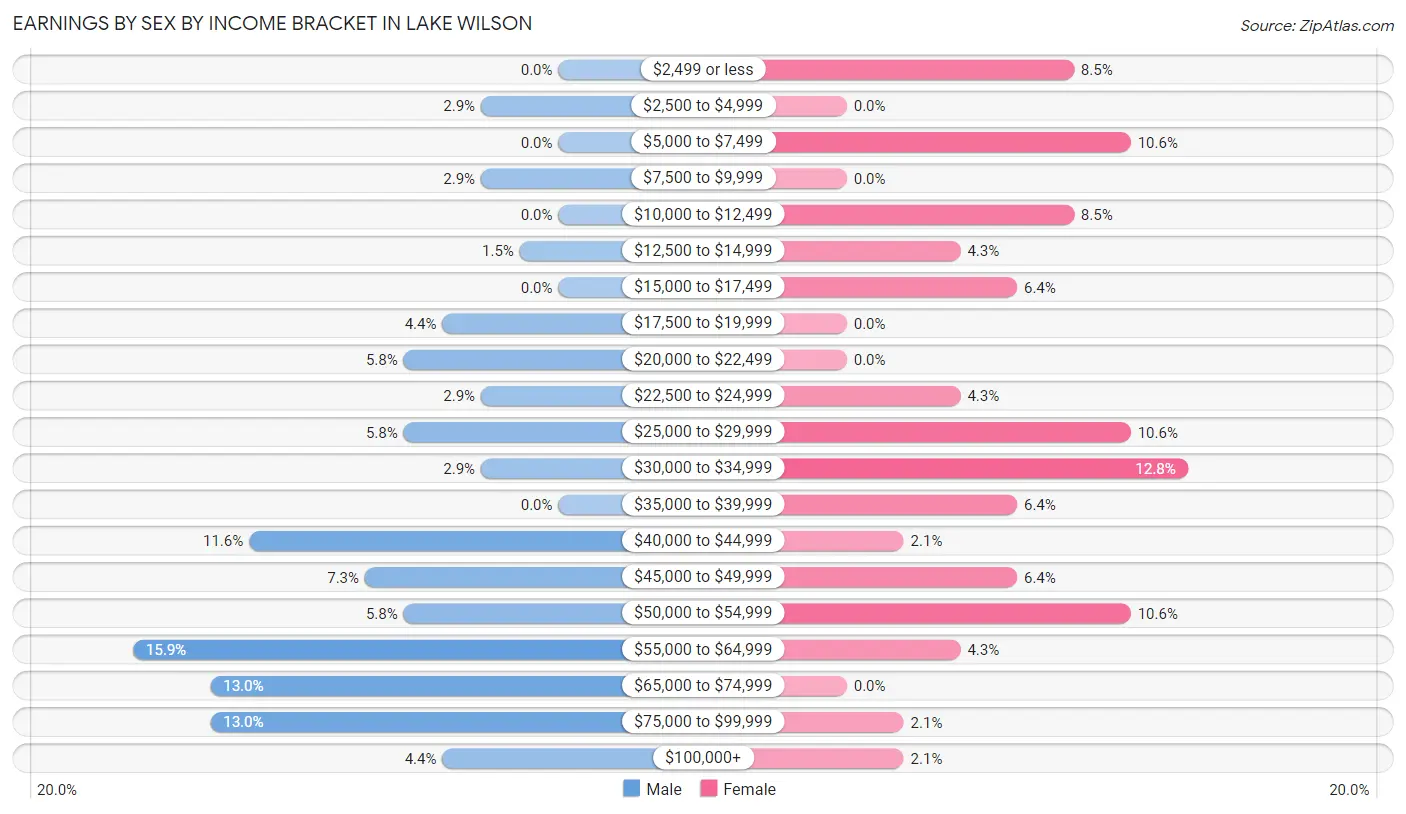
| Income | Male | Female |
| $2,499 or less | 0 (0.0%) | 4 (8.5%) |
| $2,500 to $4,999 | 2 (2.9%) | 0 (0.0%) |
| $5,000 to $7,499 | 0 (0.0%) | 5 (10.6%) |
| $7,500 to $9,999 | 2 (2.9%) | 0 (0.0%) |
| $10,000 to $12,499 | 0 (0.0%) | 4 (8.5%) |
| $12,500 to $14,999 | 1 (1.5%) | 2 (4.3%) |
| $15,000 to $17,499 | 0 (0.0%) | 3 (6.4%) |
| $17,500 to $19,999 | 3 (4.3%) | 0 (0.0%) |
| $20,000 to $22,499 | 4 (5.8%) | 0 (0.0%) |
| $22,500 to $24,999 | 2 (2.9%) | 2 (4.3%) |
| $25,000 to $29,999 | 4 (5.8%) | 5 (10.6%) |
| $30,000 to $34,999 | 2 (2.9%) | 6 (12.8%) |
| $35,000 to $39,999 | 0 (0.0%) | 3 (6.4%) |
| $40,000 to $44,999 | 8 (11.6%) | 1 (2.1%) |
| $45,000 to $49,999 | 5 (7.2%) | 3 (6.4%) |
| $50,000 to $54,999 | 4 (5.8%) | 5 (10.6%) |
| $55,000 to $64,999 | 11 (15.9%) | 2 (4.3%) |
| $65,000 to $74,999 | 9 (13.0%) | 0 (0.0%) |
| $75,000 to $99,999 | 9 (13.0%) | 1 (2.1%) |
| $100,000+ | 3 (4.3%) | 1 (2.1%) |
| Total | 69 (100.0%) | 47 (100.0%) |
Earnings by Sex by Educational Attainment in Lake Wilson
Average earnings in Lake Wilson are $51,563 for men and $30,313 for women, a difference of 41.2%. Men with an educational attainment of high school diploma enjoy the highest average annual earnings of $58,000, while those with college or associate's degree education earn the least with $49,375. Women with an educational attainment of graduate degree earn the most with the average annual earnings of $51,667, while those with high school diploma education have the smallest earnings of $13,750.
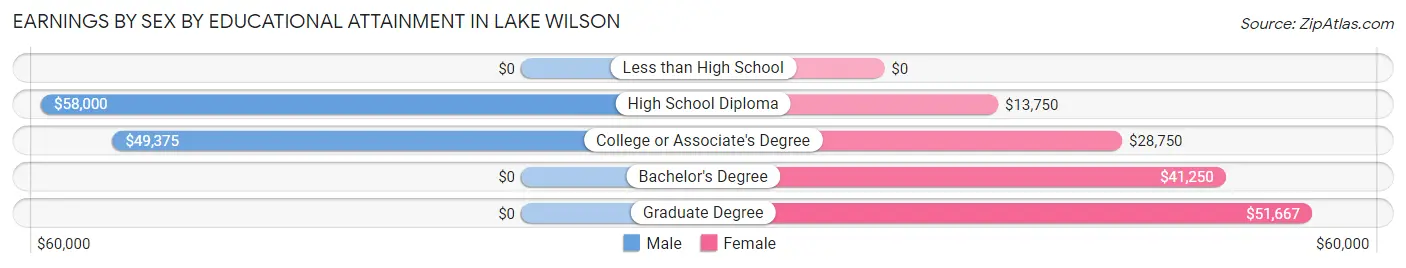
| Educational Attainment | Male Income | Female Income |
| Less than High School | - | - |
| High School Diploma | $58,000 | $13,750 |
| College or Associate's Degree | $49,375 | $28,750 |
| Bachelor's Degree | - | - |
| Graduate Degree | - | - |
| Total | $51,563 | $30,313 |
Family Income in Lake Wilson
Family Income Brackets in Lake Wilson
According to the Lake Wilson family income data, there are 22 families falling into the $50,000 to $74,999 income range, which is the most common income bracket and makes up 32.4% of all families.
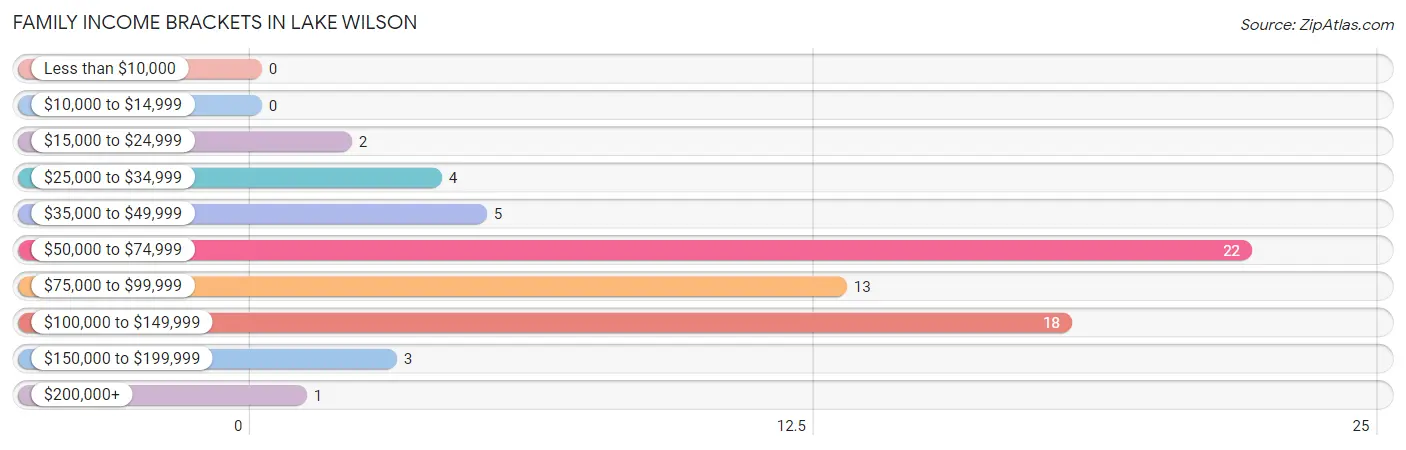
| Income Bracket | # Families | % Families |
| Less than $10,000 | 0 | 0.0% |
| $10,000 to $14,999 | 0 | 0.0% |
| $15,000 to $24,999 | 2 | 2.9% |
| $25,000 to $34,999 | 4 | 5.9% |
| $35,000 to $49,999 | 5 | 7.4% |
| $50,000 to $74,999 | 22 | 32.4% |
| $75,000 to $99,999 | 13 | 19.1% |
| $100,000 to $149,999 | 18 | 26.5% |
| $150,000 to $199,999 | 3 | 4.4% |
| $200,000+ | 1 | 1.5% |
Family Income by Famaliy Size in Lake Wilson
3-person families (7 | 10.3%) account for the highest median family income in Lake Wilson with $97,083 per family, while 2-person families (54 | 79.4%) have the highest median income of $35,625 per family member.
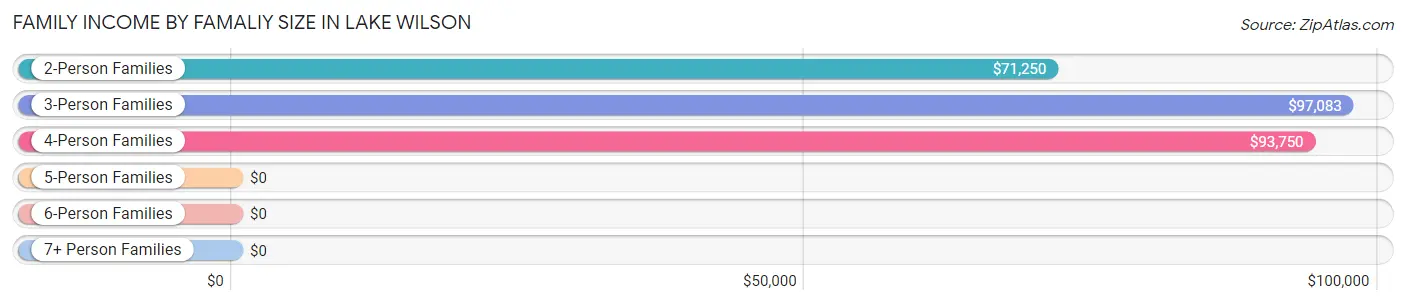
| Income Bracket | # Families | Median Income |
| 2-Person Families | 54 (79.4%) | $71,250 |
| 3-Person Families | 7 (10.3%) | $97,083 |
| 4-Person Families | 3 (4.4%) | $93,750 |
| 5-Person Families | 4 (5.9%) | $0 |
| 6-Person Families | 0 (0.0%) | $0 |
| 7+ Person Families | 0 (0.0%) | $0 |
| Total | 68 (100.0%) | $82,500 |
Family Income by Number of Earners in Lake Wilson
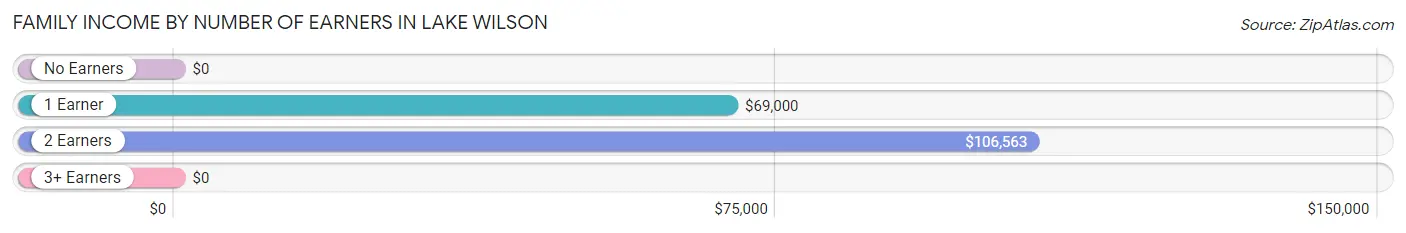
| Number of Earners | # Families | Median Income |
| No Earners | 11 (16.2%) | $0 |
| 1 Earner | 34 (50.0%) | $69,000 |
| 2 Earners | 21 (30.9%) | $106,563 |
| 3+ Earners | 2 (2.9%) | $0 |
| Total | 68 (100.0%) | $82,500 |
Household Income in Lake Wilson
Household Income Brackets in Lake Wilson
With 23 households falling in the category, the $100,000 to $149,999 income range is the most frequent in Lake Wilson, accounting for 20.3% of all households.
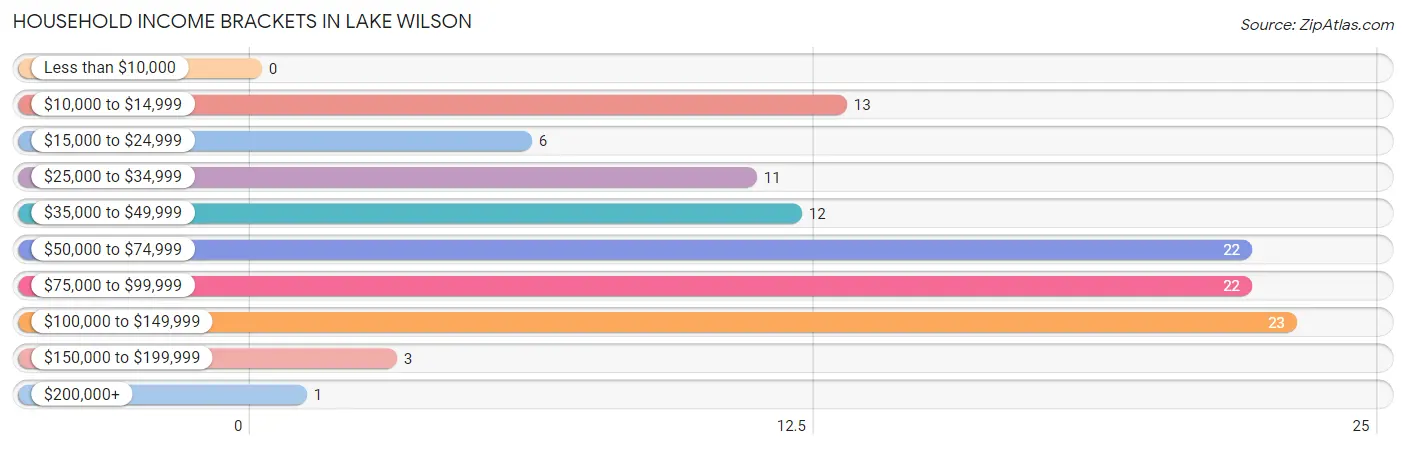
| Income Bracket | # Households | % Households |
| Less than $10,000 | 0 | 0.0% |
| $10,000 to $14,999 | 13 | 11.5% |
| $15,000 to $24,999 | 6 | 5.3% |
| $25,000 to $34,999 | 11 | 9.7% |
| $35,000 to $49,999 | 12 | 10.6% |
| $50,000 to $74,999 | 22 | 19.5% |
| $75,000 to $99,999 | 22 | 19.5% |
| $100,000 to $149,999 | 23 | 20.4% |
| $150,000 to $199,999 | 3 | 2.7% |
| $200,000+ | 1 | 0.9% |
Household Income by Householder Age in Lake Wilson
The median household income in Lake Wilson is $64,375, with the highest median household income of $73,750 found in the 25 to 44 years age bracket for the primary householder. A total of 34 households (30.1%) fall into this category.
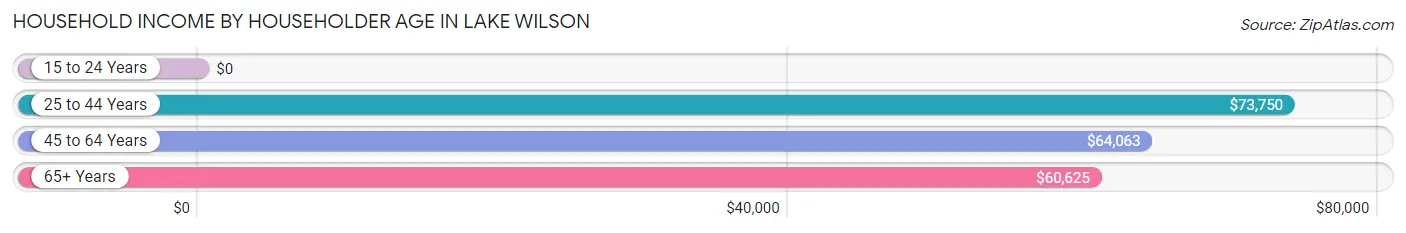
| Income Bracket | # Households | Median Income |
| 15 to 24 Years | 0 (0.0%) | $0 |
| 25 to 44 Years | 34 (30.1%) | $73,750 |
| 45 to 64 Years | 33 (29.2%) | $64,063 |
| 65+ Years | 46 (40.7%) | $60,625 |
| Total | 113 (100.0%) | $64,375 |
Poverty in Lake Wilson
Income Below Poverty by Sex and Age in Lake Wilson
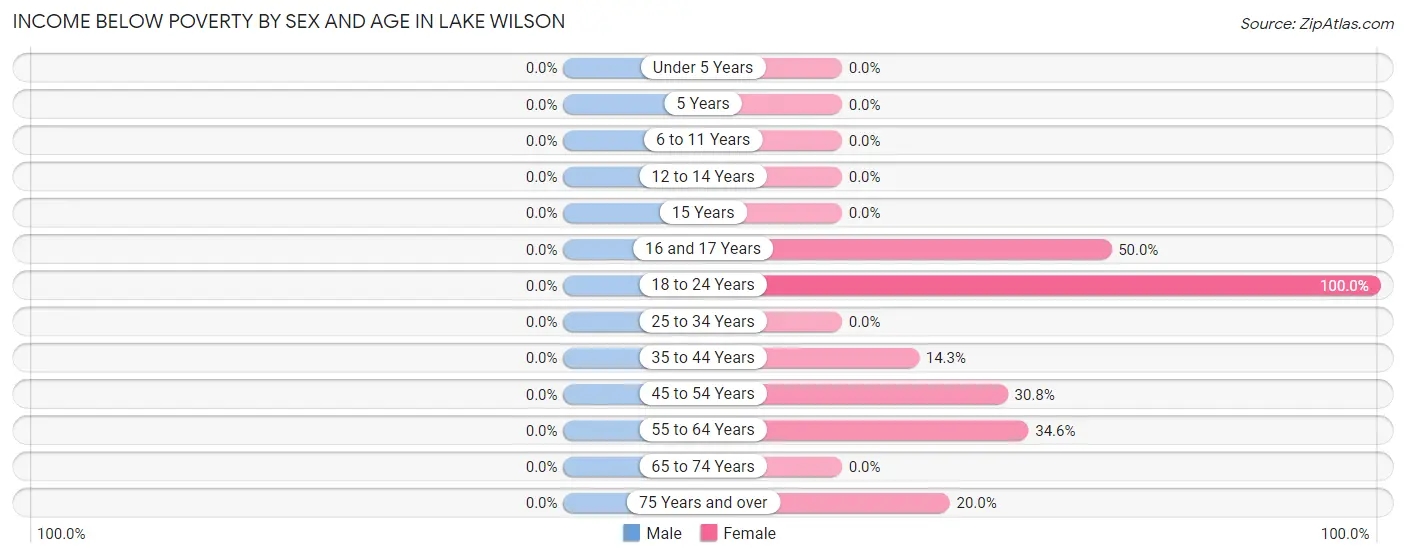
| Age Bracket | Male | Female |
| Under 5 Years | 0 (0.0%) | 0 (0.0%) |
| 5 Years | 0 (0.0%) | 0 (0.0%) |
| 6 to 11 Years | 0 (0.0%) | 0 (0.0%) |
| 12 to 14 Years | 0 (0.0%) | 0 (0.0%) |
| 15 Years | 0 (0.0%) | 0 (0.0%) |
| 16 and 17 Years | 0 (0.0%) | 1 (50.0%) |
| 18 to 24 Years | 0 (0.0%) | 2 (100.0%) |
| 25 to 34 Years | 0 (0.0%) | 0 (0.0%) |
| 35 to 44 Years | 0 (0.0%) | 2 (14.3%) |
| 45 to 54 Years | 0 (0.0%) | 4 (30.8%) |
| 55 to 64 Years | 0 (0.0%) | 9 (34.6%) |
| 65 to 74 Years | 0 (0.0%) | 0 (0.0%) |
| 75 Years and over | 0 (0.0%) | 2 (20.0%) |
| Total | 0 (0.0%) | 20 (19.4%) |
Income Above Poverty by Sex and Age in Lake Wilson
According to the poverty statistics in Lake Wilson, males aged under 5 years and females aged 6 to 11 years are the age groups that are most secure financially, with 100.0% of males and 100.0% of females in these age groups living above the poverty line.
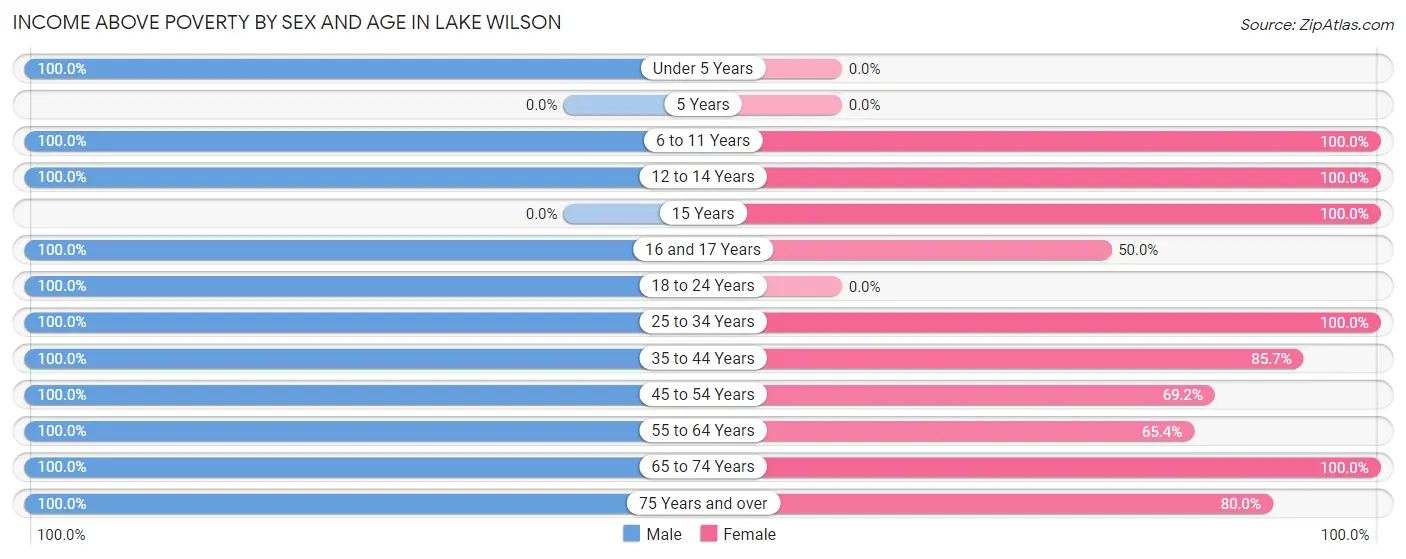
| Age Bracket | Male | Female |
| Under 5 Years | 9 (100.0%) | 0 (0.0%) |
| 5 Years | 0 (0.0%) | 0 (0.0%) |
| 6 to 11 Years | 5 (100.0%) | 6 (100.0%) |
| 12 to 14 Years | 2 (100.0%) | 1 (100.0%) |
| 15 Years | 0 (0.0%) | 5 (100.0%) |
| 16 and 17 Years | 1 (100.0%) | 1 (50.0%) |
| 18 to 24 Years | 6 (100.0%) | 0 (0.0%) |
| 25 to 34 Years | 13 (100.0%) | 8 (100.0%) |
| 35 to 44 Years | 13 (100.0%) | 12 (85.7%) |
| 45 to 54 Years | 8 (100.0%) | 9 (69.2%) |
| 55 to 64 Years | 13 (100.0%) | 17 (65.4%) |
| 65 to 74 Years | 23 (100.0%) | 16 (100.0%) |
| 75 Years and over | 17 (100.0%) | 8 (80.0%) |
| Total | 110 (100.0%) | 83 (80.6%) |
Income Below Poverty Among Married-Couple Families in Lake Wilson
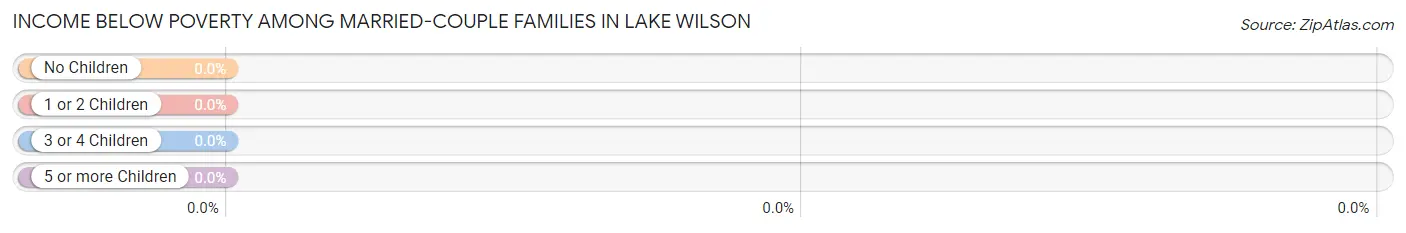
| Children | Above Poverty | Below Poverty |
| No Children | 44 (100.0%) | 0 (0.0%) |
| 1 or 2 Children | 9 (100.0%) | 0 (0.0%) |
| 3 or 4 Children | 4 (100.0%) | 0 (0.0%) |
| 5 or more Children | 0 (0.0%) | 0 (0.0%) |
| Total | 57 (100.0%) | 0 (0.0%) |
Income Below Poverty Among Single-Parent Households in Lake Wilson
| Children | Single Father | Single Mother |
| No Children | 0 (0.0%) | 0 (0.0%) |
| 1 or 2 Children | 0 (0.0%) | 0 (0.0%) |
| 3 or 4 Children | 0 (0.0%) | 0 (0.0%) |
| 5 or more Children | 0 (0.0%) | 0 (0.0%) |
| Total | 0 (0.0%) | 0 (0.0%) |
Income Below Poverty Among Married-Couple vs Single-Parent Households in Lake Wilson
| Children | Married-Couple Families | Single-Parent Households |
| No Children | 0 (0.0%) | 0 (0.0%) |
| 1 or 2 Children | 0 (0.0%) | 0 (0.0%) |
| 3 or 4 Children | 0 (0.0%) | 0 (0.0%) |
| 5 or more Children | 0 (0.0%) | 0 (0.0%) |
| Total | 0 (0.0%) | 0 (0.0%) |
Race in Lake Wilson
The most populous races in Lake Wilson are White / Caucasian (199 | 93.4%), Two or more Races (14 | 6.6%), and Hispanic or Latino (4 | 1.9%).
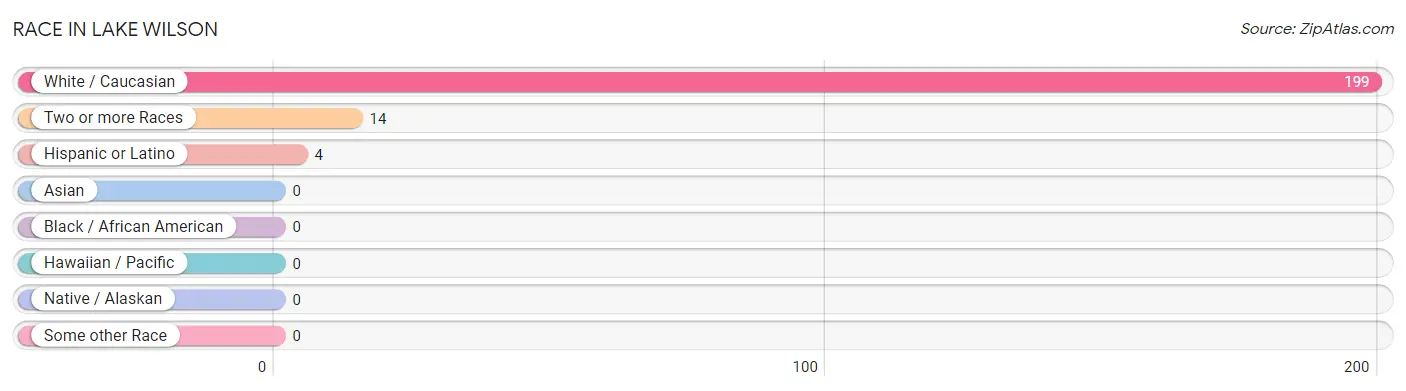
| Race | # Population | % Population |
| Asian | 0 | 0.0% |
| Black / African American | 0 | 0.0% |
| Hawaiian / Pacific | 0 | 0.0% |
| Hispanic or Latino | 4 | 1.9% |
| Native / Alaskan | 0 | 0.0% |
| White / Caucasian | 199 | 93.4% |
| Two or more Races | 14 | 6.6% |
| Some other Race | 0 | 0.0% |
| Total | 213 | 100.0% |
Ancestry in Lake Wilson
The most populous ancestries reported in Lake Wilson are German (83 | 39.0%), Dutch (60 | 28.2%), Norwegian (47 | 22.1%), Bhutanese (14 | 6.6%), and Irish (14 | 6.6%), together accounting for 102.4% of all Lake Wilson residents.
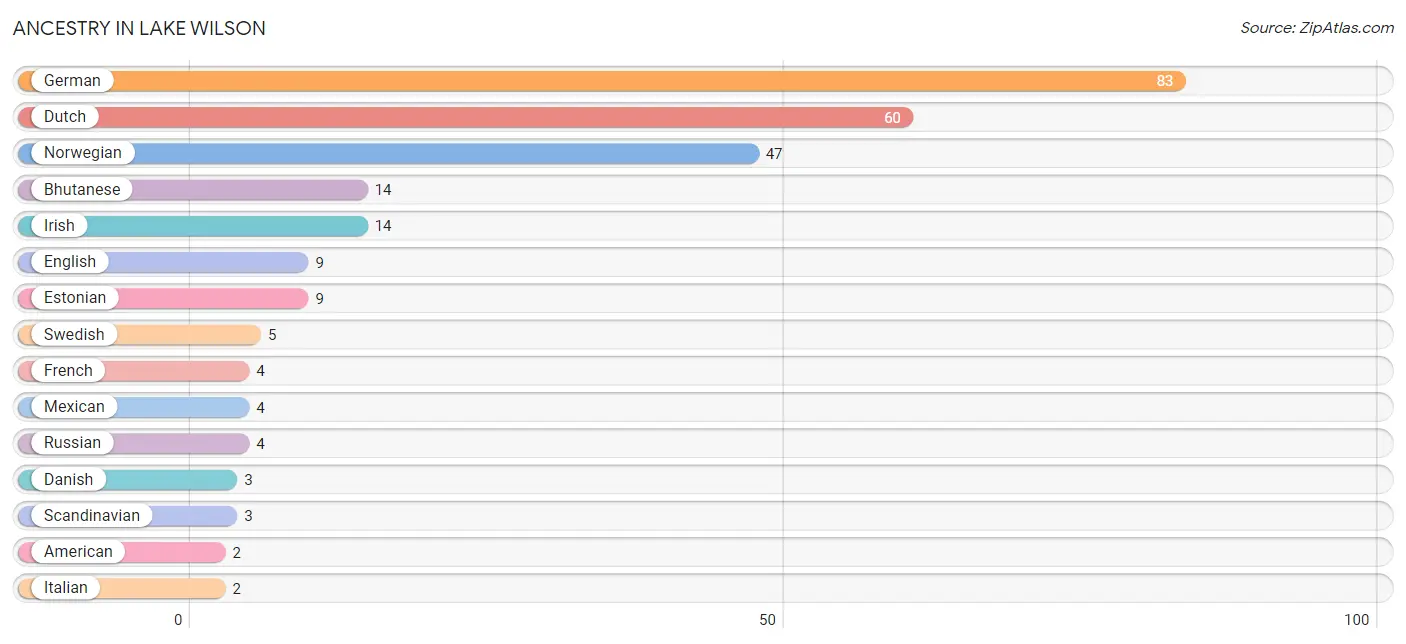
| Ancestry | # Population | % Population |
| American | 2 | 0.9% |
| Bhutanese | 14 | 6.6% |
| Danish | 3 | 1.4% |
| Dutch | 60 | 28.2% |
| English | 9 | 4.2% |
| Estonian | 9 | 4.2% |
| French | 4 | 1.9% |
| German | 83 | 39.0% |
| Irish | 14 | 6.6% |
| Italian | 2 | 0.9% |
| Luxembourger | 1 | 0.5% |
| Mexican | 4 | 1.9% |
| Norwegian | 47 | 22.1% |
| Russian | 4 | 1.9% |
| Scandinavian | 3 | 1.4% |
| Swedish | 5 | 2.4% | View All 16 Rows |
Immigrants in Lake Wilson
The most numerous immigrant groups reported in Lake Wilson came from Central America (4 | 1.9%), Latin America (4 | 1.9%), and Mexico (4 | 1.9%), together accounting for 5.6% of all Lake Wilson residents.
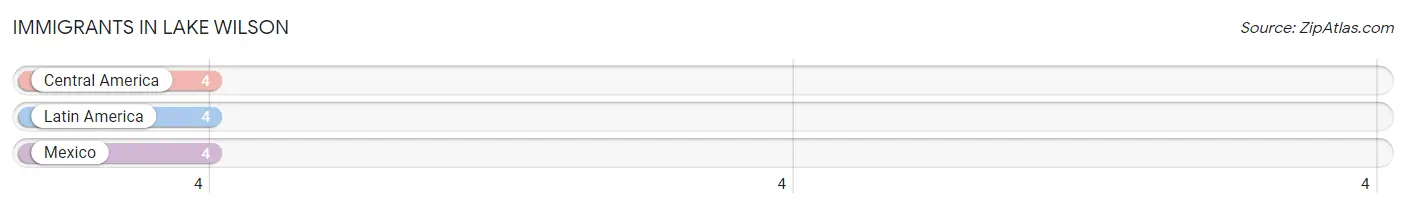
| Immigration Origin | # Population | % Population |
| Central America | 4 | 1.9% |
| Latin America | 4 | 1.9% |
| Mexico | 4 | 1.9% | View All 3 Rows |
Sex and Age in Lake Wilson
Sex and Age in Lake Wilson
The most populous age groups in Lake Wilson are 65 to 69 Years (14 | 12.7%) for men and 60 to 64 Years (16 | 15.5%) for women.
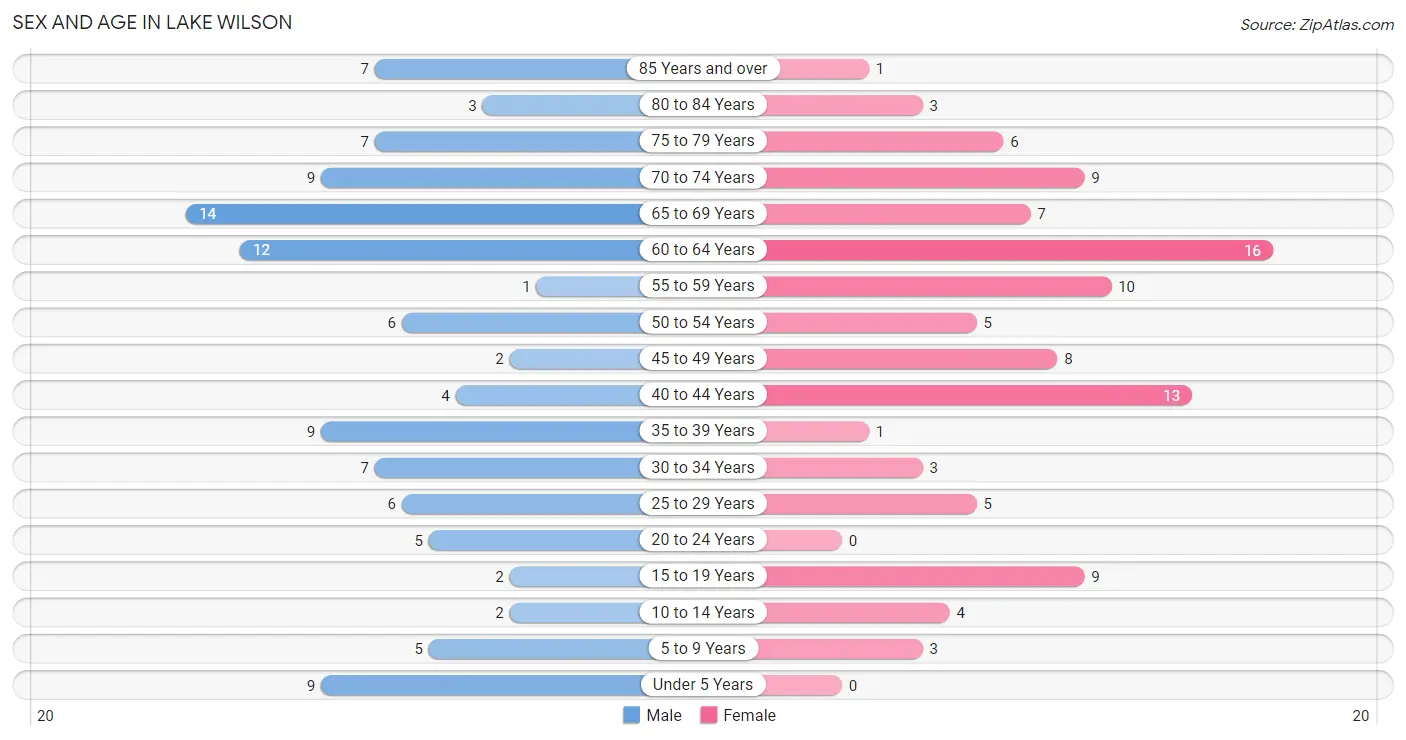
| Age Bracket | Male | Female |
| Under 5 Years | 9 (8.2%) | 0 (0.0%) |
| 5 to 9 Years | 5 (4.5%) | 3 (2.9%) |
| 10 to 14 Years | 2 (1.8%) | 4 (3.9%) |
| 15 to 19 Years | 2 (1.8%) | 9 (8.7%) |
| 20 to 24 Years | 5 (4.5%) | 0 (0.0%) |
| 25 to 29 Years | 6 (5.4%) | 5 (4.9%) |
| 30 to 34 Years | 7 (6.4%) | 3 (2.9%) |
| 35 to 39 Years | 9 (8.2%) | 1 (1.0%) |
| 40 to 44 Years | 4 (3.6%) | 13 (12.6%) |
| 45 to 49 Years | 2 (1.8%) | 8 (7.8%) |
| 50 to 54 Years | 6 (5.4%) | 5 (4.9%) |
| 55 to 59 Years | 1 (0.9%) | 10 (9.7%) |
| 60 to 64 Years | 12 (10.9%) | 16 (15.5%) |
| 65 to 69 Years | 14 (12.7%) | 7 (6.8%) |
| 70 to 74 Years | 9 (8.2%) | 9 (8.7%) |
| 75 to 79 Years | 7 (6.4%) | 6 (5.8%) |
| 80 to 84 Years | 3 (2.7%) | 3 (2.9%) |
| 85 Years and over | 7 (6.4%) | 1 (1.0%) |
| Total | 110 (100.0%) | 103 (100.0%) |
Families and Households in Lake Wilson
Median Family Size in Lake Wilson
The median family size in Lake Wilson is 2.29 persons per family, with married-couple families (57 | 83.8%) accounting for the largest median family size of 2.35 persons per family. On the other hand, single female/mother families (2 | 2.9%) represent the smallest median family size with 1.50 persons per family.
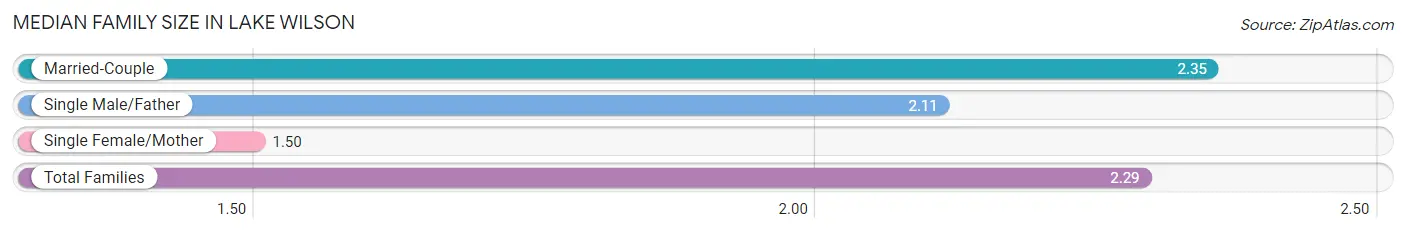
| Family Type | # Families | Family Size |
| Married-Couple | 57 (83.8%) | 2.35 |
| Single Male/Father | 9 (13.2%) | 2.11 |
| Single Female/Mother | 2 (2.9%) | 1.50 |
| Total Families | 68 (100.0%) | 2.29 |
Median Household Size in Lake Wilson
The median household size in Lake Wilson is 1.88 persons per household, with single male/father households (9 | 8.0%) accounting for the largest median household size of 2.89 persons per household. non-family households (45 | 39.8%) represent the smallest median household size with 1.11 persons per household.
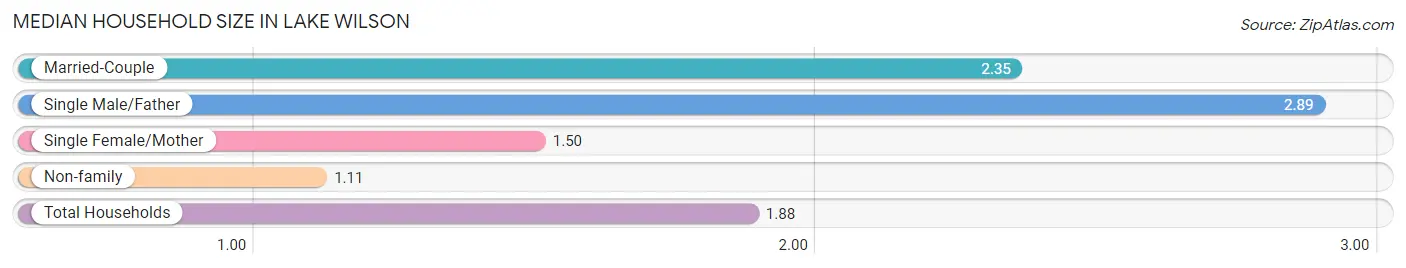
| Household Type | # Households | Household Size |
| Married-Couple | 57 (50.4%) | 2.35 |
| Single Male/Father | 9 (8.0%) | 2.89 |
| Single Female/Mother | 2 (1.8%) | 1.50 |
| Non-family | 45 (39.8%) | 1.11 |
| Total Households | 113 (100.0%) | 1.88 |
Household Size by Marriage Status in Lake Wilson
Out of a total of 113 households in Lake Wilson, 68 (60.2%) are family households, while 45 (39.8%) are nonfamily households. The most numerous type of family households are 2-person households, comprising 47, and the most common type of nonfamily households are 1-person households, comprising 41.
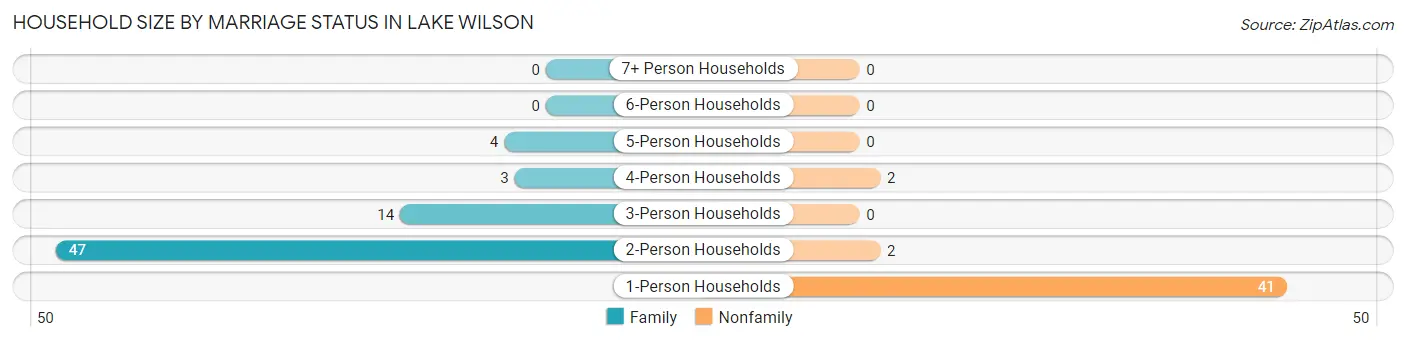
| Household Size | Family Households | Nonfamily Households |
| 1-Person Households | - | 41 (36.3%) |
| 2-Person Households | 47 (41.6%) | 2 (1.8%) |
| 3-Person Households | 14 (12.4%) | 0 (0.0%) |
| 4-Person Households | 3 (2.6%) | 2 (1.8%) |
| 5-Person Households | 4 (3.5%) | 0 (0.0%) |
| 6-Person Households | 0 (0.0%) | 0 (0.0%) |
| 7+ Person Households | 0 (0.0%) | 0 (0.0%) |
| Total | 68 (60.2%) | 45 (39.8%) |
Female Fertility in Lake Wilson
Fertility by Age in Lake Wilson
Average fertility rate in Lake Wilson is 26.0 births per 1,000 women. Women in the age bracket of 20 to 34 years have the highest fertility rate with 125.0 births per 1,000 women. Women in the age bracket of 20 to 34 years acount for 100.0% of all women with births.
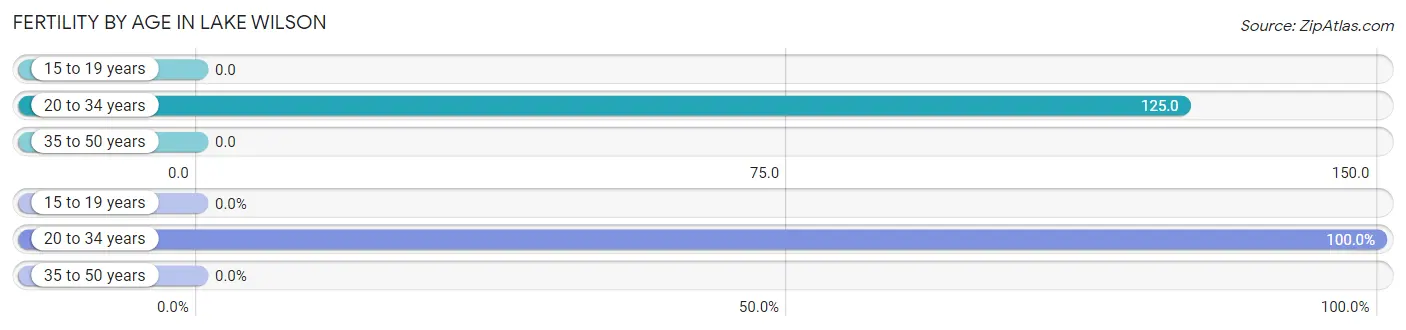
| Age Bracket | Women with Births | Births / 1,000 Women |
| 15 to 19 years | 0 (0.0%) | 0.0 |
| 20 to 34 years | 1 (100.0%) | 125.0 |
| 35 to 50 years | 0 (0.0%) | 0.0 |
| Total | 1 (100.0%) | 26.0 |
Fertility by Age by Marriage Status in Lake Wilson
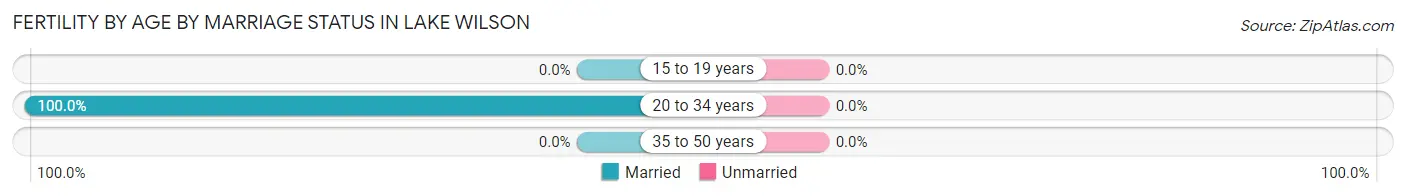
| Age Bracket | Married | Unmarried |
| 15 to 19 years | 0 (0.0%) | 0 (0.0%) |
| 20 to 34 years | 1 (100.0%) | 0 (0.0%) |
| 35 to 50 years | 0 (0.0%) | 0 (0.0%) |
| Total | 1 (100.0%) | 0 (0.0%) |
Fertility by Education in Lake Wilson
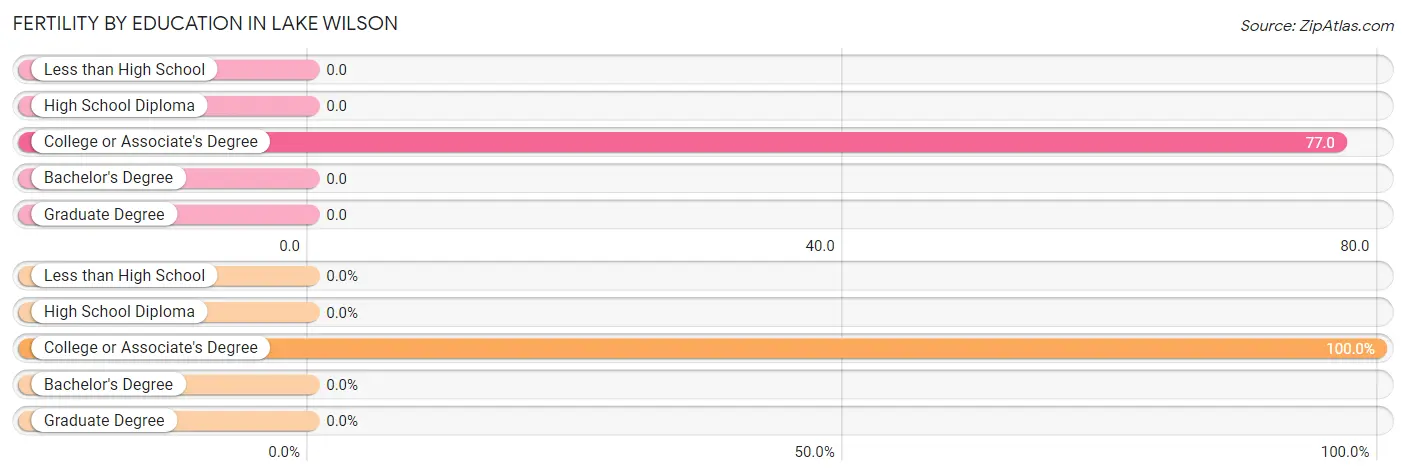
| Educational Attainment | Women with Births | Births / 1,000 Women |
| Less than High School | 0 (0.0%) | 0.0 |
| High School Diploma | 0 (0.0%) | 0.0 |
| College or Associate's Degree | 1 (100.0%) | 77.0 |
| Bachelor's Degree | 0 (0.0%) | 0.0 |
| Graduate Degree | 0 (0.0%) | 0.0 |
| Total | 1 (100.0%) | 26.0 |
Fertility by Education by Marriage Status in Lake Wilson
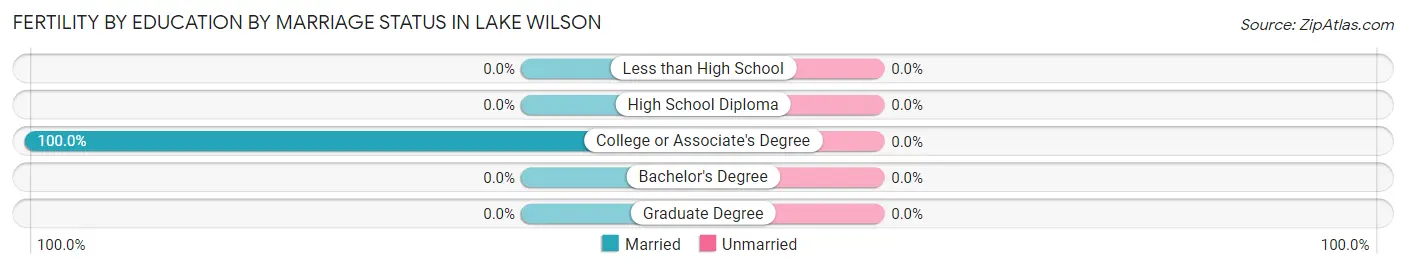
| Educational Attainment | Married | Unmarried |
| Less than High School | 0 (0.0%) | 0 (0.0%) |
| High School Diploma | 0 (0.0%) | 0 (0.0%) |
| College or Associate's Degree | 1 (100.0%) | 0 (0.0%) |
| Bachelor's Degree | 0 (0.0%) | 0 (0.0%) |
| Graduate Degree | 0 (0.0%) | 0 (0.0%) |
| Total | 1 (100.0%) | 0 (0.0%) |
Employment Characteristics in Lake Wilson
Employment by Class of Employer in Lake Wilson
Among the 106 employed individuals in Lake Wilson, private company employees (69 | 65.1%), local government employees (13 | 12.3%), and self-employed (not incorporated) (12 | 11.3%) make up the most common classes of employment.
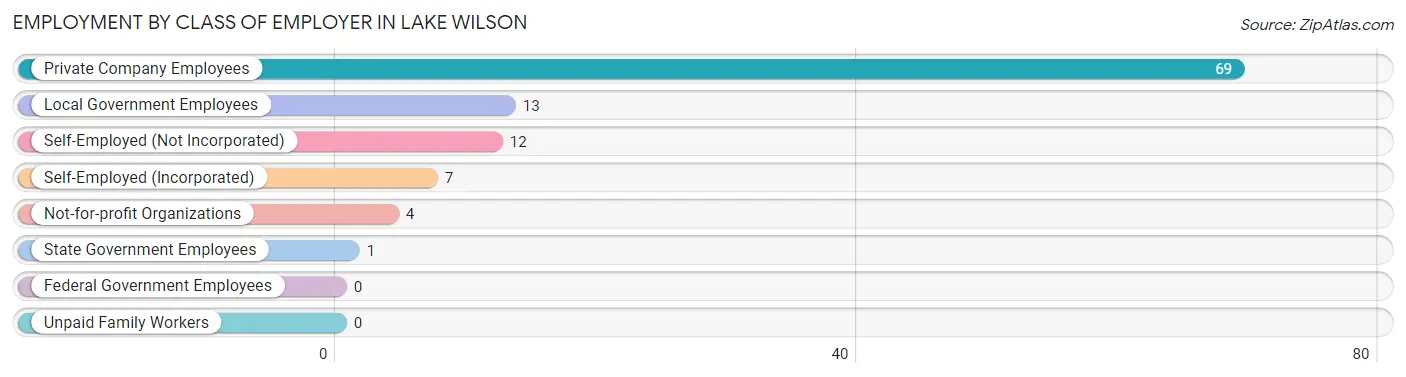
| Employer Class | # Employees | % Employees |
| Private Company Employees | 69 | 65.1% |
| Self-Employed (Incorporated) | 7 | 6.6% |
| Self-Employed (Not Incorporated) | 12 | 11.3% |
| Not-for-profit Organizations | 4 | 3.8% |
| Local Government Employees | 13 | 12.3% |
| State Government Employees | 1 | 0.9% |
| Federal Government Employees | 0 | 0.0% |
| Unpaid Family Workers | 0 | 0.0% |
| Total | 106 | 100.0% |
Employment Status by Age in Lake Wilson
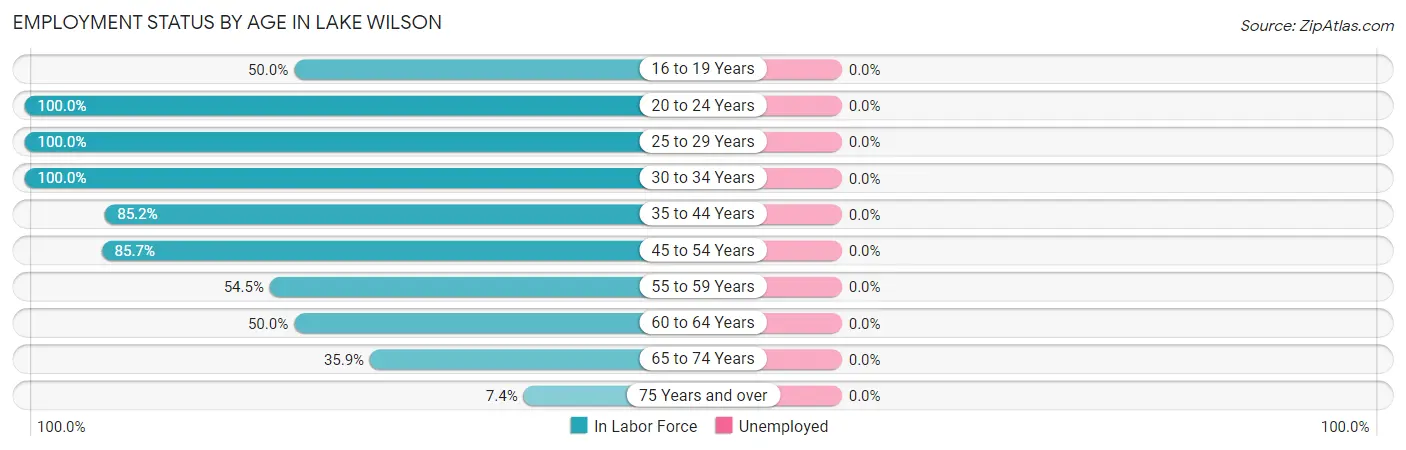
| Age Bracket | In Labor Force | Unemployed |
| 16 to 19 Years | 3 (50.0%) | 0 (0.0%) |
| 20 to 24 Years | 5 (100.0%) | 0 (0.0%) |
| 25 to 29 Years | 11 (100.0%) | 0 (0.0%) |
| 30 to 34 Years | 10 (100.0%) | 0 (0.0%) |
| 35 to 44 Years | 23 (85.2%) | 0 (0.0%) |
| 45 to 54 Years | 18 (85.7%) | 0 (0.0%) |
| 55 to 59 Years | 6 (54.5%) | 0 (0.0%) |
| 60 to 64 Years | 14 (50.0%) | 0 (0.0%) |
| 65 to 74 Years | 14 (35.9%) | 0 (0.0%) |
| 75 Years and over | 2 (7.4%) | 0 (0.0%) |
| Total | 106 (57.3%) | 0 (0.0%) |
Employment Status by Educational Attainment in Lake Wilson
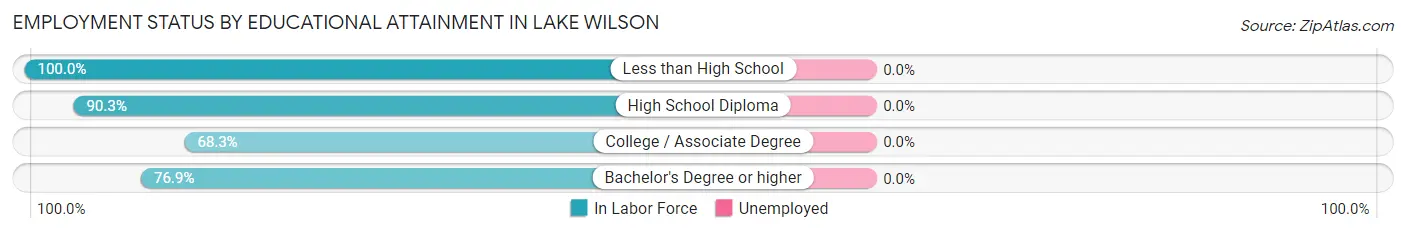
| Educational Attainment | In Labor Force | Unemployed |
| Less than High School | 1 (100.0%) | 0 (0.0%) |
| High School Diploma | 28 (90.3%) | 0 (0.0%) |
| College / Associate Degree | 43 (68.3%) | 0 (0.0%) |
| Bachelor's Degree or higher | 10 (76.9%) | 0 (0.0%) |
| Total | 82 (75.9%) | 0 (0.0%) |
Employment Occupations by Sex in Lake Wilson
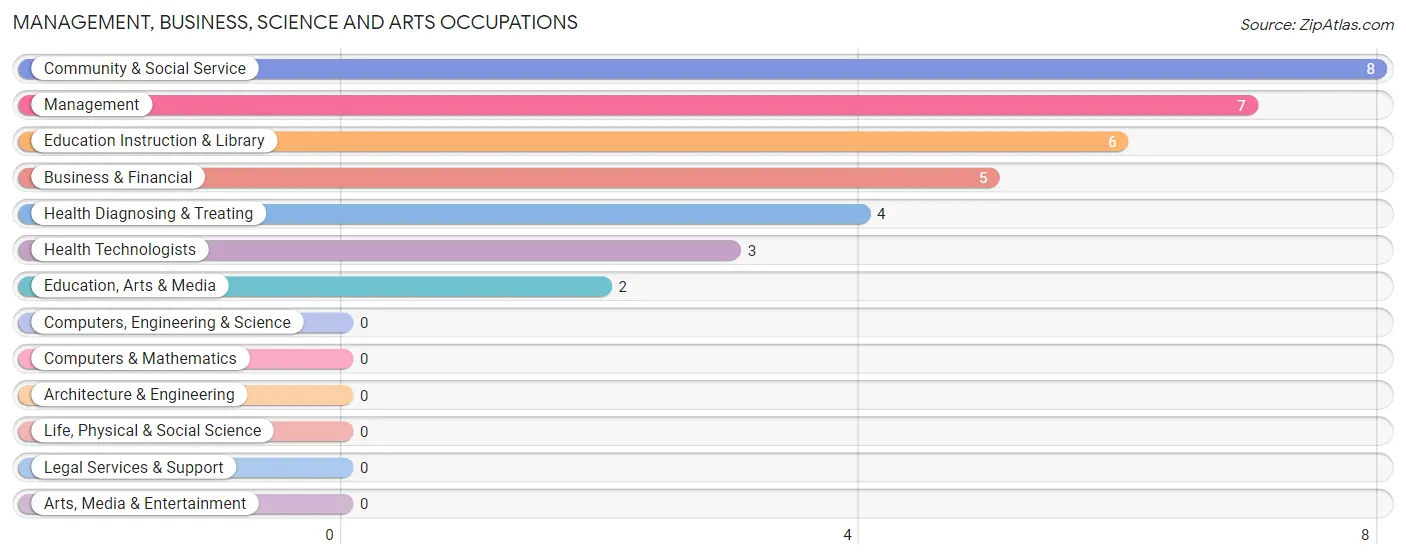
Management, Business, Science and Arts Occupations
The most common Management, Business, Science and Arts occupations in Lake Wilson are Community & Social Service (8 | 7.5%), Management (7 | 6.6%), Education Instruction & Library (6 | 5.7%), Business & Financial (5 | 4.7%), and Health Diagnosing & Treating (4 | 3.8%).
Management, Business, Science and Arts Occupations by Sex
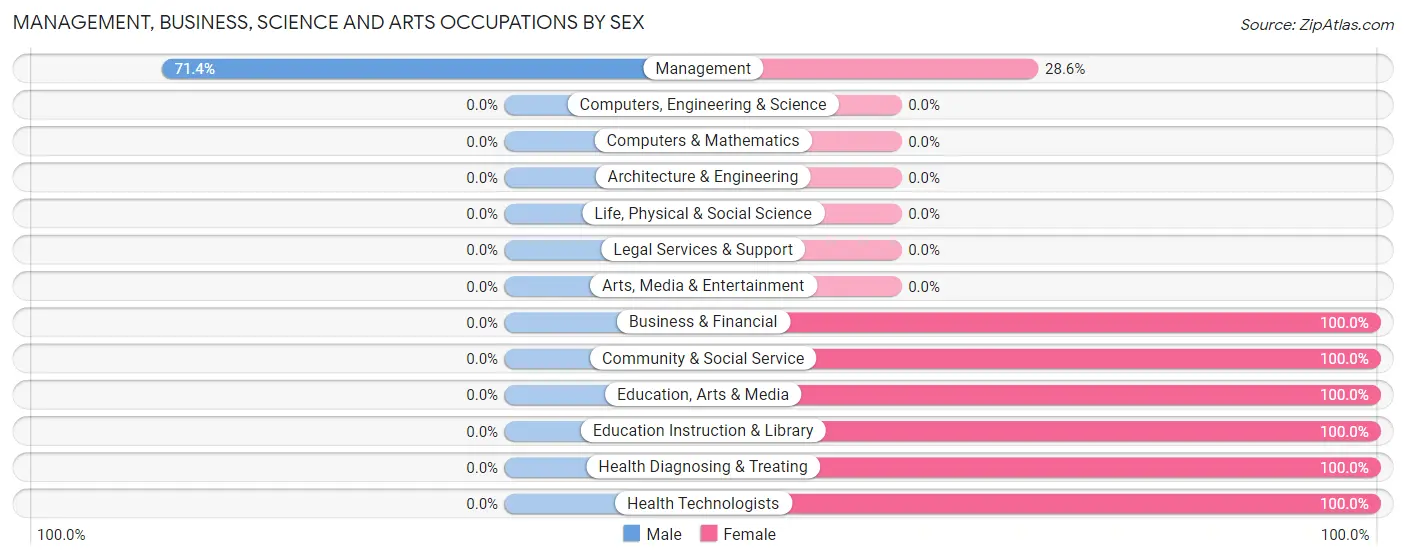
| Occupation | Male | Female |
| Management | 5 (71.4%) | 2 (28.6%) |
| Business & Financial | 0 (0.0%) | 5 (100.0%) |
| Computers, Engineering & Science | 0 (0.0%) | 0 (0.0%) |
| Computers & Mathematics | 0 (0.0%) | 0 (0.0%) |
| Architecture & Engineering | 0 (0.0%) | 0 (0.0%) |
| Life, Physical & Social Science | 0 (0.0%) | 0 (0.0%) |
| Community & Social Service | 0 (0.0%) | 8 (100.0%) |
| Education, Arts & Media | 0 (0.0%) | 2 (100.0%) |
| Legal Services & Support | 0 (0.0%) | 0 (0.0%) |
| Education Instruction & Library | 0 (0.0%) | 6 (100.0%) |
| Arts, Media & Entertainment | 0 (0.0%) | 0 (0.0%) |
| Health Diagnosing & Treating | 0 (0.0%) | 4 (100.0%) |
| Health Technologists | 0 (0.0%) | 3 (100.0%) |
| Total (Category) | 5 (20.8%) | 19 (79.2%) |
| Total (Overall) | 64 (60.4%) | 42 (39.6%) |
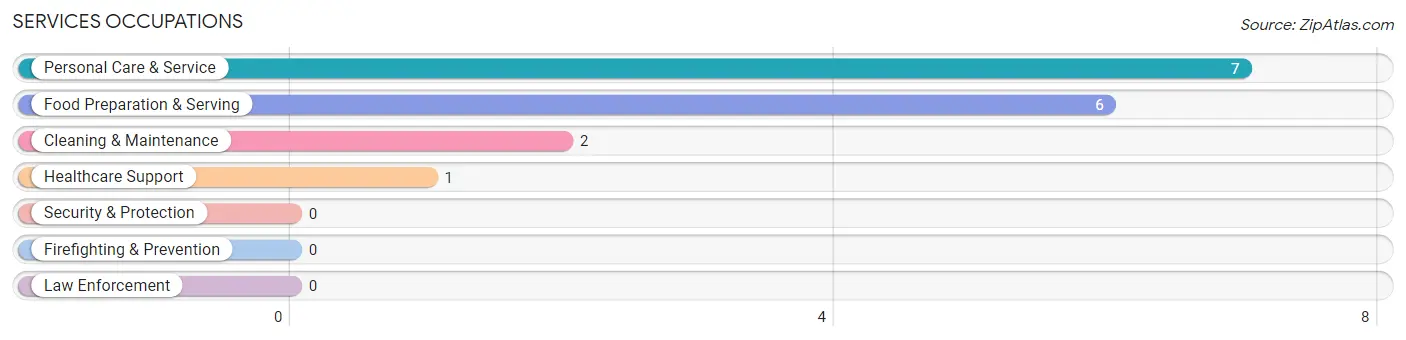
Services Occupations
The most common Services occupations in Lake Wilson are Personal Care & Service (7 | 6.6%), Food Preparation & Serving (6 | 5.7%), Cleaning & Maintenance (2 | 1.9%), and Healthcare Support (1 | 0.9%).
Services Occupations by Sex
Within the Services occupations in Lake Wilson, the most male-oriented occupations are Cleaning & Maintenance (50.0%), and Personal Care & Service (14.3%), while the most female-oriented occupations are Healthcare Support (100.0%), Food Preparation & Serving (100.0%), and Personal Care & Service (85.7%).
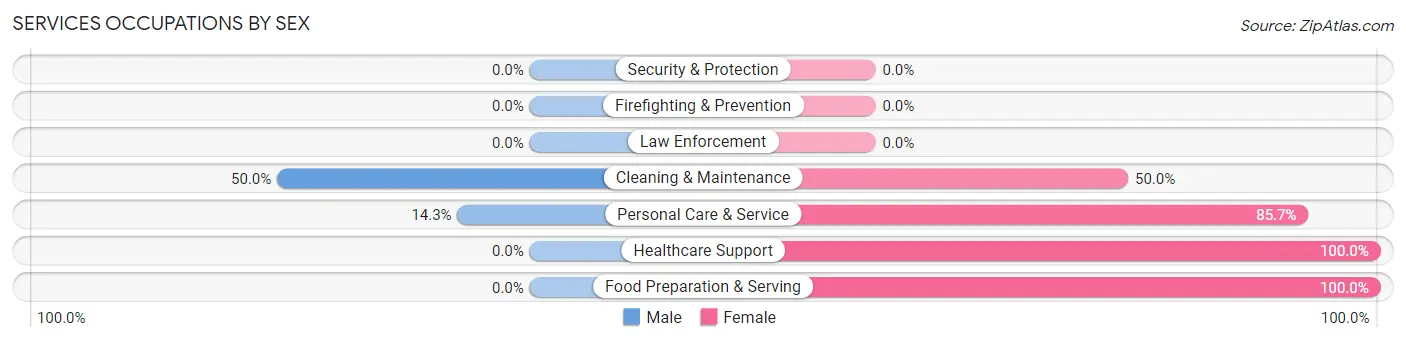
| Occupation | Male | Female |
| Healthcare Support | 0 (0.0%) | 1 (100.0%) |
| Security & Protection | 0 (0.0%) | 0 (0.0%) |
| Firefighting & Prevention | 0 (0.0%) | 0 (0.0%) |
| Law Enforcement | 0 (0.0%) | 0 (0.0%) |
| Food Preparation & Serving | 0 (0.0%) | 6 (100.0%) |
| Cleaning & Maintenance | 1 (50.0%) | 1 (50.0%) |
| Personal Care & Service | 1 (14.3%) | 6 (85.7%) |
| Total (Category) | 2 (12.5%) | 14 (87.5%) |
| Total (Overall) | 64 (60.4%) | 42 (39.6%) |
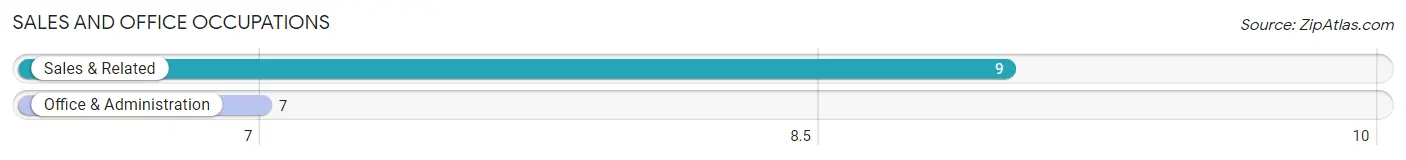
Sales and Office Occupations
The most common Sales and Office occupations in Lake Wilson are Sales & Related (9 | 8.5%), and Office & Administration (7 | 6.6%).
Sales and Office Occupations by Sex
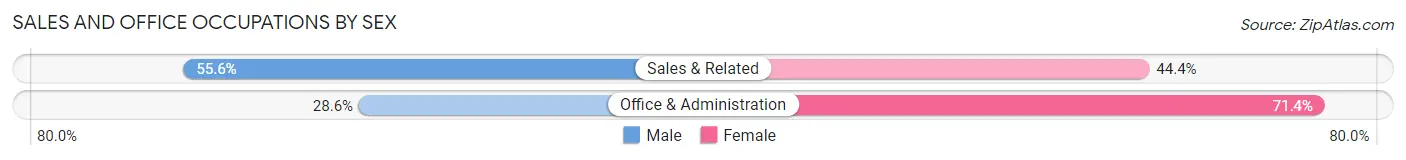
| Occupation | Male | Female |
| Sales & Related | 5 (55.6%) | 4 (44.4%) |
| Office & Administration | 2 (28.6%) | 5 (71.4%) |
| Total (Category) | 7 (43.8%) | 9 (56.2%) |
| Total (Overall) | 64 (60.4%) | 42 (39.6%) |
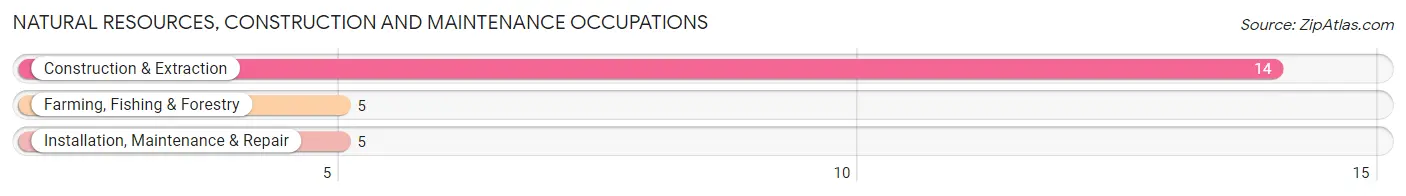
Natural Resources, Construction and Maintenance Occupations
The most common Natural Resources, Construction and Maintenance occupations in Lake Wilson are Construction & Extraction (14 | 13.2%), Farming, Fishing & Forestry (5 | 4.7%), and Installation, Maintenance & Repair (5 | 4.7%).
Natural Resources, Construction and Maintenance Occupations by Sex
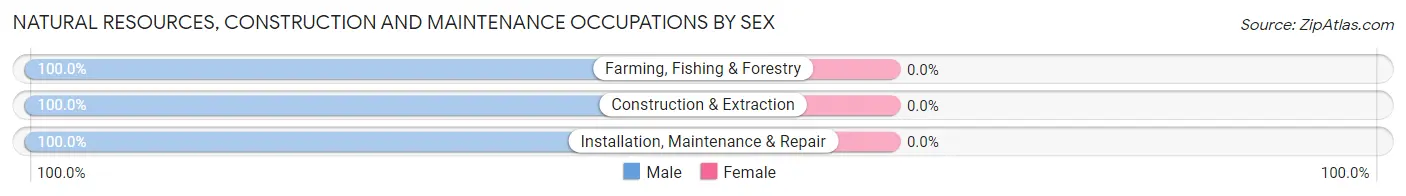
| Occupation | Male | Female |
| Farming, Fishing & Forestry | 5 (100.0%) | 0 (0.0%) |
| Construction & Extraction | 14 (100.0%) | 0 (0.0%) |
| Installation, Maintenance & Repair | 5 (100.0%) | 0 (0.0%) |
| Total (Category) | 24 (100.0%) | 0 (0.0%) |
| Total (Overall) | 64 (60.4%) | 42 (39.6%) |
Production, Transportation and Moving Occupations
The most common Production, Transportation and Moving occupations in Lake Wilson are Transportation (15 | 14.1%), Material Moving (8 | 7.5%), and Production (3 | 2.8%).
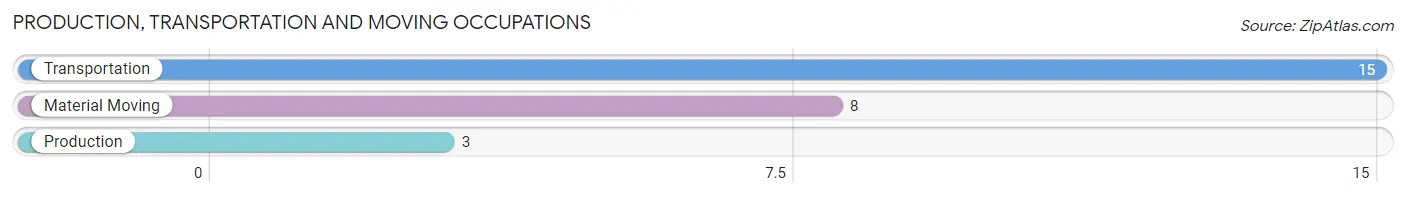
Production, Transportation and Moving Occupations by Sex
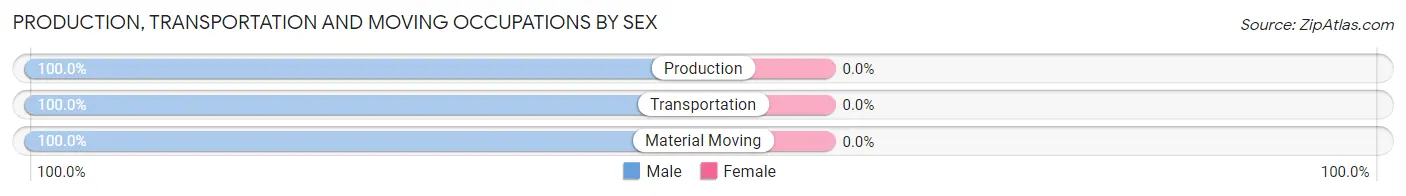
| Occupation | Male | Female |
| Production | 3 (100.0%) | 0 (0.0%) |
| Transportation | 15 (100.0%) | 0 (0.0%) |
| Material Moving | 8 (100.0%) | 0 (0.0%) |
| Total (Category) | 26 (100.0%) | 0 (0.0%) |
| Total (Overall) | 64 (60.4%) | 42 (39.6%) |
Employment Industries by Sex in Lake Wilson
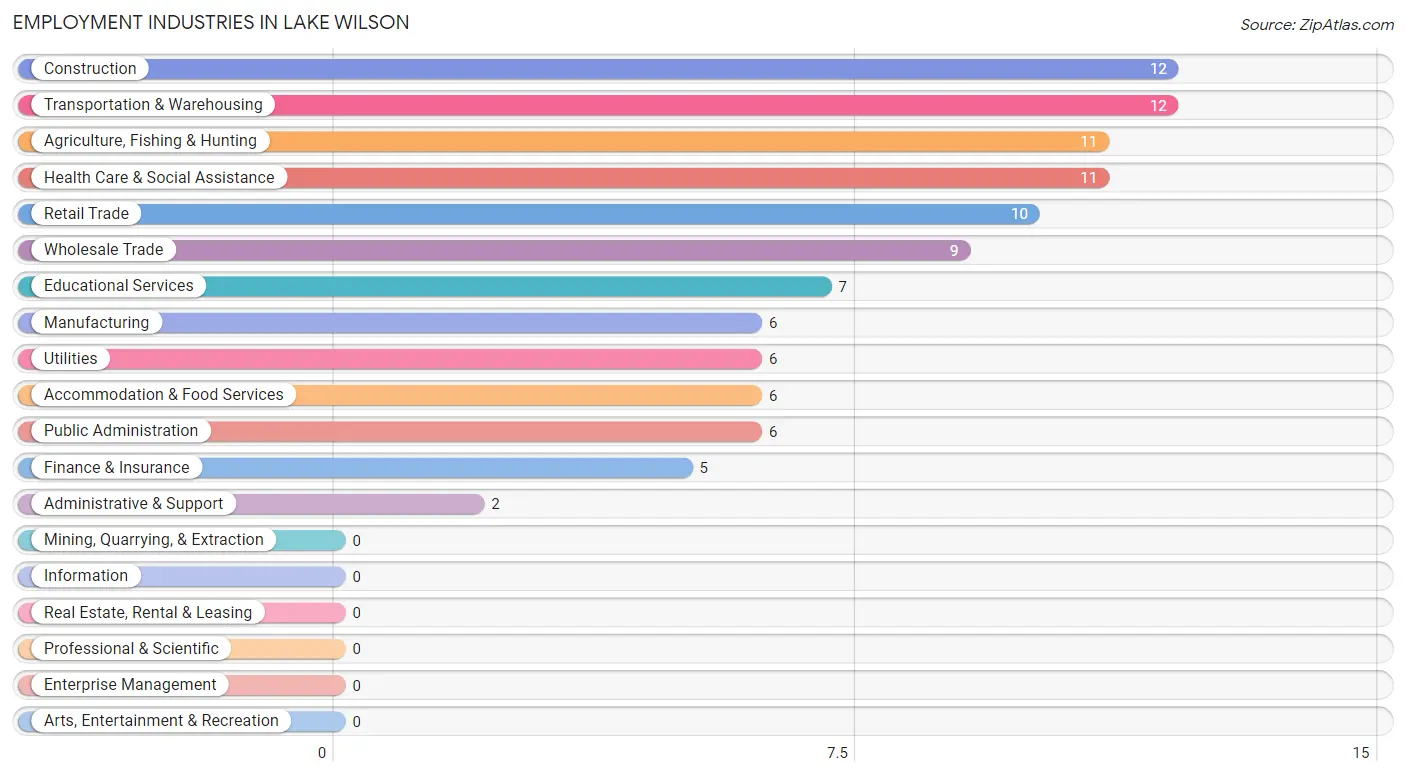
Employment Industries in Lake Wilson
The major employment industries in Lake Wilson include Construction (12 | 11.3%), Transportation & Warehousing (12 | 11.3%), Agriculture, Fishing & Hunting (11 | 10.4%), Health Care & Social Assistance (11 | 10.4%), and Retail Trade (10 | 9.4%).
Employment Industries by Sex in Lake Wilson
The Lake Wilson industries that see more men than women are Agriculture, Fishing & Hunting (100.0%), Manufacturing (100.0%), and Transportation & Warehousing (100.0%), whereas the industries that tend to have a higher number of women are Educational Services (100.0%), Health Care & Social Assistance (100.0%), and Accommodation & Food Services (100.0%).
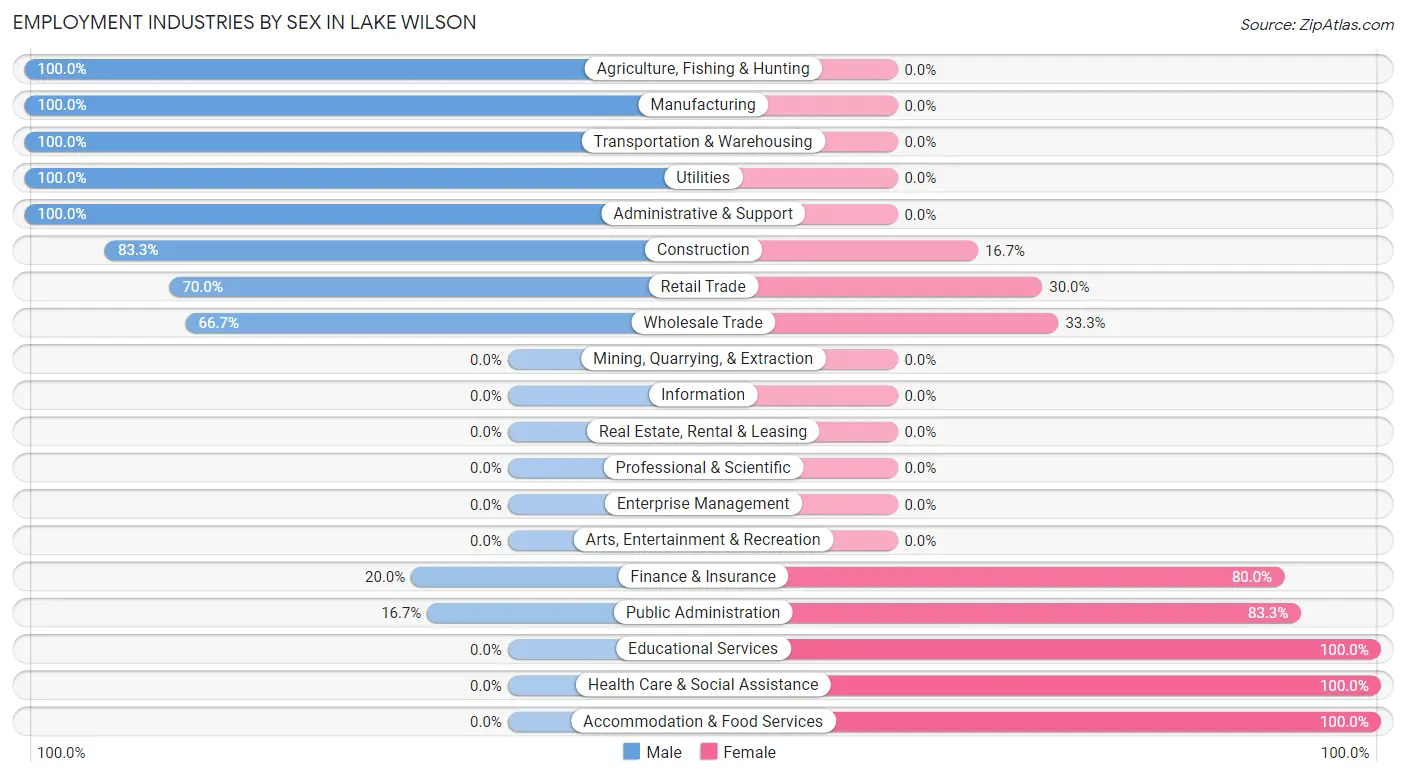
| Industry | Male | Female |
| Agriculture, Fishing & Hunting | 11 (100.0%) | 0 (0.0%) |
| Mining, Quarrying, & Extraction | 0 (0.0%) | 0 (0.0%) |
| Construction | 10 (83.3%) | 2 (16.7%) |
| Manufacturing | 6 (100.0%) | 0 (0.0%) |
| Wholesale Trade | 6 (66.7%) | 3 (33.3%) |
| Retail Trade | 7 (70.0%) | 3 (30.0%) |
| Transportation & Warehousing | 12 (100.0%) | 0 (0.0%) |
| Utilities | 6 (100.0%) | 0 (0.0%) |
| Information | 0 (0.0%) | 0 (0.0%) |
| Finance & Insurance | 1 (20.0%) | 4 (80.0%) |
| Real Estate, Rental & Leasing | 0 (0.0%) | 0 (0.0%) |
| Professional & Scientific | 0 (0.0%) | 0 (0.0%) |
| Enterprise Management | 0 (0.0%) | 0 (0.0%) |
| Administrative & Support | 2 (100.0%) | 0 (0.0%) |
| Educational Services | 0 (0.0%) | 7 (100.0%) |
| Health Care & Social Assistance | 0 (0.0%) | 11 (100.0%) |
| Arts, Entertainment & Recreation | 0 (0.0%) | 0 (0.0%) |
| Accommodation & Food Services | 0 (0.0%) | 6 (100.0%) |
| Public Administration | 1 (16.7%) | 5 (83.3%) |
| Total | 64 (60.4%) | 42 (39.6%) |
Education in Lake Wilson
School Enrollment in Lake Wilson
The most common levels of schooling among the 30 students in Lake Wilson are high school (11 | 36.7%), elementary school (7 | 23.3%), and middle school (6 | 20.0%).
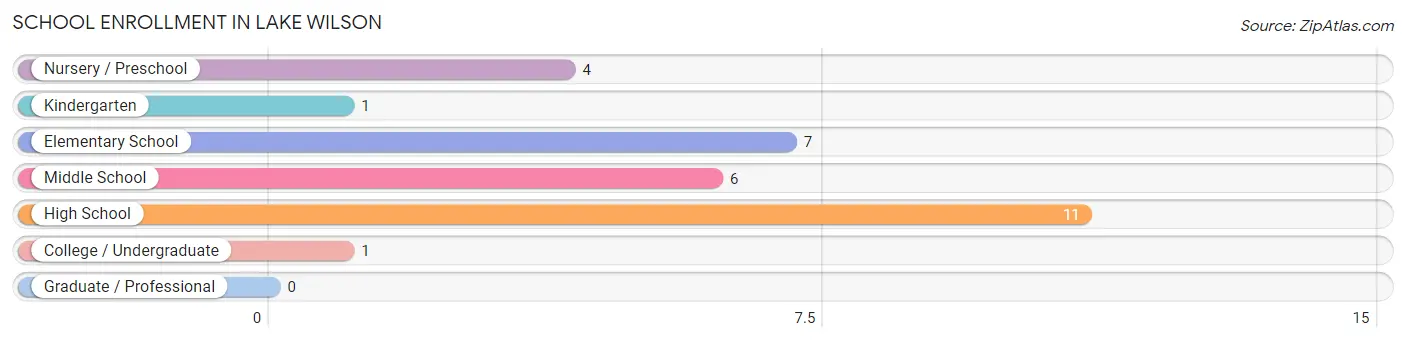
| School Level | # Students | % Students |
| Nursery / Preschool | 4 | 13.3% |
| Kindergarten | 1 | 3.3% |
| Elementary School | 7 | 23.3% |
| Middle School | 6 | 20.0% |
| High School | 11 | 36.7% |
| College / Undergraduate | 1 | 3.3% |
| Graduate / Professional | 0 | 0.0% |
| Total | 30 | 100.0% |
School Enrollment by Age by Funding Source in Lake Wilson
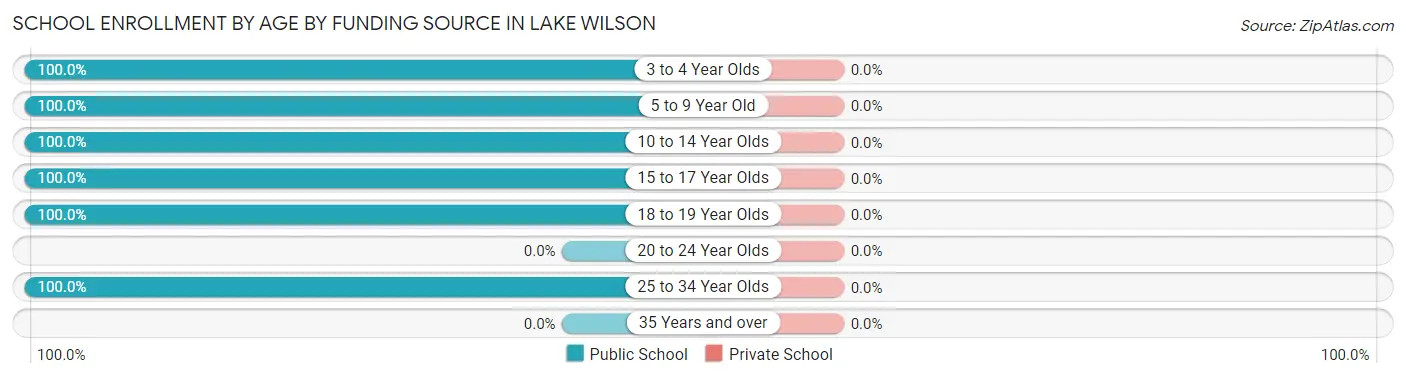
| Age Bracket | Public School | Private School |
| 3 to 4 Year Olds | 4 (100.0%) | 0 (0.0%) |
| 5 to 9 Year Old | 8 (100.0%) | 0 (0.0%) |
| 10 to 14 Year Olds | 6 (100.0%) | 0 (0.0%) |
| 15 to 17 Year Olds | 8 (100.0%) | 0 (0.0%) |
| 18 to 19 Year Olds | 3 (100.0%) | 0 (0.0%) |
| 20 to 24 Year Olds | 0 (0.0%) | 0 (0.0%) |
| 25 to 34 Year Olds | 1 (100.0%) | 0 (0.0%) |
| 35 Years and over | 0 (0.0%) | 0 (0.0%) |
| Total | 30 (100.0%) | 0 (0.0%) |
Educational Attainment by Field of Study in Lake Wilson
Business (11 | 50.0%), education (5 | 22.7%), science & technology (3 | 13.6%), engineering (2 | 9.1%), and arts & humanities (1 | 4.5%) are the most common fields of study among 22 individuals in Lake Wilson who have obtained a bachelor's degree or higher.
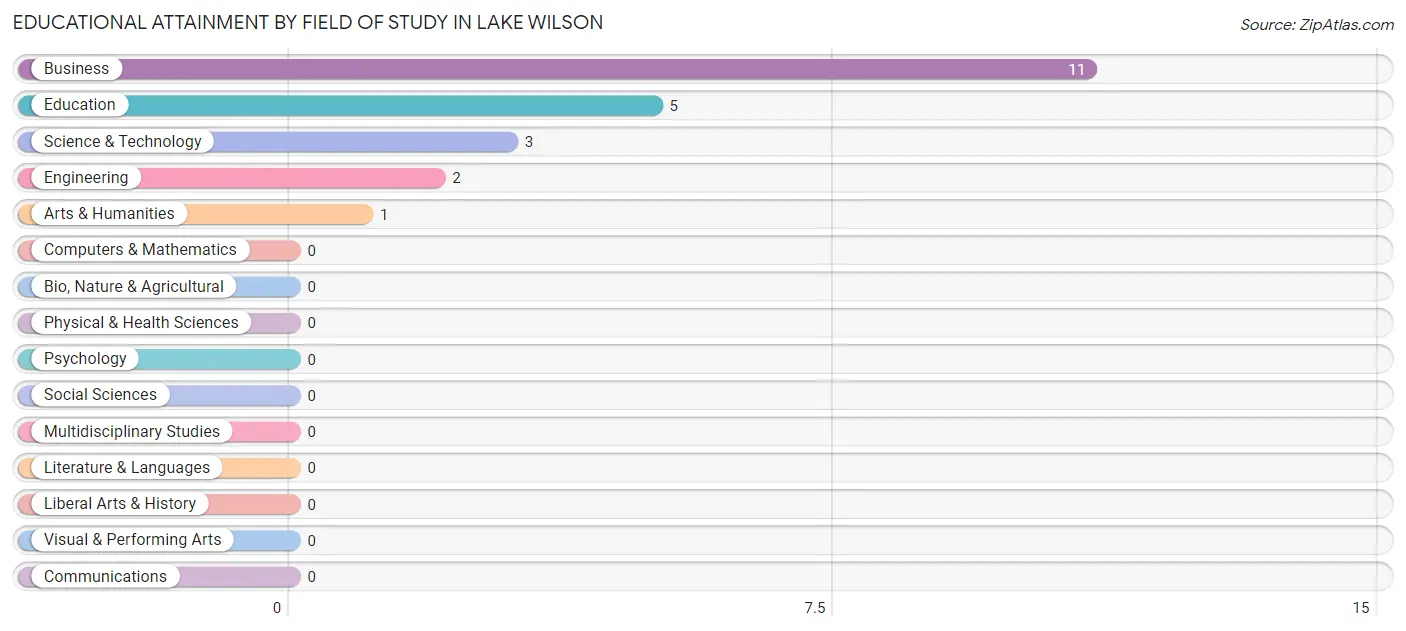
| Field of Study | # Graduates | % Graduates |
| Computers & Mathematics | 0 | 0.0% |
| Bio, Nature & Agricultural | 0 | 0.0% |
| Physical & Health Sciences | 0 | 0.0% |
| Psychology | 0 | 0.0% |
| Social Sciences | 0 | 0.0% |
| Engineering | 2 | 9.1% |
| Multidisciplinary Studies | 0 | 0.0% |
| Science & Technology | 3 | 13.6% |
| Business | 11 | 50.0% |
| Education | 5 | 22.7% |
| Literature & Languages | 0 | 0.0% |
| Liberal Arts & History | 0 | 0.0% |
| Visual & Performing Arts | 0 | 0.0% |
| Communications | 0 | 0.0% |
| Arts & Humanities | 1 | 4.5% |
| Total | 22 | 100.0% |
Transportation & Commute in Lake Wilson
Vehicle Availability by Sex in Lake Wilson
The most prevalent vehicle ownership categories in Lake Wilson are males with 2 vehicles (31, accounting for 48.4%) and females with 2 vehicles (10, making up 73.8%).
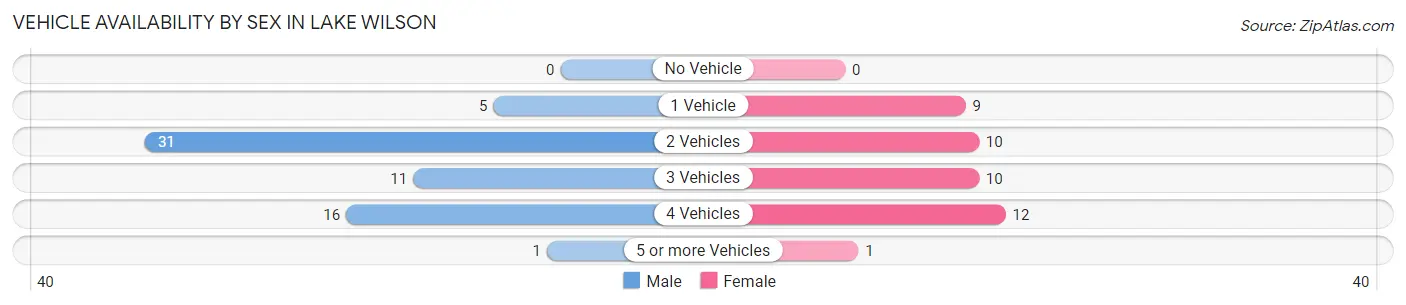
| Vehicles Available | Male | Female |
| No Vehicle | 0 (0.0%) | 0 (0.0%) |
| 1 Vehicle | 5 (7.8%) | 9 (21.4%) |
| 2 Vehicles | 31 (48.4%) | 10 (23.8%) |
| 3 Vehicles | 11 (17.2%) | 10 (23.8%) |
| 4 Vehicles | 16 (25.0%) | 12 (28.6%) |
| 5 or more Vehicles | 1 (1.6%) | 1 (2.4%) |
| Total | 64 (100.0%) | 42 (100.0%) |
Commute Time in Lake Wilson
The most frequently occuring commute durations in Lake Wilson are 10 to 14 minutes (20 commuters, 19.8%), 15 to 19 minutes (17 commuters, 16.8%), and 5 to 9 minutes (16 commuters, 15.8%).

| Commute Time | # Commuters | % Commuters |
| Less than 5 Minutes | 2 | 2.0% |
| 5 to 9 Minutes | 16 | 15.8% |
| 10 to 14 Minutes | 20 | 19.8% |
| 15 to 19 Minutes | 17 | 16.8% |
| 20 to 24 Minutes | 16 | 15.8% |
| 25 to 29 Minutes | 7 | 6.9% |
| 30 to 34 Minutes | 2 | 2.0% |
| 35 to 39 Minutes | 0 | 0.0% |
| 40 to 44 Minutes | 7 | 6.9% |
| 45 to 59 Minutes | 5 | 5.0% |
| 60 to 89 Minutes | 7 | 6.9% |
| 90 or more Minutes | 2 | 2.0% |
Commute Time by Sex in Lake Wilson
The most common commute times in Lake Wilson are 15 to 19 minutes (13 commuters, 20.3%) for males and 20 to 24 minutes (10 commuters, 27.0%) for females.
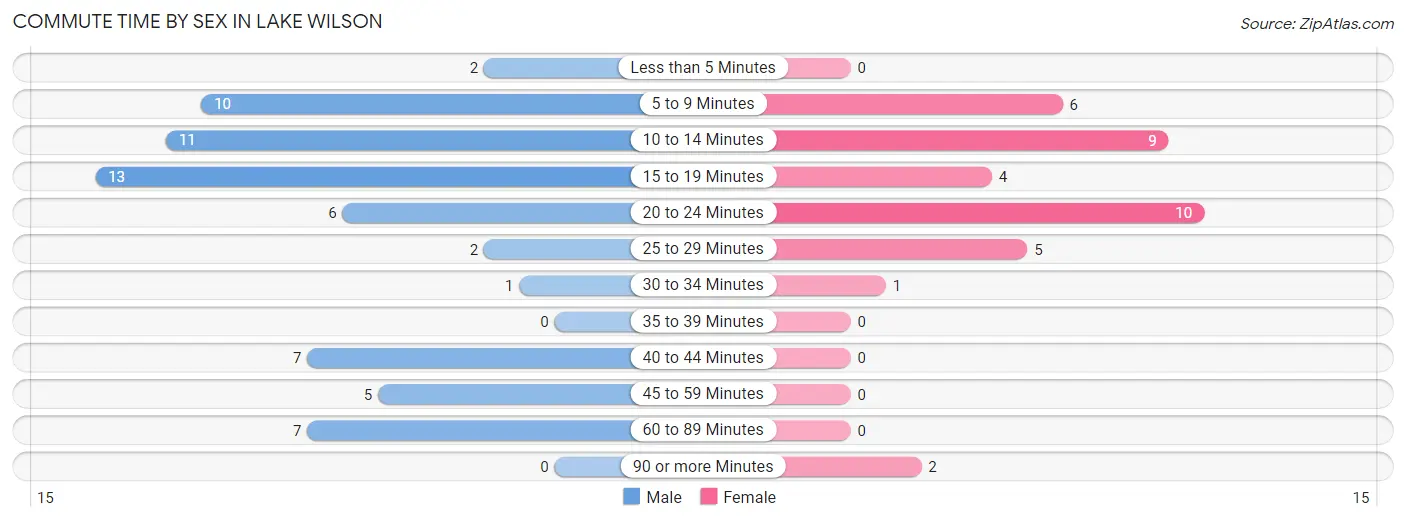
| Commute Time | Male | Female |
| Less than 5 Minutes | 2 (3.1%) | 0 (0.0%) |
| 5 to 9 Minutes | 10 (15.6%) | 6 (16.2%) |
| 10 to 14 Minutes | 11 (17.2%) | 9 (24.3%) |
| 15 to 19 Minutes | 13 (20.3%) | 4 (10.8%) |
| 20 to 24 Minutes | 6 (9.4%) | 10 (27.0%) |
| 25 to 29 Minutes | 2 (3.1%) | 5 (13.5%) |
| 30 to 34 Minutes | 1 (1.6%) | 1 (2.7%) |
| 35 to 39 Minutes | 0 (0.0%) | 0 (0.0%) |
| 40 to 44 Minutes | 7 (10.9%) | 0 (0.0%) |
| 45 to 59 Minutes | 5 (7.8%) | 0 (0.0%) |
| 60 to 89 Minutes | 7 (10.9%) | 0 (0.0%) |
| 90 or more Minutes | 0 (0.0%) | 2 (5.4%) |
Time of Departure to Work by Sex in Lake Wilson
The most frequent times of departure to work in Lake Wilson are 7:00 AM to 7:29 AM (12, 18.8%) for males and 7:30 AM to 7:59 AM (11, 29.7%) for females.
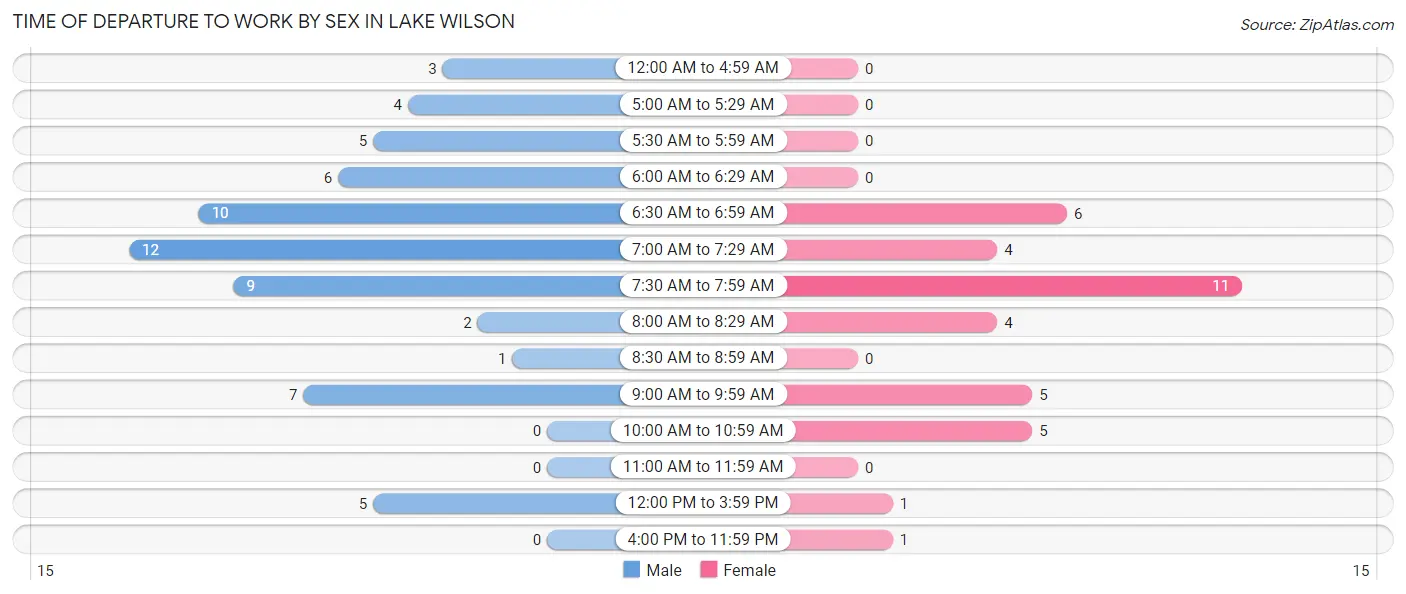
| Time of Departure | Male | Female |
| 12:00 AM to 4:59 AM | 3 (4.7%) | 0 (0.0%) |
| 5:00 AM to 5:29 AM | 4 (6.2%) | 0 (0.0%) |
| 5:30 AM to 5:59 AM | 5 (7.8%) | 0 (0.0%) |
| 6:00 AM to 6:29 AM | 6 (9.4%) | 0 (0.0%) |
| 6:30 AM to 6:59 AM | 10 (15.6%) | 6 (16.2%) |
| 7:00 AM to 7:29 AM | 12 (18.8%) | 4 (10.8%) |
| 7:30 AM to 7:59 AM | 9 (14.1%) | 11 (29.7%) |
| 8:00 AM to 8:29 AM | 2 (3.1%) | 4 (10.8%) |
| 8:30 AM to 8:59 AM | 1 (1.6%) | 0 (0.0%) |
| 9:00 AM to 9:59 AM | 7 (10.9%) | 5 (13.5%) |
| 10:00 AM to 10:59 AM | 0 (0.0%) | 5 (13.5%) |
| 11:00 AM to 11:59 AM | 0 (0.0%) | 0 (0.0%) |
| 12:00 PM to 3:59 PM | 5 (7.8%) | 1 (2.7%) |
| 4:00 PM to 11:59 PM | 0 (0.0%) | 1 (2.7%) |
| Total | 64 (100.0%) | 37 (100.0%) |
Housing Occupancy in Lake Wilson
Occupancy by Ownership in Lake Wilson
Of the total 113 dwellings in Lake Wilson, owner-occupied units account for 106 (93.8%), while renter-occupied units make up 7 (6.2%).
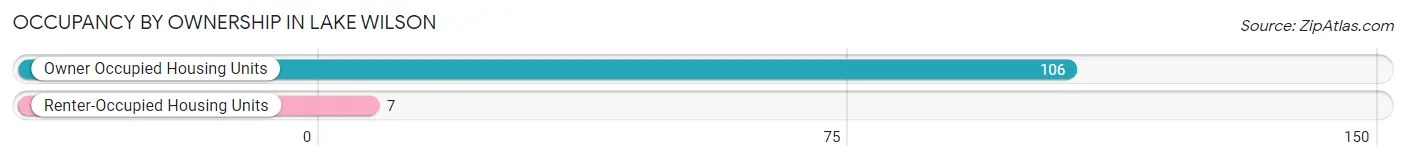
| Occupancy | # Housing Units | % Housing Units |
| Owner Occupied Housing Units | 106 | 93.8% |
| Renter-Occupied Housing Units | 7 | 6.2% |
| Total Occupied Housing Units | 113 | 100.0% |
Occupancy by Household Size in Lake Wilson
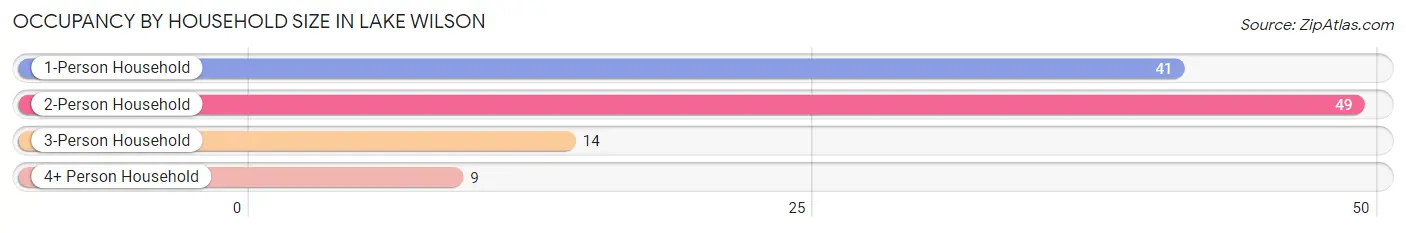
| Household Size | # Housing Units | % Housing Units |
| 1-Person Household | 41 | 36.3% |
| 2-Person Household | 49 | 43.4% |
| 3-Person Household | 14 | 12.4% |
| 4+ Person Household | 9 | 8.0% |
| Total Housing Units | 113 | 100.0% |
Occupancy by Ownership by Household Size in Lake Wilson
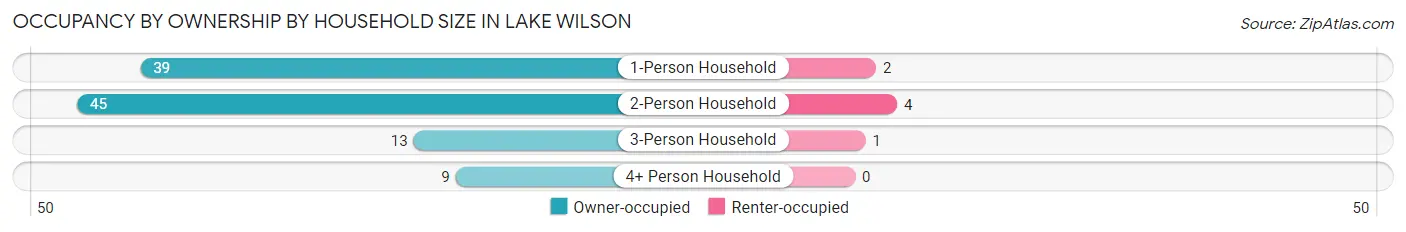
| Household Size | Owner-occupied | Renter-occupied |
| 1-Person Household | 39 (95.1%) | 2 (4.9%) |
| 2-Person Household | 45 (91.8%) | 4 (8.2%) |
| 3-Person Household | 13 (92.9%) | 1 (7.1%) |
| 4+ Person Household | 9 (100.0%) | 0 (0.0%) |
| Total Housing Units | 106 (93.8%) | 7 (6.2%) |
Occupancy by Educational Attainment in Lake Wilson
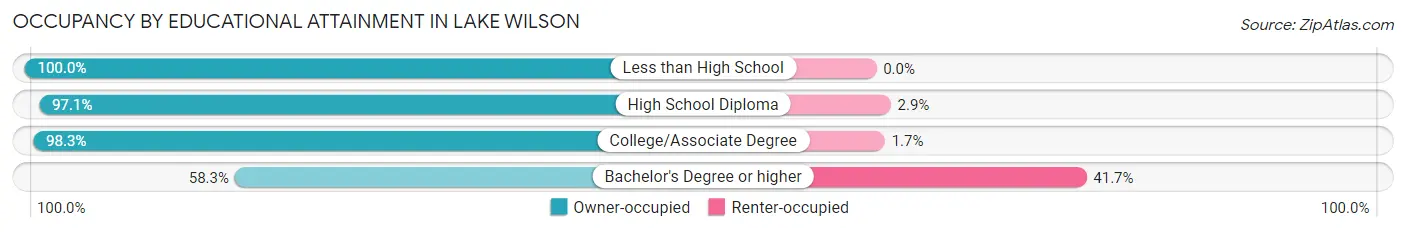
| Household Size | Owner-occupied | Renter-occupied |
| Less than High School | 7 (100.0%) | 0 (0.0%) |
| High School Diploma | 34 (97.1%) | 1 (2.9%) |
| College/Associate Degree | 58 (98.3%) | 1 (1.7%) |
| Bachelor's Degree or higher | 7 (58.3%) | 5 (41.7%) |
Occupancy by Age of Householder in Lake Wilson
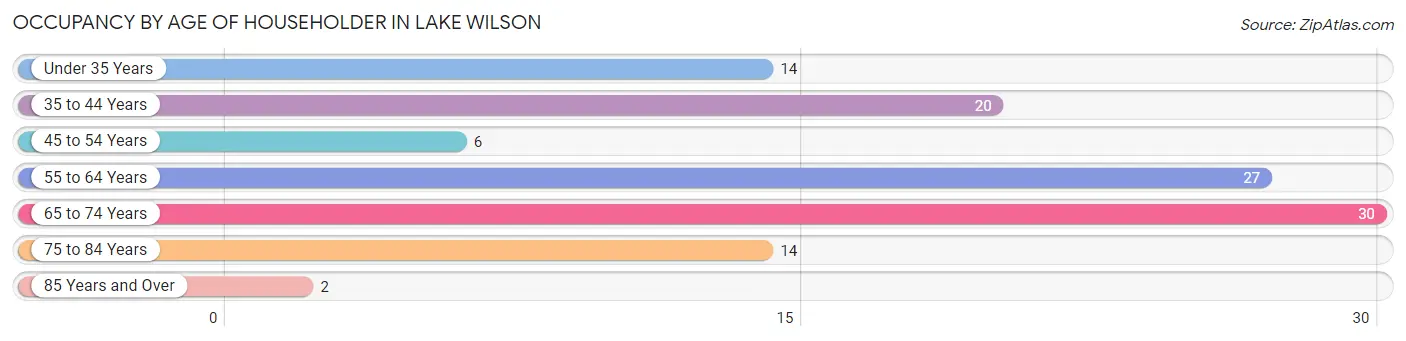
| Age Bracket | # Households | % Households |
| Under 35 Years | 14 | 12.4% |
| 35 to 44 Years | 20 | 17.7% |
| 45 to 54 Years | 6 | 5.3% |
| 55 to 64 Years | 27 | 23.9% |
| 65 to 74 Years | 30 | 26.6% |
| 75 to 84 Years | 14 | 12.4% |
| 85 Years and Over | 2 | 1.8% |
| Total | 113 | 100.0% |
Housing Finances in Lake Wilson
Median Income by Occupancy in Lake Wilson
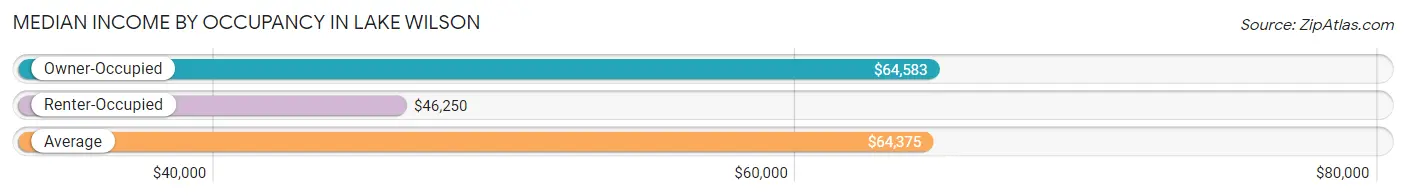
| Occupancy Type | # Households | Median Income |
| Owner-Occupied | 106 (93.8%) | $64,583 |
| Renter-Occupied | 7 (6.2%) | $46,250 |
| Average | 113 (100.0%) | $64,375 |
Occupancy by Householder Income Bracket in Lake Wilson
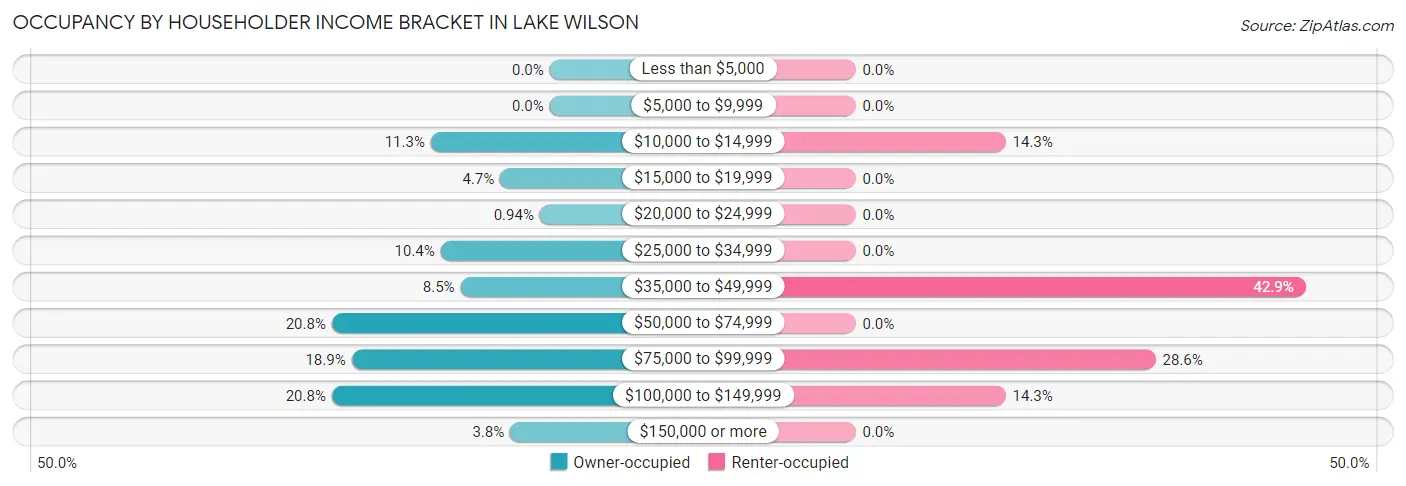
| Income Bracket | Owner-occupied | Renter-occupied |
| Less than $5,000 | 0 (0.0%) | 0 (0.0%) |
| $5,000 to $9,999 | 0 (0.0%) | 0 (0.0%) |
| $10,000 to $14,999 | 12 (11.3%) | 1 (14.3%) |
| $15,000 to $19,999 | 5 (4.7%) | 0 (0.0%) |
| $20,000 to $24,999 | 1 (0.9%) | 0 (0.0%) |
| $25,000 to $34,999 | 11 (10.4%) | 0 (0.0%) |
| $35,000 to $49,999 | 9 (8.5%) | 3 (42.9%) |
| $50,000 to $74,999 | 22 (20.7%) | 0 (0.0%) |
| $75,000 to $99,999 | 20 (18.9%) | 2 (28.6%) |
| $100,000 to $149,999 | 22 (20.7%) | 1 (14.3%) |
| $150,000 or more | 4 (3.8%) | 0 (0.0%) |
| Total | 106 (100.0%) | 7 (100.0%) |
Monthly Housing Cost Tiers in Lake Wilson
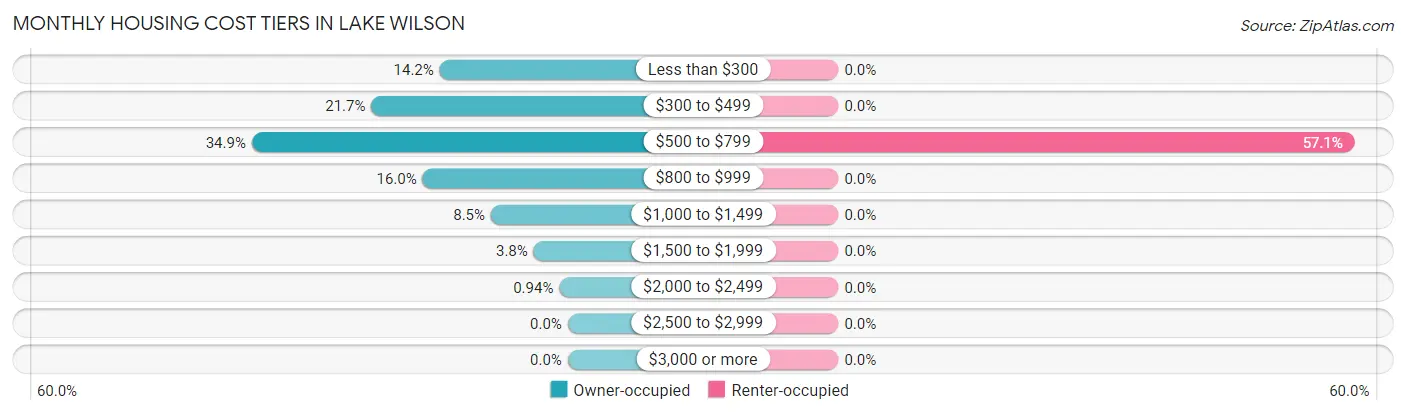
| Monthly Cost | Owner-occupied | Renter-occupied |
| Less than $300 | 15 (14.1%) | 0 (0.0%) |
| $300 to $499 | 23 (21.7%) | 0 (0.0%) |
| $500 to $799 | 37 (34.9%) | 4 (57.1%) |
| $800 to $999 | 17 (16.0%) | 0 (0.0%) |
| $1,000 to $1,499 | 9 (8.5%) | 0 (0.0%) |
| $1,500 to $1,999 | 4 (3.8%) | 0 (0.0%) |
| $2,000 to $2,499 | 1 (0.9%) | 0 (0.0%) |
| $2,500 to $2,999 | 0 (0.0%) | 0 (0.0%) |
| $3,000 or more | 0 (0.0%) | 0 (0.0%) |
| Total | 106 (100.0%) | 7 (100.0%) |
Physical Housing Characteristics in Lake Wilson
Housing Structures in Lake Wilson
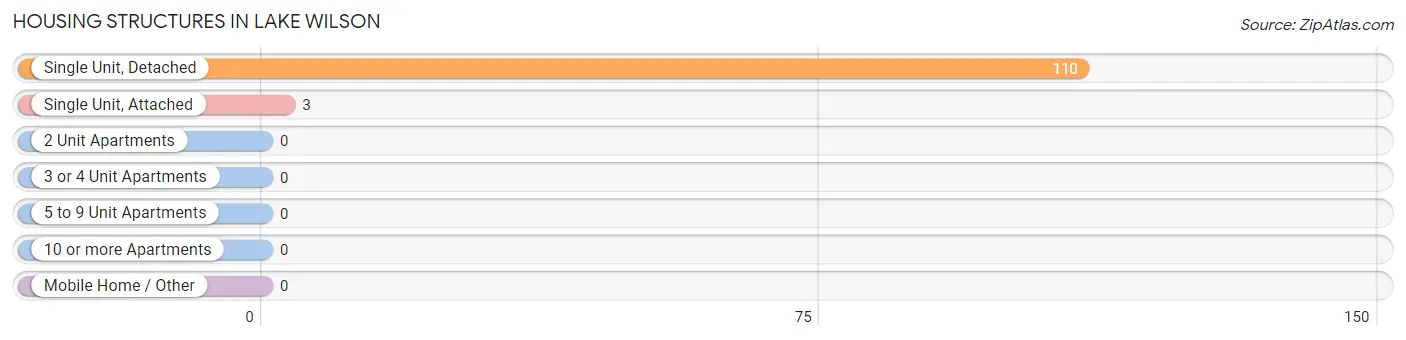
| Structure Type | # Housing Units | % Housing Units |
| Single Unit, Detached | 110 | 97.4% |
| Single Unit, Attached | 3 | 2.6% |
| 2 Unit Apartments | 0 | 0.0% |
| 3 or 4 Unit Apartments | 0 | 0.0% |
| 5 to 9 Unit Apartments | 0 | 0.0% |
| 10 or more Apartments | 0 | 0.0% |
| Mobile Home / Other | 0 | 0.0% |
| Total | 113 | 100.0% |
Housing Structures by Occupancy in Lake Wilson
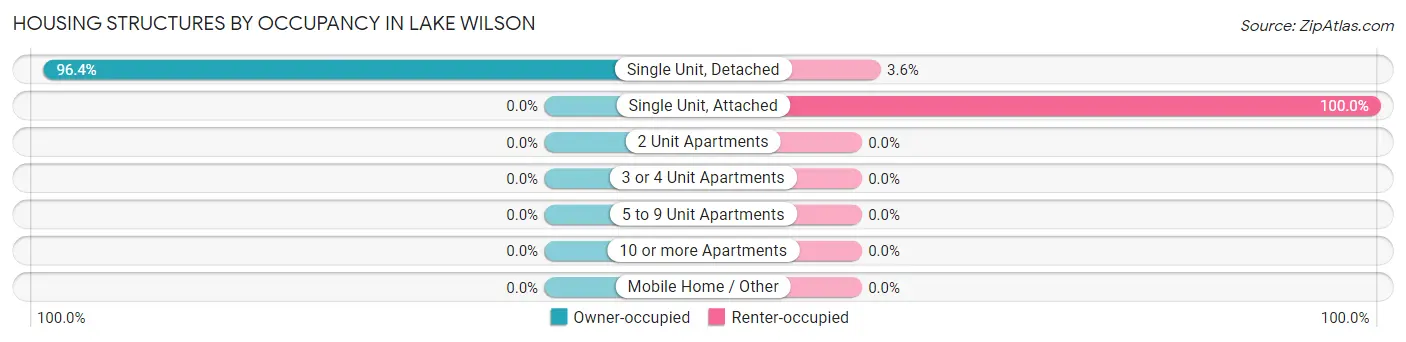
| Structure Type | Owner-occupied | Renter-occupied |
| Single Unit, Detached | 106 (96.4%) | 4 (3.6%) |
| Single Unit, Attached | 0 (0.0%) | 3 (100.0%) |
| 2 Unit Apartments | 0 (0.0%) | 0 (0.0%) |
| 3 or 4 Unit Apartments | 0 (0.0%) | 0 (0.0%) |
| 5 to 9 Unit Apartments | 0 (0.0%) | 0 (0.0%) |
| 10 or more Apartments | 0 (0.0%) | 0 (0.0%) |
| Mobile Home / Other | 0 (0.0%) | 0 (0.0%) |
| Total | 106 (93.8%) | 7 (6.2%) |
Housing Structures by Number of Rooms in Lake Wilson
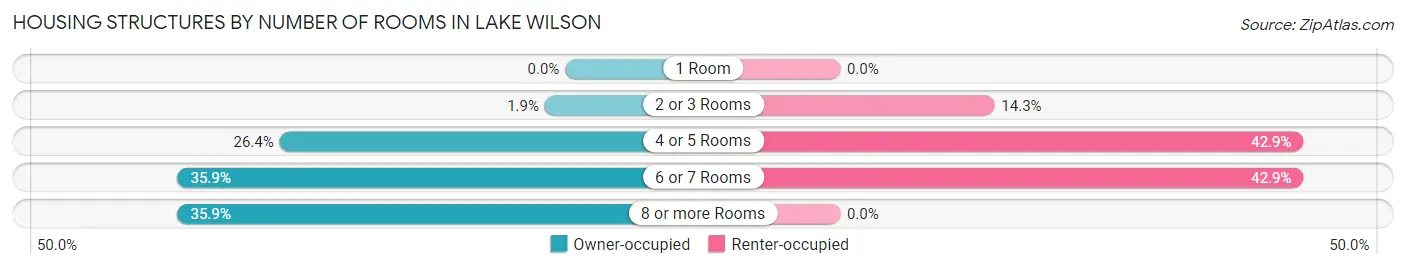
| Number of Rooms | Owner-occupied | Renter-occupied |
| 1 Room | 0 (0.0%) | 0 (0.0%) |
| 2 or 3 Rooms | 2 (1.9%) | 1 (14.3%) |
| 4 or 5 Rooms | 28 (26.4%) | 3 (42.9%) |
| 6 or 7 Rooms | 38 (35.8%) | 3 (42.9%) |
| 8 or more Rooms | 38 (35.8%) | 0 (0.0%) |
| Total | 106 (100.0%) | 7 (100.0%) |
Housing Structure by Heating Type in Lake Wilson
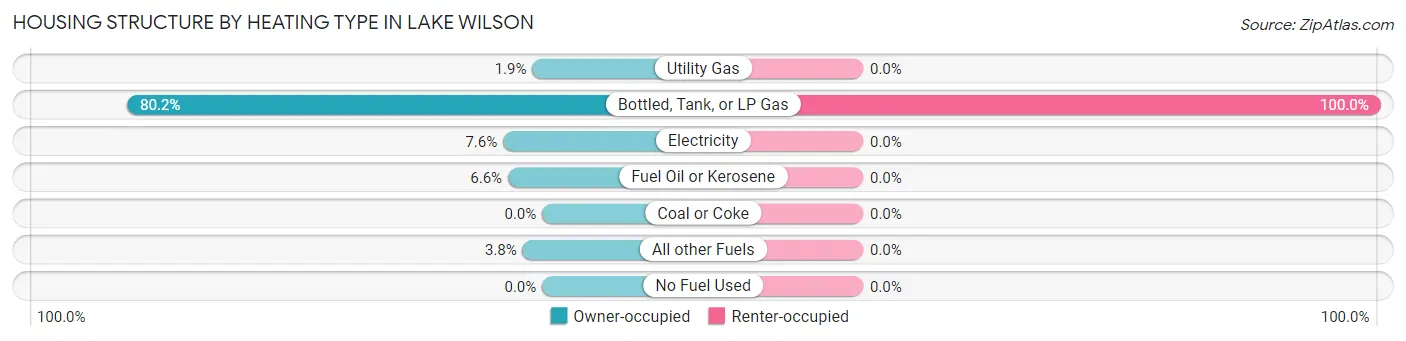
| Heating Type | Owner-occupied | Renter-occupied |
| Utility Gas | 2 (1.9%) | 0 (0.0%) |
| Bottled, Tank, or LP Gas | 85 (80.2%) | 7 (100.0%) |
| Electricity | 8 (7.5%) | 0 (0.0%) |
| Fuel Oil or Kerosene | 7 (6.6%) | 0 (0.0%) |
| Coal or Coke | 0 (0.0%) | 0 (0.0%) |
| All other Fuels | 4 (3.8%) | 0 (0.0%) |
| No Fuel Used | 0 (0.0%) | 0 (0.0%) |
| Total | 106 (100.0%) | 7 (100.0%) |
Household Vehicle Usage in Lake Wilson
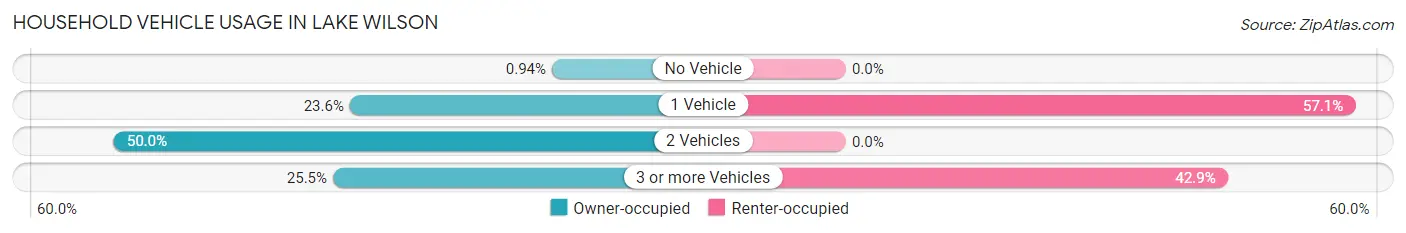
| Vehicles per Household | Owner-occupied | Renter-occupied |
| No Vehicle | 1 (0.9%) | 0 (0.0%) |
| 1 Vehicle | 25 (23.6%) | 4 (57.1%) |
| 2 Vehicles | 53 (50.0%) | 0 (0.0%) |
| 3 or more Vehicles | 27 (25.5%) | 3 (42.9%) |
| Total | 106 (100.0%) | 7 (100.0%) |
Real Estate & Mortgages in Lake Wilson
Real Estate and Mortgage Overview in Lake Wilson
| Characteristic | Without Mortgage | With Mortgage |
| Housing Units | 59 | 47 |
| Median Property Value | $85,000 | $81,900 |
| Median Household Income | $53,750 | $2 |
| Monthly Housing Costs | $450 | $0 |
| Real Estate Taxes | $464 | $0 |
Property Value by Mortgage Status in Lake Wilson
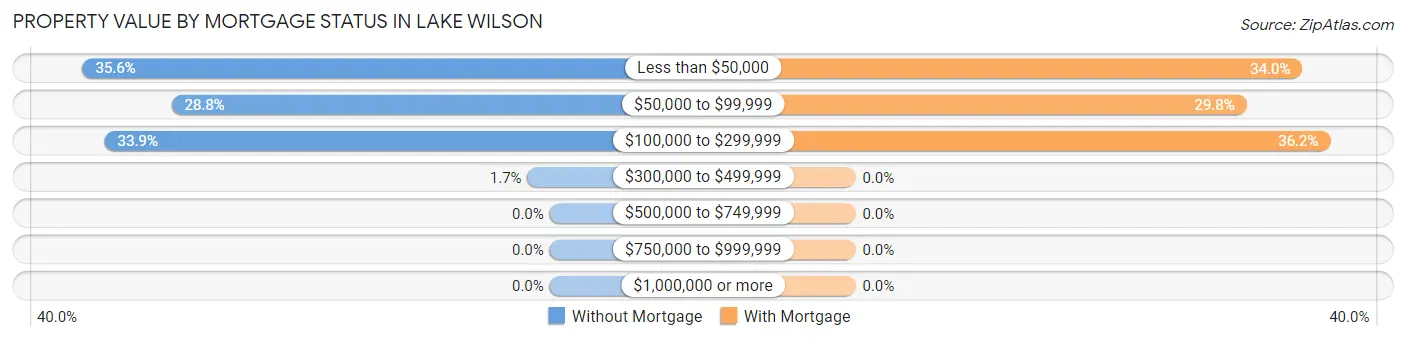
| Property Value | Without Mortgage | With Mortgage |
| Less than $50,000 | 21 (35.6%) | 16 (34.0%) |
| $50,000 to $99,999 | 17 (28.8%) | 14 (29.8%) |
| $100,000 to $299,999 | 20 (33.9%) | 17 (36.2%) |
| $300,000 to $499,999 | 1 (1.7%) | 0 (0.0%) |
| $500,000 to $749,999 | 0 (0.0%) | 0 (0.0%) |
| $750,000 to $999,999 | 0 (0.0%) | 0 (0.0%) |
| $1,000,000 or more | 0 (0.0%) | 0 (0.0%) |
| Total | 59 (100.0%) | 47 (100.0%) |
Household Income by Mortgage Status in Lake Wilson
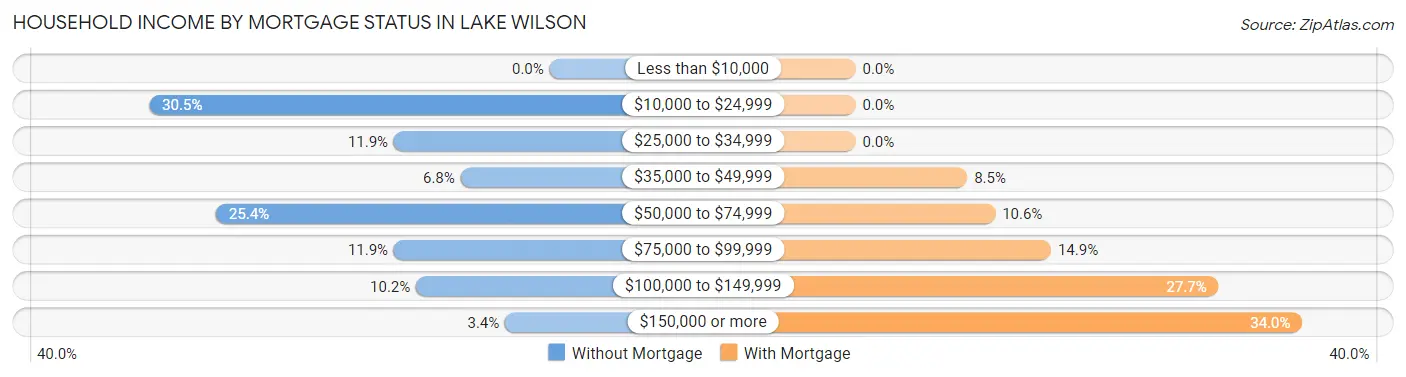
| Household Income | Without Mortgage | With Mortgage |
| Less than $10,000 | 0 (0.0%) | 0 (0.0%) |
| $10,000 to $24,999 | 18 (30.5%) | 0 (0.0%) |
| $25,000 to $34,999 | 7 (11.9%) | 0 (0.0%) |
| $35,000 to $49,999 | 4 (6.8%) | 4 (8.5%) |
| $50,000 to $74,999 | 15 (25.4%) | 5 (10.6%) |
| $75,000 to $99,999 | 7 (11.9%) | 7 (14.9%) |
| $100,000 to $149,999 | 6 (10.2%) | 13 (27.7%) |
| $150,000 or more | 2 (3.4%) | 16 (34.0%) |
| Total | 59 (100.0%) | 47 (100.0%) |
Property Value to Household Income Ratio in Lake Wilson
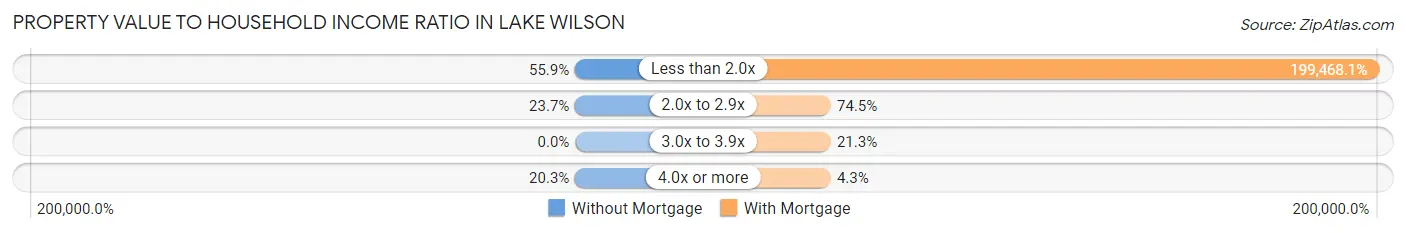
| Value-to-Income Ratio | Without Mortgage | With Mortgage |
| Less than 2.0x | 33 (55.9%) | 93,750 (199,468.1%) |
| 2.0x to 2.9x | 14 (23.7%) | 35 (74.5%) |
| 3.0x to 3.9x | 0 (0.0%) | 10 (21.3%) |
| 4.0x or more | 12 (20.3%) | 2 (4.3%) |
| Total | 59 (100.0%) | 47 (100.0%) |
Real Estate Taxes by Mortgage Status in Lake Wilson
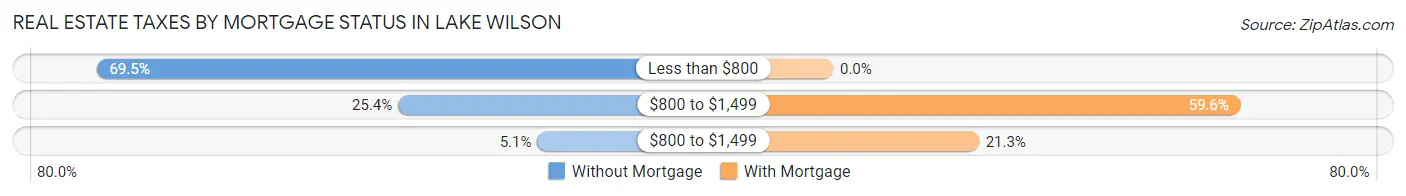
| Property Taxes | Without Mortgage | With Mortgage |
| Less than $800 | 41 (69.5%) | 0 (0.0%) |
| $800 to $1,499 | 15 (25.4%) | 28 (59.6%) |
| $800 to $1,499 | 3 (5.1%) | 10 (21.3%) |
| Total | 59 (100.0%) | 47 (100.0%) |
Health & Disability in Lake Wilson
Health Insurance Coverage by Age in Lake Wilson
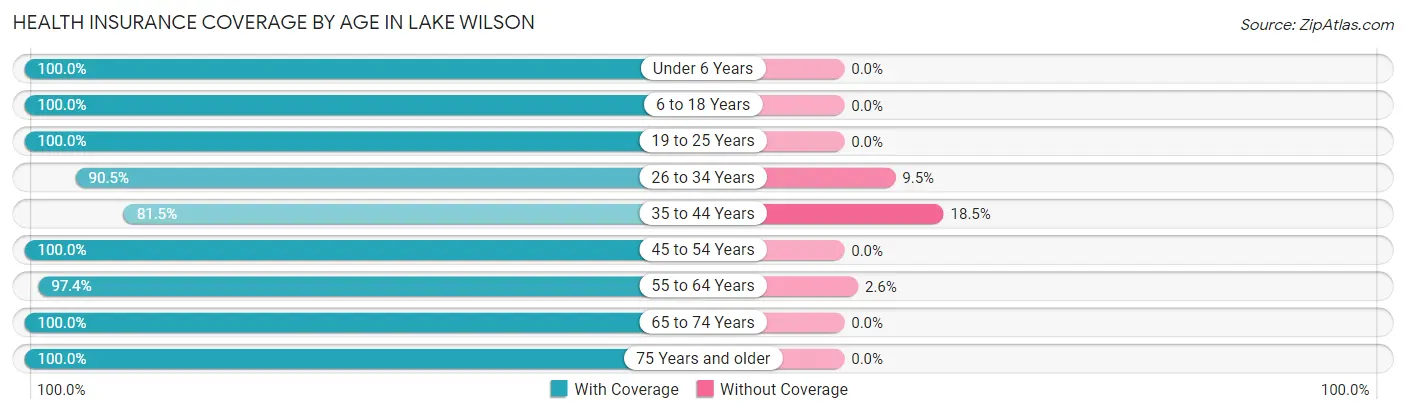
| Age Bracket | With Coverage | Without Coverage |
| Under 6 Years | 9 (100.0%) | 0 (0.0%) |
| 6 to 18 Years | 25 (100.0%) | 0 (0.0%) |
| 19 to 25 Years | 5 (100.0%) | 0 (0.0%) |
| 26 to 34 Years | 19 (90.5%) | 2 (9.5%) |
| 35 to 44 Years | 22 (81.5%) | 5 (18.5%) |
| 45 to 54 Years | 21 (100.0%) | 0 (0.0%) |
| 55 to 64 Years | 38 (97.4%) | 1 (2.6%) |
| 65 to 74 Years | 39 (100.0%) | 0 (0.0%) |
| 75 Years and older | 27 (100.0%) | 0 (0.0%) |
| Total | 205 (96.2%) | 8 (3.8%) |
Health Insurance Coverage by Citizenship Status in Lake Wilson
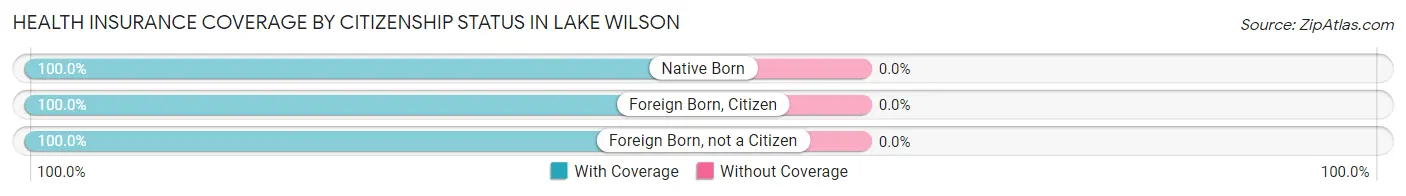
| Citizenship Status | With Coverage | Without Coverage |
| Native Born | 9 (100.0%) | 0 (0.0%) |
| Foreign Born, Citizen | 25 (100.0%) | 0 (0.0%) |
| Foreign Born, not a Citizen | 5 (100.0%) | 0 (0.0%) |
Health Insurance Coverage by Household Income in Lake Wilson
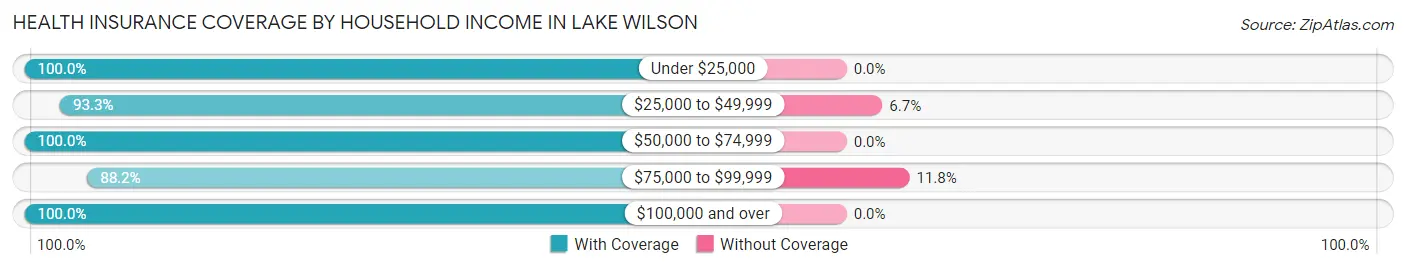
| Household Income | With Coverage | Without Coverage |
| Under $25,000 | 20 (100.0%) | 0 (0.0%) |
| $25,000 to $49,999 | 28 (93.3%) | 2 (6.7%) |
| $50,000 to $74,999 | 59 (100.0%) | 0 (0.0%) |
| $75,000 to $99,999 | 45 (88.2%) | 6 (11.8%) |
| $100,000 and over | 53 (100.0%) | 0 (0.0%) |
Public vs Private Health Insurance Coverage by Age in Lake Wilson
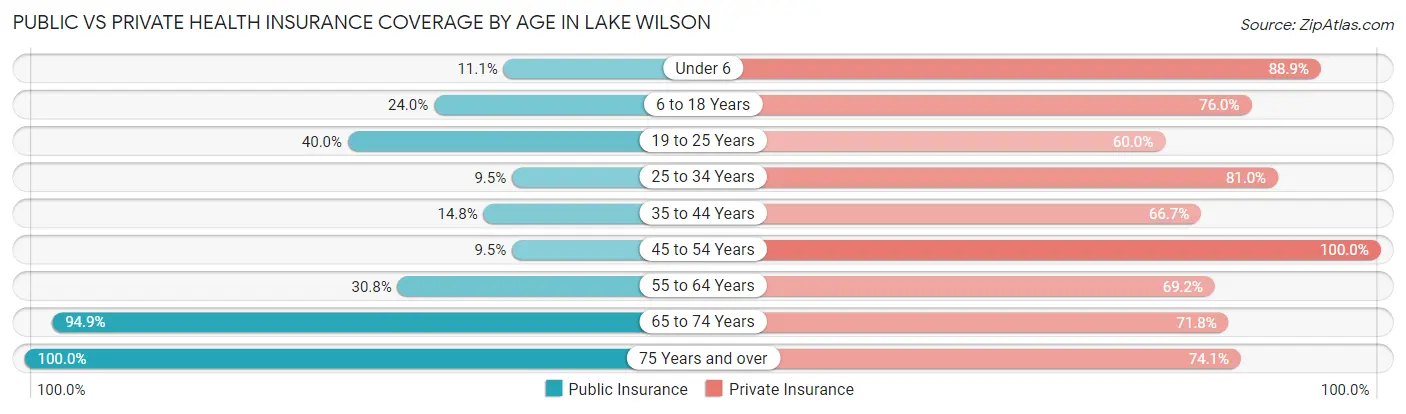
| Age Bracket | Public Insurance | Private Insurance |
| Under 6 | 1 (11.1%) | 8 (88.9%) |
| 6 to 18 Years | 6 (24.0%) | 19 (76.0%) |
| 19 to 25 Years | 2 (40.0%) | 3 (60.0%) |
| 25 to 34 Years | 2 (9.5%) | 17 (80.9%) |
| 35 to 44 Years | 4 (14.8%) | 18 (66.7%) |
| 45 to 54 Years | 2 (9.5%) | 21 (100.0%) |
| 55 to 64 Years | 12 (30.8%) | 27 (69.2%) |
| 65 to 74 Years | 37 (94.9%) | 28 (71.8%) |
| 75 Years and over | 27 (100.0%) | 20 (74.1%) |
| Total | 93 (43.7%) | 161 (75.6%) |
Disability Status by Sex by Age in Lake Wilson
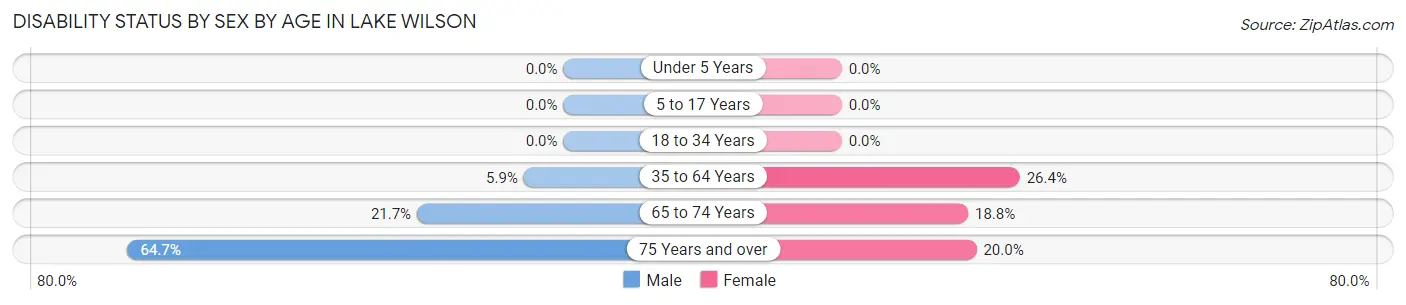
| Age Bracket | Male | Female |
| Under 5 Years | 0 (0.0%) | 0 (0.0%) |
| 5 to 17 Years | 0 (0.0%) | 0 (0.0%) |
| 18 to 34 Years | 0 (0.0%) | 0 (0.0%) |
| 35 to 64 Years | 2 (5.9%) | 14 (26.4%) |
| 65 to 74 Years | 5 (21.7%) | 3 (18.8%) |
| 75 Years and over | 11 (64.7%) | 2 (20.0%) |
Disability Class by Sex by Age in Lake Wilson
Disability Class: Hearing Difficulty
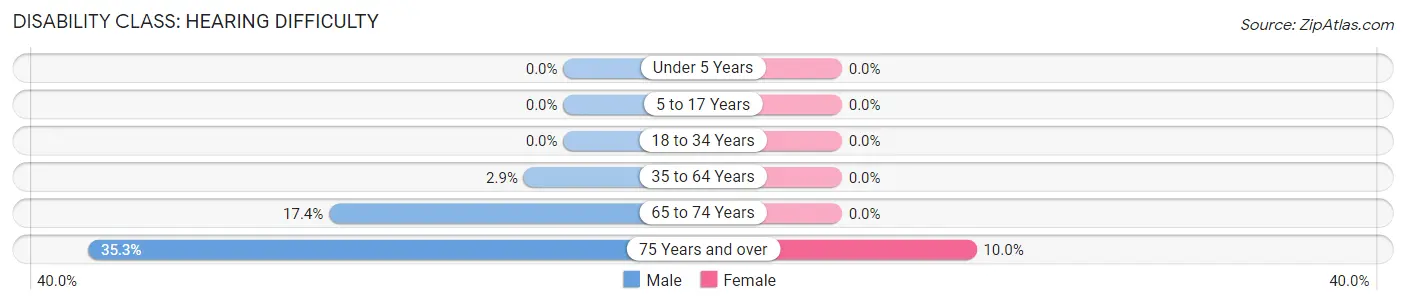
| Age Bracket | Male | Female |
| Under 5 Years | 0 (0.0%) | 0 (0.0%) |
| 5 to 17 Years | 0 (0.0%) | 0 (0.0%) |
| 18 to 34 Years | 0 (0.0%) | 0 (0.0%) |
| 35 to 64 Years | 1 (2.9%) | 0 (0.0%) |
| 65 to 74 Years | 4 (17.4%) | 0 (0.0%) |
| 75 Years and over | 6 (35.3%) | 1 (10.0%) |
Disability Class: Vision Difficulty
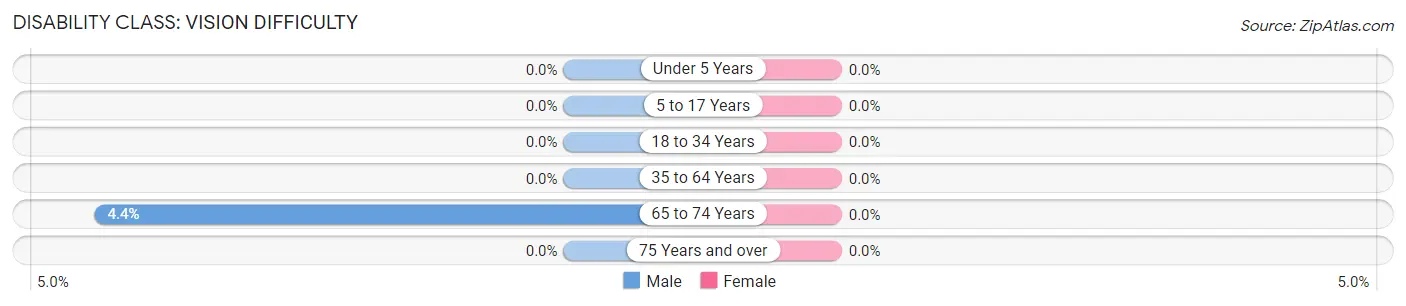
| Age Bracket | Male | Female |
| Under 5 Years | 0 (0.0%) | 0 (0.0%) |
| 5 to 17 Years | 0 (0.0%) | 0 (0.0%) |
| 18 to 34 Years | 0 (0.0%) | 0 (0.0%) |
| 35 to 64 Years | 0 (0.0%) | 0 (0.0%) |
| 65 to 74 Years | 1 (4.3%) | 0 (0.0%) |
| 75 Years and over | 0 (0.0%) | 0 (0.0%) |
Disability Class: Cognitive Difficulty
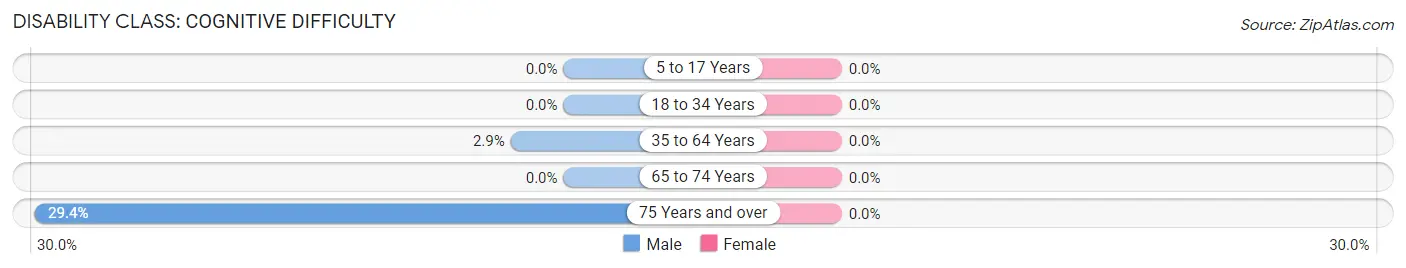
| Age Bracket | Male | Female |
| 5 to 17 Years | 0 (0.0%) | 0 (0.0%) |
| 18 to 34 Years | 0 (0.0%) | 0 (0.0%) |
| 35 to 64 Years | 1 (2.9%) | 0 (0.0%) |
| 65 to 74 Years | 0 (0.0%) | 0 (0.0%) |
| 75 Years and over | 5 (29.4%) | 0 (0.0%) |
Disability Class: Ambulatory Difficulty
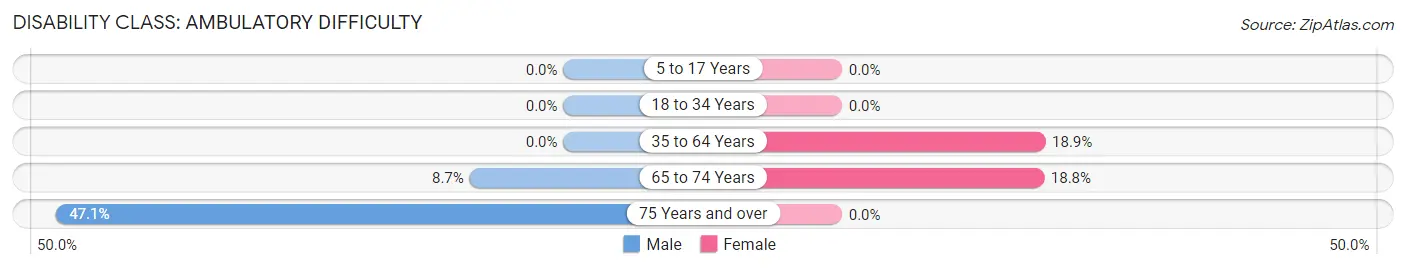
| Age Bracket | Male | Female |
| 5 to 17 Years | 0 (0.0%) | 0 (0.0%) |
| 18 to 34 Years | 0 (0.0%) | 0 (0.0%) |
| 35 to 64 Years | 0 (0.0%) | 10 (18.9%) |
| 65 to 74 Years | 2 (8.7%) | 3 (18.8%) |
| 75 Years and over | 8 (47.1%) | 0 (0.0%) |
Disability Class: Self-Care Difficulty
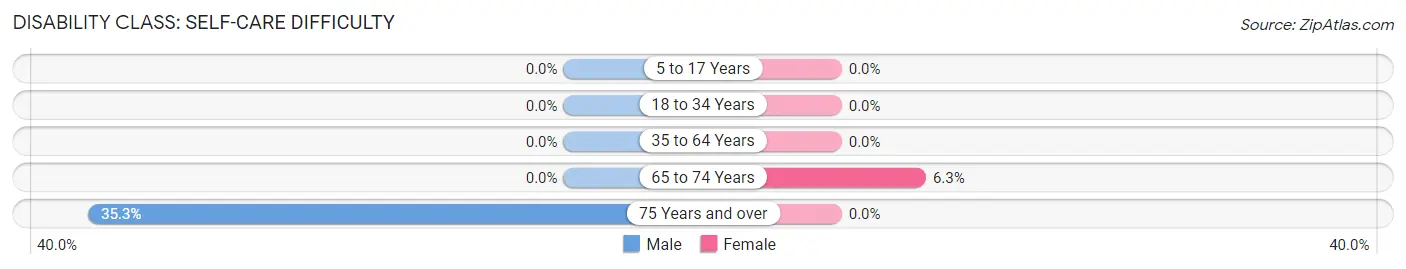
| Age Bracket | Male | Female |
| 5 to 17 Years | 0 (0.0%) | 0 (0.0%) |
| 18 to 34 Years | 0 (0.0%) | 0 (0.0%) |
| 35 to 64 Years | 0 (0.0%) | 0 (0.0%) |
| 65 to 74 Years | 0 (0.0%) | 1 (6.2%) |
| 75 Years and over | 6 (35.3%) | 0 (0.0%) |
Technology Access in Lake Wilson
Computing Device Access in Lake Wilson
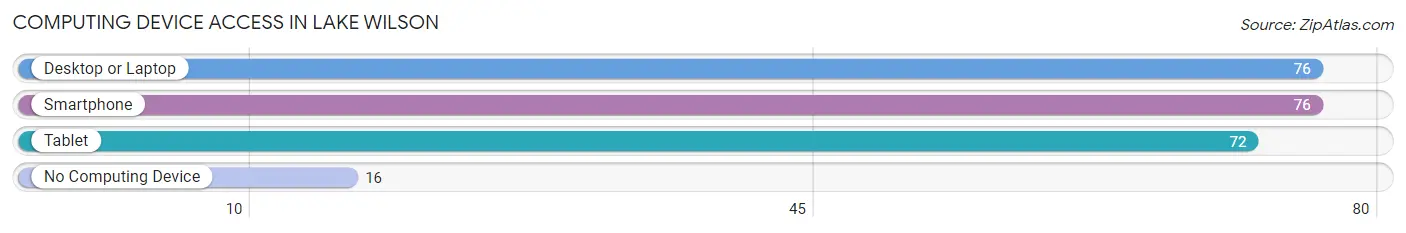
| Device Type | # Households | % Households |
| Desktop or Laptop | 76 | 67.3% |
| Smartphone | 76 | 67.3% |
| Tablet | 72 | 63.7% |
| No Computing Device | 16 | 14.2% |
| Total | 113 | 100.0% |
Internet Access in Lake Wilson
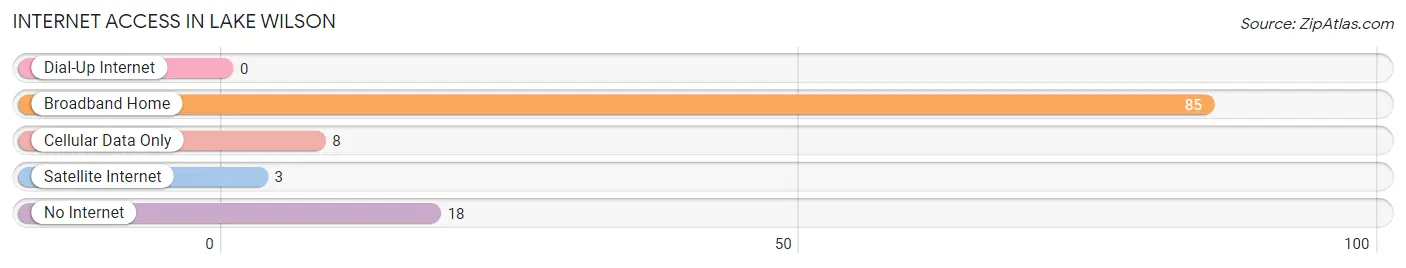
| Internet Type | # Households | % Households |
| Dial-Up Internet | 0 | 0.0% |
| Broadband Home | 85 | 75.2% |
| Cellular Data Only | 8 | 7.1% |
| Satellite Internet | 3 | 2.6% |
| No Internet | 18 | 15.9% |
| Total | 113 | 100.0% |
Lake Wilson Summary
Wilson, Minnesota is a small town located in the southwestern corner of the state, just north of the Iowa border. It is part of the larger Mower County, and is situated on the banks of Lake Wilson, a small lake that is part of the Upper Iowa River watershed. The town has a population of just over 500 people, and is a rural community with a strong agricultural base.
History
The area around Lake Wilson has been inhabited for centuries, with evidence of Native American settlements dating back to the 1600s. The first European settlers arrived in the area in the mid-1800s, and the town of Wilson was officially established in 1856. The town was named after the lake, which was named after a local settler, William Wilson.
The town grew slowly over the next few decades, and by the early 1900s, it had become a thriving agricultural community. The town was home to several grain elevators, a creamery, and a number of other businesses. In the 1920s, the town was connected to the rest of the state by a railroad line, which allowed for the transport of goods and people.
Geography
Wilson is located in the southwestern corner of Minnesota, just north of the Iowa border. It is part of Mower County, and is situated on the banks of Lake Wilson, a small lake that is part of the Upper Iowa River watershed. The town is surrounded by rolling hills and farmland, and is located about 25 miles from the larger city of Austin.
The climate in Wilson is typical of the Midwest, with hot summers and cold winters. The average temperature in the summer is around 75 degrees Fahrenheit, and the average temperature in the winter is around 20 degrees Fahrenheit. The town receives an average of about 30 inches of precipitation each year.
Economy
The economy of Wilson is largely based on agriculture. The town is home to several grain elevators, and the surrounding area is home to many farms and ranches. The town is also home to a number of small businesses, including a grocery store, a hardware store, and a few restaurants.
The town is also home to a number of recreational activities, including fishing, boating, and camping. The lake is a popular destination for anglers, and the town is home to a number of parks and trails.
Demographics
As of the 2010 census, the population of Wilson was 514 people. The racial makeup of the town was 97.3% White, 0.6% African American, 0.2% Native American, 0.2% Asian, 0.4% from other races, and 1.3% from two or more races. The median household income was $45,000, and the median age was 43.
Conclusion
Wilson, Minnesota is a small town located in the southwestern corner of the state, just north of the Iowa border. It is part of the larger Mower County, and is situated on the banks of Lake Wilson, a small lake that is part of the Upper Iowa River watershed. The town has a population of just over 500 people, and is a rural community with a strong agricultural base. The economy of Wilson is largely based on agriculture, and the town is home to several grain elevators, as well as a number of small businesses. The town is also home to a number of recreational activities, including fishing, boating, and camping. The population of Wilson is largely white, with a median household income of $45,000 and a median age of 43.
Common Questions
What is Per Capita Income in Lake Wilson?
Per Capita income in Lake Wilson is $37,236.
What is the Median Family Income in Lake Wilson?
Median Family Income in Lake Wilson is $82,500.
What is the Median Household income in Lake Wilson?
Median Household Income in Lake Wilson is $64,375.
What is Income or Wage Gap in Lake Wilson?
Income or Wage Gap in Lake Wilson is 46.6%.
Women in Lake Wilson earn 53.4 cents for every dollar earned by a man.
What is Inequality or Gini Index in Lake Wilson?
Inequality or Gini Index in Lake Wilson is 0.35.
What is the Total Population of Lake Wilson?
Total Population of Lake Wilson is 213.
What is the Total Male Population of Lake Wilson?
Total Male Population of Lake Wilson is 110.
What is the Total Female Population of Lake Wilson?
Total Female Population of Lake Wilson is 103.
What is the Ratio of Males per 100 Females in Lake Wilson?
There are 106.80 Males per 100 Females in Lake Wilson.
What is the Ratio of Females per 100 Males in Lake Wilson?
There are 93.64 Females per 100 Males in Lake Wilson.
What is the Median Population Age in Lake Wilson?
Median Population Age in Lake Wilson is 54.8 Years.
What is the Average Family Size in Lake Wilson
Average Family Size in Lake Wilson is 2.3 People.
What is the Average Household Size in Lake Wilson
Average Household Size in Lake Wilson is 1.9 People.
How Large is the Labor Force in Lake Wilson?
There are 106 People in the Labor Forcein in Lake Wilson.
What is the Percentage of People in the Labor Force in Lake Wilson?
57.3% of People are in the Labor Force in Lake Wilson.