Los Olivos, CA Map & Demographics
Los Olivos Map
Los Olivos Overview
$71,982
PER CAPITA INCOME
$153,750
AVG FAMILY INCOME
$150,882
AVG HOUSEHOLD INCOME
62.0%
WAGE / INCOME GAP [ % ]
38.0¢/ $1
WAGE / INCOME GAP [ $ ]
0.42
INEQUALITY / GINI INDEX
1,020
TOTAL POPULATION
557
MALE POPULATION
463
FEMALE POPULATION
120.30
MALES / 100 FEMALES
83.12
FEMALES / 100 MALES
52.9
MEDIAN AGE
2.8
AVG FAMILY SIZE
2.4
AVG HOUSEHOLD SIZE
468
LABOR FORCE [ PEOPLE ]
52.1%
PERCENT IN LABOR FORCE
9.0%
UNEMPLOYMENT RATE
Los Olivos Zip Codes
Income in Los Olivos
Income Overview in Los Olivos
Per Capita Income in Los Olivos is $71,982, while median incomes of families and households are $153,750 and $150,882 respectively.
| Characteristic | Number | Measure |
| Per Capita Income | 1,020 | $71,982 |
| Median Family Income | 314 | $153,750 |
| Mean Family Income | 314 | $205,655 |
| Median Household Income | 400 | $150,882 |
| Mean Household Income | 400 | $181,905 |
| Income Deficit | 314 | $0 |
| Wage / Income Gap (%) | 1,020 | 61.97% |
| Wage / Income Gap ($) | 1,020 | 38.03¢ per $1 |
| Gini / Inequality Index | 1,020 | 0.42 |
Earnings by Sex in Los Olivos
Average Earnings in Los Olivos are $60,147, $91,736 for men and $34,883 for women, a difference of 62.0%.
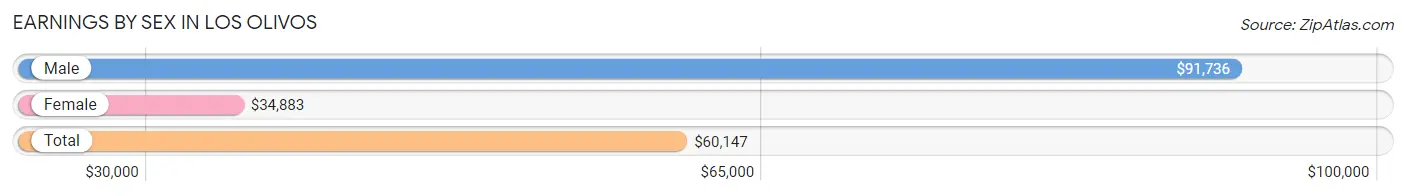
| Sex | Number | Average Earnings |
| Male | 241 (48.2%) | $91,736 |
| Female | 259 (51.8%) | $34,883 |
| Total | 500 (100.0%) | $60,147 |
Earnings by Sex by Income Bracket in Los Olivos
The most common earnings brackets in Los Olivos are $100,000+ for men (106 | 44.0%) and $30,000 to $34,999 for women (40 | 15.4%).
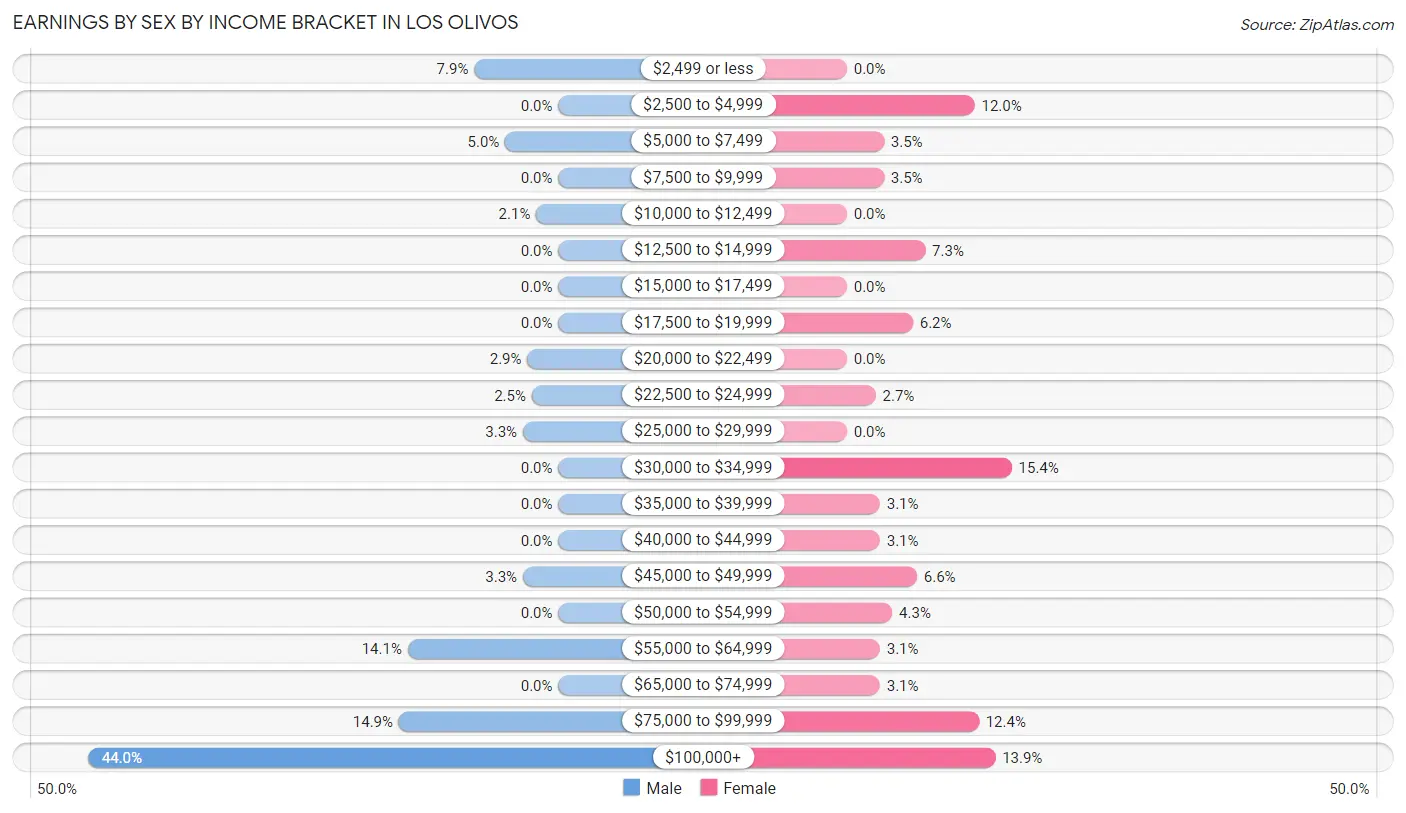
| Income | Male | Female |
| $2,499 or less | 19 (7.9%) | 0 (0.0%) |
| $2,500 to $4,999 | 0 (0.0%) | 31 (12.0%) |
| $5,000 to $7,499 | 12 (5.0%) | 9 (3.5%) |
| $7,500 to $9,999 | 0 (0.0%) | 9 (3.5%) |
| $10,000 to $12,499 | 5 (2.1%) | 0 (0.0%) |
| $12,500 to $14,999 | 0 (0.0%) | 19 (7.3%) |
| $15,000 to $17,499 | 0 (0.0%) | 0 (0.0%) |
| $17,500 to $19,999 | 0 (0.0%) | 16 (6.2%) |
| $20,000 to $22,499 | 7 (2.9%) | 0 (0.0%) |
| $22,500 to $24,999 | 6 (2.5%) | 7 (2.7%) |
| $25,000 to $29,999 | 8 (3.3%) | 0 (0.0%) |
| $30,000 to $34,999 | 0 (0.0%) | 40 (15.4%) |
| $35,000 to $39,999 | 0 (0.0%) | 8 (3.1%) |
| $40,000 to $44,999 | 0 (0.0%) | 8 (3.1%) |
| $45,000 to $49,999 | 8 (3.3%) | 17 (6.6%) |
| $50,000 to $54,999 | 0 (0.0%) | 11 (4.3%) |
| $55,000 to $64,999 | 34 (14.1%) | 8 (3.1%) |
| $65,000 to $74,999 | 0 (0.0%) | 8 (3.1%) |
| $75,000 to $99,999 | 36 (14.9%) | 32 (12.4%) |
| $100,000+ | 106 (44.0%) | 36 (13.9%) |
| Total | 241 (100.0%) | 259 (100.0%) |
Earnings by Sex by Educational Attainment in Los Olivos
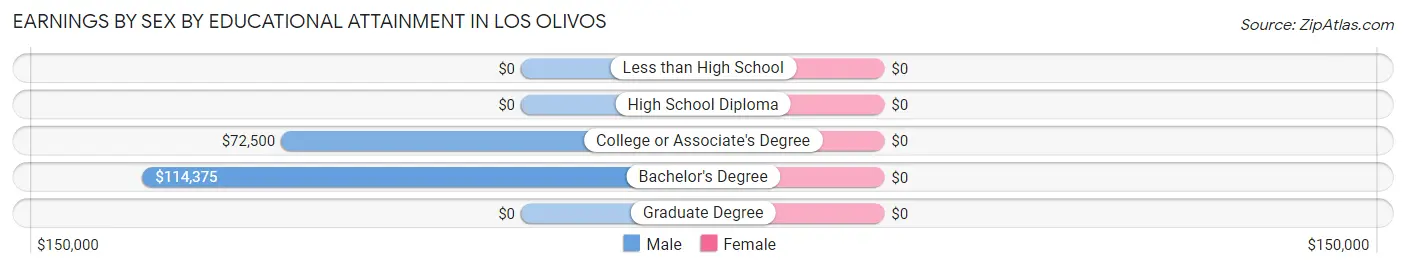
| Educational Attainment | Male Income | Female Income |
| Less than High School | - | - |
| High School Diploma | - | - |
| College or Associate's Degree | $72,500 | $0 |
| Bachelor's Degree | $114,375 | $0 |
| Graduate Degree | - | - |
| Total | $105,000 | $36,875 |
Family Income in Los Olivos
Family Income Brackets in Los Olivos
According to the Los Olivos family income data, there are 117 families falling into the $200,000+ income range, which is the most common income bracket and makes up 37.3% of all families.
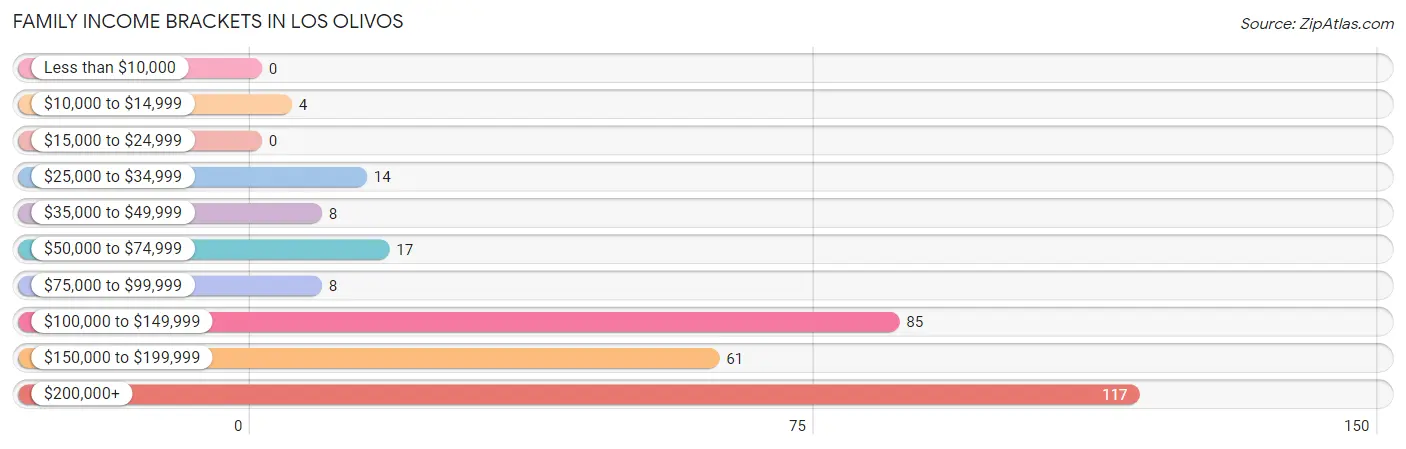
| Income Bracket | # Families | % Families |
| Less than $10,000 | 0 | 0.0% |
| $10,000 to $14,999 | 4 | 1.3% |
| $15,000 to $24,999 | 0 | 0.0% |
| $25,000 to $34,999 | 14 | 4.5% |
| $35,000 to $49,999 | 8 | 2.5% |
| $50,000 to $74,999 | 17 | 5.4% |
| $75,000 to $99,999 | 8 | 2.5% |
| $100,000 to $149,999 | 85 | 27.1% |
| $150,000 to $199,999 | 61 | 19.4% |
| $200,000+ | 117 | 37.3% |
Family Income by Famaliy Size in Los Olivos
3-person families (80 | 25.5%) account for the highest median family income in Los Olivos with $175,556 per family, while 2-person families (179 | 57.0%) have the highest median income of $75,919 per family member.
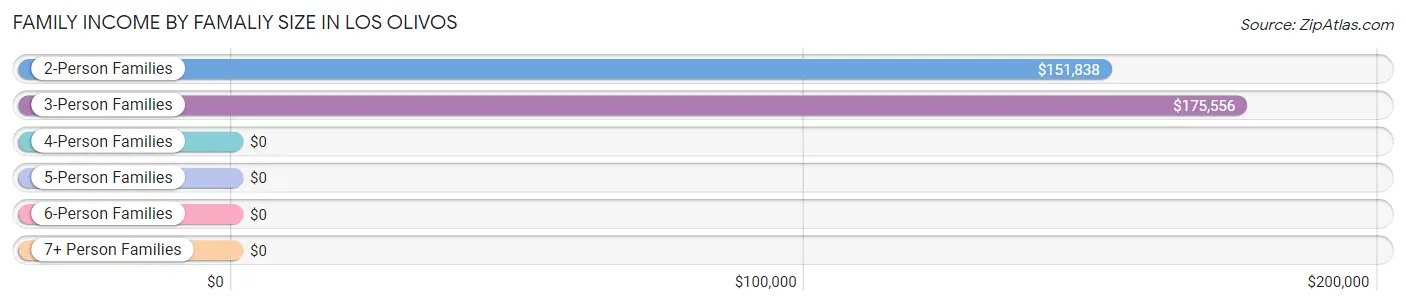
| Income Bracket | # Families | Median Income |
| 2-Person Families | 179 (57.0%) | $151,838 |
| 3-Person Families | 80 (25.5%) | $175,556 |
| 4-Person Families | 39 (12.4%) | $0 |
| 5-Person Families | 0 (0.0%) | $0 |
| 6-Person Families | 16 (5.1%) | $0 |
| 7+ Person Families | 0 (0.0%) | $0 |
| Total | 314 (100.0%) | $153,750 |
Family Income by Number of Earners in Los Olivos
The median family income in Los Olivos is $153,750, with families comprising 2 earners (96) having the highest median family income of $246,071, while families with 1 earner (116) have the lowest median family income of $101,071, accounting for 30.6% and 36.9% of families, respectively.
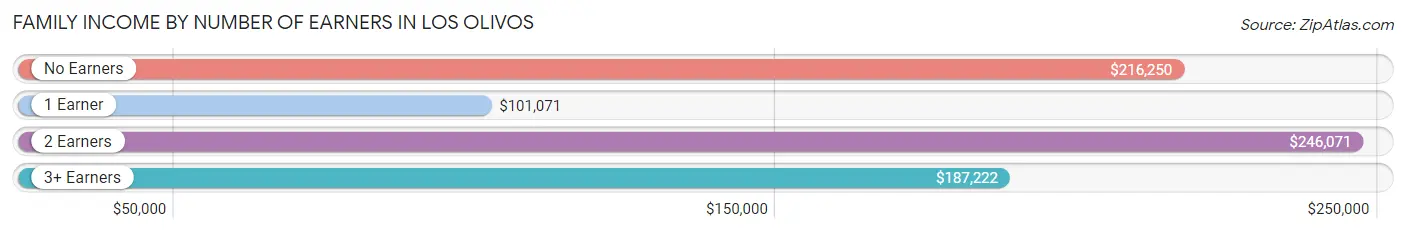
| Number of Earners | # Families | Median Income |
| No Earners | 70 (22.3%) | $216,250 |
| 1 Earner | 116 (36.9%) | $101,071 |
| 2 Earners | 96 (30.6%) | $246,071 |
| 3+ Earners | 32 (10.2%) | $187,222 |
| Total | 314 (100.0%) | $153,750 |
Household Income in Los Olivos
Household Income Brackets in Los Olivos
With 128 households falling in the category, the $200,000+ income range is the most frequent in Los Olivos, accounting for 32.0% of all households.
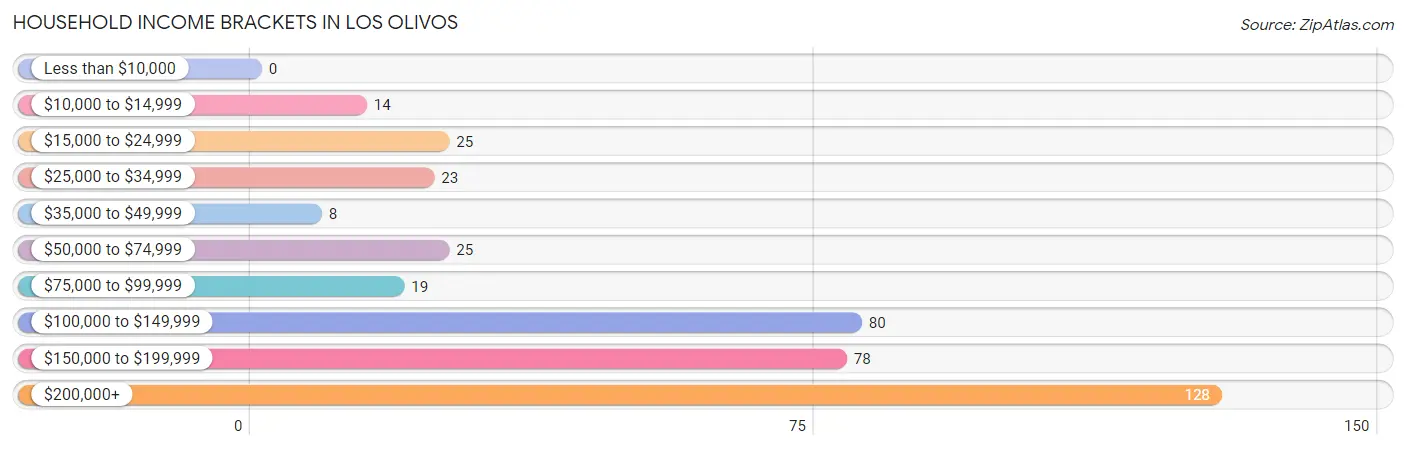
| Income Bracket | # Households | % Households |
| Less than $10,000 | 0 | 0.0% |
| $10,000 to $14,999 | 14 | 3.5% |
| $15,000 to $24,999 | 25 | 6.3% |
| $25,000 to $34,999 | 23 | 5.8% |
| $35,000 to $49,999 | 8 | 2.0% |
| $50,000 to $74,999 | 25 | 6.3% |
| $75,000 to $99,999 | 19 | 4.8% |
| $100,000 to $149,999 | 80 | 20.0% |
| $150,000 to $199,999 | 78 | 19.5% |
| $200,000+ | 128 | 32.0% |
Household Income by Householder Age in Los Olivos
The median household income in Los Olivos is $150,882, with the highest median household income of $185,833 found in the 45 to 64 years age bracket for the primary householder. A total of 172 households (43.0%) fall into this category.
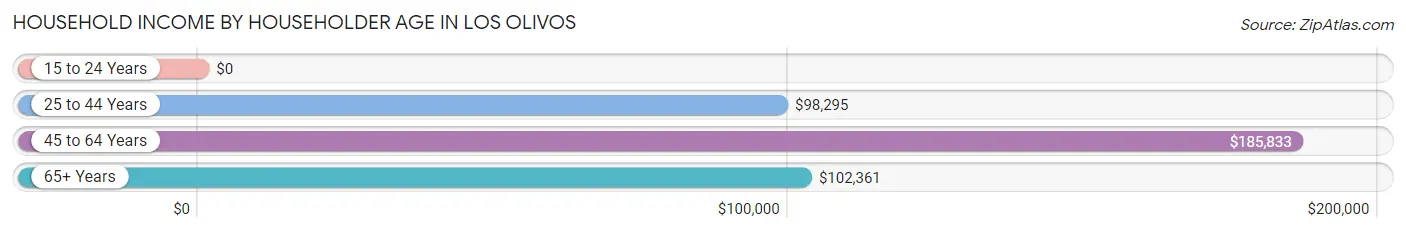
| Income Bracket | # Households | Median Income |
| 15 to 24 Years | 0 (0.0%) | $0 |
| 25 to 44 Years | 49 (12.2%) | $98,295 |
| 45 to 64 Years | 172 (43.0%) | $185,833 |
| 65+ Years | 179 (44.8%) | $102,361 |
| Total | 400 (100.0%) | $150,882 |
Poverty in Los Olivos
Income Below Poverty by Sex and Age in Los Olivos
With 9.7% poverty level for males and 5.0% for females among the residents of Los Olivos, 35 to 44 year old males and 16 and 17 year old females are the most vulnerable to poverty, with 46 males (63.9%) and 4 females (100.0%) in their respective age groups living below the poverty level.
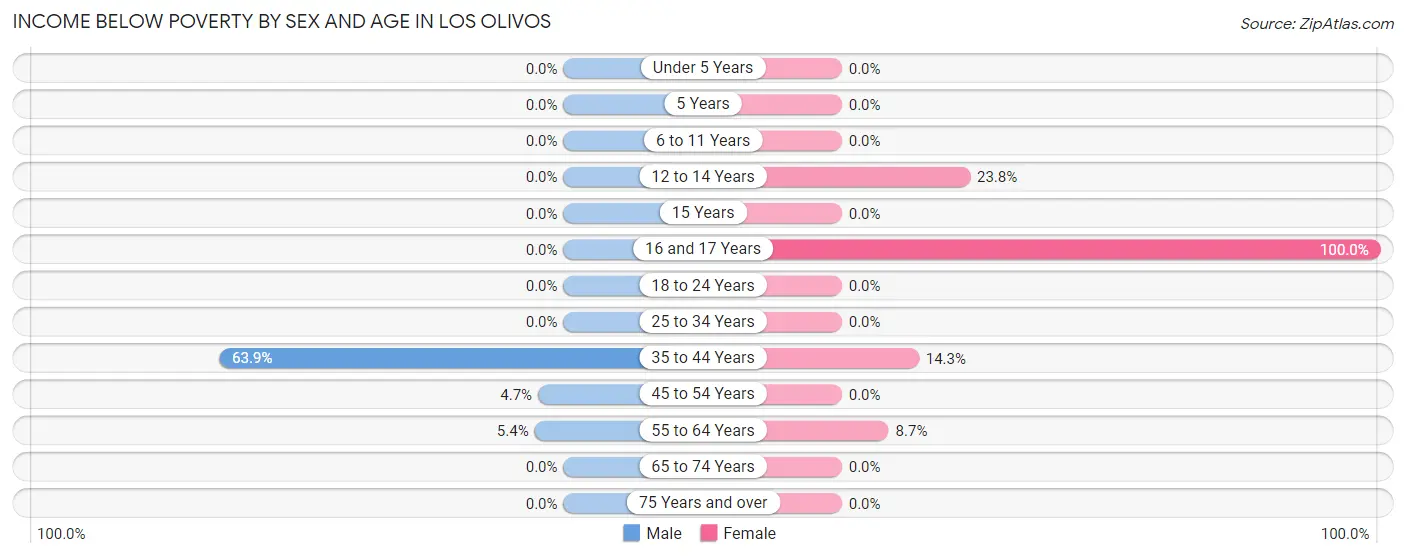
| Age Bracket | Male | Female |
| Under 5 Years | 0 (0.0%) | 0 (0.0%) |
| 5 Years | 0 (0.0%) | 0 (0.0%) |
| 6 to 11 Years | 0 (0.0%) | 0 (0.0%) |
| 12 to 14 Years | 0 (0.0%) | 5 (23.8%) |
| 15 Years | 0 (0.0%) | 0 (0.0%) |
| 16 and 17 Years | 0 (0.0%) | 4 (100.0%) |
| 18 to 24 Years | 0 (0.0%) | 0 (0.0%) |
| 25 to 34 Years | 0 (0.0%) | 0 (0.0%) |
| 35 to 44 Years | 46 (63.9%) | 4 (14.3%) |
| 45 to 54 Years | 5 (4.7%) | 0 (0.0%) |
| 55 to 64 Years | 3 (5.4%) | 10 (8.7%) |
| 65 to 74 Years | 0 (0.0%) | 0 (0.0%) |
| 75 Years and over | 0 (0.0%) | 0 (0.0%) |
| Total | 54 (9.7%) | 23 (5.0%) |
Income Above Poverty by Sex and Age in Los Olivos
According to the poverty statistics in Los Olivos, males aged under 5 years and females aged under 5 years are the age groups that are most secure financially, with 100.0% of males and 100.0% of females in these age groups living above the poverty line.
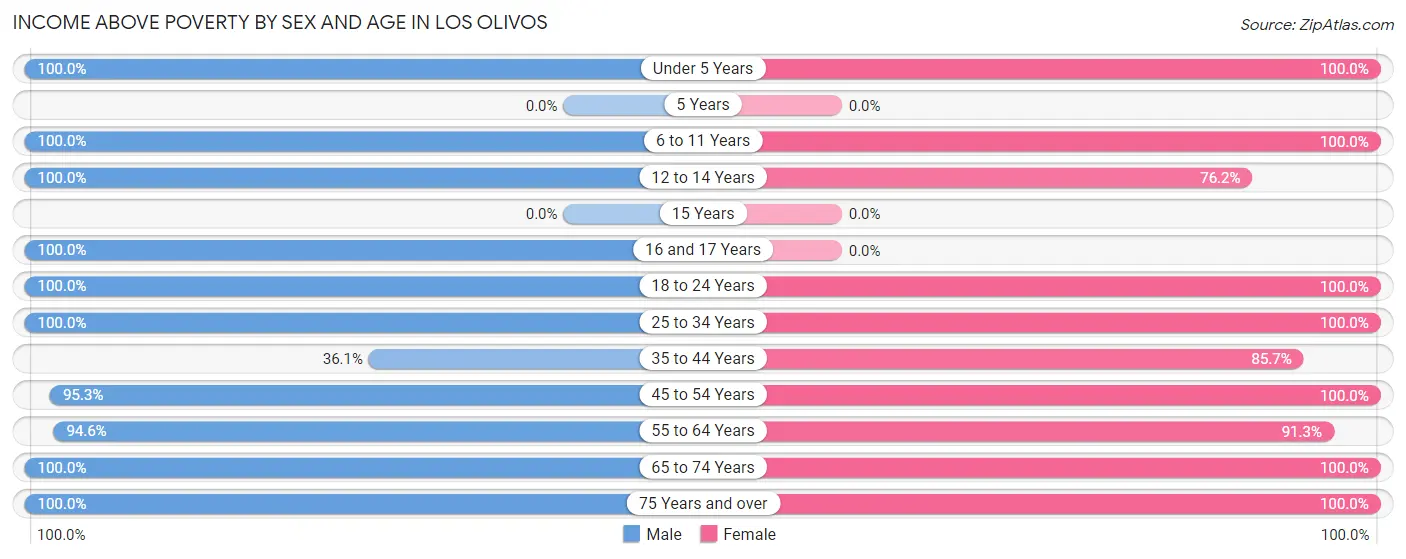
| Age Bracket | Male | Female |
| Under 5 Years | 13 (100.0%) | 3 (100.0%) |
| 5 Years | 0 (0.0%) | 0 (0.0%) |
| 6 to 11 Years | 42 (100.0%) | 26 (100.0%) |
| 12 to 14 Years | 15 (100.0%) | 16 (76.2%) |
| 15 Years | 0 (0.0%) | 0 (0.0%) |
| 16 and 17 Years | 26 (100.0%) | 0 (0.0%) |
| 18 to 24 Years | 29 (100.0%) | 15 (100.0%) |
| 25 to 34 Years | 48 (100.0%) | 19 (100.0%) |
| 35 to 44 Years | 26 (36.1%) | 24 (85.7%) |
| 45 to 54 Years | 101 (95.3%) | 67 (100.0%) |
| 55 to 64 Years | 53 (94.6%) | 105 (91.3%) |
| 65 to 74 Years | 74 (100.0%) | 114 (100.0%) |
| 75 Years and over | 76 (100.0%) | 50 (100.0%) |
| Total | 503 (90.3%) | 439 (95.0%) |
Income Below Poverty Among Married-Couple Families in Los Olivos
The poverty statistics for married-couple families in Los Olivos show that 1.4% or 4 of the total 282 families live below the poverty line. Families with 1 or 2 children have the highest poverty rate of 7.1%, comprising of 4 families. On the other hand, families with no children have the lowest poverty rate of 0.0%, which includes 0 families.
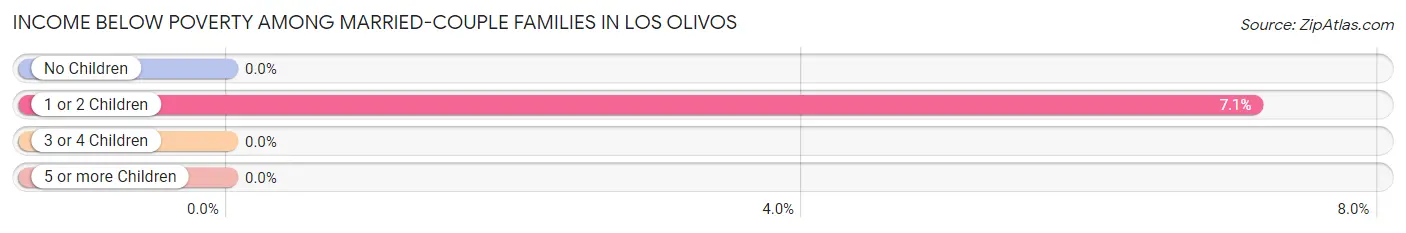
| Children | Above Poverty | Below Poverty |
| No Children | 210 (100.0%) | 0 (0.0%) |
| 1 or 2 Children | 52 (92.9%) | 4 (7.1%) |
| 3 or 4 Children | 16 (100.0%) | 0 (0.0%) |
| 5 or more Children | 0 (0.0%) | 0 (0.0%) |
| Total | 278 (98.6%) | 4 (1.4%) |
Income Below Poverty Among Single-Parent Households in Los Olivos
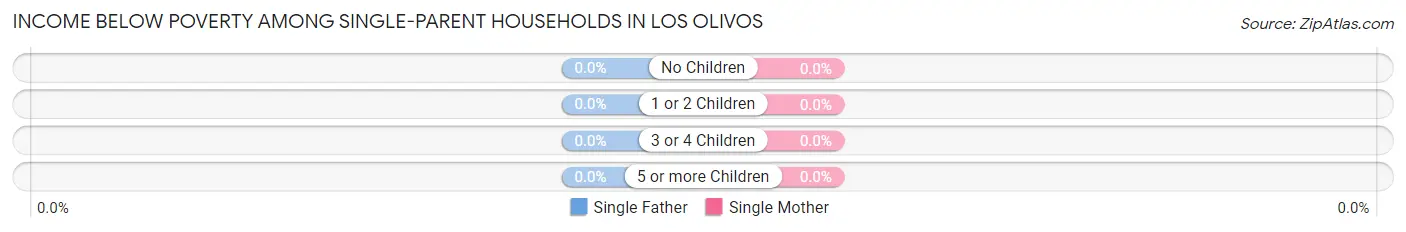
| Children | Single Father | Single Mother |
| No Children | 0 (0.0%) | 0 (0.0%) |
| 1 or 2 Children | 0 (0.0%) | 0 (0.0%) |
| 3 or 4 Children | 0 (0.0%) | 0 (0.0%) |
| 5 or more Children | 0 (0.0%) | 0 (0.0%) |
| Total | 0 (0.0%) | 0 (0.0%) |
Income Below Poverty Among Married-Couple vs Single-Parent Households in Los Olivos
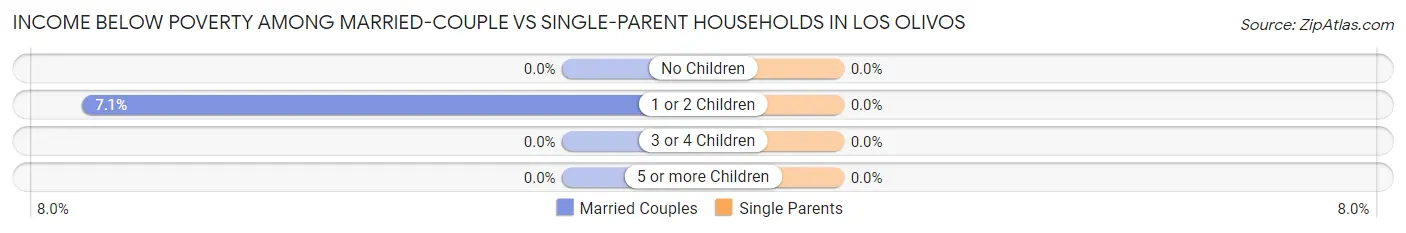
| Children | Married-Couple Families | Single-Parent Households |
| No Children | 0 (0.0%) | 0 (0.0%) |
| 1 or 2 Children | 4 (7.1%) | 0 (0.0%) |
| 3 or 4 Children | 0 (0.0%) | 0 (0.0%) |
| 5 or more Children | 0 (0.0%) | 0 (0.0%) |
| Total | 4 (1.4%) | 0 (0.0%) |
Race in Los Olivos
The most populous races in Los Olivos are White / Caucasian (949 | 93.0%), Hispanic or Latino (154 | 15.1%), and Two or more Races (39 | 3.8%).
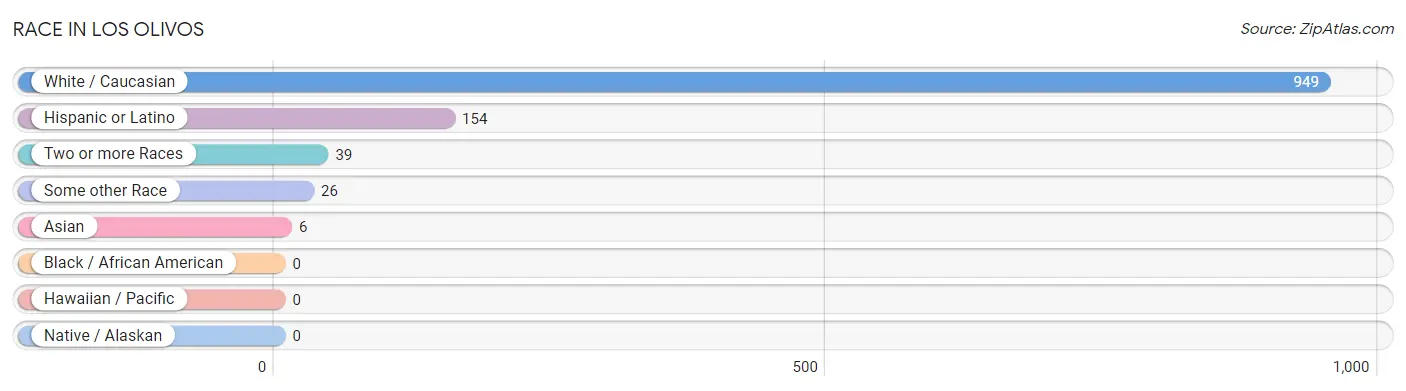
| Race | # Population | % Population |
| Asian | 6 | 0.6% |
| Black / African American | 0 | 0.0% |
| Hawaiian / Pacific | 0 | 0.0% |
| Hispanic or Latino | 154 | 15.1% |
| Native / Alaskan | 0 | 0.0% |
| White / Caucasian | 949 | 93.0% |
| Two or more Races | 39 | 3.8% |
| Some other Race | 26 | 2.5% |
| Total | 1,020 | 100.0% |
Ancestry in Los Olivos
The most populous ancestries reported in Los Olivos are Irish (296 | 29.0%), German (247 | 24.2%), English (182 | 17.8%), Mexican (142 | 13.9%), and Scandinavian (37 | 3.6%), together accounting for 88.6% of all Los Olivos residents.
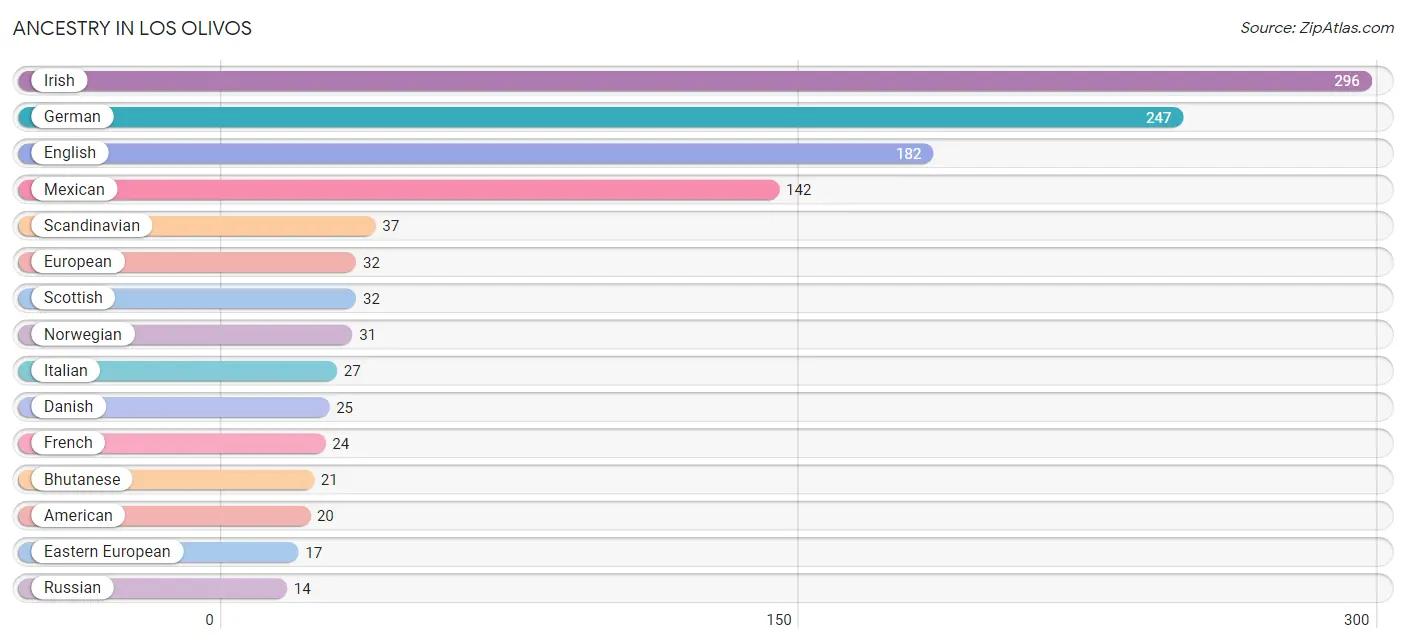
| Ancestry | # Population | % Population |
| African | 10 | 1.0% |
| American | 20 | 2.0% |
| Austrian | 8 | 0.8% |
| Bhutanese | 21 | 2.1% |
| Central American | 12 | 1.2% |
| Danish | 25 | 2.5% |
| Dutch | 13 | 1.3% |
| Eastern European | 17 | 1.7% |
| English | 182 | 17.8% |
| Estonian | 8 | 0.8% |
| European | 32 | 3.1% |
| French | 24 | 2.4% |
| German | 247 | 24.2% |
| Greek | 3 | 0.3% |
| Guatemalan | 7 | 0.7% |
| Irish | 296 | 29.0% |
| Italian | 27 | 2.6% |
| Mexican | 142 | 13.9% |
| Nicaraguan | 5 | 0.5% |
| Norwegian | 31 | 3.0% |
| Polish | 9 | 0.9% |
| Russian | 14 | 1.4% |
| Scandinavian | 37 | 3.6% |
| Scottish | 32 | 3.1% |
| Subsaharan African | 10 | 1.0% |
| Swiss | 2 | 0.2% |
| Ukrainian | 10 | 1.0% | View All 27 Rows |
Immigrants in Los Olivos
The most numerous immigrant groups reported in Los Olivos came from Europe (29 | 2.8%), Western Europe (29 | 2.8%), Central America (28 | 2.8%), Latin America (28 | 2.8%), and Mexico (21 | 2.1%), together accounting for 13.2% of all Los Olivos residents.
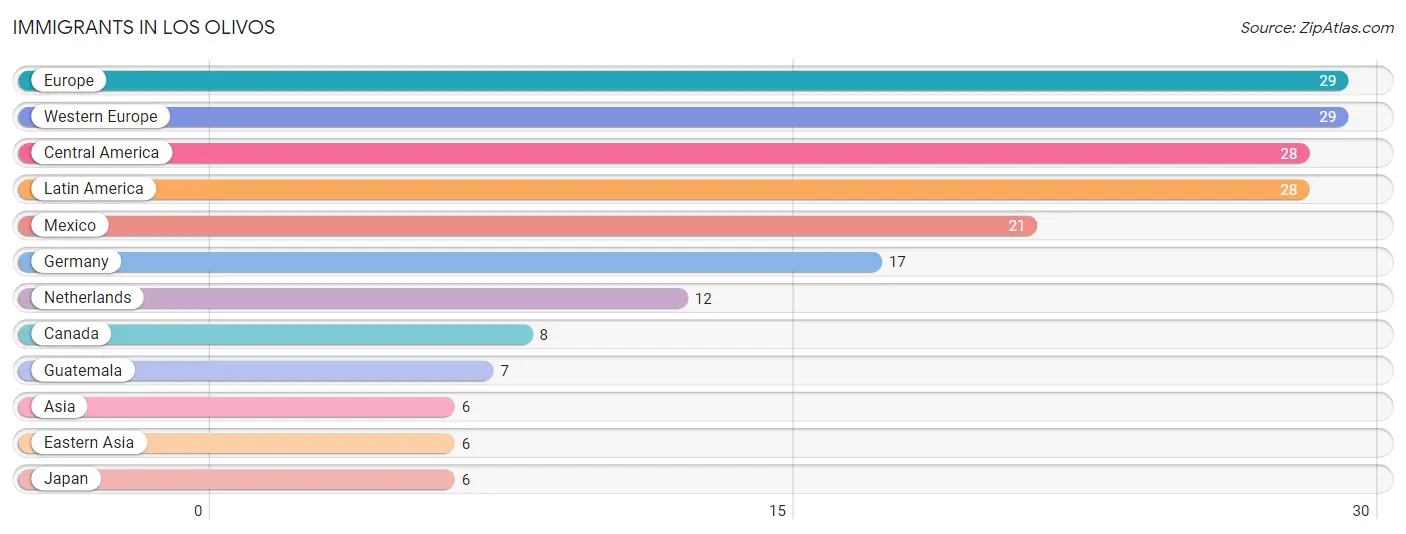
| Immigration Origin | # Population | % Population |
| Asia | 6 | 0.6% |
| Canada | 8 | 0.8% |
| Central America | 28 | 2.8% |
| Eastern Asia | 6 | 0.6% |
| Europe | 29 | 2.8% |
| Germany | 17 | 1.7% |
| Guatemala | 7 | 0.7% |
| Japan | 6 | 0.6% |
| Latin America | 28 | 2.8% |
| Mexico | 21 | 2.1% |
| Netherlands | 12 | 1.2% |
| Western Europe | 29 | 2.8% | View All 12 Rows |
Sex and Age in Los Olivos
Sex and Age in Los Olivos
The most populous age groups in Los Olivos are 50 to 54 Years (80 | 14.4%) for men and 70 to 74 Years (83 | 17.9%) for women.
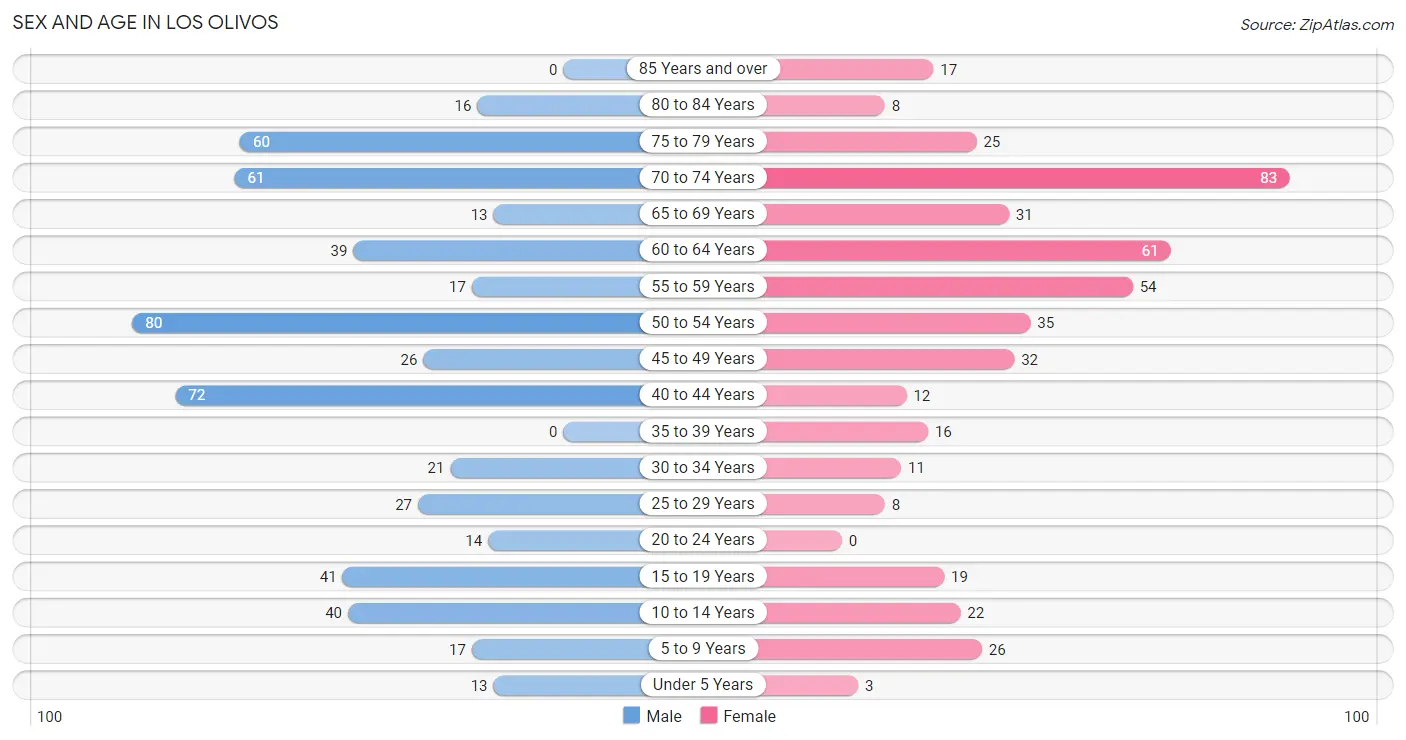
| Age Bracket | Male | Female |
| Under 5 Years | 13 (2.3%) | 3 (0.6%) |
| 5 to 9 Years | 17 (3.0%) | 26 (5.6%) |
| 10 to 14 Years | 40 (7.2%) | 22 (4.8%) |
| 15 to 19 Years | 41 (7.4%) | 19 (4.1%) |
| 20 to 24 Years | 14 (2.5%) | 0 (0.0%) |
| 25 to 29 Years | 27 (4.9%) | 8 (1.7%) |
| 30 to 34 Years | 21 (3.8%) | 11 (2.4%) |
| 35 to 39 Years | 0 (0.0%) | 16 (3.5%) |
| 40 to 44 Years | 72 (12.9%) | 12 (2.6%) |
| 45 to 49 Years | 26 (4.7%) | 32 (6.9%) |
| 50 to 54 Years | 80 (14.4%) | 35 (7.6%) |
| 55 to 59 Years | 17 (3.0%) | 54 (11.7%) |
| 60 to 64 Years | 39 (7.0%) | 61 (13.2%) |
| 65 to 69 Years | 13 (2.3%) | 31 (6.7%) |
| 70 to 74 Years | 61 (11.0%) | 83 (17.9%) |
| 75 to 79 Years | 60 (10.8%) | 25 (5.4%) |
| 80 to 84 Years | 16 (2.9%) | 8 (1.7%) |
| 85 Years and over | 0 (0.0%) | 17 (3.7%) |
| Total | 557 (100.0%) | 463 (100.0%) |
Families and Households in Los Olivos
Median Family Size in Los Olivos
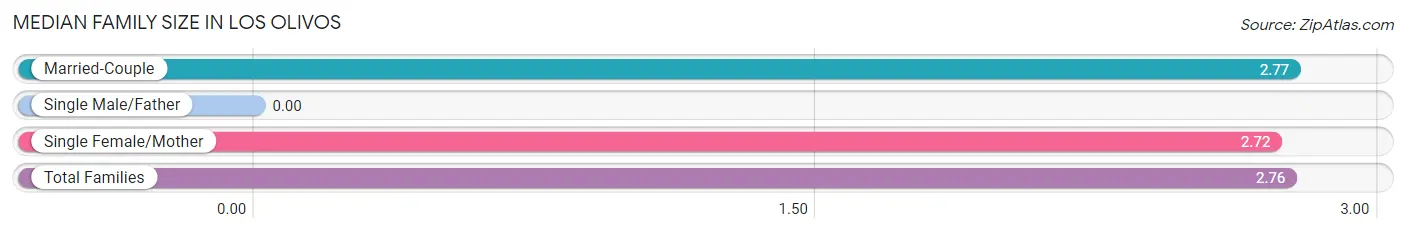
| Family Type | # Families | Family Size |
| Married-Couple | 282 (89.8%) | 2.77 |
| Single Male/Father | 0 (0.0%) | - |
| Single Female/Mother | 32 (10.2%) | 2.72 |
| Total Families | 314 (100.0%) | 2.76 |
Median Household Size in Los Olivos
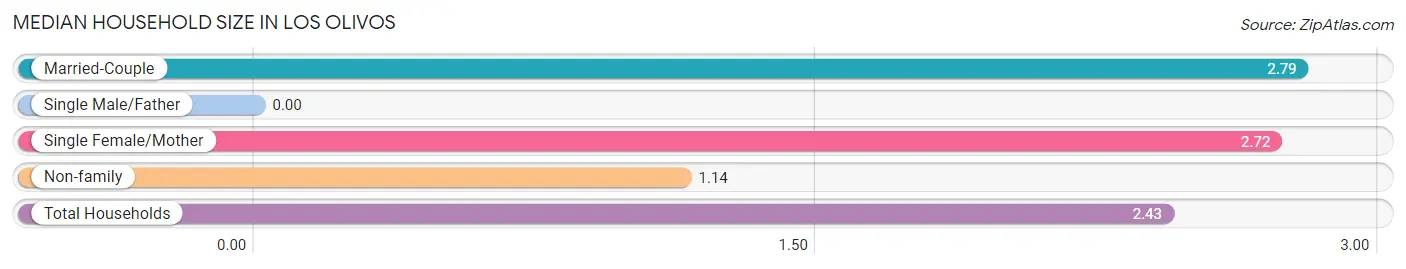
| Household Type | # Households | Household Size |
| Married-Couple | 282 (70.5%) | 2.79 |
| Single Male/Father | 0 (0.0%) | - |
| Single Female/Mother | 32 (8.0%) | 2.72 |
| Non-family | 86 (21.5%) | 1.14 |
| Total Households | 400 (100.0%) | 2.43 |
Household Size by Marriage Status in Los Olivos
Out of a total of 400 households in Los Olivos, 314 (78.5%) are family households, while 86 (21.5%) are nonfamily households. The most numerous type of family households are 2-person households, comprising 179, and the most common type of nonfamily households are 1-person households, comprising 72.
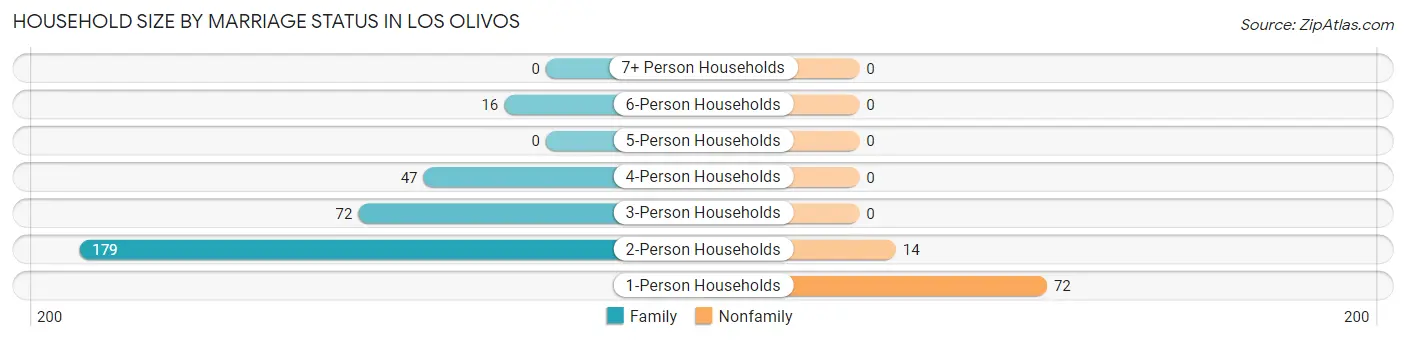
| Household Size | Family Households | Nonfamily Households |
| 1-Person Households | - | 72 (18.0%) |
| 2-Person Households | 179 (44.8%) | 14 (3.5%) |
| 3-Person Households | 72 (18.0%) | 0 (0.0%) |
| 4-Person Households | 47 (11.7%) | 0 (0.0%) |
| 5-Person Households | 0 (0.0%) | 0 (0.0%) |
| 6-Person Households | 16 (4.0%) | 0 (0.0%) |
| 7+ Person Households | 0 (0.0%) | 0 (0.0%) |
| Total | 314 (78.5%) | 86 (21.5%) |
Female Fertility in Los Olivos
Fertility by Age in Los Olivos
| Age Bracket | Women with Births | Births / 1,000 Women |
| 15 to 19 years | 0 (0.0%) | 0.0 |
| 20 to 34 years | 0 (0.0%) | 0.0 |
| 35 to 50 years | 0 (0.0%) | 0.0 |
| Total | 0 (0.0%) | 0.0 |
Fertility by Age by Marriage Status in Los Olivos
| Age Bracket | Married | Unmarried |
| 15 to 19 years | 0 (0.0%) | 0 (0.0%) |
| 20 to 34 years | 0 (0.0%) | 0 (0.0%) |
| 35 to 50 years | 0 (0.0%) | 0 (0.0%) |
| Total | 0 (0.0%) | 0 (0.0%) |
Fertility by Education in Los Olivos
| Educational Attainment | Women with Births | Births / 1,000 Women |
| Less than High School | 0 (0.0%) | 0.0 |
| High School Diploma | 0 (0.0%) | 0.0 |
| College or Associate's Degree | 0 (0.0%) | 0.0 |
| Bachelor's Degree | 0 (0.0%) | 0.0 |
| Graduate Degree | 0 (0.0%) | 0.0 |
| Total | 0 (0.0%) | 0.0 |
Fertility by Education by Marriage Status in Los Olivos
| Educational Attainment | Married | Unmarried |
| Less than High School | 0 (0.0%) | 0 (0.0%) |
| High School Diploma | 0 (0.0%) | 0 (0.0%) |
| College or Associate's Degree | 0 (0.0%) | 0 (0.0%) |
| Bachelor's Degree | 0 (0.0%) | 0 (0.0%) |
| Graduate Degree | 0 (0.0%) | 0 (0.0%) |
| Total | 0 (0.0%) | 0 (0.0%) |
Employment Characteristics in Los Olivos
Employment by Class of Employer in Los Olivos
Among the 419 employed individuals in Los Olivos, private company employees (212 | 50.6%), self-employed (not incorporated) (77 | 18.4%), and self-employed (incorporated) (45 | 10.7%) make up the most common classes of employment.
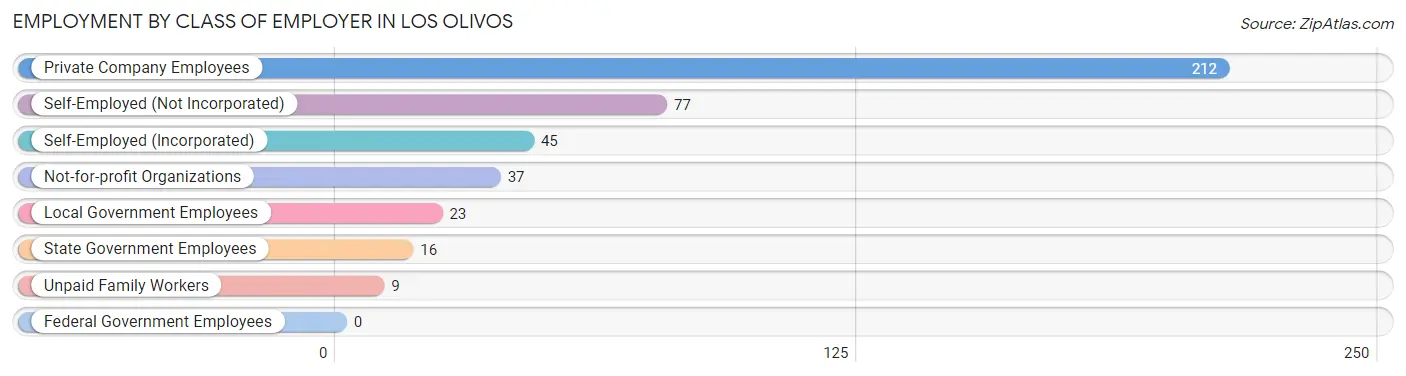
| Employer Class | # Employees | % Employees |
| Private Company Employees | 212 | 50.6% |
| Self-Employed (Incorporated) | 45 | 10.7% |
| Self-Employed (Not Incorporated) | 77 | 18.4% |
| Not-for-profit Organizations | 37 | 8.8% |
| Local Government Employees | 23 | 5.5% |
| State Government Employees | 16 | 3.8% |
| Federal Government Employees | 0 | 0.0% |
| Unpaid Family Workers | 9 | 2.1% |
| Total | 419 | 100.0% |
Employment Status by Age in Los Olivos
According to the labor force statistics for Los Olivos, out of the total population over 16 years of age (899), 52.1% or 468 individuals are in the labor force, with 9.0% or 42 of them unemployed. The age group with the highest labor force participation rate is 20 to 24 years, with 100.0% or 14 individuals in the labor force. Within the labor force, the 20 to 24 years age range has the highest percentage of unemployed individuals, with 100.0% or 14 of them being unemployed.
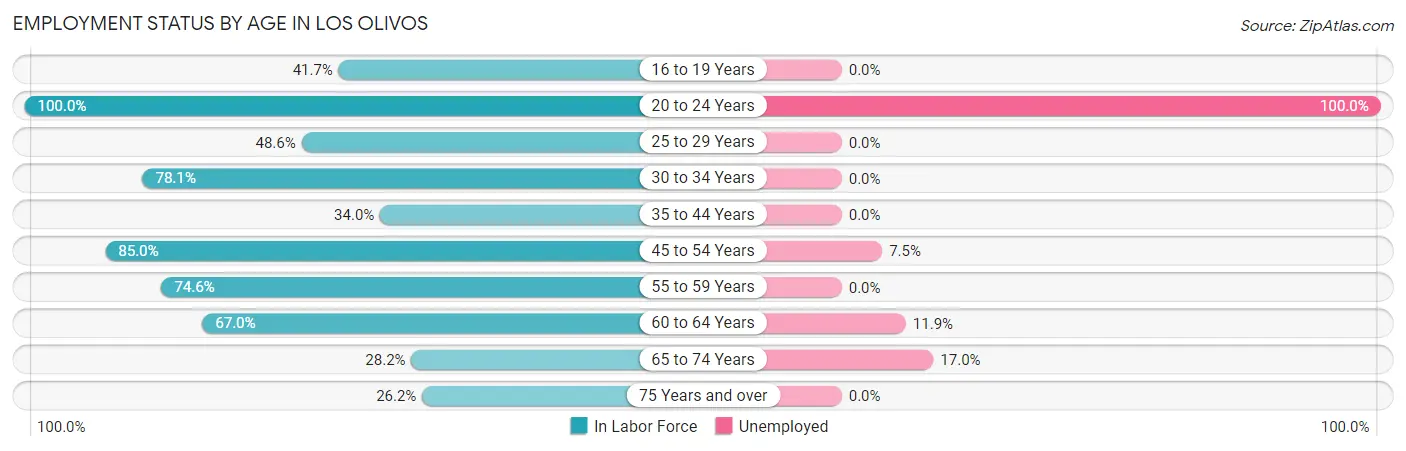
| Age Bracket | In Labor Force | Unemployed |
| 16 to 19 Years | 25 (41.7%) | 0 (0.0%) |
| 20 to 24 Years | 14 (100.0%) | 14 (100.0%) |
| 25 to 29 Years | 17 (48.6%) | 0 (0.0%) |
| 30 to 34 Years | 25 (78.1%) | 0 (0.0%) |
| 35 to 44 Years | 34 (34.0%) | 0 (0.0%) |
| 45 to 54 Years | 147 (85.0%) | 11 (7.5%) |
| 55 to 59 Years | 53 (74.6%) | 0 (0.0%) |
| 60 to 64 Years | 67 (67.0%) | 8 (11.9%) |
| 65 to 74 Years | 53 (28.2%) | 9 (17.0%) |
| 75 Years and over | 33 (26.2%) | 0 (0.0%) |
| Total | 468 (52.1%) | 42 (9.0%) |
Employment Status by Educational Attainment in Los Olivos
According to labor force statistics for Los Olivos, 67.1% of individuals (343) out of the total population between 25 and 64 years of age (511) are in the labor force, with 5.5% or 19 of them being unemployed. The group with the highest labor force participation rate are those with the educational attainment of college / associate degree, with 79.5% or 70 individuals in the labor force. Within the labor force, individuals with bachelor's degree or higher education have the highest percentage of unemployment, with 8.5% or 19 of them being unemployed.
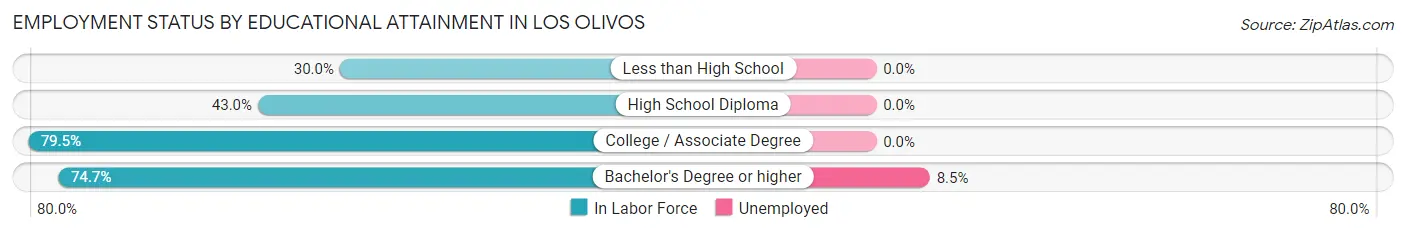
| Educational Attainment | In Labor Force | Unemployed |
| Less than High School | 9 (30.0%) | 0 (0.0%) |
| High School Diploma | 40 (43.0%) | 0 (0.0%) |
| College / Associate Degree | 70 (79.5%) | 0 (0.0%) |
| Bachelor's Degree or higher | 224 (74.7%) | 26 (8.5%) |
| Total | 343 (67.1%) | 28 (5.5%) |
Employment Occupations by Sex in Los Olivos
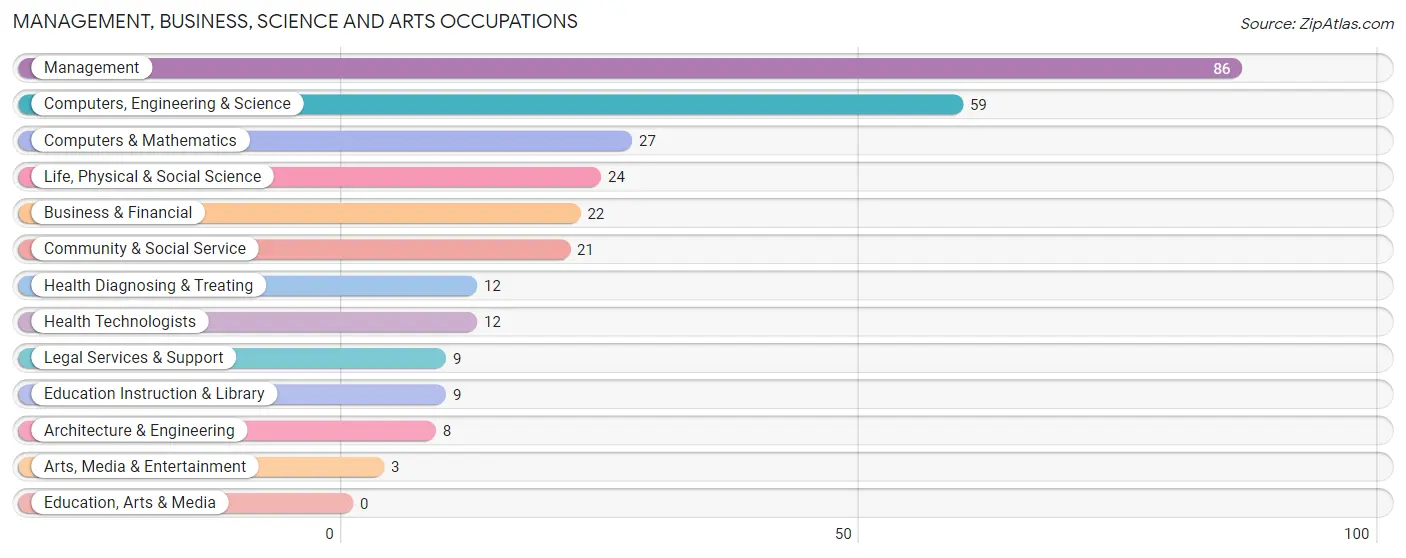
Management, Business, Science and Arts Occupations
The most common Management, Business, Science and Arts occupations in Los Olivos are Management (86 | 20.2%), Computers, Engineering & Science (59 | 13.9%), Computers & Mathematics (27 | 6.3%), Life, Physical & Social Science (24 | 5.6%), and Business & Financial (22 | 5.2%).
Management, Business, Science and Arts Occupations by Sex
Within the Management, Business, Science and Arts occupations in Los Olivos, the most male-oriented occupations are Computers & Mathematics (100.0%), Legal Services & Support (100.0%), and Computers, Engineering & Science (59.3%), while the most female-oriented occupations are Architecture & Engineering (100.0%), Education Instruction & Library (100.0%), and Arts, Media & Entertainment (100.0%).
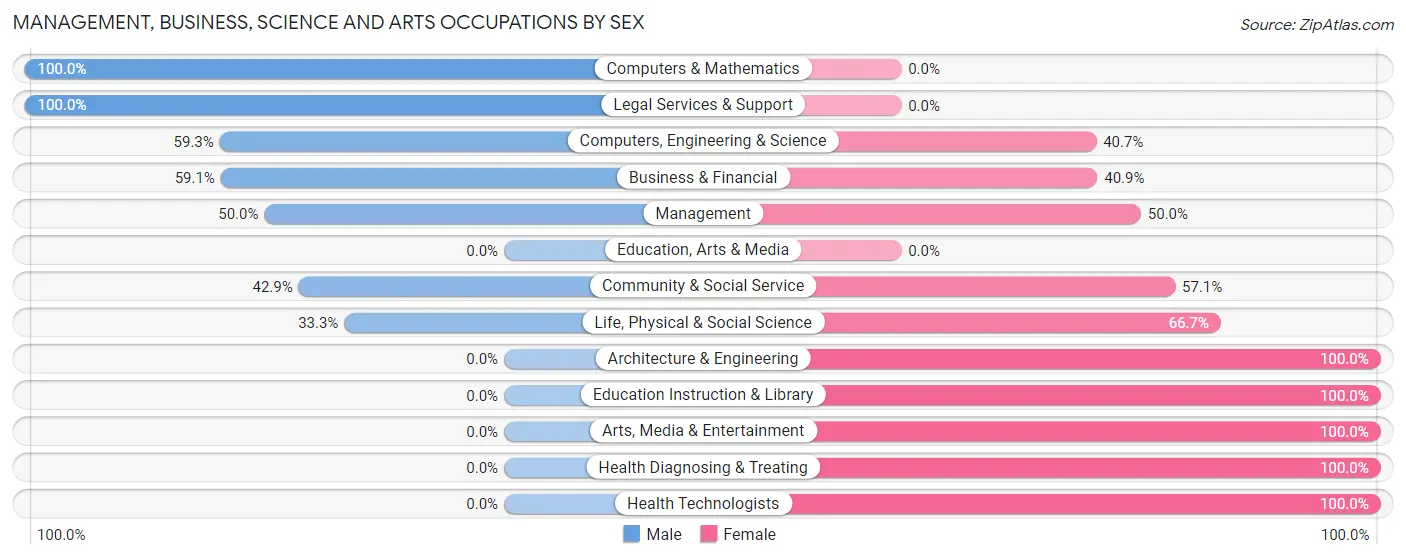
| Occupation | Male | Female |
| Management | 43 (50.0%) | 43 (50.0%) |
| Business & Financial | 13 (59.1%) | 9 (40.9%) |
| Computers, Engineering & Science | 35 (59.3%) | 24 (40.7%) |
| Computers & Mathematics | 27 (100.0%) | 0 (0.0%) |
| Architecture & Engineering | 0 (0.0%) | 8 (100.0%) |
| Life, Physical & Social Science | 8 (33.3%) | 16 (66.7%) |
| Community & Social Service | 9 (42.9%) | 12 (57.1%) |
| Education, Arts & Media | 0 (0.0%) | 0 (0.0%) |
| Legal Services & Support | 9 (100.0%) | 0 (0.0%) |
| Education Instruction & Library | 0 (0.0%) | 9 (100.0%) |
| Arts, Media & Entertainment | 0 (0.0%) | 3 (100.0%) |
| Health Diagnosing & Treating | 0 (0.0%) | 12 (100.0%) |
| Health Technologists | 0 (0.0%) | 12 (100.0%) |
| Total (Category) | 100 (50.0%) | 100 (50.0%) |
| Total (Overall) | 204 (47.9%) | 222 (52.1%) |
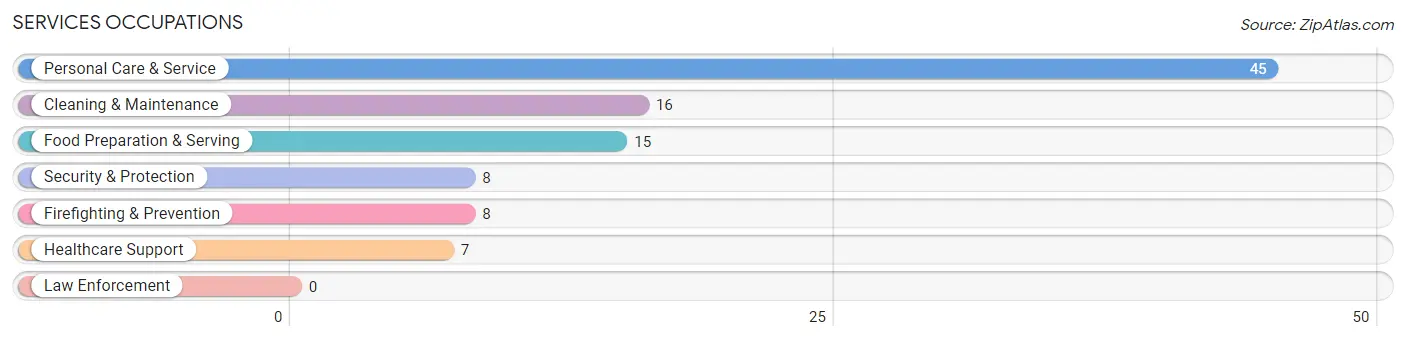
Services Occupations
The most common Services occupations in Los Olivos are Personal Care & Service (45 | 10.6%), Cleaning & Maintenance (16 | 3.8%), Food Preparation & Serving (15 | 3.5%), Security & Protection (8 | 1.9%), and Firefighting & Prevention (8 | 1.9%).
Services Occupations by Sex
Within the Services occupations in Los Olivos, the most male-oriented occupations are Security & Protection (100.0%), Firefighting & Prevention (100.0%), and Cleaning & Maintenance (56.2%), while the most female-oriented occupations are Healthcare Support (100.0%), Personal Care & Service (60.0%), and Food Preparation & Serving (53.3%).
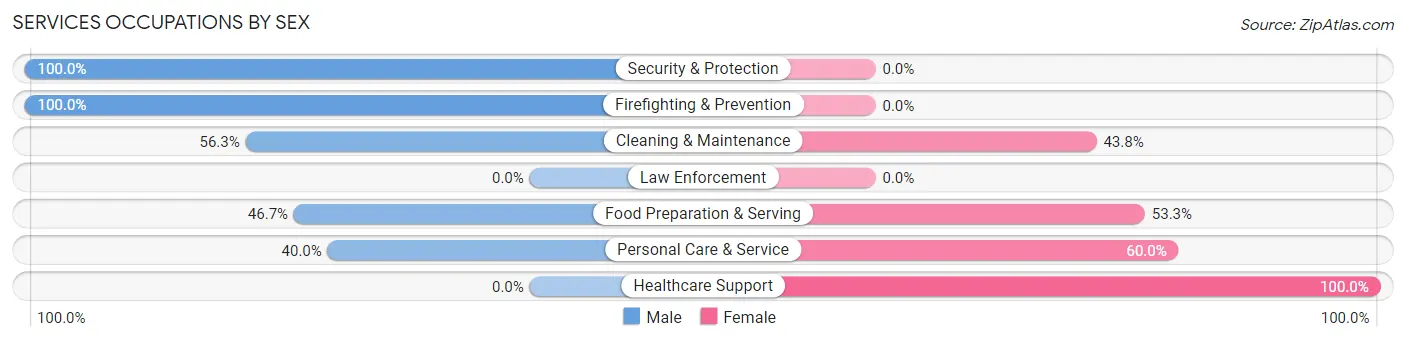
| Occupation | Male | Female |
| Healthcare Support | 0 (0.0%) | 7 (100.0%) |
| Security & Protection | 8 (100.0%) | 0 (0.0%) |
| Firefighting & Prevention | 8 (100.0%) | 0 (0.0%) |
| Law Enforcement | 0 (0.0%) | 0 (0.0%) |
| Food Preparation & Serving | 7 (46.7%) | 8 (53.3%) |
| Cleaning & Maintenance | 9 (56.2%) | 7 (43.8%) |
| Personal Care & Service | 18 (40.0%) | 27 (60.0%) |
| Total (Category) | 42 (46.2%) | 49 (53.8%) |
| Total (Overall) | 204 (47.9%) | 222 (52.1%) |
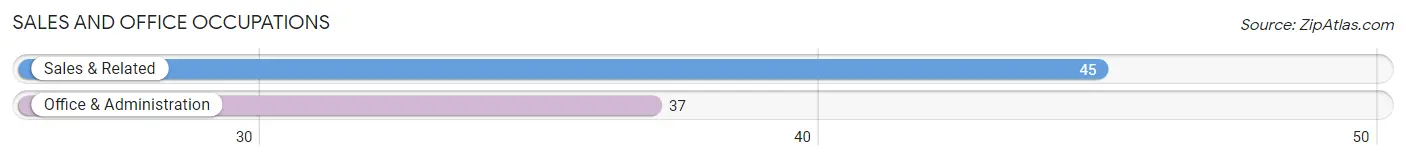
Sales and Office Occupations
The most common Sales and Office occupations in Los Olivos are Sales & Related (45 | 10.6%), and Office & Administration (37 | 8.7%).
Sales and Office Occupations by Sex
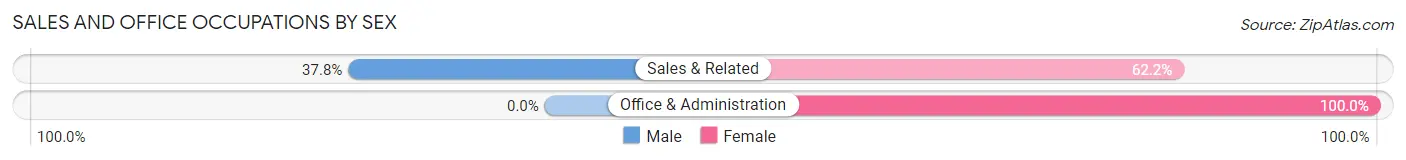
| Occupation | Male | Female |
| Sales & Related | 17 (37.8%) | 28 (62.2%) |
| Office & Administration | 0 (0.0%) | 37 (100.0%) |
| Total (Category) | 17 (20.7%) | 65 (79.3%) |
| Total (Overall) | 204 (47.9%) | 222 (52.1%) |
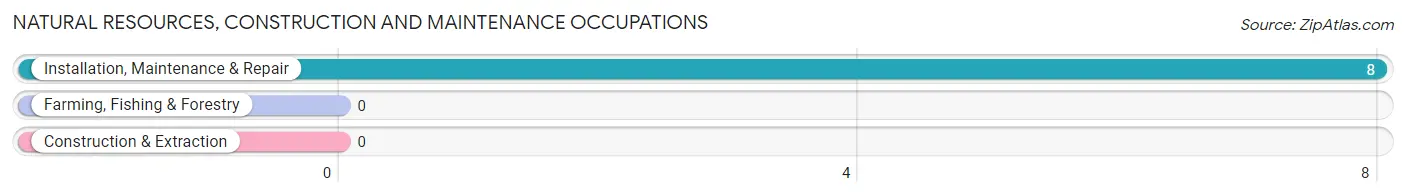
Natural Resources, Construction and Maintenance Occupations
The most common Natural Resources, Construction and Maintenance occupations in Los Olivos are , and Installation, Maintenance & Repair (8 | 1.9%).
Natural Resources, Construction and Maintenance Occupations by Sex
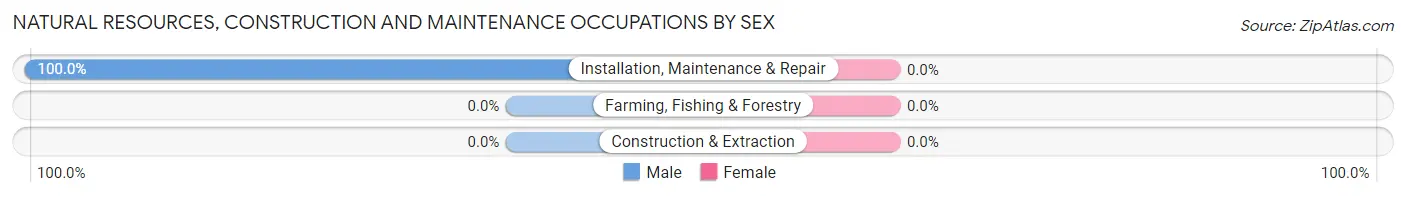
| Occupation | Male | Female |
| Farming, Fishing & Forestry | 0 (0.0%) | 0 (0.0%) |
| Construction & Extraction | 0 (0.0%) | 0 (0.0%) |
| Installation, Maintenance & Repair | 8 (100.0%) | 0 (0.0%) |
| Total (Category) | 8 (100.0%) | 0 (0.0%) |
| Total (Overall) | 204 (47.9%) | 222 (52.1%) |
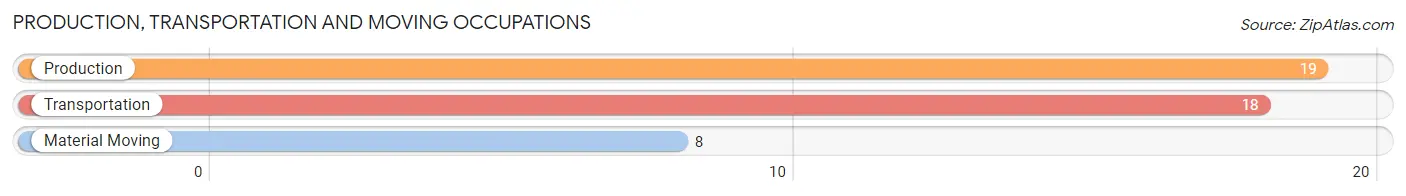
Production, Transportation and Moving Occupations
The most common Production, Transportation and Moving occupations in Los Olivos are Production (19 | 4.5%), Transportation (18 | 4.2%), and Material Moving (8 | 1.9%).
Production, Transportation and Moving Occupations by Sex
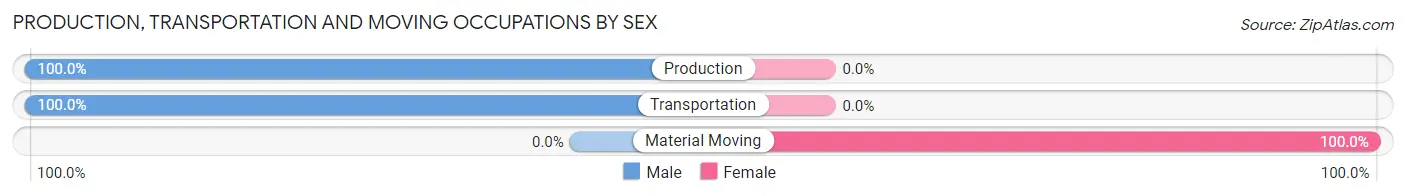
| Occupation | Male | Female |
| Production | 19 (100.0%) | 0 (0.0%) |
| Transportation | 18 (100.0%) | 0 (0.0%) |
| Material Moving | 0 (0.0%) | 8 (100.0%) |
| Total (Category) | 37 (82.2%) | 8 (17.8%) |
| Total (Overall) | 204 (47.9%) | 222 (52.1%) |
Employment Industries by Sex in Los Olivos
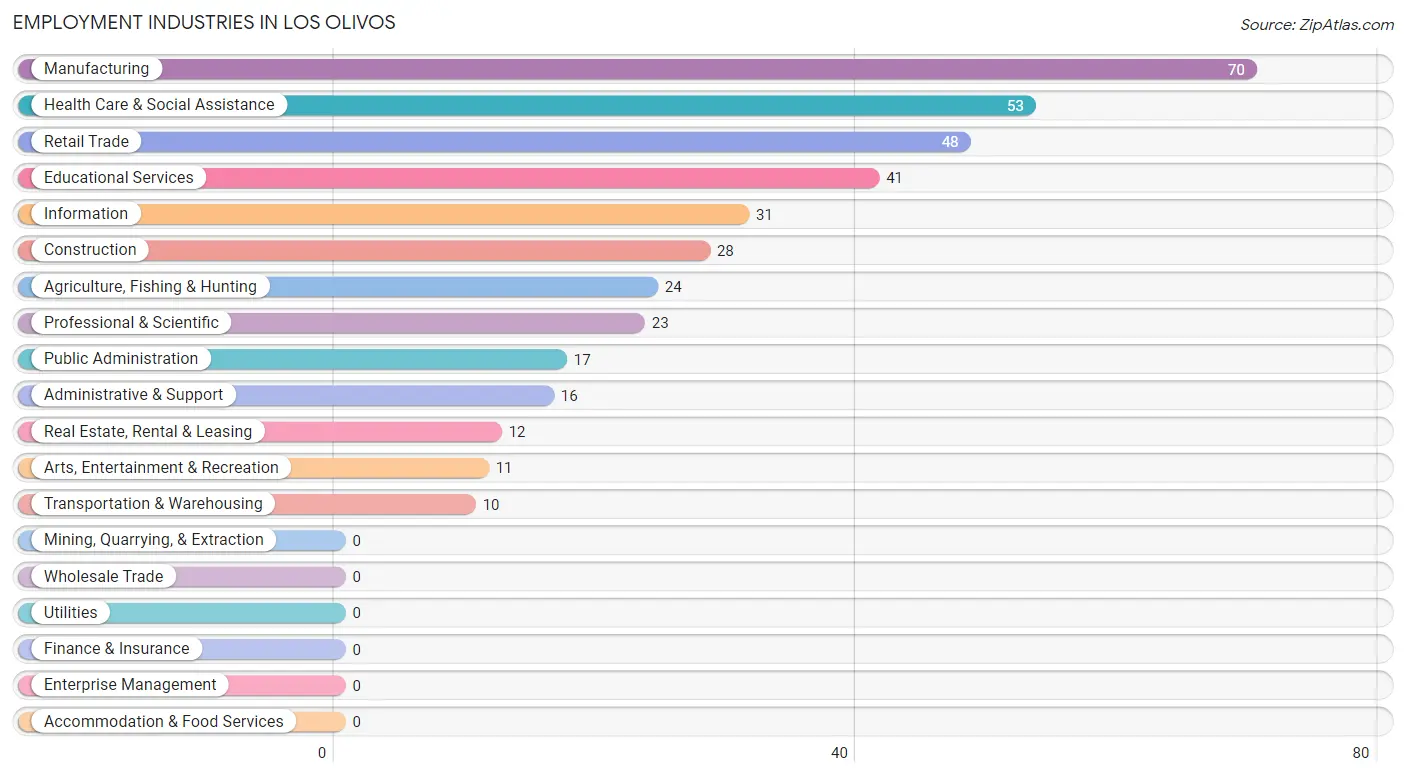
Employment Industries in Los Olivos
The major employment industries in Los Olivos include Manufacturing (70 | 16.4%), Health Care & Social Assistance (53 | 12.4%), Retail Trade (48 | 11.3%), Educational Services (41 | 9.6%), and Information (31 | 7.3%).
Employment Industries by Sex in Los Olivos
The Los Olivos industries that see more men than women are Construction (100.0%), Transportation & Warehousing (100.0%), and Administrative & Support (100.0%), whereas the industries that tend to have a higher number of women are Real Estate, Rental & Leasing (100.0%), Arts, Entertainment & Recreation (100.0%), and Professional & Scientific (87.0%).
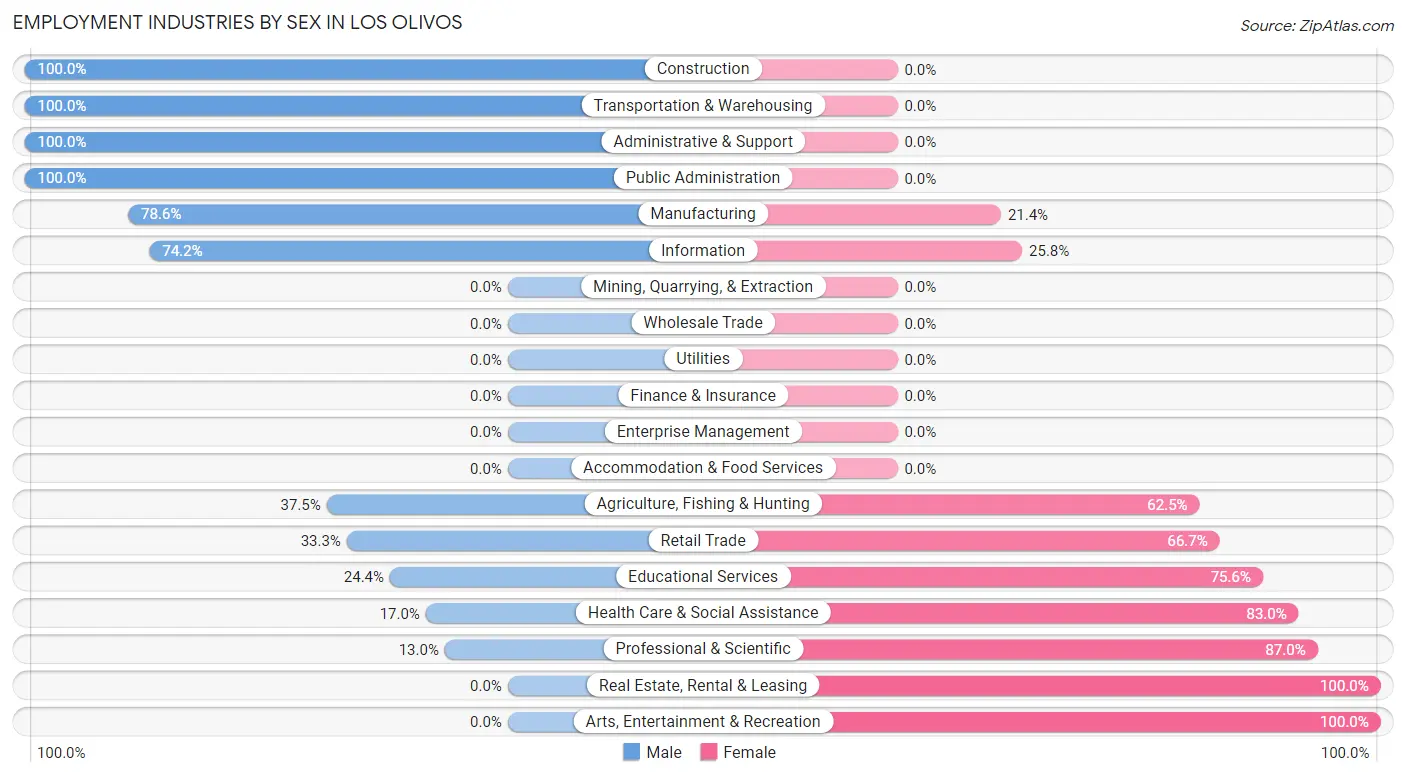
| Industry | Male | Female |
| Agriculture, Fishing & Hunting | 9 (37.5%) | 15 (62.5%) |
| Mining, Quarrying, & Extraction | 0 (0.0%) | 0 (0.0%) |
| Construction | 28 (100.0%) | 0 (0.0%) |
| Manufacturing | 55 (78.6%) | 15 (21.4%) |
| Wholesale Trade | 0 (0.0%) | 0 (0.0%) |
| Retail Trade | 16 (33.3%) | 32 (66.7%) |
| Transportation & Warehousing | 10 (100.0%) | 0 (0.0%) |
| Utilities | 0 (0.0%) | 0 (0.0%) |
| Information | 23 (74.2%) | 8 (25.8%) |
| Finance & Insurance | 0 (0.0%) | 0 (0.0%) |
| Real Estate, Rental & Leasing | 0 (0.0%) | 12 (100.0%) |
| Professional & Scientific | 3 (13.0%) | 20 (87.0%) |
| Enterprise Management | 0 (0.0%) | 0 (0.0%) |
| Administrative & Support | 16 (100.0%) | 0 (0.0%) |
| Educational Services | 10 (24.4%) | 31 (75.6%) |
| Health Care & Social Assistance | 9 (17.0%) | 44 (83.0%) |
| Arts, Entertainment & Recreation | 0 (0.0%) | 11 (100.0%) |
| Accommodation & Food Services | 0 (0.0%) | 0 (0.0%) |
| Public Administration | 17 (100.0%) | 0 (0.0%) |
| Total | 204 (47.9%) | 222 (52.1%) |
Education in Los Olivos
School Enrollment in Los Olivos
The most common levels of schooling among the 185 students in Los Olivos are college / undergraduate (51 | 27.6%), middle school (47 | 25.4%), and high school (37 | 20.0%).
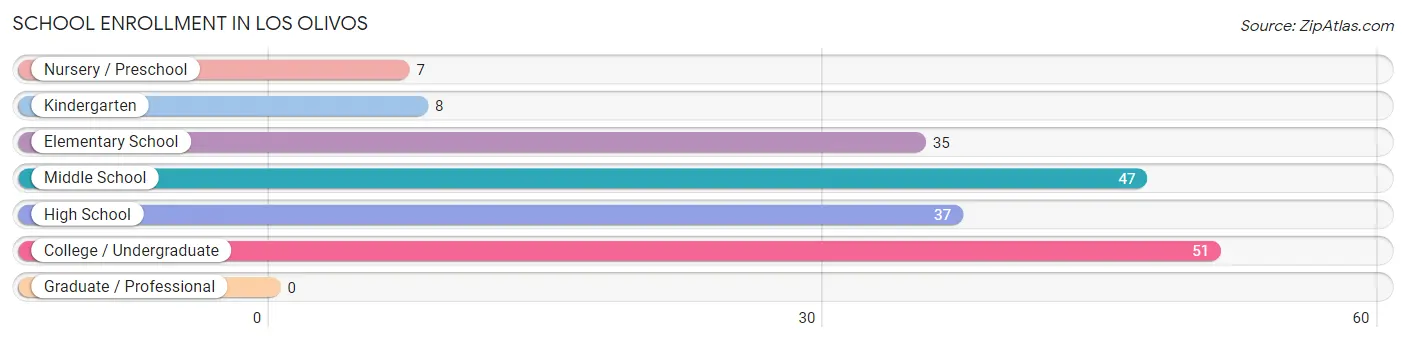
| School Level | # Students | % Students |
| Nursery / Preschool | 7 | 3.8% |
| Kindergarten | 8 | 4.3% |
| Elementary School | 35 | 18.9% |
| Middle School | 47 | 25.4% |
| High School | 37 | 20.0% |
| College / Undergraduate | 51 | 27.6% |
| Graduate / Professional | 0 | 0.0% |
| Total | 185 | 100.0% |
School Enrollment by Age by Funding Source in Los Olivos
Out of a total of 185 students who are enrolled in schools in Los Olivos, 30 (16.2%) attend a private institution, while the remaining 155 (83.8%) are enrolled in public schools. The age group of 3 to 4 year olds has the highest likelihood of being enrolled in private schools, with 7 (100.0% in the age bracket) enrolled. Conversely, the age group of 5 to 9 year old has the lowest likelihood of being enrolled in a private school, with 34 (100.0% in the age bracket) attending a public institution.
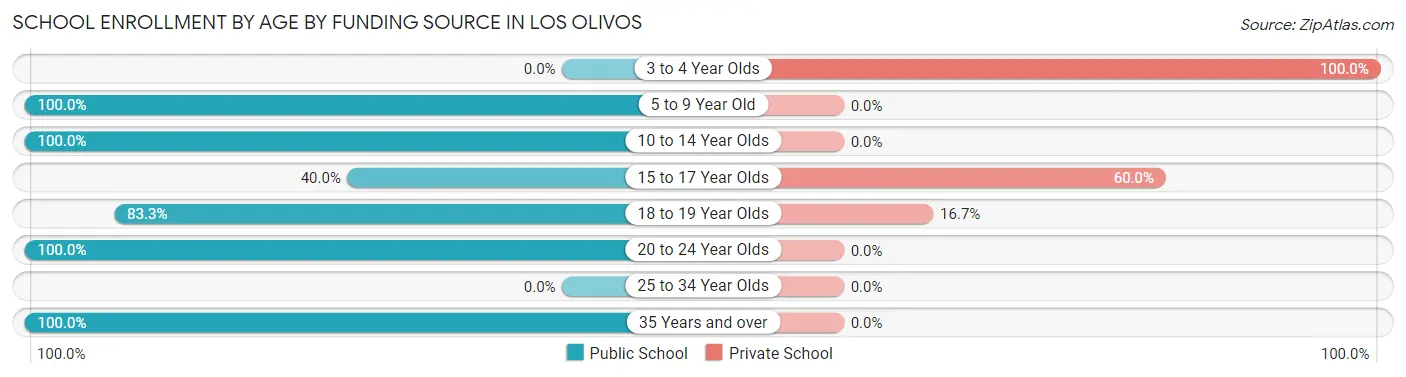
| Age Bracket | Public School | Private School |
| 3 to 4 Year Olds | 0 (0.0%) | 7 (100.0%) |
| 5 to 9 Year Old | 34 (100.0%) | 0 (0.0%) |
| 10 to 14 Year Olds | 62 (100.0%) | 0 (0.0%) |
| 15 to 17 Year Olds | 12 (40.0%) | 18 (60.0%) |
| 18 to 19 Year Olds | 25 (83.3%) | 5 (16.7%) |
| 20 to 24 Year Olds | 14 (100.0%) | 0 (0.0%) |
| 25 to 34 Year Olds | 0 (0.0%) | 0 (0.0%) |
| 35 Years and over | 8 (100.0%) | 0 (0.0%) |
| Total | 155 (83.8%) | 30 (16.2%) |
Educational Attainment by Field of Study in Los Olivos
Science & technology (68 | 13.4%), visual & performing arts (64 | 12.7%), liberal arts & history (59 | 11.7%), business (58 | 11.5%), and bio, nature & agricultural (39 | 7.7%) are the most common fields of study among 506 individuals in Los Olivos who have obtained a bachelor's degree or higher.
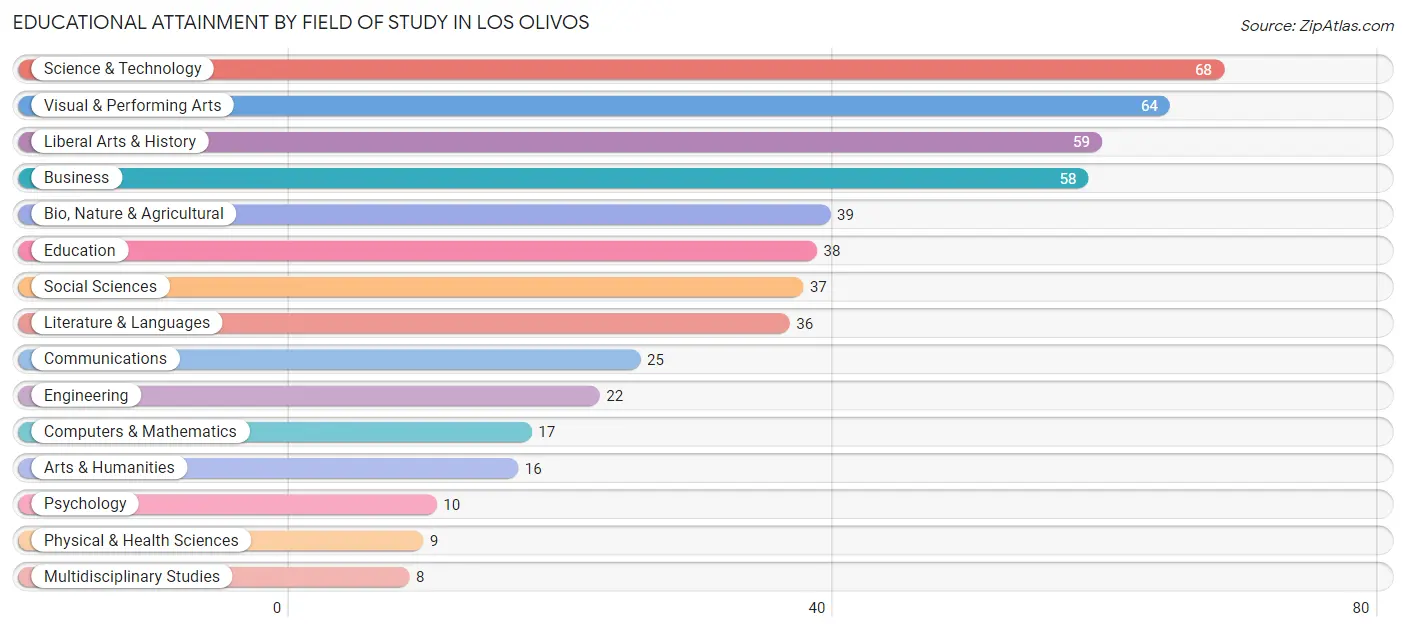
| Field of Study | # Graduates | % Graduates |
| Computers & Mathematics | 17 | 3.4% |
| Bio, Nature & Agricultural | 39 | 7.7% |
| Physical & Health Sciences | 9 | 1.8% |
| Psychology | 10 | 2.0% |
| Social Sciences | 37 | 7.3% |
| Engineering | 22 | 4.3% |
| Multidisciplinary Studies | 8 | 1.6% |
| Science & Technology | 68 | 13.4% |
| Business | 58 | 11.5% |
| Education | 38 | 7.5% |
| Literature & Languages | 36 | 7.1% |
| Liberal Arts & History | 59 | 11.7% |
| Visual & Performing Arts | 64 | 12.7% |
| Communications | 25 | 4.9% |
| Arts & Humanities | 16 | 3.2% |
| Total | 506 | 100.0% |
Transportation & Commute in Los Olivos
Vehicle Availability by Sex in Los Olivos
The most prevalent vehicle ownership categories in Los Olivos are males with 2 vehicles (69, accounting for 33.8%) and females with 2 vehicles (73, making up 32.1%).
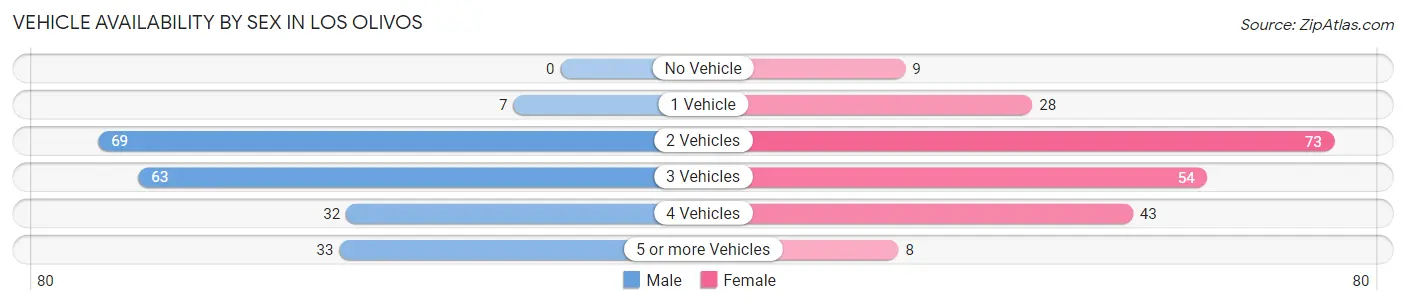
| Vehicles Available | Male | Female |
| No Vehicle | 0 (0.0%) | 9 (4.2%) |
| 1 Vehicle | 7 (3.4%) | 28 (13.0%) |
| 2 Vehicles | 69 (33.8%) | 73 (34.0%) |
| 3 Vehicles | 63 (30.9%) | 54 (25.1%) |
| 4 Vehicles | 32 (15.7%) | 43 (20.0%) |
| 5 or more Vehicles | 33 (16.2%) | 8 (3.7%) |
| Total | 204 (100.0%) | 215 (100.0%) |
Commute Time in Los Olivos
The most frequently occuring commute durations in Los Olivos are 10 to 14 minutes (77 commuters, 23.3%), 15 to 19 minutes (50 commuters, 15.1%), and 5 to 9 minutes (43 commuters, 13.0%).
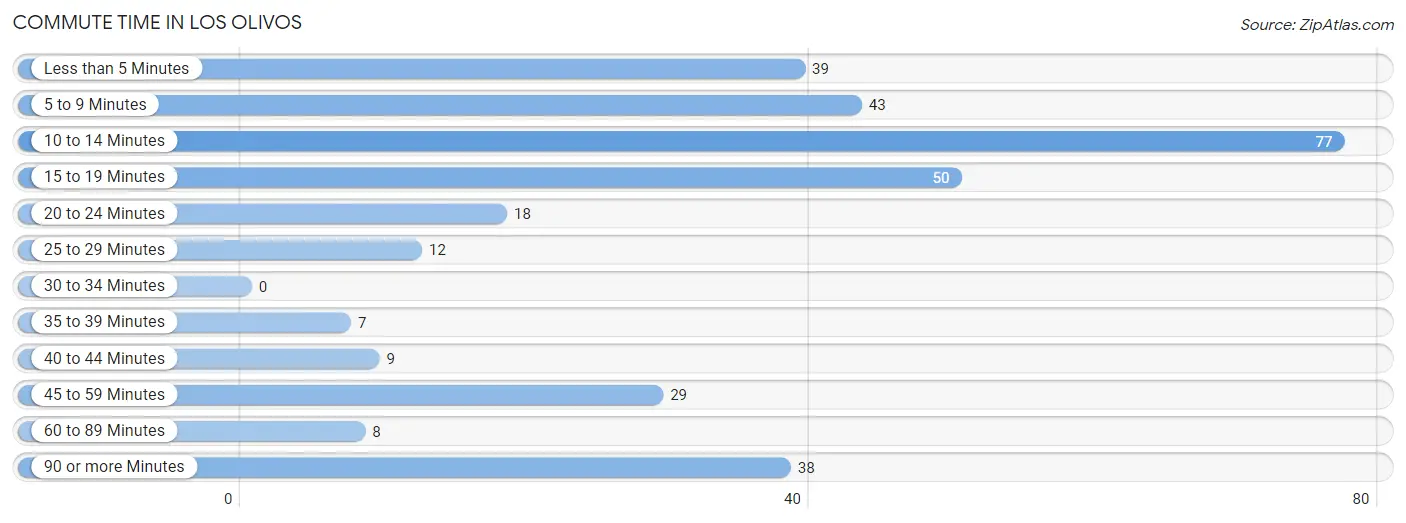
| Commute Time | # Commuters | % Commuters |
| Less than 5 Minutes | 39 | 11.8% |
| 5 to 9 Minutes | 43 | 13.0% |
| 10 to 14 Minutes | 77 | 23.3% |
| 15 to 19 Minutes | 50 | 15.1% |
| 20 to 24 Minutes | 18 | 5.4% |
| 25 to 29 Minutes | 12 | 3.6% |
| 30 to 34 Minutes | 0 | 0.0% |
| 35 to 39 Minutes | 7 | 2.1% |
| 40 to 44 Minutes | 9 | 2.7% |
| 45 to 59 Minutes | 29 | 8.8% |
| 60 to 89 Minutes | 8 | 2.4% |
| 90 or more Minutes | 38 | 11.5% |
Commute Time by Sex in Los Olivos
The most common commute times in Los Olivos are 10 to 14 minutes (37 commuters, 20.7%) for males and 10 to 14 minutes (40 commuters, 26.5%) for females.
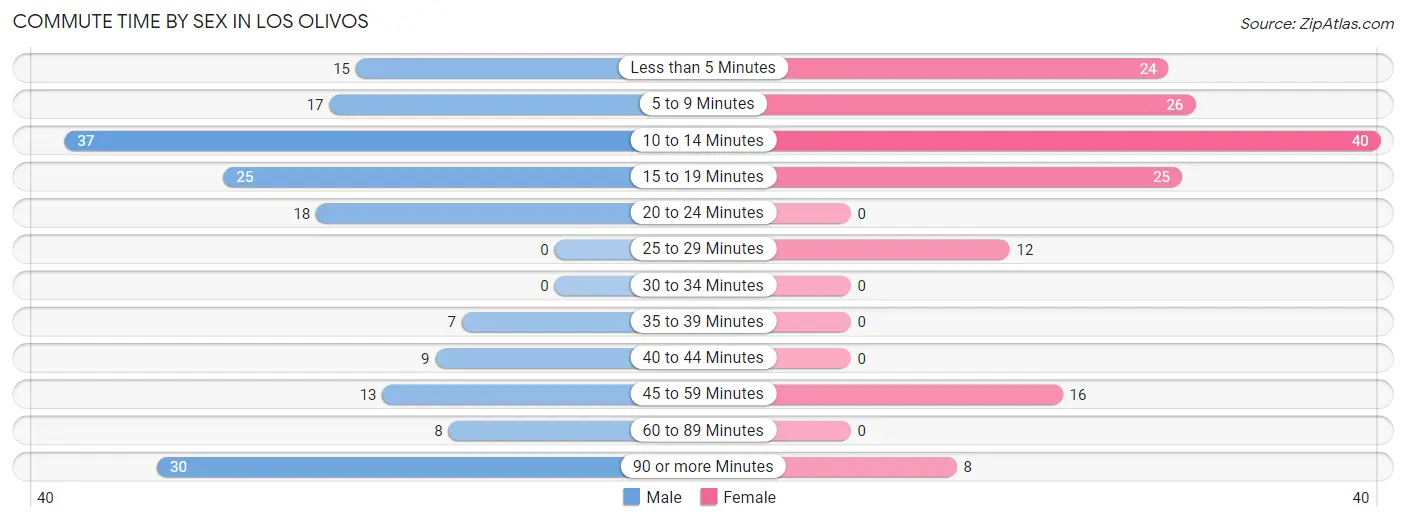
| Commute Time | Male | Female |
| Less than 5 Minutes | 15 (8.4%) | 24 (15.9%) |
| 5 to 9 Minutes | 17 (9.5%) | 26 (17.2%) |
| 10 to 14 Minutes | 37 (20.7%) | 40 (26.5%) |
| 15 to 19 Minutes | 25 (14.0%) | 25 (16.6%) |
| 20 to 24 Minutes | 18 (10.1%) | 0 (0.0%) |
| 25 to 29 Minutes | 0 (0.0%) | 12 (8.0%) |
| 30 to 34 Minutes | 0 (0.0%) | 0 (0.0%) |
| 35 to 39 Minutes | 7 (3.9%) | 0 (0.0%) |
| 40 to 44 Minutes | 9 (5.0%) | 0 (0.0%) |
| 45 to 59 Minutes | 13 (7.3%) | 16 (10.6%) |
| 60 to 89 Minutes | 8 (4.5%) | 0 (0.0%) |
| 90 or more Minutes | 30 (16.8%) | 8 (5.3%) |
Time of Departure to Work by Sex in Los Olivos
The most frequent times of departure to work in Los Olivos are 7:00 AM to 7:29 AM (41, 22.9%) for males and 10:00 AM to 10:59 AM (56, 37.1%) for females.
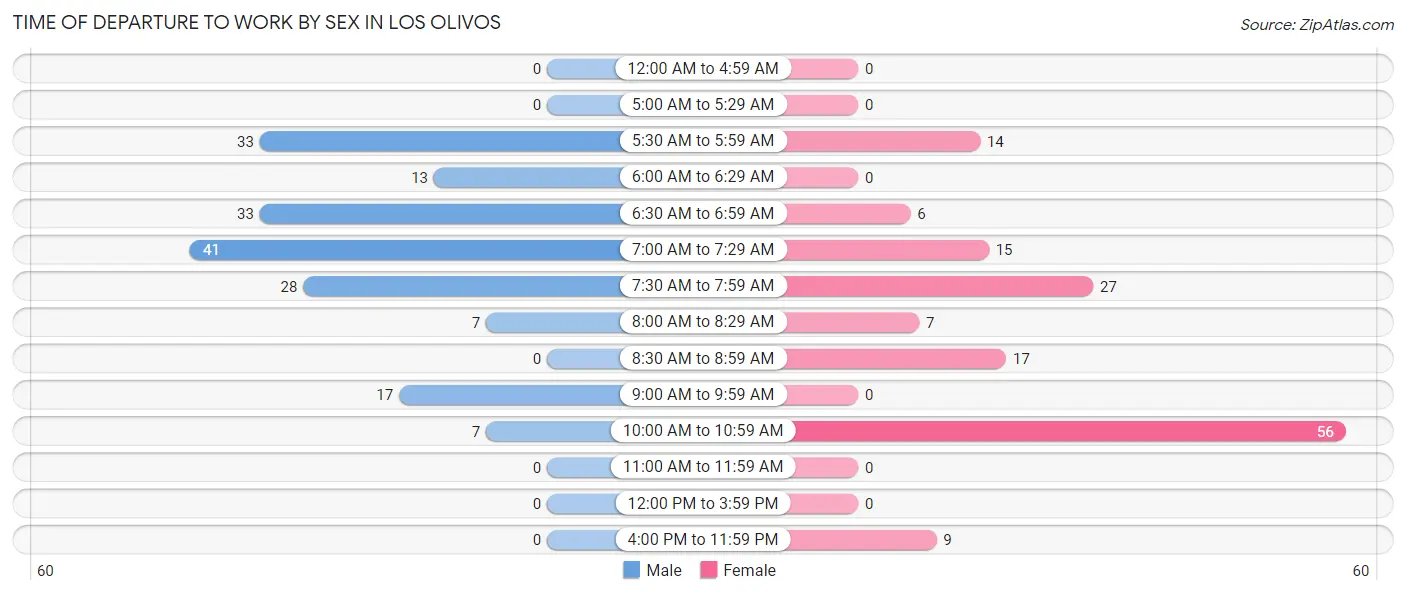
| Time of Departure | Male | Female |
| 12:00 AM to 4:59 AM | 0 (0.0%) | 0 (0.0%) |
| 5:00 AM to 5:29 AM | 0 (0.0%) | 0 (0.0%) |
| 5:30 AM to 5:59 AM | 33 (18.4%) | 14 (9.3%) |
| 6:00 AM to 6:29 AM | 13 (7.3%) | 0 (0.0%) |
| 6:30 AM to 6:59 AM | 33 (18.4%) | 6 (4.0%) |
| 7:00 AM to 7:29 AM | 41 (22.9%) | 15 (9.9%) |
| 7:30 AM to 7:59 AM | 28 (15.6%) | 27 (17.9%) |
| 8:00 AM to 8:29 AM | 7 (3.9%) | 7 (4.6%) |
| 8:30 AM to 8:59 AM | 0 (0.0%) | 17 (11.3%) |
| 9:00 AM to 9:59 AM | 17 (9.5%) | 0 (0.0%) |
| 10:00 AM to 10:59 AM | 7 (3.9%) | 56 (37.1%) |
| 11:00 AM to 11:59 AM | 0 (0.0%) | 0 (0.0%) |
| 12:00 PM to 3:59 PM | 0 (0.0%) | 0 (0.0%) |
| 4:00 PM to 11:59 PM | 0 (0.0%) | 9 (6.0%) |
| Total | 179 (100.0%) | 151 (100.0%) |
Housing Occupancy in Los Olivos
Occupancy by Ownership in Los Olivos
Of the total 400 dwellings in Los Olivos, owner-occupied units account for 348 (87.0%), while renter-occupied units make up 52 (13.0%).
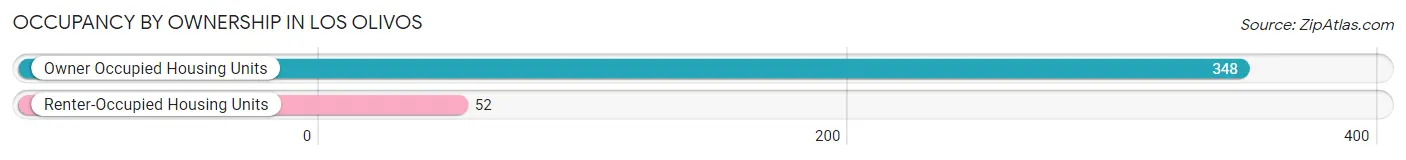
| Occupancy | # Housing Units | % Housing Units |
| Owner Occupied Housing Units | 348 | 87.0% |
| Renter-Occupied Housing Units | 52 | 13.0% |
| Total Occupied Housing Units | 400 | 100.0% |
Occupancy by Household Size in Los Olivos
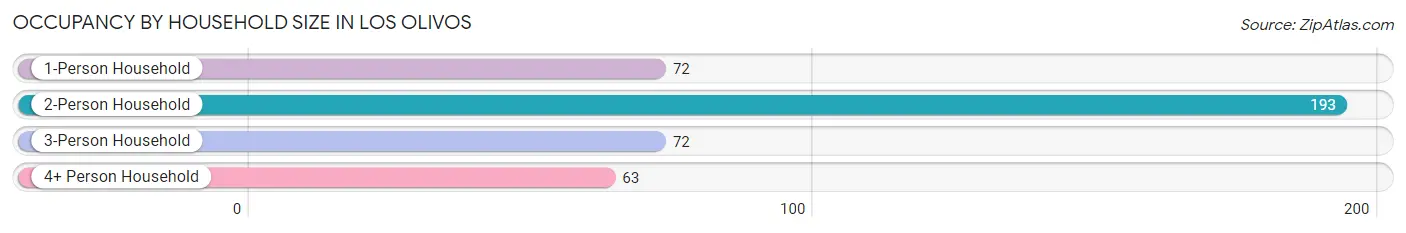
| Household Size | # Housing Units | % Housing Units |
| 1-Person Household | 72 | 18.0% |
| 2-Person Household | 193 | 48.2% |
| 3-Person Household | 72 | 18.0% |
| 4+ Person Household | 63 | 15.8% |
| Total Housing Units | 400 | 100.0% |
Occupancy by Ownership by Household Size in Los Olivos
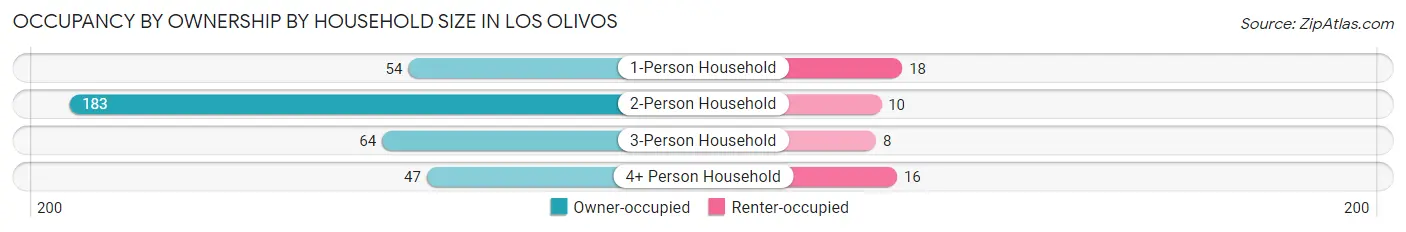
| Household Size | Owner-occupied | Renter-occupied |
| 1-Person Household | 54 (75.0%) | 18 (25.0%) |
| 2-Person Household | 183 (94.8%) | 10 (5.2%) |
| 3-Person Household | 64 (88.9%) | 8 (11.1%) |
| 4+ Person Household | 47 (74.6%) | 16 (25.4%) |
| Total Housing Units | 348 (87.0%) | 52 (13.0%) |
Occupancy by Educational Attainment in Los Olivos
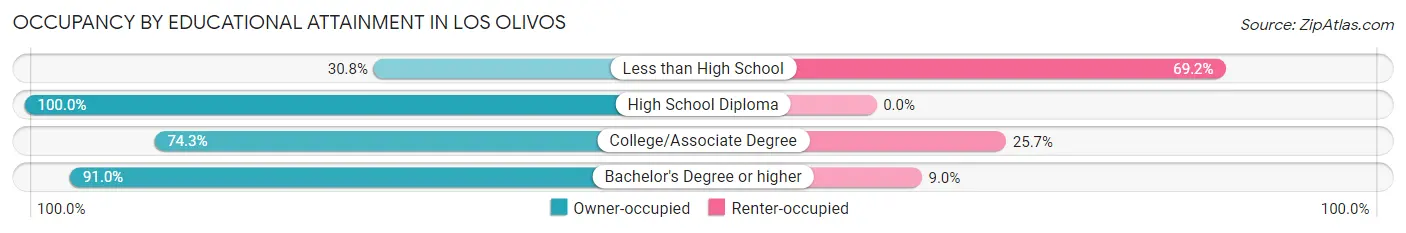
| Household Size | Owner-occupied | Renter-occupied |
| Less than High School | 4 (30.8%) | 9 (69.2%) |
| High School Diploma | 39 (100.0%) | 0 (0.0%) |
| College/Associate Degree | 52 (74.3%) | 18 (25.7%) |
| Bachelor's Degree or higher | 253 (91.0%) | 25 (9.0%) |
Occupancy by Age of Householder in Los Olivos
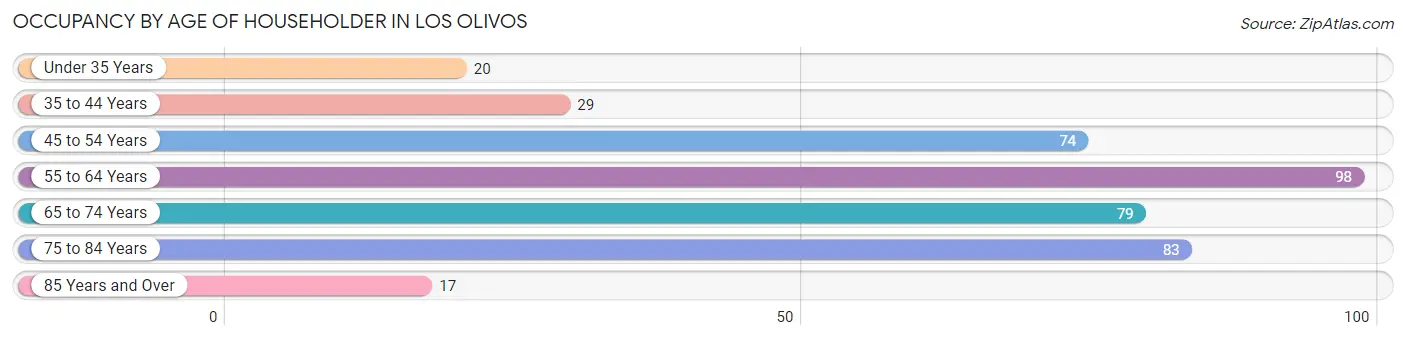
| Age Bracket | # Households | % Households |
| Under 35 Years | 20 | 5.0% |
| 35 to 44 Years | 29 | 7.2% |
| 45 to 54 Years | 74 | 18.5% |
| 55 to 64 Years | 98 | 24.5% |
| 65 to 74 Years | 79 | 19.8% |
| 75 to 84 Years | 83 | 20.7% |
| 85 Years and Over | 17 | 4.3% |
| Total | 400 | 100.0% |
Housing Finances in Los Olivos
Median Income by Occupancy in Los Olivos
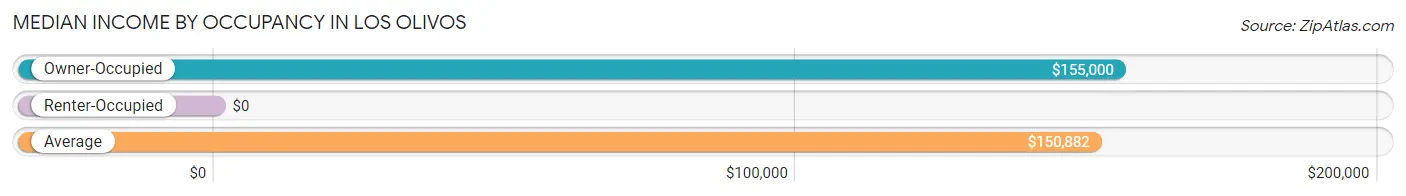
| Occupancy Type | # Households | Median Income |
| Owner-Occupied | 348 (87.0%) | $155,000 |
| Renter-Occupied | 52 (13.0%) | $0 |
| Average | 400 (100.0%) | $150,882 |
Occupancy by Householder Income Bracket in Los Olivos
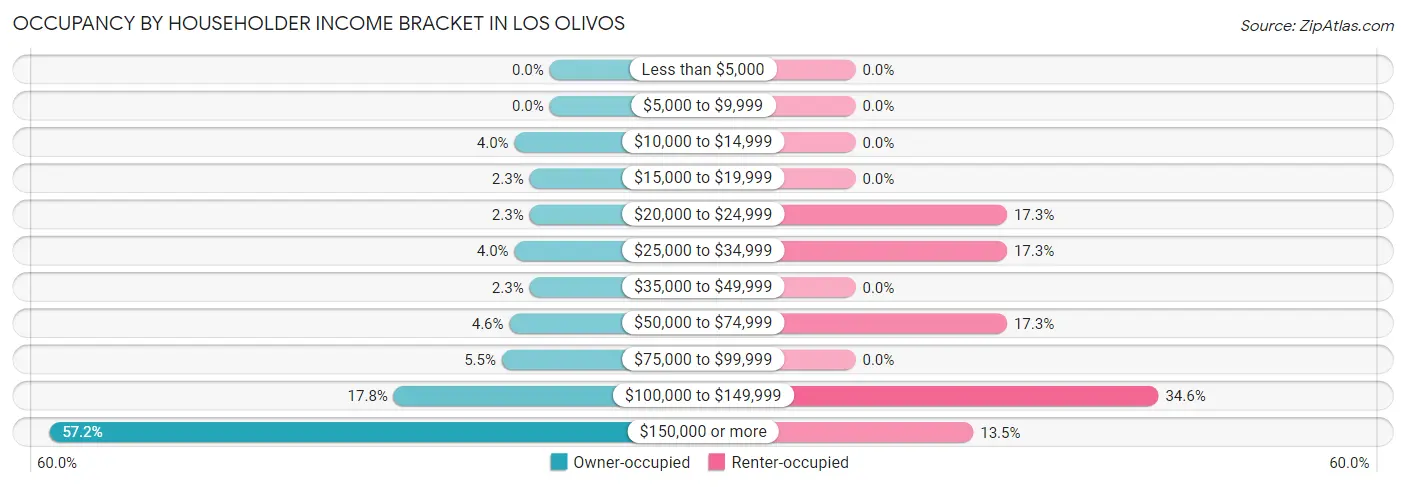
| Income Bracket | Owner-occupied | Renter-occupied |
| Less than $5,000 | 0 (0.0%) | 0 (0.0%) |
| $5,000 to $9,999 | 0 (0.0%) | 0 (0.0%) |
| $10,000 to $14,999 | 14 (4.0%) | 0 (0.0%) |
| $15,000 to $19,999 | 8 (2.3%) | 0 (0.0%) |
| $20,000 to $24,999 | 8 (2.3%) | 9 (17.3%) |
| $25,000 to $34,999 | 14 (4.0%) | 9 (17.3%) |
| $35,000 to $49,999 | 8 (2.3%) | 0 (0.0%) |
| $50,000 to $74,999 | 16 (4.6%) | 9 (17.3%) |
| $75,000 to $99,999 | 19 (5.5%) | 0 (0.0%) |
| $100,000 to $149,999 | 62 (17.8%) | 18 (34.6%) |
| $150,000 or more | 199 (57.2%) | 7 (13.5%) |
| Total | 348 (100.0%) | 52 (100.0%) |
Monthly Housing Cost Tiers in Los Olivos
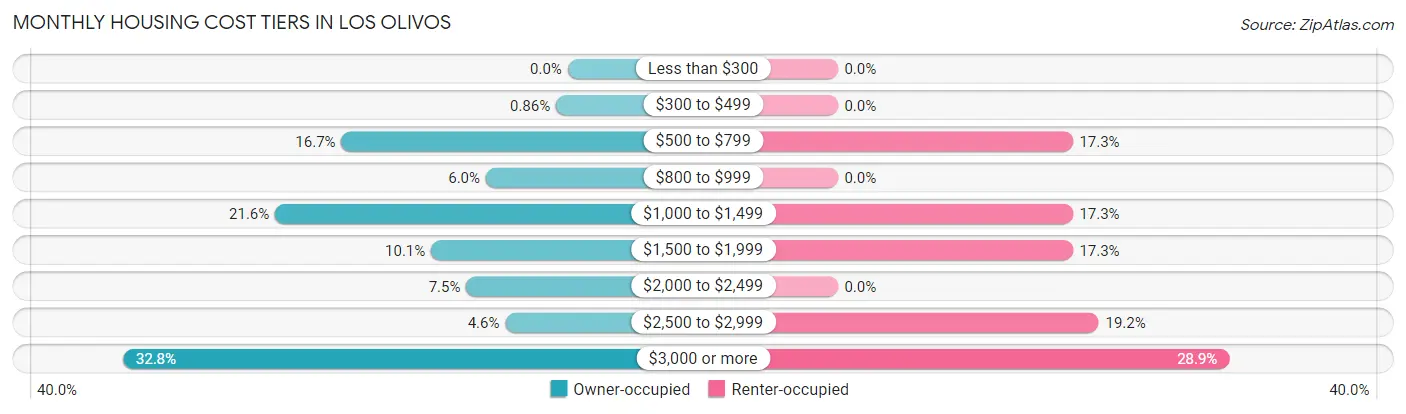
| Monthly Cost | Owner-occupied | Renter-occupied |
| Less than $300 | 0 (0.0%) | 0 (0.0%) |
| $300 to $499 | 3 (0.9%) | 0 (0.0%) |
| $500 to $799 | 58 (16.7%) | 9 (17.3%) |
| $800 to $999 | 21 (6.0%) | 0 (0.0%) |
| $1,000 to $1,499 | 75 (21.5%) | 9 (17.3%) |
| $1,500 to $1,999 | 35 (10.1%) | 9 (17.3%) |
| $2,000 to $2,499 | 26 (7.5%) | 0 (0.0%) |
| $2,500 to $2,999 | 16 (4.6%) | 10 (19.2%) |
| $3,000 or more | 114 (32.8%) | 15 (28.8%) |
| Total | 348 (100.0%) | 52 (100.0%) |
Physical Housing Characteristics in Los Olivos
Housing Structures in Los Olivos
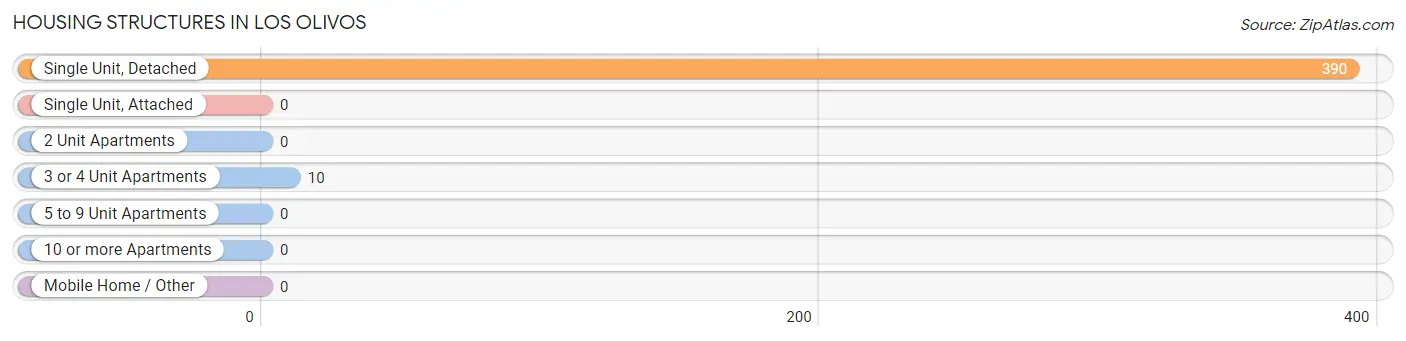
| Structure Type | # Housing Units | % Housing Units |
| Single Unit, Detached | 390 | 97.5% |
| Single Unit, Attached | 0 | 0.0% |
| 2 Unit Apartments | 0 | 0.0% |
| 3 or 4 Unit Apartments | 10 | 2.5% |
| 5 to 9 Unit Apartments | 0 | 0.0% |
| 10 or more Apartments | 0 | 0.0% |
| Mobile Home / Other | 0 | 0.0% |
| Total | 400 | 100.0% |
Housing Structures by Occupancy in Los Olivos
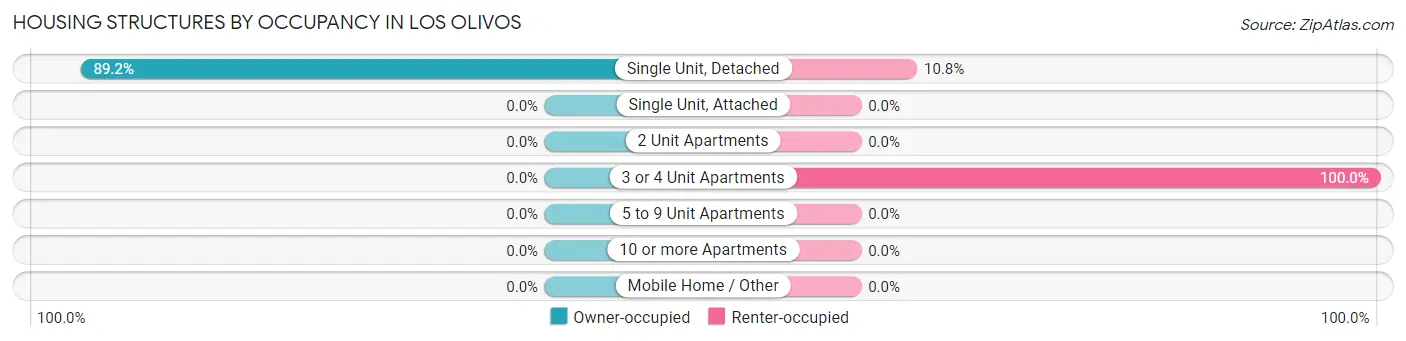
| Structure Type | Owner-occupied | Renter-occupied |
| Single Unit, Detached | 348 (89.2%) | 42 (10.8%) |
| Single Unit, Attached | 0 (0.0%) | 0 (0.0%) |
| 2 Unit Apartments | 0 (0.0%) | 0 (0.0%) |
| 3 or 4 Unit Apartments | 0 (0.0%) | 10 (100.0%) |
| 5 to 9 Unit Apartments | 0 (0.0%) | 0 (0.0%) |
| 10 or more Apartments | 0 (0.0%) | 0 (0.0%) |
| Mobile Home / Other | 0 (0.0%) | 0 (0.0%) |
| Total | 348 (87.0%) | 52 (13.0%) |
Housing Structures by Number of Rooms in Los Olivos
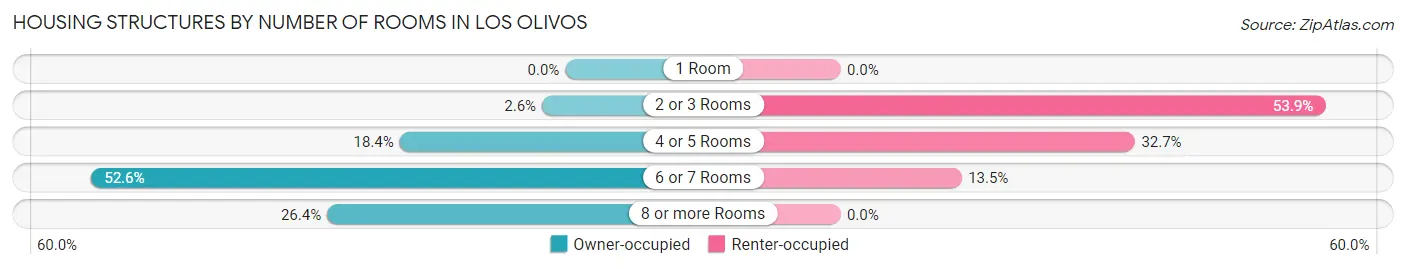
| Number of Rooms | Owner-occupied | Renter-occupied |
| 1 Room | 0 (0.0%) | 0 (0.0%) |
| 2 or 3 Rooms | 9 (2.6%) | 28 (53.8%) |
| 4 or 5 Rooms | 64 (18.4%) | 17 (32.7%) |
| 6 or 7 Rooms | 183 (52.6%) | 7 (13.5%) |
| 8 or more Rooms | 92 (26.4%) | 0 (0.0%) |
| Total | 348 (100.0%) | 52 (100.0%) |
Housing Structure by Heating Type in Los Olivos
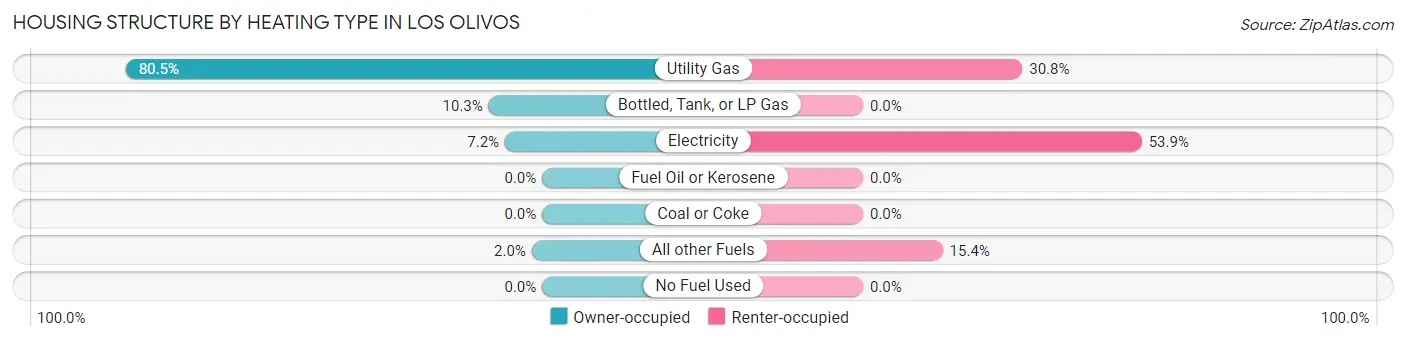
| Heating Type | Owner-occupied | Renter-occupied |
| Utility Gas | 280 (80.5%) | 16 (30.8%) |
| Bottled, Tank, or LP Gas | 36 (10.3%) | 0 (0.0%) |
| Electricity | 25 (7.2%) | 28 (53.8%) |
| Fuel Oil or Kerosene | 0 (0.0%) | 0 (0.0%) |
| Coal or Coke | 0 (0.0%) | 0 (0.0%) |
| All other Fuels | 7 (2.0%) | 8 (15.4%) |
| No Fuel Used | 0 (0.0%) | 0 (0.0%) |
| Total | 348 (100.0%) | 52 (100.0%) |
Household Vehicle Usage in Los Olivos
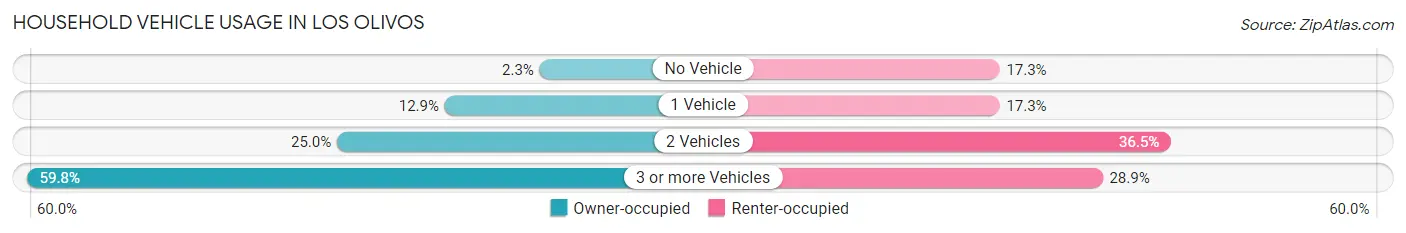
| Vehicles per Household | Owner-occupied | Renter-occupied |
| No Vehicle | 8 (2.3%) | 9 (17.3%) |
| 1 Vehicle | 45 (12.9%) | 9 (17.3%) |
| 2 Vehicles | 87 (25.0%) | 19 (36.5%) |
| 3 or more Vehicles | 208 (59.8%) | 15 (28.8%) |
| Total | 348 (100.0%) | 52 (100.0%) |
Real Estate & Mortgages in Los Olivos
Real Estate and Mortgage Overview in Los Olivos
| Characteristic | Without Mortgage | With Mortgage |
| Housing Units | 184 | 164 |
| Median Property Value | $1,221,200 | $1,229,200 |
| Median Household Income | $159,167 | $93 |
| Monthly Housing Costs | $1,203 | $106 |
| Real Estate Taxes | $4,829 | $0 |
Property Value by Mortgage Status in Los Olivos
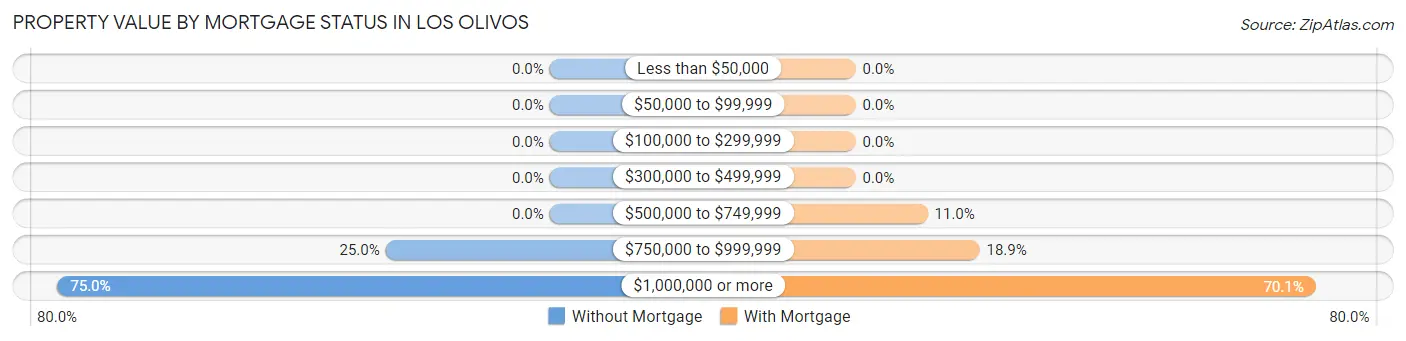
| Property Value | Without Mortgage | With Mortgage |
| Less than $50,000 | 0 (0.0%) | 0 (0.0%) |
| $50,000 to $99,999 | 0 (0.0%) | 0 (0.0%) |
| $100,000 to $299,999 | 0 (0.0%) | 0 (0.0%) |
| $300,000 to $499,999 | 0 (0.0%) | 0 (0.0%) |
| $500,000 to $749,999 | 0 (0.0%) | 18 (11.0%) |
| $750,000 to $999,999 | 46 (25.0%) | 31 (18.9%) |
| $1,000,000 or more | 138 (75.0%) | 115 (70.1%) |
| Total | 184 (100.0%) | 164 (100.0%) |
Household Income by Mortgage Status in Los Olivos
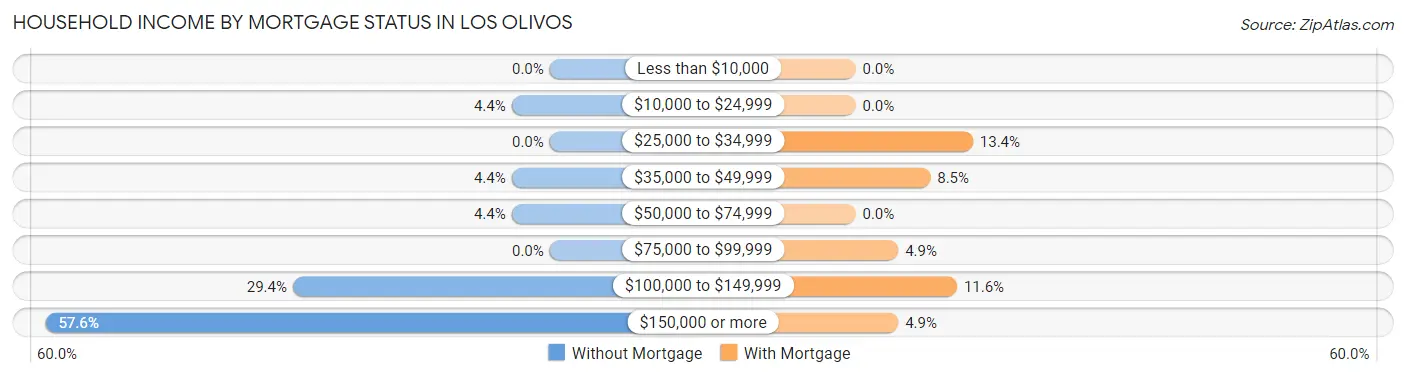
| Household Income | Without Mortgage | With Mortgage |
| Less than $10,000 | 0 (0.0%) | 0 (0.0%) |
| $10,000 to $24,999 | 8 (4.3%) | 0 (0.0%) |
| $25,000 to $34,999 | 0 (0.0%) | 22 (13.4%) |
| $35,000 to $49,999 | 8 (4.3%) | 14 (8.5%) |
| $50,000 to $74,999 | 8 (4.3%) | 0 (0.0%) |
| $75,000 to $99,999 | 0 (0.0%) | 8 (4.9%) |
| $100,000 to $149,999 | 54 (29.3%) | 19 (11.6%) |
| $150,000 or more | 106 (57.6%) | 8 (4.9%) |
| Total | 184 (100.0%) | 164 (100.0%) |
Property Value to Household Income Ratio in Los Olivos
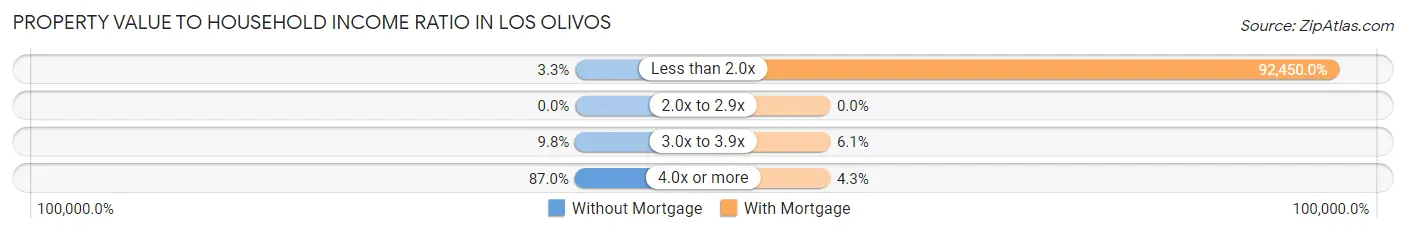
| Value-to-Income Ratio | Without Mortgage | With Mortgage |
| Less than 2.0x | 6 (3.3%) | 151,618 (92,450.0%) |
| 2.0x to 2.9x | 0 (0.0%) | 0 (0.0%) |
| 3.0x to 3.9x | 18 (9.8%) | 10 (6.1%) |
| 4.0x or more | 160 (87.0%) | 7 (4.3%) |
| Total | 184 (100.0%) | 164 (100.0%) |
Real Estate Taxes by Mortgage Status in Los Olivos
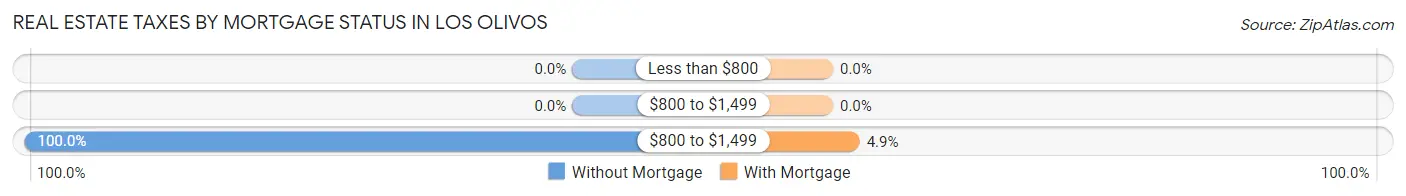
| Property Taxes | Without Mortgage | With Mortgage |
| Less than $800 | 0 (0.0%) | 0 (0.0%) |
| $800 to $1,499 | 0 (0.0%) | 0 (0.0%) |
| $800 to $1,499 | 184 (100.0%) | 8 (4.9%) |
| Total | 184 (100.0%) | 164 (100.0%) |
Health & Disability in Los Olivos
Health Insurance Coverage by Age in Los Olivos
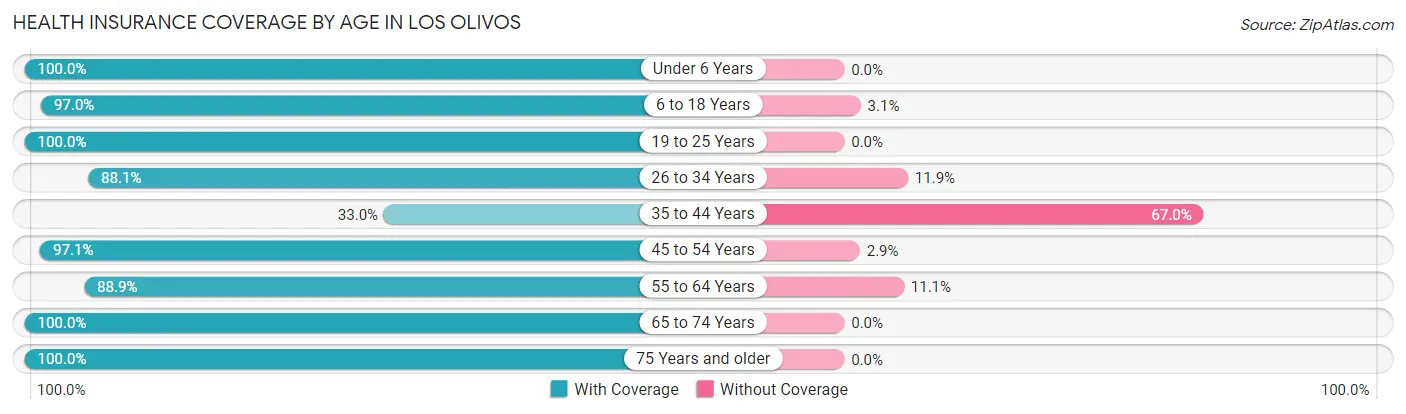
| Age Bracket | With Coverage | Without Coverage |
| Under 6 Years | 16 (100.0%) | 0 (0.0%) |
| 6 to 18 Years | 159 (97.0%) | 5 (3.0%) |
| 19 to 25 Years | 22 (100.0%) | 0 (0.0%) |
| 26 to 34 Years | 52 (88.1%) | 7 (11.9%) |
| 35 to 44 Years | 33 (33.0%) | 67 (67.0%) |
| 45 to 54 Years | 168 (97.1%) | 5 (2.9%) |
| 55 to 64 Years | 152 (88.9%) | 19 (11.1%) |
| 65 to 74 Years | 188 (100.0%) | 0 (0.0%) |
| 75 Years and older | 126 (100.0%) | 0 (0.0%) |
| Total | 916 (89.9%) | 103 (10.1%) |
Health Insurance Coverage by Citizenship Status in Los Olivos
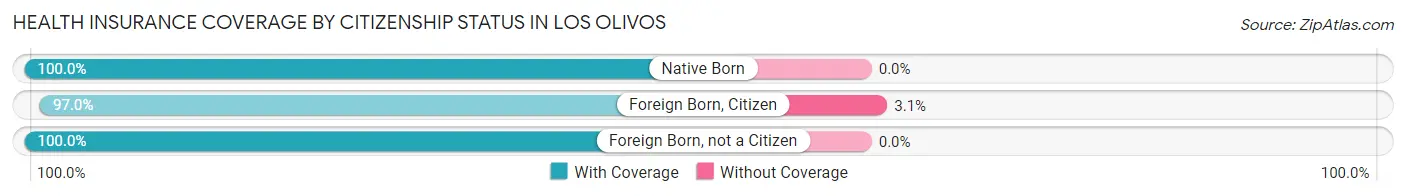
| Citizenship Status | With Coverage | Without Coverage |
| Native Born | 16 (100.0%) | 0 (0.0%) |
| Foreign Born, Citizen | 159 (97.0%) | 5 (3.0%) |
| Foreign Born, not a Citizen | 22 (100.0%) | 0 (0.0%) |
Health Insurance Coverage by Household Income in Los Olivos
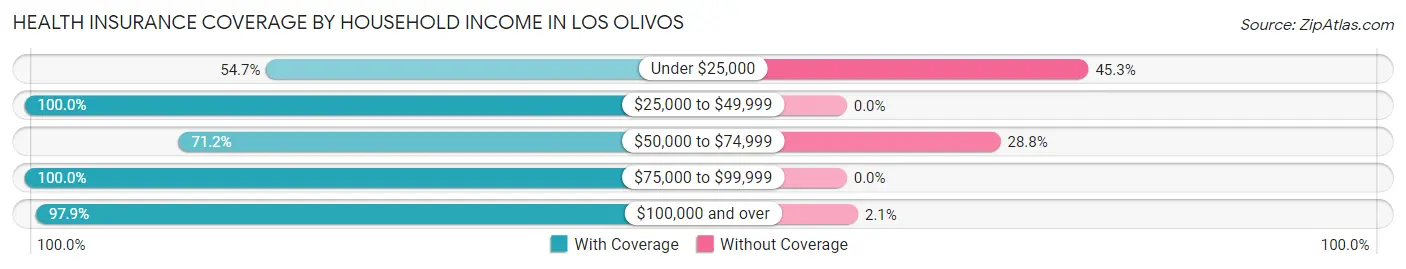
| Household Income | With Coverage | Without Coverage |
| Under $25,000 | 29 (54.7%) | 24 (45.3%) |
| $25,000 to $49,999 | 59 (100.0%) | 0 (0.0%) |
| $50,000 to $74,999 | 42 (71.2%) | 17 (28.8%) |
| $75,000 to $99,999 | 44 (100.0%) | 0 (0.0%) |
| $100,000 and over | 742 (97.9%) | 16 (2.1%) |
Public vs Private Health Insurance Coverage by Age in Los Olivos
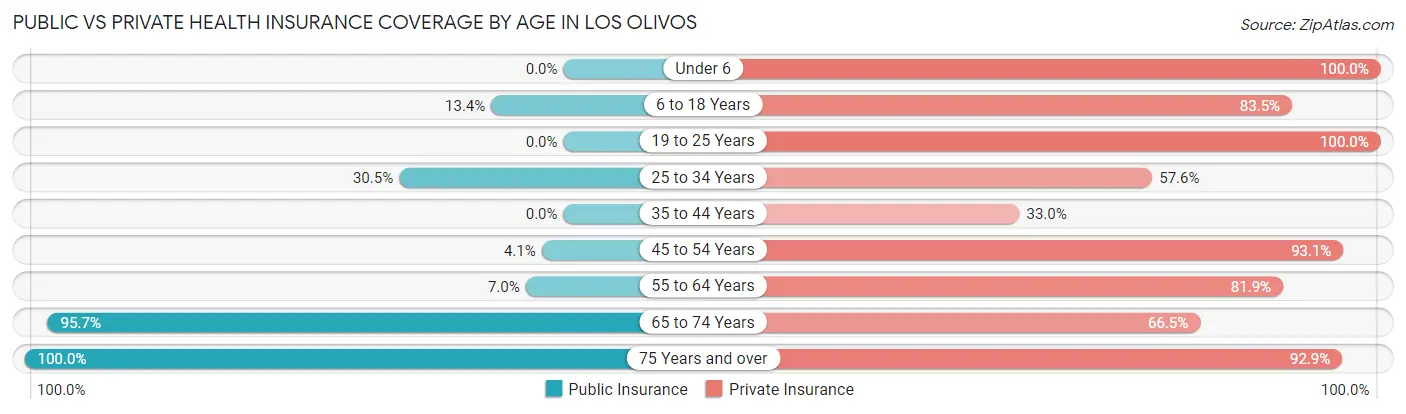
| Age Bracket | Public Insurance | Private Insurance |
| Under 6 | 0 (0.0%) | 16 (100.0%) |
| 6 to 18 Years | 22 (13.4%) | 137 (83.5%) |
| 19 to 25 Years | 0 (0.0%) | 22 (100.0%) |
| 25 to 34 Years | 18 (30.5%) | 34 (57.6%) |
| 35 to 44 Years | 0 (0.0%) | 33 (33.0%) |
| 45 to 54 Years | 7 (4.1%) | 161 (93.1%) |
| 55 to 64 Years | 12 (7.0%) | 140 (81.9%) |
| 65 to 74 Years | 180 (95.7%) | 125 (66.5%) |
| 75 Years and over | 126 (100.0%) | 117 (92.9%) |
| Total | 365 (35.8%) | 785 (77.0%) |
Disability Status by Sex by Age in Los Olivos
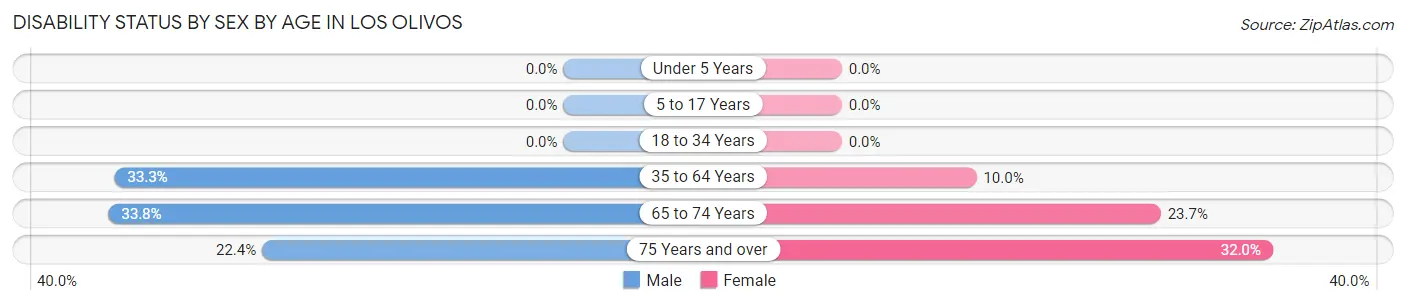
| Age Bracket | Male | Female |
| Under 5 Years | 0 (0.0%) | 0 (0.0%) |
| 5 to 17 Years | 0 (0.0%) | 0 (0.0%) |
| 18 to 34 Years | 0 (0.0%) | 0 (0.0%) |
| 35 to 64 Years | 78 (33.3%) | 21 (10.0%) |
| 65 to 74 Years | 25 (33.8%) | 27 (23.7%) |
| 75 Years and over | 17 (22.4%) | 16 (32.0%) |
Disability Class by Sex by Age in Los Olivos
Disability Class: Hearing Difficulty
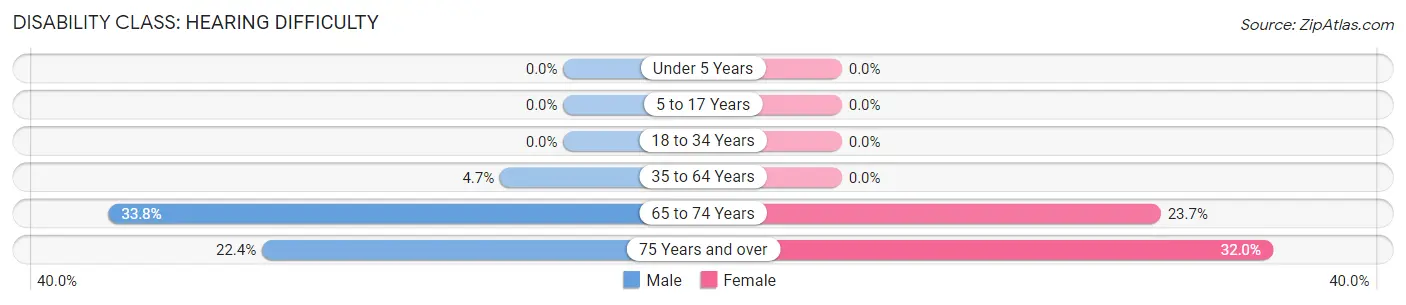
| Age Bracket | Male | Female |
| Under 5 Years | 0 (0.0%) | 0 (0.0%) |
| 5 to 17 Years | 0 (0.0%) | 0 (0.0%) |
| 18 to 34 Years | 0 (0.0%) | 0 (0.0%) |
| 35 to 64 Years | 11 (4.7%) | 0 (0.0%) |
| 65 to 74 Years | 25 (33.8%) | 27 (23.7%) |
| 75 Years and over | 17 (22.4%) | 16 (32.0%) |
Disability Class: Vision Difficulty
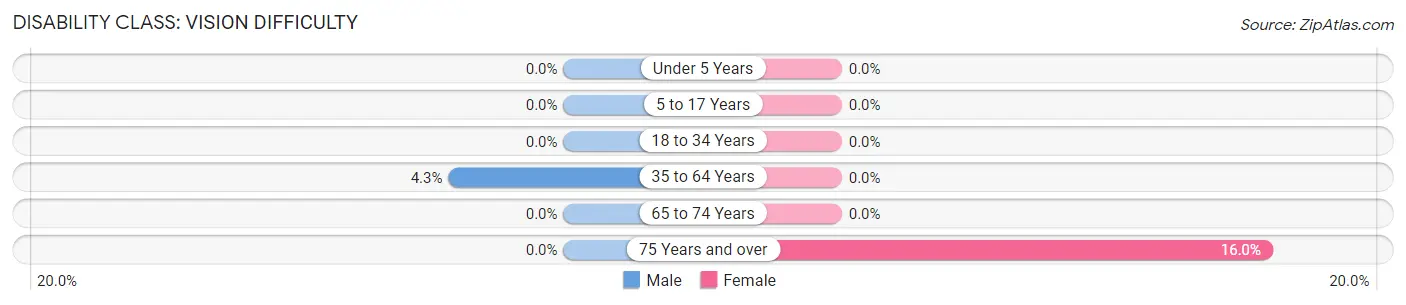
| Age Bracket | Male | Female |
| Under 5 Years | 0 (0.0%) | 0 (0.0%) |
| 5 to 17 Years | 0 (0.0%) | 0 (0.0%) |
| 18 to 34 Years | 0 (0.0%) | 0 (0.0%) |
| 35 to 64 Years | 10 (4.3%) | 0 (0.0%) |
| 65 to 74 Years | 0 (0.0%) | 0 (0.0%) |
| 75 Years and over | 0 (0.0%) | 8 (16.0%) |
Disability Class: Cognitive Difficulty
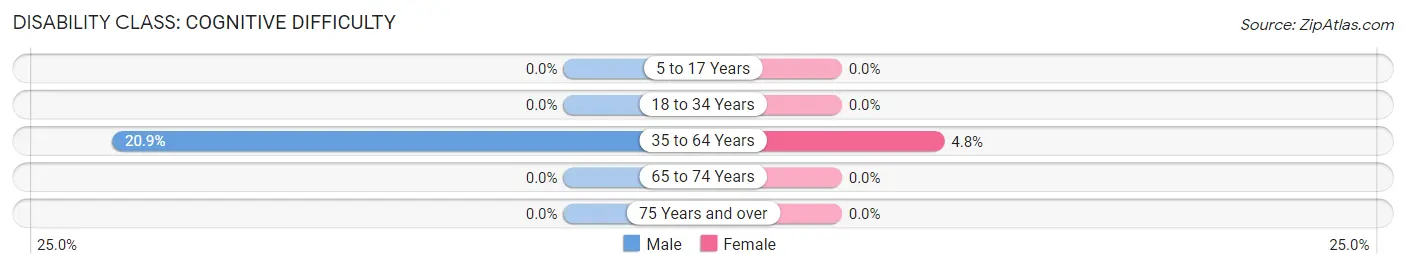
| Age Bracket | Male | Female |
| 5 to 17 Years | 0 (0.0%) | 0 (0.0%) |
| 18 to 34 Years | 0 (0.0%) | 0 (0.0%) |
| 35 to 64 Years | 49 (20.9%) | 10 (4.8%) |
| 65 to 74 Years | 0 (0.0%) | 0 (0.0%) |
| 75 Years and over | 0 (0.0%) | 0 (0.0%) |
Disability Class: Ambulatory Difficulty
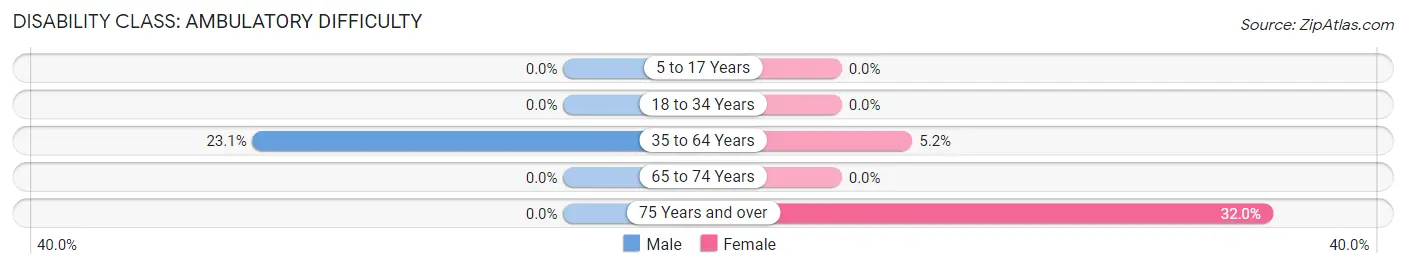
| Age Bracket | Male | Female |
| 5 to 17 Years | 0 (0.0%) | 0 (0.0%) |
| 18 to 34 Years | 0 (0.0%) | 0 (0.0%) |
| 35 to 64 Years | 54 (23.1%) | 11 (5.2%) |
| 65 to 74 Years | 0 (0.0%) | 0 (0.0%) |
| 75 Years and over | 0 (0.0%) | 16 (32.0%) |
Disability Class: Self-Care Difficulty
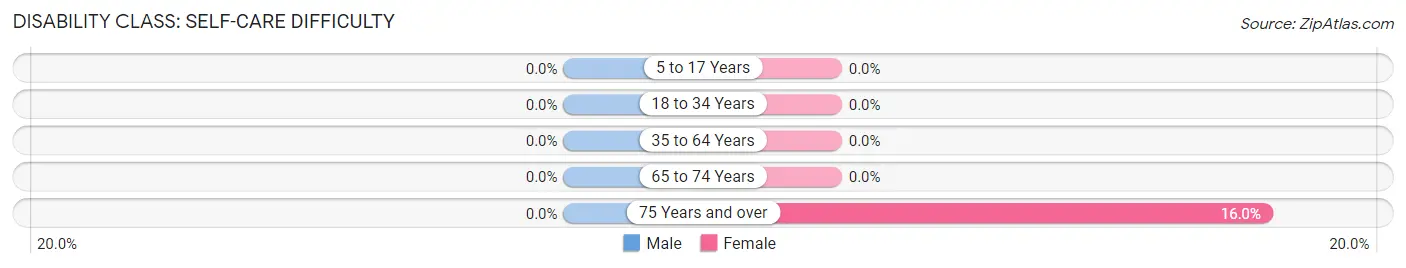
| Age Bracket | Male | Female |
| 5 to 17 Years | 0 (0.0%) | 0 (0.0%) |
| 18 to 34 Years | 0 (0.0%) | 0 (0.0%) |
| 35 to 64 Years | 0 (0.0%) | 0 (0.0%) |
| 65 to 74 Years | 0 (0.0%) | 0 (0.0%) |
| 75 Years and over | 0 (0.0%) | 8 (16.0%) |
Technology Access in Los Olivos
Computing Device Access in Los Olivos
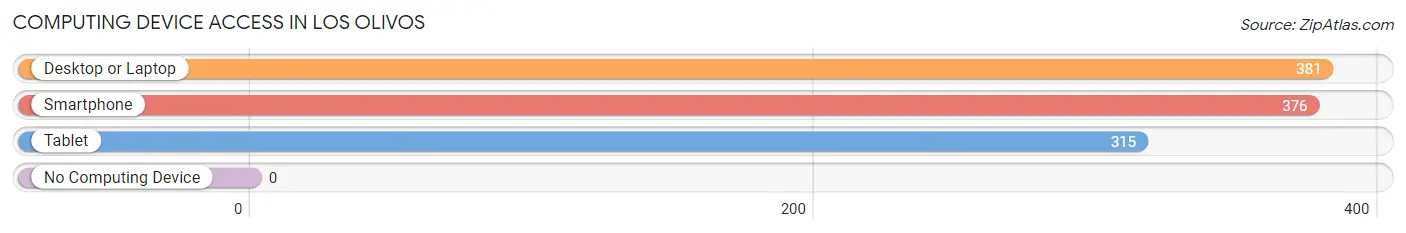
| Device Type | # Households | % Households |
| Desktop or Laptop | 381 | 95.3% |
| Smartphone | 376 | 94.0% |
| Tablet | 315 | 78.7% |
| No Computing Device | 0 | 0.0% |
| Total | 400 | 100.0% |
Internet Access in Los Olivos
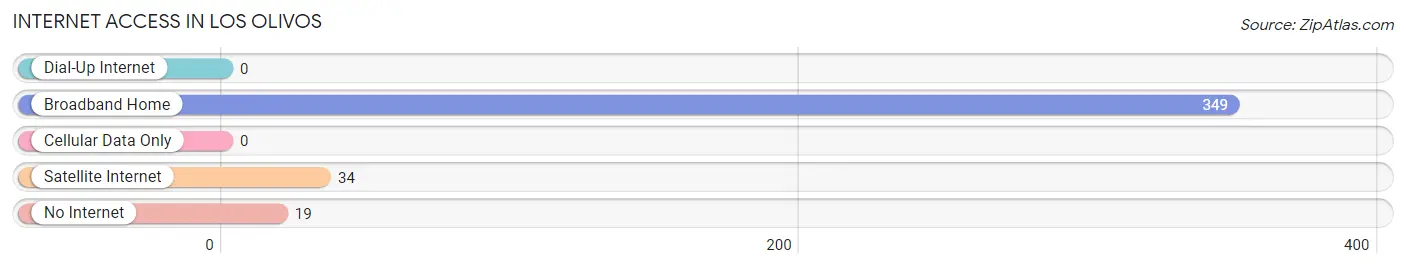
| Internet Type | # Households | % Households |
| Dial-Up Internet | 0 | 0.0% |
| Broadband Home | 349 | 87.3% |
| Cellular Data Only | 0 | 0.0% |
| Satellite Internet | 34 | 8.5% |
| No Internet | 19 | 4.8% |
| Total | 400 | 100.0% |
Los Olivos Summary
Olivos, California is a small unincorporated community located in Santa Barbara County, California. It is situated in the Santa Ynez Valley, about 15 miles north of Santa Barbara. The population of Olivos was estimated to be around 1,000 in 2020.
History
Olivos was founded in 1871 by a group of Spanish settlers who were looking for a place to settle and farm. The area was originally known as Los Olivos, which translates to “the olives” in Spanish. The settlers planted olive trees and began to cultivate the land. The town was officially incorporated in 1887.
In the early 1900s, the town began to grow and prosper. The population increased and the town became a popular destination for tourists. The town was known for its wineries, which produced some of the finest wines in the region.
In the 1950s, the town began to decline as the wine industry moved away from the area. The population decreased and the town became a quiet, rural community.
Geography
Olivos is located in the Santa Ynez Valley, about 15 miles north of Santa Barbara. The town is situated in a valley surrounded by rolling hills and mountains. The climate is mild and the area receives an average of 300 days of sunshine each year.
The town is located near several popular attractions, including the Santa Ynez Valley Wine Country, the Santa Ynez River, and the Santa Ynez Mountains.
Economy
The economy of Olivos is largely based on agriculture and tourism. The town is home to several wineries, which produce some of the finest wines in the region. The town is also home to several restaurants, shops, and other businesses.
Tourism is a major part of the economy. The town is a popular destination for wine tasting, hiking, and other outdoor activities.
Demographics
The population of Olivos was estimated to be around 1,000 in 2020. The town is predominantly white, with a small Hispanic population. The median household income is around $60,000.
Conclusion
Olivos, California is a small unincorporated community located in Santa Barbara County, California. It is situated in the Santa Ynez Valley, about 15 miles north of Santa Barbara. The town was founded in 1871 by a group of Spanish settlers and has since grown to become a popular destination for tourists. The economy of Olivos is largely based on agriculture and tourism, and the population was estimated to be around 1,000 in 2020. The town is predominantly white, with a small Hispanic population, and the median household income is around $60,000.
Common Questions
What is Per Capita Income in Los Olivos?
Per Capita income in Los Olivos is $71,982.
What is the Median Family Income in Los Olivos?
Median Family Income in Los Olivos is $153,750.
What is the Median Household income in Los Olivos?
Median Household Income in Los Olivos is $150,882.
What is Income or Wage Gap in Los Olivos?
Income or Wage Gap in Los Olivos is 62.0%.
Women in Los Olivos earn 38.0 cents for every dollar earned by a man.
What is Inequality or Gini Index in Los Olivos?
Inequality or Gini Index in Los Olivos is 0.42.
What is the Total Population of Los Olivos?
Total Population of Los Olivos is 1,020.
What is the Total Male Population of Los Olivos?
Total Male Population of Los Olivos is 557.
What is the Total Female Population of Los Olivos?
Total Female Population of Los Olivos is 463.
What is the Ratio of Males per 100 Females in Los Olivos?
There are 120.30 Males per 100 Females in Los Olivos.
What is the Ratio of Females per 100 Males in Los Olivos?
There are 83.12 Females per 100 Males in Los Olivos.
What is the Median Population Age in Los Olivos?
Median Population Age in Los Olivos is 52.9 Years.
What is the Average Family Size in Los Olivos
Average Family Size in Los Olivos is 2.8 People.
What is the Average Household Size in Los Olivos
Average Household Size in Los Olivos is 2.4 People.
How Large is the Labor Force in Los Olivos?
There are 468 People in the Labor Forcein in Los Olivos.
What is the Percentage of People in the Labor Force in Los Olivos?
52.1% of People are in the Labor Force in Los Olivos.
What is the Unemployment Rate in Los Olivos?
Unemployment Rate in Los Olivos is 9.0%.