Hillsboro, WI Map & Demographics
Hillsboro Map
Hillsboro Overview
$32,293
PER CAPITA INCOME
$78,158
AVG FAMILY INCOME
$58,281
AVG HOUSEHOLD INCOME
22.3%
WAGE / INCOME GAP [ % ]
77.7¢/ $1
WAGE / INCOME GAP [ $ ]
$4,495
FAMILY INCOME DEFICIT
0.42
INEQUALITY / GINI INDEX
1,318
TOTAL POPULATION
737
MALE POPULATION
581
FEMALE POPULATION
126.85
MALES / 100 FEMALES
78.83
FEMALES / 100 MALES
45.9
MEDIAN AGE
2.8
AVG FAMILY SIZE
2.2
AVG HOUSEHOLD SIZE
637
LABOR FORCE [ PEOPLE ]
60.7%
PERCENT IN LABOR FORCE
5.3%
UNEMPLOYMENT RATE
Hillsboro Zip Codes
Hillsboro Area Codes
Income in Hillsboro
Income Overview in Hillsboro
Per Capita Income in Hillsboro is $32,293, while median incomes of families and households are $78,158 and $58,281 respectively.
| Characteristic | Number | Measure |
| Per Capita Income | 1,318 | $32,293 |
| Median Family Income | 374 | $78,158 |
| Mean Family Income | 374 | $86,860 |
| Median Household Income | 581 | $58,281 |
| Mean Household Income | 581 | $71,830 |
| Income Deficit | 374 | $4,495 |
| Wage / Income Gap (%) | 1,318 | 22.29% |
| Wage / Income Gap ($) | 1,318 | 77.71¢ per $1 |
| Gini / Inequality Index | 1,318 | 0.42 |
Earnings by Sex in Hillsboro
Average Earnings in Hillsboro are $38,872, $45,893 for men and $35,662 for women, a difference of 22.3%.
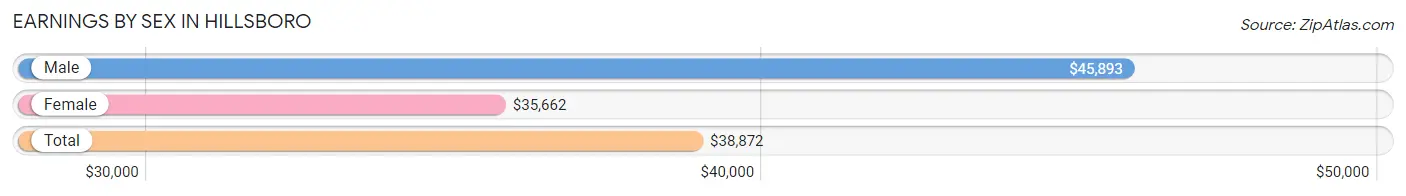
| Sex | Number | Average Earnings |
| Male | 340 (48.6%) | $45,893 |
| Female | 359 (51.4%) | $35,662 |
| Total | 699 (100.0%) | $38,872 |
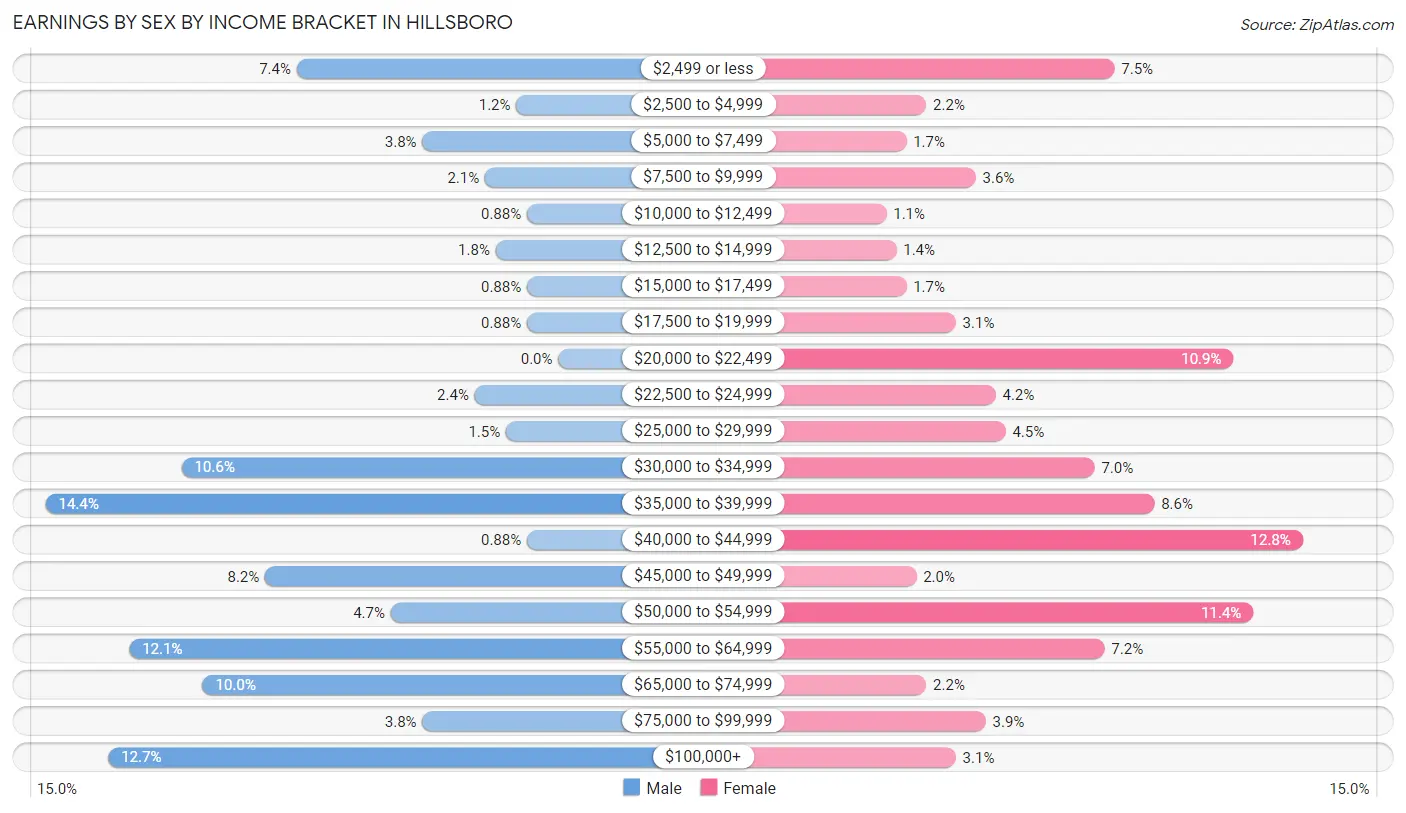
Earnings by Sex by Income Bracket in Hillsboro
The most common earnings brackets in Hillsboro are $35,000 to $39,999 for men (49 | 14.4%) and $40,000 to $44,999 for women (46 | 12.8%).
| Income | Male | Female |
| $2,499 or less | 25 (7.3%) | 27 (7.5%) |
| $2,500 to $4,999 | 4 (1.2%) | 8 (2.2%) |
| $5,000 to $7,499 | 13 (3.8%) | 6 (1.7%) |
| $7,500 to $9,999 | 7 (2.1%) | 13 (3.6%) |
| $10,000 to $12,499 | 3 (0.9%) | 4 (1.1%) |
| $12,500 to $14,999 | 6 (1.8%) | 5 (1.4%) |
| $15,000 to $17,499 | 3 (0.9%) | 6 (1.7%) |
| $17,500 to $19,999 | 3 (0.9%) | 11 (3.1%) |
| $20,000 to $22,499 | 0 (0.0%) | 39 (10.9%) |
| $22,500 to $24,999 | 8 (2.4%) | 15 (4.2%) |
| $25,000 to $29,999 | 5 (1.5%) | 16 (4.5%) |
| $30,000 to $34,999 | 36 (10.6%) | 25 (7.0%) |
| $35,000 to $39,999 | 49 (14.4%) | 31 (8.6%) |
| $40,000 to $44,999 | 3 (0.9%) | 46 (12.8%) |
| $45,000 to $49,999 | 28 (8.2%) | 7 (1.9%) |
| $50,000 to $54,999 | 16 (4.7%) | 41 (11.4%) |
| $55,000 to $64,999 | 41 (12.1%) | 26 (7.2%) |
| $65,000 to $74,999 | 34 (10.0%) | 8 (2.2%) |
| $75,000 to $99,999 | 13 (3.8%) | 14 (3.9%) |
| $100,000+ | 43 (12.7%) | 11 (3.1%) |
| Total | 340 (100.0%) | 359 (100.0%) |
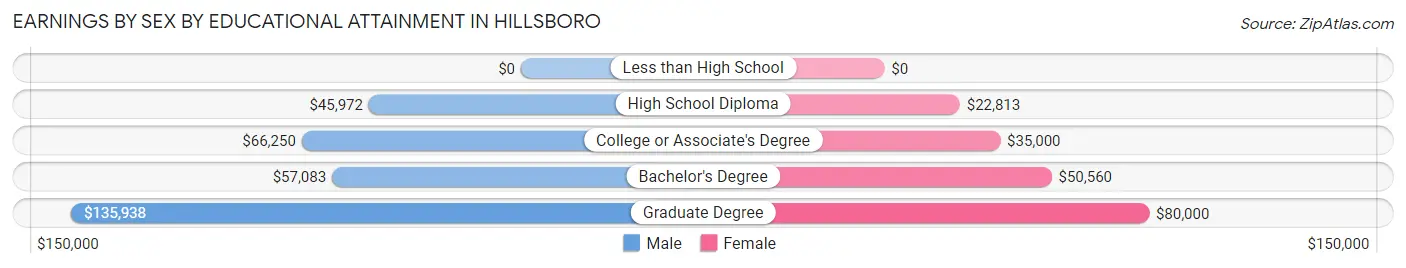
Earnings by Sex by Educational Attainment in Hillsboro
Average earnings in Hillsboro are $48,214 for men and $36,389 for women, a difference of 24.5%. Men with an educational attainment of graduate degree enjoy the highest average annual earnings of $135,938, while those with high school diploma education earn the least with $45,972. Women with an educational attainment of graduate degree earn the most with the average annual earnings of $80,000, while those with high school diploma education have the smallest earnings of $22,813.
| Educational Attainment | Male Income | Female Income |
| Less than High School | - | - |
| High School Diploma | $45,972 | $22,813 |
| College or Associate's Degree | $66,250 | $35,000 |
| Bachelor's Degree | $57,083 | $50,560 |
| Graduate Degree | $135,938 | $80,000 |
| Total | $48,214 | $36,389 |
Family Income in Hillsboro
Family Income Brackets in Hillsboro
According to the Hillsboro family income data, there are 75 families falling into the $100,000 to $149,999 income range, which is the most common income bracket and makes up 20.1% of all families.
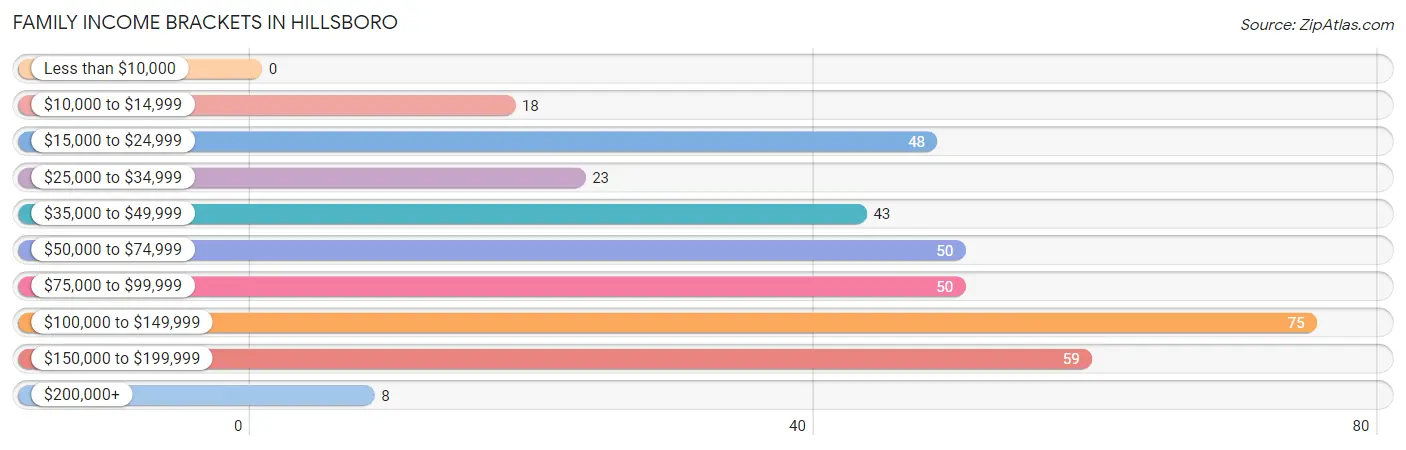
| Income Bracket | # Families | % Families |
| Less than $10,000 | 0 | 0.0% |
| $10,000 to $14,999 | 18 | 4.8% |
| $15,000 to $24,999 | 48 | 12.8% |
| $25,000 to $34,999 | 23 | 6.1% |
| $35,000 to $49,999 | 43 | 11.5% |
| $50,000 to $74,999 | 50 | 13.4% |
| $75,000 to $99,999 | 50 | 13.4% |
| $100,000 to $149,999 | 75 | 20.1% |
| $150,000 to $199,999 | 59 | 15.8% |
| $200,000+ | 8 | 2.1% |
Family Income by Famaliy Size in Hillsboro
5-person families (13 | 3.5%) account for the highest median family income in Hillsboro with $138,125 per family, while 2-person families (237 | 63.4%) have the highest median income of $35,312 per family member.
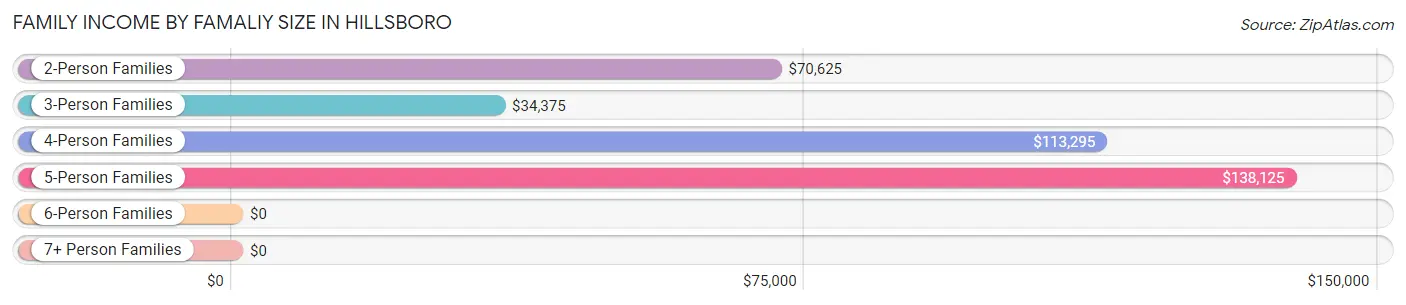
| Income Bracket | # Families | Median Income |
| 2-Person Families | 237 (63.4%) | $70,625 |
| 3-Person Families | 52 (13.9%) | $34,375 |
| 4-Person Families | 63 (16.8%) | $113,295 |
| 5-Person Families | 13 (3.5%) | $138,125 |
| 6-Person Families | 6 (1.6%) | $0 |
| 7+ Person Families | 3 (0.8%) | $0 |
| Total | 374 (100.0%) | $78,158 |
Family Income by Number of Earners in Hillsboro
The median family income in Hillsboro is $78,158, with families comprising 3+ earners (19) having the highest median family income of $163,438, while families with no earners (72) have the lowest median family income of $29,167, accounting for 5.1% and 19.3% of families, respectively.
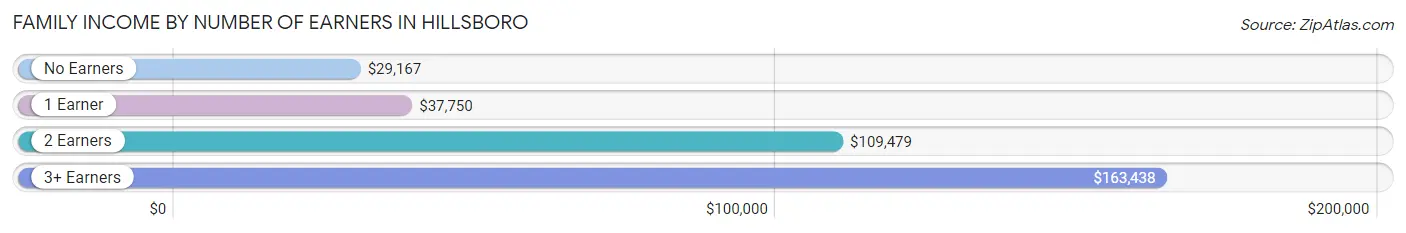
| Number of Earners | # Families | Median Income |
| No Earners | 72 (19.3%) | $29,167 |
| 1 Earner | 82 (21.9%) | $37,750 |
| 2 Earners | 201 (53.7%) | $109,479 |
| 3+ Earners | 19 (5.1%) | $163,438 |
| Total | 374 (100.0%) | $78,158 |
Household Income in Hillsboro
Household Income Brackets in Hillsboro
With 91 households falling in the category, the $50,000 to $74,999 income range is the most frequent in Hillsboro, accounting for 15.7% of all households. In contrast, only 8 households (1.4%) fall into the $200,000+ income bracket, making it the least populous group.
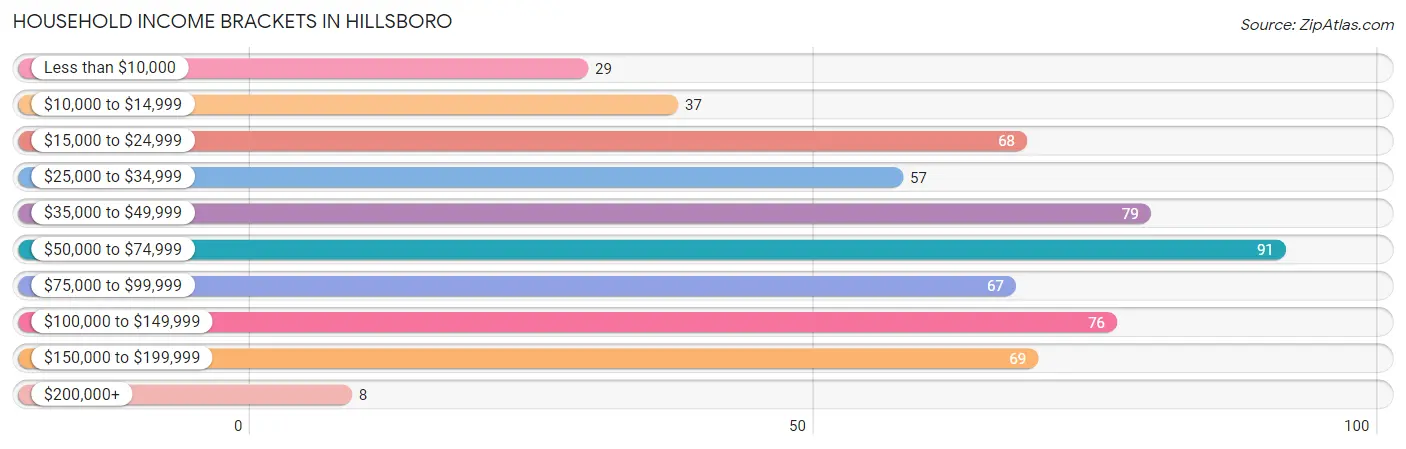
| Income Bracket | # Households | % Households |
| Less than $10,000 | 29 | 5.0% |
| $10,000 to $14,999 | 37 | 6.4% |
| $15,000 to $24,999 | 68 | 11.7% |
| $25,000 to $34,999 | 57 | 9.8% |
| $35,000 to $49,999 | 79 | 13.6% |
| $50,000 to $74,999 | 91 | 15.7% |
| $75,000 to $99,999 | 67 | 11.5% |
| $100,000 to $149,999 | 76 | 13.1% |
| $150,000 to $199,999 | 69 | 11.9% |
| $200,000+ | 8 | 1.4% |
Household Income by Householder Age in Hillsboro
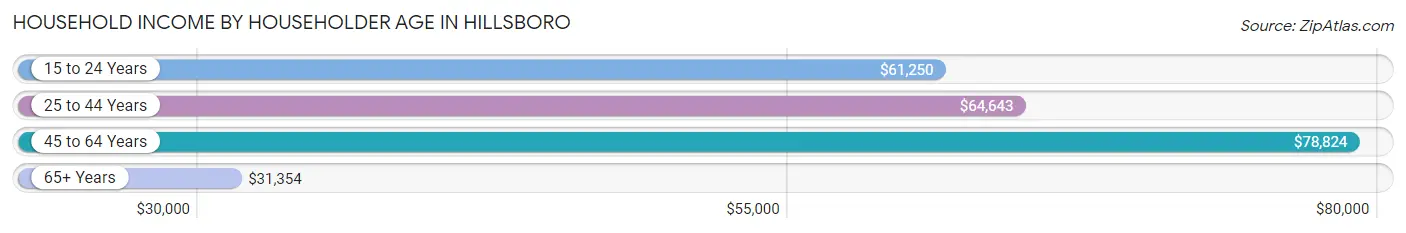
The median household income in Hillsboro is $58,281, with the highest median household income of $78,824 found in the 45 to 64 years age bracket for the primary householder. A total of 194 households (33.4%) fall into this category. Meanwhile, the 65+ years age bracket for the primary householder has the lowest median household income of $31,354, with 225 households (38.7%) in this group.
| Income Bracket | # Households | Median Income |
| 15 to 24 Years | 22 (3.8%) | $61,250 |
| 25 to 44 Years | 140 (24.1%) | $64,643 |
| 45 to 64 Years | 194 (33.4%) | $78,824 |
| 65+ Years | 225 (38.7%) | $31,354 |
| Total | 581 (100.0%) | $58,281 |
Poverty in Hillsboro
Income Below Poverty by Sex and Age in Hillsboro
With 12.2% poverty level for males and 16.2% for females among the residents of Hillsboro, 75 year old and over males and 75 year old and over females are the most vulnerable to poverty, with 23 males (31.9%) and 25 females (42.4%) in their respective age groups living below the poverty level.
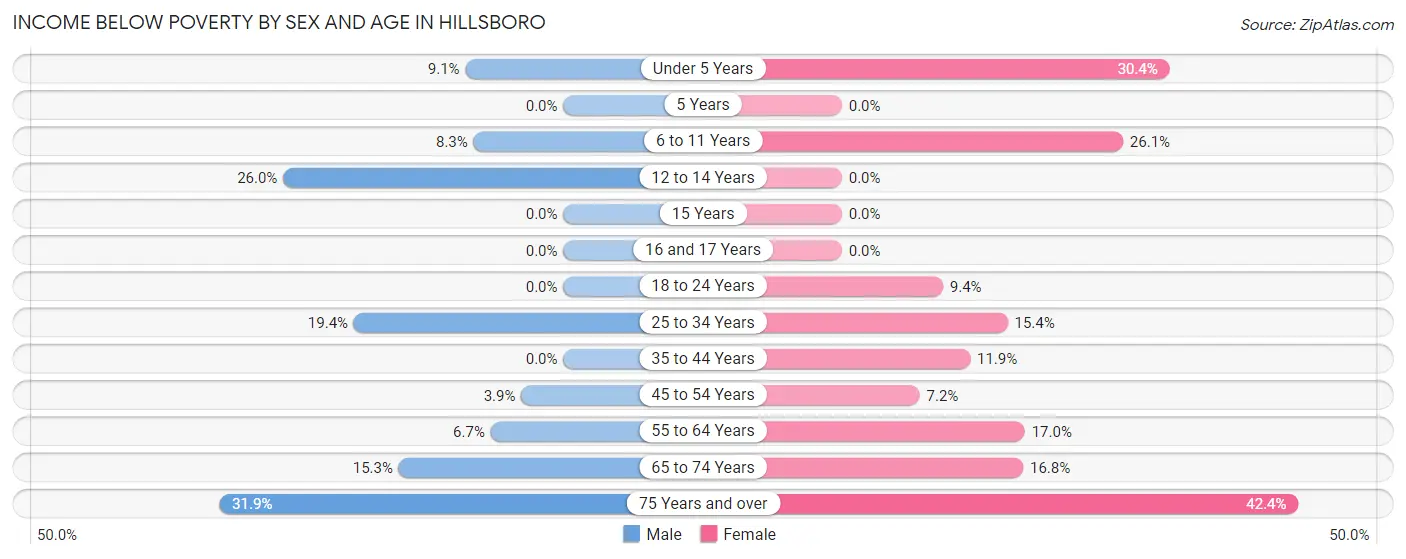
| Age Bracket | Male | Female |
| Under 5 Years | 2 (9.1%) | 7 (30.4%) |
| 5 Years | 0 (0.0%) | 0 (0.0%) |
| 6 to 11 Years | 8 (8.3%) | 6 (26.1%) |
| 12 to 14 Years | 13 (26.0%) | 0 (0.0%) |
| 15 Years | 0 (0.0%) | 0 (0.0%) |
| 16 and 17 Years | 0 (0.0%) | 0 (0.0%) |
| 18 to 24 Years | 0 (0.0%) | 3 (9.4%) |
| 25 to 34 Years | 14 (19.4%) | 8 (15.4%) |
| 35 to 44 Years | 0 (0.0%) | 10 (11.9%) |
| 45 to 54 Years | 3 (3.9%) | 7 (7.2%) |
| 55 to 64 Years | 6 (6.7%) | 9 (17.0%) |
| 65 to 74 Years | 20 (15.3%) | 18 (16.8%) |
| 75 Years and over | 23 (31.9%) | 25 (42.4%) |
| Total | 89 (12.2%) | 93 (16.2%) |
Income Above Poverty by Sex and Age in Hillsboro
According to the poverty statistics in Hillsboro, males aged 5 years and females aged 5 years are the age groups that are most secure financially, with 100.0% of males and 100.0% of females in these age groups living above the poverty line.
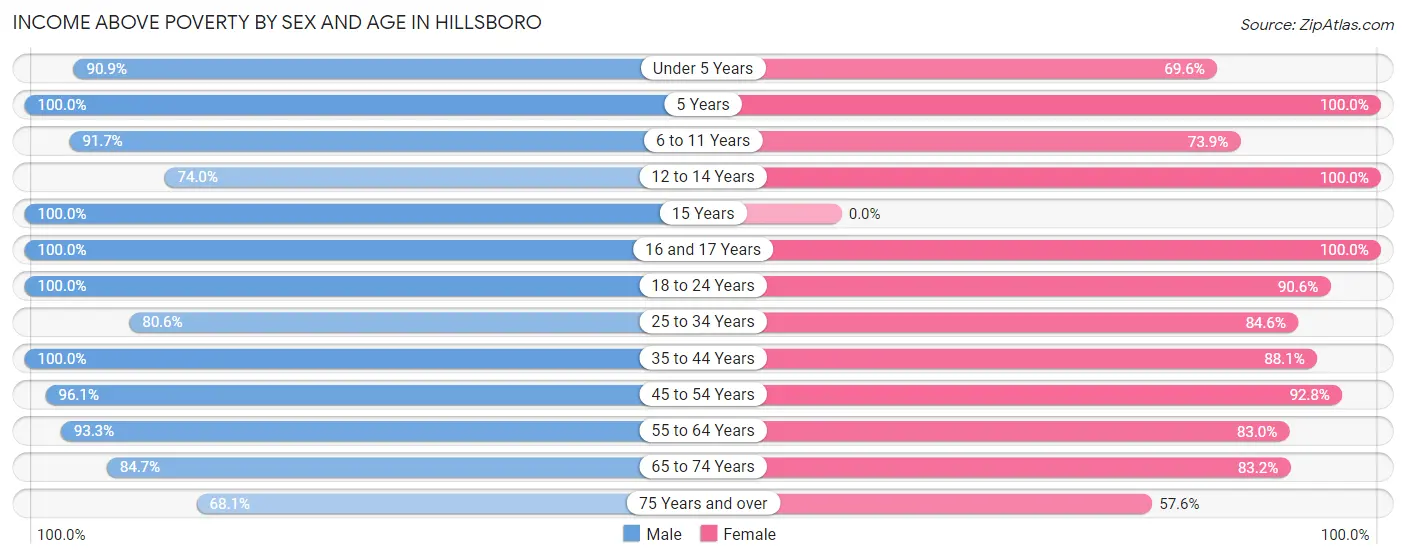
| Age Bracket | Male | Female |
| Under 5 Years | 20 (90.9%) | 16 (69.6%) |
| 5 Years | 3 (100.0%) | 3 (100.0%) |
| 6 to 11 Years | 88 (91.7%) | 17 (73.9%) |
| 12 to 14 Years | 37 (74.0%) | 22 (100.0%) |
| 15 Years | 26 (100.0%) | 0 (0.0%) |
| 16 and 17 Years | 8 (100.0%) | 21 (100.0%) |
| 18 to 24 Years | 18 (100.0%) | 29 (90.6%) |
| 25 to 34 Years | 58 (80.6%) | 44 (84.6%) |
| 35 to 44 Years | 68 (100.0%) | 74 (88.1%) |
| 45 to 54 Years | 74 (96.1%) | 90 (92.8%) |
| 55 to 64 Years | 83 (93.3%) | 44 (83.0%) |
| 65 to 74 Years | 111 (84.7%) | 89 (83.2%) |
| 75 Years and over | 49 (68.1%) | 34 (57.6%) |
| Total | 643 (87.8%) | 483 (83.9%) |
Income Below Poverty Among Married-Couple Families in Hillsboro
The poverty statistics for married-couple families in Hillsboro show that 7.7% or 21 of the total 271 families live below the poverty line. Families with 3 or 4 children have the highest poverty rate of 13.6%, comprising of 3 families. On the other hand, families with 1 or 2 children have the lowest poverty rate of 0.0%, which includes 0 families.
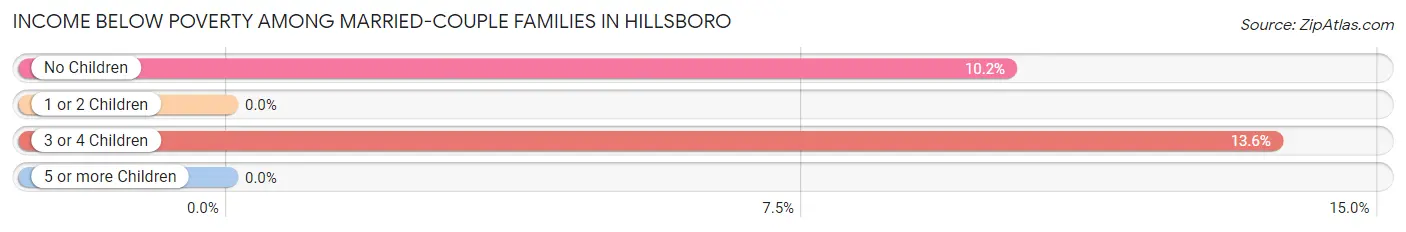
| Children | Above Poverty | Below Poverty |
| No Children | 159 (89.8%) | 18 (10.2%) |
| 1 or 2 Children | 72 (100.0%) | 0 (0.0%) |
| 3 or 4 Children | 19 (86.4%) | 3 (13.6%) |
| 5 or more Children | 0 (0.0%) | 0 (0.0%) |
| Total | 250 (92.2%) | 21 (7.7%) |
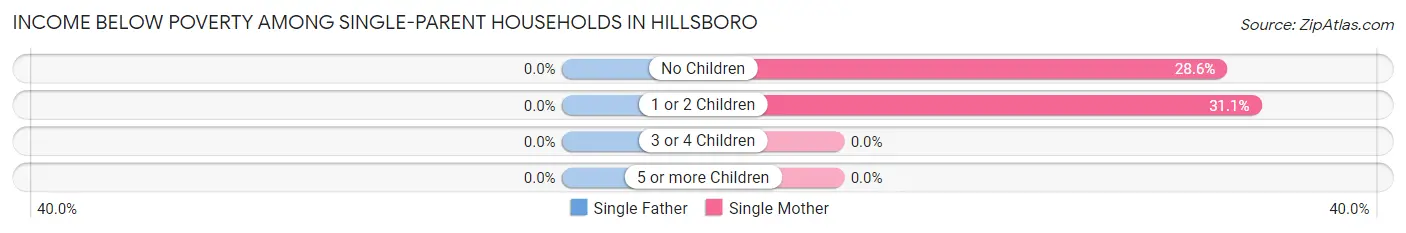
Income Below Poverty Among Single-Parent Households in Hillsboro
| Children | Single Father | Single Mother |
| No Children | 0 (0.0%) | 6 (28.6%) |
| 1 or 2 Children | 0 (0.0%) | 14 (31.1%) |
| 3 or 4 Children | 0 (0.0%) | 0 (0.0%) |
| 5 or more Children | 0 (0.0%) | 0 (0.0%) |
| Total | 0 (0.0%) | 20 (29.0%) |
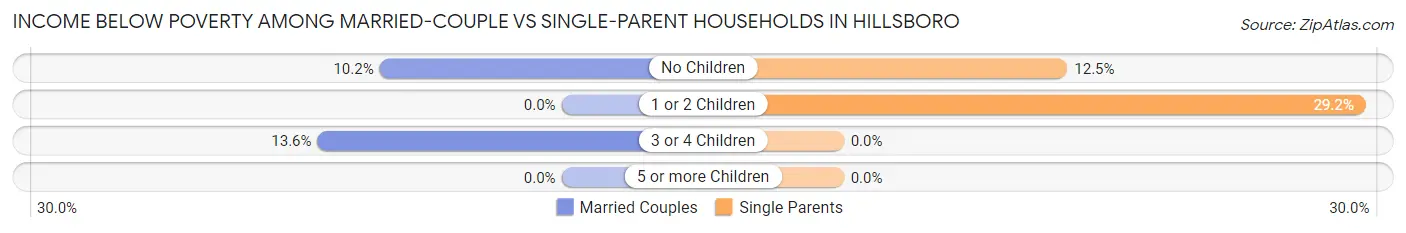
Income Below Poverty Among Married-Couple vs Single-Parent Households in Hillsboro
The poverty data for Hillsboro shows that 21 of the married-couple family households (7.7%) and 20 of the single-parent households (19.4%) are living below the poverty level. Within the married-couple family households, those with 3 or 4 children have the highest poverty rate, with 3 households (13.6%) falling below the poverty line. Among the single-parent households, those with 1 or 2 children have the highest poverty rate, with 14 household (29.2%) living below poverty.
| Children | Married-Couple Families | Single-Parent Households |
| No Children | 18 (10.2%) | 6 (12.5%) |
| 1 or 2 Children | 0 (0.0%) | 14 (29.2%) |
| 3 or 4 Children | 3 (13.6%) | 0 (0.0%) |
| 5 or more Children | 0 (0.0%) | 0 (0.0%) |
| Total | 21 (7.7%) | 20 (19.4%) |
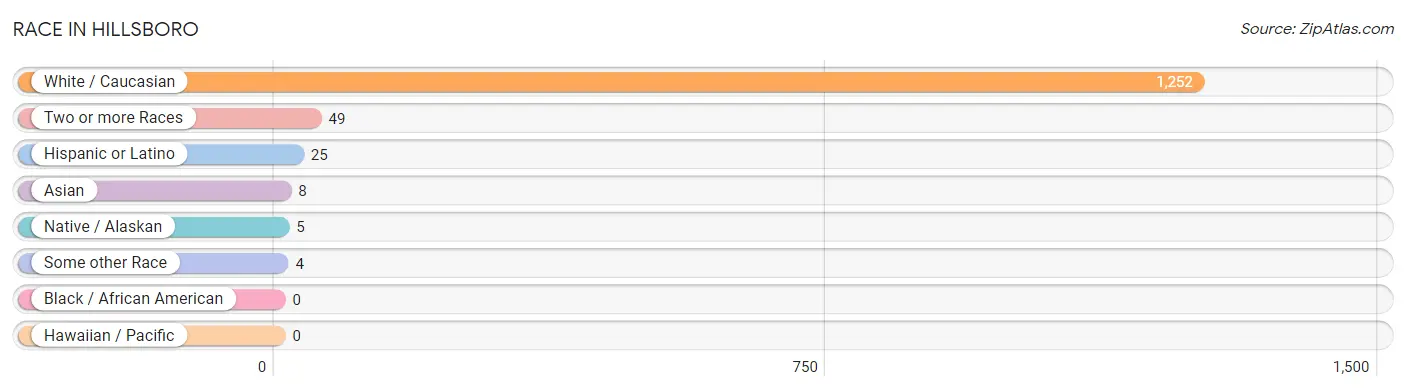
Race in Hillsboro
The most populous races in Hillsboro are White / Caucasian (1,252 | 95.0%), Two or more Races (49 | 3.7%), and Hispanic or Latino (25 | 1.9%).
| Race | # Population | % Population |
| Asian | 8 | 0.6% |
| Black / African American | 0 | 0.0% |
| Hawaiian / Pacific | 0 | 0.0% |
| Hispanic or Latino | 25 | 1.9% |
| Native / Alaskan | 5 | 0.4% |
| White / Caucasian | 1,252 | 95.0% |
| Two or more Races | 49 | 3.7% |
| Some other Race | 4 | 0.3% |
| Total | 1,318 | 100.0% |
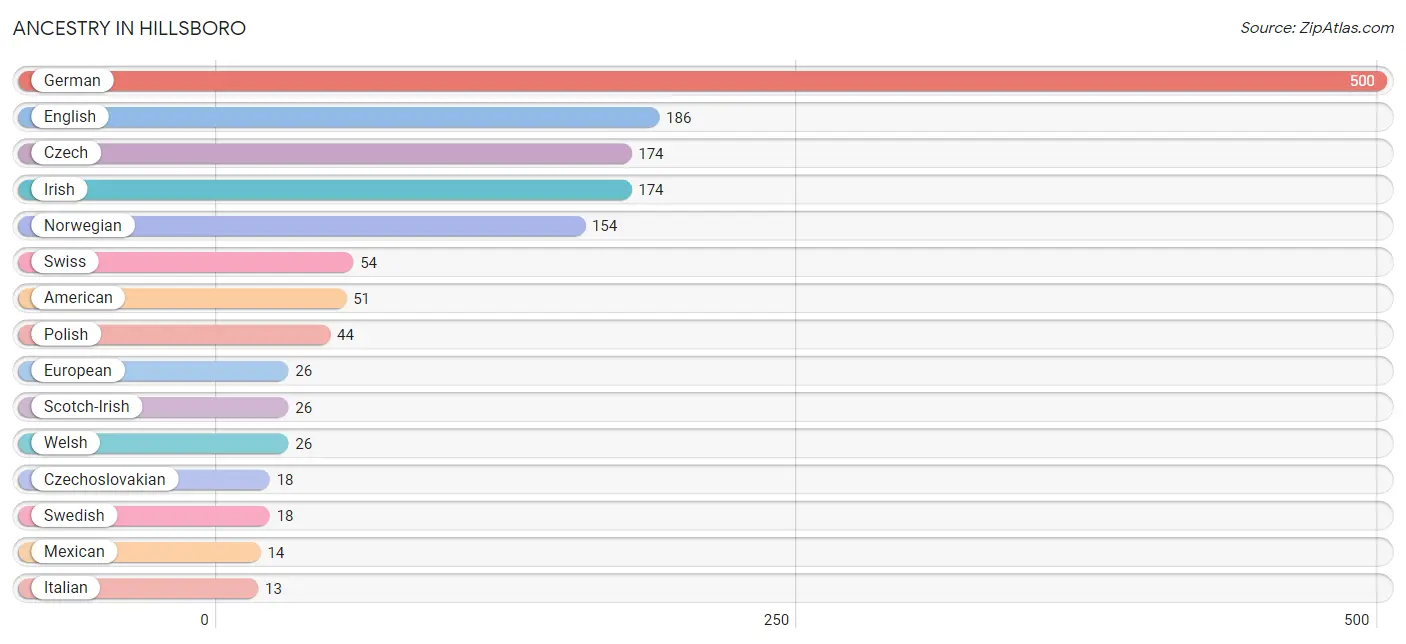
Ancestry in Hillsboro
The most populous ancestries reported in Hillsboro are German (500 | 37.9%), English (186 | 14.1%), Czech (174 | 13.2%), Irish (174 | 13.2%), and Norwegian (154 | 11.7%), together accounting for 90.1% of all Hillsboro residents.
| Ancestry | # Population | % Population |
| American | 51 | 3.9% |
| Arab | 5 | 0.4% |
| Cherokee | 1 | 0.1% |
| Colombian | 6 | 0.5% |
| Cuban | 5 | 0.4% |
| Czech | 174 | 13.2% |
| Czechoslovakian | 18 | 1.4% |
| Danish | 11 | 0.8% |
| Dutch | 10 | 0.8% |
| English | 186 | 14.1% |
| Estonian | 8 | 0.6% |
| European | 26 | 2.0% |
| French | 12 | 0.9% |
| German | 500 | 37.9% |
| Hungarian | 9 | 0.7% |
| Irish | 174 | 13.2% |
| Italian | 13 | 1.0% |
| Korean | 8 | 0.6% |
| Lebanese | 5 | 0.4% |
| Lithuanian | 5 | 0.4% |
| Mexican | 14 | 1.1% |
| Mexican American Indian | 5 | 0.4% |
| Norwegian | 154 | 11.7% |
| Polish | 44 | 3.3% |
| Russian | 7 | 0.5% |
| Scandinavian | 4 | 0.3% |
| Scotch-Irish | 26 | 2.0% |
| Scottish | 10 | 0.8% |
| South American | 6 | 0.5% |
| Swedish | 18 | 1.4% |
| Swiss | 54 | 4.1% |
| Welsh | 26 | 2.0% | View All 32 Rows |
Immigrants in Hillsboro
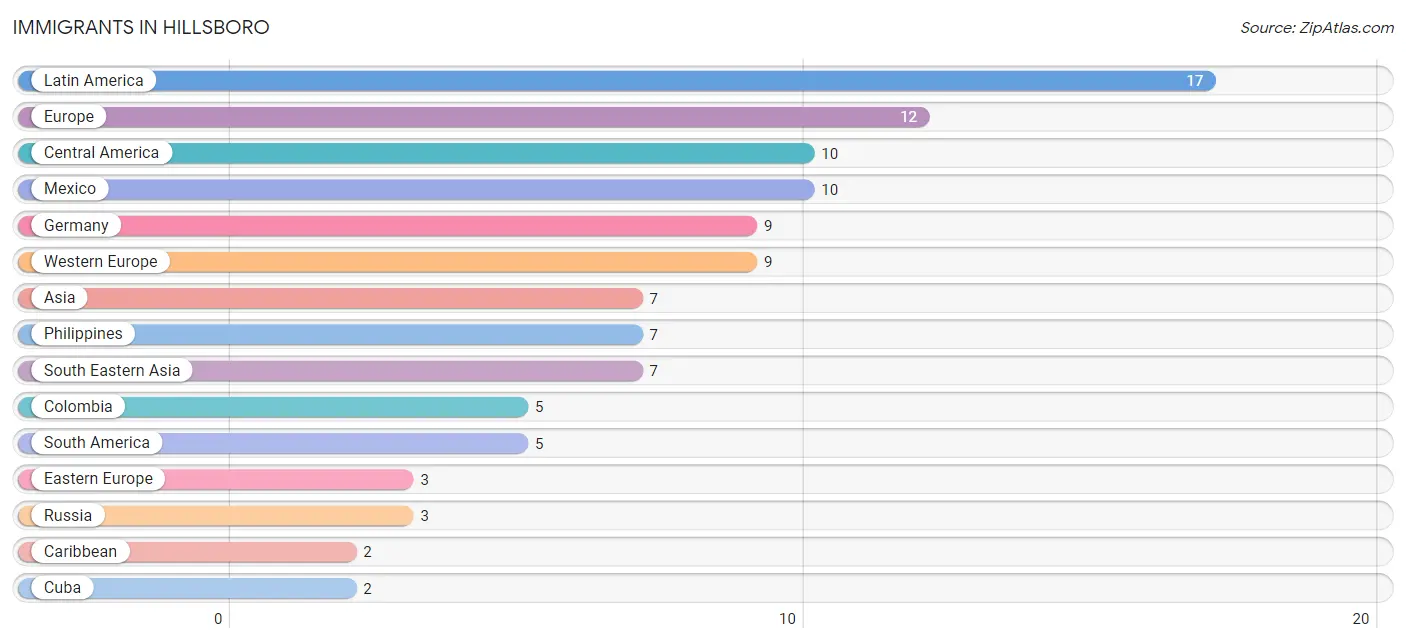
The most numerous immigrant groups reported in Hillsboro came from Latin America (17 | 1.3%), Europe (12 | 0.9%), Central America (10 | 0.8%), Mexico (10 | 0.8%), and Germany (9 | 0.7%), together accounting for 4.4% of all Hillsboro residents.
| Immigration Origin | # Population | % Population |
| Asia | 7 | 0.5% |
| Caribbean | 2 | 0.2% |
| Central America | 10 | 0.8% |
| Colombia | 5 | 0.4% |
| Cuba | 2 | 0.2% |
| Eastern Europe | 3 | 0.2% |
| Europe | 12 | 0.9% |
| Germany | 9 | 0.7% |
| Latin America | 17 | 1.3% |
| Mexico | 10 | 0.8% |
| Philippines | 7 | 0.5% |
| Russia | 3 | 0.2% |
| South America | 5 | 0.4% |
| South Eastern Asia | 7 | 0.5% |
| Western Europe | 9 | 0.7% | View All 15 Rows |
Sex and Age in Hillsboro
Sex and Age in Hillsboro
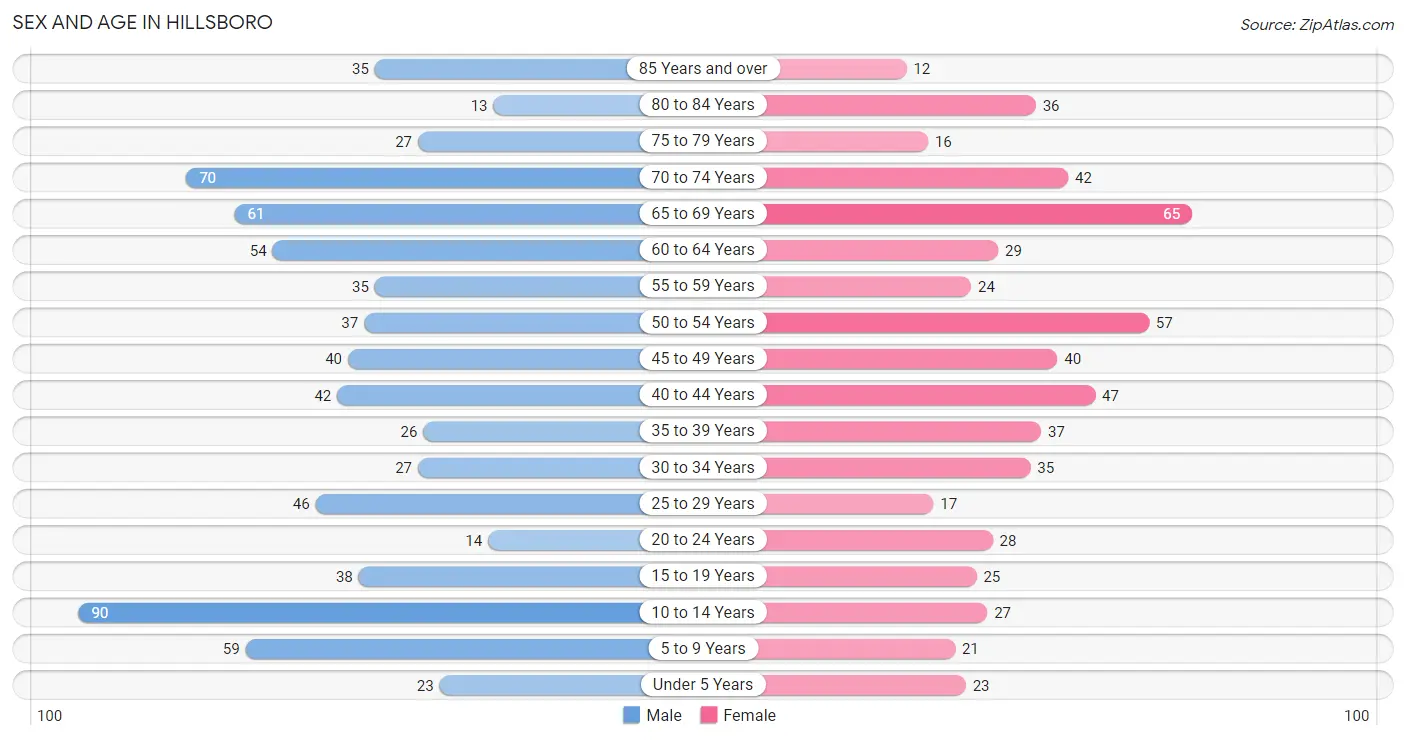
The most populous age groups in Hillsboro are 10 to 14 Years (90 | 12.2%) for men and 65 to 69 Years (65 | 11.2%) for women.
| Age Bracket | Male | Female |
| Under 5 Years | 23 (3.1%) | 23 (4.0%) |
| 5 to 9 Years | 59 (8.0%) | 21 (3.6%) |
| 10 to 14 Years | 90 (12.2%) | 27 (4.6%) |
| 15 to 19 Years | 38 (5.2%) | 25 (4.3%) |
| 20 to 24 Years | 14 (1.9%) | 28 (4.8%) |
| 25 to 29 Years | 46 (6.2%) | 17 (2.9%) |
| 30 to 34 Years | 27 (3.7%) | 35 (6.0%) |
| 35 to 39 Years | 26 (3.5%) | 37 (6.4%) |
| 40 to 44 Years | 42 (5.7%) | 47 (8.1%) |
| 45 to 49 Years | 40 (5.4%) | 40 (6.9%) |
| 50 to 54 Years | 37 (5.0%) | 57 (9.8%) |
| 55 to 59 Years | 35 (4.8%) | 24 (4.1%) |
| 60 to 64 Years | 54 (7.3%) | 29 (5.0%) |
| 65 to 69 Years | 61 (8.3%) | 65 (11.2%) |
| 70 to 74 Years | 70 (9.5%) | 42 (7.2%) |
| 75 to 79 Years | 27 (3.7%) | 16 (2.8%) |
| 80 to 84 Years | 13 (1.8%) | 36 (6.2%) |
| 85 Years and over | 35 (4.8%) | 12 (2.1%) |
| Total | 737 (100.0%) | 581 (100.0%) |
Families and Households in Hillsboro
Median Family Size in Hillsboro
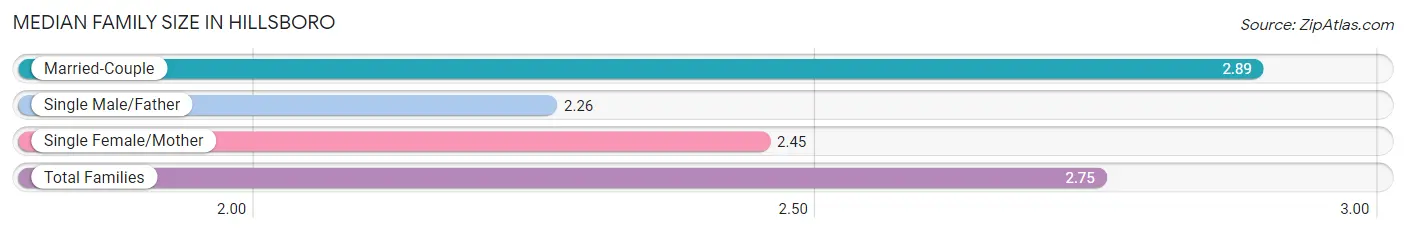
The median family size in Hillsboro is 2.75 persons per family, with married-couple families (271 | 72.5%) accounting for the largest median family size of 2.89 persons per family. On the other hand, single male/father families (34 | 9.1%) represent the smallest median family size with 2.26 persons per family.
| Family Type | # Families | Family Size |
| Married-Couple | 271 (72.5%) | 2.89 |
| Single Male/Father | 34 (9.1%) | 2.26 |
| Single Female/Mother | 69 (18.4%) | 2.45 |
| Total Families | 374 (100.0%) | 2.75 |
Median Household Size in Hillsboro
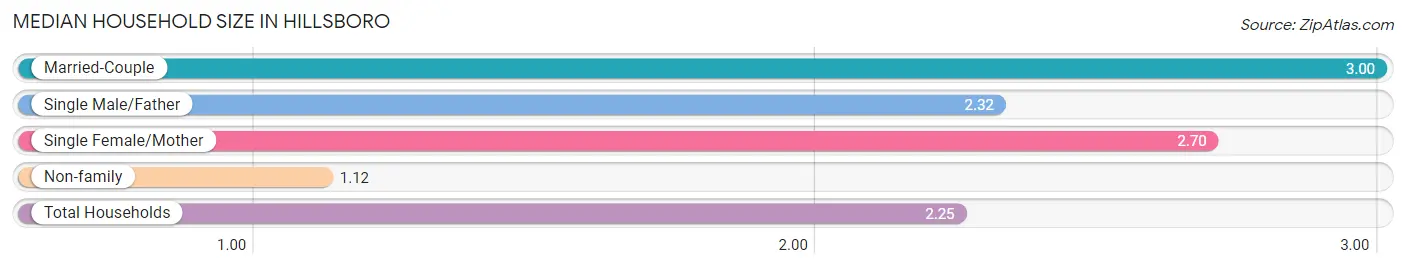
The median household size in Hillsboro is 2.25 persons per household, with married-couple households (271 | 46.6%) accounting for the largest median household size of 3 persons per household. non-family households (207 | 35.6%) represent the smallest median household size with 1.12 persons per household.
| Household Type | # Households | Household Size |
| Married-Couple | 271 (46.6%) | 3.00 |
| Single Male/Father | 34 (5.9%) | 2.32 |
| Single Female/Mother | 69 (11.9%) | 2.70 |
| Non-family | 207 (35.6%) | 1.12 |
| Total Households | 581 (100.0%) | 2.25 |
Household Size by Marriage Status in Hillsboro
Out of a total of 581 households in Hillsboro, 374 (64.4%) are family households, while 207 (35.6%) are nonfamily households. The most numerous type of family households are 2-person households, comprising 223, and the most common type of nonfamily households are 1-person households, comprising 179.
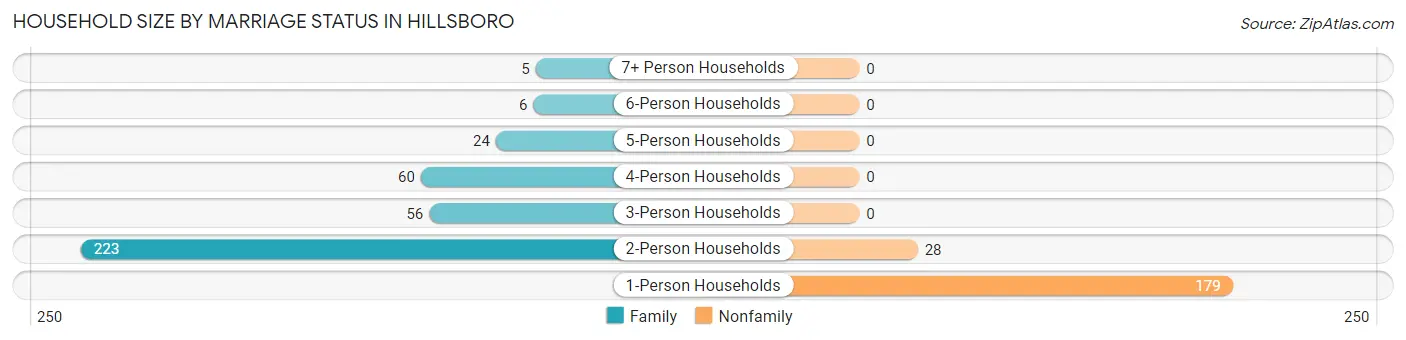
| Household Size | Family Households | Nonfamily Households |
| 1-Person Households | - | 179 (30.8%) |
| 2-Person Households | 223 (38.4%) | 28 (4.8%) |
| 3-Person Households | 56 (9.6%) | 0 (0.0%) |
| 4-Person Households | 60 (10.3%) | 0 (0.0%) |
| 5-Person Households | 24 (4.1%) | 0 (0.0%) |
| 6-Person Households | 6 (1.0%) | 0 (0.0%) |
| 7+ Person Households | 5 (0.9%) | 0 (0.0%) |
| Total | 374 (64.4%) | 207 (35.6%) |
Female Fertility in Hillsboro
Fertility by Age in Hillsboro
Average fertility rate in Hillsboro is 63.0 births per 1,000 women. Women in the age bracket of 20 to 34 years have the highest fertility rate with 100.0 births per 1,000 women. Women in the age bracket of 20 to 34 years acount for 53.3% of all women with births.
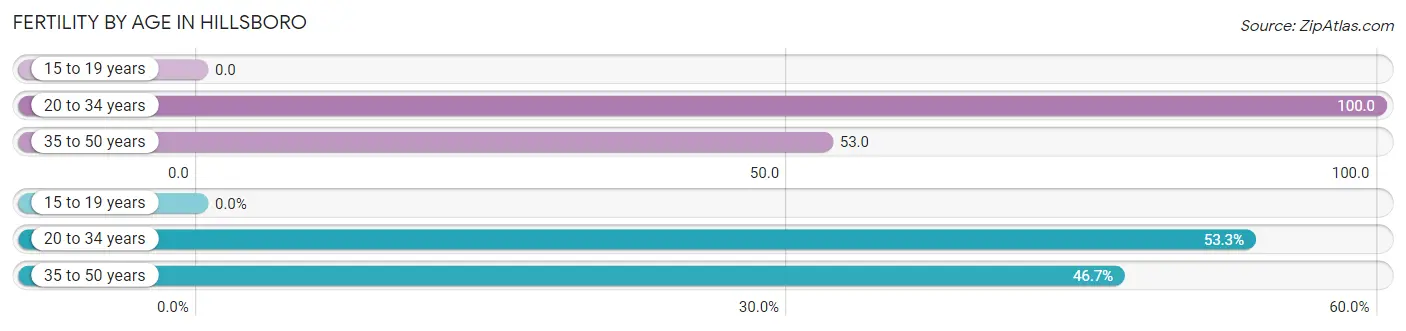
| Age Bracket | Women with Births | Births / 1,000 Women |
| 15 to 19 years | 0 (0.0%) | 0.0 |
| 20 to 34 years | 8 (53.3%) | 100.0 |
| 35 to 50 years | 7 (46.7%) | 53.0 |
| Total | 15 (100.0%) | 63.0 |
Fertility by Age by Marriage Status in Hillsboro
60.0% of women with births (15) in Hillsboro are married. The highest percentage of unmarried women with births falls into 35 to 50 years age bracket with 42.9% of them unmarried at the time of birth, while the lowest percentage of unmarried women with births belong to 20 to 34 years age bracket with 37.5% of them unmarried.
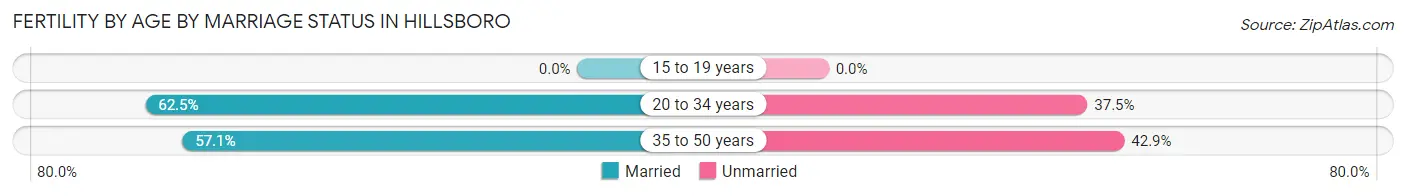
| Age Bracket | Married | Unmarried |
| 15 to 19 years | 0 (0.0%) | 0 (0.0%) |
| 20 to 34 years | 5 (62.5%) | 3 (37.5%) |
| 35 to 50 years | 4 (57.1%) | 3 (42.9%) |
| Total | 9 (60.0%) | 6 (40.0%) |
Fertility by Education in Hillsboro
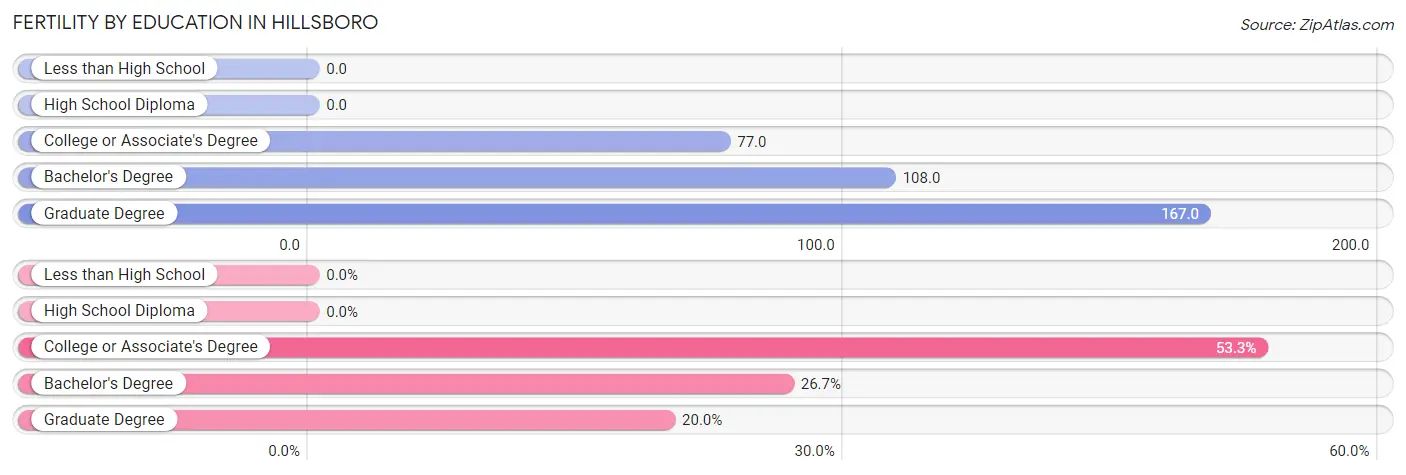
| Educational Attainment | Women with Births | Births / 1,000 Women |
| Less than High School | 0 (0.0%) | 0.0 |
| High School Diploma | 0 (0.0%) | 0.0 |
| College or Associate's Degree | 8 (53.3%) | 77.0 |
| Bachelor's Degree | 4 (26.7%) | 108.0 |
| Graduate Degree | 3 (20.0%) | 167.0 |
| Total | 15 (100.0%) | 63.0 |
Fertility by Education by Marriage Status in Hillsboro
40.0% of women with births in Hillsboro are unmarried. Women with the educational attainment of bachelor's degree are most likely to be married with 100.0% of them married at childbirth, while women with the educational attainment of graduate degree are least likely to be married with 100.0% of them unmarried at childbirth.
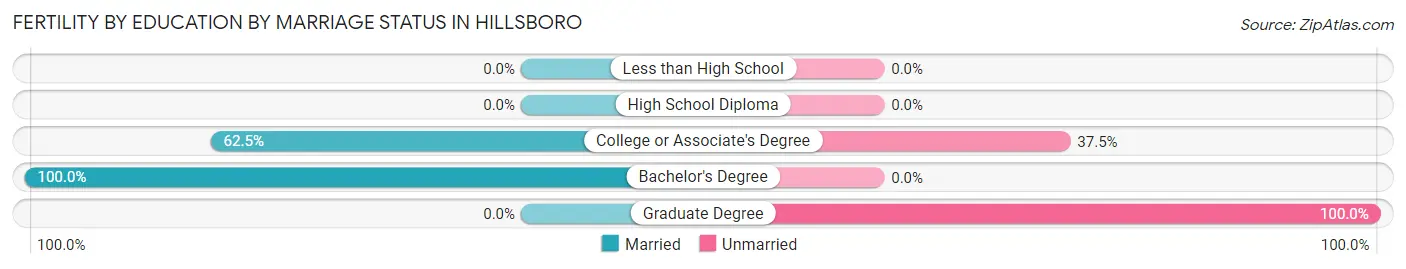
| Educational Attainment | Married | Unmarried |
| Less than High School | 0 (0.0%) | 0 (0.0%) |
| High School Diploma | 0 (0.0%) | 0 (0.0%) |
| College or Associate's Degree | 5 (62.5%) | 3 (37.5%) |
| Bachelor's Degree | 4 (100.0%) | 0 (0.0%) |
| Graduate Degree | 0 (0.0%) | 3 (100.0%) |
| Total | 9 (60.0%) | 6 (40.0%) |
Employment Characteristics in Hillsboro
Employment by Class of Employer in Hillsboro
Among the 587 employed individuals in Hillsboro, private company employees (382 | 65.1%), not-for-profit organizations (64 | 10.9%), and local government employees (63 | 10.7%) make up the most common classes of employment.
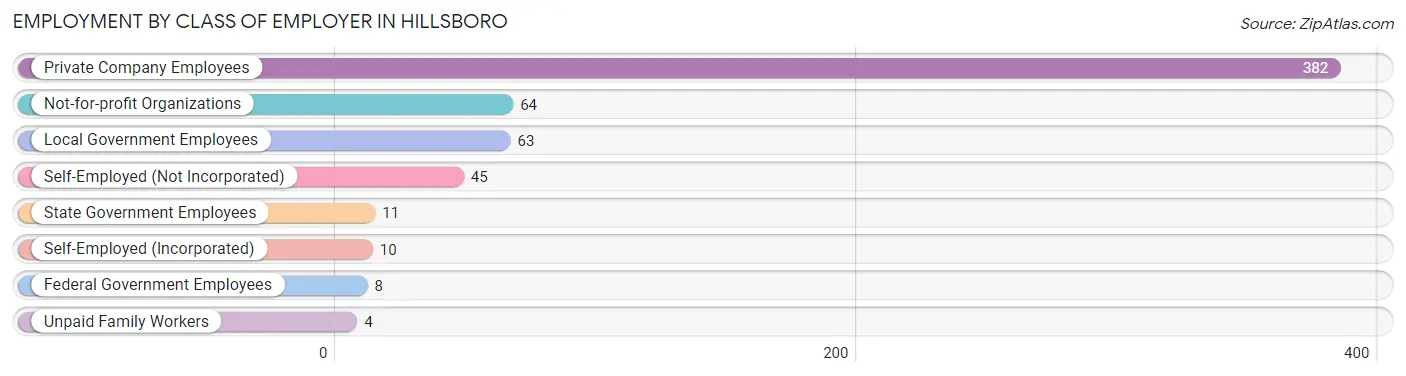
| Employer Class | # Employees | % Employees |
| Private Company Employees | 382 | 65.1% |
| Self-Employed (Incorporated) | 10 | 1.7% |
| Self-Employed (Not Incorporated) | 45 | 7.7% |
| Not-for-profit Organizations | 64 | 10.9% |
| Local Government Employees | 63 | 10.7% |
| State Government Employees | 11 | 1.9% |
| Federal Government Employees | 8 | 1.4% |
| Unpaid Family Workers | 4 | 0.7% |
| Total | 587 | 100.0% |
Employment Status by Age in Hillsboro
According to the labor force statistics for Hillsboro, out of the total population over 16 years of age (1,049), 60.7% or 637 individuals are in the labor force, with 5.3% or 34 of them unemployed. The age group with the highest labor force participation rate is 25 to 29 years, with 100.0% or 63 individuals in the labor force. Within the labor force, the 25 to 29 years age range has the highest percentage of unemployed individuals, with 14.3% or 9 of them being unemployed.
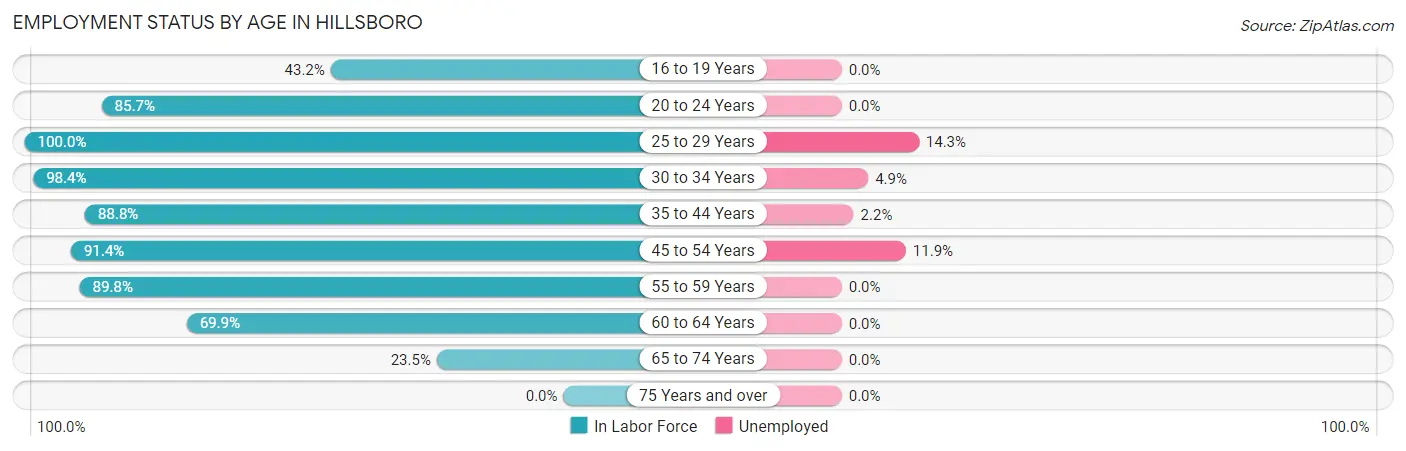
| Age Bracket | In Labor Force | Unemployed |
| 16 to 19 Years | 16 (43.2%) | 0 (0.0%) |
| 20 to 24 Years | 36 (85.7%) | 0 (0.0%) |
| 25 to 29 Years | 63 (100.0%) | 9 (14.3%) |
| 30 to 34 Years | 61 (98.4%) | 3 (4.9%) |
| 35 to 44 Years | 135 (88.8%) | 3 (2.2%) |
| 45 to 54 Years | 159 (91.4%) | 19 (11.9%) |
| 55 to 59 Years | 53 (89.8%) | 0 (0.0%) |
| 60 to 64 Years | 58 (69.9%) | 0 (0.0%) |
| 65 to 74 Years | 56 (23.5%) | 0 (0.0%) |
| 75 Years and over | 0 (0.0%) | 0 (0.0%) |
| Total | 637 (60.7%) | 34 (5.3%) |
Employment Status by Educational Attainment in Hillsboro
According to labor force statistics for Hillsboro, 89.2% of individuals (529) out of the total population between 25 and 64 years of age (593) are in the labor force, with 6.4% or 34 of them being unemployed. The group with the highest labor force participation rate are those with the educational attainment of college / associate degree, with 91.5% or 193 individuals in the labor force. Within the labor force, individuals with less than high school education have the highest percentage of unemployment, with 42.9% or 12 of them being unemployed.
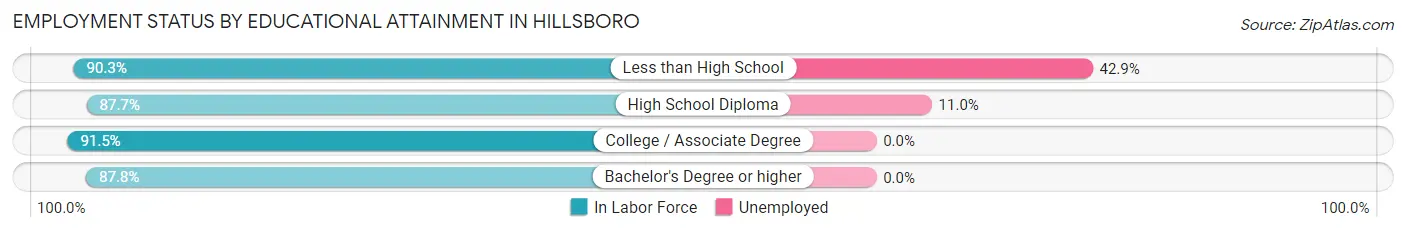
| Educational Attainment | In Labor Force | Unemployed |
| Less than High School | 28 (90.3%) | 13 (42.9%) |
| High School Diploma | 200 (87.7%) | 25 (11.0%) |
| College / Associate Degree | 193 (91.5%) | 0 (0.0%) |
| Bachelor's Degree or higher | 108 (87.8%) | 0 (0.0%) |
| Total | 529 (89.2%) | 38 (6.4%) |
Employment Occupations by Sex in Hillsboro
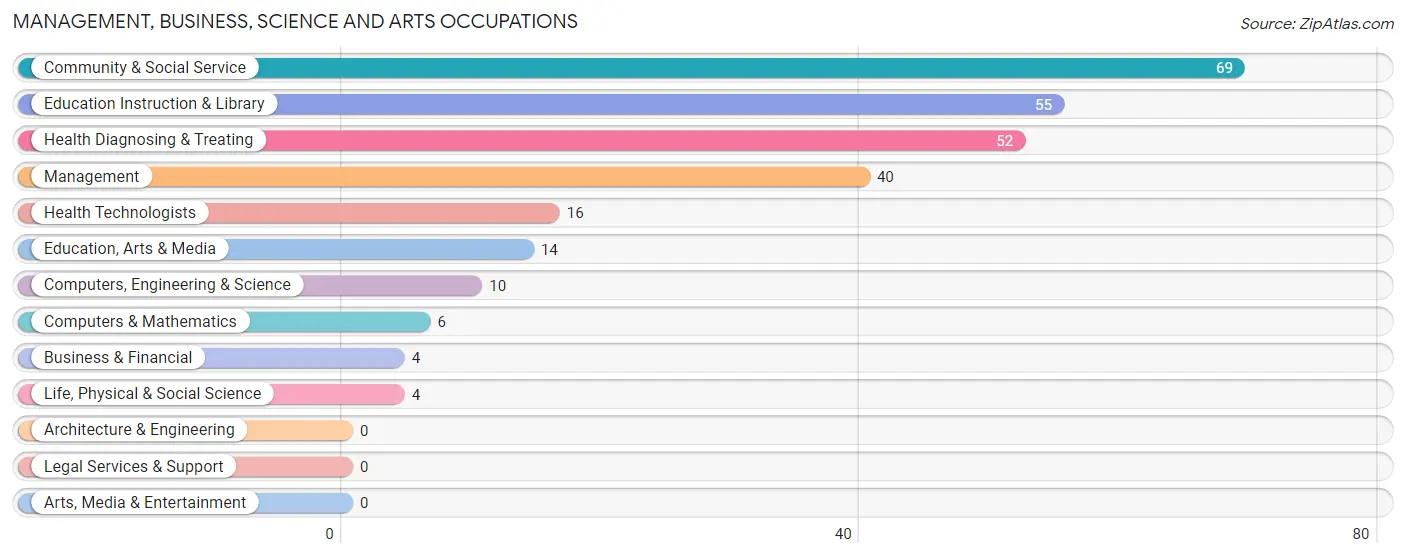
Management, Business, Science and Arts Occupations
The most common Management, Business, Science and Arts occupations in Hillsboro are Community & Social Service (69 | 11.4%), Education Instruction & Library (55 | 9.1%), Health Diagnosing & Treating (52 | 8.6%), Management (40 | 6.6%), and Health Technologists (16 | 2.6%).
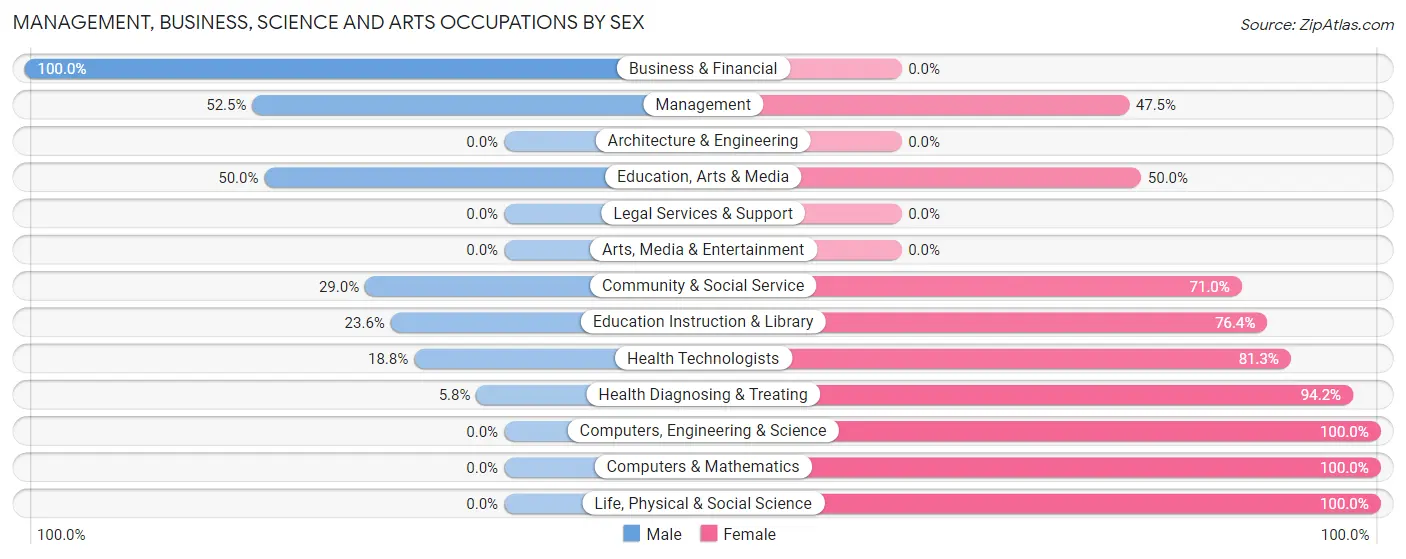
Management, Business, Science and Arts Occupations by Sex
Within the Management, Business, Science and Arts occupations in Hillsboro, the most male-oriented occupations are Business & Financial (100.0%), Management (52.5%), and Education, Arts & Media (50.0%), while the most female-oriented occupations are Computers, Engineering & Science (100.0%), Computers & Mathematics (100.0%), and Life, Physical & Social Science (100.0%).
| Occupation | Male | Female |
| Management | 21 (52.5%) | 19 (47.5%) |
| Business & Financial | 4 (100.0%) | 0 (0.0%) |
| Computers, Engineering & Science | 0 (0.0%) | 10 (100.0%) |
| Computers & Mathematics | 0 (0.0%) | 6 (100.0%) |
| Architecture & Engineering | 0 (0.0%) | 0 (0.0%) |
| Life, Physical & Social Science | 0 (0.0%) | 4 (100.0%) |
| Community & Social Service | 20 (29.0%) | 49 (71.0%) |
| Education, Arts & Media | 7 (50.0%) | 7 (50.0%) |
| Legal Services & Support | 0 (0.0%) | 0 (0.0%) |
| Education Instruction & Library | 13 (23.6%) | 42 (76.4%) |
| Arts, Media & Entertainment | 0 (0.0%) | 0 (0.0%) |
| Health Diagnosing & Treating | 3 (5.8%) | 49 (94.2%) |
| Health Technologists | 3 (18.8%) | 13 (81.2%) |
| Total (Category) | 48 (27.4%) | 127 (72.6%) |
| Total (Overall) | 277 (45.9%) | 326 (54.1%) |
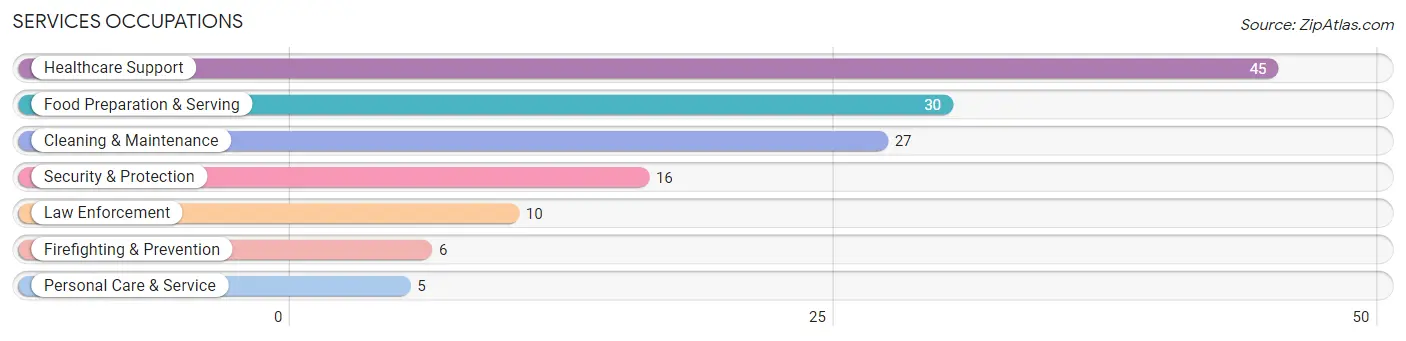
Services Occupations
The most common Services occupations in Hillsboro are Healthcare Support (45 | 7.5%), Food Preparation & Serving (30 | 5.0%), Cleaning & Maintenance (27 | 4.5%), Security & Protection (16 | 2.6%), and Law Enforcement (10 | 1.7%).
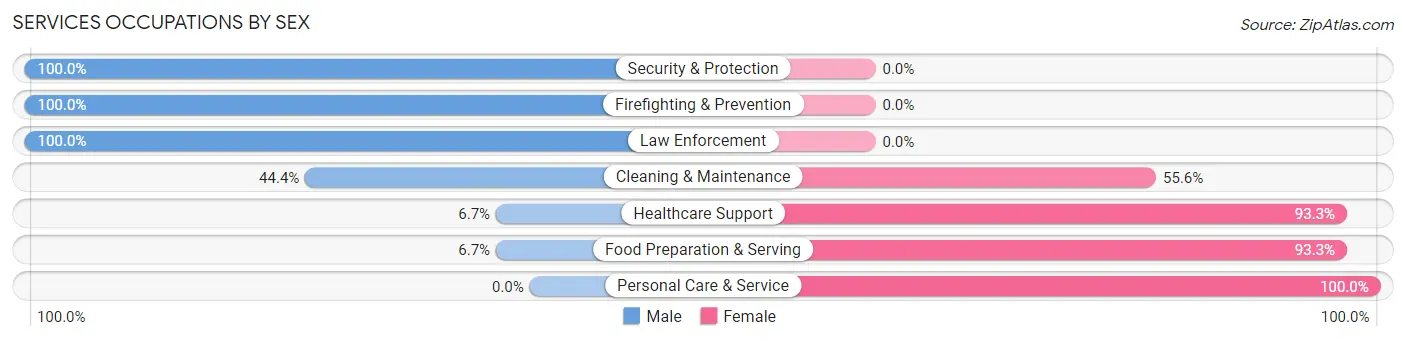
Services Occupations by Sex
Within the Services occupations in Hillsboro, the most male-oriented occupations are Security & Protection (100.0%), Firefighting & Prevention (100.0%), and Law Enforcement (100.0%), while the most female-oriented occupations are Personal Care & Service (100.0%), Healthcare Support (93.3%), and Food Preparation & Serving (93.3%).
| Occupation | Male | Female |
| Healthcare Support | 3 (6.7%) | 42 (93.3%) |
| Security & Protection | 16 (100.0%) | 0 (0.0%) |
| Firefighting & Prevention | 6 (100.0%) | 0 (0.0%) |
| Law Enforcement | 10 (100.0%) | 0 (0.0%) |
| Food Preparation & Serving | 2 (6.7%) | 28 (93.3%) |
| Cleaning & Maintenance | 12 (44.4%) | 15 (55.6%) |
| Personal Care & Service | 0 (0.0%) | 5 (100.0%) |
| Total (Category) | 33 (26.8%) | 90 (73.2%) |
| Total (Overall) | 277 (45.9%) | 326 (54.1%) |
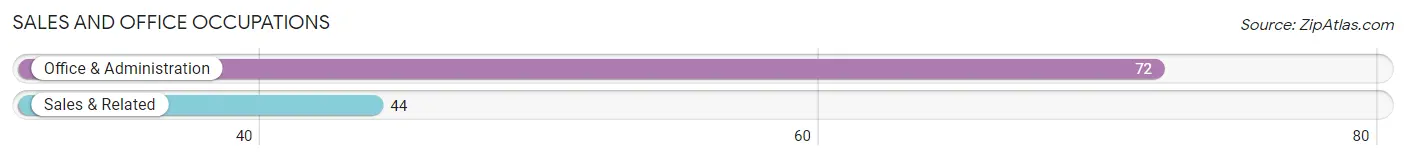
Sales and Office Occupations
The most common Sales and Office occupations in Hillsboro are Office & Administration (72 | 11.9%), and Sales & Related (44 | 7.3%).
Sales and Office Occupations by Sex
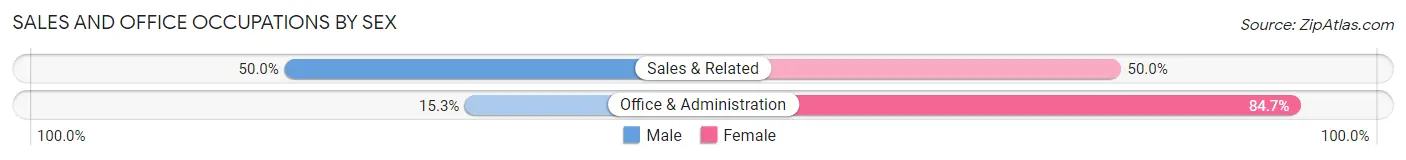
| Occupation | Male | Female |
| Sales & Related | 22 (50.0%) | 22 (50.0%) |
| Office & Administration | 11 (15.3%) | 61 (84.7%) |
| Total (Category) | 33 (28.4%) | 83 (71.6%) |
| Total (Overall) | 277 (45.9%) | 326 (54.1%) |
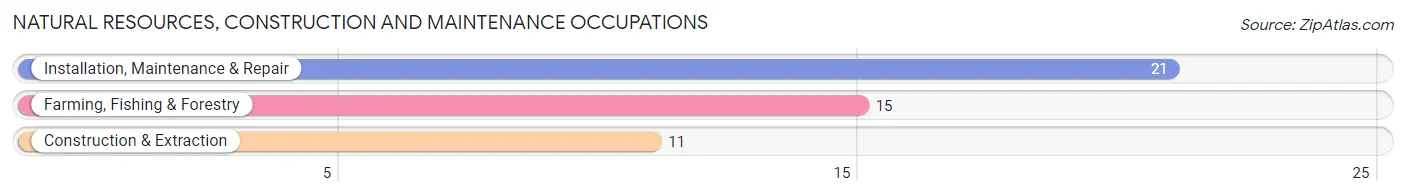
Natural Resources, Construction and Maintenance Occupations
The most common Natural Resources, Construction and Maintenance occupations in Hillsboro are Installation, Maintenance & Repair (21 | 3.5%), Farming, Fishing & Forestry (15 | 2.5%), and Construction & Extraction (11 | 1.8%).
Natural Resources, Construction and Maintenance Occupations by Sex
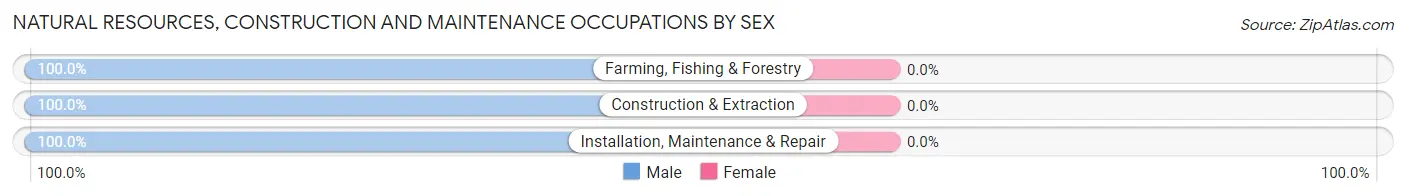
| Occupation | Male | Female |
| Farming, Fishing & Forestry | 15 (100.0%) | 0 (0.0%) |
| Construction & Extraction | 11 (100.0%) | 0 (0.0%) |
| Installation, Maintenance & Repair | 21 (100.0%) | 0 (0.0%) |
| Total (Category) | 47 (100.0%) | 0 (0.0%) |
| Total (Overall) | 277 (45.9%) | 326 (54.1%) |
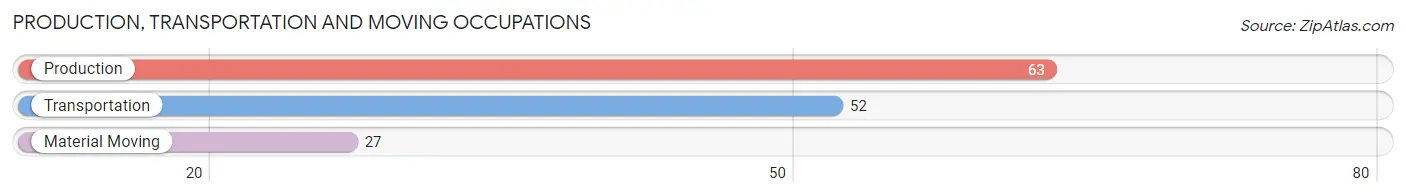
Production, Transportation and Moving Occupations
The most common Production, Transportation and Moving occupations in Hillsboro are Production (63 | 10.4%), Transportation (52 | 8.6%), and Material Moving (27 | 4.5%).
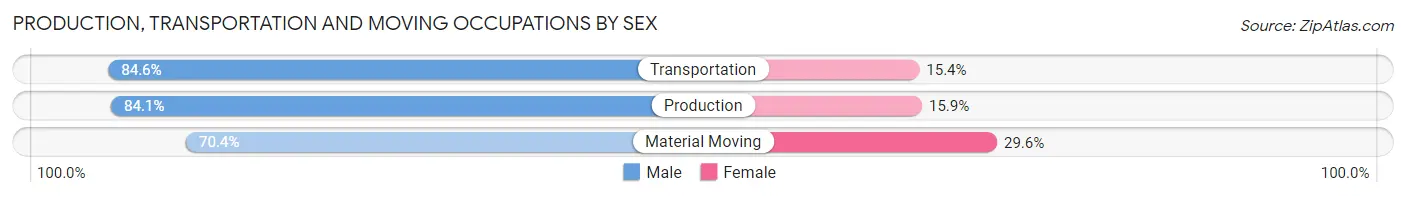
Production, Transportation and Moving Occupations by Sex
| Occupation | Male | Female |
| Production | 53 (84.1%) | 10 (15.9%) |
| Transportation | 44 (84.6%) | 8 (15.4%) |
| Material Moving | 19 (70.4%) | 8 (29.6%) |
| Total (Category) | 116 (81.7%) | 26 (18.3%) |
| Total (Overall) | 277 (45.9%) | 326 (54.1%) |
Employment Industries by Sex in Hillsboro
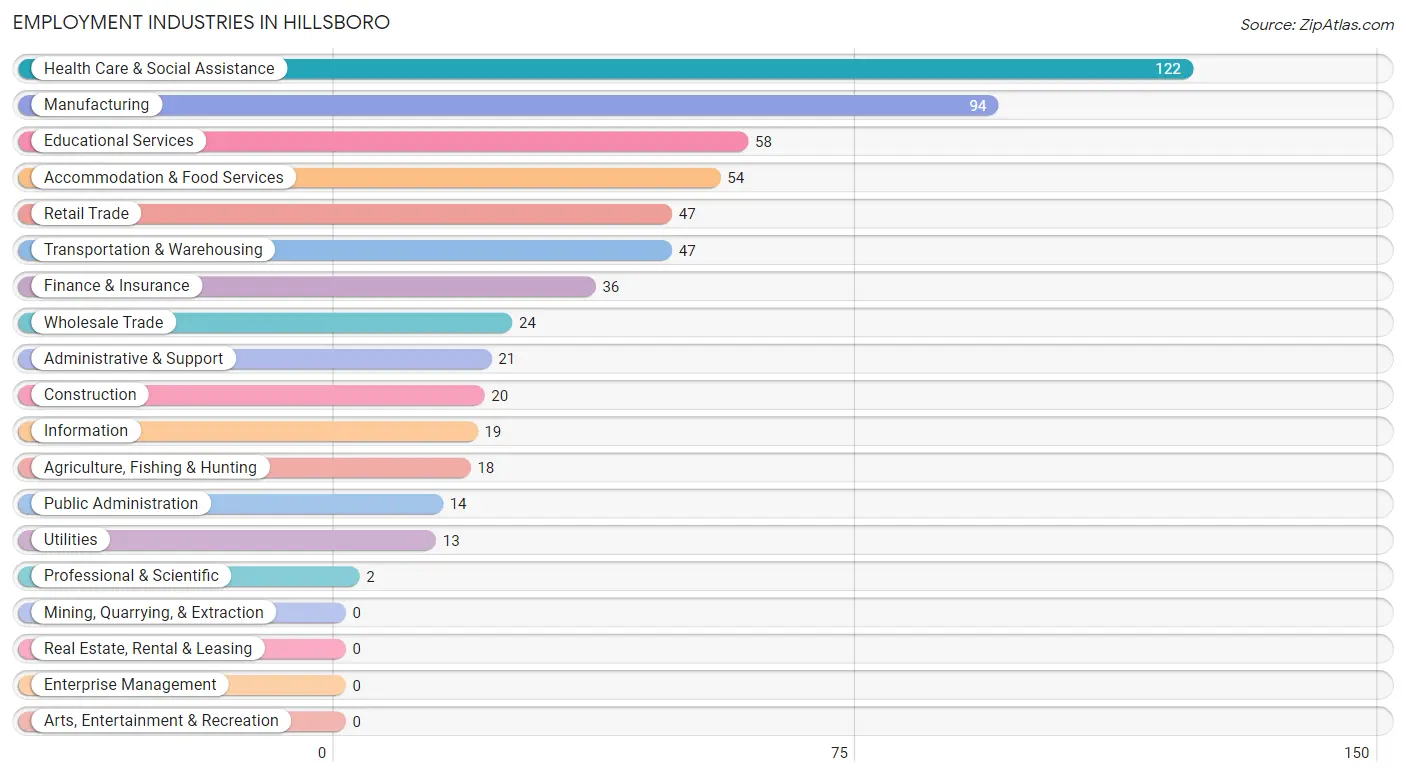
Employment Industries in Hillsboro
The major employment industries in Hillsboro include Health Care & Social Assistance (122 | 20.2%), Manufacturing (94 | 15.6%), Educational Services (58 | 9.6%), Accommodation & Food Services (54 | 9.0%), and Retail Trade (47 | 7.8%).
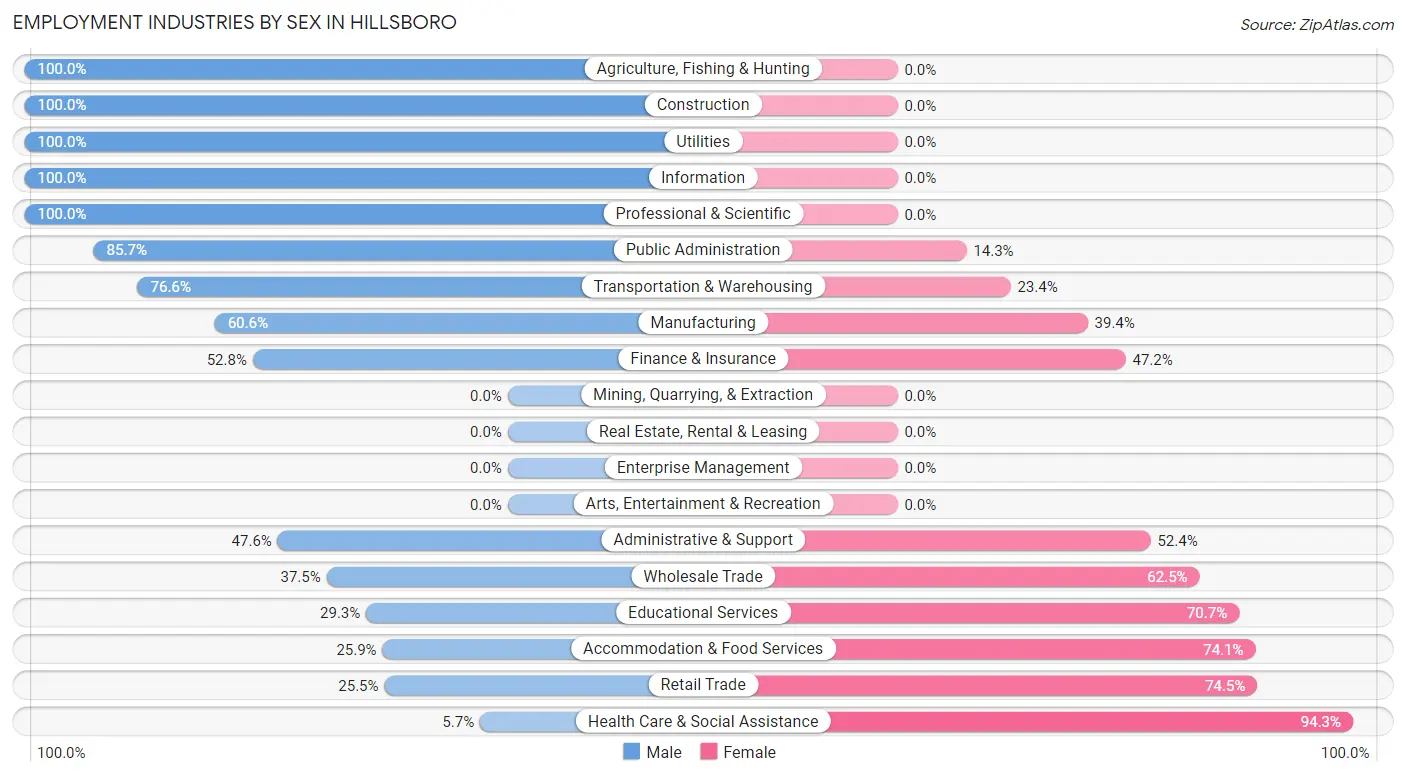
Employment Industries by Sex in Hillsboro
The Hillsboro industries that see more men than women are Agriculture, Fishing & Hunting (100.0%), Construction (100.0%), and Utilities (100.0%), whereas the industries that tend to have a higher number of women are Health Care & Social Assistance (94.3%), Retail Trade (74.5%), and Accommodation & Food Services (74.1%).
| Industry | Male | Female |
| Agriculture, Fishing & Hunting | 18 (100.0%) | 0 (0.0%) |
| Mining, Quarrying, & Extraction | 0 (0.0%) | 0 (0.0%) |
| Construction | 20 (100.0%) | 0 (0.0%) |
| Manufacturing | 57 (60.6%) | 37 (39.4%) |
| Wholesale Trade | 9 (37.5%) | 15 (62.5%) |
| Retail Trade | 12 (25.5%) | 35 (74.5%) |
| Transportation & Warehousing | 36 (76.6%) | 11 (23.4%) |
| Utilities | 13 (100.0%) | 0 (0.0%) |
| Information | 19 (100.0%) | 0 (0.0%) |
| Finance & Insurance | 19 (52.8%) | 17 (47.2%) |
| Real Estate, Rental & Leasing | 0 (0.0%) | 0 (0.0%) |
| Professional & Scientific | 2 (100.0%) | 0 (0.0%) |
| Enterprise Management | 0 (0.0%) | 0 (0.0%) |
| Administrative & Support | 10 (47.6%) | 11 (52.4%) |
| Educational Services | 17 (29.3%) | 41 (70.7%) |
| Health Care & Social Assistance | 7 (5.7%) | 115 (94.3%) |
| Arts, Entertainment & Recreation | 0 (0.0%) | 0 (0.0%) |
| Accommodation & Food Services | 14 (25.9%) | 40 (74.1%) |
| Public Administration | 12 (85.7%) | 2 (14.3%) |
| Total | 277 (45.9%) | 326 (54.1%) |
Education in Hillsboro
School Enrollment in Hillsboro
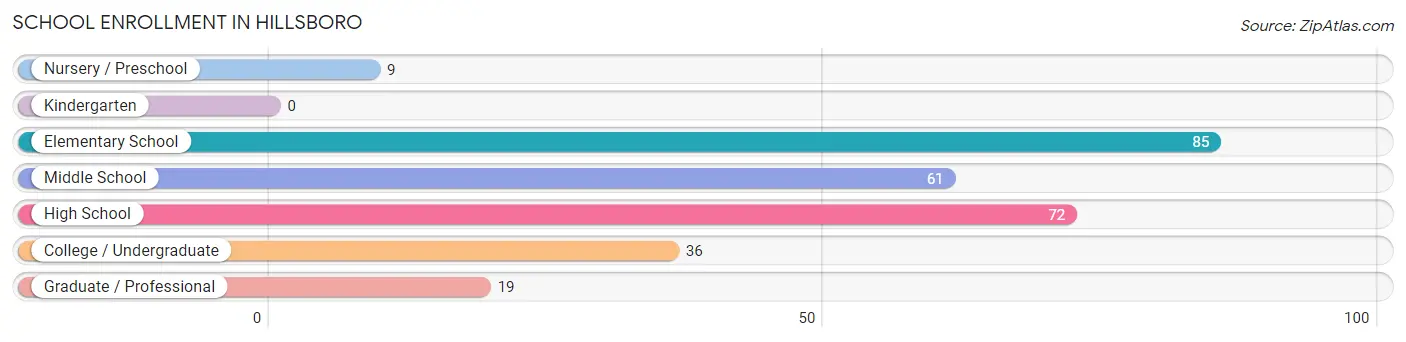
The most common levels of schooling among the 282 students in Hillsboro are elementary school (85 | 30.1%), high school (72 | 25.5%), and middle school (61 | 21.6%).
| School Level | # Students | % Students |
| Nursery / Preschool | 9 | 3.2% |
| Kindergarten | 0 | 0.0% |
| Elementary School | 85 | 30.1% |
| Middle School | 61 | 21.6% |
| High School | 72 | 25.5% |
| College / Undergraduate | 36 | 12.8% |
| Graduate / Professional | 19 | 6.7% |
| Total | 282 | 100.0% |
School Enrollment by Age by Funding Source in Hillsboro
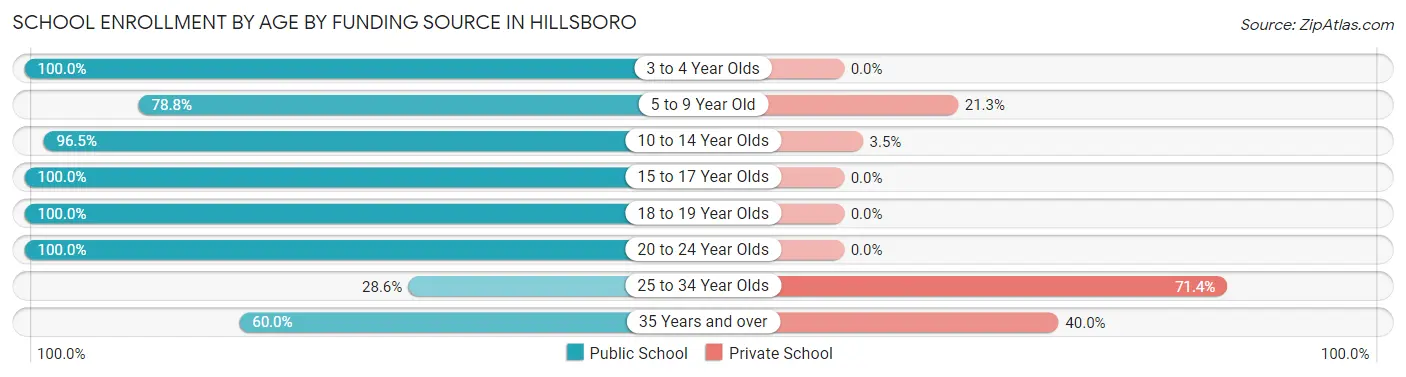
Out of a total of 282 students who are enrolled in schools in Hillsboro, 35 (12.4%) attend a private institution, while the remaining 247 (87.6%) are enrolled in public schools. The age group of 25 to 34 year olds has the highest likelihood of being enrolled in private schools, with 5 (71.4% in the age bracket) enrolled. Conversely, the age group of 3 to 4 year olds has the lowest likelihood of being enrolled in a private school, with 3 (100.0% in the age bracket) attending a public institution.
| Age Bracket | Public School | Private School |
| 3 to 4 Year Olds | 3 (100.0%) | 0 (0.0%) |
| 5 to 9 Year Old | 63 (78.7%) | 17 (21.2%) |
| 10 to 14 Year Olds | 82 (96.5%) | 3 (3.5%) |
| 15 to 17 Year Olds | 55 (100.0%) | 0 (0.0%) |
| 18 to 19 Year Olds | 4 (100.0%) | 0 (0.0%) |
| 20 to 24 Year Olds | 23 (100.0%) | 0 (0.0%) |
| 25 to 34 Year Olds | 2 (28.6%) | 5 (71.4%) |
| 35 Years and over | 15 (60.0%) | 10 (40.0%) |
| Total | 247 (87.6%) | 35 (12.4%) |
Educational Attainment by Field of Study in Hillsboro
Education (54 | 30.0%), science & technology (41 | 22.8%), bio, nature & agricultural (30 | 16.7%), business (11 | 6.1%), and literature & languages (11 | 6.1%) are the most common fields of study among 180 individuals in Hillsboro who have obtained a bachelor's degree or higher.
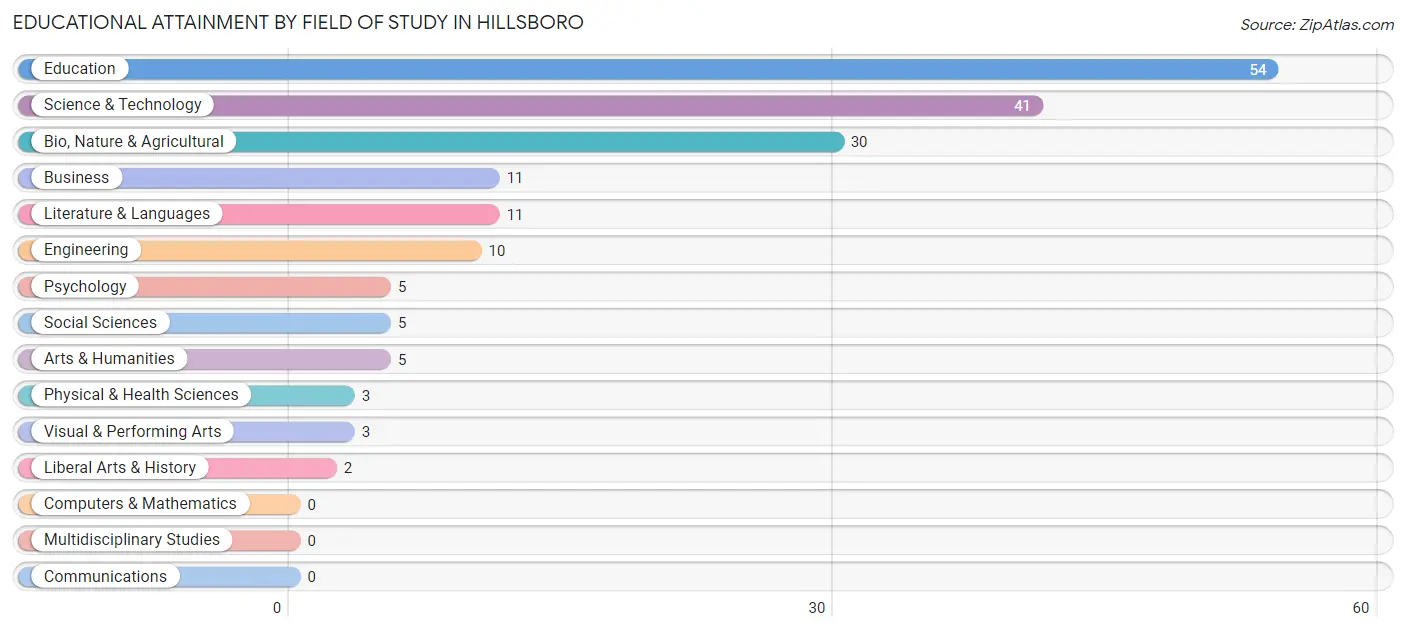
| Field of Study | # Graduates | % Graduates |
| Computers & Mathematics | 0 | 0.0% |
| Bio, Nature & Agricultural | 30 | 16.7% |
| Physical & Health Sciences | 3 | 1.7% |
| Psychology | 5 | 2.8% |
| Social Sciences | 5 | 2.8% |
| Engineering | 10 | 5.6% |
| Multidisciplinary Studies | 0 | 0.0% |
| Science & Technology | 41 | 22.8% |
| Business | 11 | 6.1% |
| Education | 54 | 30.0% |
| Literature & Languages | 11 | 6.1% |
| Liberal Arts & History | 2 | 1.1% |
| Visual & Performing Arts | 3 | 1.7% |
| Communications | 0 | 0.0% |
| Arts & Humanities | 5 | 2.8% |
| Total | 180 | 100.0% |
Transportation & Commute in Hillsboro
Vehicle Availability by Sex in Hillsboro
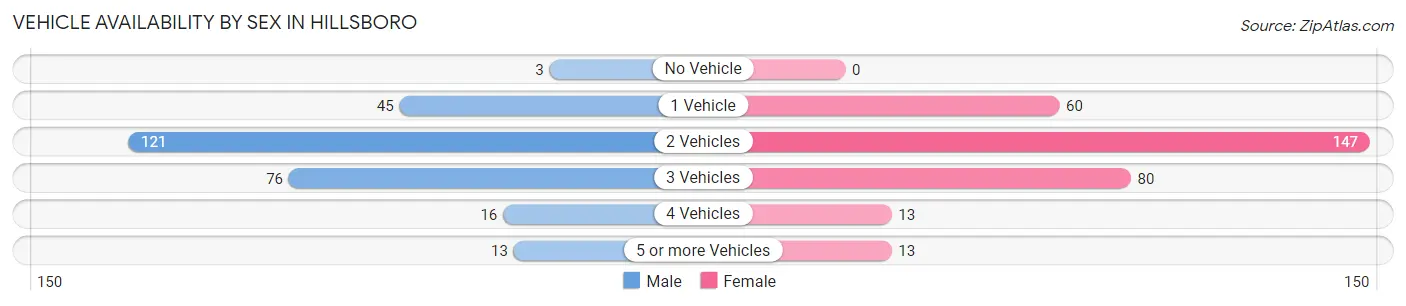
The most prevalent vehicle ownership categories in Hillsboro are males with 2 vehicles (121, accounting for 44.2%) and females with 2 vehicles (147, making up 38.7%).
| Vehicles Available | Male | Female |
| No Vehicle | 3 (1.1%) | 0 (0.0%) |
| 1 Vehicle | 45 (16.4%) | 60 (19.2%) |
| 2 Vehicles | 121 (44.2%) | 147 (47.0%) |
| 3 Vehicles | 76 (27.7%) | 80 (25.6%) |
| 4 Vehicles | 16 (5.8%) | 13 (4.2%) |
| 5 or more Vehicles | 13 (4.7%) | 13 (4.2%) |
| Total | 274 (100.0%) | 313 (100.0%) |
Commute Time in Hillsboro
The most frequently occuring commute durations in Hillsboro are 5 to 9 minutes (101 commuters, 18.5%), less than 5 minutes (91 commuters, 16.7%), and 10 to 14 minutes (78 commuters, 14.3%).
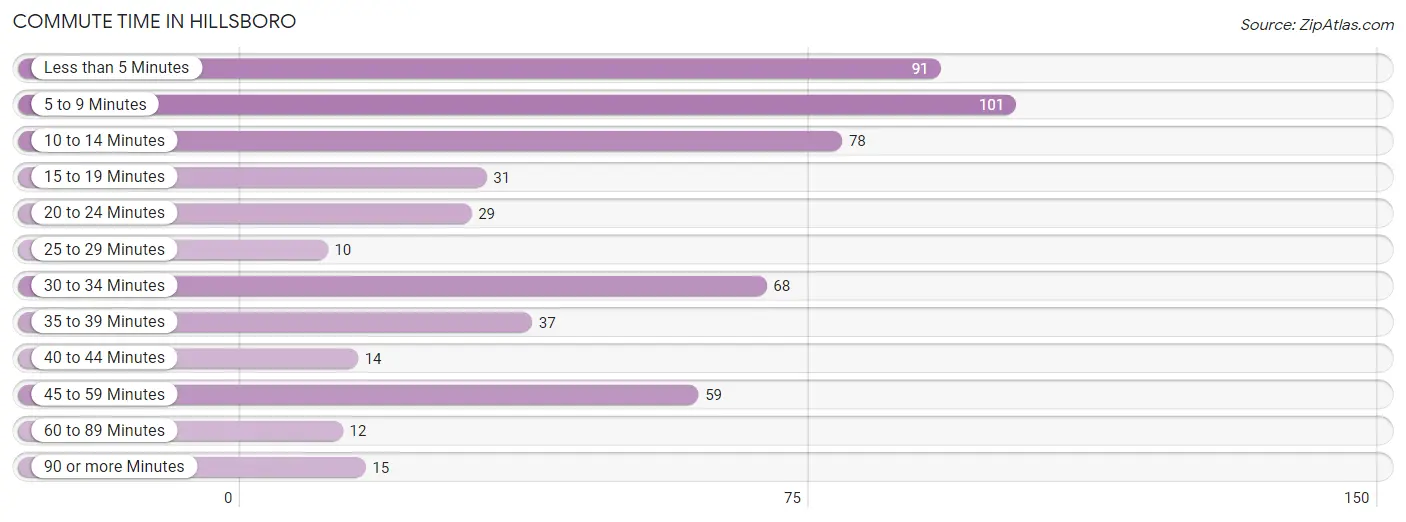
| Commute Time | # Commuters | % Commuters |
| Less than 5 Minutes | 91 | 16.7% |
| 5 to 9 Minutes | 101 | 18.5% |
| 10 to 14 Minutes | 78 | 14.3% |
| 15 to 19 Minutes | 31 | 5.7% |
| 20 to 24 Minutes | 29 | 5.3% |
| 25 to 29 Minutes | 10 | 1.8% |
| 30 to 34 Minutes | 68 | 12.5% |
| 35 to 39 Minutes | 37 | 6.8% |
| 40 to 44 Minutes | 14 | 2.6% |
| 45 to 59 Minutes | 59 | 10.8% |
| 60 to 89 Minutes | 12 | 2.2% |
| 90 or more Minutes | 15 | 2.8% |
Commute Time by Sex in Hillsboro
The most common commute times in Hillsboro are 5 to 9 minutes (49 commuters, 19.0%) for males and less than 5 minutes (63 commuters, 22.0%) for females.
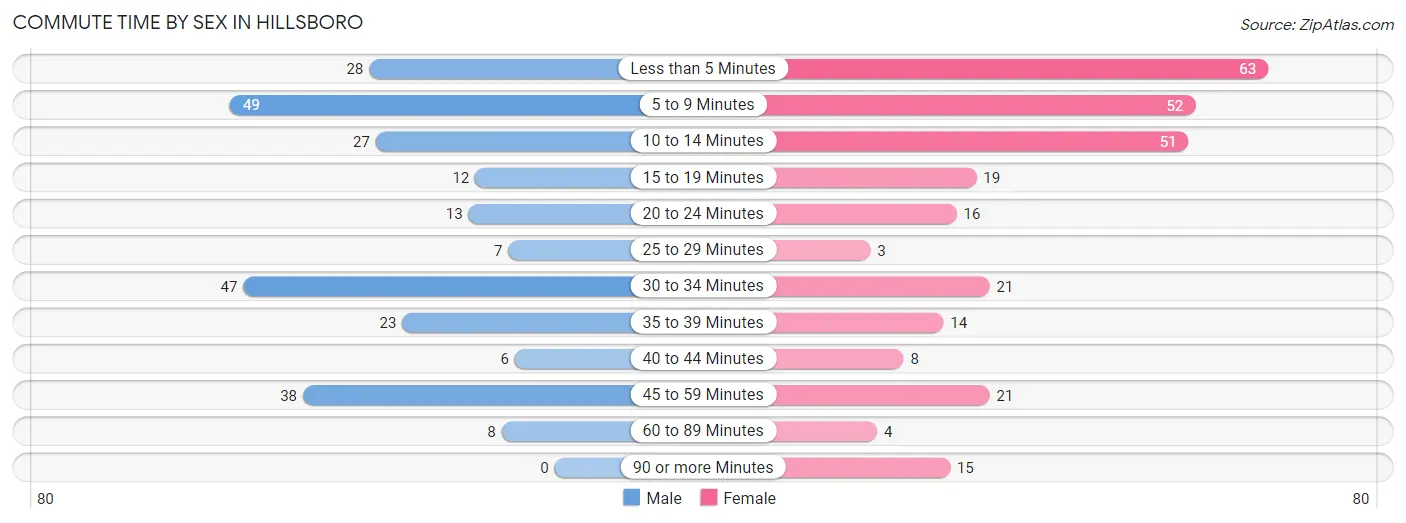
| Commute Time | Male | Female |
| Less than 5 Minutes | 28 (10.8%) | 63 (22.0%) |
| 5 to 9 Minutes | 49 (19.0%) | 52 (18.1%) |
| 10 to 14 Minutes | 27 (10.5%) | 51 (17.8%) |
| 15 to 19 Minutes | 12 (4.6%) | 19 (6.6%) |
| 20 to 24 Minutes | 13 (5.0%) | 16 (5.6%) |
| 25 to 29 Minutes | 7 (2.7%) | 3 (1.1%) |
| 30 to 34 Minutes | 47 (18.2%) | 21 (7.3%) |
| 35 to 39 Minutes | 23 (8.9%) | 14 (4.9%) |
| 40 to 44 Minutes | 6 (2.3%) | 8 (2.8%) |
| 45 to 59 Minutes | 38 (14.7%) | 21 (7.3%) |
| 60 to 89 Minutes | 8 (3.1%) | 4 (1.4%) |
| 90 or more Minutes | 0 (0.0%) | 15 (5.2%) |
Time of Departure to Work by Sex in Hillsboro
The most frequent times of departure to work in Hillsboro are 12:00 AM to 4:59 AM (48, 18.6%) for males and 7:00 AM to 7:29 AM (59, 20.6%) for females.
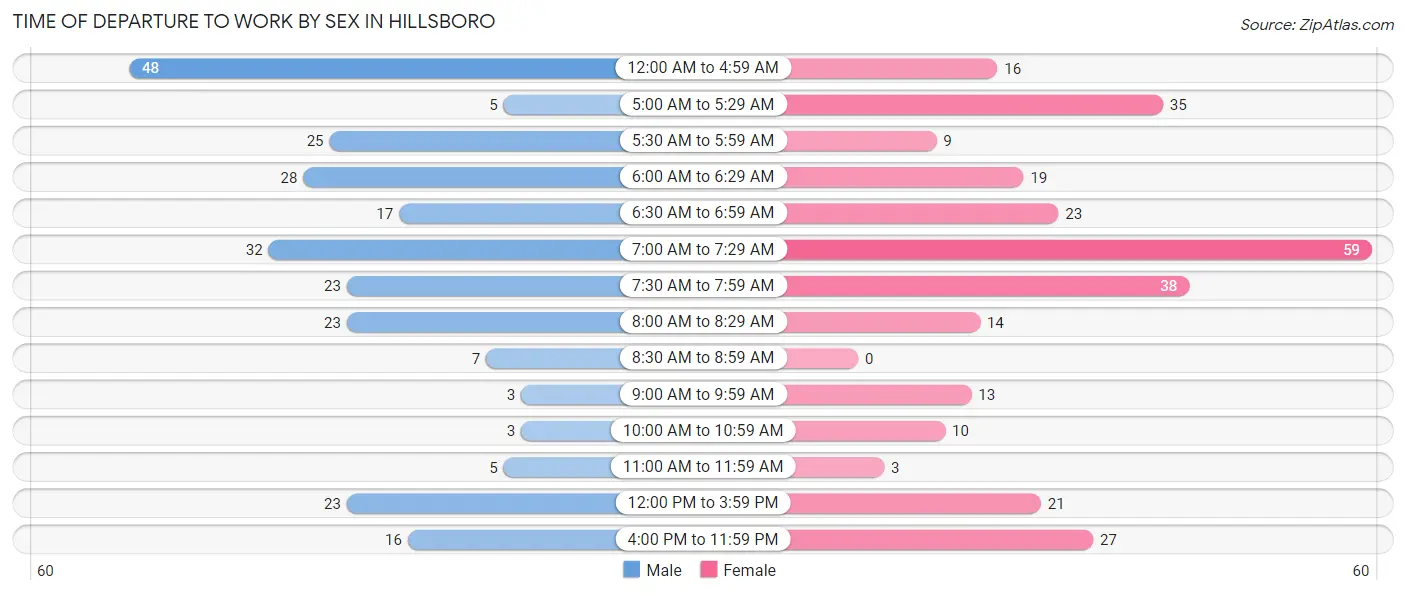
| Time of Departure | Male | Female |
| 12:00 AM to 4:59 AM | 48 (18.6%) | 16 (5.6%) |
| 5:00 AM to 5:29 AM | 5 (1.9%) | 35 (12.2%) |
| 5:30 AM to 5:59 AM | 25 (9.7%) | 9 (3.1%) |
| 6:00 AM to 6:29 AM | 28 (10.8%) | 19 (6.6%) |
| 6:30 AM to 6:59 AM | 17 (6.6%) | 23 (8.0%) |
| 7:00 AM to 7:29 AM | 32 (12.4%) | 59 (20.6%) |
| 7:30 AM to 7:59 AM | 23 (8.9%) | 38 (13.2%) |
| 8:00 AM to 8:29 AM | 23 (8.9%) | 14 (4.9%) |
| 8:30 AM to 8:59 AM | 7 (2.7%) | 0 (0.0%) |
| 9:00 AM to 9:59 AM | 3 (1.2%) | 13 (4.5%) |
| 10:00 AM to 10:59 AM | 3 (1.2%) | 10 (3.5%) |
| 11:00 AM to 11:59 AM | 5 (1.9%) | 3 (1.1%) |
| 12:00 PM to 3:59 PM | 23 (8.9%) | 21 (7.3%) |
| 4:00 PM to 11:59 PM | 16 (6.2%) | 27 (9.4%) |
| Total | 258 (100.0%) | 287 (100.0%) |
Housing Occupancy in Hillsboro
Occupancy by Ownership in Hillsboro
Of the total 581 dwellings in Hillsboro, owner-occupied units account for 425 (73.2%), while renter-occupied units make up 156 (26.9%).
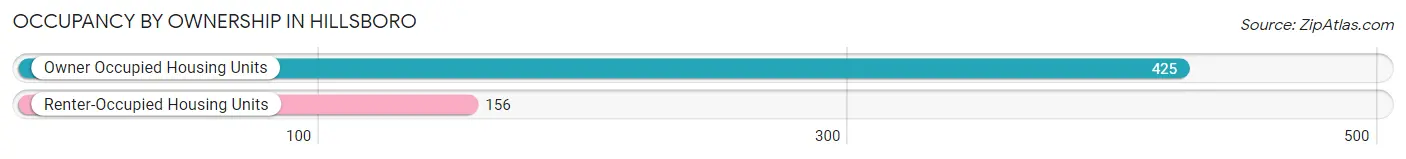
| Occupancy | # Housing Units | % Housing Units |
| Owner Occupied Housing Units | 425 | 73.2% |
| Renter-Occupied Housing Units | 156 | 26.9% |
| Total Occupied Housing Units | 581 | 100.0% |
Occupancy by Household Size in Hillsboro
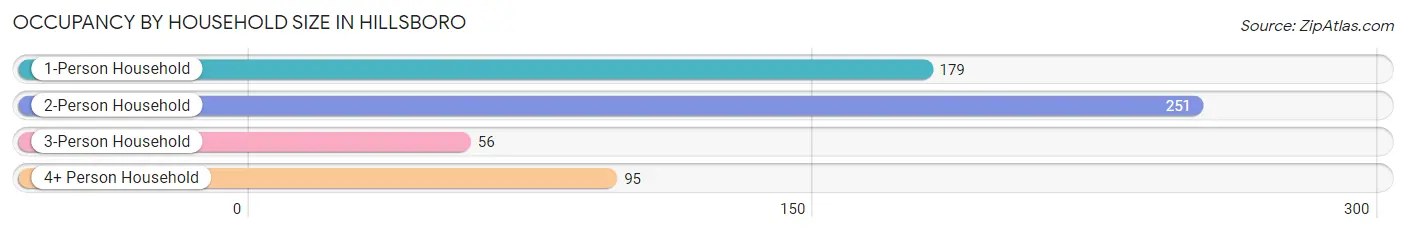
| Household Size | # Housing Units | % Housing Units |
| 1-Person Household | 179 | 30.8% |
| 2-Person Household | 251 | 43.2% |
| 3-Person Household | 56 | 9.6% |
| 4+ Person Household | 95 | 16.4% |
| Total Housing Units | 581 | 100.0% |
Occupancy by Ownership by Household Size in Hillsboro
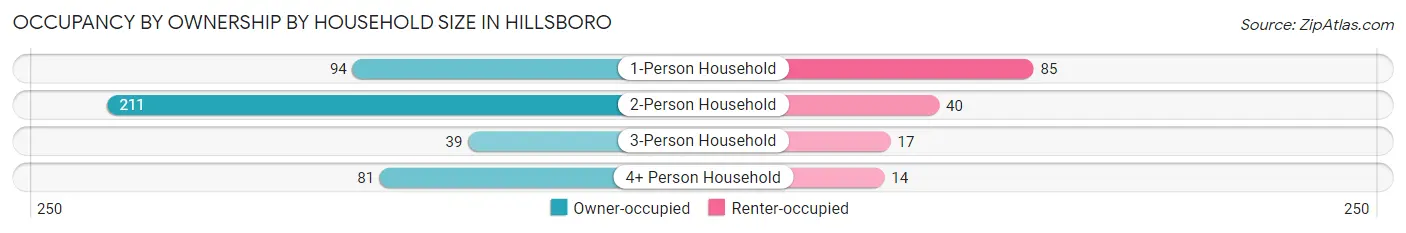
| Household Size | Owner-occupied | Renter-occupied |
| 1-Person Household | 94 (52.5%) | 85 (47.5%) |
| 2-Person Household | 211 (84.1%) | 40 (15.9%) |
| 3-Person Household | 39 (69.6%) | 17 (30.4%) |
| 4+ Person Household | 81 (85.3%) | 14 (14.7%) |
| Total Housing Units | 425 (73.2%) | 156 (26.9%) |
Occupancy by Educational Attainment in Hillsboro
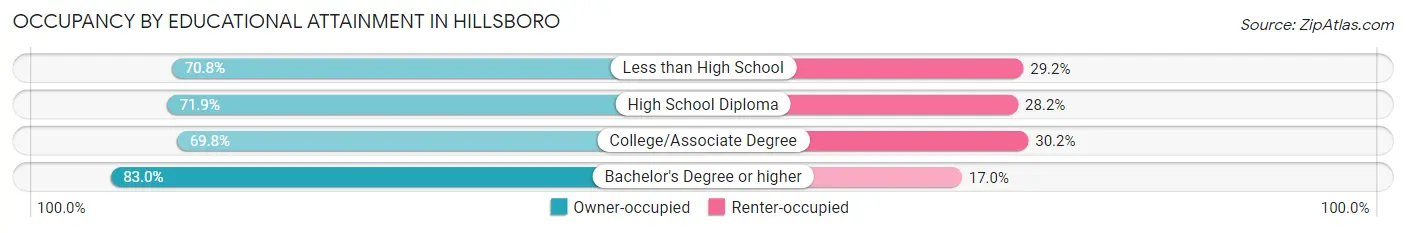
| Household Size | Owner-occupied | Renter-occupied |
| Less than High School | 34 (70.8%) | 14 (29.2%) |
| High School Diploma | 171 (71.9%) | 67 (28.1%) |
| College/Associate Degree | 132 (69.8%) | 57 (30.2%) |
| Bachelor's Degree or higher | 88 (83.0%) | 18 (17.0%) |
Occupancy by Age of Householder in Hillsboro
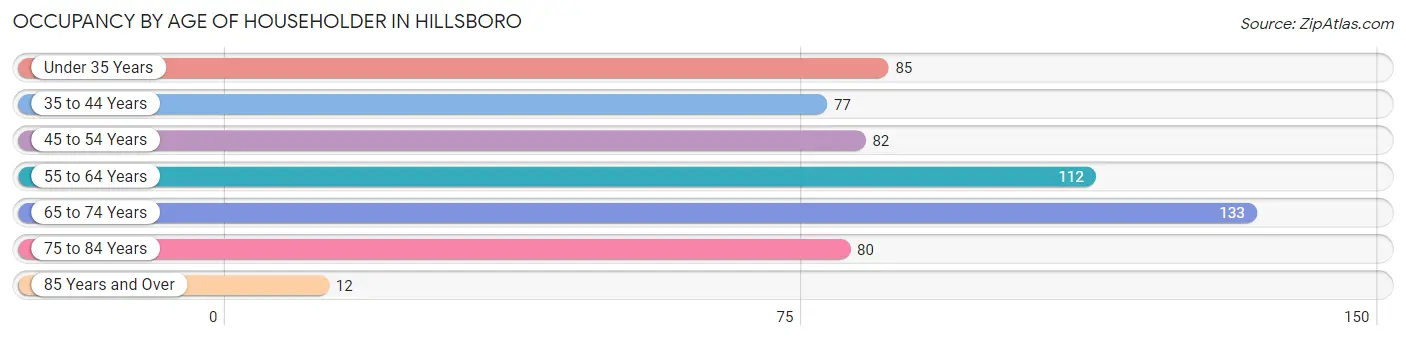
| Age Bracket | # Households | % Households |
| Under 35 Years | 85 | 14.6% |
| 35 to 44 Years | 77 | 13.3% |
| 45 to 54 Years | 82 | 14.1% |
| 55 to 64 Years | 112 | 19.3% |
| 65 to 74 Years | 133 | 22.9% |
| 75 to 84 Years | 80 | 13.8% |
| 85 Years and Over | 12 | 2.1% |
| Total | 581 | 100.0% |
Housing Finances in Hillsboro
Median Income by Occupancy in Hillsboro
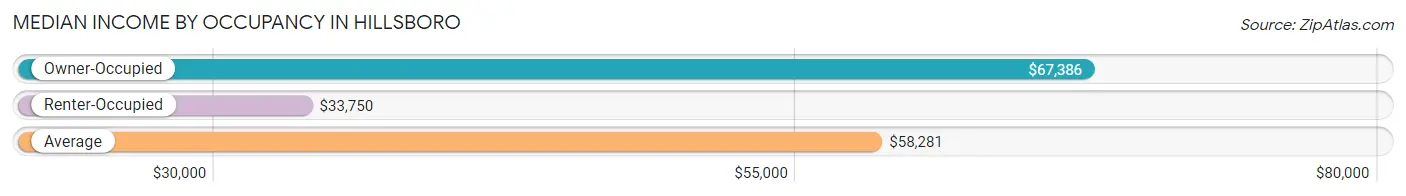
| Occupancy Type | # Households | Median Income |
| Owner-Occupied | 425 (73.2%) | $67,386 |
| Renter-Occupied | 156 (26.9%) | $33,750 |
| Average | 581 (100.0%) | $58,281 |
Occupancy by Householder Income Bracket in Hillsboro
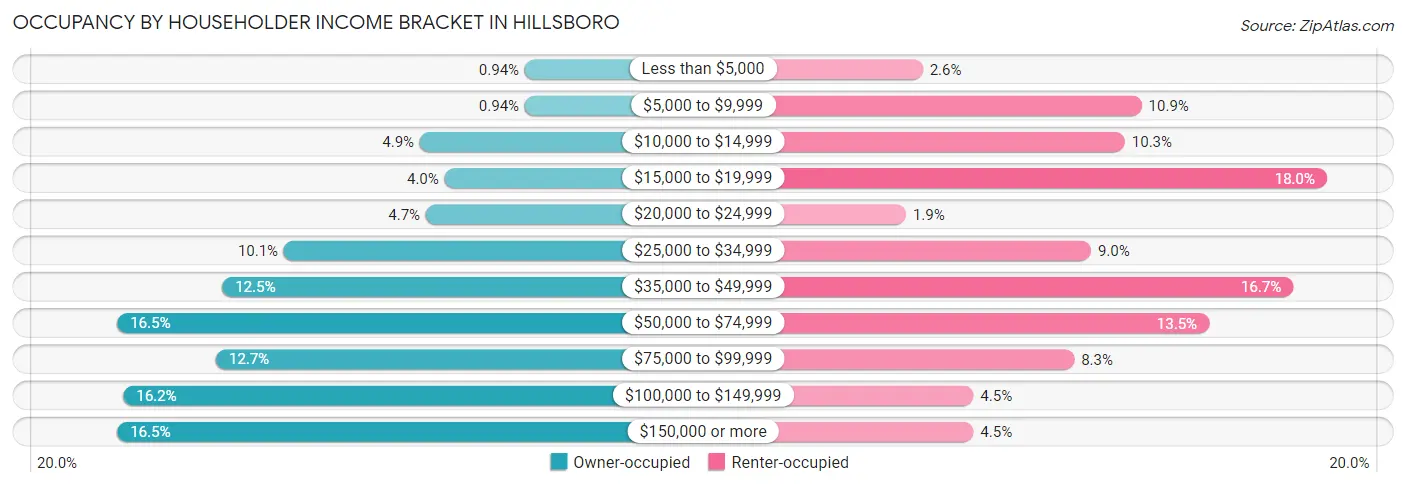
| Income Bracket | Owner-occupied | Renter-occupied |
| Less than $5,000 | 4 (0.9%) | 4 (2.6%) |
| $5,000 to $9,999 | 4 (0.9%) | 17 (10.9%) |
| $10,000 to $14,999 | 21 (4.9%) | 16 (10.3%) |
| $15,000 to $19,999 | 17 (4.0%) | 28 (17.9%) |
| $20,000 to $24,999 | 20 (4.7%) | 3 (1.9%) |
| $25,000 to $34,999 | 43 (10.1%) | 14 (9.0%) |
| $35,000 to $49,999 | 53 (12.5%) | 26 (16.7%) |
| $50,000 to $74,999 | 70 (16.5%) | 21 (13.5%) |
| $75,000 to $99,999 | 54 (12.7%) | 13 (8.3%) |
| $100,000 to $149,999 | 69 (16.2%) | 7 (4.5%) |
| $150,000 or more | 70 (16.5%) | 7 (4.5%) |
| Total | 425 (100.0%) | 156 (100.0%) |
Monthly Housing Cost Tiers in Hillsboro
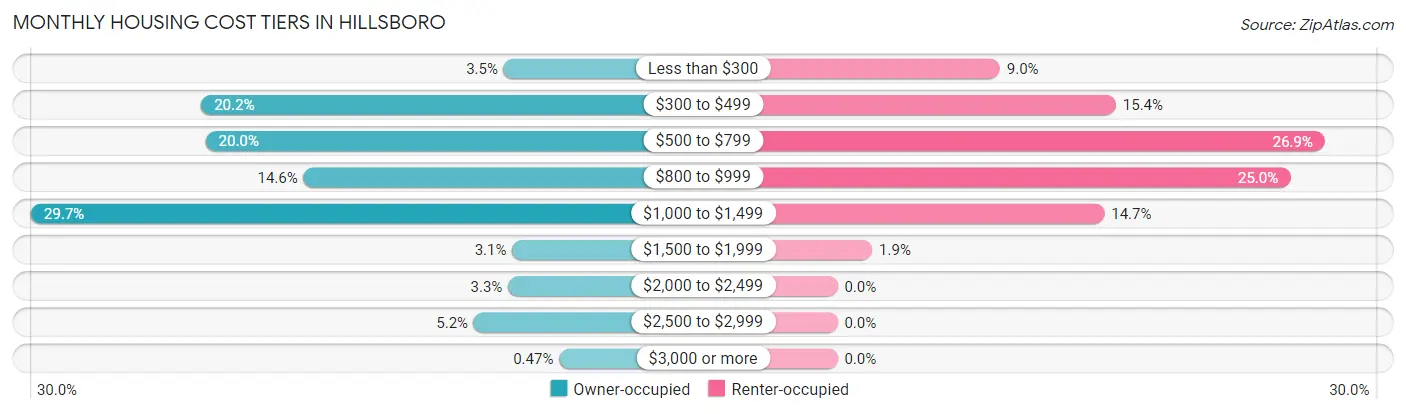
| Monthly Cost | Owner-occupied | Renter-occupied |
| Less than $300 | 15 (3.5%) | 14 (9.0%) |
| $300 to $499 | 86 (20.2%) | 24 (15.4%) |
| $500 to $799 | 85 (20.0%) | 42 (26.9%) |
| $800 to $999 | 62 (14.6%) | 39 (25.0%) |
| $1,000 to $1,499 | 126 (29.6%) | 23 (14.7%) |
| $1,500 to $1,999 | 13 (3.1%) | 3 (1.9%) |
| $2,000 to $2,499 | 14 (3.3%) | 0 (0.0%) |
| $2,500 to $2,999 | 22 (5.2%) | 0 (0.0%) |
| $3,000 or more | 2 (0.5%) | 0 (0.0%) |
| Total | 425 (100.0%) | 156 (100.0%) |
Physical Housing Characteristics in Hillsboro
Housing Structures in Hillsboro
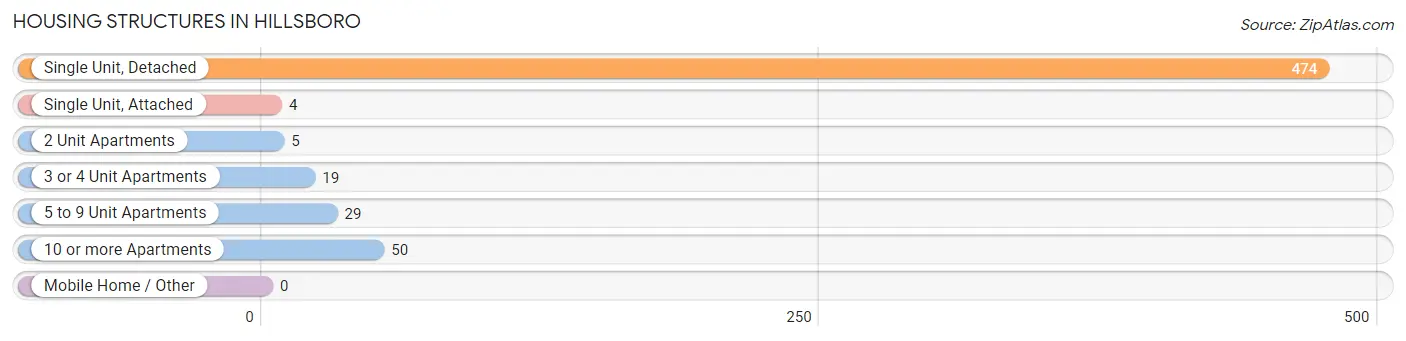
| Structure Type | # Housing Units | % Housing Units |
| Single Unit, Detached | 474 | 81.6% |
| Single Unit, Attached | 4 | 0.7% |
| 2 Unit Apartments | 5 | 0.9% |
| 3 or 4 Unit Apartments | 19 | 3.3% |
| 5 to 9 Unit Apartments | 29 | 5.0% |
| 10 or more Apartments | 50 | 8.6% |
| Mobile Home / Other | 0 | 0.0% |
| Total | 581 | 100.0% |
Housing Structures by Occupancy in Hillsboro
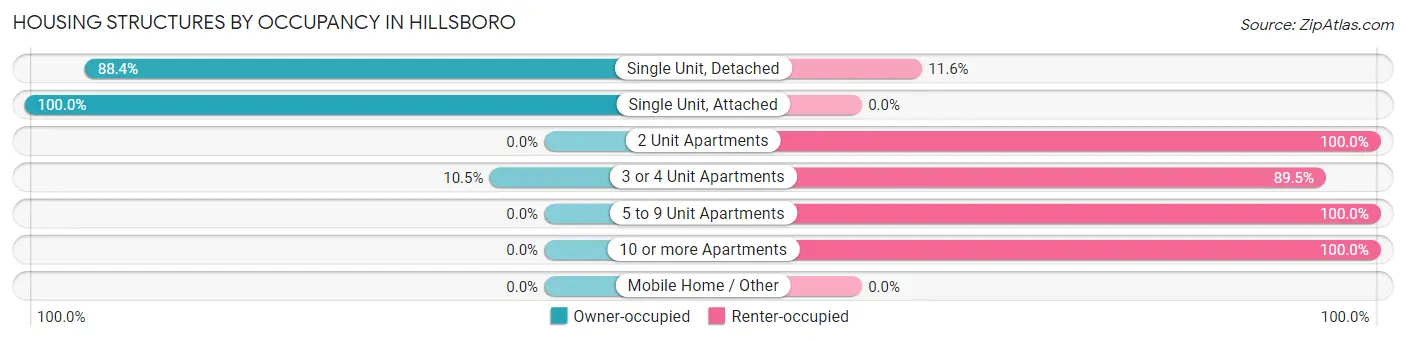
| Structure Type | Owner-occupied | Renter-occupied |
| Single Unit, Detached | 419 (88.4%) | 55 (11.6%) |
| Single Unit, Attached | 4 (100.0%) | 0 (0.0%) |
| 2 Unit Apartments | 0 (0.0%) | 5 (100.0%) |
| 3 or 4 Unit Apartments | 2 (10.5%) | 17 (89.5%) |
| 5 to 9 Unit Apartments | 0 (0.0%) | 29 (100.0%) |
| 10 or more Apartments | 0 (0.0%) | 50 (100.0%) |
| Mobile Home / Other | 0 (0.0%) | 0 (0.0%) |
| Total | 425 (73.2%) | 156 (26.9%) |
Housing Structures by Number of Rooms in Hillsboro
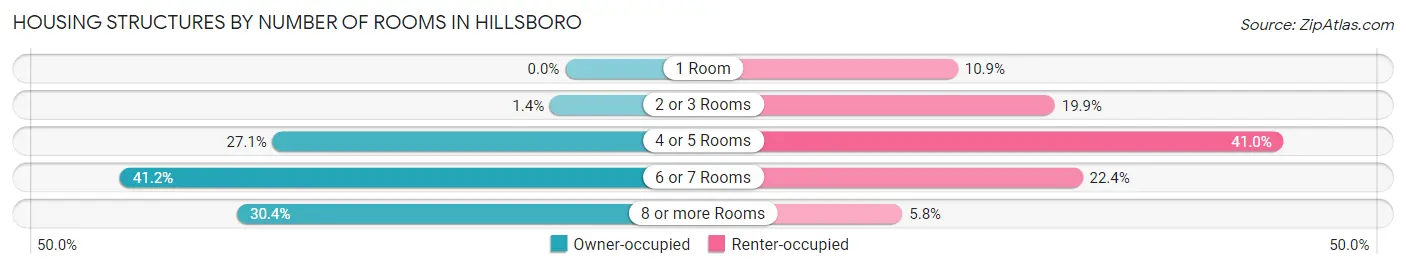
| Number of Rooms | Owner-occupied | Renter-occupied |
| 1 Room | 0 (0.0%) | 17 (10.9%) |
| 2 or 3 Rooms | 6 (1.4%) | 31 (19.9%) |
| 4 or 5 Rooms | 115 (27.1%) | 64 (41.0%) |
| 6 or 7 Rooms | 175 (41.2%) | 35 (22.4%) |
| 8 or more Rooms | 129 (30.3%) | 9 (5.8%) |
| Total | 425 (100.0%) | 156 (100.0%) |
Housing Structure by Heating Type in Hillsboro
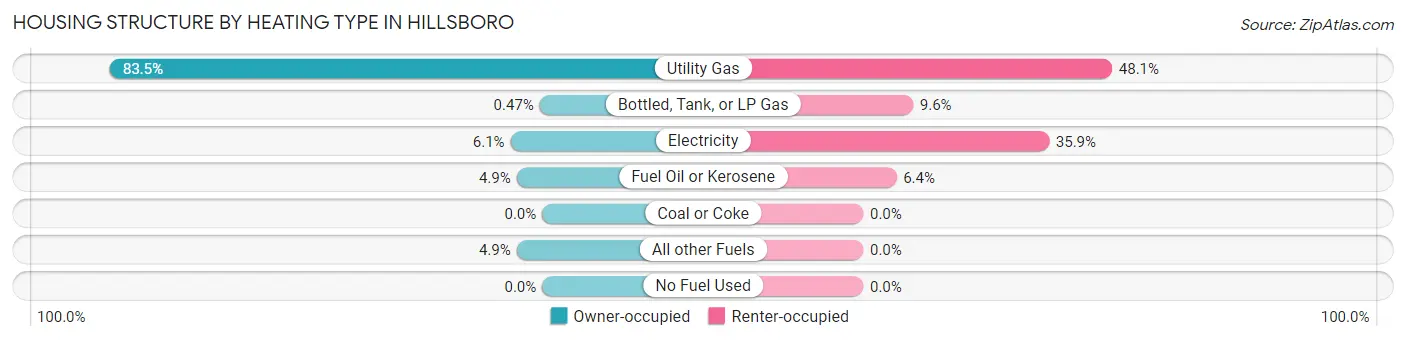
| Heating Type | Owner-occupied | Renter-occupied |
| Utility Gas | 355 (83.5%) | 75 (48.1%) |
| Bottled, Tank, or LP Gas | 2 (0.5%) | 15 (9.6%) |
| Electricity | 26 (6.1%) | 56 (35.9%) |
| Fuel Oil or Kerosene | 21 (4.9%) | 10 (6.4%) |
| Coal or Coke | 0 (0.0%) | 0 (0.0%) |
| All other Fuels | 21 (4.9%) | 0 (0.0%) |
| No Fuel Used | 0 (0.0%) | 0 (0.0%) |
| Total | 425 (100.0%) | 156 (100.0%) |
Household Vehicle Usage in Hillsboro
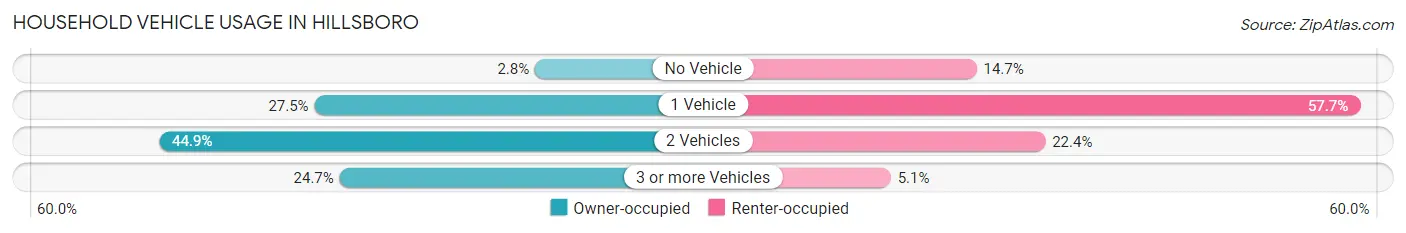
| Vehicles per Household | Owner-occupied | Renter-occupied |
| No Vehicle | 12 (2.8%) | 23 (14.7%) |
| 1 Vehicle | 117 (27.5%) | 90 (57.7%) |
| 2 Vehicles | 191 (44.9%) | 35 (22.4%) |
| 3 or more Vehicles | 105 (24.7%) | 8 (5.1%) |
| Total | 425 (100.0%) | 156 (100.0%) |
Real Estate & Mortgages in Hillsboro
Real Estate and Mortgage Overview in Hillsboro
| Characteristic | Without Mortgage | With Mortgage |
| Housing Units | 182 | 243 |
| Median Property Value | $131,100 | $154,600 |
| Median Household Income | $42,833 | $41 |
| Monthly Housing Costs | $478 | $2 |
| Real Estate Taxes | $1,952 | $0 |
Property Value by Mortgage Status in Hillsboro
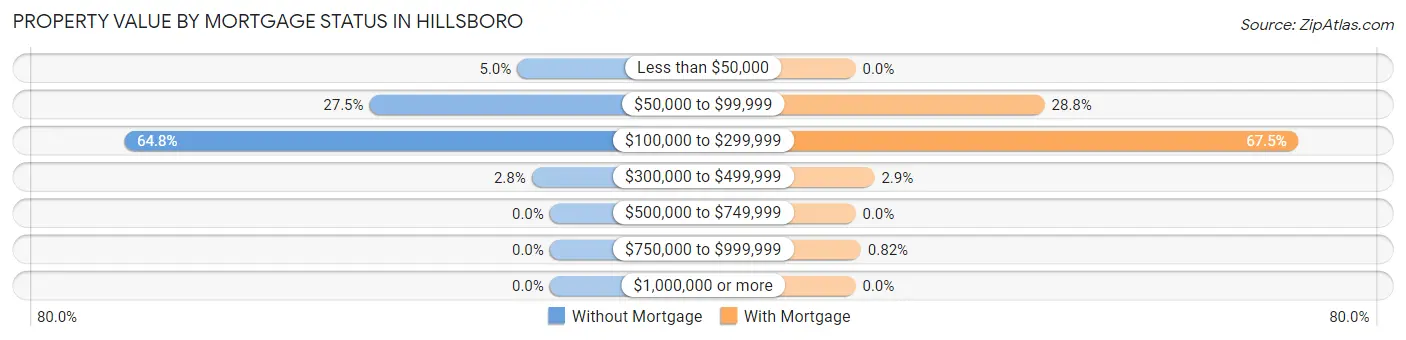
| Property Value | Without Mortgage | With Mortgage |
| Less than $50,000 | 9 (5.0%) | 0 (0.0%) |
| $50,000 to $99,999 | 50 (27.5%) | 70 (28.8%) |
| $100,000 to $299,999 | 118 (64.8%) | 164 (67.5%) |
| $300,000 to $499,999 | 5 (2.8%) | 7 (2.9%) |
| $500,000 to $749,999 | 0 (0.0%) | 0 (0.0%) |
| $750,000 to $999,999 | 0 (0.0%) | 2 (0.8%) |
| $1,000,000 or more | 0 (0.0%) | 0 (0.0%) |
| Total | 182 (100.0%) | 243 (100.0%) |
Household Income by Mortgage Status in Hillsboro
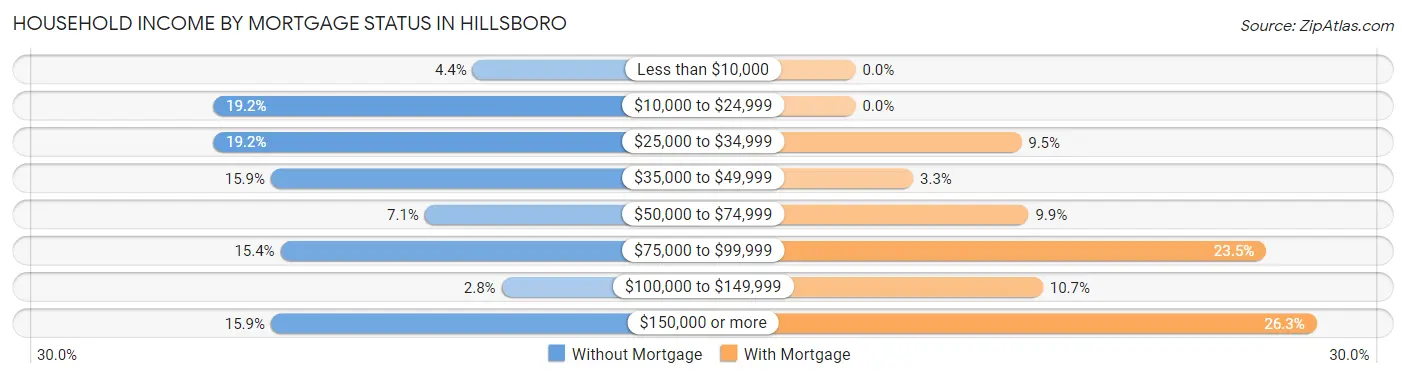
| Household Income | Without Mortgage | With Mortgage |
| Less than $10,000 | 8 (4.4%) | 0 (0.0%) |
| $10,000 to $24,999 | 35 (19.2%) | 0 (0.0%) |
| $25,000 to $34,999 | 35 (19.2%) | 23 (9.5%) |
| $35,000 to $49,999 | 29 (15.9%) | 8 (3.3%) |
| $50,000 to $74,999 | 13 (7.1%) | 24 (9.9%) |
| $75,000 to $99,999 | 28 (15.4%) | 57 (23.5%) |
| $100,000 to $149,999 | 5 (2.8%) | 26 (10.7%) |
| $150,000 or more | 29 (15.9%) | 64 (26.3%) |
| Total | 182 (100.0%) | 243 (100.0%) |
Property Value to Household Income Ratio in Hillsboro
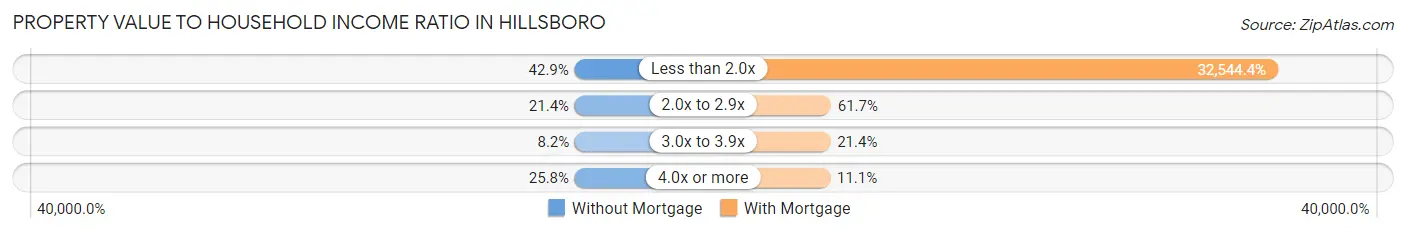
| Value-to-Income Ratio | Without Mortgage | With Mortgage |
| Less than 2.0x | 78 (42.9%) | 79,083 (32,544.4%) |
| 2.0x to 2.9x | 39 (21.4%) | 150 (61.7%) |
| 3.0x to 3.9x | 15 (8.2%) | 52 (21.4%) |
| 4.0x or more | 47 (25.8%) | 27 (11.1%) |
| Total | 182 (100.0%) | 243 (100.0%) |
Real Estate Taxes by Mortgage Status in Hillsboro
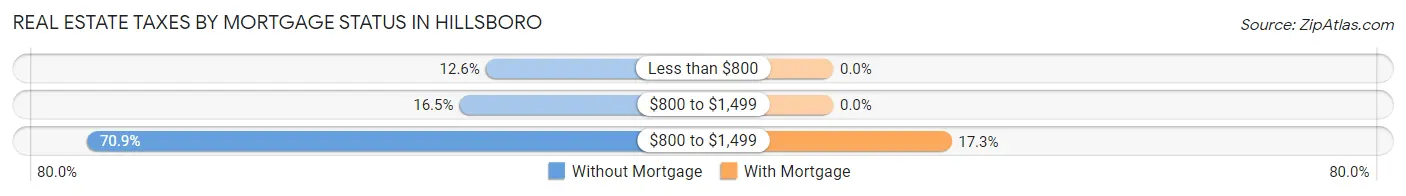
| Property Taxes | Without Mortgage | With Mortgage |
| Less than $800 | 23 (12.6%) | 0 (0.0%) |
| $800 to $1,499 | 30 (16.5%) | 0 (0.0%) |
| $800 to $1,499 | 129 (70.9%) | 42 (17.3%) |
| Total | 182 (100.0%) | 243 (100.0%) |
Health & Disability in Hillsboro
Health Insurance Coverage by Age in Hillsboro
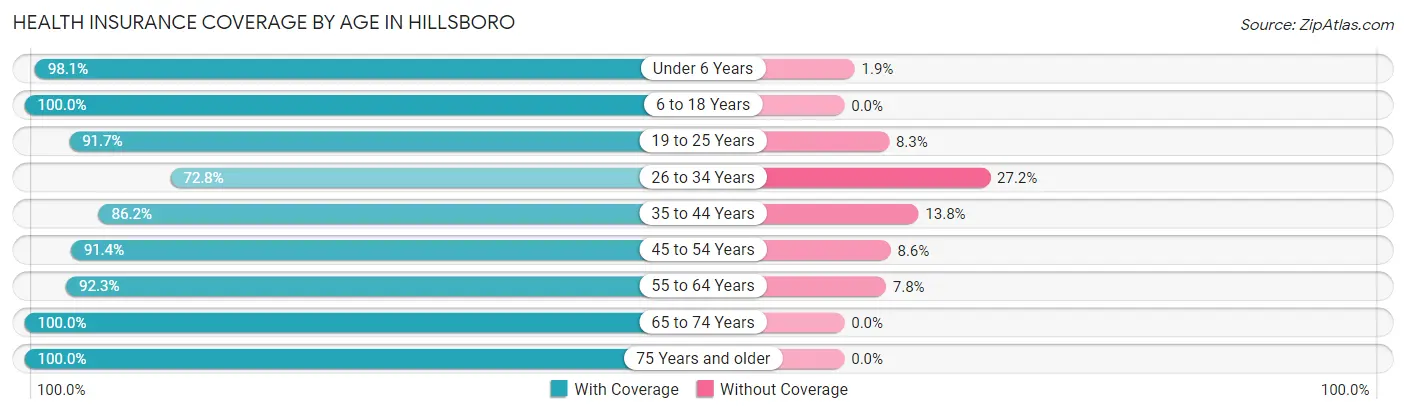
| Age Bracket | With Coverage | Without Coverage |
| Under 6 Years | 51 (98.1%) | 1 (1.9%) |
| 6 to 18 Years | 246 (100.0%) | 0 (0.0%) |
| 19 to 25 Years | 55 (91.7%) | 5 (8.3%) |
| 26 to 34 Years | 83 (72.8%) | 31 (27.2%) |
| 35 to 44 Years | 131 (86.2%) | 21 (13.8%) |
| 45 to 54 Years | 159 (91.4%) | 15 (8.6%) |
| 55 to 64 Years | 131 (92.2%) | 11 (7.7%) |
| 65 to 74 Years | 238 (100.0%) | 0 (0.0%) |
| 75 Years and older | 131 (100.0%) | 0 (0.0%) |
| Total | 1,225 (93.6%) | 84 (6.4%) |
Health Insurance Coverage by Citizenship Status in Hillsboro
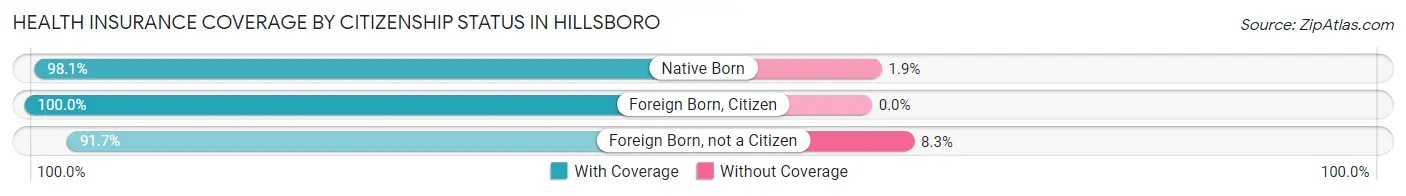
| Citizenship Status | With Coverage | Without Coverage |
| Native Born | 51 (98.1%) | 1 (1.9%) |
| Foreign Born, Citizen | 246 (100.0%) | 0 (0.0%) |
| Foreign Born, not a Citizen | 55 (91.7%) | 5 (8.3%) |
Health Insurance Coverage by Household Income in Hillsboro
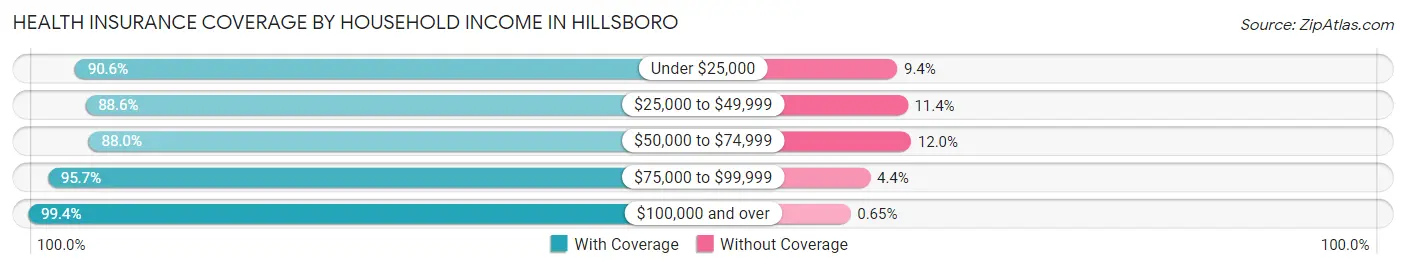
| Household Income | With Coverage | Without Coverage |
| Under $25,000 | 183 (90.6%) | 19 (9.4%) |
| $25,000 to $49,999 | 234 (88.6%) | 30 (11.4%) |
| $50,000 to $74,999 | 176 (88.0%) | 24 (12.0%) |
| $75,000 to $99,999 | 176 (95.7%) | 8 (4.3%) |
| $100,000 and over | 456 (99.4%) | 3 (0.6%) |
Public vs Private Health Insurance Coverage by Age in Hillsboro
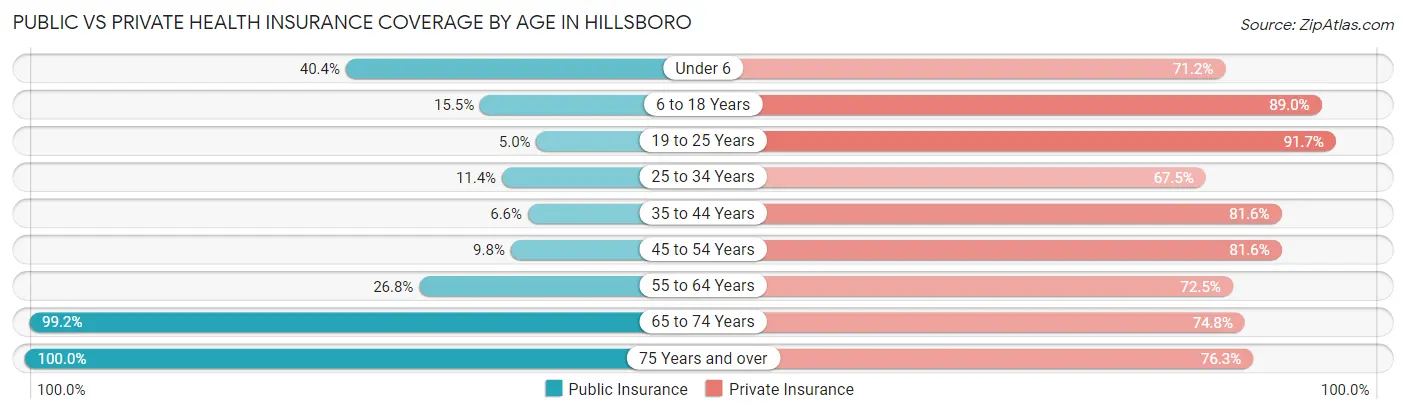
| Age Bracket | Public Insurance | Private Insurance |
| Under 6 | 21 (40.4%) | 37 (71.2%) |
| 6 to 18 Years | 38 (15.4%) | 219 (89.0%) |
| 19 to 25 Years | 3 (5.0%) | 55 (91.7%) |
| 25 to 34 Years | 13 (11.4%) | 77 (67.5%) |
| 35 to 44 Years | 10 (6.6%) | 124 (81.6%) |
| 45 to 54 Years | 17 (9.8%) | 142 (81.6%) |
| 55 to 64 Years | 38 (26.8%) | 103 (72.5%) |
| 65 to 74 Years | 236 (99.2%) | 178 (74.8%) |
| 75 Years and over | 131 (100.0%) | 100 (76.3%) |
| Total | 507 (38.7%) | 1,035 (79.1%) |
Disability Status by Sex by Age in Hillsboro
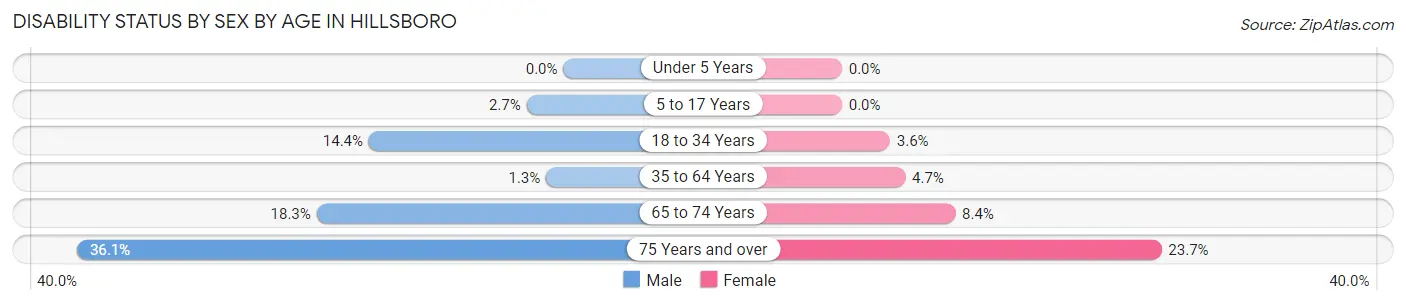
| Age Bracket | Male | Female |
| Under 5 Years | 0 (0.0%) | 0 (0.0%) |
| 5 to 17 Years | 5 (2.7%) | 0 (0.0%) |
| 18 to 34 Years | 13 (14.4%) | 3 (3.6%) |
| 35 to 64 Years | 3 (1.3%) | 11 (4.7%) |
| 65 to 74 Years | 24 (18.3%) | 9 (8.4%) |
| 75 Years and over | 26 (36.1%) | 14 (23.7%) |
Disability Class by Sex by Age in Hillsboro
Disability Class: Hearing Difficulty
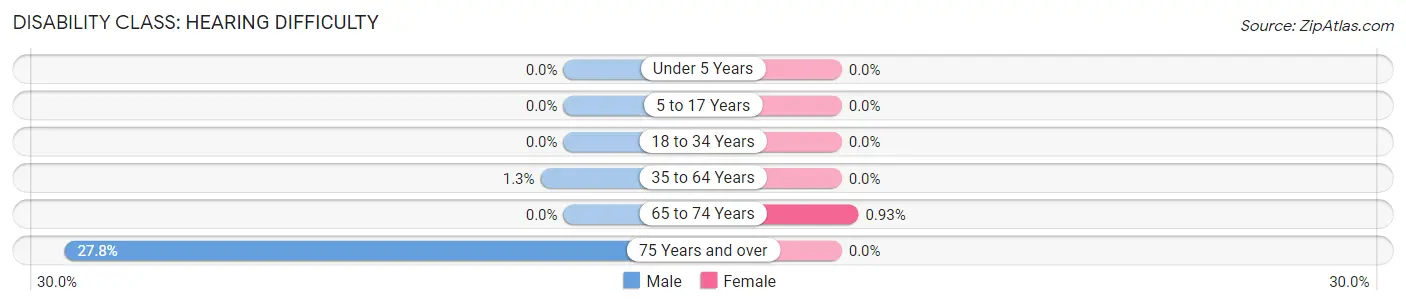
| Age Bracket | Male | Female |
| Under 5 Years | 0 (0.0%) | 0 (0.0%) |
| 5 to 17 Years | 0 (0.0%) | 0 (0.0%) |
| 18 to 34 Years | 0 (0.0%) | 0 (0.0%) |
| 35 to 64 Years | 3 (1.3%) | 0 (0.0%) |
| 65 to 74 Years | 0 (0.0%) | 1 (0.9%) |
| 75 Years and over | 20 (27.8%) | 0 (0.0%) |
Disability Class: Vision Difficulty
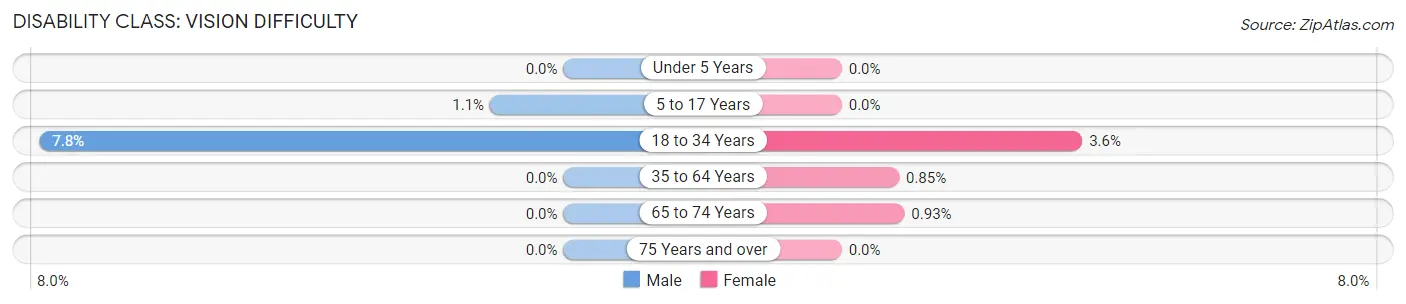
| Age Bracket | Male | Female |
| Under 5 Years | 0 (0.0%) | 0 (0.0%) |
| 5 to 17 Years | 2 (1.1%) | 0 (0.0%) |
| 18 to 34 Years | 7 (7.8%) | 3 (3.6%) |
| 35 to 64 Years | 0 (0.0%) | 2 (0.9%) |
| 65 to 74 Years | 0 (0.0%) | 1 (0.9%) |
| 75 Years and over | 0 (0.0%) | 0 (0.0%) |
Disability Class: Cognitive Difficulty
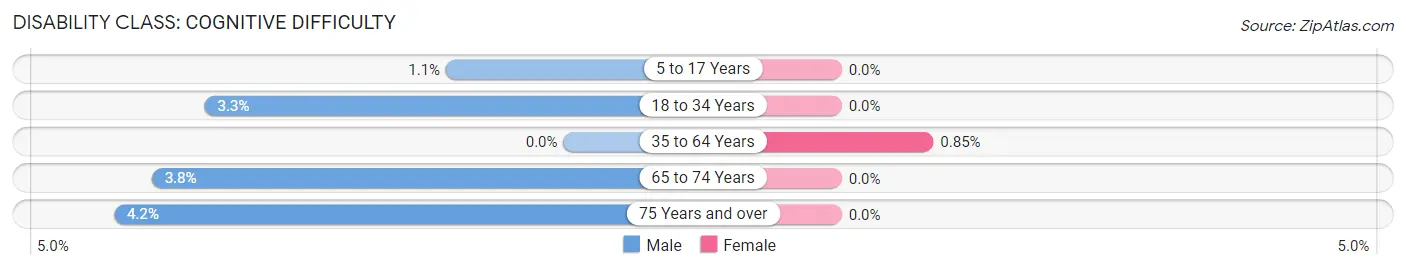
| Age Bracket | Male | Female |
| 5 to 17 Years | 2 (1.1%) | 0 (0.0%) |
| 18 to 34 Years | 3 (3.3%) | 0 (0.0%) |
| 35 to 64 Years | 0 (0.0%) | 2 (0.9%) |
| 65 to 74 Years | 5 (3.8%) | 0 (0.0%) |
| 75 Years and over | 3 (4.2%) | 0 (0.0%) |
Disability Class: Ambulatory Difficulty
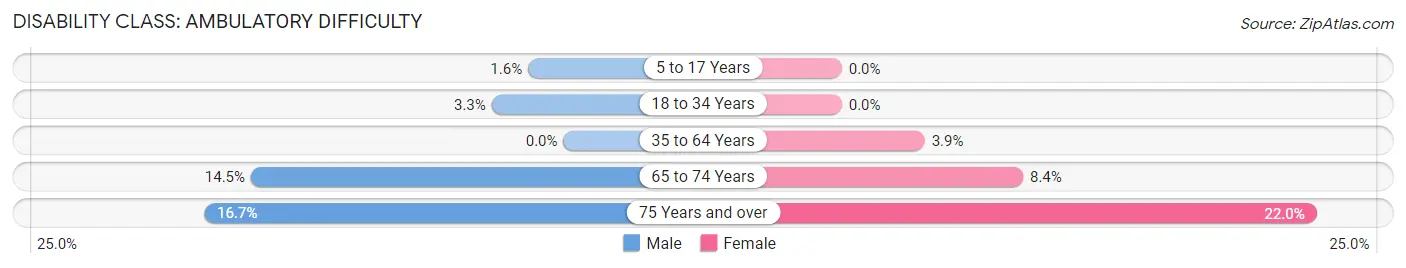
| Age Bracket | Male | Female |
| 5 to 17 Years | 3 (1.6%) | 0 (0.0%) |
| 18 to 34 Years | 3 (3.3%) | 0 (0.0%) |
| 35 to 64 Years | 0 (0.0%) | 9 (3.8%) |
| 65 to 74 Years | 19 (14.5%) | 9 (8.4%) |
| 75 Years and over | 12 (16.7%) | 13 (22.0%) |
Disability Class: Self-Care Difficulty
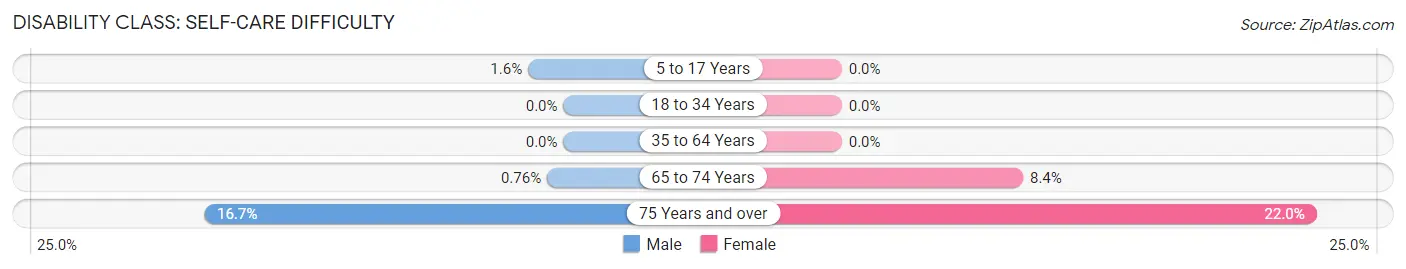
| Age Bracket | Male | Female |
| 5 to 17 Years | 3 (1.6%) | 0 (0.0%) |
| 18 to 34 Years | 0 (0.0%) | 0 (0.0%) |
| 35 to 64 Years | 0 (0.0%) | 0 (0.0%) |
| 65 to 74 Years | 1 (0.8%) | 9 (8.4%) |
| 75 Years and over | 12 (16.7%) | 13 (22.0%) |
Technology Access in Hillsboro
Computing Device Access in Hillsboro
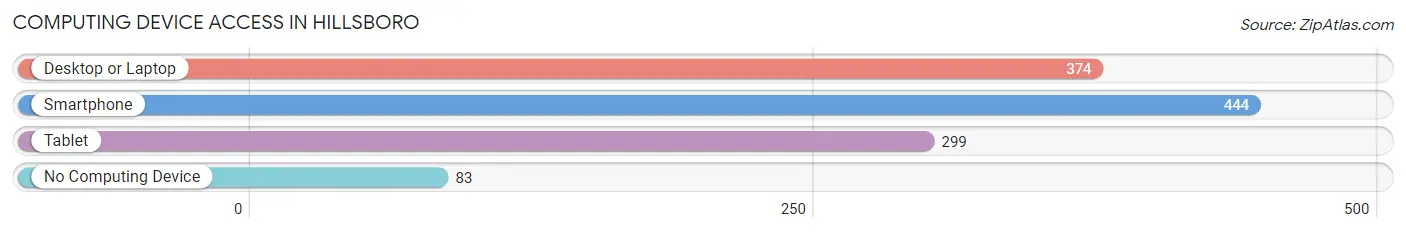
| Device Type | # Households | % Households |
| Desktop or Laptop | 374 | 64.4% |
| Smartphone | 444 | 76.4% |
| Tablet | 299 | 51.5% |
| No Computing Device | 83 | 14.3% |
| Total | 581 | 100.0% |
Internet Access in Hillsboro
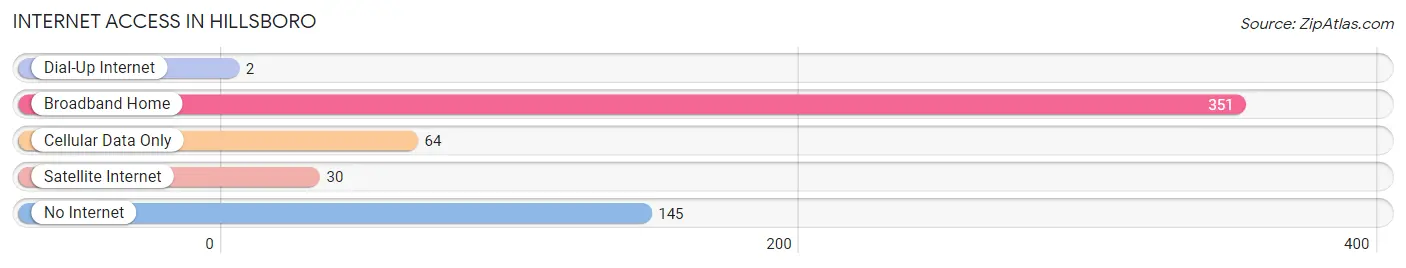
| Internet Type | # Households | % Households |
| Dial-Up Internet | 2 | 0.3% |
| Broadband Home | 351 | 60.4% |
| Cellular Data Only | 64 | 11.0% |
| Satellite Internet | 30 | 5.2% |
| No Internet | 145 | 25.0% |
| Total | 581 | 100.0% |
Hillsboro Summary
Hillsboro, Wisconsin is a small city located in the southwestern corner of the state, in Vernon County. It is situated on the banks of the Kickapoo River, and is the county seat of Vernon County. The city has a population of 2,845, according to the 2010 census.
History
Hillsboro was founded in 1851 by a group of settlers from New York. The city was named after Hillsborough, New York, the hometown of the settlers. The city was incorporated in 1858, and the first mayor was elected in 1859.
The city was an important stop on the Milwaukee and St. Paul Railroad, which ran through the city in the late 19th century. The railroad brought economic growth to the city, and it became a center for the lumber industry. The city also became a center for the dairy industry, and the first cheese factory was built in 1876.
Geography
Hillsboro is located in the southwestern corner of Wisconsin, in Vernon County. It is situated on the banks of the Kickapoo River, and is the county seat of Vernon County. The city has a total area of 2.2 square miles, all of which is land.
The city is located in the Driftless Area, a region of Wisconsin that was not glaciated during the last ice age. The area is characterized by rolling hills and valleys, and is home to a variety of wildlife.
Economy
Hillsboro is a small city, and its economy is largely based on agriculture and tourism. The city is home to several dairy farms, and is a major producer of cheese. The city is also home to several wineries, and is a popular destination for wine tours.
The city is also home to several manufacturing companies, including a paper mill and a furniture factory. The city is also home to several retail stores, restaurants, and other businesses.
Demographics
According to the 2010 census, Hillsboro has a population of 2,845. The population is predominantly white, with a small minority population. The median household income is $41,944, and the median age is 43.
Conclusion
Hillsboro, Wisconsin is a small city located in the southwestern corner of the state, in Vernon County. It is situated on the banks of the Kickapoo River, and is the county seat of Vernon County. The city has a population of 2,845, according to the 2010 census. The city's economy is largely based on agriculture and tourism, and it is home to several dairy farms, wineries, and manufacturing companies. The population is predominantly white, with a small minority population. The median household income is $41,944, and the median age is 43.
Common Questions
What is Per Capita Income in Hillsboro?
Per Capita income in Hillsboro is $32,293.
What is the Median Family Income in Hillsboro?
Median Family Income in Hillsboro is $78,158.
What is the Median Household income in Hillsboro?
Median Household Income in Hillsboro is $58,281.
What is Income or Wage Gap in Hillsboro?
Income or Wage Gap in Hillsboro is 22.3%.
Women in Hillsboro earn 77.7 cents for every dollar earned by a man.
What is Family Income Deficit in Hillsboro?
Family Income Deficit in Hillsboro is $4,495.
Families that are below poverty line in Hillsboro earn $4,495 less on average than the poverty threshold level.
What is Inequality or Gini Index in Hillsboro?
Inequality or Gini Index in Hillsboro is 0.42.
What is the Total Population of Hillsboro?
Total Population of Hillsboro is 1,318.
What is the Total Male Population of Hillsboro?
Total Male Population of Hillsboro is 737.
What is the Total Female Population of Hillsboro?
Total Female Population of Hillsboro is 581.
What is the Ratio of Males per 100 Females in Hillsboro?
There are 126.85 Males per 100 Females in Hillsboro.
What is the Ratio of Females per 100 Males in Hillsboro?
There are 78.83 Females per 100 Males in Hillsboro.
What is the Median Population Age in Hillsboro?
Median Population Age in Hillsboro is 45.9 Years.
What is the Average Family Size in Hillsboro
Average Family Size in Hillsboro is 2.8 People.
What is the Average Household Size in Hillsboro
Average Household Size in Hillsboro is 2.2 People.
How Large is the Labor Force in Hillsboro?
There are 637 People in the Labor Forcein in Hillsboro.
What is the Percentage of People in the Labor Force in Hillsboro?
60.7% of People are in the Labor Force in Hillsboro.
What is the Unemployment Rate in Hillsboro?
Unemployment Rate in Hillsboro is 5.3%.