Broken Bow, NE Map & Demographics
Broken Bow Map
Broken Bow Overview
$28,785
PER CAPITA INCOME
$67,139
AVG FAMILY INCOME
$49,425
AVG HOUSEHOLD INCOME
32.6%
WAGE / INCOME GAP [ % ]
67.4¢/ $1
WAGE / INCOME GAP [ $ ]
$12,692
FAMILY INCOME DEFICIT
0.44
INEQUALITY / GINI INDEX
3,510
TOTAL POPULATION
1,605
MALE POPULATION
1,905
FEMALE POPULATION
84.25
MALES / 100 FEMALES
118.69
FEMALES / 100 MALES
41.4
MEDIAN AGE
3.0
AVG FAMILY SIZE
2.3
AVG HOUSEHOLD SIZE
1,639
LABOR FORCE [ PEOPLE ]
59.4%
PERCENT IN LABOR FORCE
2.2%
UNEMPLOYMENT RATE
Broken Bow Zip Codes
Broken Bow Area Codes
Income in Broken Bow
Income Overview in Broken Bow
Per Capita Income in Broken Bow is $28,785, while median incomes of families and households are $67,139 and $49,425 respectively.
| Characteristic | Number | Measure |
| Per Capita Income | 3,510 | $28,785 |
| Median Family Income | 841 | $67,139 |
| Mean Family Income | 841 | $90,080 |
| Median Household Income | 1,515 | $49,425 |
| Mean Household Income | 1,515 | $68,006 |
| Income Deficit | 841 | $12,692 |
| Wage / Income Gap (%) | 3,510 | 32.59% |
| Wage / Income Gap ($) | 3,510 | 67.41¢ per $1 |
| Gini / Inequality Index | 3,510 | 0.44 |
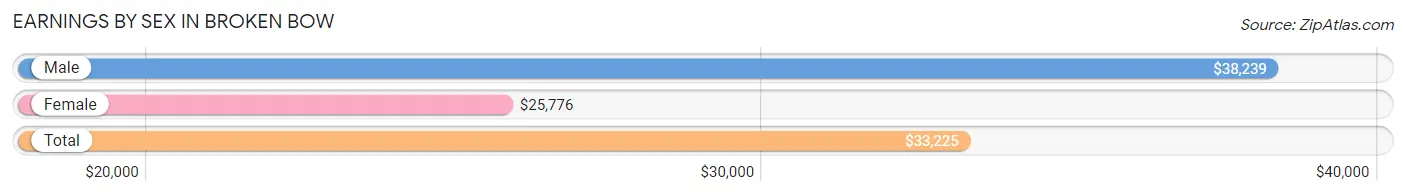
Earnings by Sex in Broken Bow
Average Earnings in Broken Bow are $33,225, $38,239 for men and $25,776 for women, a difference of 32.6%.
| Sex | Number | Average Earnings |
| Male | 967 (53.3%) | $38,239 |
| Female | 846 (46.7%) | $25,776 |
| Total | 1,813 (100.0%) | $33,225 |
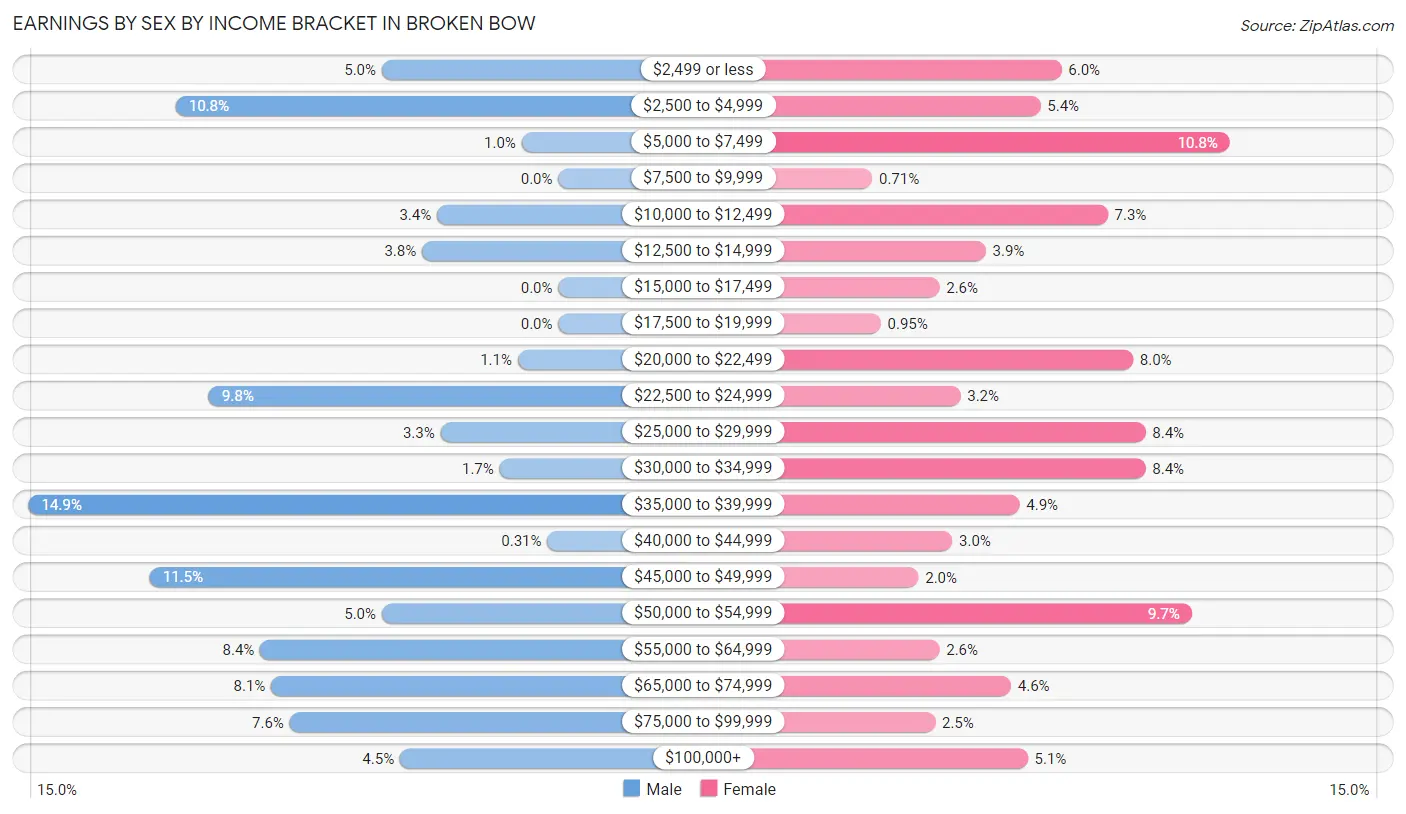
Earnings by Sex by Income Bracket in Broken Bow
The most common earnings brackets in Broken Bow are $35,000 to $39,999 for men (144 | 14.9%) and $5,000 to $7,499 for women (91 | 10.8%).
| Income | Male | Female |
| $2,499 or less | 48 (5.0%) | 51 (6.0%) |
| $2,500 to $4,999 | 104 (10.7%) | 46 (5.4%) |
| $5,000 to $7,499 | 10 (1.0%) | 91 (10.8%) |
| $7,500 to $9,999 | 0 (0.0%) | 6 (0.7%) |
| $10,000 to $12,499 | 33 (3.4%) | 62 (7.3%) |
| $12,500 to $14,999 | 37 (3.8%) | 33 (3.9%) |
| $15,000 to $17,499 | 0 (0.0%) | 22 (2.6%) |
| $17,500 to $19,999 | 0 (0.0%) | 8 (0.9%) |
| $20,000 to $22,499 | 11 (1.1%) | 68 (8.0%) |
| $22,500 to $24,999 | 95 (9.8%) | 27 (3.2%) |
| $25,000 to $29,999 | 32 (3.3%) | 71 (8.4%) |
| $30,000 to $34,999 | 16 (1.7%) | 71 (8.4%) |
| $35,000 to $39,999 | 144 (14.9%) | 41 (4.9%) |
| $40,000 to $44,999 | 3 (0.3%) | 25 (3.0%) |
| $45,000 to $49,999 | 111 (11.5%) | 17 (2.0%) |
| $50,000 to $54,999 | 48 (5.0%) | 82 (9.7%) |
| $55,000 to $64,999 | 81 (8.4%) | 22 (2.6%) |
| $65,000 to $74,999 | 78 (8.1%) | 39 (4.6%) |
| $75,000 to $99,999 | 73 (7.5%) | 21 (2.5%) |
| $100,000+ | 43 (4.4%) | 43 (5.1%) |
| Total | 967 (100.0%) | 846 (100.0%) |
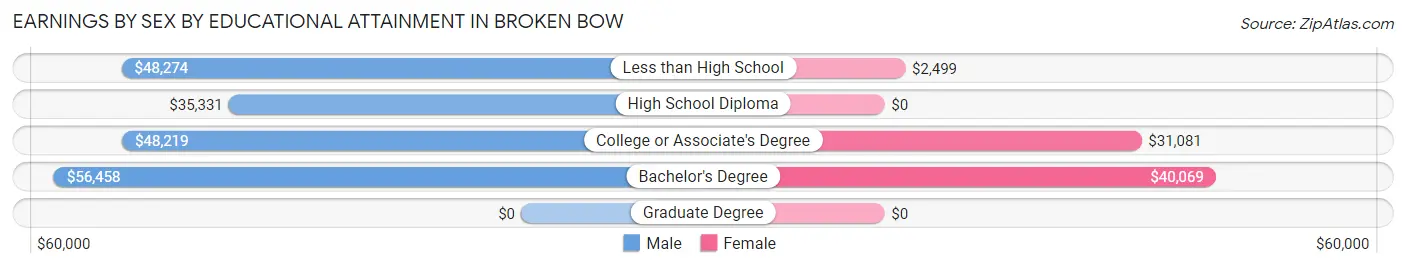
Earnings by Sex by Educational Attainment in Broken Bow
Average earnings in Broken Bow are $46,686 for men and $30,845 for women, a difference of 33.9%. Men with an educational attainment of bachelor's degree enjoy the highest average annual earnings of $56,458, while those with high school diploma education earn the least with $35,331. Women with an educational attainment of bachelor's degree earn the most with the average annual earnings of $40,069, while those with less than high school education have the smallest earnings of $2,499.
| Educational Attainment | Male Income | Female Income |
| Less than High School | $48,274 | $2,499 |
| High School Diploma | $35,331 | $0 |
| College or Associate's Degree | $48,219 | $31,081 |
| Bachelor's Degree | $56,458 | $40,069 |
| Graduate Degree | - | - |
| Total | $46,686 | $30,845 |
Family Income in Broken Bow
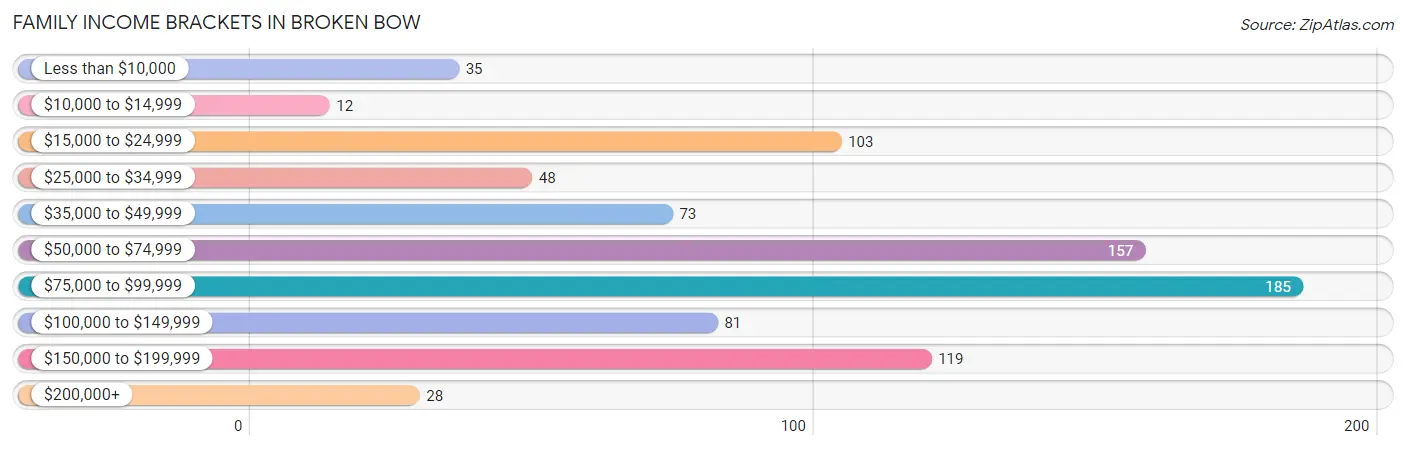
Family Income Brackets in Broken Bow
According to the Broken Bow family income data, there are 185 families falling into the $75,000 to $99,999 income range, which is the most common income bracket and makes up 22.0% of all families. Conversely, the $10,000 to $14,999 income bracket is the least frequent group with only 12 families (1.4%) belonging to this category.
| Income Bracket | # Families | % Families |
| Less than $10,000 | 35 | 4.2% |
| $10,000 to $14,999 | 12 | 1.4% |
| $15,000 to $24,999 | 103 | 12.2% |
| $25,000 to $34,999 | 48 | 5.7% |
| $35,000 to $49,999 | 73 | 8.7% |
| $50,000 to $74,999 | 157 | 18.7% |
| $75,000 to $99,999 | 185 | 22.0% |
| $100,000 to $149,999 | 81 | 9.6% |
| $150,000 to $199,999 | 119 | 14.1% |
| $200,000+ | 28 | 3.3% |
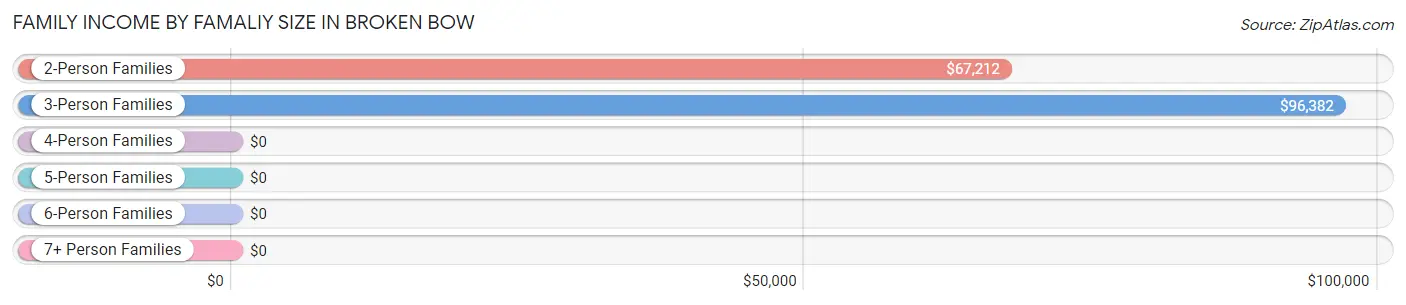
Family Income by Famaliy Size in Broken Bow
3-person families (99 | 11.8%) account for the highest median family income in Broken Bow with $96,382 per family, while 2-person families (468 | 55.6%) have the highest median income of $33,606 per family member.
| Income Bracket | # Families | Median Income |
| 2-Person Families | 468 (55.6%) | $67,212 |
| 3-Person Families | 99 (11.8%) | $96,382 |
| 4-Person Families | 93 (11.1%) | $0 |
| 5-Person Families | 117 (13.9%) | $0 |
| 6-Person Families | 0 (0.0%) | $0 |
| 7+ Person Families | 64 (7.6%) | $0 |
| Total | 841 (100.0%) | $67,139 |
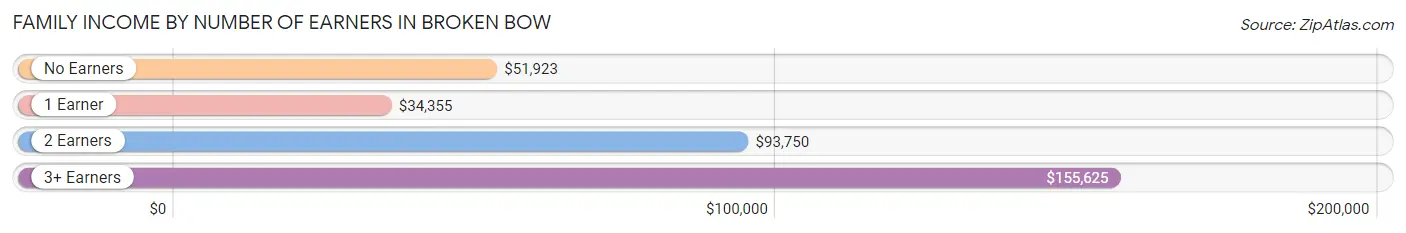
Family Income by Number of Earners in Broken Bow
The median family income in Broken Bow is $67,139, with families comprising 3+ earners (165) having the highest median family income of $155,625, while families with 1 earner (252) have the lowest median family income of $34,355, accounting for 19.6% and 30.0% of families, respectively.
| Number of Earners | # Families | Median Income |
| No Earners | 84 (10.0%) | $51,923 |
| 1 Earner | 252 (30.0%) | $34,355 |
| 2 Earners | 340 (40.4%) | $93,750 |
| 3+ Earners | 165 (19.6%) | $155,625 |
| Total | 841 (100.0%) | $67,139 |
Household Income in Broken Bow
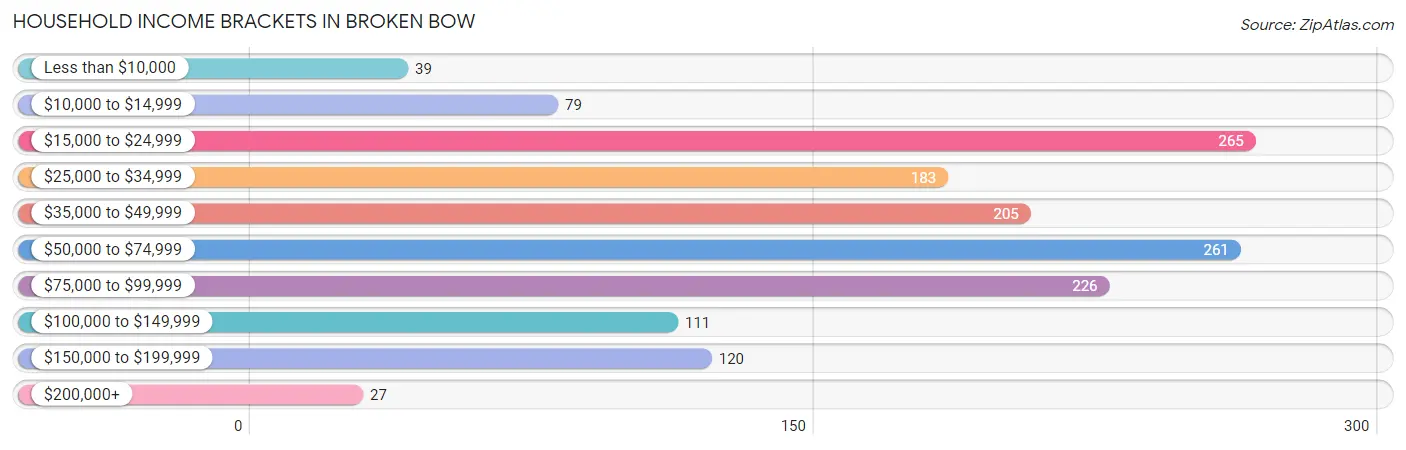
Household Income Brackets in Broken Bow
With 265 households falling in the category, the $15,000 to $24,999 income range is the most frequent in Broken Bow, accounting for 17.5% of all households. In contrast, only 27 households (1.8%) fall into the $200,000+ income bracket, making it the least populous group.
| Income Bracket | # Households | % Households |
| Less than $10,000 | 39 | 2.6% |
| $10,000 to $14,999 | 79 | 5.2% |
| $15,000 to $24,999 | 265 | 17.5% |
| $25,000 to $34,999 | 183 | 12.1% |
| $35,000 to $49,999 | 205 | 13.5% |
| $50,000 to $74,999 | 261 | 17.2% |
| $75,000 to $99,999 | 226 | 14.9% |
| $100,000 to $149,999 | 111 | 7.3% |
| $150,000 to $199,999 | 120 | 7.9% |
| $200,000+ | 27 | 1.8% |
Household Income by Householder Age in Broken Bow
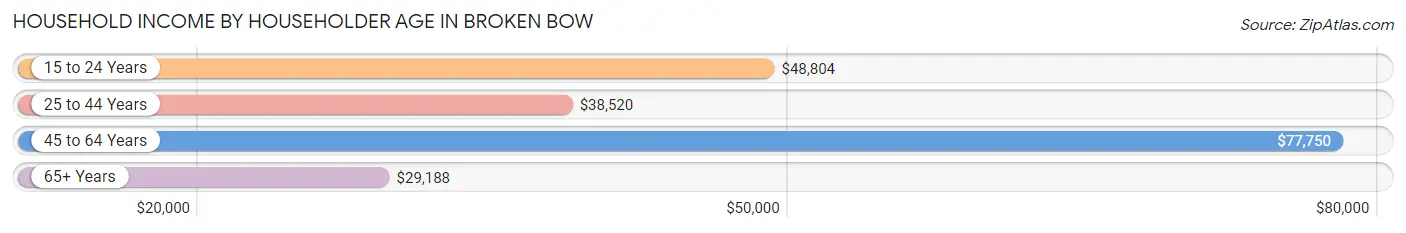
The median household income in Broken Bow is $49,425, with the highest median household income of $77,750 found in the 45 to 64 years age bracket for the primary householder. A total of 432 households (28.5%) fall into this category. Meanwhile, the 65+ years age bracket for the primary householder has the lowest median household income of $29,188, with 463 households (30.6%) in this group.
| Income Bracket | # Households | Median Income |
| 15 to 24 Years | 126 (8.3%) | $48,804 |
| 25 to 44 Years | 494 (32.6%) | $38,520 |
| 45 to 64 Years | 432 (28.5%) | $77,750 |
| 65+ Years | 463 (30.6%) | $29,188 |
| Total | 1,515 (100.0%) | $49,425 |
Poverty in Broken Bow
Income Below Poverty by Sex and Age in Broken Bow
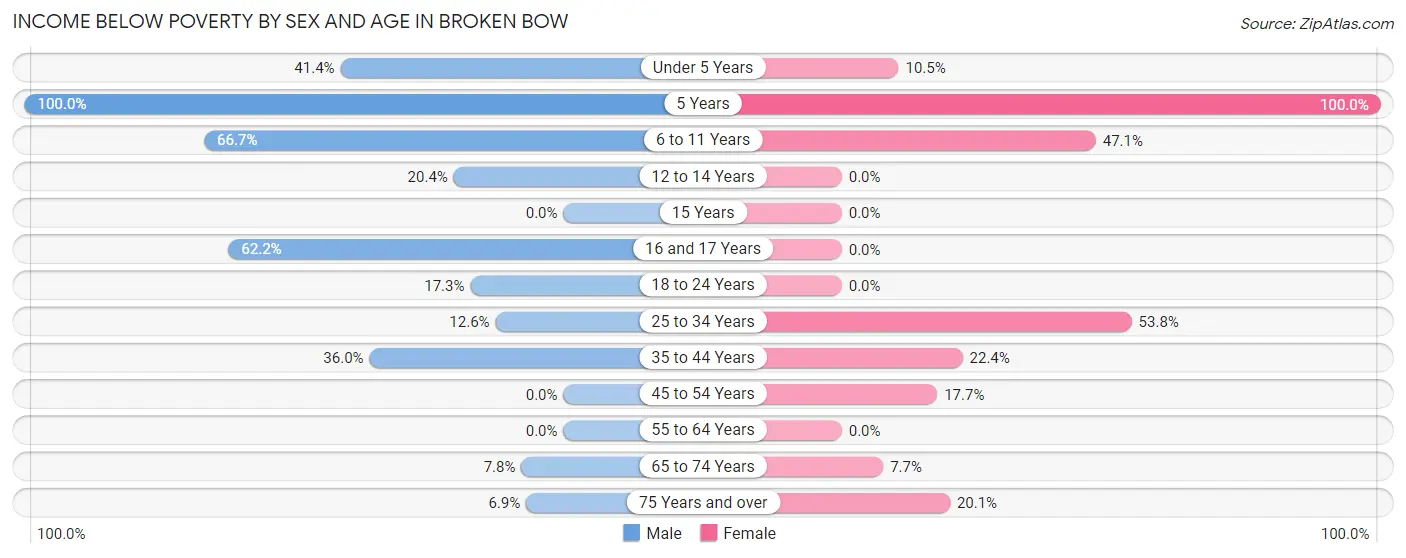
With 21.5% poverty level for males and 19.5% for females among the residents of Broken Bow, 5 year old males and 5 year old females are the most vulnerable to poverty, with 36 males (100.0%) and 39 females (100.0%) in their respective age groups living below the poverty level.
| Age Bracket | Male | Female |
| Under 5 Years | 12 (41.4%) | 4 (10.5%) |
| 5 Years | 36 (100.0%) | 39 (100.0%) |
| 6 to 11 Years | 46 (66.7%) | 66 (47.1%) |
| 12 to 14 Years | 34 (20.4%) | 0 (0.0%) |
| 15 Years | 0 (0.0%) | 0 (0.0%) |
| 16 and 17 Years | 69 (62.2%) | 0 (0.0%) |
| 18 to 24 Years | 24 (17.3%) | 0 (0.0%) |
| 25 to 34 Years | 15 (12.6%) | 99 (53.8%) |
| 35 to 44 Years | 81 (36.0%) | 63 (22.4%) |
| 45 to 54 Years | 0 (0.0%) | 17 (17.7%) |
| 55 to 64 Years | 0 (0.0%) | 0 (0.0%) |
| 65 to 74 Years | 11 (7.8%) | 10 (7.7%) |
| 75 Years and over | 7 (6.9%) | 58 (20.1%) |
| Total | 335 (21.5%) | 356 (19.5%) |
Income Above Poverty by Sex and Age in Broken Bow
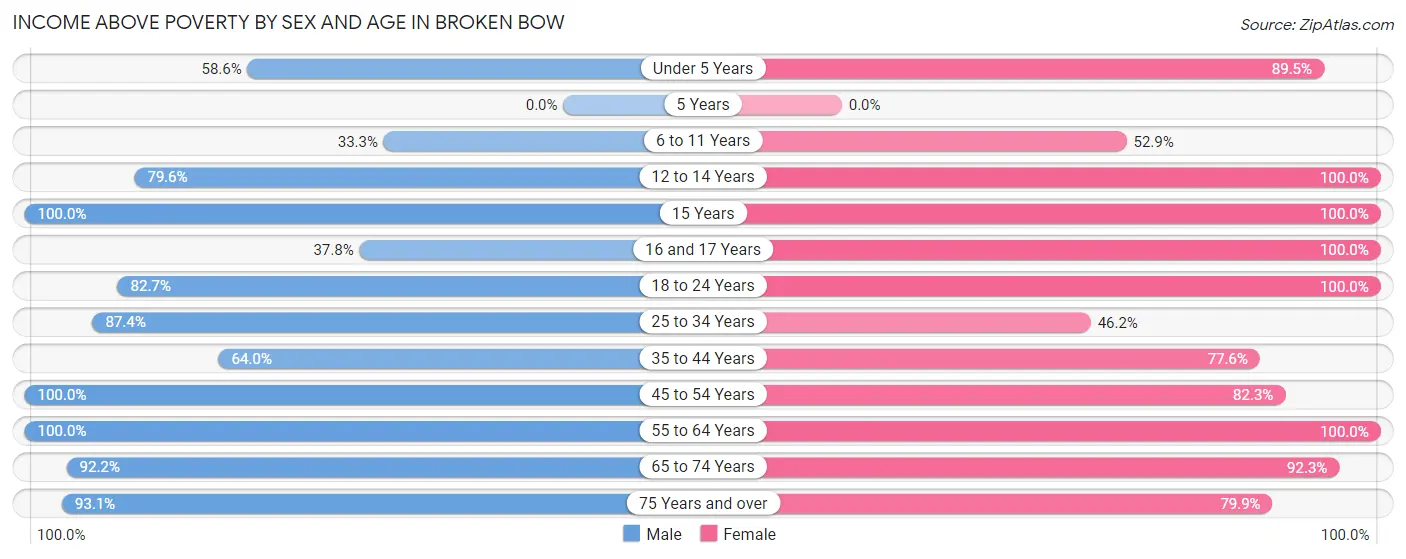
According to the poverty statistics in Broken Bow, males aged 15 years and females aged 12 to 14 years are the age groups that are most secure financially, with 100.0% of males and 100.0% of females in these age groups living above the poverty line.
| Age Bracket | Male | Female |
| Under 5 Years | 17 (58.6%) | 34 (89.5%) |
| 5 Years | 0 (0.0%) | 0 (0.0%) |
| 6 to 11 Years | 23 (33.3%) | 74 (52.9%) |
| 12 to 14 Years | 133 (79.6%) | 163 (100.0%) |
| 15 Years | 8 (100.0%) | 19 (100.0%) |
| 16 and 17 Years | 42 (37.8%) | 73 (100.0%) |
| 18 to 24 Years | 115 (82.7%) | 148 (100.0%) |
| 25 to 34 Years | 104 (87.4%) | 85 (46.2%) |
| 35 to 44 Years | 144 (64.0%) | 218 (77.6%) |
| 45 to 54 Years | 154 (100.0%) | 79 (82.3%) |
| 55 to 64 Years | 258 (100.0%) | 228 (100.0%) |
| 65 to 74 Years | 130 (92.2%) | 120 (92.3%) |
| 75 Years and over | 94 (93.1%) | 231 (79.9%) |
| Total | 1,222 (78.5%) | 1,472 (80.5%) |
Income Below Poverty Among Married-Couple Families in Broken Bow
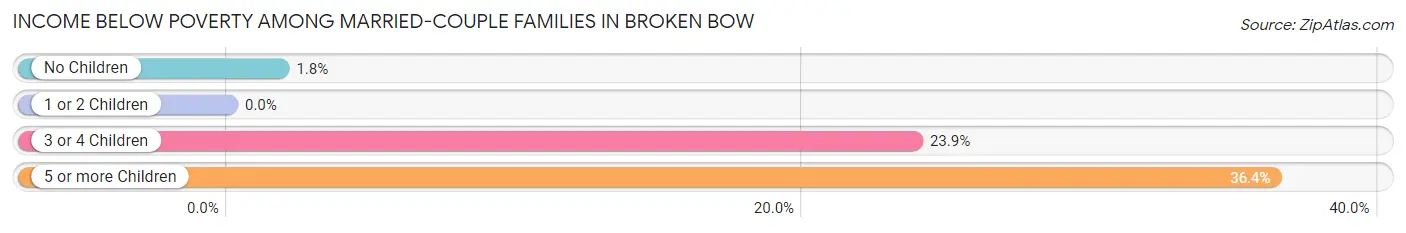
The poverty statistics for married-couple families in Broken Bow show that 7.5% or 50 of the total 662 families live below the poverty line. Families with 5 or more children have the highest poverty rate of 36.4%, comprising of 12 families. On the other hand, families with 1 or 2 children have the lowest poverty rate of 0.0%, which includes 0 families.
| Children | Above Poverty | Below Poverty |
| No Children | 385 (98.2%) | 7 (1.8%) |
| 1 or 2 Children | 107 (100.0%) | 0 (0.0%) |
| 3 or 4 Children | 99 (76.1%) | 31 (23.8%) |
| 5 or more Children | 21 (63.6%) | 12 (36.4%) |
| Total | 612 (92.4%) | 50 (7.5%) |
Income Below Poverty Among Single-Parent Households in Broken Bow
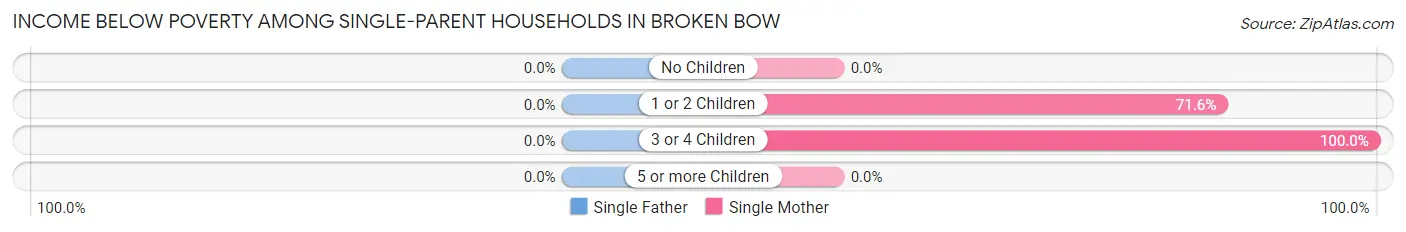
| Children | Single Father | Single Mother |
| No Children | 0 (0.0%) | 0 (0.0%) |
| 1 or 2 Children | 0 (0.0%) | 58 (71.6%) |
| 3 or 4 Children | 0 (0.0%) | 15 (100.0%) |
| 5 or more Children | 0 (0.0%) | 0 (0.0%) |
| Total | 0 (0.0%) | 73 (65.2%) |
Income Below Poverty Among Married-Couple vs Single-Parent Households in Broken Bow
The poverty data for Broken Bow shows that 50 of the married-couple family households (7.5%) and 73 of the single-parent households (40.8%) are living below the poverty level. Within the married-couple family households, those with 5 or more children have the highest poverty rate, with 12 households (36.4%) falling below the poverty line. Among the single-parent households, those with 3 or 4 children have the highest poverty rate, with 15 household (100.0%) living below poverty.
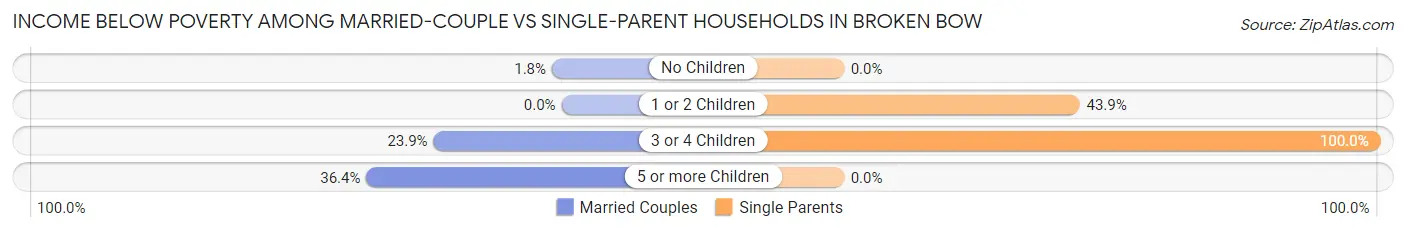
| Children | Married-Couple Families | Single-Parent Households |
| No Children | 7 (1.8%) | 0 (0.0%) |
| 1 or 2 Children | 0 (0.0%) | 58 (43.9%) |
| 3 or 4 Children | 31 (23.8%) | 15 (100.0%) |
| 5 or more Children | 12 (36.4%) | 0 (0.0%) |
| Total | 50 (7.5%) | 73 (40.8%) |
Race in Broken Bow
The most populous races in Broken Bow are White / Caucasian (3,303 | 94.1%), Hispanic or Latino (197 | 5.6%), and Two or more Races (123 | 3.5%).
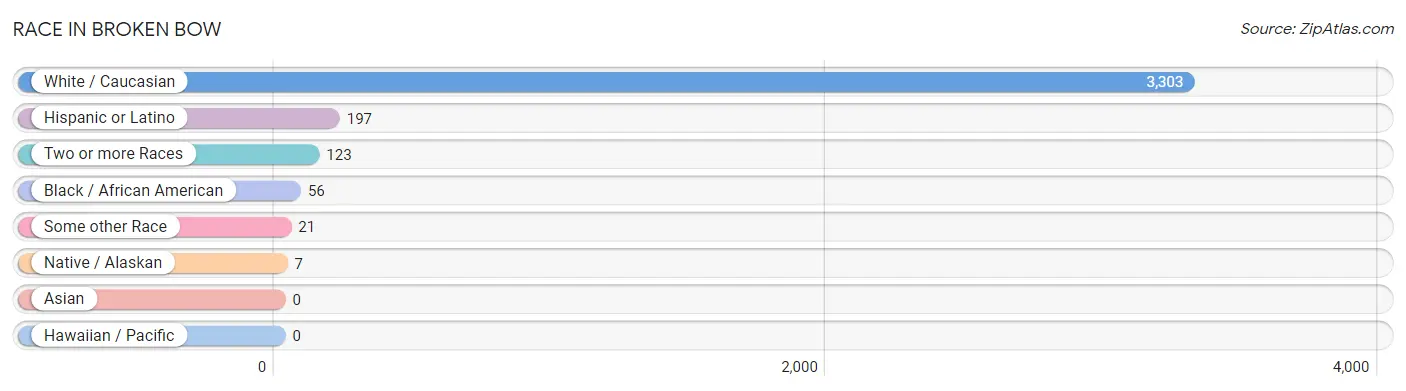
| Race | # Population | % Population |
| Asian | 0 | 0.0% |
| Black / African American | 56 | 1.6% |
| Hawaiian / Pacific | 0 | 0.0% |
| Hispanic or Latino | 197 | 5.6% |
| Native / Alaskan | 7 | 0.2% |
| White / Caucasian | 3,303 | 94.1% |
| Two or more Races | 123 | 3.5% |
| Some other Race | 21 | 0.6% |
| Total | 3,510 | 100.0% |
Ancestry in Broken Bow
The most populous ancestries reported in Broken Bow are German (1,235 | 35.2%), English (644 | 18.3%), Irish (474 | 13.5%), Norwegian (228 | 6.5%), and Mexican (196 | 5.6%), together accounting for 79.1% of all Broken Bow residents.
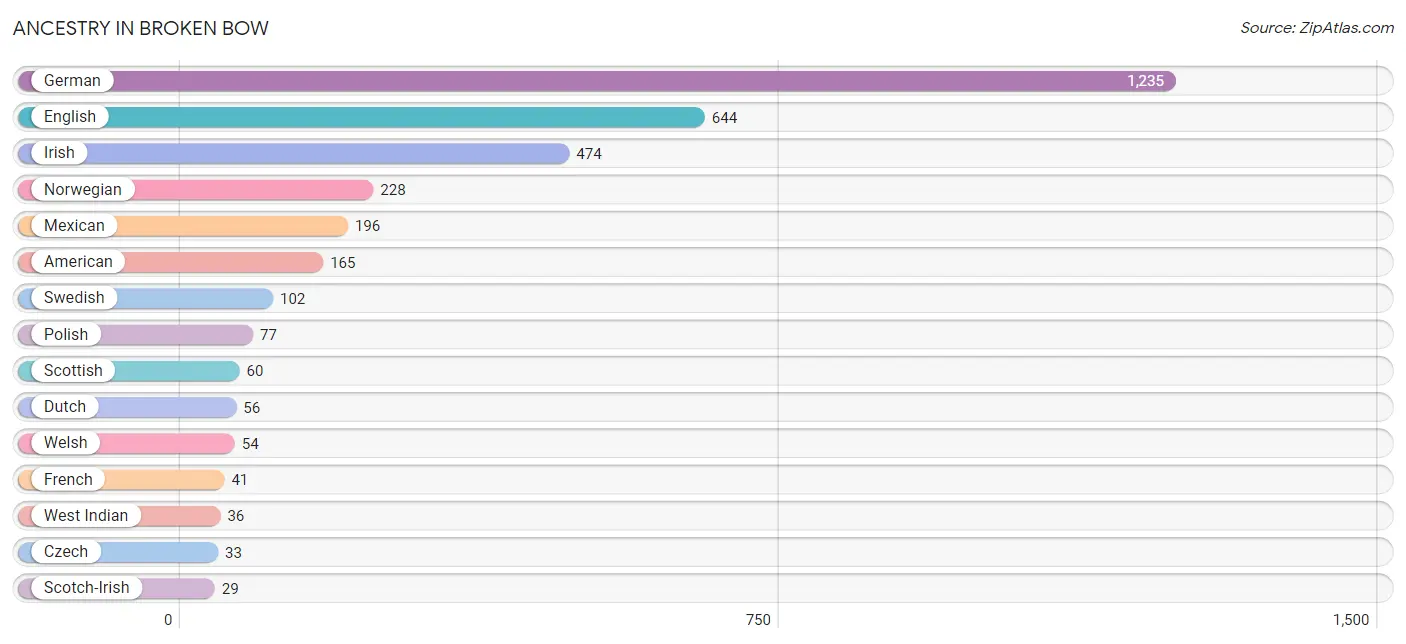
| Ancestry | # Population | % Population |
| American | 165 | 4.7% |
| Cuban | 1 | 0.0% |
| Czech | 33 | 0.9% |
| Danish | 28 | 0.8% |
| Dutch | 56 | 1.6% |
| Eastern European | 14 | 0.4% |
| English | 644 | 18.3% |
| Estonian | 21 | 0.6% |
| European | 25 | 0.7% |
| French | 41 | 1.2% |
| French Canadian | 2 | 0.1% |
| German | 1,235 | 35.2% |
| Irish | 474 | 13.5% |
| Italian | 21 | 0.6% |
| Lithuanian | 5 | 0.1% |
| Mexican | 196 | 5.6% |
| Norwegian | 228 | 6.5% |
| Polish | 77 | 2.2% |
| Scotch-Irish | 29 | 0.8% |
| Scottish | 60 | 1.7% |
| Sioux | 16 | 0.5% |
| Subsaharan African | 1 | 0.0% |
| Sudanese | 1 | 0.0% |
| Swedish | 102 | 2.9% |
| Trinidadian and Tobagonian | 8 | 0.2% |
| Welsh | 54 | 1.5% |
| West Indian | 36 | 1.0% | View All 27 Rows |
Immigrants in Broken Bow
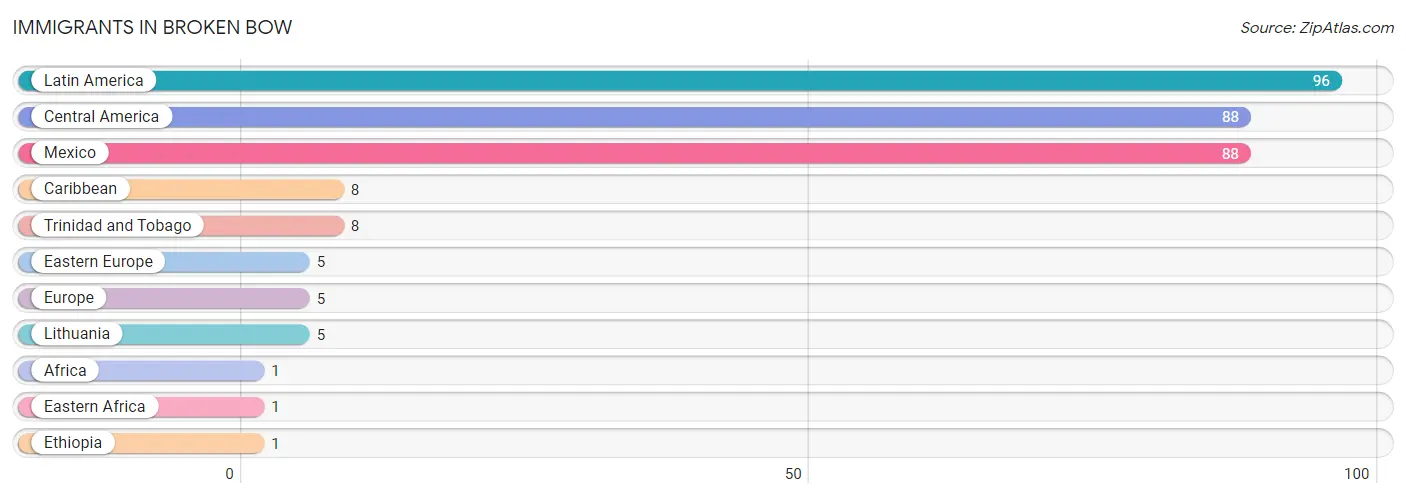
The most numerous immigrant groups reported in Broken Bow came from Latin America (96 | 2.7%), Central America (88 | 2.5%), Mexico (88 | 2.5%), Caribbean (8 | 0.2%), and Trinidad and Tobago (8 | 0.2%), together accounting for 8.2% of all Broken Bow residents.
| Immigration Origin | # Population | % Population |
| Africa | 1 | 0.0% |
| Caribbean | 8 | 0.2% |
| Central America | 88 | 2.5% |
| Eastern Africa | 1 | 0.0% |
| Eastern Europe | 5 | 0.1% |
| Ethiopia | 1 | 0.0% |
| Europe | 5 | 0.1% |
| Latin America | 96 | 2.7% |
| Lithuania | 5 | 0.1% |
| Mexico | 88 | 2.5% |
| Trinidad and Tobago | 8 | 0.2% | View All 11 Rows |
Sex and Age in Broken Bow
Sex and Age in Broken Bow
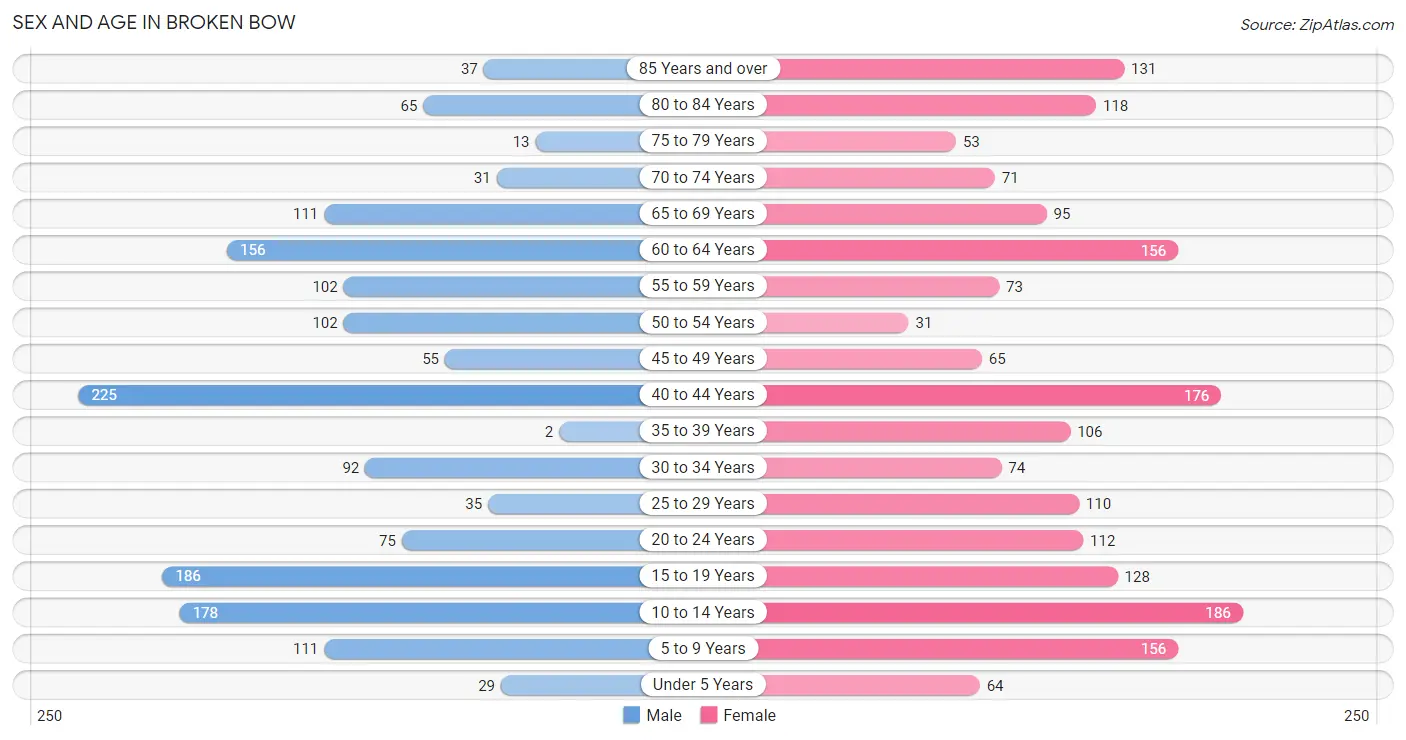
The most populous age groups in Broken Bow are 40 to 44 Years (225 | 14.0%) for men and 10 to 14 Years (186 | 9.8%) for women.
| Age Bracket | Male | Female |
| Under 5 Years | 29 (1.8%) | 64 (3.4%) |
| 5 to 9 Years | 111 (6.9%) | 156 (8.2%) |
| 10 to 14 Years | 178 (11.1%) | 186 (9.8%) |
| 15 to 19 Years | 186 (11.6%) | 128 (6.7%) |
| 20 to 24 Years | 75 (4.7%) | 112 (5.9%) |
| 25 to 29 Years | 35 (2.2%) | 110 (5.8%) |
| 30 to 34 Years | 92 (5.7%) | 74 (3.9%) |
| 35 to 39 Years | 2 (0.1%) | 106 (5.6%) |
| 40 to 44 Years | 225 (14.0%) | 176 (9.2%) |
| 45 to 49 Years | 55 (3.4%) | 65 (3.4%) |
| 50 to 54 Years | 102 (6.4%) | 31 (1.6%) |
| 55 to 59 Years | 102 (6.4%) | 73 (3.8%) |
| 60 to 64 Years | 156 (9.7%) | 156 (8.2%) |
| 65 to 69 Years | 111 (6.9%) | 95 (5.0%) |
| 70 to 74 Years | 31 (1.9%) | 71 (3.7%) |
| 75 to 79 Years | 13 (0.8%) | 53 (2.8%) |
| 80 to 84 Years | 65 (4.1%) | 118 (6.2%) |
| 85 Years and over | 37 (2.3%) | 131 (6.9%) |
| Total | 1,605 (100.0%) | 1,905 (100.0%) |
Families and Households in Broken Bow
Median Family Size in Broken Bow
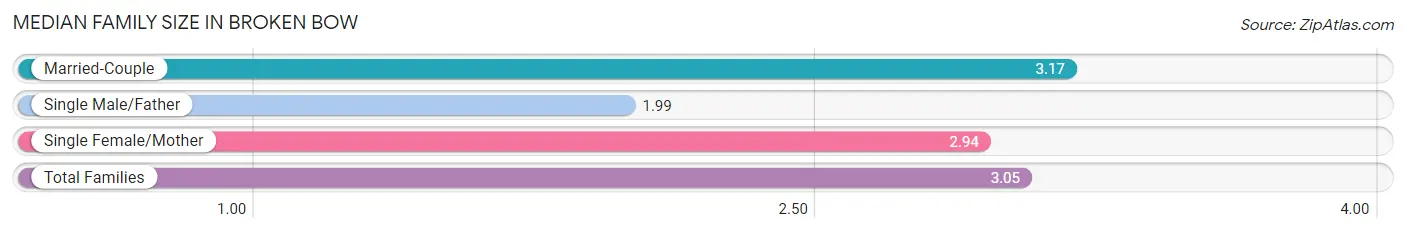
The median family size in Broken Bow is 3.05 persons per family, with married-couple families (662 | 78.7%) accounting for the largest median family size of 3.17 persons per family. On the other hand, single male/father families (67 | 8.0%) represent the smallest median family size with 1.99 persons per family.
| Family Type | # Families | Family Size |
| Married-Couple | 662 (78.7%) | 3.17 |
| Single Male/Father | 67 (8.0%) | 1.99 |
| Single Female/Mother | 112 (13.3%) | 2.94 |
| Total Families | 841 (100.0%) | 3.05 |
Median Household Size in Broken Bow
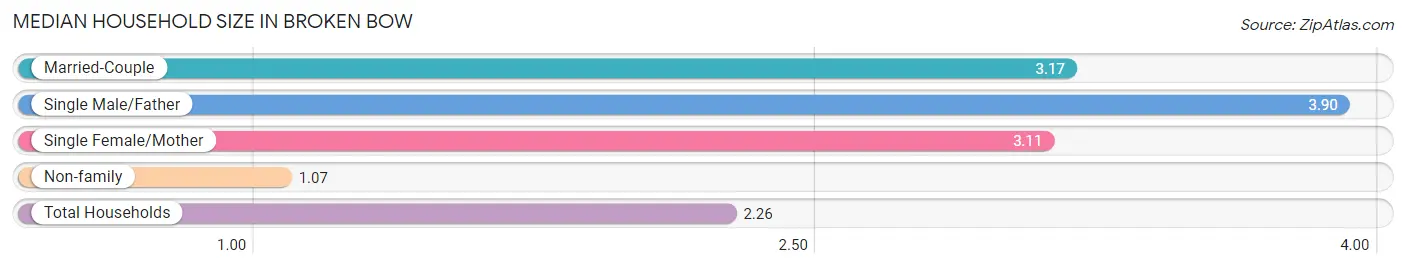
The median household size in Broken Bow is 2.26 persons per household, with single male/father households (67 | 4.4%) accounting for the largest median household size of 3.9 persons per household. non-family households (674 | 44.5%) represent the smallest median household size with 1.07 persons per household.
| Household Type | # Households | Household Size |
| Married-Couple | 662 (43.7%) | 3.17 |
| Single Male/Father | 67 (4.4%) | 3.90 |
| Single Female/Mother | 112 (7.4%) | 3.11 |
| Non-family | 674 (44.5%) | 1.07 |
| Total Households | 1,515 (100.0%) | 2.26 |
Household Size by Marriage Status in Broken Bow
Out of a total of 1,515 households in Broken Bow, 841 (55.5%) are family households, while 674 (44.5%) are nonfamily households. The most numerous type of family households are 2-person households, comprising 391, and the most common type of nonfamily households are 1-person households, comprising 629.
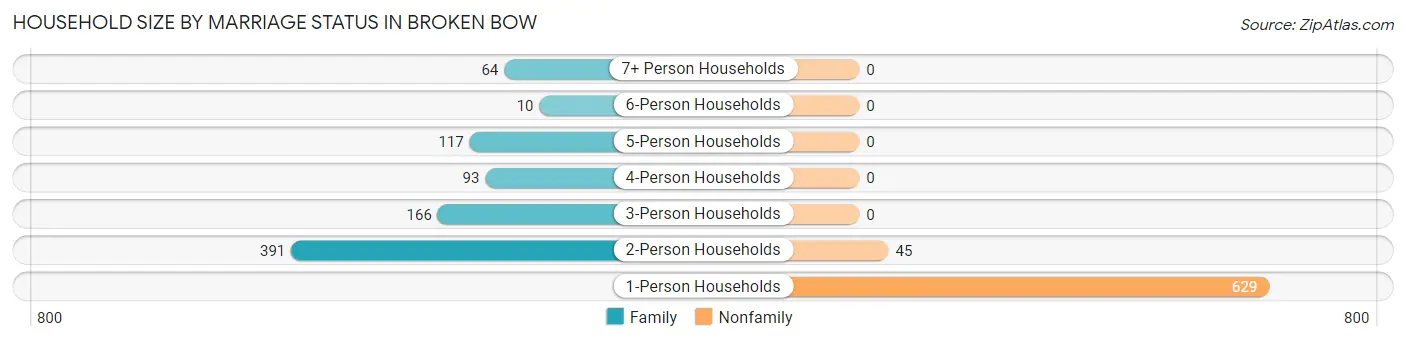
| Household Size | Family Households | Nonfamily Households |
| 1-Person Households | - | 629 (41.5%) |
| 2-Person Households | 391 (25.8%) | 45 (3.0%) |
| 3-Person Households | 166 (11.0%) | 0 (0.0%) |
| 4-Person Households | 93 (6.1%) | 0 (0.0%) |
| 5-Person Households | 117 (7.7%) | 0 (0.0%) |
| 6-Person Households | 10 (0.7%) | 0 (0.0%) |
| 7+ Person Households | 64 (4.2%) | 0 (0.0%) |
| Total | 841 (55.5%) | 674 (44.5%) |
Female Fertility in Broken Bow
Fertility by Age in Broken Bow
Average fertility rate in Broken Bow is 42.0 births per 1,000 women. Women in the age bracket of 20 to 34 years have the highest fertility rate with 111.0 births per 1,000 women. Women in the age bracket of 20 to 34 years acount for 100.0% of all women with births.
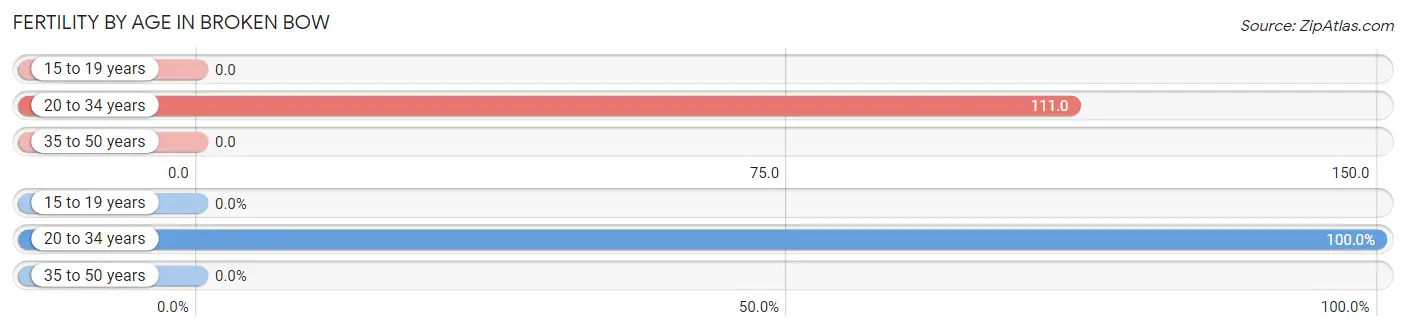
| Age Bracket | Women with Births | Births / 1,000 Women |
| 15 to 19 years | 0 (0.0%) | 0.0 |
| 20 to 34 years | 33 (100.0%) | 111.0 |
| 35 to 50 years | 0 (0.0%) | 0.0 |
| Total | 33 (100.0%) | 42.0 |
Fertility by Age by Marriage Status in Broken Bow
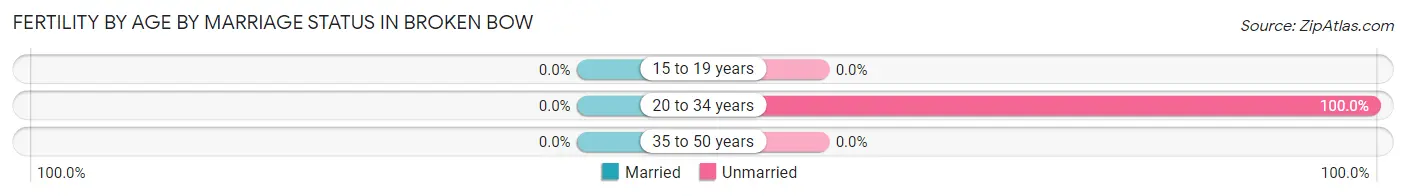
| Age Bracket | Married | Unmarried |
| 15 to 19 years | 0 (0.0%) | 0 (0.0%) |
| 20 to 34 years | 0 (0.0%) | 33 (100.0%) |
| 35 to 50 years | 0 (0.0%) | 0 (0.0%) |
| Total | 0 (0.0%) | 33 (100.0%) |
Fertility by Education in Broken Bow
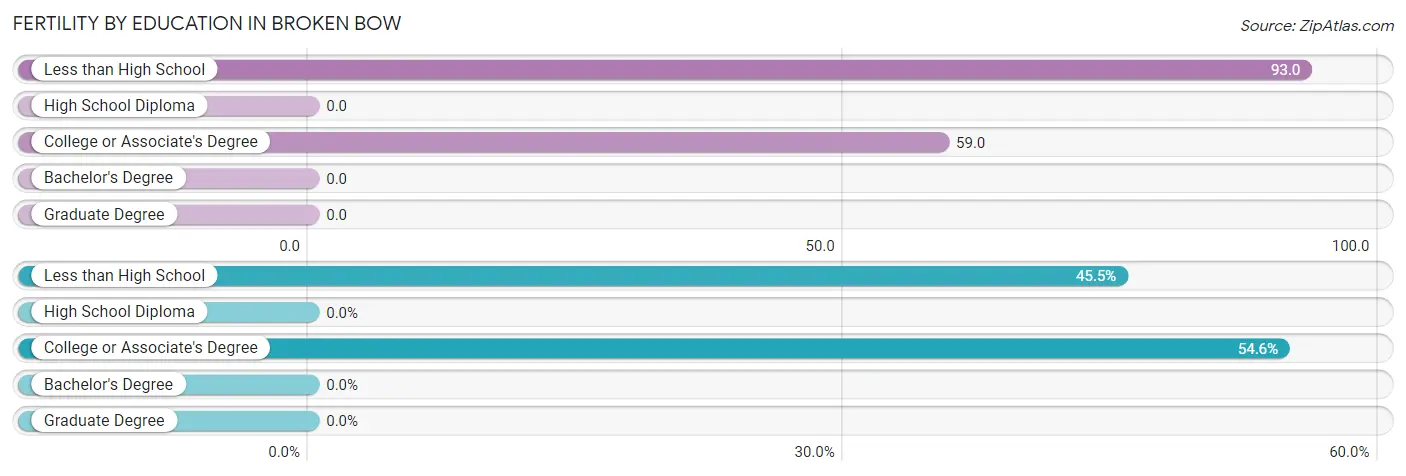
| Educational Attainment | Women with Births | Births / 1,000 Women |
| Less than High School | 15 (45.5%) | 93.0 |
| High School Diploma | 0 (0.0%) | 0.0 |
| College or Associate's Degree | 18 (54.5%) | 59.0 |
| Bachelor's Degree | 0 (0.0%) | 0.0 |
| Graduate Degree | 0 (0.0%) | 0.0 |
| Total | 33 (100.0%) | 42.0 |
Fertility by Education by Marriage Status in Broken Bow
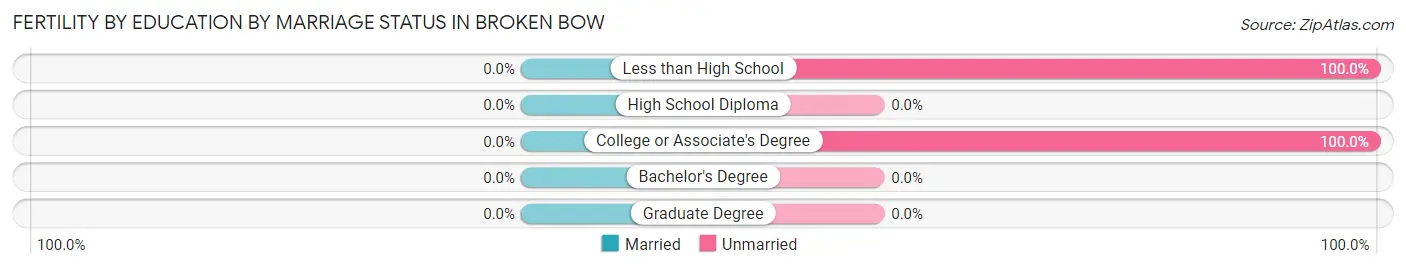
| Educational Attainment | Married | Unmarried |
| Less than High School | 0 (0.0%) | 15 (100.0%) |
| High School Diploma | 0 (0.0%) | 0 (0.0%) |
| College or Associate's Degree | 0 (0.0%) | 18 (100.0%) |
| Bachelor's Degree | 0 (0.0%) | 0 (0.0%) |
| Graduate Degree | 0 (0.0%) | 0 (0.0%) |
| Total | 0 (0.0%) | 33 (100.0%) |
Employment Characteristics in Broken Bow
Employment by Class of Employer in Broken Bow
Among the 1,498 employed individuals in Broken Bow, private company employees (856 | 57.1%), not-for-profit organizations (162 | 10.8%), and local government employees (138 | 9.2%) make up the most common classes of employment.
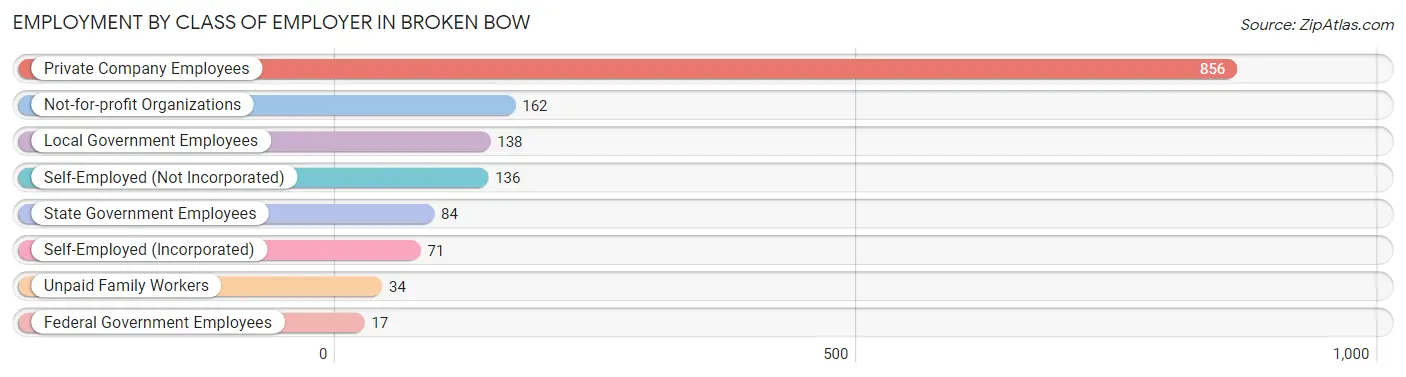
| Employer Class | # Employees | % Employees |
| Private Company Employees | 856 | 57.1% |
| Self-Employed (Incorporated) | 71 | 4.7% |
| Self-Employed (Not Incorporated) | 136 | 9.1% |
| Not-for-profit Organizations | 162 | 10.8% |
| Local Government Employees | 138 | 9.2% |
| State Government Employees | 84 | 5.6% |
| Federal Government Employees | 17 | 1.1% |
| Unpaid Family Workers | 34 | 2.3% |
| Total | 1,498 | 100.0% |
Employment Status by Age in Broken Bow
According to the labor force statistics for Broken Bow, out of the total population over 16 years of age (2,759), 59.4% or 1,639 individuals are in the labor force, with 2.2% or 36 of them unemployed. The age group with the highest labor force participation rate is 45 to 54 years, with 92.1% or 233 individuals in the labor force. Within the labor force, the 60 to 64 years age range has the highest percentage of unemployed individuals, with 10.0% or 20 of them being unemployed.
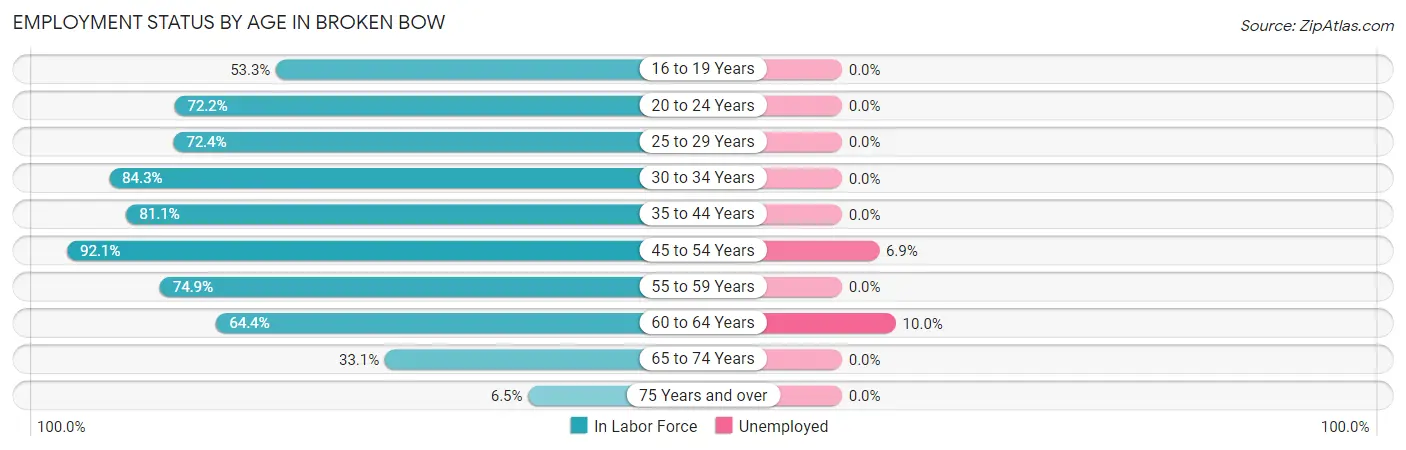
| Age Bracket | In Labor Force | Unemployed |
| 16 to 19 Years | 153 (53.3%) | 0 (0.0%) |
| 20 to 24 Years | 135 (72.2%) | 0 (0.0%) |
| 25 to 29 Years | 105 (72.4%) | 0 (0.0%) |
| 30 to 34 Years | 140 (84.3%) | 0 (0.0%) |
| 35 to 44 Years | 413 (81.1%) | 0 (0.0%) |
| 45 to 54 Years | 233 (92.1%) | 16 (6.9%) |
| 55 to 59 Years | 131 (74.9%) | 0 (0.0%) |
| 60 to 64 Years | 201 (64.4%) | 20 (10.0%) |
| 65 to 74 Years | 102 (33.1%) | 0 (0.0%) |
| 75 Years and over | 27 (6.5%) | 0 (0.0%) |
| Total | 1,639 (59.4%) | 36 (2.2%) |
Employment Status by Educational Attainment in Broken Bow
According to labor force statistics for Broken Bow, 78.4% of individuals (1,223) out of the total population between 25 and 64 years of age (1,560) are in the labor force, with 2.9% or 35 of them being unemployed. The group with the highest labor force participation rate are those with the educational attainment of college / associate degree, with 84.2% or 513 individuals in the labor force. Within the labor force, individuals with college / associate degree education have the highest percentage of unemployment, with 7.0% or 36 of them being unemployed.
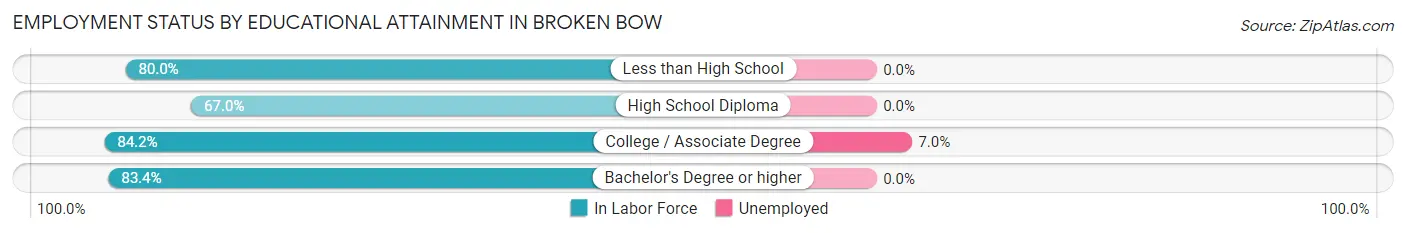
| Educational Attainment | In Labor Force | Unemployed |
| Less than High School | 72 (80.0%) | 0 (0.0%) |
| High School Diploma | 327 (67.0%) | 0 (0.0%) |
| College / Associate Degree | 513 (84.2%) | 43 (7.0%) |
| Bachelor's Degree or higher | 311 (83.4%) | 0 (0.0%) |
| Total | 1,223 (78.4%) | 45 (2.9%) |
Employment Occupations by Sex in Broken Bow
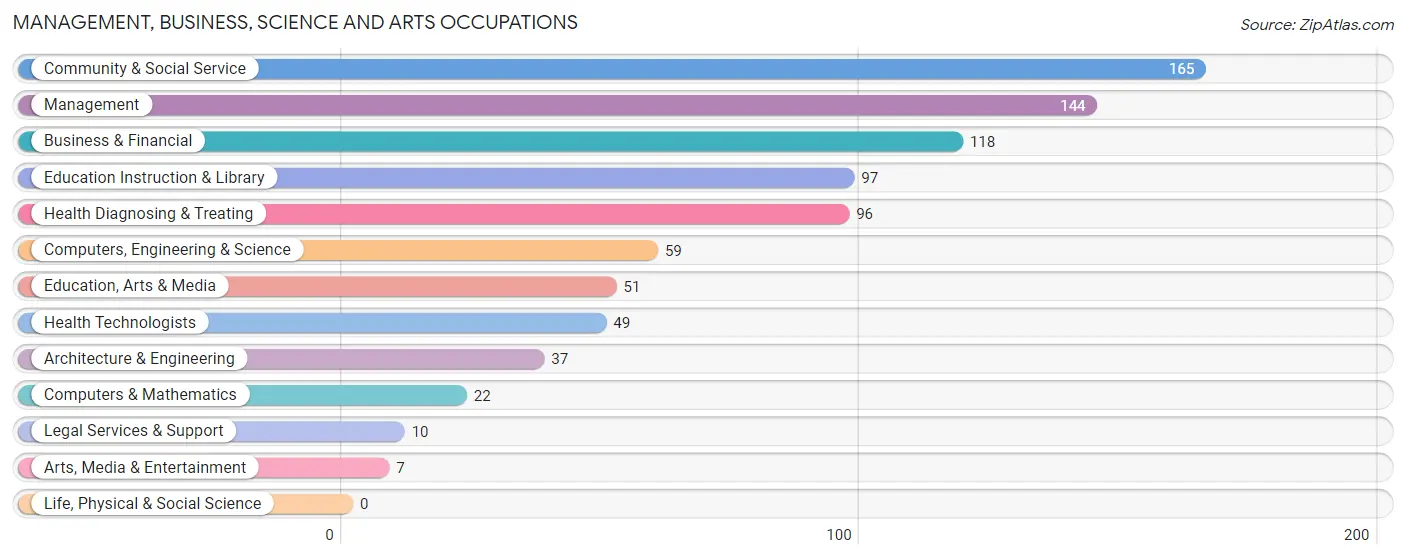
Management, Business, Science and Arts Occupations
The most common Management, Business, Science and Arts occupations in Broken Bow are Community & Social Service (165 | 10.3%), Management (144 | 9.0%), Business & Financial (118 | 7.4%), Education Instruction & Library (97 | 6.0%), and Health Diagnosing & Treating (96 | 6.0%).
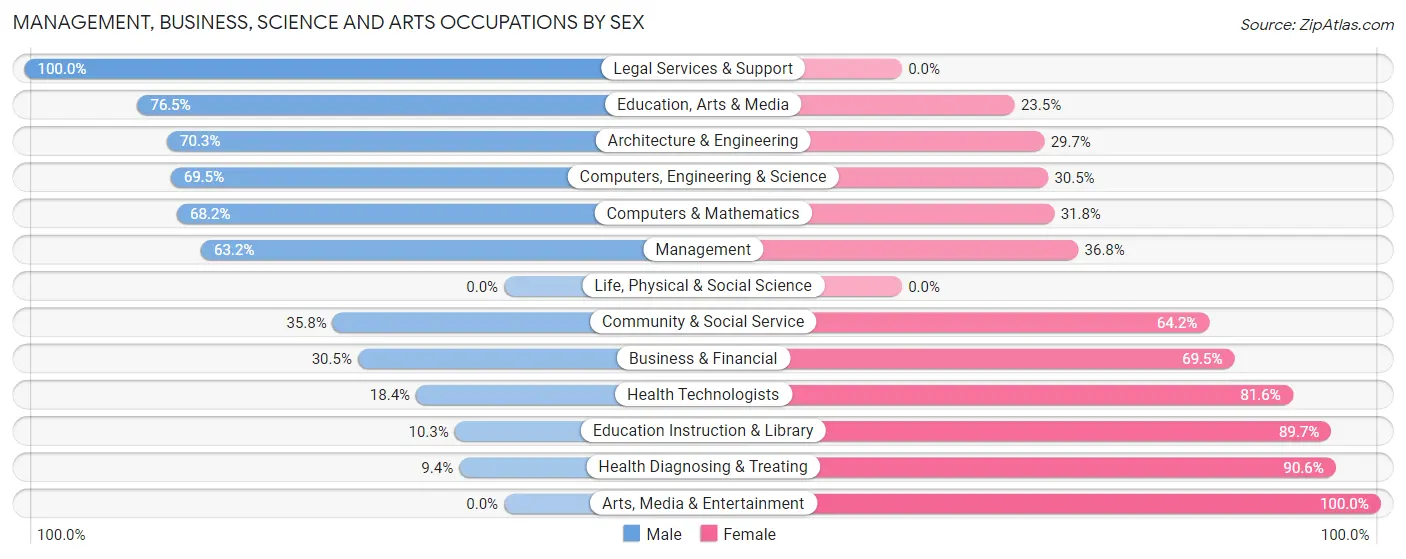
Management, Business, Science and Arts Occupations by Sex
Within the Management, Business, Science and Arts occupations in Broken Bow, the most male-oriented occupations are Legal Services & Support (100.0%), Education, Arts & Media (76.5%), and Architecture & Engineering (70.3%), while the most female-oriented occupations are Arts, Media & Entertainment (100.0%), Health Diagnosing & Treating (90.6%), and Education Instruction & Library (89.7%).
| Occupation | Male | Female |
| Management | 91 (63.2%) | 53 (36.8%) |
| Business & Financial | 36 (30.5%) | 82 (69.5%) |
| Computers, Engineering & Science | 41 (69.5%) | 18 (30.5%) |
| Computers & Mathematics | 15 (68.2%) | 7 (31.8%) |
| Architecture & Engineering | 26 (70.3%) | 11 (29.7%) |
| Life, Physical & Social Science | 0 (0.0%) | 0 (0.0%) |
| Community & Social Service | 59 (35.8%) | 106 (64.2%) |
| Education, Arts & Media | 39 (76.5%) | 12 (23.5%) |
| Legal Services & Support | 10 (100.0%) | 0 (0.0%) |
| Education Instruction & Library | 10 (10.3%) | 87 (89.7%) |
| Arts, Media & Entertainment | 0 (0.0%) | 7 (100.0%) |
| Health Diagnosing & Treating | 9 (9.4%) | 87 (90.6%) |
| Health Technologists | 9 (18.4%) | 40 (81.6%) |
| Total (Category) | 236 (40.6%) | 346 (59.5%) |
| Total (Overall) | 832 (51.9%) | 772 (48.1%) |
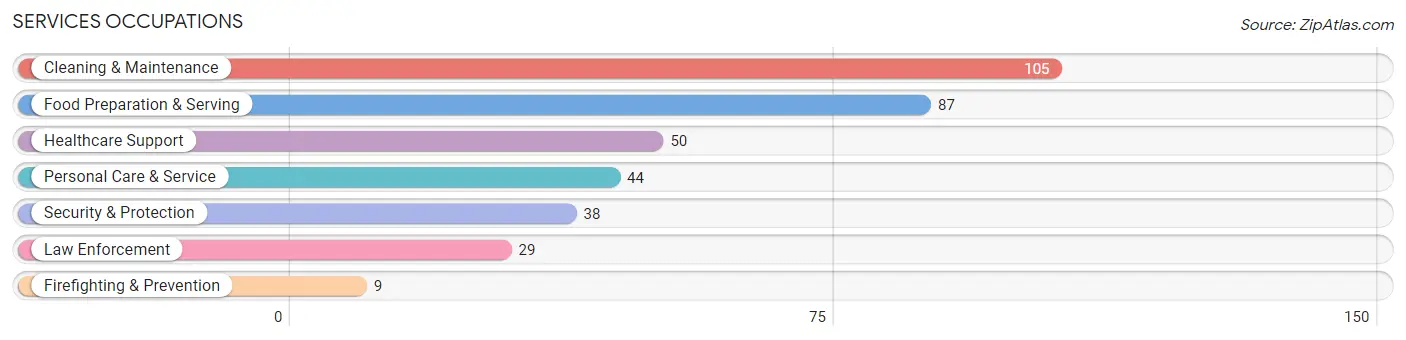
Services Occupations
The most common Services occupations in Broken Bow are Cleaning & Maintenance (105 | 6.6%), Food Preparation & Serving (87 | 5.4%), Healthcare Support (50 | 3.1%), Personal Care & Service (44 | 2.7%), and Security & Protection (38 | 2.4%).
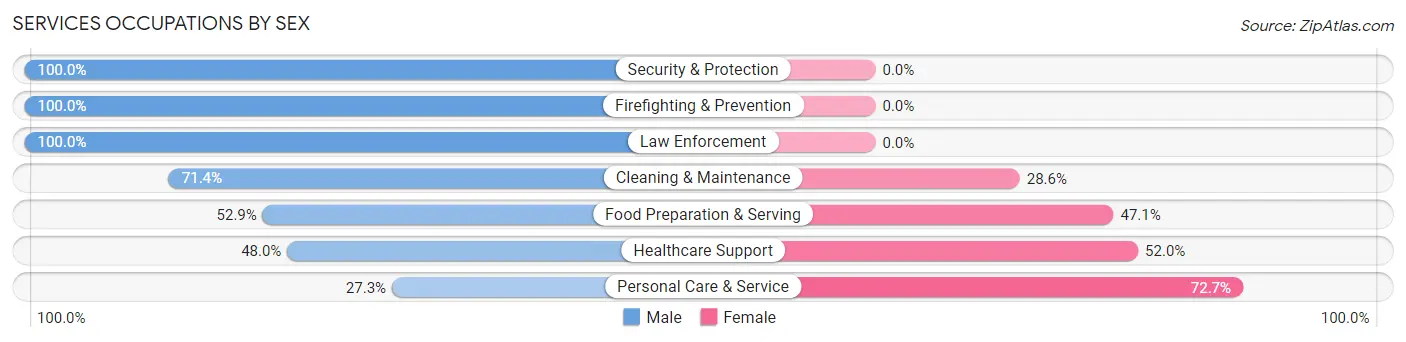
Services Occupations by Sex
Within the Services occupations in Broken Bow, the most male-oriented occupations are Security & Protection (100.0%), Firefighting & Prevention (100.0%), and Law Enforcement (100.0%), while the most female-oriented occupations are Personal Care & Service (72.7%), Healthcare Support (52.0%), and Food Preparation & Serving (47.1%).
| Occupation | Male | Female |
| Healthcare Support | 24 (48.0%) | 26 (52.0%) |
| Security & Protection | 38 (100.0%) | 0 (0.0%) |
| Firefighting & Prevention | 9 (100.0%) | 0 (0.0%) |
| Law Enforcement | 29 (100.0%) | 0 (0.0%) |
| Food Preparation & Serving | 46 (52.9%) | 41 (47.1%) |
| Cleaning & Maintenance | 75 (71.4%) | 30 (28.6%) |
| Personal Care & Service | 12 (27.3%) | 32 (72.7%) |
| Total (Category) | 195 (60.2%) | 129 (39.8%) |
| Total (Overall) | 832 (51.9%) | 772 (48.1%) |
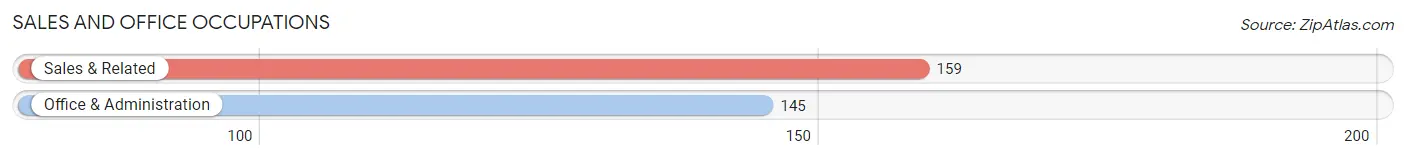
Sales and Office Occupations
The most common Sales and Office occupations in Broken Bow are Sales & Related (159 | 9.9%), and Office & Administration (145 | 9.0%).
Sales and Office Occupations by Sex
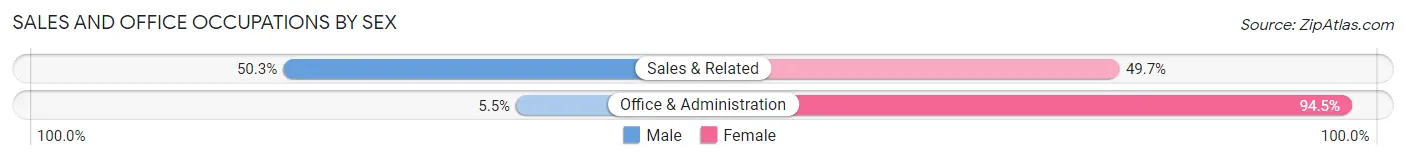
| Occupation | Male | Female |
| Sales & Related | 80 (50.3%) | 79 (49.7%) |
| Office & Administration | 8 (5.5%) | 137 (94.5%) |
| Total (Category) | 88 (28.9%) | 216 (71.1%) |
| Total (Overall) | 832 (51.9%) | 772 (48.1%) |
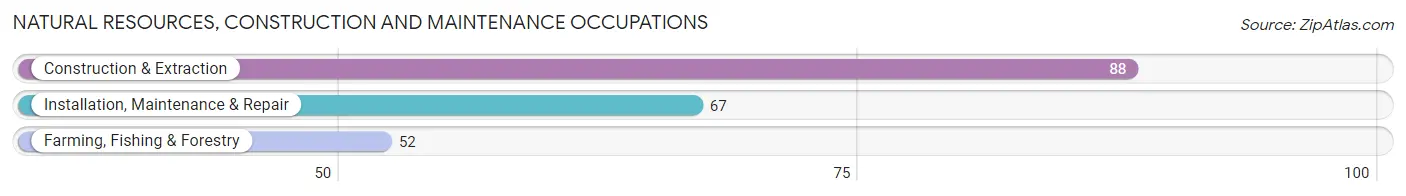
Natural Resources, Construction and Maintenance Occupations
The most common Natural Resources, Construction and Maintenance occupations in Broken Bow are Construction & Extraction (88 | 5.5%), Installation, Maintenance & Repair (67 | 4.2%), and Farming, Fishing & Forestry (52 | 3.2%).
Natural Resources, Construction and Maintenance Occupations by Sex
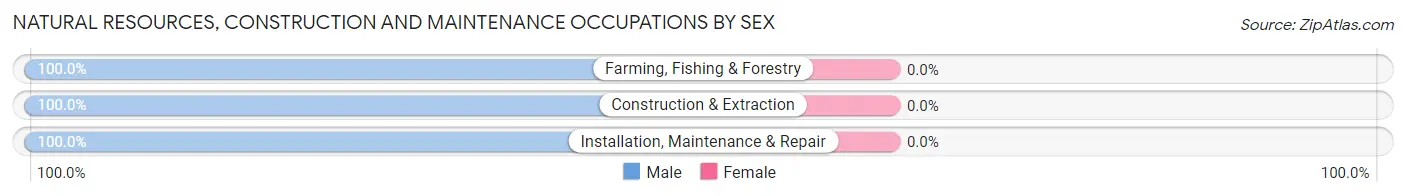
| Occupation | Male | Female |
| Farming, Fishing & Forestry | 52 (100.0%) | 0 (0.0%) |
| Construction & Extraction | 88 (100.0%) | 0 (0.0%) |
| Installation, Maintenance & Repair | 67 (100.0%) | 0 (0.0%) |
| Total (Category) | 207 (100.0%) | 0 (0.0%) |
| Total (Overall) | 832 (51.9%) | 772 (48.1%) |
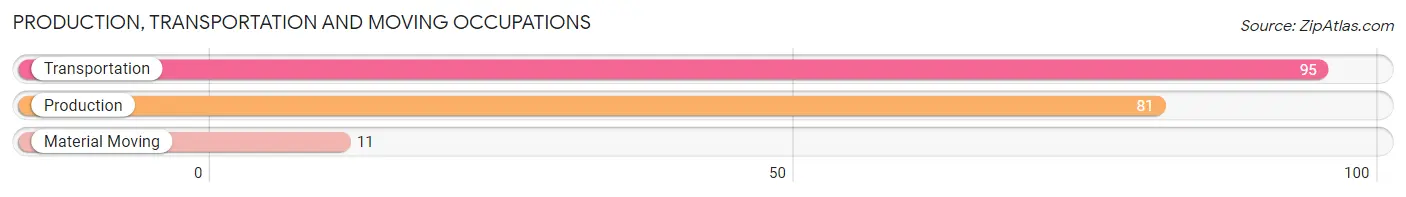
Production, Transportation and Moving Occupations
The most common Production, Transportation and Moving occupations in Broken Bow are Transportation (95 | 5.9%), Production (81 | 5.1%), and Material Moving (11 | 0.7%).
Production, Transportation and Moving Occupations by Sex
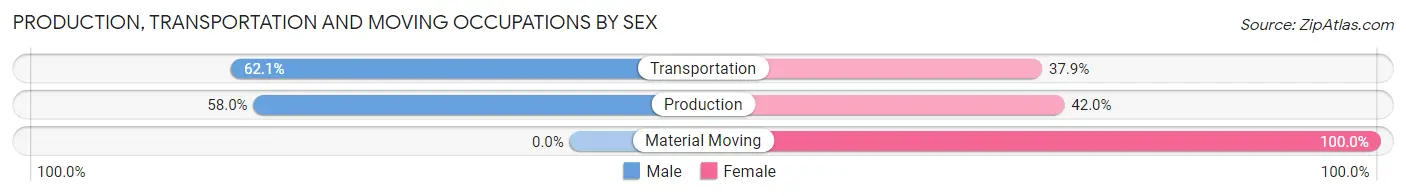
| Occupation | Male | Female |
| Production | 47 (58.0%) | 34 (42.0%) |
| Transportation | 59 (62.1%) | 36 (37.9%) |
| Material Moving | 0 (0.0%) | 11 (100.0%) |
| Total (Category) | 106 (56.7%) | 81 (43.3%) |
| Total (Overall) | 832 (51.9%) | 772 (48.1%) |
Employment Industries by Sex in Broken Bow
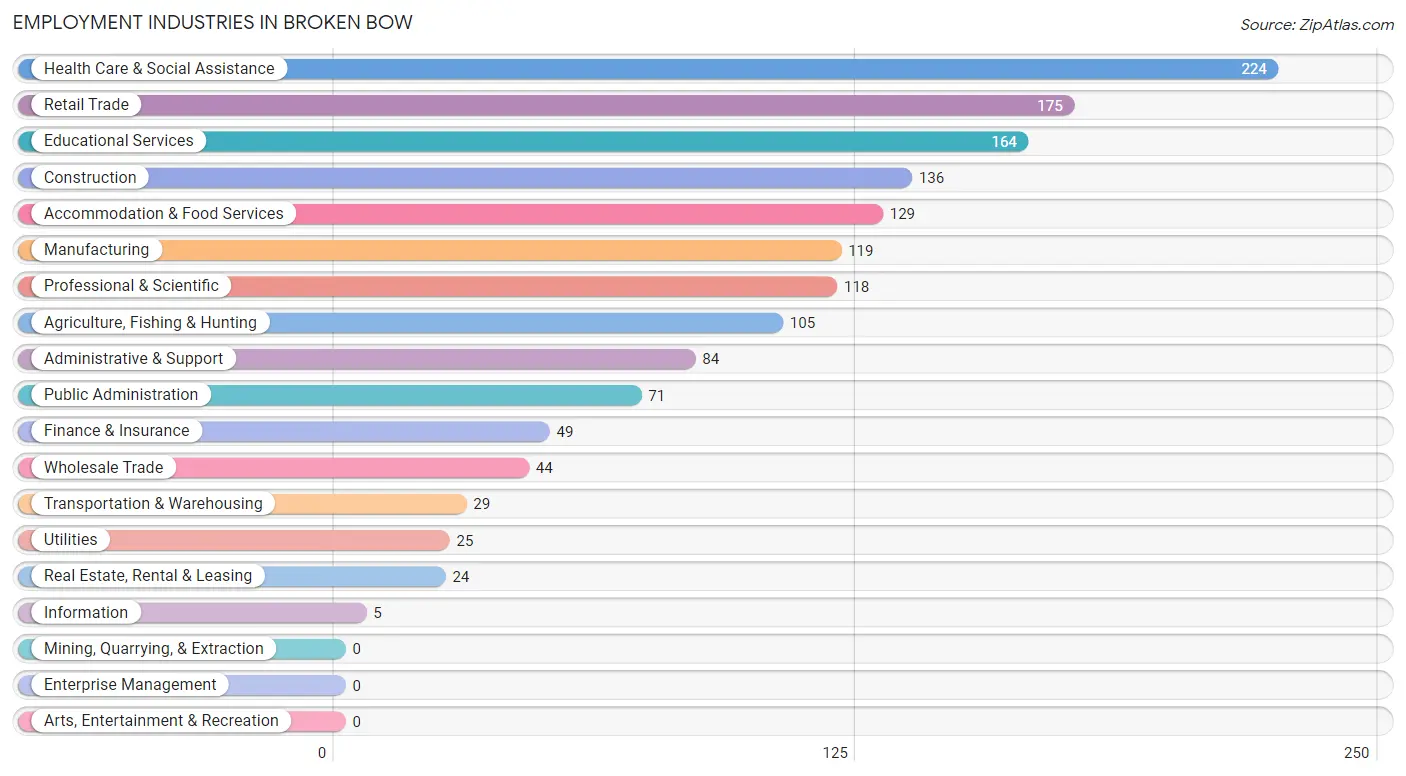
Employment Industries in Broken Bow
The major employment industries in Broken Bow include Health Care & Social Assistance (224 | 14.0%), Retail Trade (175 | 10.9%), Educational Services (164 | 10.2%), Construction (136 | 8.5%), and Accommodation & Food Services (129 | 8.0%).
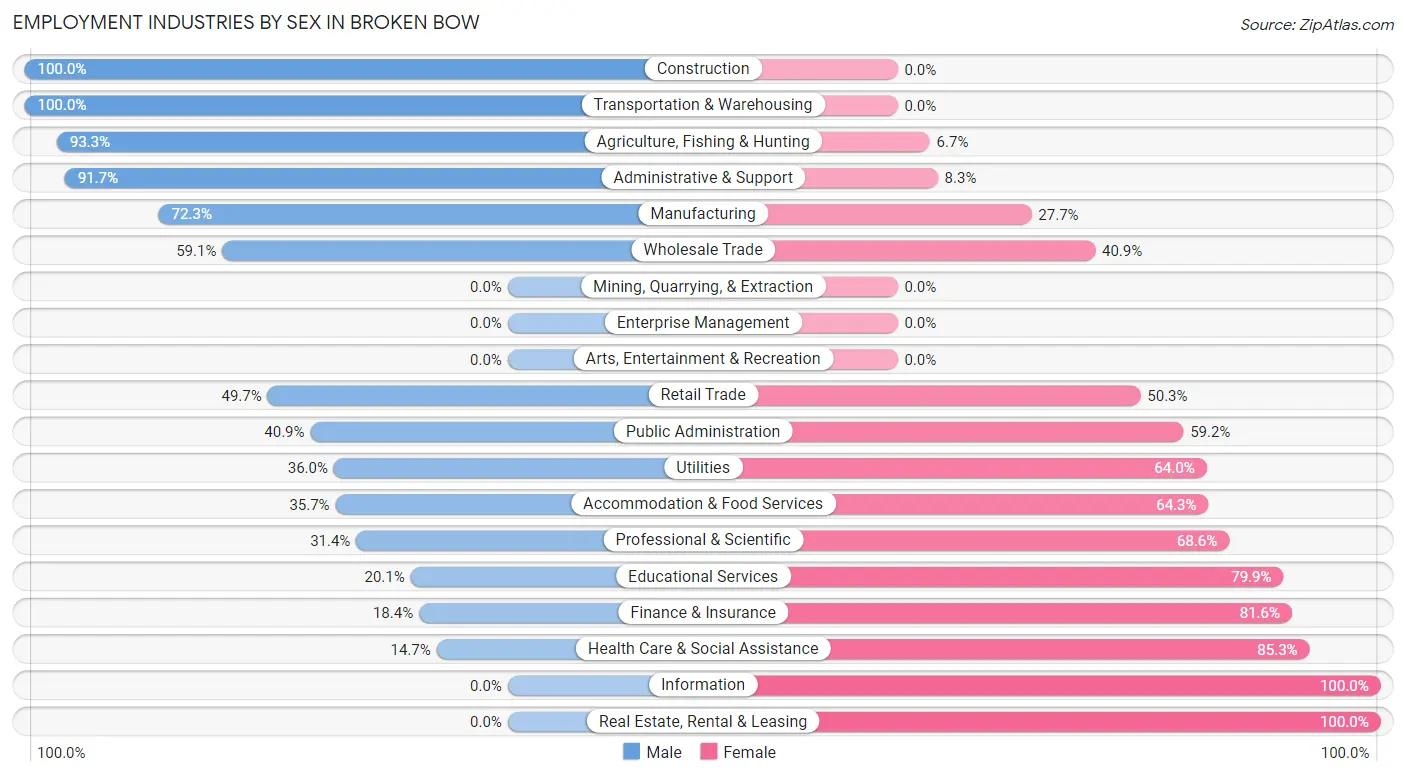
Employment Industries by Sex in Broken Bow
The Broken Bow industries that see more men than women are Construction (100.0%), Transportation & Warehousing (100.0%), and Agriculture, Fishing & Hunting (93.3%), whereas the industries that tend to have a higher number of women are Information (100.0%), Real Estate, Rental & Leasing (100.0%), and Health Care & Social Assistance (85.3%).
| Industry | Male | Female |
| Agriculture, Fishing & Hunting | 98 (93.3%) | 7 (6.7%) |
| Mining, Quarrying, & Extraction | 0 (0.0%) | 0 (0.0%) |
| Construction | 136 (100.0%) | 0 (0.0%) |
| Manufacturing | 86 (72.3%) | 33 (27.7%) |
| Wholesale Trade | 26 (59.1%) | 18 (40.9%) |
| Retail Trade | 87 (49.7%) | 88 (50.3%) |
| Transportation & Warehousing | 29 (100.0%) | 0 (0.0%) |
| Utilities | 9 (36.0%) | 16 (64.0%) |
| Information | 0 (0.0%) | 5 (100.0%) |
| Finance & Insurance | 9 (18.4%) | 40 (81.6%) |
| Real Estate, Rental & Leasing | 0 (0.0%) | 24 (100.0%) |
| Professional & Scientific | 37 (31.4%) | 81 (68.6%) |
| Enterprise Management | 0 (0.0%) | 0 (0.0%) |
| Administrative & Support | 77 (91.7%) | 7 (8.3%) |
| Educational Services | 33 (20.1%) | 131 (79.9%) |
| Health Care & Social Assistance | 33 (14.7%) | 191 (85.3%) |
| Arts, Entertainment & Recreation | 0 (0.0%) | 0 (0.0%) |
| Accommodation & Food Services | 46 (35.7%) | 83 (64.3%) |
| Public Administration | 29 (40.8%) | 42 (59.2%) |
| Total | 832 (51.9%) | 772 (48.1%) |
Education in Broken Bow
School Enrollment in Broken Bow
The most common levels of schooling among the 856 students in Broken Bow are high school (412 | 48.1%), middle school (192 | 22.4%), and elementary school (120 | 14.0%).
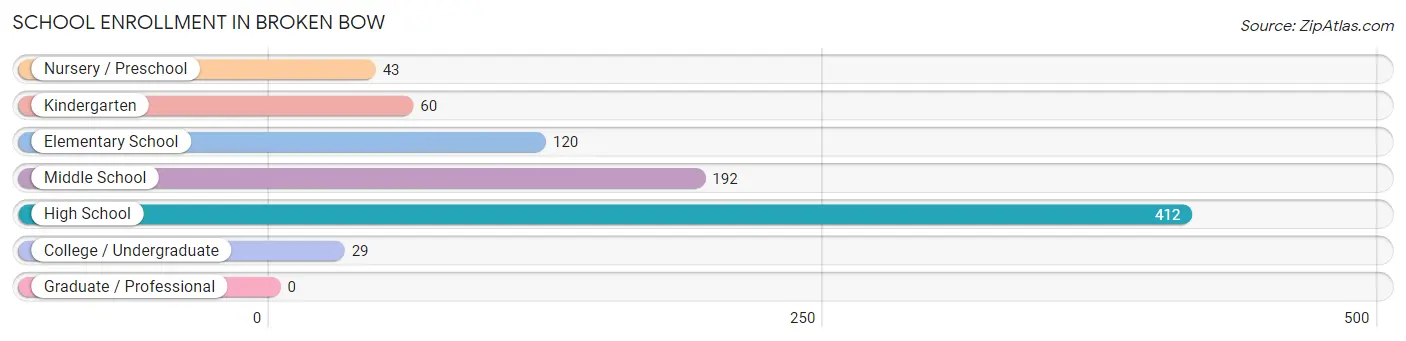
| School Level | # Students | % Students |
| Nursery / Preschool | 43 | 5.0% |
| Kindergarten | 60 | 7.0% |
| Elementary School | 120 | 14.0% |
| Middle School | 192 | 22.4% |
| High School | 412 | 48.1% |
| College / Undergraduate | 29 | 3.4% |
| Graduate / Professional | 0 | 0.0% |
| Total | 856 | 100.0% |
School Enrollment by Age by Funding Source in Broken Bow
Out of a total of 856 students who are enrolled in schools in Broken Bow, 179 (20.9%) attend a private institution, while the remaining 677 (79.1%) are enrolled in public schools. The age group of 18 to 19 year olds has the highest likelihood of being enrolled in private schools, with 18 (36.0% in the age bracket) enrolled. Conversely, the age group of 3 to 4 year olds has the lowest likelihood of being enrolled in a private school, with 26 (100.0% in the age bracket) attending a public institution.
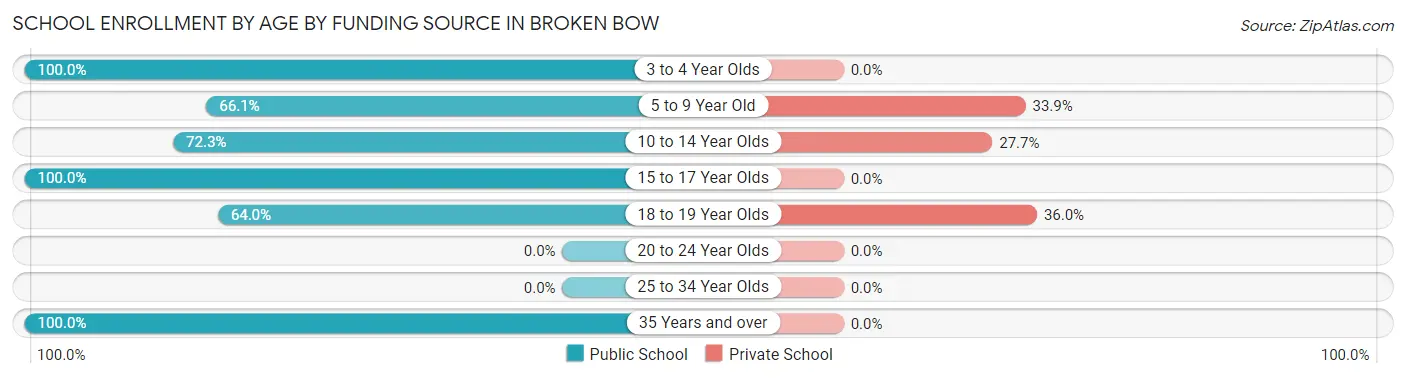
| Age Bracket | Public School | Private School |
| 3 to 4 Year Olds | 26 (100.0%) | 0 (0.0%) |
| 5 to 9 Year Old | 123 (66.1%) | 63 (33.9%) |
| 10 to 14 Year Olds | 256 (72.3%) | 98 (27.7%) |
| 15 to 17 Year Olds | 211 (100.0%) | 0 (0.0%) |
| 18 to 19 Year Olds | 32 (64.0%) | 18 (36.0%) |
| 20 to 24 Year Olds | 0 (0.0%) | 0 (0.0%) |
| 25 to 34 Year Olds | 0 (0.0%) | 0 (0.0%) |
| 35 Years and over | 29 (100.0%) | 0 (0.0%) |
| Total | 677 (79.1%) | 179 (20.9%) |
Educational Attainment by Field of Study in Broken Bow
Business (151 | 27.3%), education (134 | 24.2%), communications (47 | 8.5%), arts & humanities (40 | 7.2%), and science & technology (37 | 6.7%) are the most common fields of study among 553 individuals in Broken Bow who have obtained a bachelor's degree or higher.
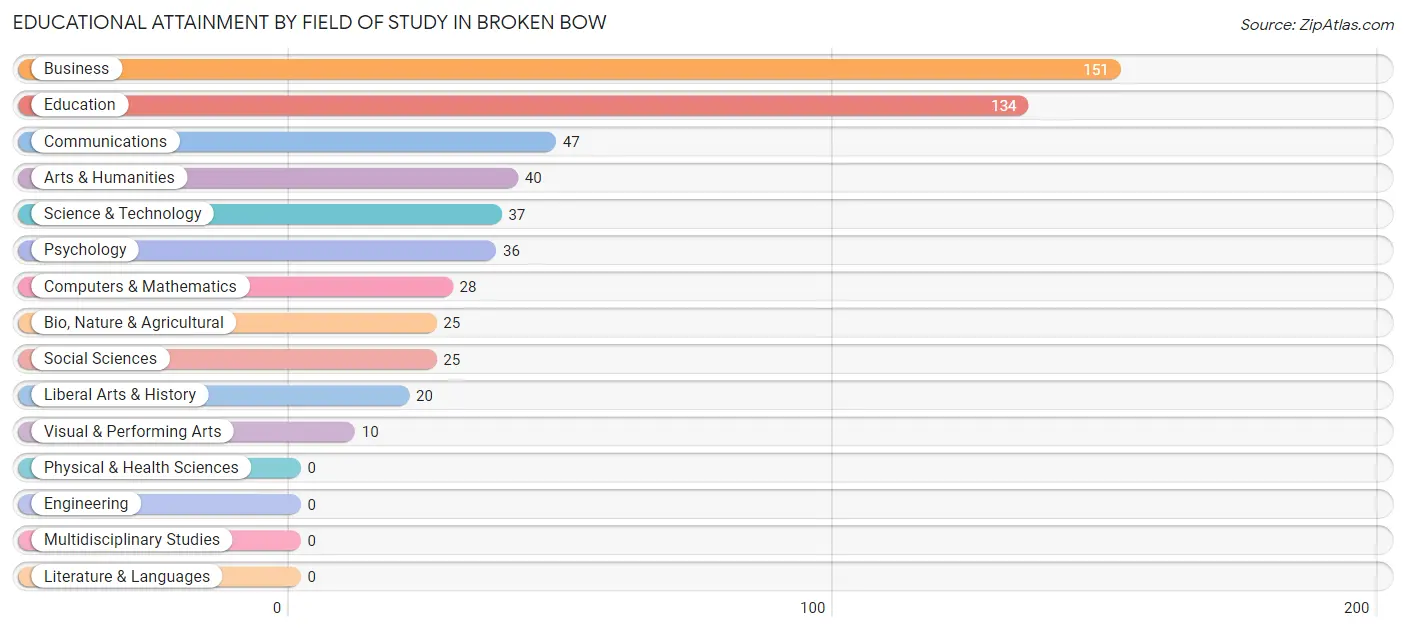
| Field of Study | # Graduates | % Graduates |
| Computers & Mathematics | 28 | 5.1% |
| Bio, Nature & Agricultural | 25 | 4.5% |
| Physical & Health Sciences | 0 | 0.0% |
| Psychology | 36 | 6.5% |
| Social Sciences | 25 | 4.5% |
| Engineering | 0 | 0.0% |
| Multidisciplinary Studies | 0 | 0.0% |
| Science & Technology | 37 | 6.7% |
| Business | 151 | 27.3% |
| Education | 134 | 24.2% |
| Literature & Languages | 0 | 0.0% |
| Liberal Arts & History | 20 | 3.6% |
| Visual & Performing Arts | 10 | 1.8% |
| Communications | 47 | 8.5% |
| Arts & Humanities | 40 | 7.2% |
| Total | 553 | 100.0% |
Transportation & Commute in Broken Bow
Vehicle Availability by Sex in Broken Bow
The most prevalent vehicle ownership categories in Broken Bow are males with 3 vehicles (285, accounting for 35.6%) and females with 3 vehicles (230, making up 40.9%).
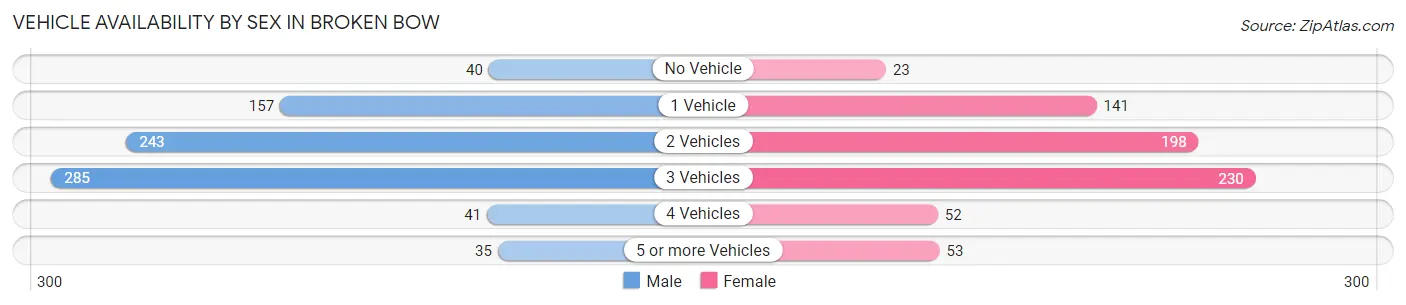
| Vehicles Available | Male | Female |
| No Vehicle | 40 (5.0%) | 23 (3.3%) |
| 1 Vehicle | 157 (19.6%) | 141 (20.2%) |
| 2 Vehicles | 243 (30.3%) | 198 (28.4%) |
| 3 Vehicles | 285 (35.6%) | 230 (33.0%) |
| 4 Vehicles | 41 (5.1%) | 52 (7.5%) |
| 5 or more Vehicles | 35 (4.4%) | 53 (7.6%) |
| Total | 801 (100.0%) | 697 (100.0%) |
Commute Time in Broken Bow
The most frequently occuring commute durations in Broken Bow are 5 to 9 minutes (555 commuters, 39.9%), 10 to 14 minutes (299 commuters, 21.5%), and less than 5 minutes (236 commuters, 17.0%).
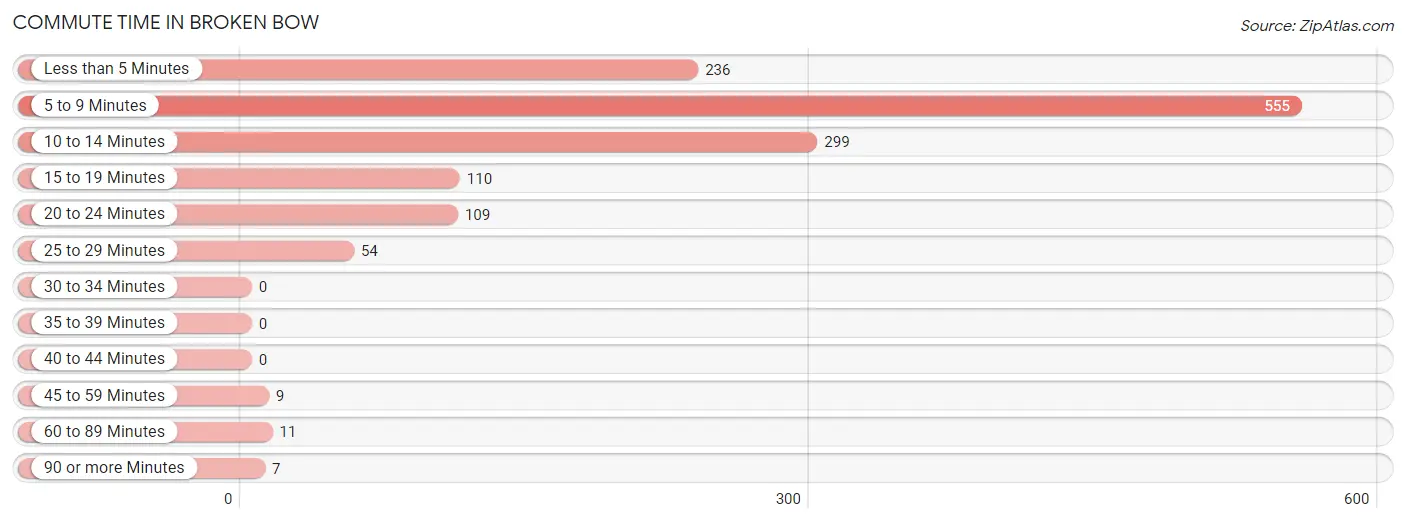
| Commute Time | # Commuters | % Commuters |
| Less than 5 Minutes | 236 | 17.0% |
| 5 to 9 Minutes | 555 | 39.9% |
| 10 to 14 Minutes | 299 | 21.5% |
| 15 to 19 Minutes | 110 | 7.9% |
| 20 to 24 Minutes | 109 | 7.8% |
| 25 to 29 Minutes | 54 | 3.9% |
| 30 to 34 Minutes | 0 | 0.0% |
| 35 to 39 Minutes | 0 | 0.0% |
| 40 to 44 Minutes | 0 | 0.0% |
| 45 to 59 Minutes | 9 | 0.6% |
| 60 to 89 Minutes | 11 | 0.8% |
| 90 or more Minutes | 7 | 0.5% |
Commute Time by Sex in Broken Bow
The most common commute times in Broken Bow are 5 to 9 minutes (214 commuters, 29.4%) for males and 5 to 9 minutes (341 commuters, 51.4%) for females.
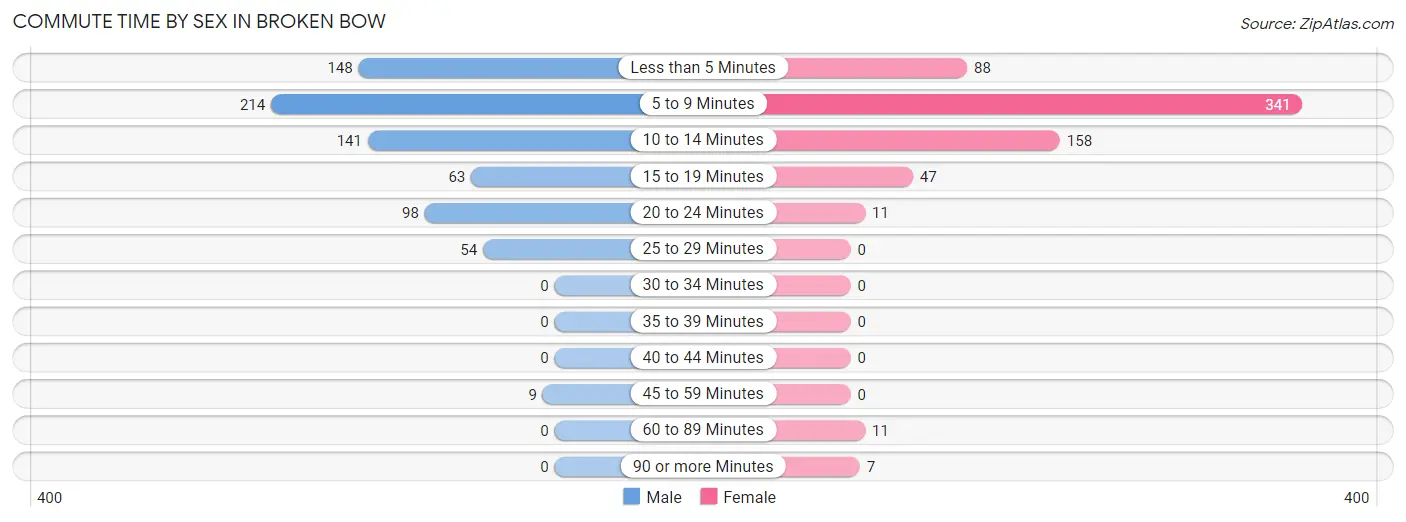
| Commute Time | Male | Female |
| Less than 5 Minutes | 148 (20.4%) | 88 (13.3%) |
| 5 to 9 Minutes | 214 (29.4%) | 341 (51.4%) |
| 10 to 14 Minutes | 141 (19.4%) | 158 (23.8%) |
| 15 to 19 Minutes | 63 (8.7%) | 47 (7.1%) |
| 20 to 24 Minutes | 98 (13.5%) | 11 (1.7%) |
| 25 to 29 Minutes | 54 (7.4%) | 0 (0.0%) |
| 30 to 34 Minutes | 0 (0.0%) | 0 (0.0%) |
| 35 to 39 Minutes | 0 (0.0%) | 0 (0.0%) |
| 40 to 44 Minutes | 0 (0.0%) | 0 (0.0%) |
| 45 to 59 Minutes | 9 (1.2%) | 0 (0.0%) |
| 60 to 89 Minutes | 0 (0.0%) | 11 (1.7%) |
| 90 or more Minutes | 0 (0.0%) | 7 (1.1%) |
Time of Departure to Work by Sex in Broken Bow
The most frequent times of departure to work in Broken Bow are 7:00 AM to 7:29 AM (142, 19.5%) for males and 7:30 AM to 7:59 AM (135, 20.4%) for females.
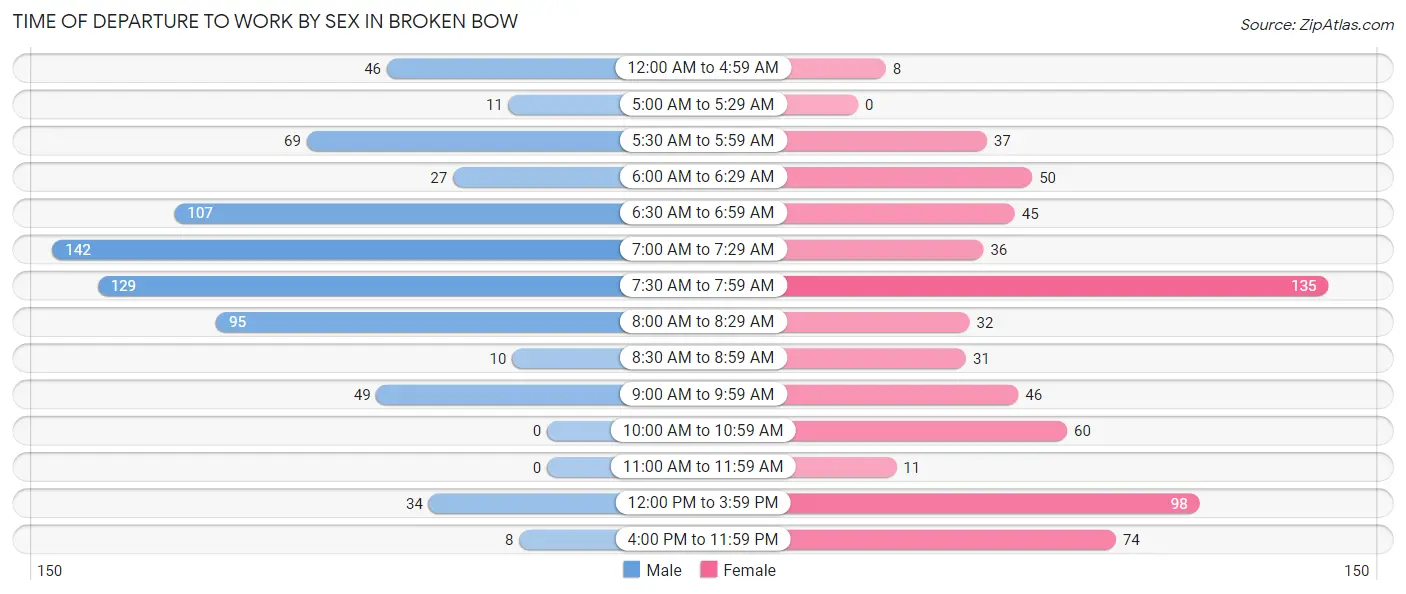
| Time of Departure | Male | Female |
| 12:00 AM to 4:59 AM | 46 (6.3%) | 8 (1.2%) |
| 5:00 AM to 5:29 AM | 11 (1.5%) | 0 (0.0%) |
| 5:30 AM to 5:59 AM | 69 (9.5%) | 37 (5.6%) |
| 6:00 AM to 6:29 AM | 27 (3.7%) | 50 (7.5%) |
| 6:30 AM to 6:59 AM | 107 (14.7%) | 45 (6.8%) |
| 7:00 AM to 7:29 AM | 142 (19.5%) | 36 (5.4%) |
| 7:30 AM to 7:59 AM | 129 (17.7%) | 135 (20.4%) |
| 8:00 AM to 8:29 AM | 95 (13.1%) | 32 (4.8%) |
| 8:30 AM to 8:59 AM | 10 (1.4%) | 31 (4.7%) |
| 9:00 AM to 9:59 AM | 49 (6.7%) | 46 (6.9%) |
| 10:00 AM to 10:59 AM | 0 (0.0%) | 60 (9.0%) |
| 11:00 AM to 11:59 AM | 0 (0.0%) | 11 (1.7%) |
| 12:00 PM to 3:59 PM | 34 (4.7%) | 98 (14.8%) |
| 4:00 PM to 11:59 PM | 8 (1.1%) | 74 (11.2%) |
| Total | 727 (100.0%) | 663 (100.0%) |
Housing Occupancy in Broken Bow
Occupancy by Ownership in Broken Bow
Of the total 1,515 dwellings in Broken Bow, owner-occupied units account for 914 (60.3%), while renter-occupied units make up 601 (39.7%).
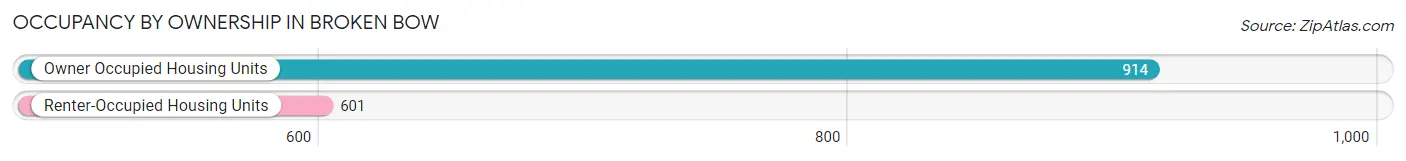
| Occupancy | # Housing Units | % Housing Units |
| Owner Occupied Housing Units | 914 | 60.3% |
| Renter-Occupied Housing Units | 601 | 39.7% |
| Total Occupied Housing Units | 1,515 | 100.0% |
Occupancy by Household Size in Broken Bow
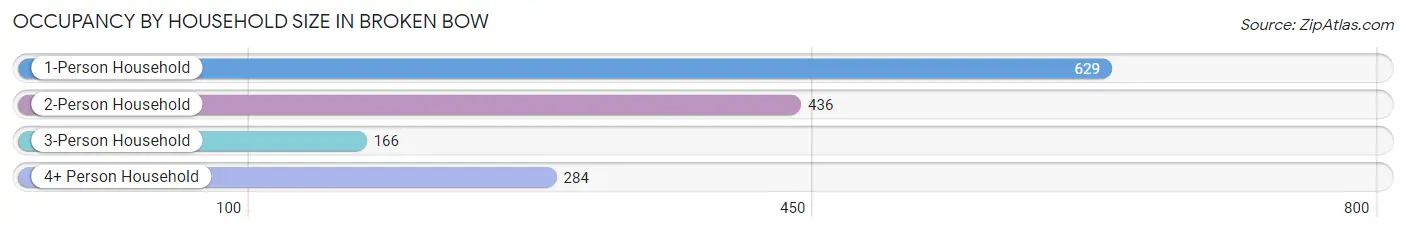
| Household Size | # Housing Units | % Housing Units |
| 1-Person Household | 629 | 41.5% |
| 2-Person Household | 436 | 28.8% |
| 3-Person Household | 166 | 11.0% |
| 4+ Person Household | 284 | 18.8% |
| Total Housing Units | 1,515 | 100.0% |
Occupancy by Ownership by Household Size in Broken Bow
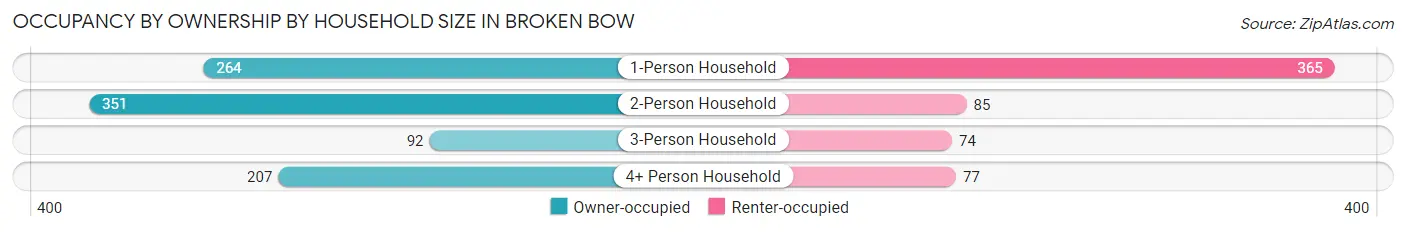
| Household Size | Owner-occupied | Renter-occupied |
| 1-Person Household | 264 (42.0%) | 365 (58.0%) |
| 2-Person Household | 351 (80.5%) | 85 (19.5%) |
| 3-Person Household | 92 (55.4%) | 74 (44.6%) |
| 4+ Person Household | 207 (72.9%) | 77 (27.1%) |
| Total Housing Units | 914 (60.3%) | 601 (39.7%) |
Occupancy by Educational Attainment in Broken Bow
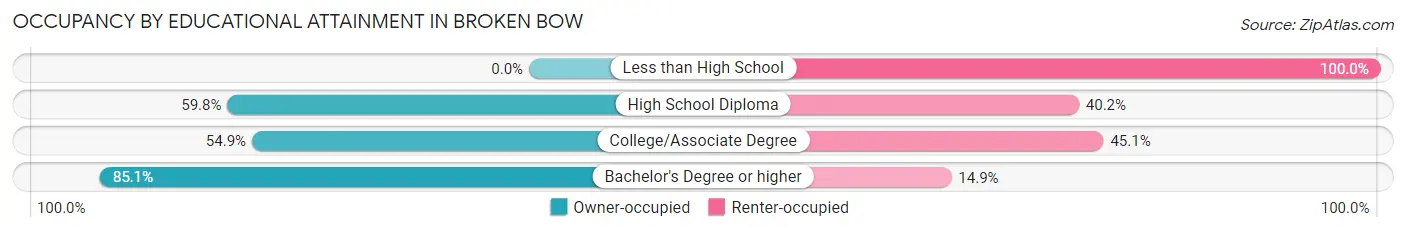
| Household Size | Owner-occupied | Renter-occupied |
| Less than High School | 0 (0.0%) | 61 (100.0%) |
| High School Diploma | 323 (59.8%) | 217 (40.2%) |
| College/Associate Degree | 340 (54.9%) | 279 (45.1%) |
| Bachelor's Degree or higher | 251 (85.1%) | 44 (14.9%) |
Occupancy by Age of Householder in Broken Bow
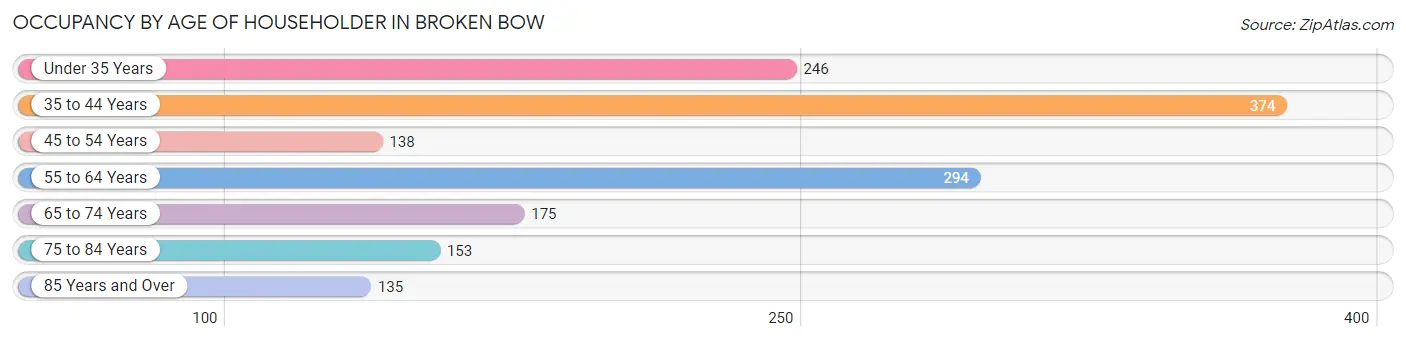
| Age Bracket | # Households | % Households |
| Under 35 Years | 246 | 16.2% |
| 35 to 44 Years | 374 | 24.7% |
| 45 to 54 Years | 138 | 9.1% |
| 55 to 64 Years | 294 | 19.4% |
| 65 to 74 Years | 175 | 11.6% |
| 75 to 84 Years | 153 | 10.1% |
| 85 Years and Over | 135 | 8.9% |
| Total | 1,515 | 100.0% |
Housing Finances in Broken Bow
Median Income by Occupancy in Broken Bow
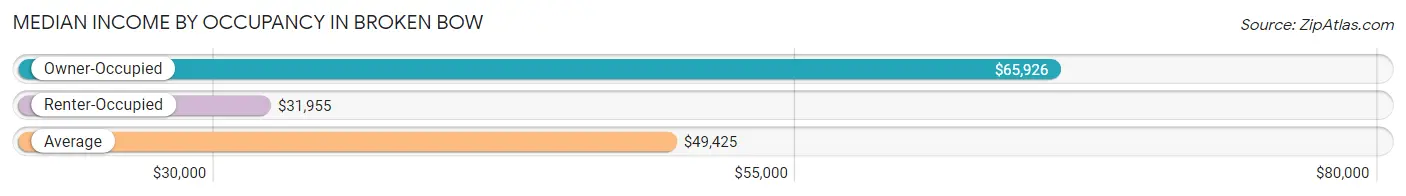
| Occupancy Type | # Households | Median Income |
| Owner-Occupied | 914 (60.3%) | $65,926 |
| Renter-Occupied | 601 (39.7%) | $31,955 |
| Average | 1,515 (100.0%) | $49,425 |
Occupancy by Householder Income Bracket in Broken Bow
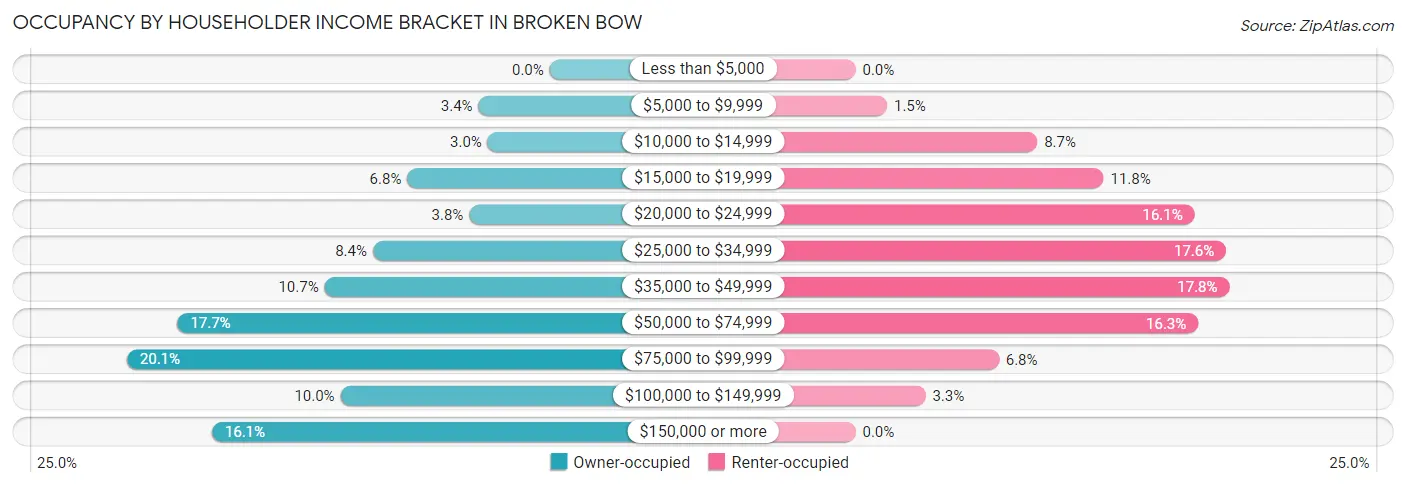
| Income Bracket | Owner-occupied | Renter-occupied |
| Less than $5,000 | 0 (0.0%) | 0 (0.0%) |
| $5,000 to $9,999 | 31 (3.4%) | 9 (1.5%) |
| $10,000 to $14,999 | 27 (2.9%) | 52 (8.6%) |
| $15,000 to $19,999 | 62 (6.8%) | 71 (11.8%) |
| $20,000 to $24,999 | 35 (3.8%) | 97 (16.1%) |
| $25,000 to $34,999 | 77 (8.4%) | 106 (17.6%) |
| $35,000 to $49,999 | 98 (10.7%) | 107 (17.8%) |
| $50,000 to $74,999 | 162 (17.7%) | 98 (16.3%) |
| $75,000 to $99,999 | 184 (20.1%) | 41 (6.8%) |
| $100,000 to $149,999 | 91 (10.0%) | 20 (3.3%) |
| $150,000 or more | 147 (16.1%) | 0 (0.0%) |
| Total | 914 (100.0%) | 601 (100.0%) |
Monthly Housing Cost Tiers in Broken Bow
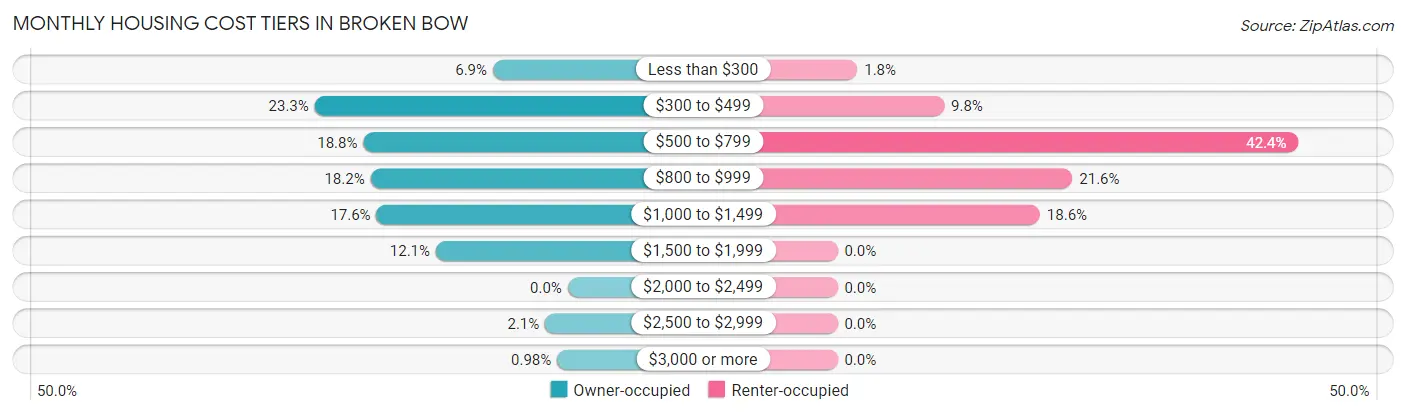
| Monthly Cost | Owner-occupied | Renter-occupied |
| Less than $300 | 63 (6.9%) | 11 (1.8%) |
| $300 to $499 | 213 (23.3%) | 59 (9.8%) |
| $500 to $799 | 172 (18.8%) | 255 (42.4%) |
| $800 to $999 | 166 (18.2%) | 130 (21.6%) |
| $1,000 to $1,499 | 161 (17.6%) | 112 (18.6%) |
| $1,500 to $1,999 | 111 (12.1%) | 0 (0.0%) |
| $2,000 to $2,499 | 0 (0.0%) | 0 (0.0%) |
| $2,500 to $2,999 | 19 (2.1%) | 0 (0.0%) |
| $3,000 or more | 9 (1.0%) | 0 (0.0%) |
| Total | 914 (100.0%) | 601 (100.0%) |
Physical Housing Characteristics in Broken Bow
Housing Structures in Broken Bow
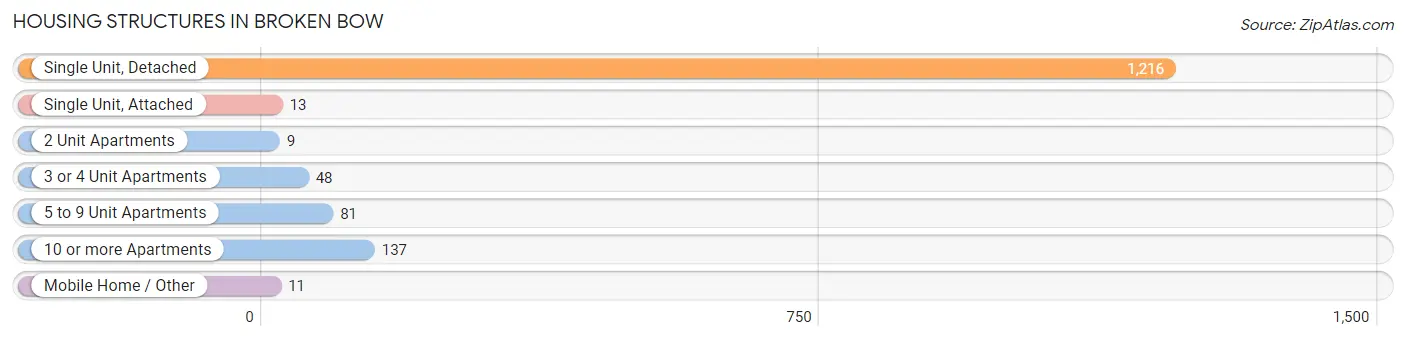
| Structure Type | # Housing Units | % Housing Units |
| Single Unit, Detached | 1,216 | 80.3% |
| Single Unit, Attached | 13 | 0.9% |
| 2 Unit Apartments | 9 | 0.6% |
| 3 or 4 Unit Apartments | 48 | 3.2% |
| 5 to 9 Unit Apartments | 81 | 5.3% |
| 10 or more Apartments | 137 | 9.0% |
| Mobile Home / Other | 11 | 0.7% |
| Total | 1,515 | 100.0% |
Housing Structures by Occupancy in Broken Bow
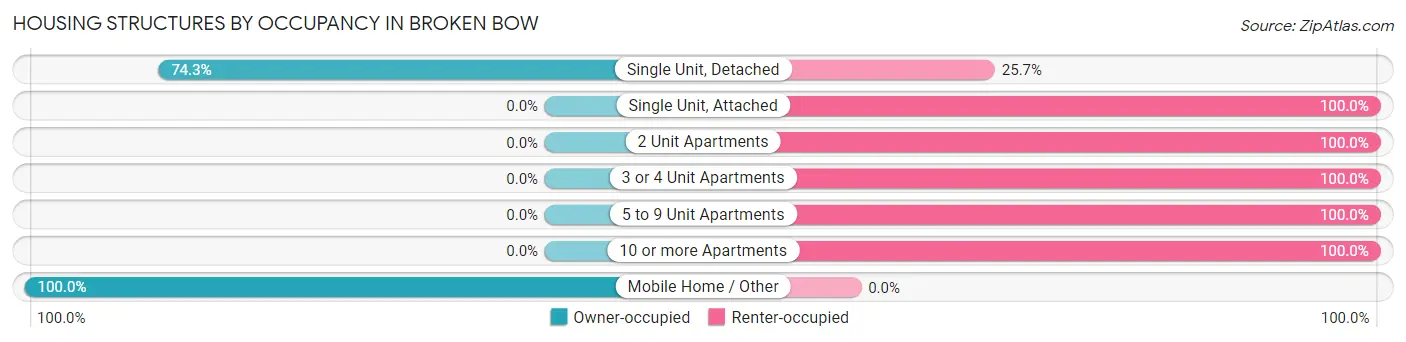
| Structure Type | Owner-occupied | Renter-occupied |
| Single Unit, Detached | 903 (74.3%) | 313 (25.7%) |
| Single Unit, Attached | 0 (0.0%) | 13 (100.0%) |
| 2 Unit Apartments | 0 (0.0%) | 9 (100.0%) |
| 3 or 4 Unit Apartments | 0 (0.0%) | 48 (100.0%) |
| 5 to 9 Unit Apartments | 0 (0.0%) | 81 (100.0%) |
| 10 or more Apartments | 0 (0.0%) | 137 (100.0%) |
| Mobile Home / Other | 11 (100.0%) | 0 (0.0%) |
| Total | 914 (60.3%) | 601 (39.7%) |
Housing Structures by Number of Rooms in Broken Bow
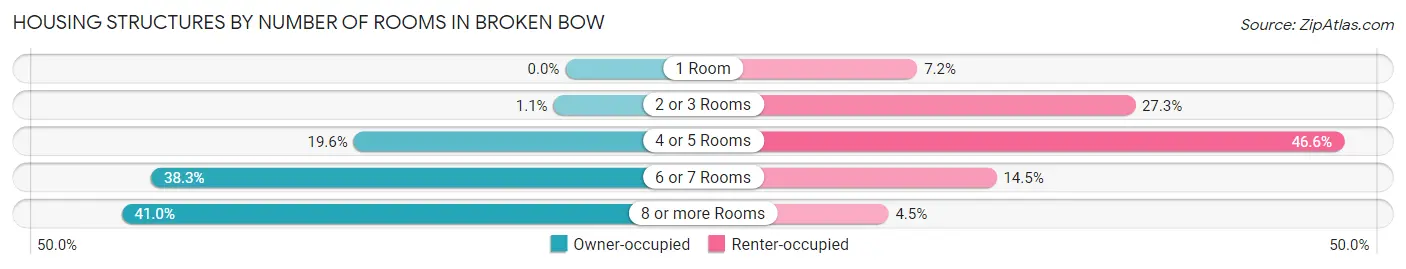
| Number of Rooms | Owner-occupied | Renter-occupied |
| 1 Room | 0 (0.0%) | 43 (7.1%) |
| 2 or 3 Rooms | 10 (1.1%) | 164 (27.3%) |
| 4 or 5 Rooms | 179 (19.6%) | 280 (46.6%) |
| 6 or 7 Rooms | 350 (38.3%) | 87 (14.5%) |
| 8 or more Rooms | 375 (41.0%) | 27 (4.5%) |
| Total | 914 (100.0%) | 601 (100.0%) |
Housing Structure by Heating Type in Broken Bow
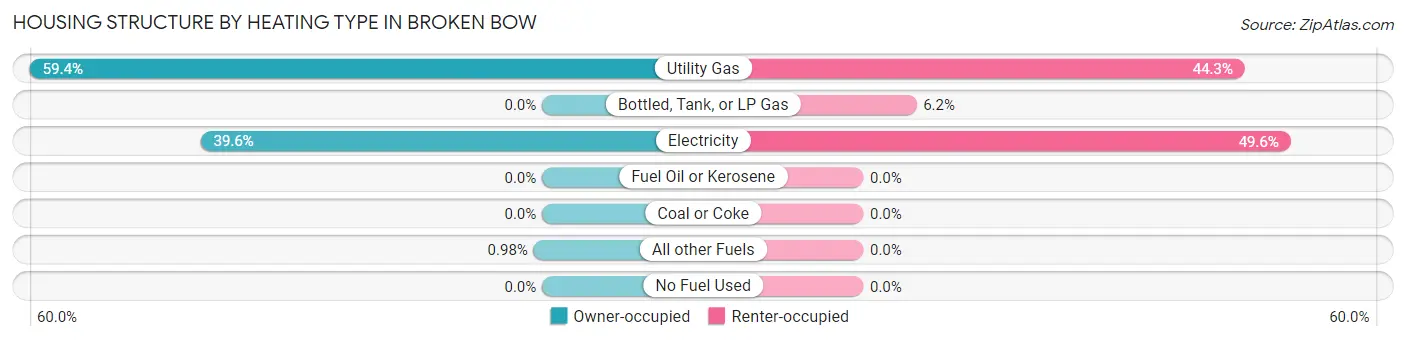
| Heating Type | Owner-occupied | Renter-occupied |
| Utility Gas | 543 (59.4%) | 266 (44.3%) |
| Bottled, Tank, or LP Gas | 0 (0.0%) | 37 (6.2%) |
| Electricity | 362 (39.6%) | 298 (49.6%) |
| Fuel Oil or Kerosene | 0 (0.0%) | 0 (0.0%) |
| Coal or Coke | 0 (0.0%) | 0 (0.0%) |
| All other Fuels | 9 (1.0%) | 0 (0.0%) |
| No Fuel Used | 0 (0.0%) | 0 (0.0%) |
| Total | 914 (100.0%) | 601 (100.0%) |
Household Vehicle Usage in Broken Bow
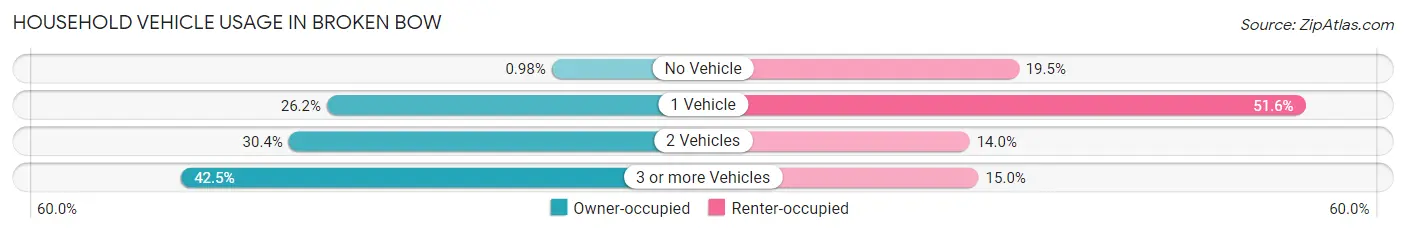
| Vehicles per Household | Owner-occupied | Renter-occupied |
| No Vehicle | 9 (1.0%) | 117 (19.5%) |
| 1 Vehicle | 239 (26.2%) | 310 (51.6%) |
| 2 Vehicles | 278 (30.4%) | 84 (14.0%) |
| 3 or more Vehicles | 388 (42.4%) | 90 (15.0%) |
| Total | 914 (100.0%) | 601 (100.0%) |
Real Estate & Mortgages in Broken Bow
Real Estate and Mortgage Overview in Broken Bow
| Characteristic | Without Mortgage | With Mortgage |
| Housing Units | 428 | 486 |
| Median Property Value | $94,000 | $130,400 |
| Median Household Income | $63,071 | $109 |
| Monthly Housing Costs | $461 | $9 |
| Real Estate Taxes | $1,448 | $31 |
Property Value by Mortgage Status in Broken Bow
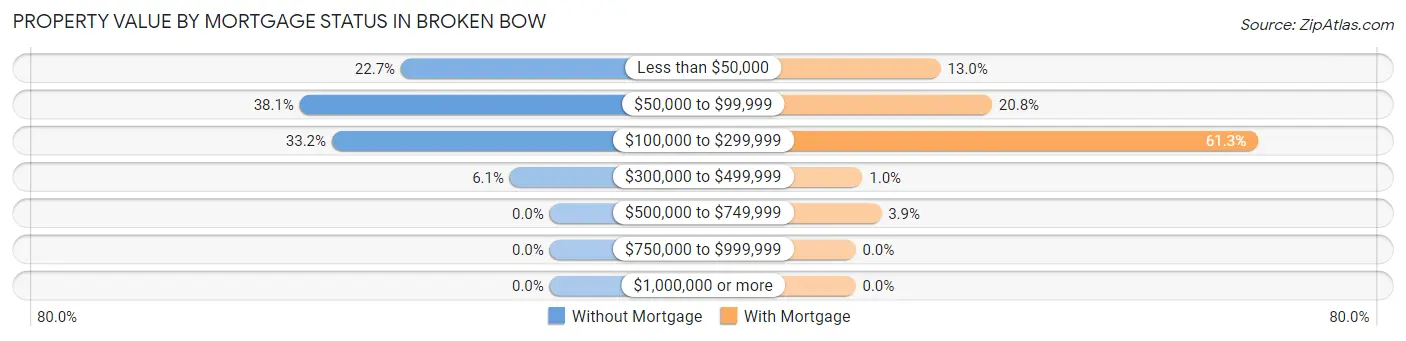
| Property Value | Without Mortgage | With Mortgage |
| Less than $50,000 | 97 (22.7%) | 63 (13.0%) |
| $50,000 to $99,999 | 163 (38.1%) | 101 (20.8%) |
| $100,000 to $299,999 | 142 (33.2%) | 298 (61.3%) |
| $300,000 to $499,999 | 26 (6.1%) | 5 (1.0%) |
| $500,000 to $749,999 | 0 (0.0%) | 19 (3.9%) |
| $750,000 to $999,999 | 0 (0.0%) | 0 (0.0%) |
| $1,000,000 or more | 0 (0.0%) | 0 (0.0%) |
| Total | 428 (100.0%) | 486 (100.0%) |
Household Income by Mortgage Status in Broken Bow
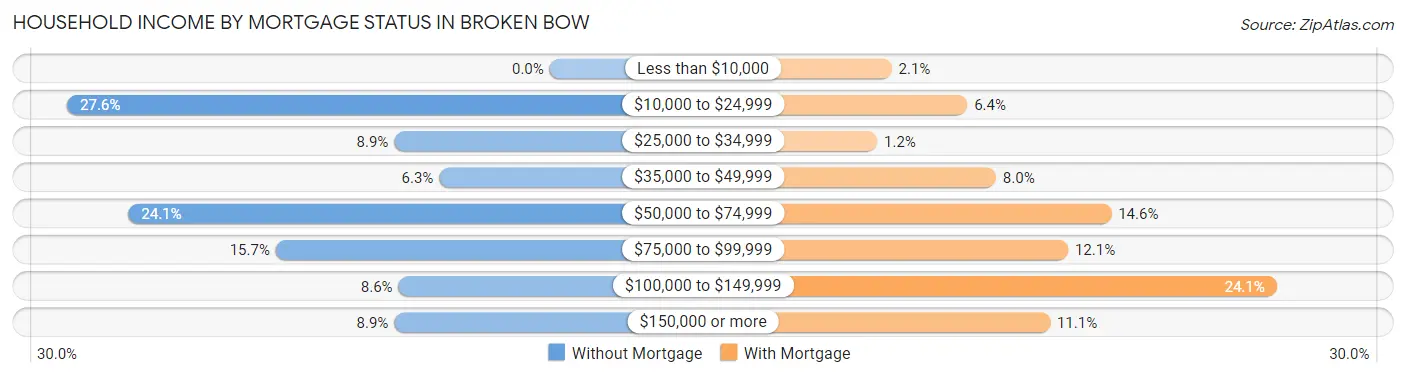
| Household Income | Without Mortgage | With Mortgage |
| Less than $10,000 | 0 (0.0%) | 10 (2.1%) |
| $10,000 to $24,999 | 118 (27.6%) | 31 (6.4%) |
| $25,000 to $34,999 | 38 (8.9%) | 6 (1.2%) |
| $35,000 to $49,999 | 27 (6.3%) | 39 (8.0%) |
| $50,000 to $74,999 | 103 (24.1%) | 71 (14.6%) |
| $75,000 to $99,999 | 67 (15.7%) | 59 (12.1%) |
| $100,000 to $149,999 | 37 (8.6%) | 117 (24.1%) |
| $150,000 or more | 38 (8.9%) | 54 (11.1%) |
| Total | 428 (100.0%) | 486 (100.0%) |
Property Value to Household Income Ratio in Broken Bow
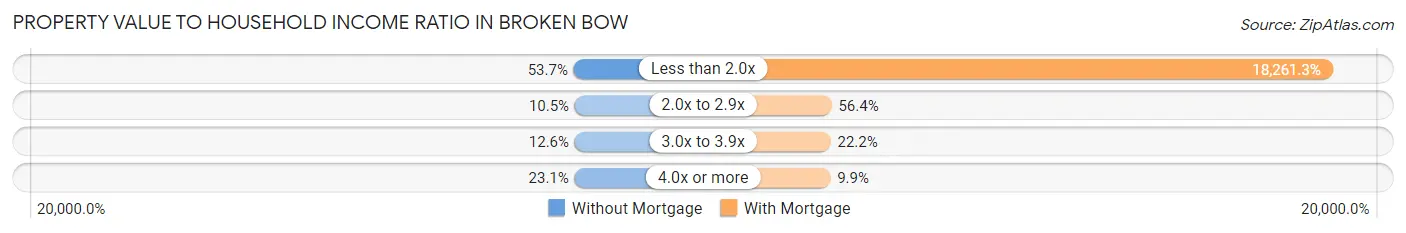
| Value-to-Income Ratio | Without Mortgage | With Mortgage |
| Less than 2.0x | 230 (53.7%) | 88,750 (18,261.3%) |
| 2.0x to 2.9x | 45 (10.5%) | 274 (56.4%) |
| 3.0x to 3.9x | 54 (12.6%) | 108 (22.2%) |
| 4.0x or more | 99 (23.1%) | 48 (9.9%) |
| Total | 428 (100.0%) | 486 (100.0%) |
Real Estate Taxes by Mortgage Status in Broken Bow
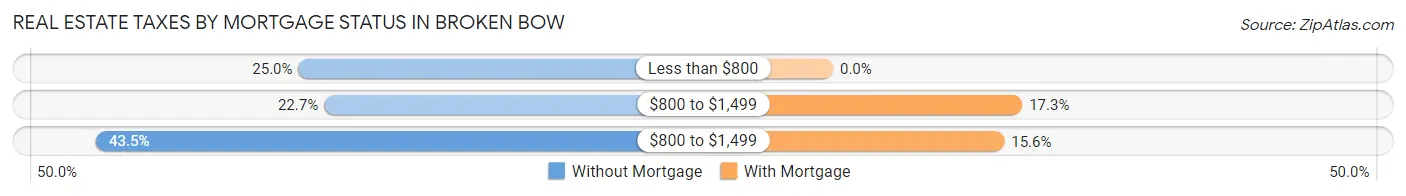
| Property Taxes | Without Mortgage | With Mortgage |
| Less than $800 | 107 (25.0%) | 0 (0.0%) |
| $800 to $1,499 | 97 (22.7%) | 84 (17.3%) |
| $800 to $1,499 | 186 (43.5%) | 76 (15.6%) |
| Total | 428 (100.0%) | 486 (100.0%) |
Health & Disability in Broken Bow
Health Insurance Coverage by Age in Broken Bow
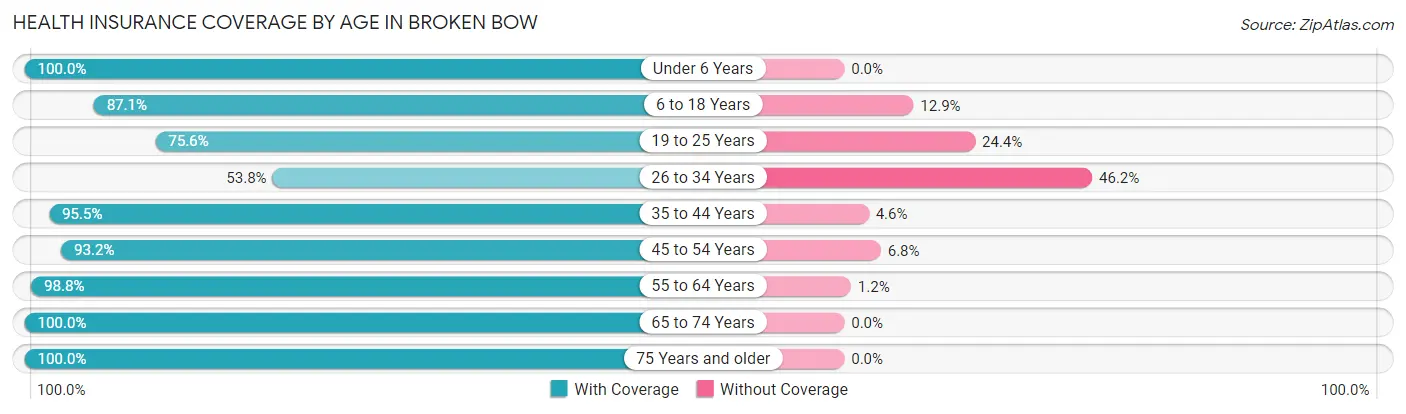
| Age Bracket | With Coverage | Without Coverage |
| Under 6 Years | 185 (100.0%) | 0 (0.0%) |
| 6 to 18 Years | 676 (87.1%) | 100 (12.9%) |
| 19 to 25 Years | 217 (75.6%) | 70 (24.4%) |
| 26 to 34 Years | 149 (53.8%) | 128 (46.2%) |
| 35 to 44 Years | 483 (95.5%) | 23 (4.5%) |
| 45 to 54 Years | 233 (93.2%) | 17 (6.8%) |
| 55 to 64 Years | 480 (98.8%) | 6 (1.2%) |
| 65 to 74 Years | 271 (100.0%) | 0 (0.0%) |
| 75 Years and older | 390 (100.0%) | 0 (0.0%) |
| Total | 3,084 (90.0%) | 344 (10.0%) |
Health Insurance Coverage by Citizenship Status in Broken Bow
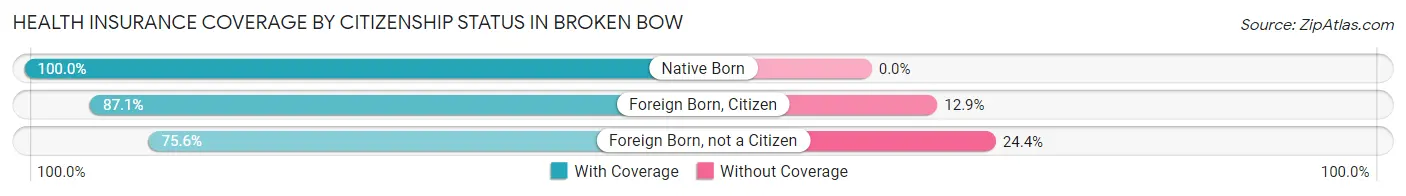
| Citizenship Status | With Coverage | Without Coverage |
| Native Born | 185 (100.0%) | 0 (0.0%) |
| Foreign Born, Citizen | 676 (87.1%) | 100 (12.9%) |
| Foreign Born, not a Citizen | 217 (75.6%) | 70 (24.4%) |
Health Insurance Coverage by Household Income in Broken Bow
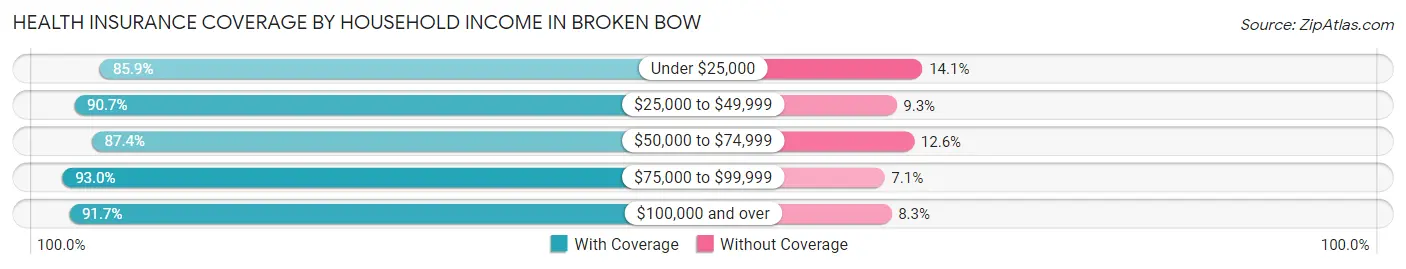
| Household Income | With Coverage | Without Coverage |
| Under $25,000 | 547 (85.9%) | 90 (14.1%) |
| $25,000 to $49,999 | 742 (90.7%) | 76 (9.3%) |
| $50,000 to $74,999 | 459 (87.4%) | 66 (12.6%) |
| $75,000 to $99,999 | 620 (92.9%) | 47 (7.0%) |
| $100,000 and over | 716 (91.7%) | 65 (8.3%) |
Public vs Private Health Insurance Coverage by Age in Broken Bow
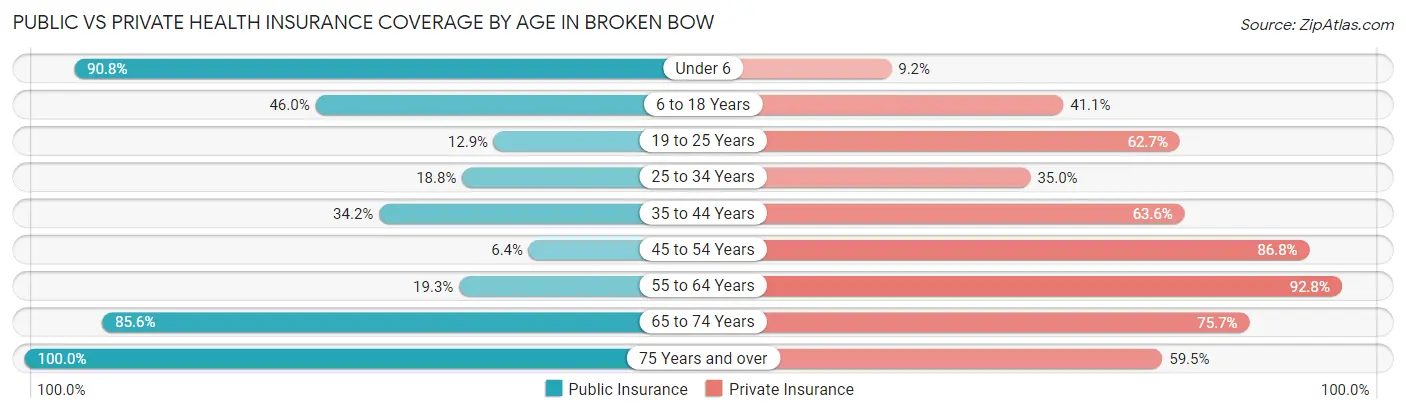
| Age Bracket | Public Insurance | Private Insurance |
| Under 6 | 168 (90.8%) | 17 (9.2%) |
| 6 to 18 Years | 357 (46.0%) | 319 (41.1%) |
| 19 to 25 Years | 37 (12.9%) | 180 (62.7%) |
| 25 to 34 Years | 52 (18.8%) | 97 (35.0%) |
| 35 to 44 Years | 173 (34.2%) | 322 (63.6%) |
| 45 to 54 Years | 16 (6.4%) | 217 (86.8%) |
| 55 to 64 Years | 94 (19.3%) | 451 (92.8%) |
| 65 to 74 Years | 232 (85.6%) | 205 (75.6%) |
| 75 Years and over | 390 (100.0%) | 232 (59.5%) |
| Total | 1,519 (44.3%) | 2,040 (59.5%) |
Disability Status by Sex by Age in Broken Bow
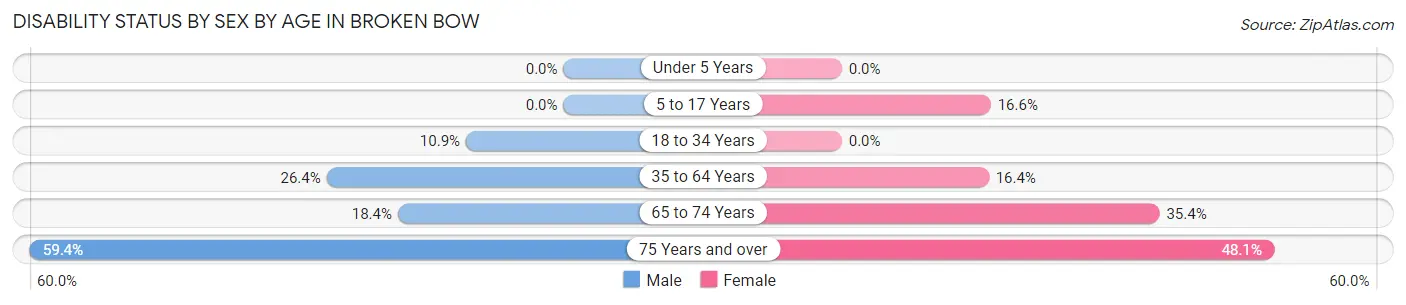
| Age Bracket | Male | Female |
| Under 5 Years | 0 (0.0%) | 0 (0.0%) |
| 5 to 17 Years | 0 (0.0%) | 72 (16.6%) |
| 18 to 34 Years | 28 (10.8%) | 0 (0.0%) |
| 35 to 64 Years | 168 (26.4%) | 99 (16.4%) |
| 65 to 74 Years | 26 (18.4%) | 46 (35.4%) |
| 75 Years and over | 60 (59.4%) | 139 (48.1%) |
Disability Class by Sex by Age in Broken Bow
Disability Class: Hearing Difficulty
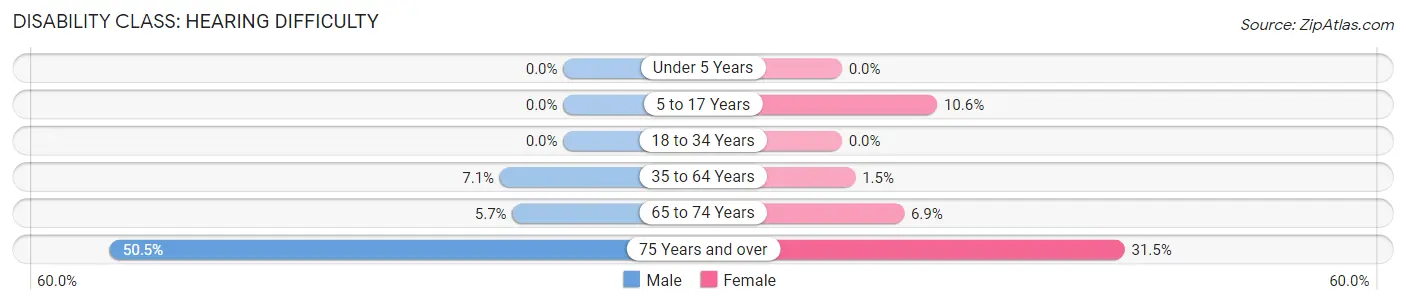
| Age Bracket | Male | Female |
| Under 5 Years | 0 (0.0%) | 0 (0.0%) |
| 5 to 17 Years | 0 (0.0%) | 46 (10.6%) |
| 18 to 34 Years | 0 (0.0%) | 0 (0.0%) |
| 35 to 64 Years | 45 (7.1%) | 9 (1.5%) |
| 65 to 74 Years | 8 (5.7%) | 9 (6.9%) |
| 75 Years and over | 51 (50.5%) | 91 (31.5%) |
Disability Class: Vision Difficulty
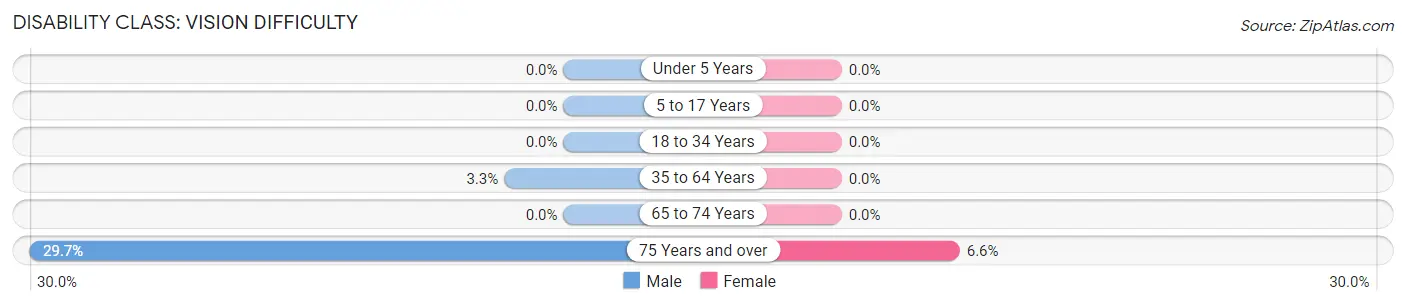
| Age Bracket | Male | Female |
| Under 5 Years | 0 (0.0%) | 0 (0.0%) |
| 5 to 17 Years | 0 (0.0%) | 0 (0.0%) |
| 18 to 34 Years | 0 (0.0%) | 0 (0.0%) |
| 35 to 64 Years | 21 (3.3%) | 0 (0.0%) |
| 65 to 74 Years | 0 (0.0%) | 0 (0.0%) |
| 75 Years and over | 30 (29.7%) | 19 (6.6%) |
Disability Class: Cognitive Difficulty
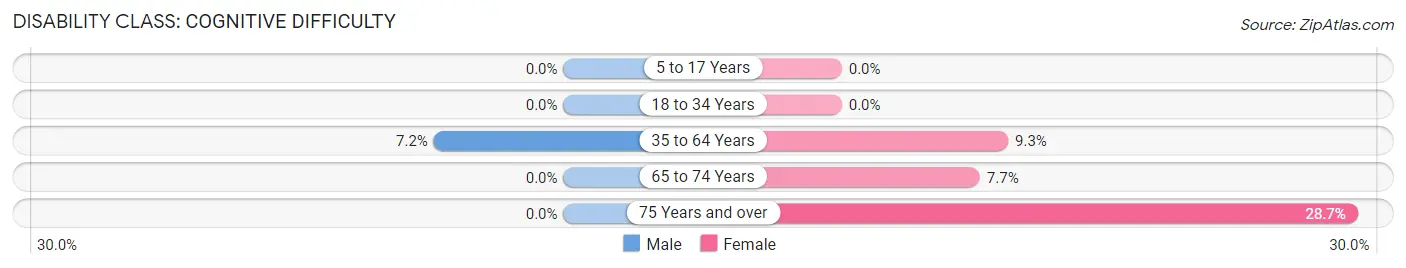
| Age Bracket | Male | Female |
| 5 to 17 Years | 0 (0.0%) | 0 (0.0%) |
| 18 to 34 Years | 0 (0.0%) | 0 (0.0%) |
| 35 to 64 Years | 46 (7.2%) | 56 (9.3%) |
| 65 to 74 Years | 0 (0.0%) | 10 (7.7%) |
| 75 Years and over | 0 (0.0%) | 83 (28.7%) |
Disability Class: Ambulatory Difficulty
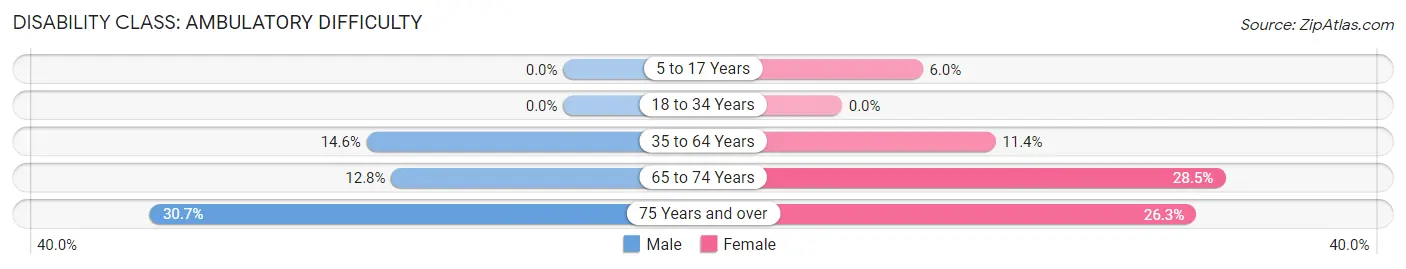
| Age Bracket | Male | Female |
| 5 to 17 Years | 0 (0.0%) | 26 (6.0%) |
| 18 to 34 Years | 0 (0.0%) | 0 (0.0%) |
| 35 to 64 Years | 93 (14.6%) | 69 (11.4%) |
| 65 to 74 Years | 18 (12.8%) | 37 (28.5%) |
| 75 Years and over | 31 (30.7%) | 76 (26.3%) |
Disability Class: Self-Care Difficulty
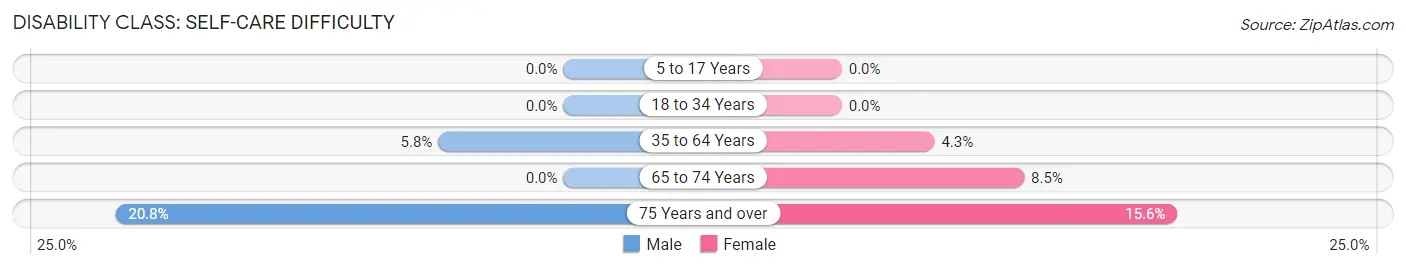
| Age Bracket | Male | Female |
| 5 to 17 Years | 0 (0.0%) | 0 (0.0%) |
| 18 to 34 Years | 0 (0.0%) | 0 (0.0%) |
| 35 to 64 Years | 37 (5.8%) | 26 (4.3%) |
| 65 to 74 Years | 0 (0.0%) | 11 (8.5%) |
| 75 Years and over | 21 (20.8%) | 45 (15.6%) |
Technology Access in Broken Bow
Computing Device Access in Broken Bow
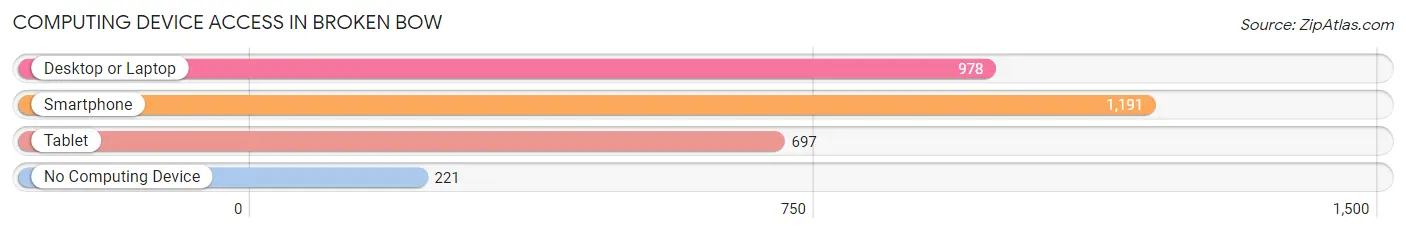
| Device Type | # Households | % Households |
| Desktop or Laptop | 978 | 64.5% |
| Smartphone | 1,191 | 78.6% |
| Tablet | 697 | 46.0% |
| No Computing Device | 221 | 14.6% |
| Total | 1,515 | 100.0% |
Internet Access in Broken Bow
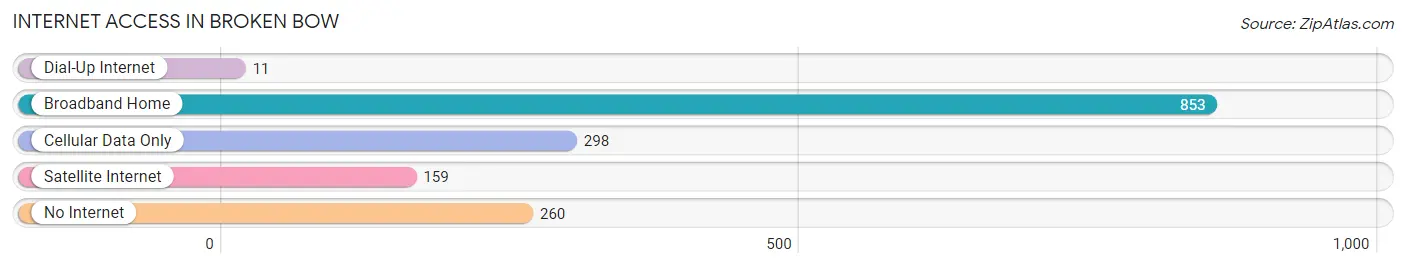
| Internet Type | # Households | % Households |
| Dial-Up Internet | 11 | 0.7% |
| Broadband Home | 853 | 56.3% |
| Cellular Data Only | 298 | 19.7% |
| Satellite Internet | 159 | 10.5% |
| No Internet | 260 | 17.2% |
| Total | 1,515 | 100.0% |
Broken Bow Summary
Broken Bow is a city located in Custer County, Nebraska, United States. It is the county seat of Custer County and is located in the Sandhills region of Nebraska. The population was 3,559 at the 2010 census.
History
The city of Broken Bow was founded in 1882 by the Union Pacific Railroad. The city was named after the nearby Broken Bow Creek, which was named after a Native American chief who was killed in a battle with the Pawnee. The city was incorporated in 1885 and was the first city in Custer County.
Geography
Broken Bow is located at 41°19'25" North, 99°45'45" West (41.323, -99.7625). According to the United States Census Bureau, the city has a total area of 2.2 square miles (5.7 km2), all of it land.
Economy
The economy of Broken Bow is largely based on agriculture and tourism. The city is home to several large agricultural operations, including cattle ranches, grain farms, and dairies. The city is also home to several tourist attractions, including the Custer County Historical Museum, the Sandhills Journey Scenic Byway, and the Broken Bow Lake State Recreation Area.
Demographics
As of the census of 2000, there were 3,541 people, 1,521 households, and 945 families residing in the city. The population density was 1,619.2 people per square mile (625.2/km2). There were 1,637 housing units at an average density of 741.2 per square mile (286.3/km2). The racial makeup of the city was 97.45% White, 0.17% African American, 0.17% Native American, 0.17% Asian, 0.17% Pacific Islander, 0.51% from other races, and 1.45% from two or more races. Hispanic or Latino of any race were 1.45% of the population.
There were 1,521 households, out of which 28.2% had children under the age of 18 living with them, 51.2% were married couples living together, 8.3% had a female householder with no husband present, and 37.2% were non-families. 33.7% of all households were made up of individuals, and 18.2% had someone living alone who was 65 years of age or older. The average household size was 2.30 and the average family size was 2.94.
In the city, the population was spread out, with 24.7% under the age of 18, 6.2% from 18 to 24, 24.2% from 25 to 44, 22.2% from 45 to 64, and 22.7% who were 65 years of age or older. The median age was 42 years. For every 100 females, there were 87.2 males. For every 100 females age 18 and over, there were 82.2 males.
The median income for a household in the city was $30,938, and the median income for a family was $37,917. Males had a median income of $27,917 versus $19,917 for females. The per capita income for the city was $16,945. About 8.2% of families and 11.2% of the population were below the poverty line, including 14.2% of those under age 18 and 8.7% of those age 65 or over.
Common Questions
What is Per Capita Income in Broken Bow?
Per Capita income in Broken Bow is $28,785.
What is the Median Family Income in Broken Bow?
Median Family Income in Broken Bow is $67,139.
What is the Median Household income in Broken Bow?
Median Household Income in Broken Bow is $49,425.
What is Income or Wage Gap in Broken Bow?
Income or Wage Gap in Broken Bow is 32.6%.
Women in Broken Bow earn 67.4 cents for every dollar earned by a man.
What is Family Income Deficit in Broken Bow?
Family Income Deficit in Broken Bow is $12,692.
Families that are below poverty line in Broken Bow earn $12,692 less on average than the poverty threshold level.
What is Inequality or Gini Index in Broken Bow?
Inequality or Gini Index in Broken Bow is 0.44.
What is the Total Population of Broken Bow?
Total Population of Broken Bow is 3,510.
What is the Total Male Population of Broken Bow?
Total Male Population of Broken Bow is 1,605.
What is the Total Female Population of Broken Bow?
Total Female Population of Broken Bow is 1,905.
What is the Ratio of Males per 100 Females in Broken Bow?
There are 84.25 Males per 100 Females in Broken Bow.
What is the Ratio of Females per 100 Males in Broken Bow?
There are 118.69 Females per 100 Males in Broken Bow.
What is the Median Population Age in Broken Bow?
Median Population Age in Broken Bow is 41.4 Years.
What is the Average Family Size in Broken Bow
Average Family Size in Broken Bow is 3.0 People.
What is the Average Household Size in Broken Bow
Average Household Size in Broken Bow is 2.3 People.
How Large is the Labor Force in Broken Bow?
There are 1,639 People in the Labor Forcein in Broken Bow.
What is the Percentage of People in the Labor Force in Broken Bow?
59.4% of People are in the Labor Force in Broken Bow.
What is the Unemployment Rate in Broken Bow?
Unemployment Rate in Broken Bow is 2.2%.