Camp Sherman, OR Map & Demographics
Camp Sherman Map
Camp Sherman Overview
$35,222
PER CAPITA INCOME
$83,438
AVG FAMILY INCOME
$83,125
AVG HOUSEHOLD INCOME
46.9%
WAGE / INCOME GAP [ % ]
53.1¢/ $1
WAGE / INCOME GAP [ $ ]
0.26
INEQUALITY / GINI INDEX
313
TOTAL POPULATION
181
MALE POPULATION
132
FEMALE POPULATION
137.12
MALES / 100 FEMALES
72.93
FEMALES / 100 MALES
47.8
MEDIAN AGE
2.8
AVG FAMILY SIZE
2.6
AVG HOUSEHOLD SIZE
79
LABOR FORCE [ PEOPLE ]
34.5%
PERCENT IN LABOR FORCE
2.5%
UNEMPLOYMENT RATE
Camp Sherman Zip Codes
Camp Sherman Area Codes
Income in Camp Sherman
Income Overview in Camp Sherman
Per Capita Income in Camp Sherman is $35,222, while median incomes of families and households are $83,438 and $83,125 respectively.
| Characteristic | Number | Measure |
| Per Capita Income | 313 | $35,222 |
| Median Family Income | 105 | $83,438 |
| Mean Family Income | 105 | $93,522 |
| Median Household Income | 120 | $83,125 |
| Mean Household Income | 120 | $94,520 |
| Income Deficit | 105 | $0 |
| Wage / Income Gap (%) | 313 | 46.88% |
| Wage / Income Gap ($) | 313 | 53.12¢ per $1 |
| Gini / Inequality Index | 313 | 0.26 |
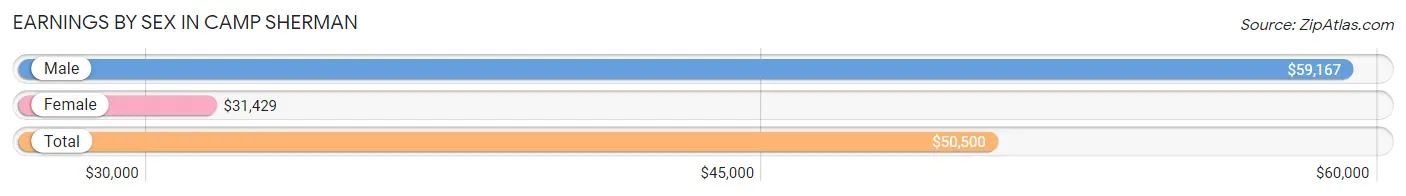
Earnings by Sex in Camp Sherman
Average Earnings in Camp Sherman are $50,500, $59,167 for men and $31,429 for women, a difference of 46.9%.
| Sex | Number | Average Earnings |
| Male | 56 (63.6%) | $59,167 |
| Female | 32 (36.4%) | $31,429 |
| Total | 88 (100.0%) | $50,500 |
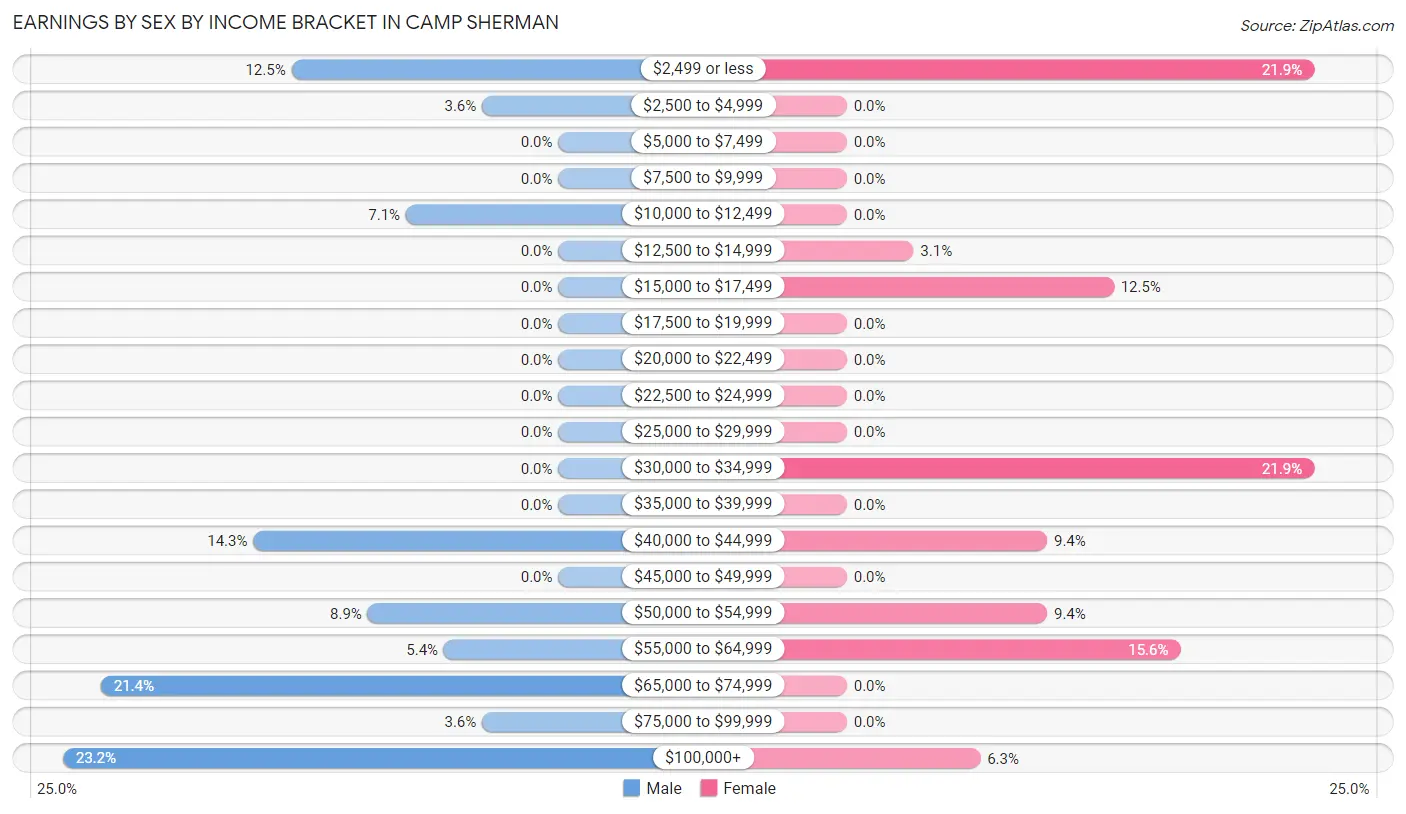
Earnings by Sex by Income Bracket in Camp Sherman
The most common earnings brackets in Camp Sherman are $100,000+ for men (13 | 23.2%) and $2,499 or less for women (7 | 21.9%).
| Income | Male | Female |
| $2,499 or less | 7 (12.5%) | 7 (21.9%) |
| $2,500 to $4,999 | 2 (3.6%) | 0 (0.0%) |
| $5,000 to $7,499 | 0 (0.0%) | 0 (0.0%) |
| $7,500 to $9,999 | 0 (0.0%) | 0 (0.0%) |
| $10,000 to $12,499 | 4 (7.1%) | 0 (0.0%) |
| $12,500 to $14,999 | 0 (0.0%) | 1 (3.1%) |
| $15,000 to $17,499 | 0 (0.0%) | 4 (12.5%) |
| $17,500 to $19,999 | 0 (0.0%) | 0 (0.0%) |
| $20,000 to $22,499 | 0 (0.0%) | 0 (0.0%) |
| $22,500 to $24,999 | 0 (0.0%) | 0 (0.0%) |
| $25,000 to $29,999 | 0 (0.0%) | 0 (0.0%) |
| $30,000 to $34,999 | 0 (0.0%) | 7 (21.9%) |
| $35,000 to $39,999 | 0 (0.0%) | 0 (0.0%) |
| $40,000 to $44,999 | 8 (14.3%) | 3 (9.4%) |
| $45,000 to $49,999 | 0 (0.0%) | 0 (0.0%) |
| $50,000 to $54,999 | 5 (8.9%) | 3 (9.4%) |
| $55,000 to $64,999 | 3 (5.4%) | 5 (15.6%) |
| $65,000 to $74,999 | 12 (21.4%) | 0 (0.0%) |
| $75,000 to $99,999 | 2 (3.6%) | 0 (0.0%) |
| $100,000+ | 13 (23.2%) | 2 (6.2%) |
| Total | 56 (100.0%) | 32 (100.0%) |
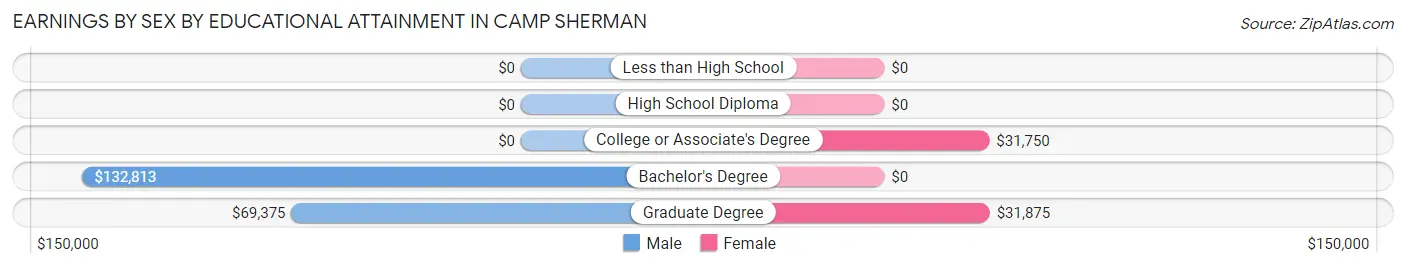
Earnings by Sex by Educational Attainment in Camp Sherman
Average earnings in Camp Sherman are $59,583 for men and $31,429 for women, a difference of 47.2%. Men with an educational attainment of bachelor's degree enjoy the highest average annual earnings of $132,813, while those with graduate degree education earn the least with $69,375. Women with an educational attainment of graduate degree earn the most with the average annual earnings of $31,875, while those with college or associate's degree education have the smallest earnings of $31,750.
| Educational Attainment | Male Income | Female Income |
| Less than High School | - | - |
| High School Diploma | - | - |
| College or Associate's Degree | - | - |
| Bachelor's Degree | $132,813 | $0 |
| Graduate Degree | $69,375 | $31,875 |
| Total | $59,583 | $31,429 |
Family Income in Camp Sherman
Family Income Brackets in Camp Sherman
According to the Camp Sherman family income data, there are 30 families falling into the $100,000 to $149,999 income range, which is the most common income bracket and makes up 28.6% of all families.
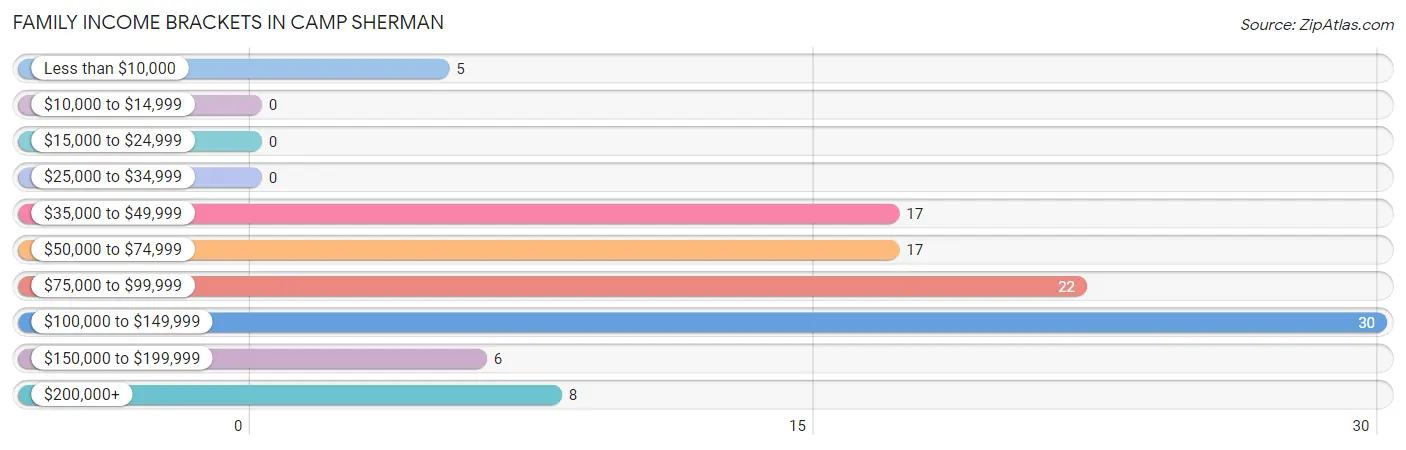
| Income Bracket | # Families | % Families |
| Less than $10,000 | 5 | 4.8% |
| $10,000 to $14,999 | 0 | 0.0% |
| $15,000 to $24,999 | 0 | 0.0% |
| $25,000 to $34,999 | 0 | 0.0% |
| $35,000 to $49,999 | 17 | 16.2% |
| $50,000 to $74,999 | 17 | 16.2% |
| $75,000 to $99,999 | 22 | 21.0% |
| $100,000 to $149,999 | 30 | 28.6% |
| $150,000 to $199,999 | 6 | 5.7% |
| $200,000+ | 8 | 7.6% |
Family Income by Famaliy Size in Camp Sherman
3-person families (19 | 18.1%) account for the highest median family income in Camp Sherman with $108,594 per family, while 2-person families (76 | 72.4%) have the highest median income of $40,250 per family member.
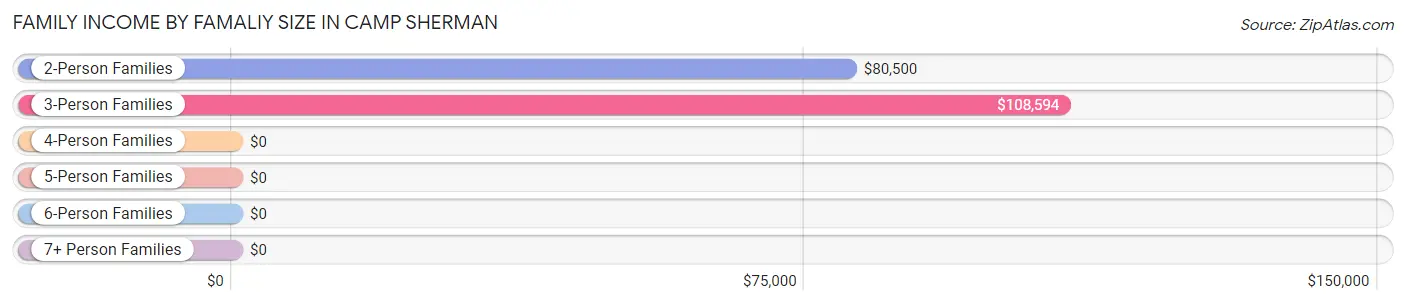
| Income Bracket | # Families | Median Income |
| 2-Person Families | 76 (72.4%) | $80,500 |
| 3-Person Families | 19 (18.1%) | $108,594 |
| 4-Person Families | 4 (3.8%) | $0 |
| 5-Person Families | 6 (5.7%) | $0 |
| 6-Person Families | 0 (0.0%) | $0 |
| 7+ Person Families | 0 (0.0%) | $0 |
| Total | 105 (100.0%) | $83,438 |
Family Income by Number of Earners in Camp Sherman
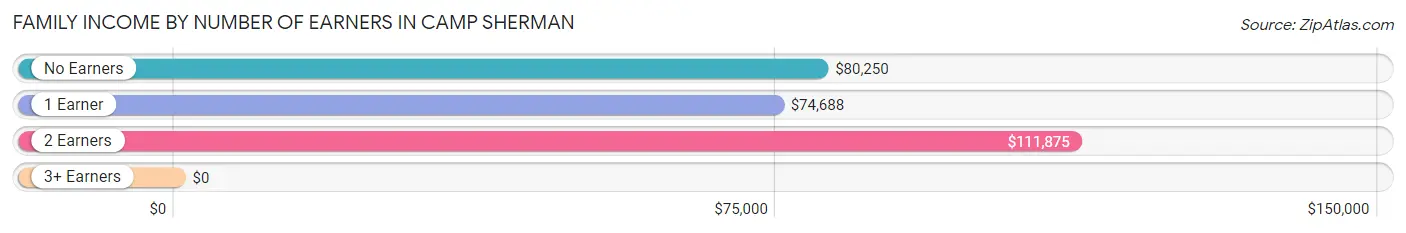
| Number of Earners | # Families | Median Income |
| No Earners | 55 (52.4%) | $80,250 |
| 1 Earner | 21 (20.0%) | $74,688 |
| 2 Earners | 29 (27.6%) | $111,875 |
| 3+ Earners | 0 (0.0%) | $0 |
| Total | 105 (100.0%) | $83,438 |
Household Income in Camp Sherman
Household Income Brackets in Camp Sherman
With 37 households falling in the category, the $100,000 to $149,999 income range is the most frequent in Camp Sherman, accounting for 30.8% of all households.
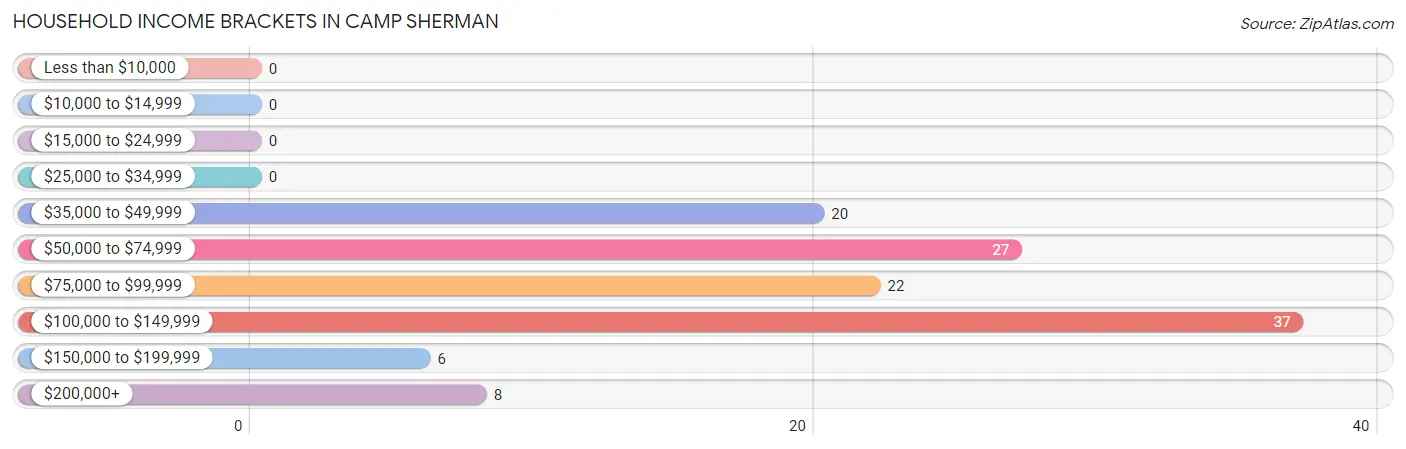
| Income Bracket | # Households | % Households |
| Less than $10,000 | 0 | 0.0% |
| $10,000 to $14,999 | 0 | 0.0% |
| $15,000 to $24,999 | 0 | 0.0% |
| $25,000 to $34,999 | 0 | 0.0% |
| $35,000 to $49,999 | 20 | 16.7% |
| $50,000 to $74,999 | 27 | 22.5% |
| $75,000 to $99,999 | 22 | 18.3% |
| $100,000 to $149,999 | 37 | 30.8% |
| $150,000 to $199,999 | 6 | 5.0% |
| $200,000+ | 8 | 6.7% |
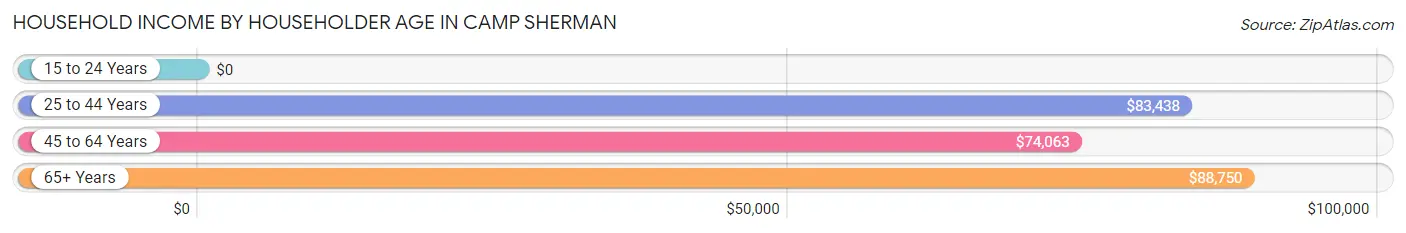
Household Income by Householder Age in Camp Sherman
The median household income in Camp Sherman is $83,125, with the highest median household income of $88,750 found in the 65+ years age bracket for the primary householder. A total of 62 households (51.7%) fall into this category.
| Income Bracket | # Households | Median Income |
| 15 to 24 Years | 0 (0.0%) | $0 |
| 25 to 44 Years | 29 (24.2%) | $83,438 |
| 45 to 64 Years | 29 (24.2%) | $74,063 |
| 65+ Years | 62 (51.7%) | $88,750 |
| Total | 120 (100.0%) | $83,125 |
Poverty in Camp Sherman
Income Below Poverty by Sex and Age in Camp Sherman
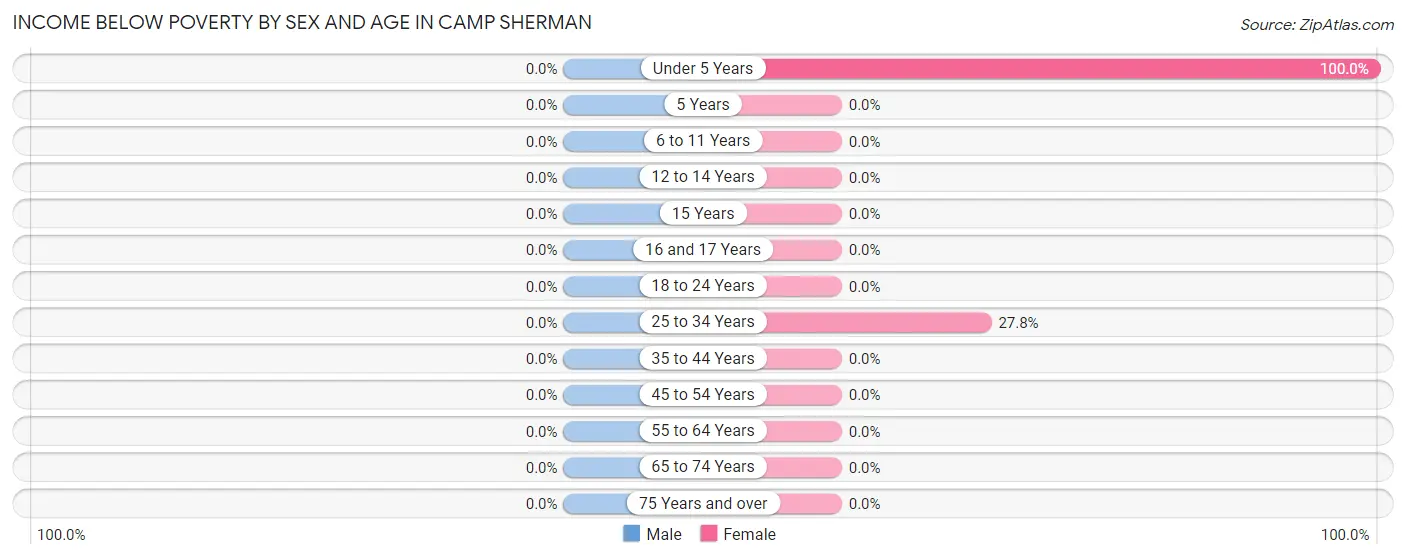
| Age Bracket | Male | Female |
| Under 5 Years | 0 (0.0%) | 7 (100.0%) |
| 5 Years | 0 (0.0%) | 0 (0.0%) |
| 6 to 11 Years | 0 (0.0%) | 0 (0.0%) |
| 12 to 14 Years | 0 (0.0%) | 0 (0.0%) |
| 15 Years | 0 (0.0%) | 0 (0.0%) |
| 16 and 17 Years | 0 (0.0%) | 0 (0.0%) |
| 18 to 24 Years | 0 (0.0%) | 0 (0.0%) |
| 25 to 34 Years | 0 (0.0%) | 5 (27.8%) |
| 35 to 44 Years | 0 (0.0%) | 0 (0.0%) |
| 45 to 54 Years | 0 (0.0%) | 0 (0.0%) |
| 55 to 64 Years | 0 (0.0%) | 0 (0.0%) |
| 65 to 74 Years | 0 (0.0%) | 0 (0.0%) |
| 75 Years and over | 0 (0.0%) | 0 (0.0%) |
| Total | 0 (0.0%) | 12 (9.1%) |
Income Above Poverty by Sex and Age in Camp Sherman
According to the poverty statistics in Camp Sherman, males aged under 5 years and females aged 5 years are the age groups that are most secure financially, with 100.0% of males and 100.0% of females in these age groups living above the poverty line.
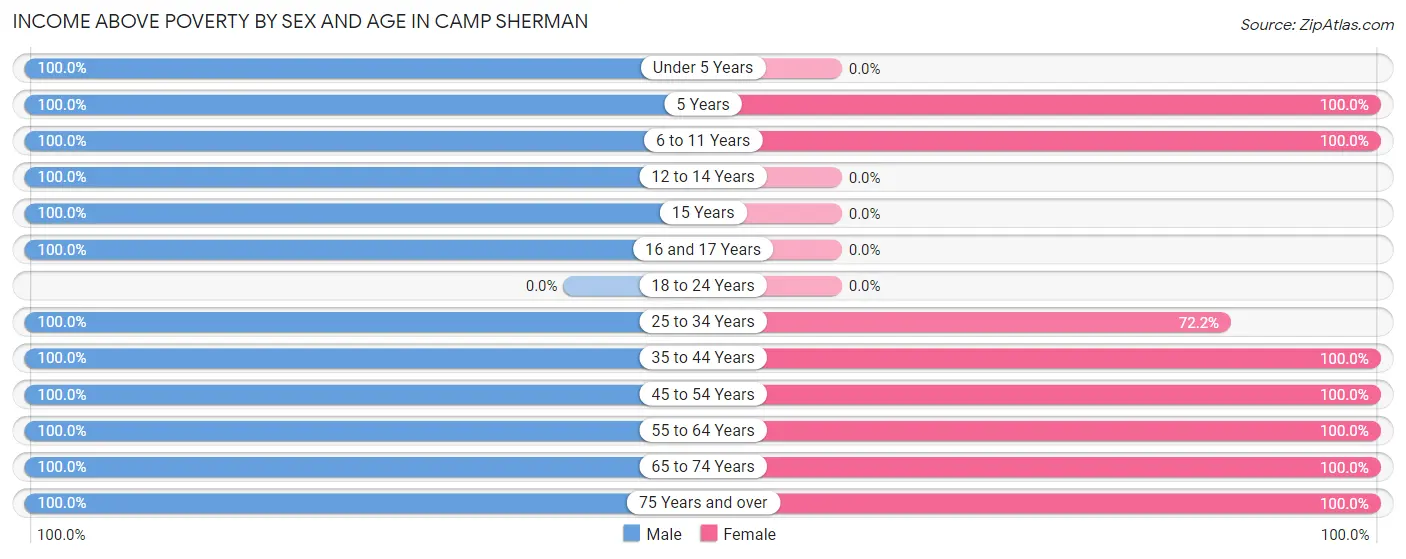
| Age Bracket | Male | Female |
| Under 5 Years | 52 (100.0%) | 0 (0.0%) |
| 5 Years | 3 (100.0%) | 5 (100.0%) |
| 6 to 11 Years | 9 (100.0%) | 3 (100.0%) |
| 12 to 14 Years | 3 (100.0%) | 0 (0.0%) |
| 15 Years | 2 (100.0%) | 0 (0.0%) |
| 16 and 17 Years | 1 (100.0%) | 0 (0.0%) |
| 18 to 24 Years | 0 (0.0%) | 0 (0.0%) |
| 25 to 34 Years | 6 (100.0%) | 13 (72.2%) |
| 35 to 44 Years | 24 (100.0%) | 17 (100.0%) |
| 45 to 54 Years | 4 (100.0%) | 9 (100.0%) |
| 55 to 64 Years | 19 (100.0%) | 14 (100.0%) |
| 65 to 74 Years | 22 (100.0%) | 35 (100.0%) |
| 75 Years and over | 36 (100.0%) | 24 (100.0%) |
| Total | 181 (100.0%) | 120 (90.9%) |
Income Below Poverty Among Married-Couple Families in Camp Sherman
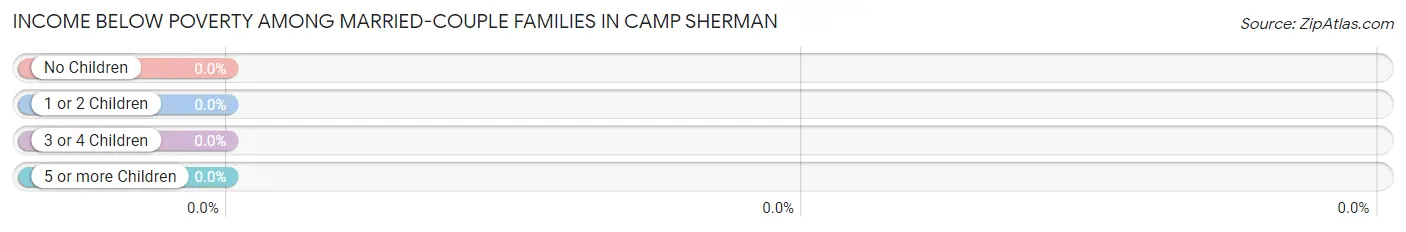
| Children | Above Poverty | Below Poverty |
| No Children | 77 (100.0%) | 0 (0.0%) |
| 1 or 2 Children | 10 (100.0%) | 0 (0.0%) |
| 3 or 4 Children | 3 (100.0%) | 0 (0.0%) |
| 5 or more Children | 0 (0.0%) | 0 (0.0%) |
| Total | 90 (100.0%) | 0 (0.0%) |
Income Below Poverty Among Single-Parent Households in Camp Sherman
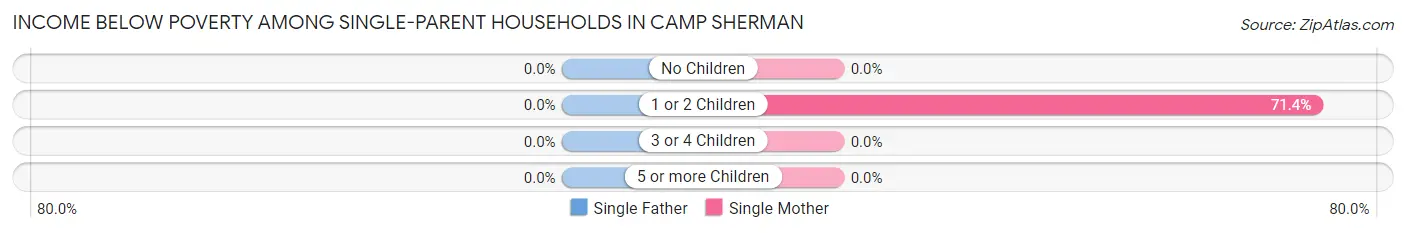
| Children | Single Father | Single Mother |
| No Children | 0 (0.0%) | 0 (0.0%) |
| 1 or 2 Children | 0 (0.0%) | 5 (71.4%) |
| 3 or 4 Children | 0 (0.0%) | 0 (0.0%) |
| 5 or more Children | 0 (0.0%) | 0 (0.0%) |
| Total | 0 (0.0%) | 5 (50.0%) |
Income Below Poverty Among Married-Couple vs Single-Parent Households in Camp Sherman
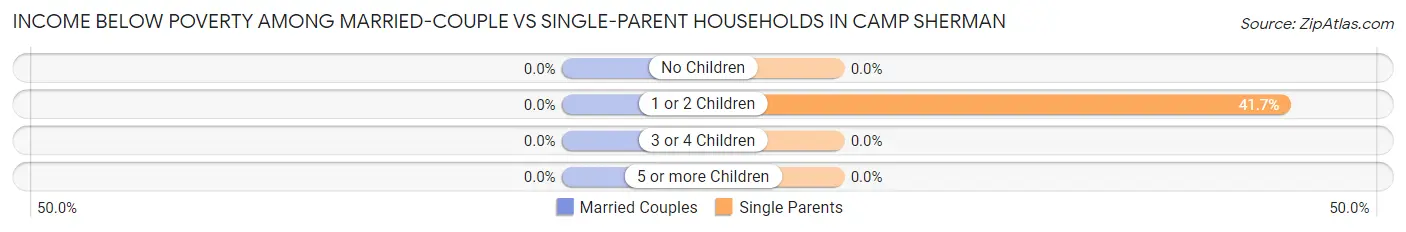
| Children | Married-Couple Families | Single-Parent Households |
| No Children | 0 (0.0%) | 0 (0.0%) |
| 1 or 2 Children | 0 (0.0%) | 5 (41.7%) |
| 3 or 4 Children | 0 (0.0%) | 0 (0.0%) |
| 5 or more Children | 0 (0.0%) | 0 (0.0%) |
| Total | 0 (0.0%) | 5 (33.3%) |
Race in Camp Sherman
The most populous races in Camp Sherman are White / Caucasian (288 | 92.0%), Hispanic or Latino (66 | 21.1%), and Two or more Races (25 | 8.0%).
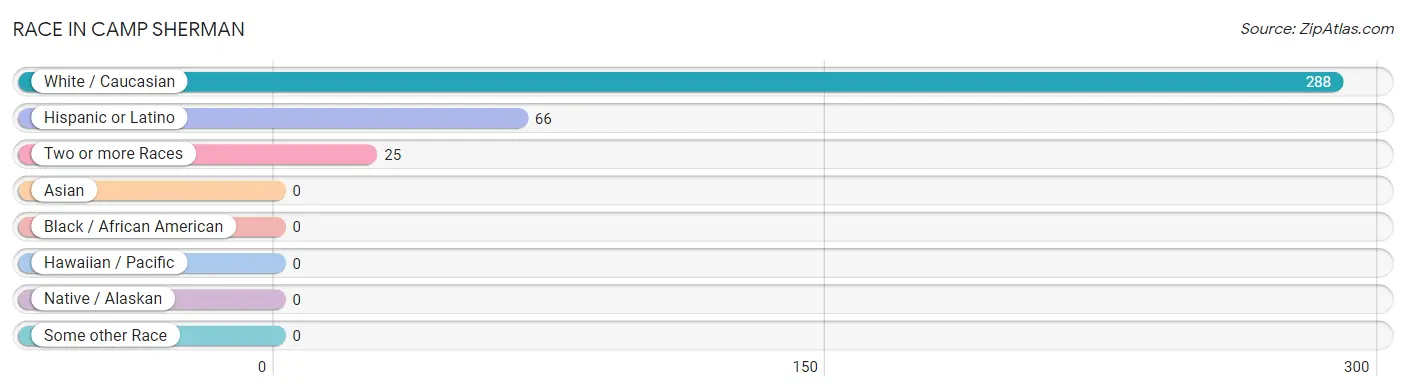
| Race | # Population | % Population |
| Asian | 0 | 0.0% |
| Black / African American | 0 | 0.0% |
| Hawaiian / Pacific | 0 | 0.0% |
| Hispanic or Latino | 66 | 21.1% |
| Native / Alaskan | 0 | 0.0% |
| White / Caucasian | 288 | 92.0% |
| Two or more Races | 25 | 8.0% |
| Some other Race | 0 | 0.0% |
| Total | 313 | 100.0% |
Ancestry in Camp Sherman
The most populous ancestries reported in Camp Sherman are English (105 | 33.6%), German (75 | 24.0%), Spanish (63 | 20.1%), Swiss (57 | 18.2%), and Irish (29 | 9.3%), together accounting for 105.1% of all Camp Sherman residents.
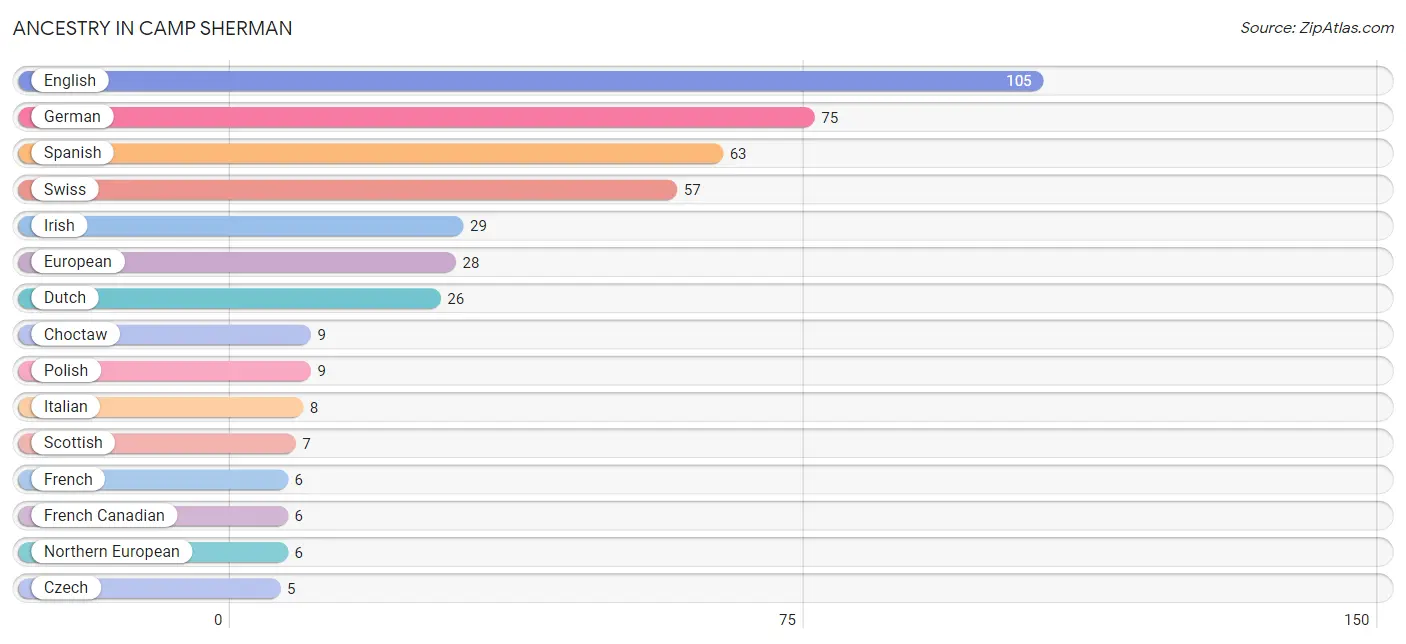
| Ancestry | # Population | % Population |
| African | 4 | 1.3% |
| Choctaw | 9 | 2.9% |
| Croatian | 3 | 1.0% |
| Czech | 5 | 1.6% |
| Danish | 4 | 1.3% |
| Dutch | 26 | 8.3% |
| English | 105 | 33.6% |
| Estonian | 2 | 0.6% |
| European | 28 | 8.9% |
| French | 6 | 1.9% |
| French Canadian | 6 | 1.9% |
| German | 75 | 24.0% |
| Irish | 29 | 9.3% |
| Italian | 8 | 2.6% |
| Northern European | 6 | 1.9% |
| Norwegian | 2 | 0.6% |
| Polish | 9 | 2.9% |
| Portuguese | 5 | 1.6% |
| Scandinavian | 2 | 0.6% |
| Scotch-Irish | 1 | 0.3% |
| Scottish | 7 | 2.2% |
| Spanish | 63 | 20.1% |
| Subsaharan African | 4 | 1.3% |
| Swedish | 4 | 1.3% |
| Swiss | 57 | 18.2% |
| Ukrainian | 2 | 0.6% |
| Welsh | 3 | 1.0% | View All 27 Rows |
Immigrants in Camp Sherman
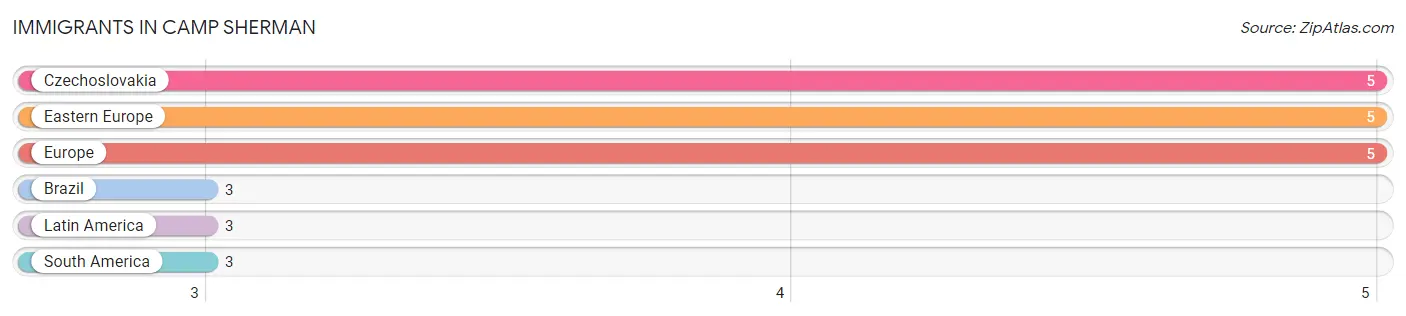
The most numerous immigrant groups reported in Camp Sherman came from Czechoslovakia (5 | 1.6%), Eastern Europe (5 | 1.6%), Europe (5 | 1.6%), Brazil (3 | 1.0%), and Latin America (3 | 1.0%), together accounting for 6.7% of all Camp Sherman residents.
| Immigration Origin | # Population | % Population |
| Brazil | 3 | 1.0% |
| Czechoslovakia | 5 | 1.6% |
| Eastern Europe | 5 | 1.6% |
| Europe | 5 | 1.6% |
| Latin America | 3 | 1.0% |
| South America | 3 | 1.0% | View All 6 Rows |
Sex and Age in Camp Sherman
Sex and Age in Camp Sherman
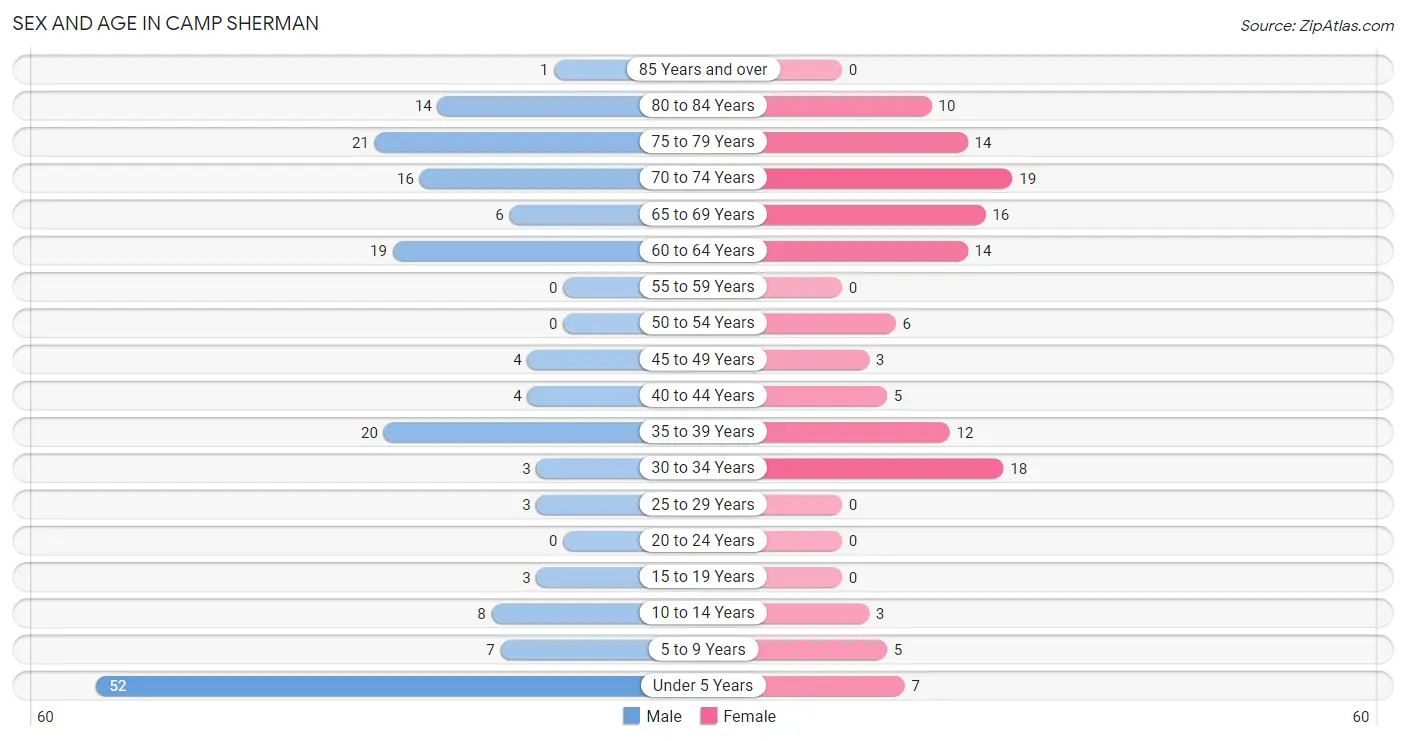
The most populous age groups in Camp Sherman are Under 5 Years (52 | 28.7%) for men and 70 to 74 Years (19 | 14.4%) for women.
| Age Bracket | Male | Female |
| Under 5 Years | 52 (28.7%) | 7 (5.3%) |
| 5 to 9 Years | 7 (3.9%) | 5 (3.8%) |
| 10 to 14 Years | 8 (4.4%) | 3 (2.3%) |
| 15 to 19 Years | 3 (1.7%) | 0 (0.0%) |
| 20 to 24 Years | 0 (0.0%) | 0 (0.0%) |
| 25 to 29 Years | 3 (1.7%) | 0 (0.0%) |
| 30 to 34 Years | 3 (1.7%) | 18 (13.6%) |
| 35 to 39 Years | 20 (11.1%) | 12 (9.1%) |
| 40 to 44 Years | 4 (2.2%) | 5 (3.8%) |
| 45 to 49 Years | 4 (2.2%) | 3 (2.3%) |
| 50 to 54 Years | 0 (0.0%) | 6 (4.5%) |
| 55 to 59 Years | 0 (0.0%) | 0 (0.0%) |
| 60 to 64 Years | 19 (10.5%) | 14 (10.6%) |
| 65 to 69 Years | 6 (3.3%) | 16 (12.1%) |
| 70 to 74 Years | 16 (8.8%) | 19 (14.4%) |
| 75 to 79 Years | 21 (11.6%) | 14 (10.6%) |
| 80 to 84 Years | 14 (7.7%) | 10 (7.6%) |
| 85 Years and over | 1 (0.5%) | 0 (0.0%) |
| Total | 181 (100.0%) | 132 (100.0%) |
Families and Households in Camp Sherman
Median Family Size in Camp Sherman
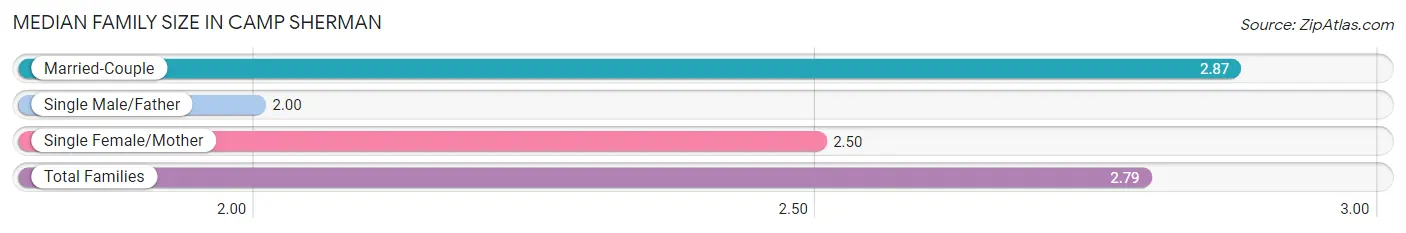
The median family size in Camp Sherman is 2.79 persons per family, with married-couple families (90 | 85.7%) accounting for the largest median family size of 2.87 persons per family. On the other hand, single male/father families (5 | 4.8%) represent the smallest median family size with 2.00 persons per family.
| Family Type | # Families | Family Size |
| Married-Couple | 90 (85.7%) | 2.87 |
| Single Male/Father | 5 (4.8%) | 2.00 |
| Single Female/Mother | 10 (9.5%) | 2.50 |
| Total Families | 105 (100.0%) | 2.79 |
Median Household Size in Camp Sherman
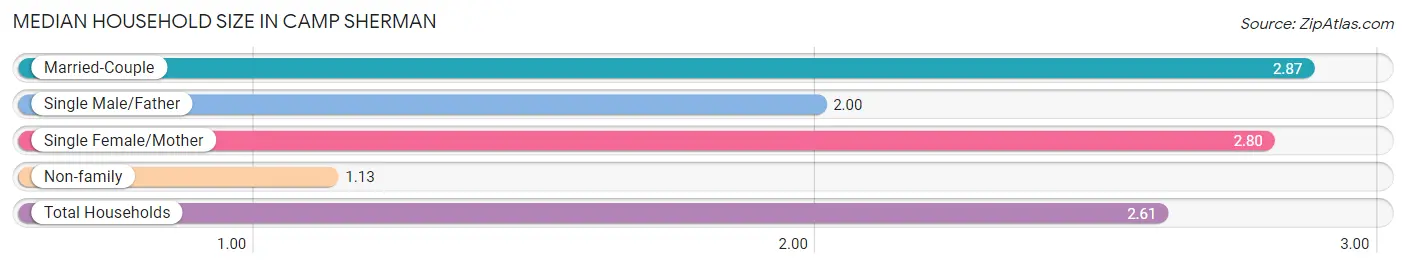
The median household size in Camp Sherman is 2.61 persons per household, with married-couple households (90 | 75.0%) accounting for the largest median household size of 2.87 persons per household. non-family households (15 | 12.5%) represent the smallest median household size with 1.13 persons per household.
| Household Type | # Households | Household Size |
| Married-Couple | 90 (75.0%) | 2.87 |
| Single Male/Father | 5 (4.2%) | 2.00 |
| Single Female/Mother | 10 (8.3%) | 2.80 |
| Non-family | 15 (12.5%) | 1.13 |
| Total Households | 120 (100.0%) | 2.61 |
Household Size by Marriage Status in Camp Sherman
Out of a total of 120 households in Camp Sherman, 105 (87.5%) are family households, while 15 (12.5%) are nonfamily households. The most numerous type of family households are 2-person households, comprising 76, and the most common type of nonfamily households are 1-person households, comprising 13.
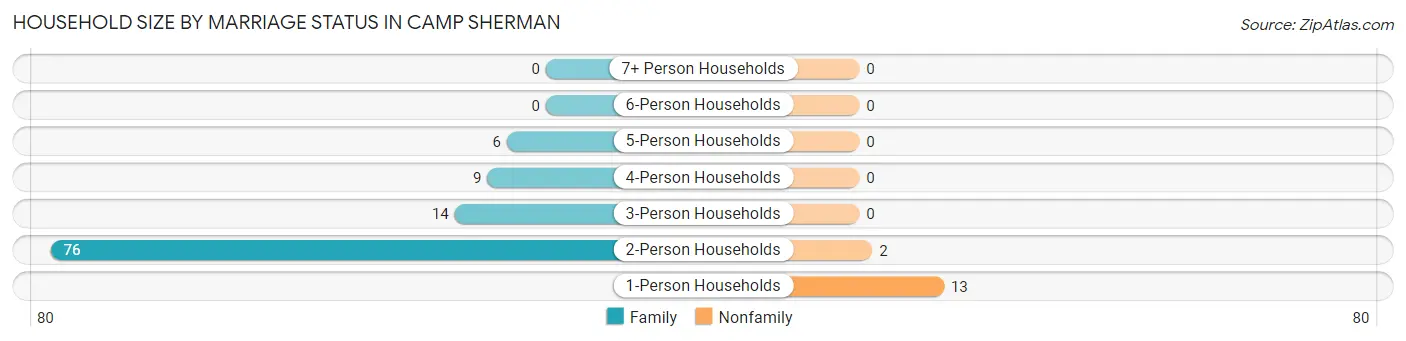
| Household Size | Family Households | Nonfamily Households |
| 1-Person Households | - | 13 (10.8%) |
| 2-Person Households | 76 (63.3%) | 2 (1.7%) |
| 3-Person Households | 14 (11.7%) | 0 (0.0%) |
| 4-Person Households | 9 (7.5%) | 0 (0.0%) |
| 5-Person Households | 6 (5.0%) | 0 (0.0%) |
| 6-Person Households | 0 (0.0%) | 0 (0.0%) |
| 7+ Person Households | 0 (0.0%) | 0 (0.0%) |
| Total | 105 (87.5%) | 15 (12.5%) |
Female Fertility in Camp Sherman
Fertility by Age in Camp Sherman
| Age Bracket | Women with Births | Births / 1,000 Women |
| 15 to 19 years | 0 (0.0%) | 0.0 |
| 20 to 34 years | 0 (0.0%) | 0.0 |
| 35 to 50 years | 0 (0.0%) | 0.0 |
| Total | 0 (0.0%) | 0.0 |
Fertility by Age by Marriage Status in Camp Sherman
| Age Bracket | Married | Unmarried |
| 15 to 19 years | 0 (0.0%) | 0 (0.0%) |
| 20 to 34 years | 0 (0.0%) | 0 (0.0%) |
| 35 to 50 years | 0 (0.0%) | 0 (0.0%) |
| Total | 0 (0.0%) | 0 (0.0%) |
Fertility by Education in Camp Sherman
| Educational Attainment | Women with Births | Births / 1,000 Women |
| Less than High School | 0 (0.0%) | 0.0 |
| High School Diploma | 0 (0.0%) | 0.0 |
| College or Associate's Degree | 0 (0.0%) | 0.0 |
| Bachelor's Degree | 0 (0.0%) | 0.0 |
| Graduate Degree | 0 (0.0%) | 0.0 |
| Total | 0 (0.0%) | 0.0 |
Fertility by Education by Marriage Status in Camp Sherman
| Educational Attainment | Married | Unmarried |
| Less than High School | 0 (0.0%) | 0 (0.0%) |
| High School Diploma | 0 (0.0%) | 0 (0.0%) |
| College or Associate's Degree | 0 (0.0%) | 0 (0.0%) |
| Bachelor's Degree | 0 (0.0%) | 0 (0.0%) |
| Graduate Degree | 0 (0.0%) | 0 (0.0%) |
| Total | 0 (0.0%) | 0 (0.0%) |
Employment Characteristics in Camp Sherman
Employment by Class of Employer in Camp Sherman
Among the 77 employed individuals in Camp Sherman, private company employees (35 | 45.5%), self-employed (not incorporated) (14 | 18.2%), and self-employed (incorporated) (9 | 11.7%) make up the most common classes of employment.
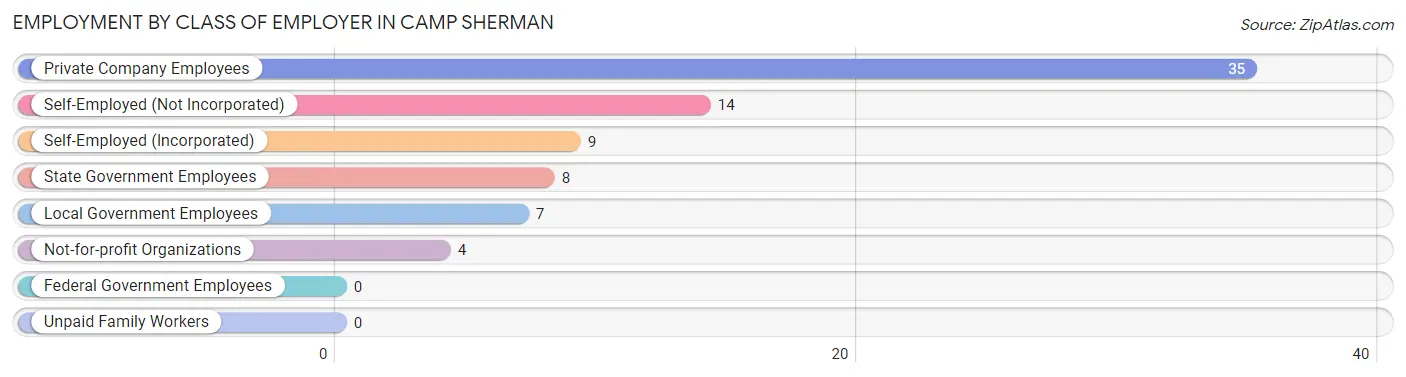
| Employer Class | # Employees | % Employees |
| Private Company Employees | 35 | 45.5% |
| Self-Employed (Incorporated) | 9 | 11.7% |
| Self-Employed (Not Incorporated) | 14 | 18.2% |
| Not-for-profit Organizations | 4 | 5.2% |
| Local Government Employees | 7 | 9.1% |
| State Government Employees | 8 | 10.4% |
| Federal Government Employees | 0 | 0.0% |
| Unpaid Family Workers | 0 | 0.0% |
| Total | 77 | 100.0% |
Employment Status by Age in Camp Sherman
According to the labor force statistics for Camp Sherman, out of the total population over 16 years of age (229), 34.5% or 79 individuals are in the labor force, with 2.5% or 2 of them unemployed. The age group with the highest labor force participation rate is 25 to 29 years, with 100.0% or 3 individuals in the labor force. Within the labor force, the 65 to 74 years age range has the highest percentage of unemployed individuals, with 22.2% or 2 of them being unemployed.
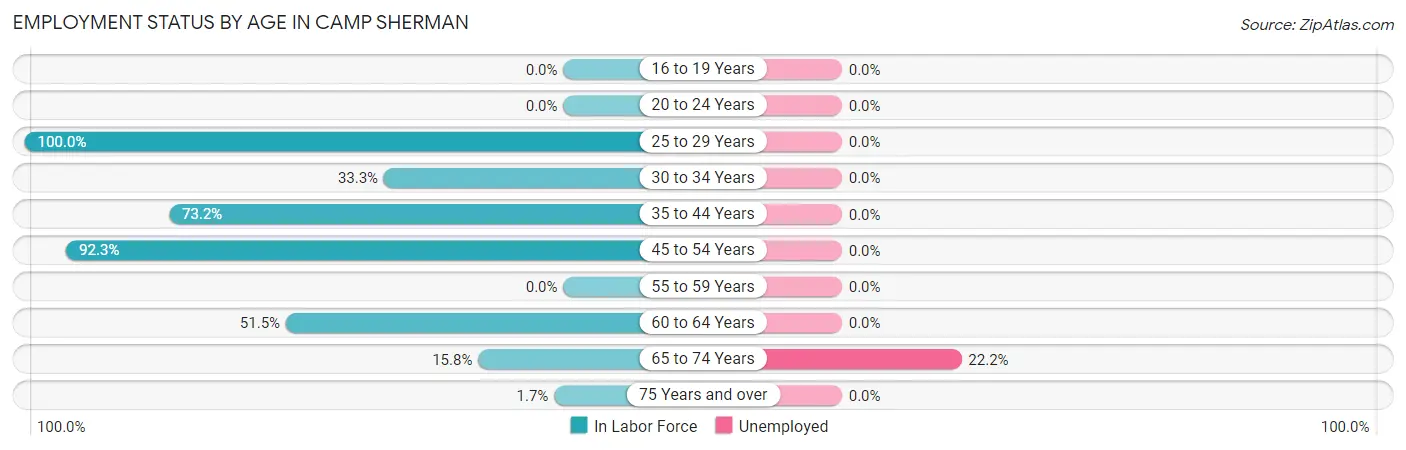
| Age Bracket | In Labor Force | Unemployed |
| 16 to 19 Years | 0 (0.0%) | 0 (0.0%) |
| 20 to 24 Years | 0 (0.0%) | 0 (0.0%) |
| 25 to 29 Years | 3 (100.0%) | 0 (0.0%) |
| 30 to 34 Years | 7 (33.3%) | 0 (0.0%) |
| 35 to 44 Years | 30 (73.2%) | 0 (0.0%) |
| 45 to 54 Years | 12 (92.3%) | 0 (0.0%) |
| 55 to 59 Years | 0 (0.0%) | 0 (0.0%) |
| 60 to 64 Years | 17 (51.5%) | 0 (0.0%) |
| 65 to 74 Years | 9 (15.8%) | 2 (22.2%) |
| 75 Years and over | 1 (1.7%) | 0 (0.0%) |
| Total | 79 (34.5%) | 2 (2.5%) |
Employment Status by Educational Attainment in Camp Sherman
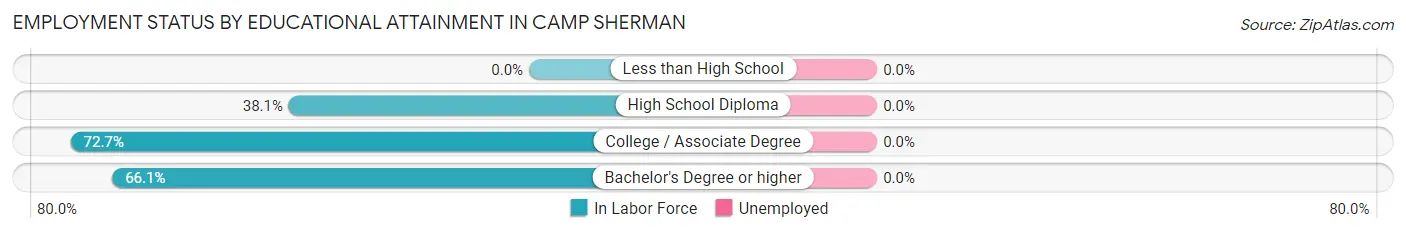
| Educational Attainment | In Labor Force | Unemployed |
| Less than High School | 0 (0.0%) | 0 (0.0%) |
| High School Diploma | 8 (38.1%) | 0 (0.0%) |
| College / Associate Degree | 24 (72.7%) | 0 (0.0%) |
| Bachelor's Degree or higher | 37 (66.1%) | 0 (0.0%) |
| Total | 69 (62.2%) | 0 (0.0%) |
Employment Occupations by Sex in Camp Sherman
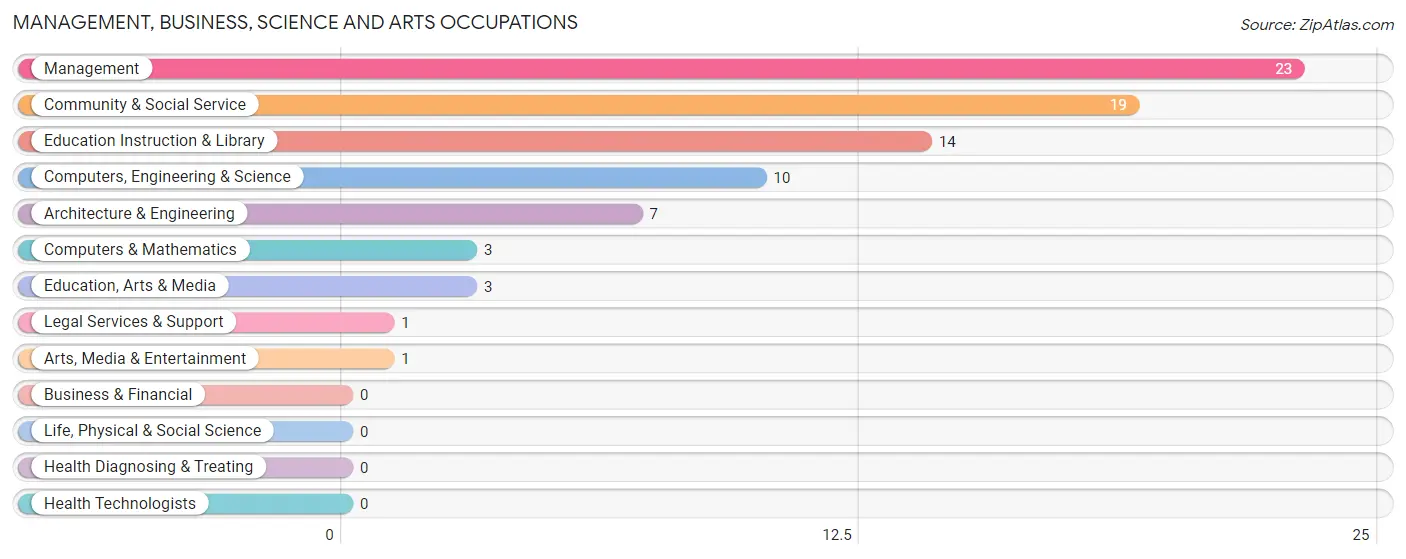
Management, Business, Science and Arts Occupations
The most common Management, Business, Science and Arts occupations in Camp Sherman are Management (23 | 29.9%), Community & Social Service (19 | 24.7%), Education Instruction & Library (14 | 18.2%), Computers, Engineering & Science (10 | 13.0%), and Architecture & Engineering (7 | 9.1%).
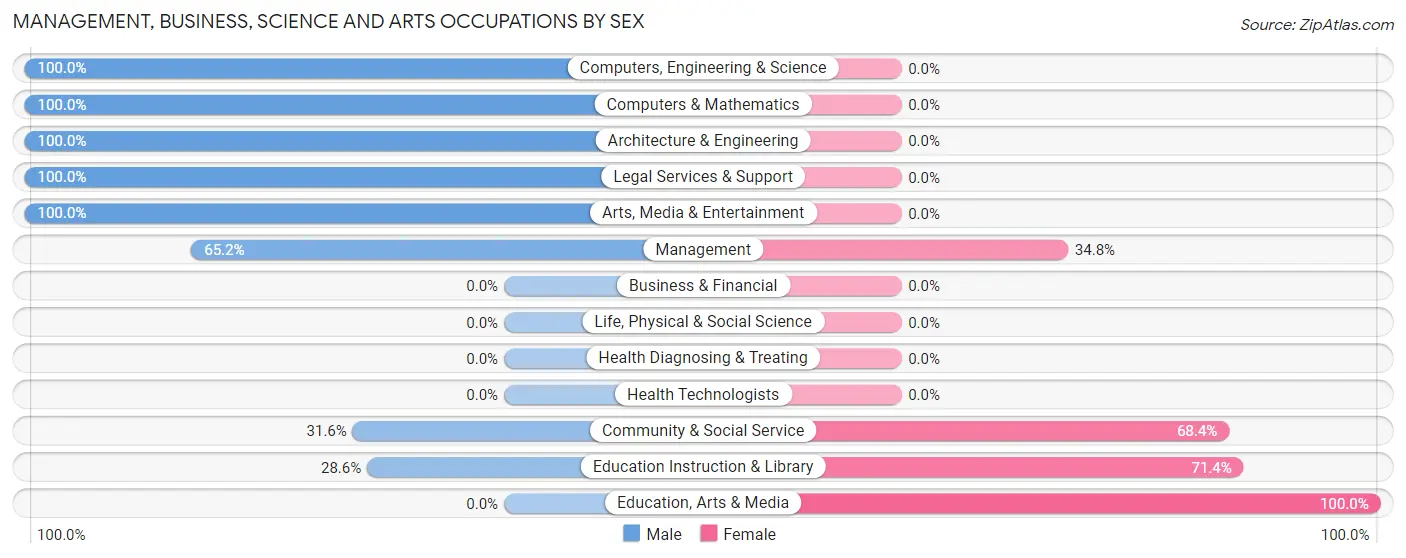
Management, Business, Science and Arts Occupations by Sex
Within the Management, Business, Science and Arts occupations in Camp Sherman, the most male-oriented occupations are Computers, Engineering & Science (100.0%), Computers & Mathematics (100.0%), and Architecture & Engineering (100.0%), while the most female-oriented occupations are Education, Arts & Media (100.0%), Education Instruction & Library (71.4%), and Community & Social Service (68.4%).
| Occupation | Male | Female |
| Management | 15 (65.2%) | 8 (34.8%) |
| Business & Financial | 0 (0.0%) | 0 (0.0%) |
| Computers, Engineering & Science | 10 (100.0%) | 0 (0.0%) |
| Computers & Mathematics | 3 (100.0%) | 0 (0.0%) |
| Architecture & Engineering | 7 (100.0%) | 0 (0.0%) |
| Life, Physical & Social Science | 0 (0.0%) | 0 (0.0%) |
| Community & Social Service | 6 (31.6%) | 13 (68.4%) |
| Education, Arts & Media | 0 (0.0%) | 3 (100.0%) |
| Legal Services & Support | 1 (100.0%) | 0 (0.0%) |
| Education Instruction & Library | 4 (28.6%) | 10 (71.4%) |
| Arts, Media & Entertainment | 1 (100.0%) | 0 (0.0%) |
| Health Diagnosing & Treating | 0 (0.0%) | 0 (0.0%) |
| Health Technologists | 0 (0.0%) | 0 (0.0%) |
| Total (Category) | 31 (59.6%) | 21 (40.4%) |
| Total (Overall) | 45 (58.4%) | 32 (41.6%) |
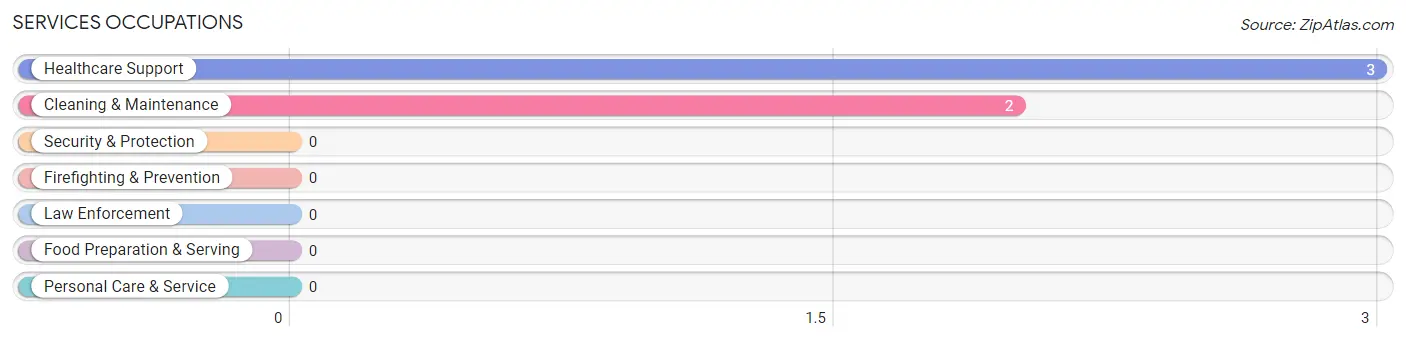
Services Occupations
The most common Services occupations in Camp Sherman are Healthcare Support (3 | 3.9%), and Cleaning & Maintenance (2 | 2.6%).
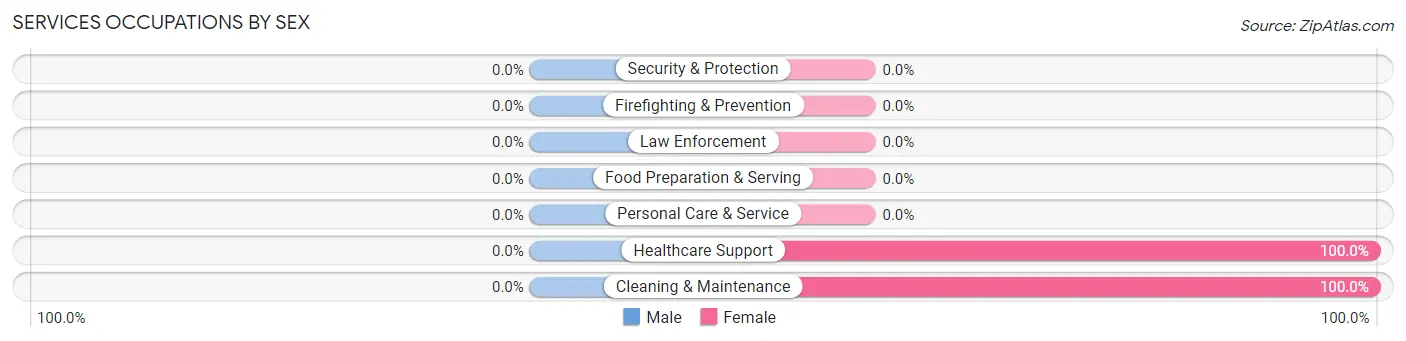
Services Occupations by Sex
| Occupation | Male | Female |
| Healthcare Support | 0 (0.0%) | 3 (100.0%) |
| Security & Protection | 0 (0.0%) | 0 (0.0%) |
| Firefighting & Prevention | 0 (0.0%) | 0 (0.0%) |
| Law Enforcement | 0 (0.0%) | 0 (0.0%) |
| Food Preparation & Serving | 0 (0.0%) | 0 (0.0%) |
| Cleaning & Maintenance | 0 (0.0%) | 2 (100.0%) |
| Personal Care & Service | 0 (0.0%) | 0 (0.0%) |
| Total (Category) | 0 (0.0%) | 5 (100.0%) |
| Total (Overall) | 45 (58.4%) | 32 (41.6%) |
Sales and Office Occupations
The most common Sales and Office occupations in Camp Sherman are , and Sales & Related (1 | 1.3%).
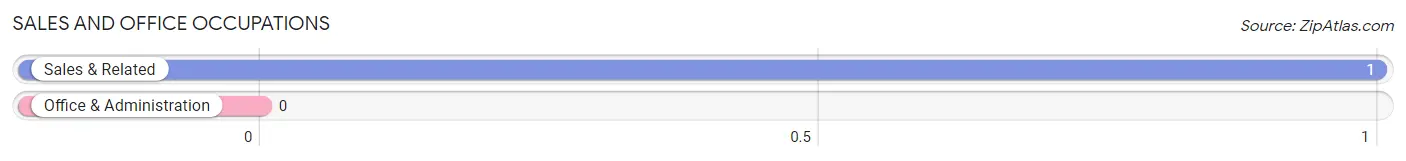
Sales and Office Occupations by Sex
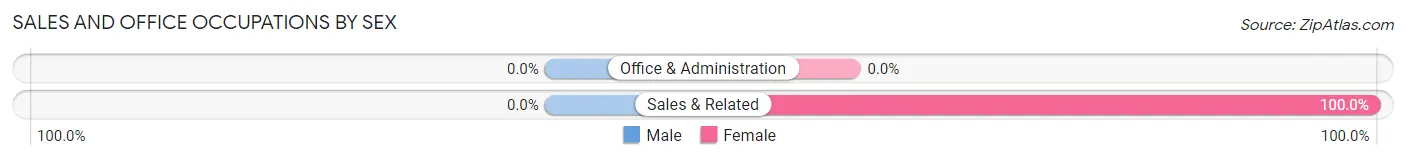
| Occupation | Male | Female |
| Sales & Related | 0 (0.0%) | 1 (100.0%) |
| Office & Administration | 0 (0.0%) | 0 (0.0%) |
| Total (Category) | 0 (0.0%) | 1 (100.0%) |
| Total (Overall) | 45 (58.4%) | 32 (41.6%) |
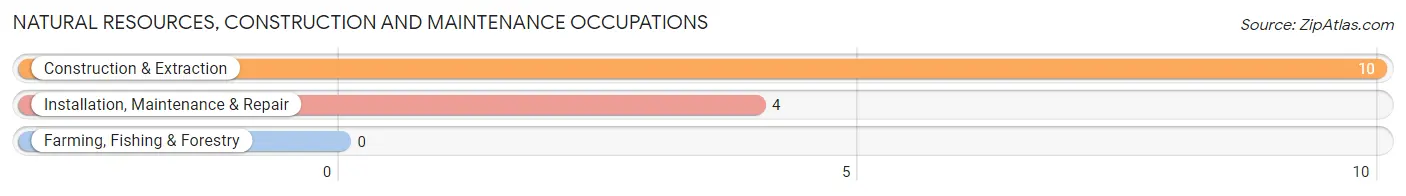
Natural Resources, Construction and Maintenance Occupations
The most common Natural Resources, Construction and Maintenance occupations in Camp Sherman are Construction & Extraction (10 | 13.0%), and Installation, Maintenance & Repair (4 | 5.2%).
Natural Resources, Construction and Maintenance Occupations by Sex
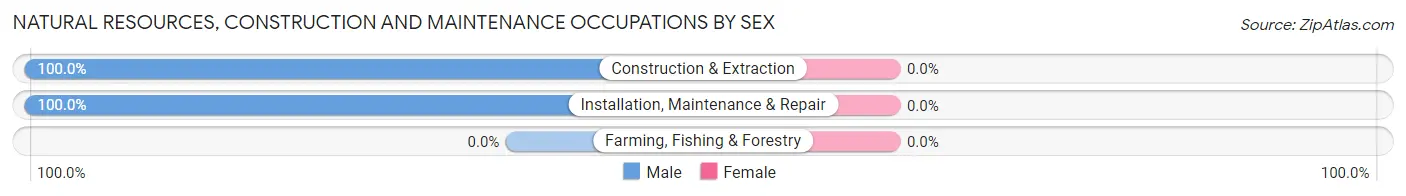
| Occupation | Male | Female |
| Farming, Fishing & Forestry | 0 (0.0%) | 0 (0.0%) |
| Construction & Extraction | 10 (100.0%) | 0 (0.0%) |
| Installation, Maintenance & Repair | 4 (100.0%) | 0 (0.0%) |
| Total (Category) | 14 (100.0%) | 0 (0.0%) |
| Total (Overall) | 45 (58.4%) | 32 (41.6%) |
Production, Transportation and Moving Occupations
The most common Production, Transportation and Moving occupations in Camp Sherman are , and Production (5 | 6.5%).
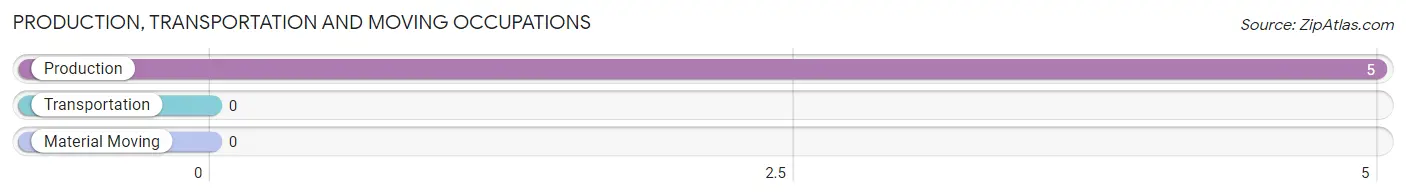
Production, Transportation and Moving Occupations by Sex
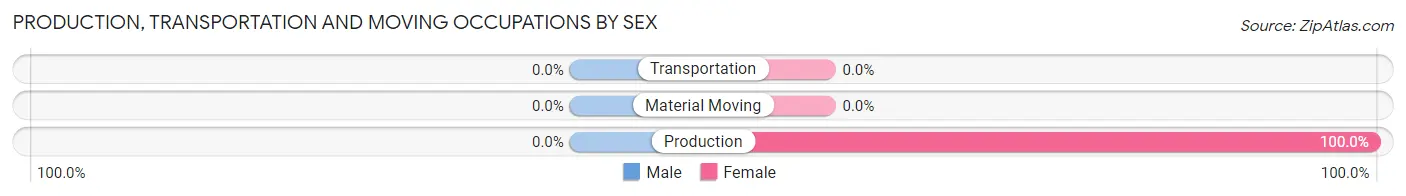
| Occupation | Male | Female |
| Production | 0 (0.0%) | 5 (100.0%) |
| Transportation | 0 (0.0%) | 0 (0.0%) |
| Material Moving | 0 (0.0%) | 0 (0.0%) |
| Total (Category) | 0 (0.0%) | 5 (100.0%) |
| Total (Overall) | 45 (58.4%) | 32 (41.6%) |
Employment Industries by Sex in Camp Sherman
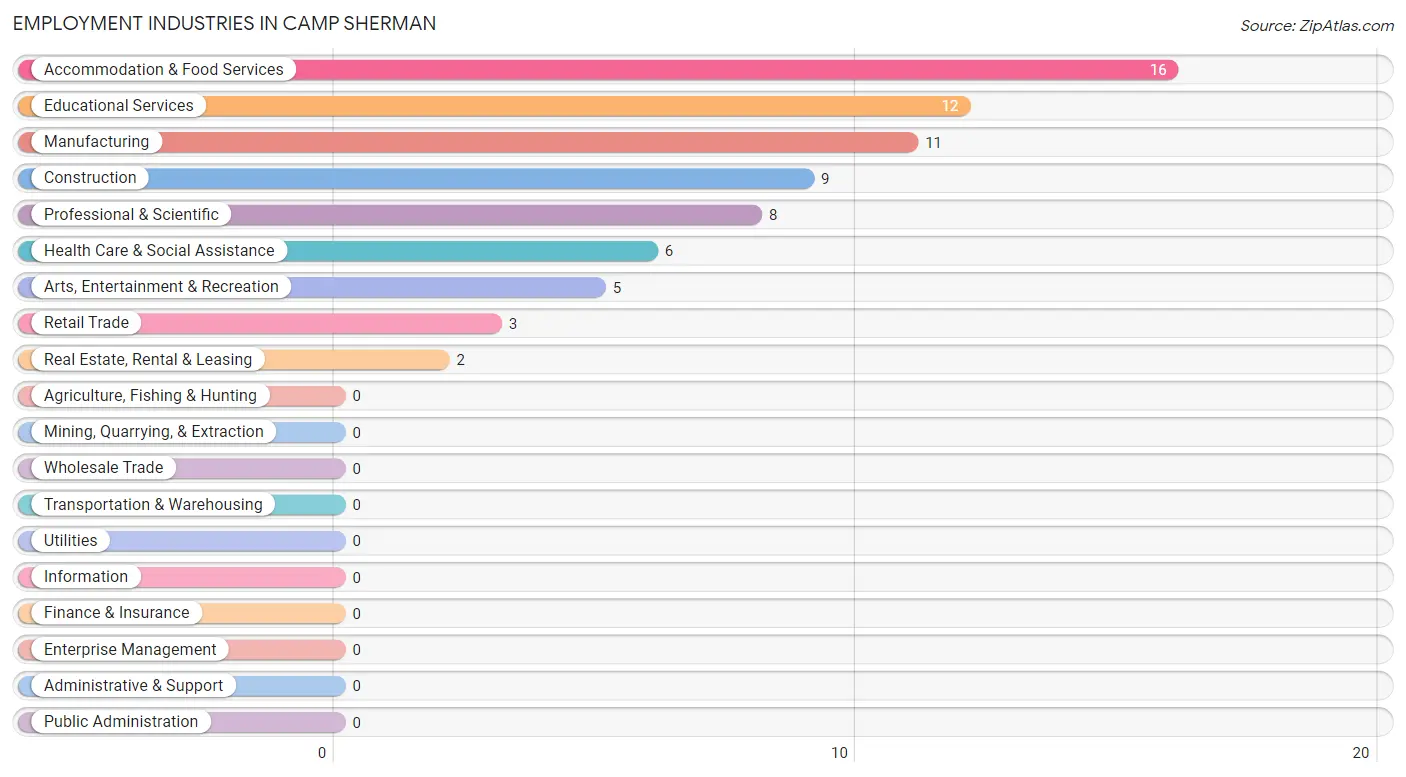
Employment Industries in Camp Sherman
The major employment industries in Camp Sherman include Accommodation & Food Services (16 | 20.8%), Educational Services (12 | 15.6%), Manufacturing (11 | 14.3%), Construction (9 | 11.7%), and Professional & Scientific (8 | 10.4%).
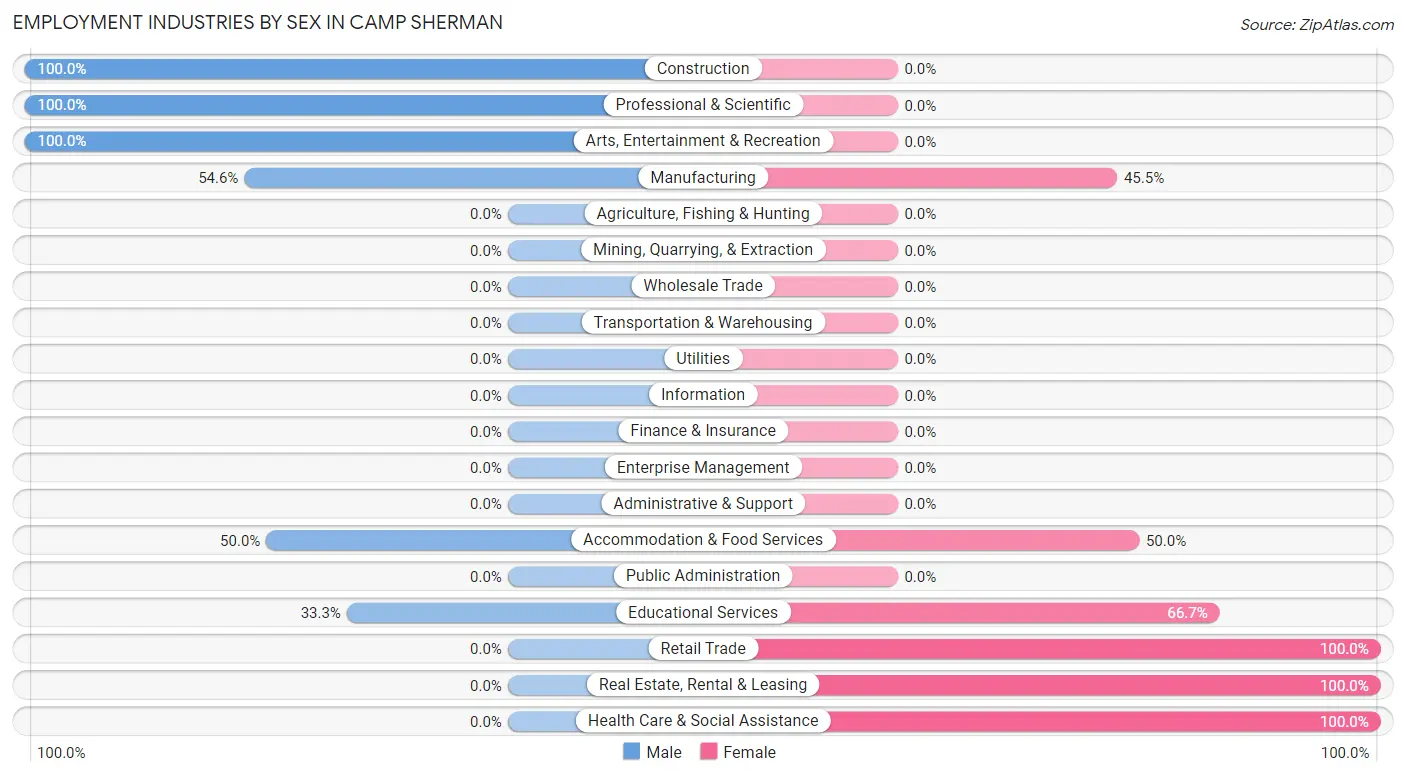
Employment Industries by Sex in Camp Sherman
The Camp Sherman industries that see more men than women are Construction (100.0%), Professional & Scientific (100.0%), and Arts, Entertainment & Recreation (100.0%), whereas the industries that tend to have a higher number of women are Retail Trade (100.0%), Real Estate, Rental & Leasing (100.0%), and Health Care & Social Assistance (100.0%).
| Industry | Male | Female |
| Agriculture, Fishing & Hunting | 0 (0.0%) | 0 (0.0%) |
| Mining, Quarrying, & Extraction | 0 (0.0%) | 0 (0.0%) |
| Construction | 9 (100.0%) | 0 (0.0%) |
| Manufacturing | 6 (54.5%) | 5 (45.5%) |
| Wholesale Trade | 0 (0.0%) | 0 (0.0%) |
| Retail Trade | 0 (0.0%) | 3 (100.0%) |
| Transportation & Warehousing | 0 (0.0%) | 0 (0.0%) |
| Utilities | 0 (0.0%) | 0 (0.0%) |
| Information | 0 (0.0%) | 0 (0.0%) |
| Finance & Insurance | 0 (0.0%) | 0 (0.0%) |
| Real Estate, Rental & Leasing | 0 (0.0%) | 2 (100.0%) |
| Professional & Scientific | 8 (100.0%) | 0 (0.0%) |
| Enterprise Management | 0 (0.0%) | 0 (0.0%) |
| Administrative & Support | 0 (0.0%) | 0 (0.0%) |
| Educational Services | 4 (33.3%) | 8 (66.7%) |
| Health Care & Social Assistance | 0 (0.0%) | 6 (100.0%) |
| Arts, Entertainment & Recreation | 5 (100.0%) | 0 (0.0%) |
| Accommodation & Food Services | 8 (50.0%) | 8 (50.0%) |
| Public Administration | 0 (0.0%) | 0 (0.0%) |
| Total | 45 (58.4%) | 32 (41.6%) |
Education in Camp Sherman
School Enrollment in Camp Sherman
The most common levels of schooling among the 27 students in Camp Sherman are elementary school (8 | 29.6%), middle school (7 | 25.9%), and nursery / preschool (6 | 22.2%).
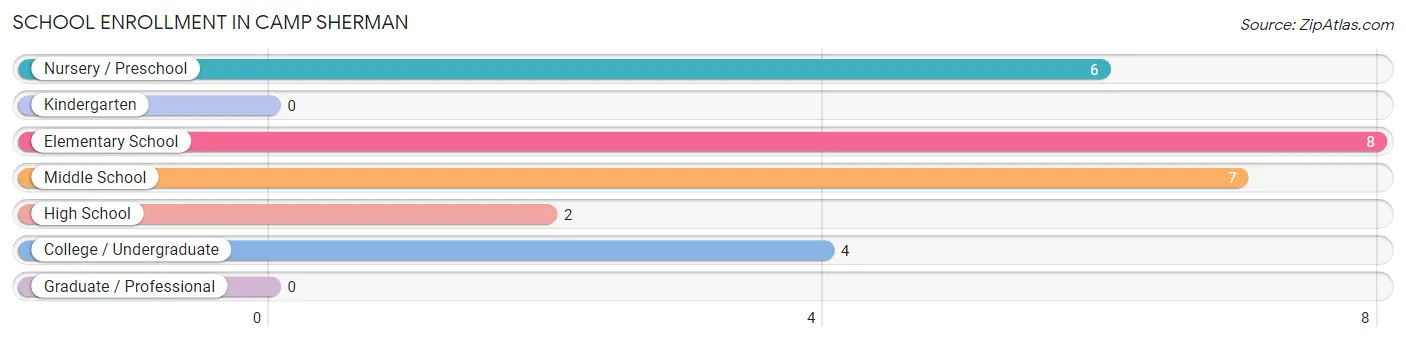
| School Level | # Students | % Students |
| Nursery / Preschool | 6 | 22.2% |
| Kindergarten | 0 | 0.0% |
| Elementary School | 8 | 29.6% |
| Middle School | 7 | 25.9% |
| High School | 2 | 7.4% |
| College / Undergraduate | 4 | 14.8% |
| Graduate / Professional | 0 | 0.0% |
| Total | 27 | 100.0% |
School Enrollment by Age by Funding Source in Camp Sherman
Out of a total of 27 students who are enrolled in schools in Camp Sherman, 6 (22.2%) attend a private institution, while the remaining 21 (77.8%) are enrolled in public schools. The age group of 3 to 4 year olds has the highest likelihood of being enrolled in private schools, with 3 (100.0% in the age bracket) enrolled. Conversely, the age group of 10 to 14 year olds has the lowest likelihood of being enrolled in a private school, with 11 (100.0% in the age bracket) attending a public institution.
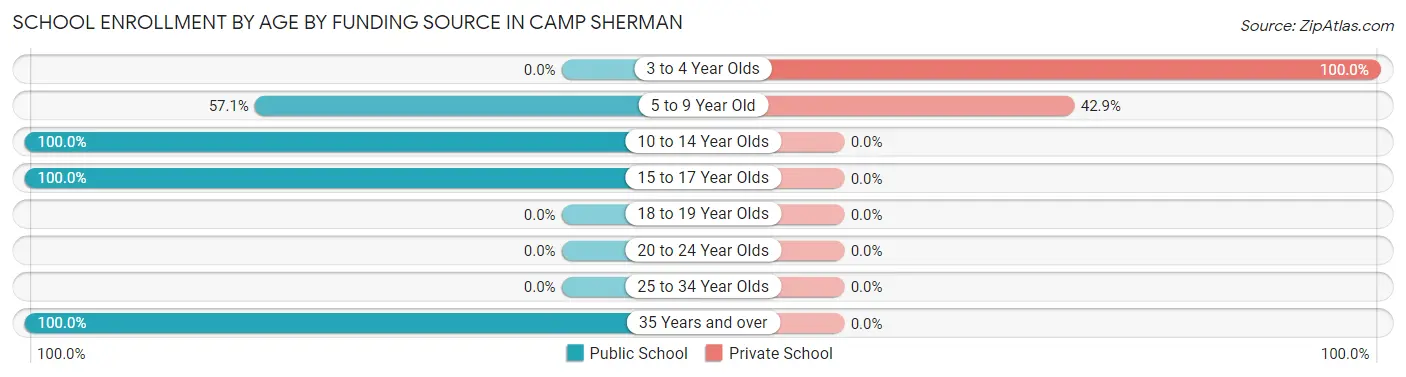
| Age Bracket | Public School | Private School |
| 3 to 4 Year Olds | 0 (0.0%) | 3 (100.0%) |
| 5 to 9 Year Old | 4 (57.1%) | 3 (42.9%) |
| 10 to 14 Year Olds | 11 (100.0%) | 0 (0.0%) |
| 15 to 17 Year Olds | 2 (100.0%) | 0 (0.0%) |
| 18 to 19 Year Olds | 0 (0.0%) | 0 (0.0%) |
| 20 to 24 Year Olds | 0 (0.0%) | 0 (0.0%) |
| 25 to 34 Year Olds | 0 (0.0%) | 0 (0.0%) |
| 35 Years and over | 4 (100.0%) | 0 (0.0%) |
| Total | 21 (77.8%) | 6 (22.2%) |
Educational Attainment by Field of Study in Camp Sherman
Science & technology (27 | 16.9%), engineering (22 | 13.8%), social sciences (17 | 10.6%), bio, nature & agricultural (15 | 9.4%), and physical & health sciences (15 | 9.4%) are the most common fields of study among 160 individuals in Camp Sherman who have obtained a bachelor's degree or higher.
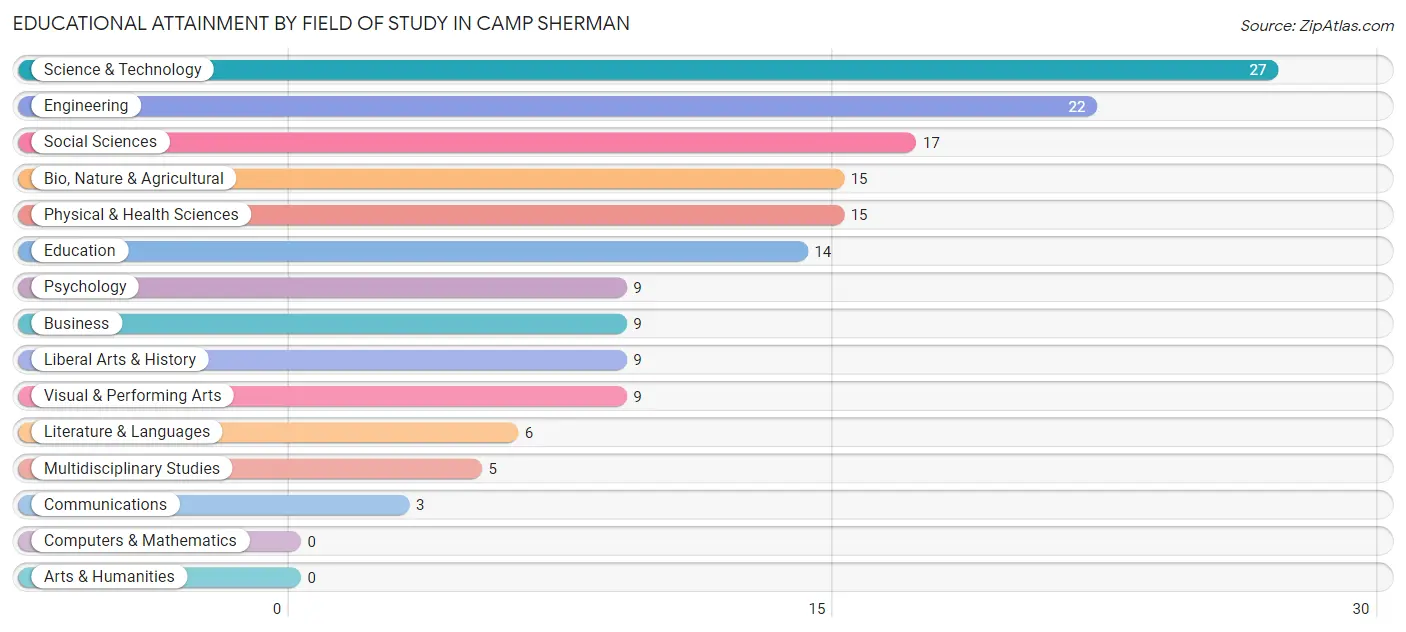
| Field of Study | # Graduates | % Graduates |
| Computers & Mathematics | 0 | 0.0% |
| Bio, Nature & Agricultural | 15 | 9.4% |
| Physical & Health Sciences | 15 | 9.4% |
| Psychology | 9 | 5.6% |
| Social Sciences | 17 | 10.6% |
| Engineering | 22 | 13.8% |
| Multidisciplinary Studies | 5 | 3.1% |
| Science & Technology | 27 | 16.9% |
| Business | 9 | 5.6% |
| Education | 14 | 8.7% |
| Literature & Languages | 6 | 3.7% |
| Liberal Arts & History | 9 | 5.6% |
| Visual & Performing Arts | 9 | 5.6% |
| Communications | 3 | 1.9% |
| Arts & Humanities | 0 | 0.0% |
| Total | 160 | 100.0% |
Transportation & Commute in Camp Sherman
Vehicle Availability by Sex in Camp Sherman
The most prevalent vehicle ownership categories in Camp Sherman are males with 2 vehicles (18, accounting for 40.0%) and females with 2 vehicles (18, making up 56.2%).
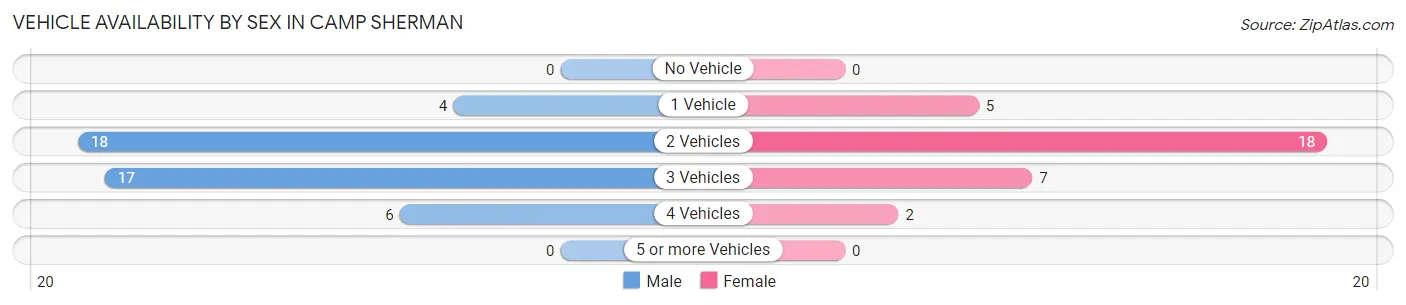
| Vehicles Available | Male | Female |
| No Vehicle | 0 (0.0%) | 0 (0.0%) |
| 1 Vehicle | 4 (8.9%) | 5 (15.6%) |
| 2 Vehicles | 18 (40.0%) | 18 (56.2%) |
| 3 Vehicles | 17 (37.8%) | 7 (21.9%) |
| 4 Vehicles | 6 (13.3%) | 2 (6.2%) |
| 5 or more Vehicles | 0 (0.0%) | 0 (0.0%) |
| Total | 45 (100.0%) | 32 (100.0%) |
Commute Time in Camp Sherman
The most frequently occuring commute durations in Camp Sherman are 30 to 34 minutes (12 commuters, 24.5%), 45 to 59 minutes (8 commuters, 16.3%), and less than 5 minutes (7 commuters, 14.3%).
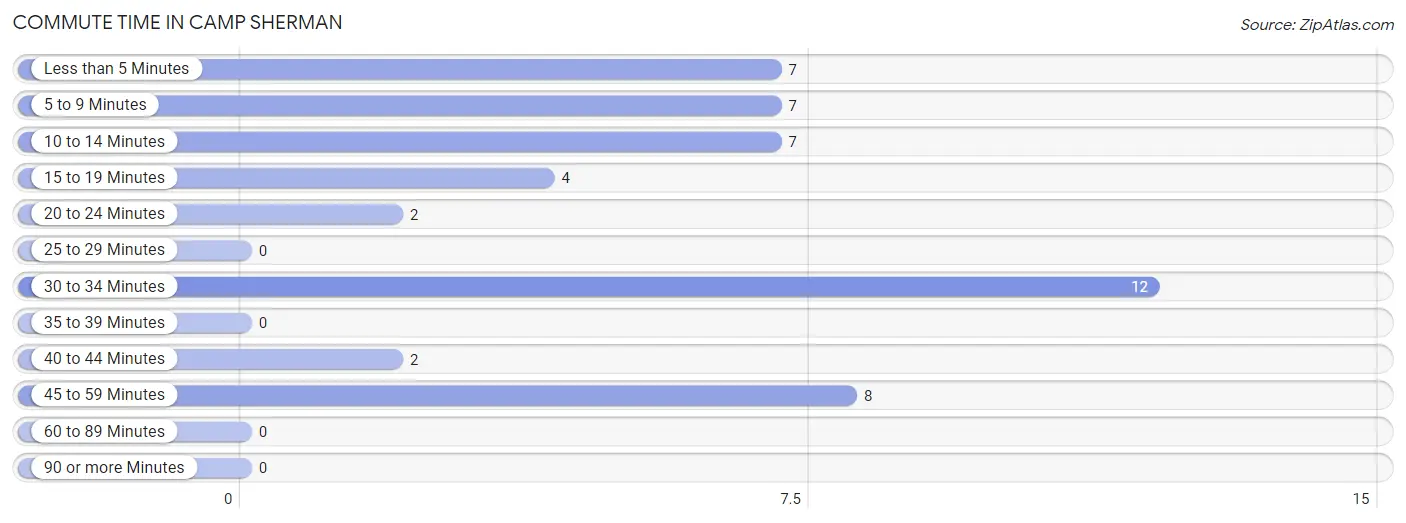
| Commute Time | # Commuters | % Commuters |
| Less than 5 Minutes | 7 | 14.3% |
| 5 to 9 Minutes | 7 | 14.3% |
| 10 to 14 Minutes | 7 | 14.3% |
| 15 to 19 Minutes | 4 | 8.2% |
| 20 to 24 Minutes | 2 | 4.1% |
| 25 to 29 Minutes | 0 | 0.0% |
| 30 to 34 Minutes | 12 | 24.5% |
| 35 to 39 Minutes | 0 | 0.0% |
| 40 to 44 Minutes | 2 | 4.1% |
| 45 to 59 Minutes | 8 | 16.3% |
| 60 to 89 Minutes | 0 | 0.0% |
| 90 or more Minutes | 0 | 0.0% |
Commute Time by Sex in Camp Sherman
The most common commute times in Camp Sherman are 30 to 34 minutes (9 commuters, 29.0%) for males and 45 to 59 minutes (8 commuters, 44.4%) for females.
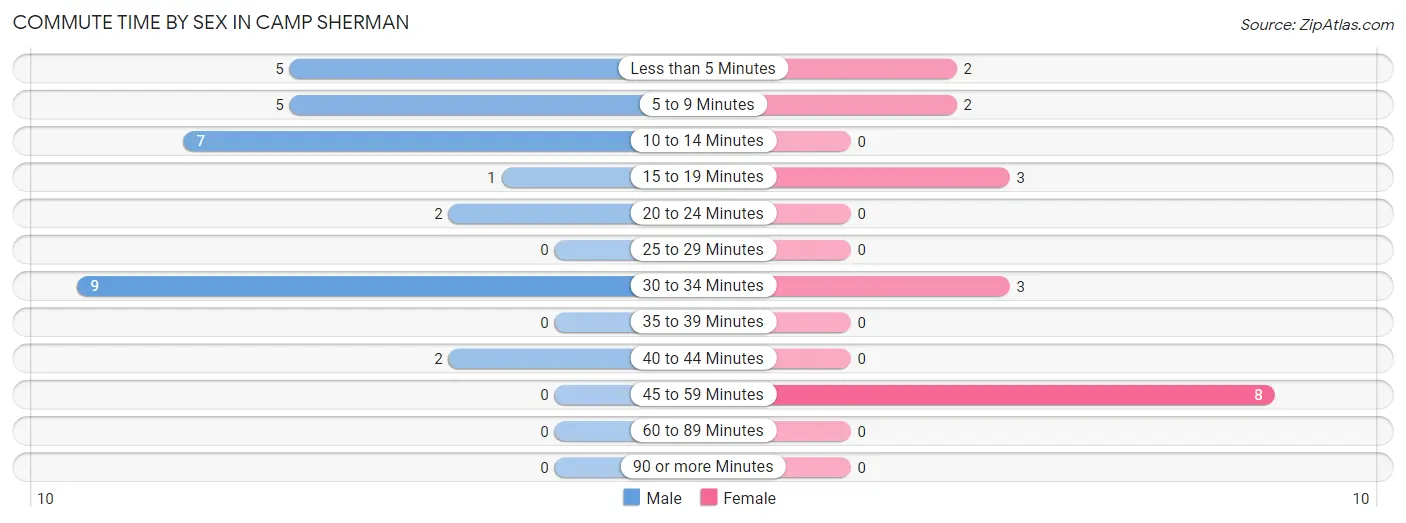
| Commute Time | Male | Female |
| Less than 5 Minutes | 5 (16.1%) | 2 (11.1%) |
| 5 to 9 Minutes | 5 (16.1%) | 2 (11.1%) |
| 10 to 14 Minutes | 7 (22.6%) | 0 (0.0%) |
| 15 to 19 Minutes | 1 (3.2%) | 3 (16.7%) |
| 20 to 24 Minutes | 2 (6.5%) | 0 (0.0%) |
| 25 to 29 Minutes | 0 (0.0%) | 0 (0.0%) |
| 30 to 34 Minutes | 9 (29.0%) | 3 (16.7%) |
| 35 to 39 Minutes | 0 (0.0%) | 0 (0.0%) |
| 40 to 44 Minutes | 2 (6.5%) | 0 (0.0%) |
| 45 to 59 Minutes | 0 (0.0%) | 8 (44.4%) |
| 60 to 89 Minutes | 0 (0.0%) | 0 (0.0%) |
| 90 or more Minutes | 0 (0.0%) | 0 (0.0%) |
Time of Departure to Work by Sex in Camp Sherman
The most frequent times of departure to work in Camp Sherman are 9:00 AM to 9:59 AM (7, 22.6%) for males and 9:00 AM to 9:59 AM (6, 33.3%) for females.
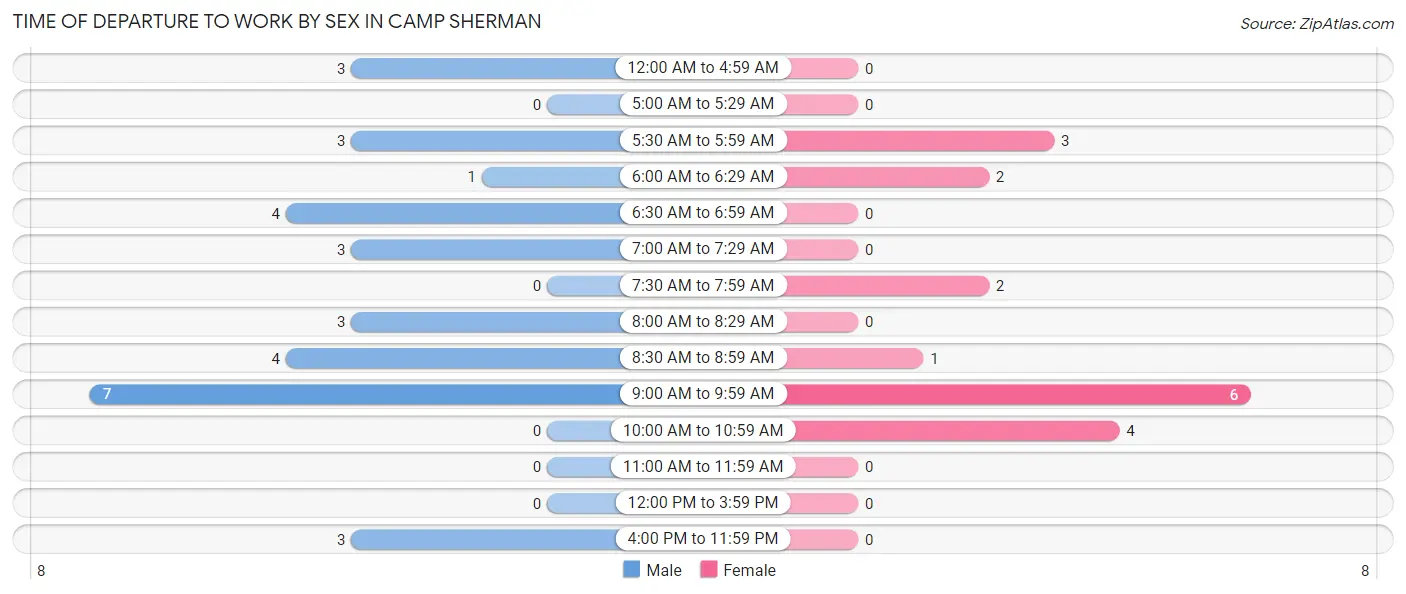
| Time of Departure | Male | Female |
| 12:00 AM to 4:59 AM | 3 (9.7%) | 0 (0.0%) |
| 5:00 AM to 5:29 AM | 0 (0.0%) | 0 (0.0%) |
| 5:30 AM to 5:59 AM | 3 (9.7%) | 3 (16.7%) |
| 6:00 AM to 6:29 AM | 1 (3.2%) | 2 (11.1%) |
| 6:30 AM to 6:59 AM | 4 (12.9%) | 0 (0.0%) |
| 7:00 AM to 7:29 AM | 3 (9.7%) | 0 (0.0%) |
| 7:30 AM to 7:59 AM | 0 (0.0%) | 2 (11.1%) |
| 8:00 AM to 8:29 AM | 3 (9.7%) | 0 (0.0%) |
| 8:30 AM to 8:59 AM | 4 (12.9%) | 1 (5.6%) |
| 9:00 AM to 9:59 AM | 7 (22.6%) | 6 (33.3%) |
| 10:00 AM to 10:59 AM | 0 (0.0%) | 4 (22.2%) |
| 11:00 AM to 11:59 AM | 0 (0.0%) | 0 (0.0%) |
| 12:00 PM to 3:59 PM | 0 (0.0%) | 0 (0.0%) |
| 4:00 PM to 11:59 PM | 3 (9.7%) | 0 (0.0%) |
| Total | 31 (100.0%) | 18 (100.0%) |
Housing Occupancy in Camp Sherman
Occupancy by Ownership in Camp Sherman
Of the total 120 dwellings in Camp Sherman, owner-occupied units account for 97 (80.8%), while renter-occupied units make up 23 (19.2%).
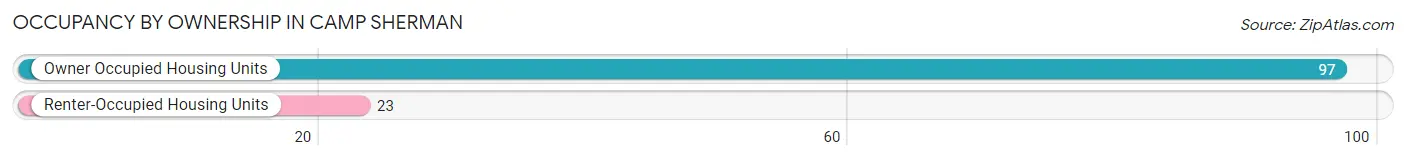
| Occupancy | # Housing Units | % Housing Units |
| Owner Occupied Housing Units | 97 | 80.8% |
| Renter-Occupied Housing Units | 23 | 19.2% |
| Total Occupied Housing Units | 120 | 100.0% |
Occupancy by Household Size in Camp Sherman
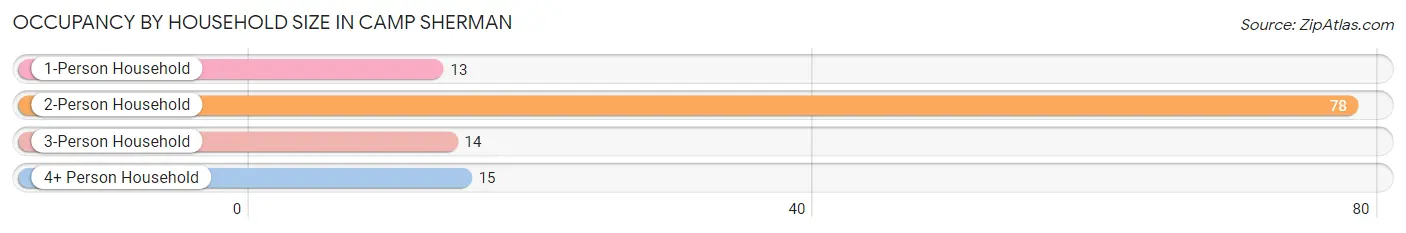
| Household Size | # Housing Units | % Housing Units |
| 1-Person Household | 13 | 10.8% |
| 2-Person Household | 78 | 65.0% |
| 3-Person Household | 14 | 11.7% |
| 4+ Person Household | 15 | 12.5% |
| Total Housing Units | 120 | 100.0% |
Occupancy by Ownership by Household Size in Camp Sherman
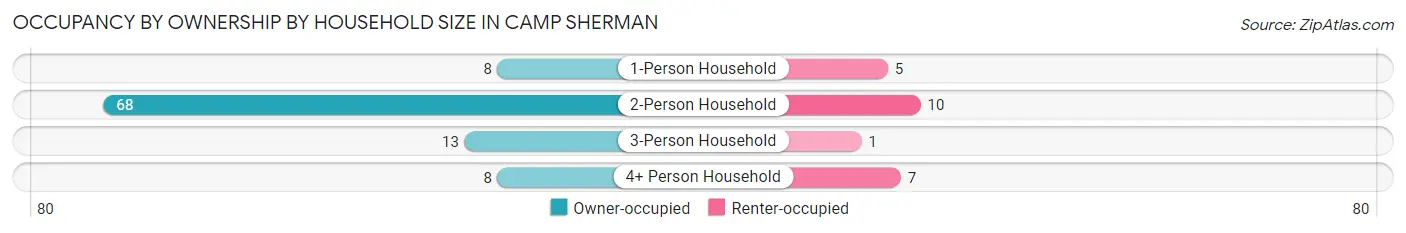
| Household Size | Owner-occupied | Renter-occupied |
| 1-Person Household | 8 (61.5%) | 5 (38.5%) |
| 2-Person Household | 68 (87.2%) | 10 (12.8%) |
| 3-Person Household | 13 (92.9%) | 1 (7.1%) |
| 4+ Person Household | 8 (53.3%) | 7 (46.7%) |
| Total Housing Units | 97 (80.8%) | 23 (19.2%) |
Occupancy by Educational Attainment in Camp Sherman
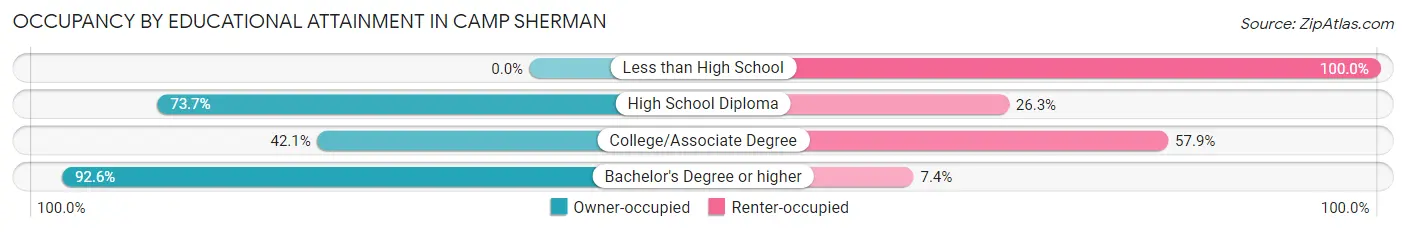
| Household Size | Owner-occupied | Renter-occupied |
| Less than High School | 0 (0.0%) | 1 (100.0%) |
| High School Diploma | 14 (73.7%) | 5 (26.3%) |
| College/Associate Degree | 8 (42.1%) | 11 (57.9%) |
| Bachelor's Degree or higher | 75 (92.6%) | 6 (7.4%) |
Occupancy by Age of Householder in Camp Sherman
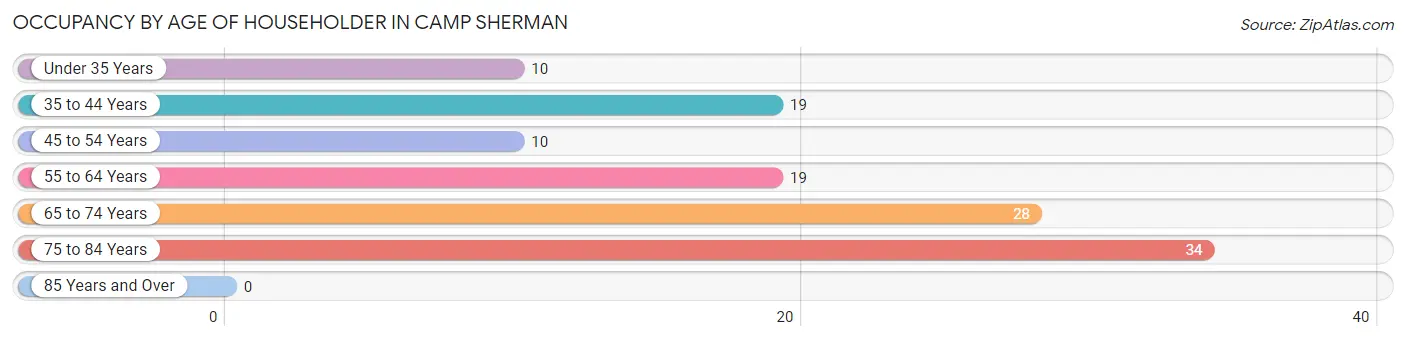
| Age Bracket | # Households | % Households |
| Under 35 Years | 10 | 8.3% |
| 35 to 44 Years | 19 | 15.8% |
| 45 to 54 Years | 10 | 8.3% |
| 55 to 64 Years | 19 | 15.8% |
| 65 to 74 Years | 28 | 23.3% |
| 75 to 84 Years | 34 | 28.3% |
| 85 Years and Over | 0 | 0.0% |
| Total | 120 | 100.0% |
Housing Finances in Camp Sherman
Median Income by Occupancy in Camp Sherman
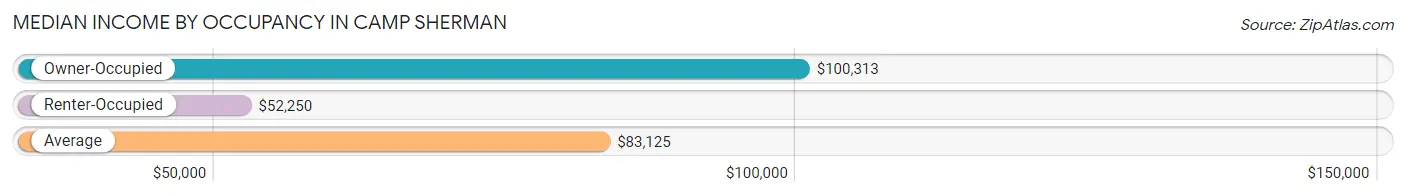
| Occupancy Type | # Households | Median Income |
| Owner-Occupied | 97 (80.8%) | $100,313 |
| Renter-Occupied | 23 (19.2%) | $52,250 |
| Average | 120 (100.0%) | $83,125 |
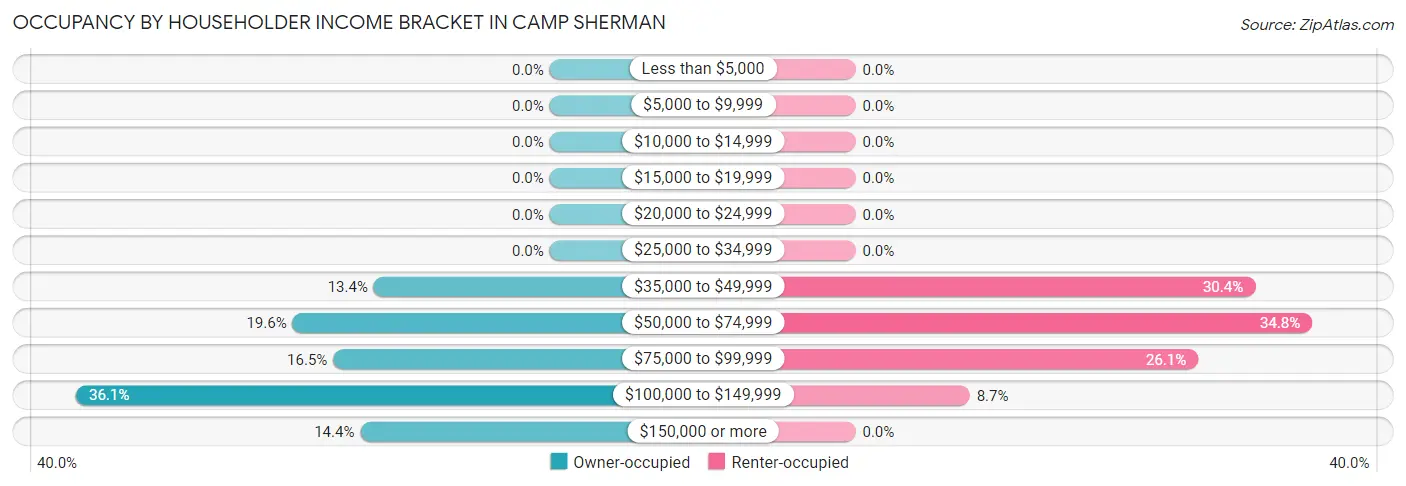
Occupancy by Householder Income Bracket in Camp Sherman
| Income Bracket | Owner-occupied | Renter-occupied |
| Less than $5,000 | 0 (0.0%) | 0 (0.0%) |
| $5,000 to $9,999 | 0 (0.0%) | 0 (0.0%) |
| $10,000 to $14,999 | 0 (0.0%) | 0 (0.0%) |
| $15,000 to $19,999 | 0 (0.0%) | 0 (0.0%) |
| $20,000 to $24,999 | 0 (0.0%) | 0 (0.0%) |
| $25,000 to $34,999 | 0 (0.0%) | 0 (0.0%) |
| $35,000 to $49,999 | 13 (13.4%) | 7 (30.4%) |
| $50,000 to $74,999 | 19 (19.6%) | 8 (34.8%) |
| $75,000 to $99,999 | 16 (16.5%) | 6 (26.1%) |
| $100,000 to $149,999 | 35 (36.1%) | 2 (8.7%) |
| $150,000 or more | 14 (14.4%) | 0 (0.0%) |
| Total | 97 (100.0%) | 23 (100.0%) |
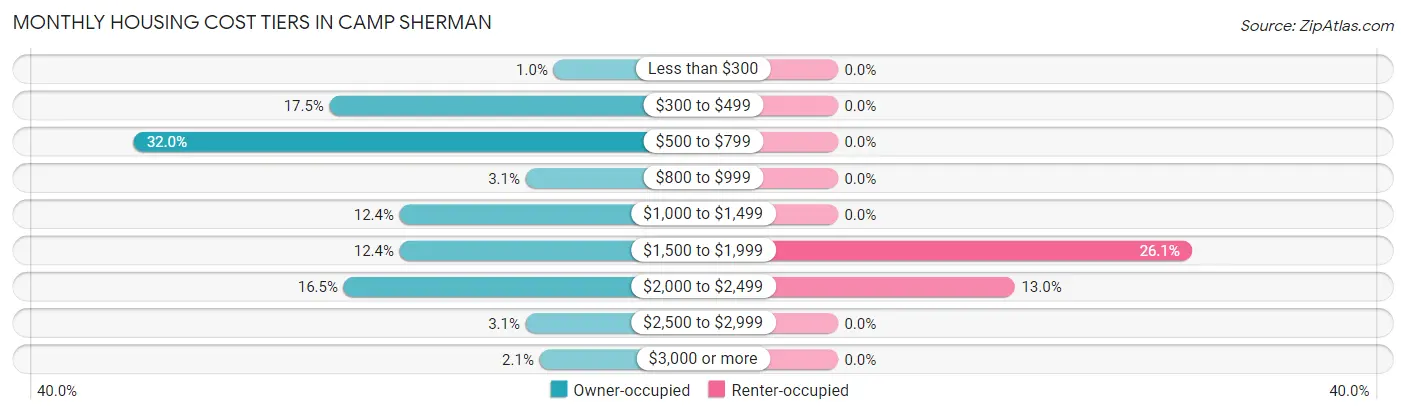
Monthly Housing Cost Tiers in Camp Sherman
| Monthly Cost | Owner-occupied | Renter-occupied |
| Less than $300 | 1 (1.0%) | 0 (0.0%) |
| $300 to $499 | 17 (17.5%) | 0 (0.0%) |
| $500 to $799 | 31 (32.0%) | 0 (0.0%) |
| $800 to $999 | 3 (3.1%) | 0 (0.0%) |
| $1,000 to $1,499 | 12 (12.4%) | 0 (0.0%) |
| $1,500 to $1,999 | 12 (12.4%) | 6 (26.1%) |
| $2,000 to $2,499 | 16 (16.5%) | 3 (13.0%) |
| $2,500 to $2,999 | 3 (3.1%) | 0 (0.0%) |
| $3,000 or more | 2 (2.1%) | 0 (0.0%) |
| Total | 97 (100.0%) | 23 (100.0%) |
Physical Housing Characteristics in Camp Sherman
Housing Structures in Camp Sherman
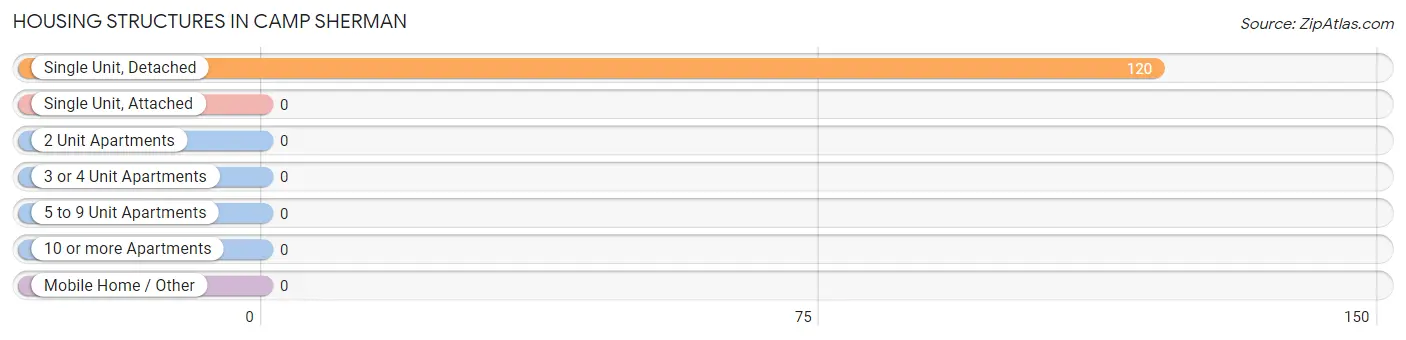
| Structure Type | # Housing Units | % Housing Units |
| Single Unit, Detached | 120 | 100.0% |
| Single Unit, Attached | 0 | 0.0% |
| 2 Unit Apartments | 0 | 0.0% |
| 3 or 4 Unit Apartments | 0 | 0.0% |
| 5 to 9 Unit Apartments | 0 | 0.0% |
| 10 or more Apartments | 0 | 0.0% |
| Mobile Home / Other | 0 | 0.0% |
| Total | 120 | 100.0% |
Housing Structures by Occupancy in Camp Sherman
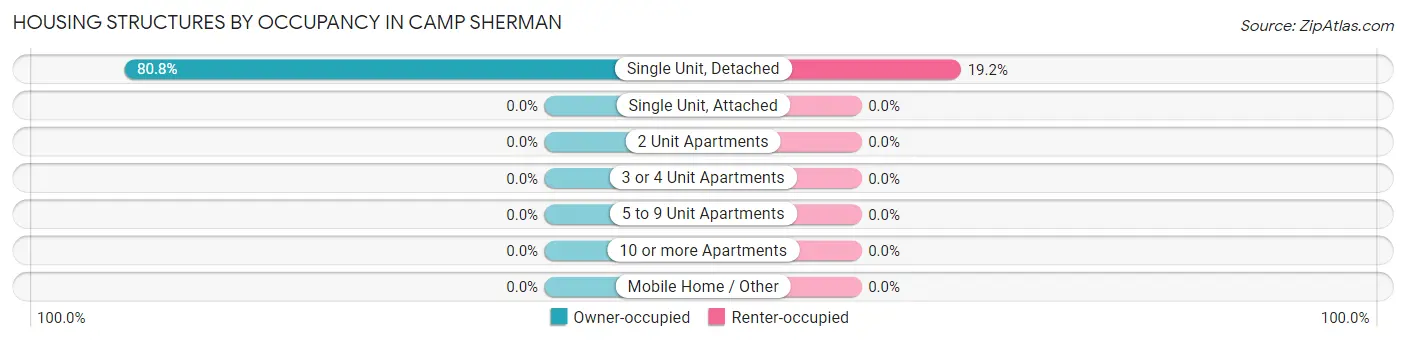
| Structure Type | Owner-occupied | Renter-occupied |
| Single Unit, Detached | 97 (80.8%) | 23 (19.2%) |
| Single Unit, Attached | 0 (0.0%) | 0 (0.0%) |
| 2 Unit Apartments | 0 (0.0%) | 0 (0.0%) |
| 3 or 4 Unit Apartments | 0 (0.0%) | 0 (0.0%) |
| 5 to 9 Unit Apartments | 0 (0.0%) | 0 (0.0%) |
| 10 or more Apartments | 0 (0.0%) | 0 (0.0%) |
| Mobile Home / Other | 0 (0.0%) | 0 (0.0%) |
| Total | 97 (80.8%) | 23 (19.2%) |
Housing Structures by Number of Rooms in Camp Sherman
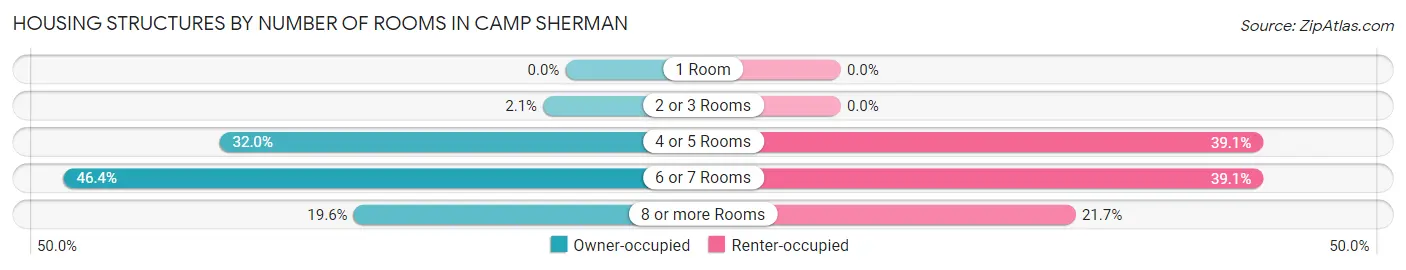
| Number of Rooms | Owner-occupied | Renter-occupied |
| 1 Room | 0 (0.0%) | 0 (0.0%) |
| 2 or 3 Rooms | 2 (2.1%) | 0 (0.0%) |
| 4 or 5 Rooms | 31 (32.0%) | 9 (39.1%) |
| 6 or 7 Rooms | 45 (46.4%) | 9 (39.1%) |
| 8 or more Rooms | 19 (19.6%) | 5 (21.7%) |
| Total | 97 (100.0%) | 23 (100.0%) |
Housing Structure by Heating Type in Camp Sherman
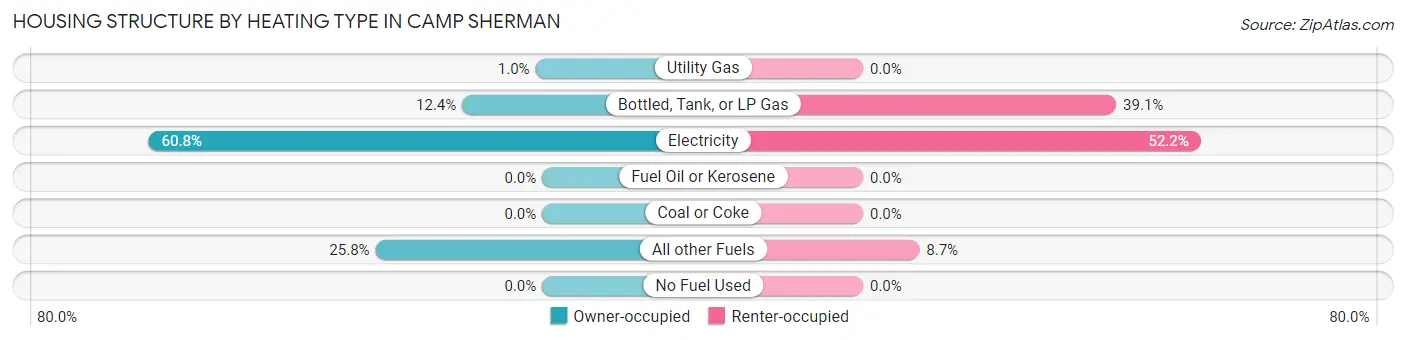
| Heating Type | Owner-occupied | Renter-occupied |
| Utility Gas | 1 (1.0%) | 0 (0.0%) |
| Bottled, Tank, or LP Gas | 12 (12.4%) | 9 (39.1%) |
| Electricity | 59 (60.8%) | 12 (52.2%) |
| Fuel Oil or Kerosene | 0 (0.0%) | 0 (0.0%) |
| Coal or Coke | 0 (0.0%) | 0 (0.0%) |
| All other Fuels | 25 (25.8%) | 2 (8.7%) |
| No Fuel Used | 0 (0.0%) | 0 (0.0%) |
| Total | 97 (100.0%) | 23 (100.0%) |
Household Vehicle Usage in Camp Sherman
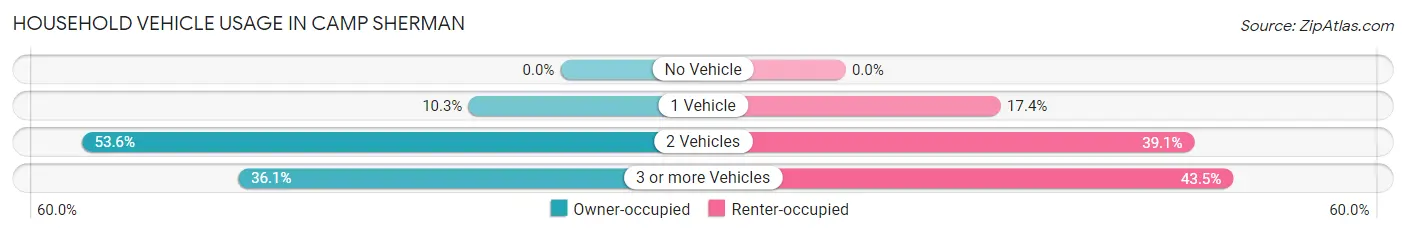
| Vehicles per Household | Owner-occupied | Renter-occupied |
| No Vehicle | 0 (0.0%) | 0 (0.0%) |
| 1 Vehicle | 10 (10.3%) | 4 (17.4%) |
| 2 Vehicles | 52 (53.6%) | 9 (39.1%) |
| 3 or more Vehicles | 35 (36.1%) | 10 (43.5%) |
| Total | 97 (100.0%) | 23 (100.0%) |
Real Estate & Mortgages in Camp Sherman
Real Estate and Mortgage Overview in Camp Sherman
| Characteristic | Without Mortgage | With Mortgage |
| Housing Units | 56 | 41 |
| Median Property Value | $590,000 | $625,000 |
| Median Household Income | $91,250 | $0 |
| Monthly Housing Costs | $571 | $2 |
| Real Estate Taxes | $3,545 | $0 |
Property Value by Mortgage Status in Camp Sherman
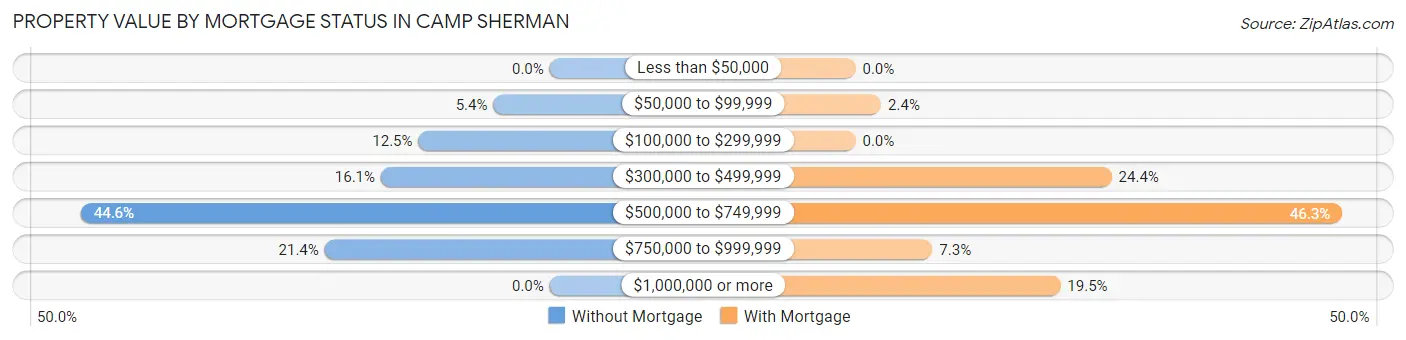
| Property Value | Without Mortgage | With Mortgage |
| Less than $50,000 | 0 (0.0%) | 0 (0.0%) |
| $50,000 to $99,999 | 3 (5.4%) | 1 (2.4%) |
| $100,000 to $299,999 | 7 (12.5%) | 0 (0.0%) |
| $300,000 to $499,999 | 9 (16.1%) | 10 (24.4%) |
| $500,000 to $749,999 | 25 (44.6%) | 19 (46.3%) |
| $750,000 to $999,999 | 12 (21.4%) | 3 (7.3%) |
| $1,000,000 or more | 0 (0.0%) | 8 (19.5%) |
| Total | 56 (100.0%) | 41 (100.0%) |
Household Income by Mortgage Status in Camp Sherman
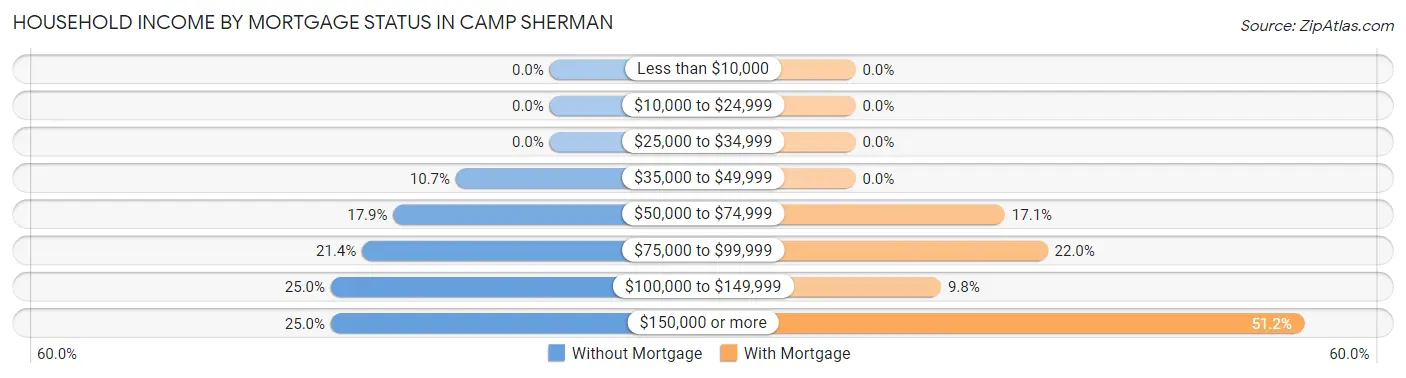
| Household Income | Without Mortgage | With Mortgage |
| Less than $10,000 | 0 (0.0%) | 0 (0.0%) |
| $10,000 to $24,999 | 0 (0.0%) | 0 (0.0%) |
| $25,000 to $34,999 | 0 (0.0%) | 0 (0.0%) |
| $35,000 to $49,999 | 6 (10.7%) | 0 (0.0%) |
| $50,000 to $74,999 | 10 (17.9%) | 7 (17.1%) |
| $75,000 to $99,999 | 12 (21.4%) | 9 (22.0%) |
| $100,000 to $149,999 | 14 (25.0%) | 4 (9.8%) |
| $150,000 or more | 14 (25.0%) | 21 (51.2%) |
| Total | 56 (100.0%) | 41 (100.0%) |
Property Value to Household Income Ratio in Camp Sherman
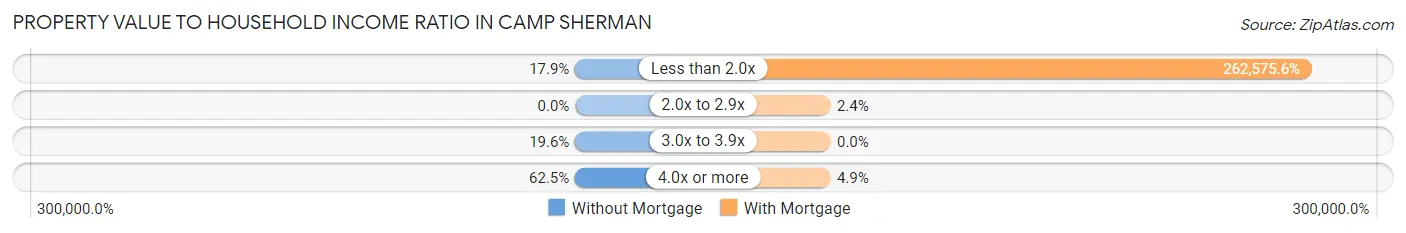
| Value-to-Income Ratio | Without Mortgage | With Mortgage |
| Less than 2.0x | 10 (17.9%) | 107,656 (262,575.6%) |
| 2.0x to 2.9x | 0 (0.0%) | 1 (2.4%) |
| 3.0x to 3.9x | 11 (19.6%) | 0 (0.0%) |
| 4.0x or more | 35 (62.5%) | 2 (4.9%) |
| Total | 56 (100.0%) | 41 (100.0%) |
Real Estate Taxes by Mortgage Status in Camp Sherman
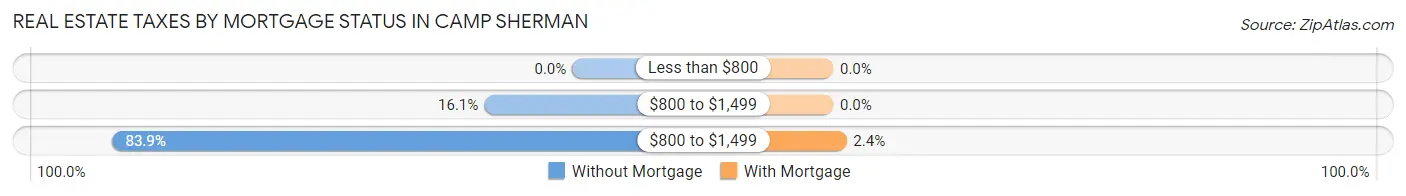
| Property Taxes | Without Mortgage | With Mortgage |
| Less than $800 | 0 (0.0%) | 0 (0.0%) |
| $800 to $1,499 | 9 (16.1%) | 0 (0.0%) |
| $800 to $1,499 | 47 (83.9%) | 1 (2.4%) |
| Total | 56 (100.0%) | 41 (100.0%) |
Health & Disability in Camp Sherman
Health Insurance Coverage by Age in Camp Sherman
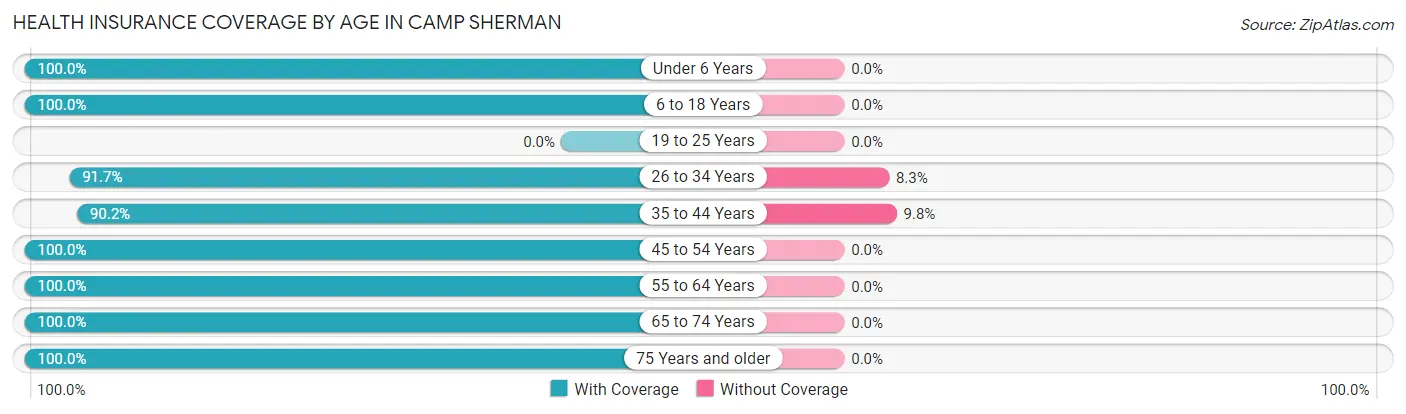
| Age Bracket | With Coverage | Without Coverage |
| Under 6 Years | 67 (100.0%) | 0 (0.0%) |
| 6 to 18 Years | 18 (100.0%) | 0 (0.0%) |
| 19 to 25 Years | 0 (0.0%) | 0 (0.0%) |
| 26 to 34 Years | 22 (91.7%) | 2 (8.3%) |
| 35 to 44 Years | 37 (90.2%) | 4 (9.8%) |
| 45 to 54 Years | 13 (100.0%) | 0 (0.0%) |
| 55 to 64 Years | 33 (100.0%) | 0 (0.0%) |
| 65 to 74 Years | 57 (100.0%) | 0 (0.0%) |
| 75 Years and older | 60 (100.0%) | 0 (0.0%) |
| Total | 307 (98.1%) | 6 (1.9%) |
Health Insurance Coverage by Citizenship Status in Camp Sherman
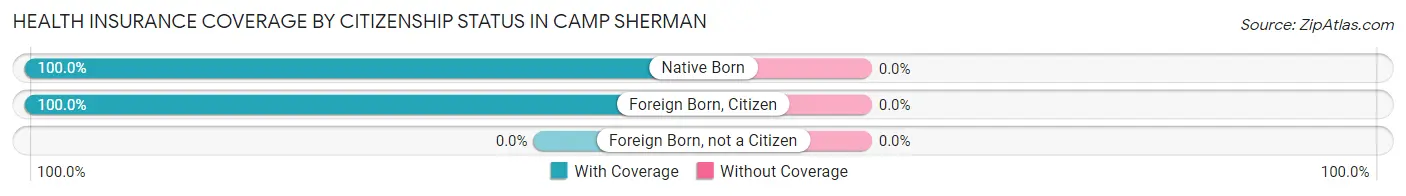
| Citizenship Status | With Coverage | Without Coverage |
| Native Born | 67 (100.0%) | 0 (0.0%) |
| Foreign Born, Citizen | 18 (100.0%) | 0 (0.0%) |
| Foreign Born, not a Citizen | 0 (0.0%) | 0 (0.0%) |
Health Insurance Coverage by Household Income in Camp Sherman
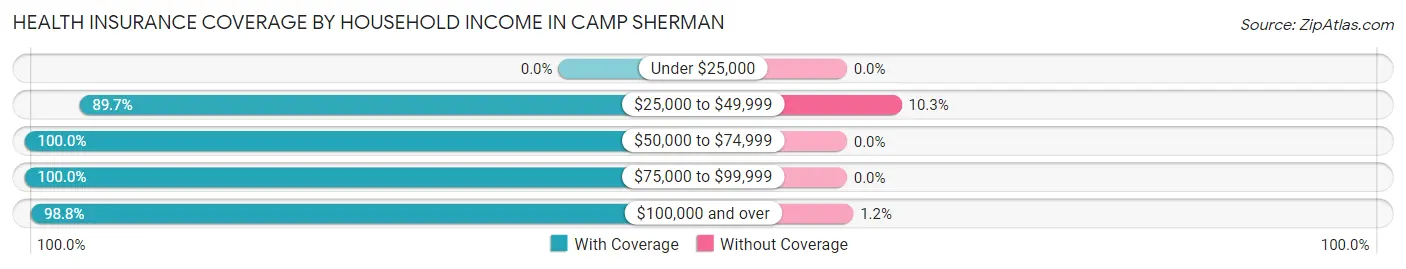
| Household Income | With Coverage | Without Coverage |
| Under $25,000 | 0 (0.0%) | 0 (0.0%) |
| $25,000 to $49,999 | 35 (89.7%) | 4 (10.3%) |
| $50,000 to $74,999 | 59 (100.0%) | 0 (0.0%) |
| $75,000 to $99,999 | 50 (100.0%) | 0 (0.0%) |
| $100,000 and over | 163 (98.8%) | 2 (1.2%) |
Public vs Private Health Insurance Coverage by Age in Camp Sherman
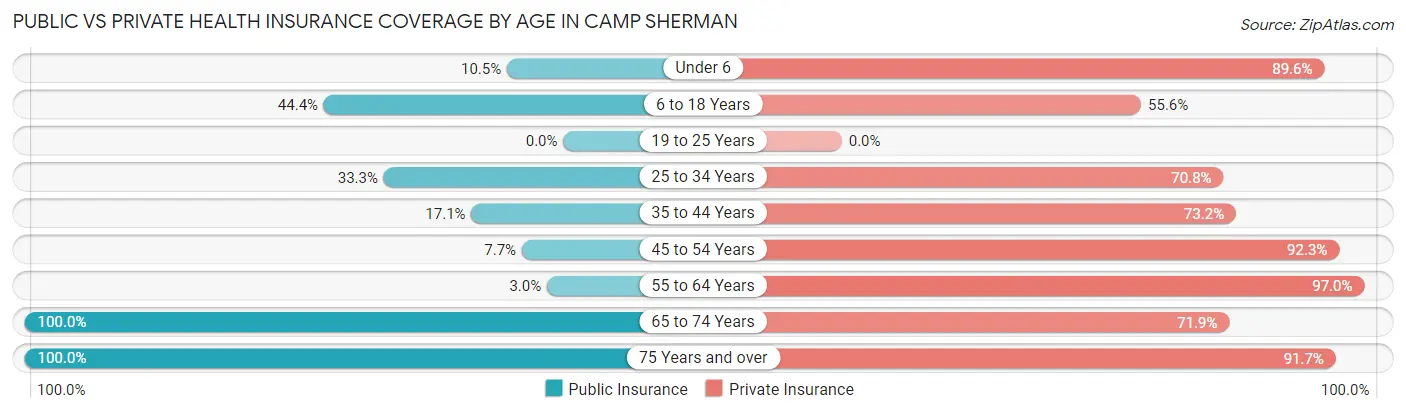
| Age Bracket | Public Insurance | Private Insurance |
| Under 6 | 7 (10.4%) | 60 (89.5%) |
| 6 to 18 Years | 8 (44.4%) | 10 (55.6%) |
| 19 to 25 Years | 0 (0.0%) | 0 (0.0%) |
| 25 to 34 Years | 8 (33.3%) | 17 (70.8%) |
| 35 to 44 Years | 7 (17.1%) | 30 (73.2%) |
| 45 to 54 Years | 1 (7.7%) | 12 (92.3%) |
| 55 to 64 Years | 1 (3.0%) | 32 (97.0%) |
| 65 to 74 Years | 57 (100.0%) | 41 (71.9%) |
| 75 Years and over | 60 (100.0%) | 55 (91.7%) |
| Total | 149 (47.6%) | 257 (82.1%) |
Disability Status by Sex by Age in Camp Sherman
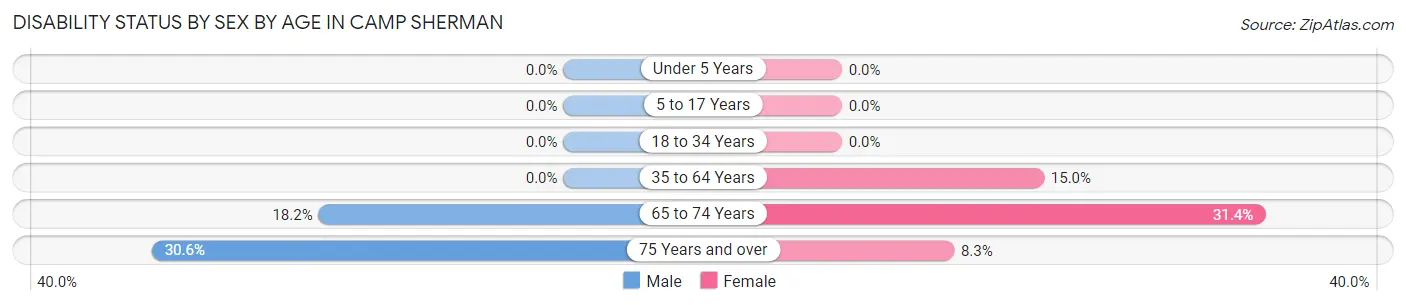
| Age Bracket | Male | Female |
| Under 5 Years | 0 (0.0%) | 0 (0.0%) |
| 5 to 17 Years | 0 (0.0%) | 0 (0.0%) |
| 18 to 34 Years | 0 (0.0%) | 0 (0.0%) |
| 35 to 64 Years | 0 (0.0%) | 6 (15.0%) |
| 65 to 74 Years | 4 (18.2%) | 11 (31.4%) |
| 75 Years and over | 11 (30.6%) | 2 (8.3%) |
Disability Class by Sex by Age in Camp Sherman
Disability Class: Hearing Difficulty
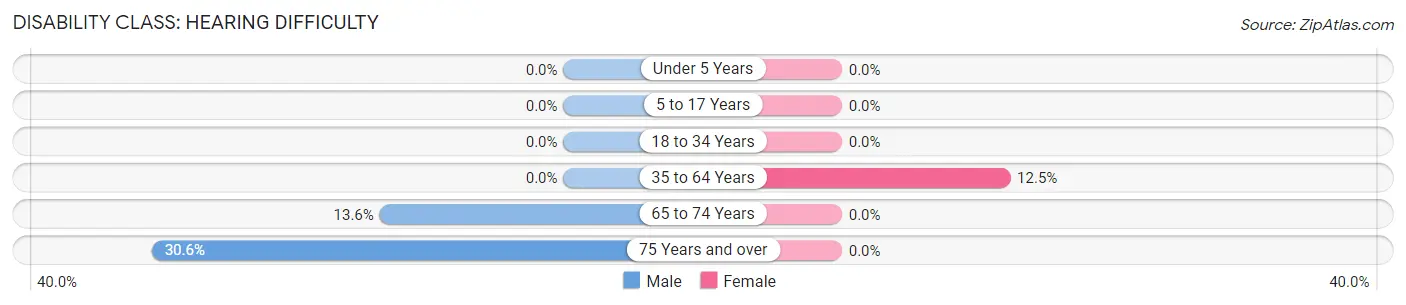
| Age Bracket | Male | Female |
| Under 5 Years | 0 (0.0%) | 0 (0.0%) |
| 5 to 17 Years | 0 (0.0%) | 0 (0.0%) |
| 18 to 34 Years | 0 (0.0%) | 0 (0.0%) |
| 35 to 64 Years | 0 (0.0%) | 5 (12.5%) |
| 65 to 74 Years | 3 (13.6%) | 0 (0.0%) |
| 75 Years and over | 11 (30.6%) | 0 (0.0%) |
Disability Class: Vision Difficulty
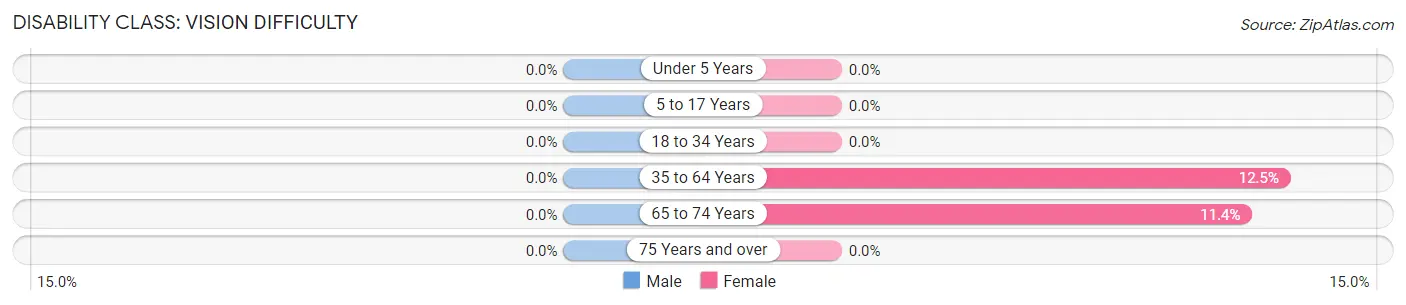
| Age Bracket | Male | Female |
| Under 5 Years | 0 (0.0%) | 0 (0.0%) |
| 5 to 17 Years | 0 (0.0%) | 0 (0.0%) |
| 18 to 34 Years | 0 (0.0%) | 0 (0.0%) |
| 35 to 64 Years | 0 (0.0%) | 5 (12.5%) |
| 65 to 74 Years | 0 (0.0%) | 4 (11.4%) |
| 75 Years and over | 0 (0.0%) | 0 (0.0%) |
Disability Class: Cognitive Difficulty
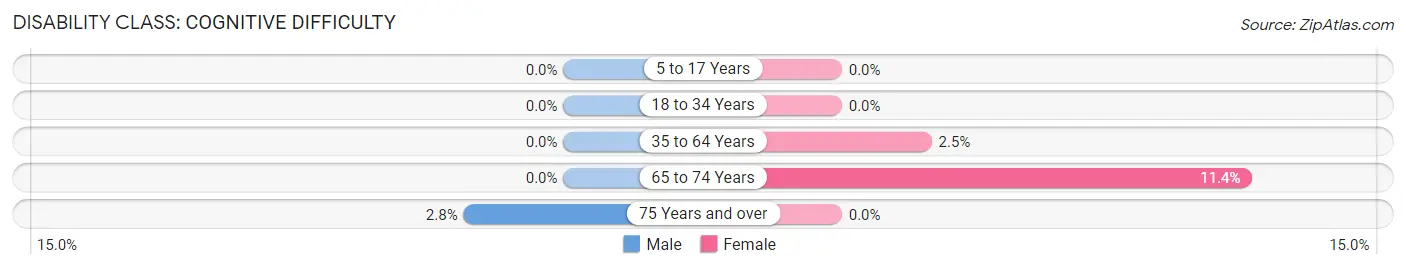
| Age Bracket | Male | Female |
| 5 to 17 Years | 0 (0.0%) | 0 (0.0%) |
| 18 to 34 Years | 0 (0.0%) | 0 (0.0%) |
| 35 to 64 Years | 0 (0.0%) | 1 (2.5%) |
| 65 to 74 Years | 0 (0.0%) | 4 (11.4%) |
| 75 Years and over | 1 (2.8%) | 0 (0.0%) |
Disability Class: Ambulatory Difficulty
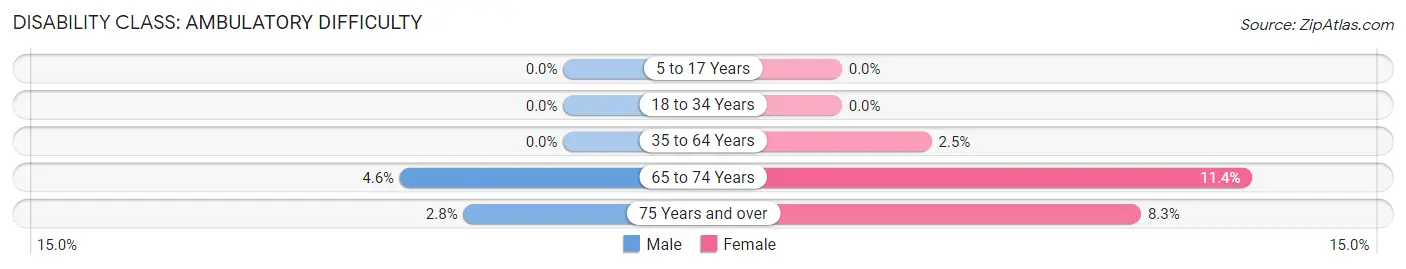
| Age Bracket | Male | Female |
| 5 to 17 Years | 0 (0.0%) | 0 (0.0%) |
| 18 to 34 Years | 0 (0.0%) | 0 (0.0%) |
| 35 to 64 Years | 0 (0.0%) | 1 (2.5%) |
| 65 to 74 Years | 1 (4.5%) | 4 (11.4%) |
| 75 Years and over | 1 (2.8%) | 2 (8.3%) |
Disability Class: Self-Care Difficulty
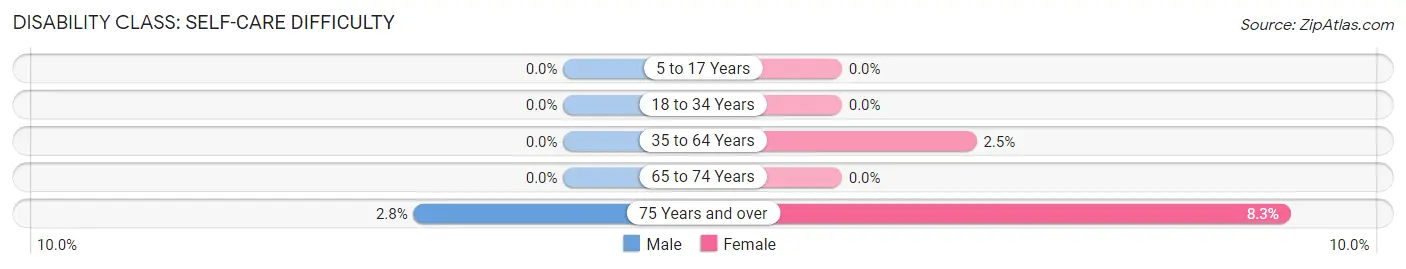
| Age Bracket | Male | Female |
| 5 to 17 Years | 0 (0.0%) | 0 (0.0%) |
| 18 to 34 Years | 0 (0.0%) | 0 (0.0%) |
| 35 to 64 Years | 0 (0.0%) | 1 (2.5%) |
| 65 to 74 Years | 0 (0.0%) | 0 (0.0%) |
| 75 Years and over | 1 (2.8%) | 2 (8.3%) |
Technology Access in Camp Sherman
Computing Device Access in Camp Sherman
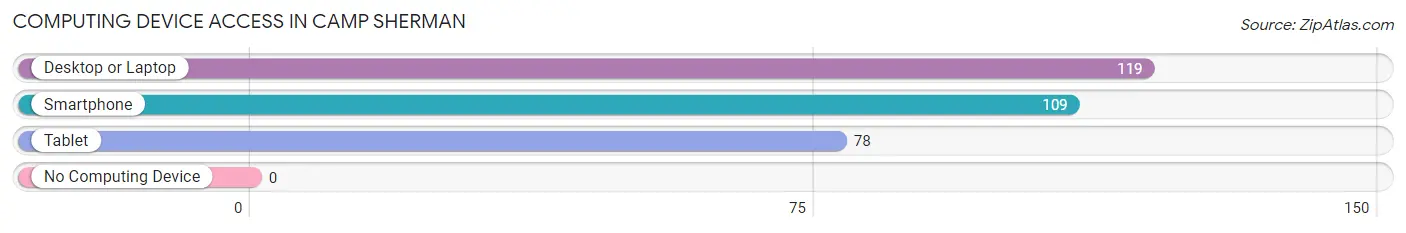
| Device Type | # Households | % Households |
| Desktop or Laptop | 119 | 99.2% |
| Smartphone | 109 | 90.8% |
| Tablet | 78 | 65.0% |
| No Computing Device | 0 | 0.0% |
| Total | 120 | 100.0% |
Internet Access in Camp Sherman
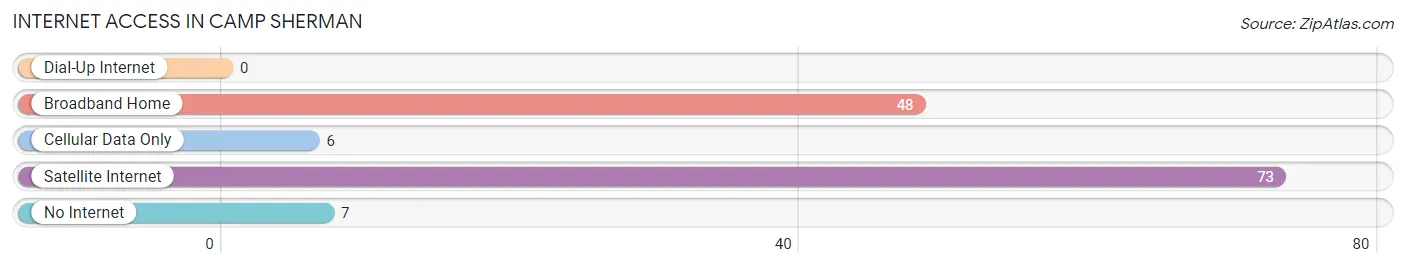
| Internet Type | # Households | % Households |
| Dial-Up Internet | 0 | 0.0% |
| Broadband Home | 48 | 40.0% |
| Cellular Data Only | 6 | 5.0% |
| Satellite Internet | 73 | 60.8% |
| No Internet | 7 | 5.8% |
| Total | 120 | 100.0% |
Camp Sherman Summary
Introduction
Camp Sherman is an unincorporated community located in the Deschutes National Forest in Central Oregon. It is situated on the Metolius River, a tributary of the Deschutes River, and is located in Jefferson County. The community is named after the nearby Camp Sherman Army post, which was established in 1891. The post was used to train soldiers for the Spanish-American War and World War I.
History
The area around Camp Sherman was first inhabited by the Warm Springs Native American tribe. The tribe used the area for hunting and fishing, and the Metolius River was an important source of food and water. In 1891, the U.S. Army established Camp Sherman as a training post for soldiers. The post was used to train soldiers for the Spanish-American War and World War I.
In the early 1900s, the area around Camp Sherman began to attract settlers. The first settlers were loggers, who harvested the area’s abundant timber. The logging industry was the main source of income for the area until the 1920s, when the timber supply began to dwindle.
In the 1930s, the area around Camp Sherman began to attract tourists. The Metolius River was a popular destination for fishing and camping, and the area was also known for its scenic beauty. The area was also popular with hunters, who came to hunt deer, elk, and other game.
In the 1950s, the area around Camp Sherman began to attract retirees. The area was known for its mild climate and scenic beauty, and it was also close to the larger cities of Bend and Redmond. The area was also known for its recreational opportunities, including fishing, camping, and hiking.
Geography
Camp Sherman is located in the Deschutes National Forest in Central Oregon. The community is situated on the Metolius River, a tributary of the Deschutes River. The area is known for its scenic beauty, with the Cascade Mountains to the west and the Ochoco Mountains to the east. The area is also known for its mild climate, with temperatures ranging from the mid-30s in the winter to the mid-80s in the summer.
Economy
The economy of Camp Sherman is largely based on tourism. The area is known for its scenic beauty and recreational opportunities, and it is a popular destination for fishing, camping, and hiking. The area is also known for its mild climate, and it is a popular destination for retirees.
The area is also home to several businesses, including restaurants, lodging, and retail stores. The area is also home to several wineries, which produce a variety of wines.
Demographics
As of the 2010 census, the population of Camp Sherman was 545. The population is largely white (94.3%), with a small percentage of Native American (2.2%) and Hispanic (1.8%) residents. The median household income is $45,000, and the median age is 48.
Conclusion
Camp Sherman is an unincorporated community located in the Deschutes National Forest in Central Oregon. The area is known for its scenic beauty and recreational opportunities, and it is a popular destination for fishing, camping, and hiking. The area is also known for its mild climate, and it is a popular destination for retirees. The economy of Camp Sherman is largely based on tourism, and the area is home to several businesses, including restaurants, lodging, and retail stores. The population of Camp Sherman is largely white, with a small percentage of Native American and Hispanic residents.
Common Questions
What is Per Capita Income in Camp Sherman?
Per Capita income in Camp Sherman is $35,222.
What is the Median Family Income in Camp Sherman?
Median Family Income in Camp Sherman is $83,438.
What is the Median Household income in Camp Sherman?
Median Household Income in Camp Sherman is $83,125.
What is Income or Wage Gap in Camp Sherman?
Income or Wage Gap in Camp Sherman is 46.9%.
Women in Camp Sherman earn 53.1 cents for every dollar earned by a man.
What is Inequality or Gini Index in Camp Sherman?
Inequality or Gini Index in Camp Sherman is 0.26.
What is the Total Population of Camp Sherman?
Total Population of Camp Sherman is 313.
What is the Total Male Population of Camp Sherman?
Total Male Population of Camp Sherman is 181.
What is the Total Female Population of Camp Sherman?
Total Female Population of Camp Sherman is 132.
What is the Ratio of Males per 100 Females in Camp Sherman?
There are 137.12 Males per 100 Females in Camp Sherman.
What is the Ratio of Females per 100 Males in Camp Sherman?
There are 72.93 Females per 100 Males in Camp Sherman.
What is the Median Population Age in Camp Sherman?
Median Population Age in Camp Sherman is 47.8 Years.
What is the Average Family Size in Camp Sherman
Average Family Size in Camp Sherman is 2.8 People.
What is the Average Household Size in Camp Sherman
Average Household Size in Camp Sherman is 2.6 People.
How Large is the Labor Force in Camp Sherman?
There are 79 People in the Labor Forcein in Camp Sherman.
What is the Percentage of People in the Labor Force in Camp Sherman?
34.5% of People are in the Labor Force in Camp Sherman.
What is the Unemployment Rate in Camp Sherman?
Unemployment Rate in Camp Sherman is 2.5%.