Edna, CA Map & Demographics
Edna Map
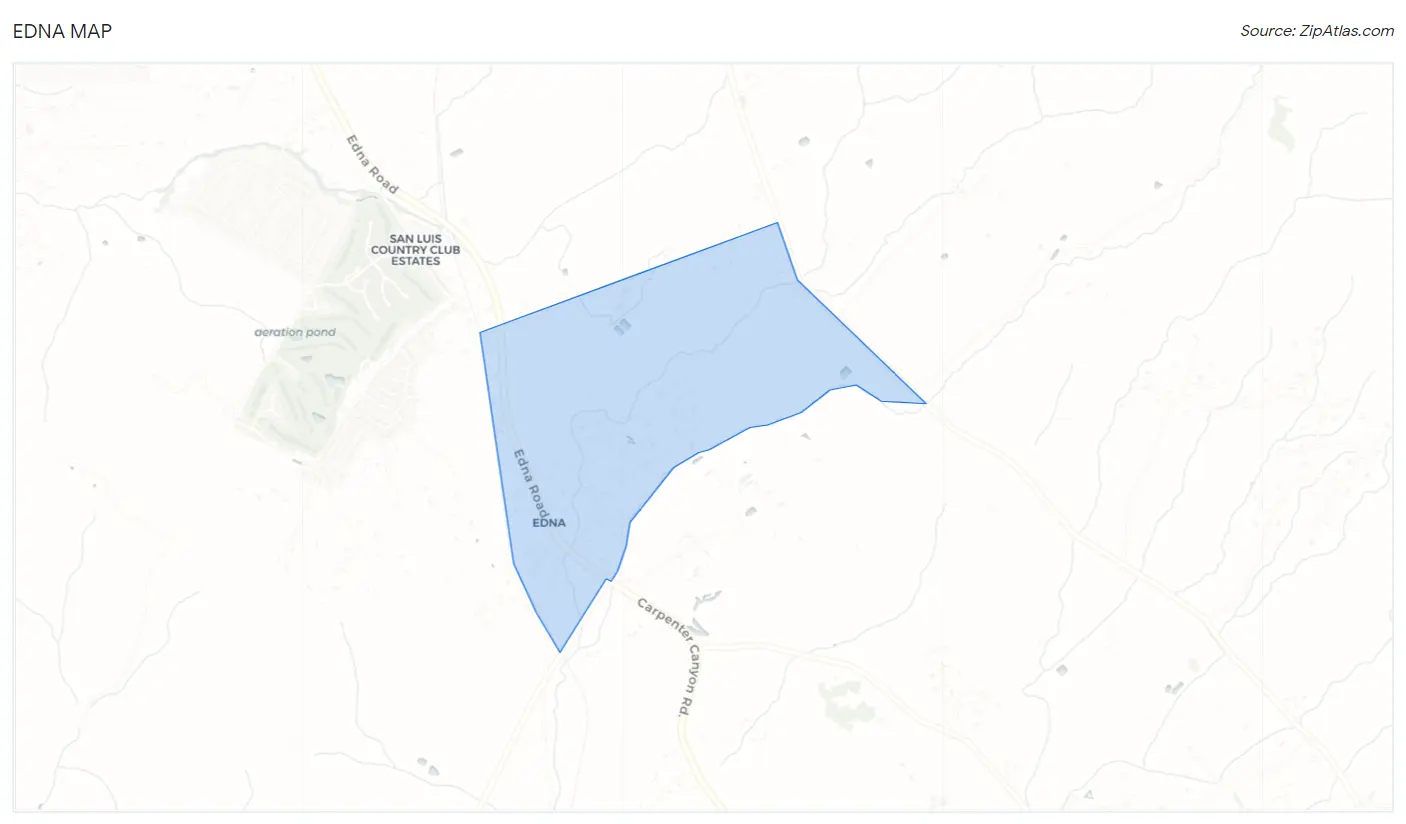
Edna Overview
$60,238
PER CAPITA INCOME
$157,917
AVG FAMILY INCOME
$157,692
AVG HOUSEHOLD INCOME
0.49
INEQUALITY / GINI INDEX
355
TOTAL POPULATION
225
MALE POPULATION
130
FEMALE POPULATION
173.08
MALES / 100 FEMALES
57.78
FEMALES / 100 MALES
32.7
MEDIAN AGE
3.6
AVG FAMILY SIZE
3.4
AVG HOUSEHOLD SIZE
89
LABOR FORCE [ PEOPLE ]
35.9%
PERCENT IN LABOR FORCE
Income in Edna
Income Overview in Edna
Per Capita Income in Edna is $60,238, while median incomes of families and households are $157,917 and $157,692 respectively.
| Characteristic | Number | Measure |
| Per Capita Income | 355 | $60,238 |
| Median Family Income | 97 | $157,917 |
| Mean Family Income | 97 | $211,511 |
| Median Household Income | 104 | $157,692 |
| Mean Household Income | 104 | $198,421 |
| Income Deficit | 97 | $0 |
| Wage / Income Gap (%) | 355 | 0.00% |
| Wage / Income Gap ($) | 355 | 100.00¢ per $1 |
| Gini / Inequality Index | 355 | 0.49 |
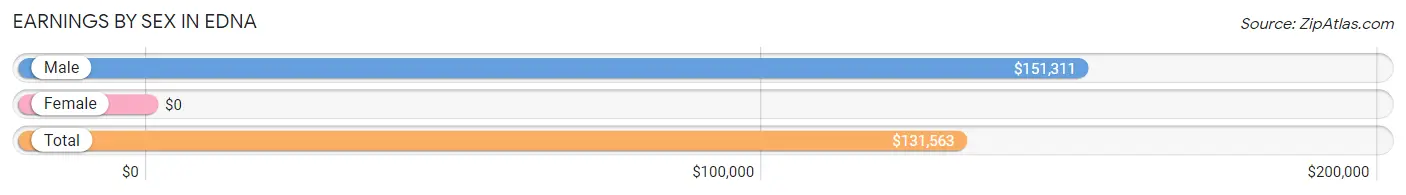
Earnings by Sex in Edna
| Sex | Number | Average Earnings |
| Male | 73 (57.0%) | $151,311 |
| Female | 55 (43.0%) | $0 |
| Total | 128 (100.0%) | $131,563 |
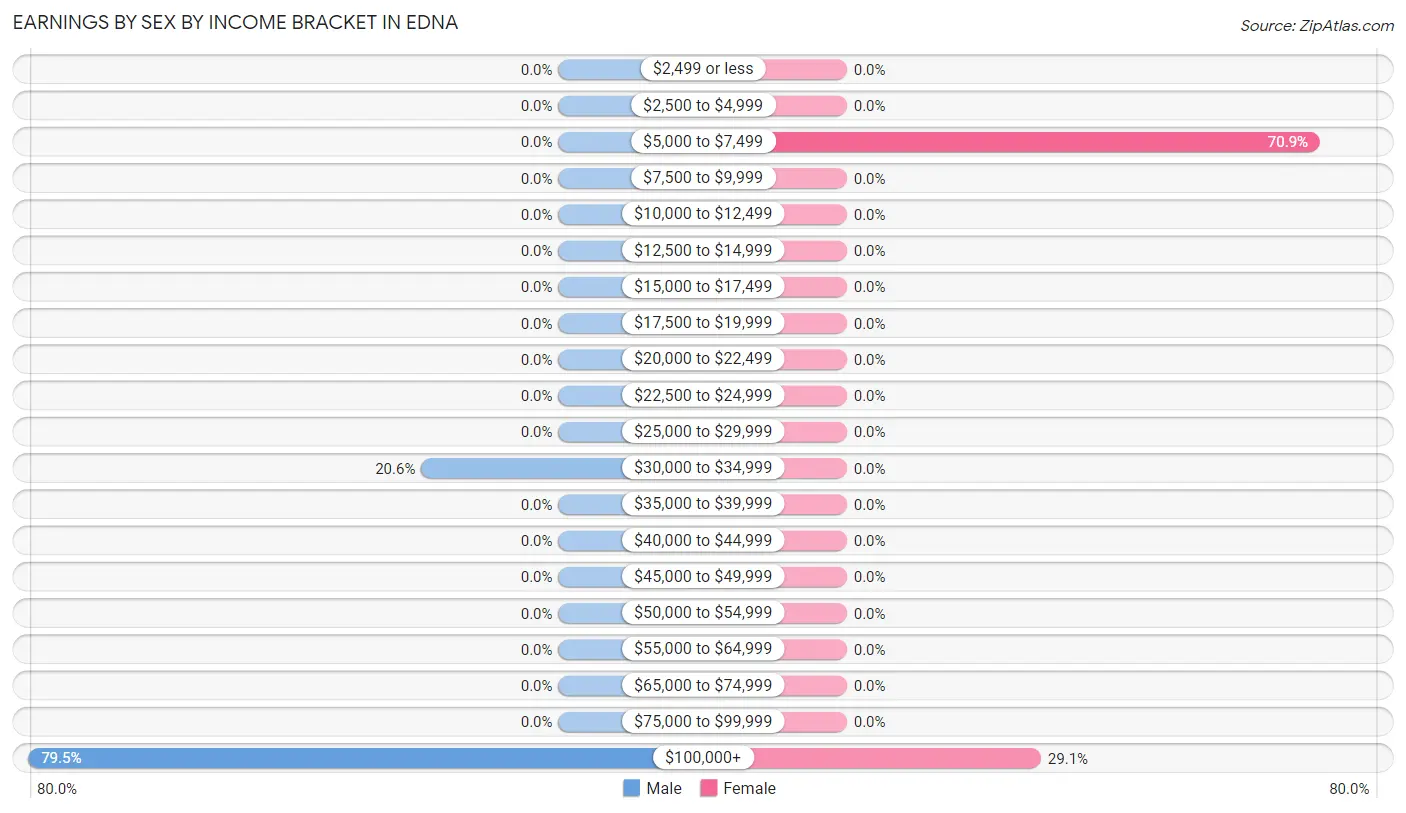
Earnings by Sex by Income Bracket in Edna
The most common earnings brackets in Edna are $100,000+ for men (58 | 79.4%) and $5,000 to $7,499 for women (39 | 70.9%).
| Income | Male | Female |
| $2,499 or less | 0 (0.0%) | 0 (0.0%) |
| $2,500 to $4,999 | 0 (0.0%) | 0 (0.0%) |
| $5,000 to $7,499 | 0 (0.0%) | 39 (70.9%) |
| $7,500 to $9,999 | 0 (0.0%) | 0 (0.0%) |
| $10,000 to $12,499 | 0 (0.0%) | 0 (0.0%) |
| $12,500 to $14,999 | 0 (0.0%) | 0 (0.0%) |
| $15,000 to $17,499 | 0 (0.0%) | 0 (0.0%) |
| $17,500 to $19,999 | 0 (0.0%) | 0 (0.0%) |
| $20,000 to $22,499 | 0 (0.0%) | 0 (0.0%) |
| $22,500 to $24,999 | 0 (0.0%) | 0 (0.0%) |
| $25,000 to $29,999 | 0 (0.0%) | 0 (0.0%) |
| $30,000 to $34,999 | 15 (20.5%) | 0 (0.0%) |
| $35,000 to $39,999 | 0 (0.0%) | 0 (0.0%) |
| $40,000 to $44,999 | 0 (0.0%) | 0 (0.0%) |
| $45,000 to $49,999 | 0 (0.0%) | 0 (0.0%) |
| $50,000 to $54,999 | 0 (0.0%) | 0 (0.0%) |
| $55,000 to $64,999 | 0 (0.0%) | 0 (0.0%) |
| $65,000 to $74,999 | 0 (0.0%) | 0 (0.0%) |
| $75,000 to $99,999 | 0 (0.0%) | 0 (0.0%) |
| $100,000+ | 58 (79.4%) | 16 (29.1%) |
| Total | 73 (100.0%) | 55 (100.0%) |
Earnings by Sex by Educational Attainment in Edna
| Educational Attainment | Male Income | Female Income |
| Less than High School | - | - |
| High School Diploma | - | - |
| College or Associate's Degree | - | - |
| Bachelor's Degree | - | - |
| Graduate Degree | - | - |
| Total | $151,311 | $0 |
Family Income in Edna
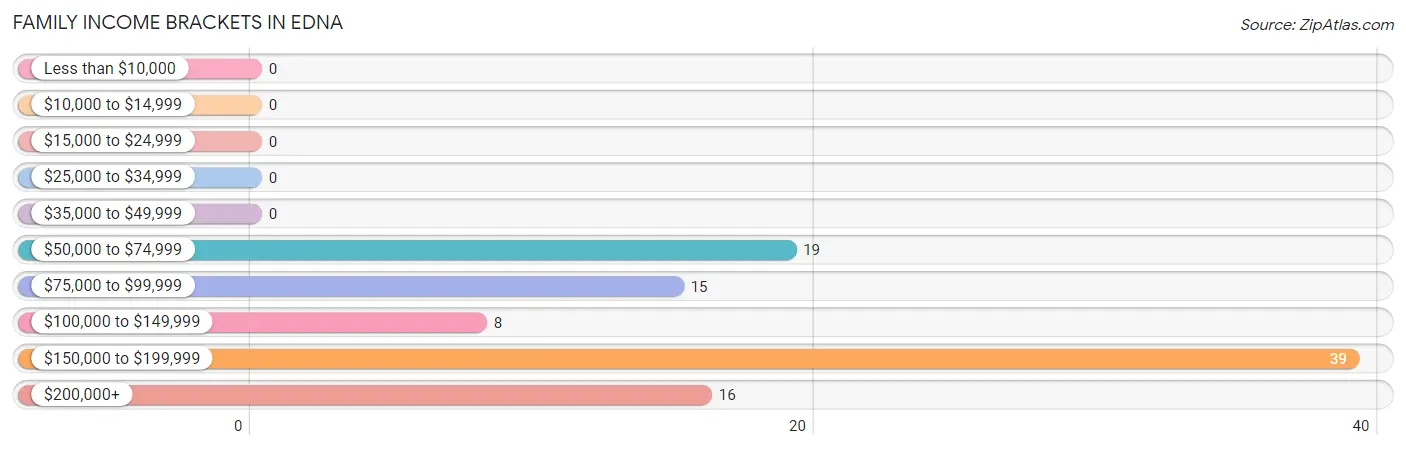
Family Income Brackets in Edna
According to the Edna family income data, there are 39 families falling into the $150,000 to $199,999 income range, which is the most common income bracket and makes up 40.2% of all families.
| Income Bracket | # Families | % Families |
| Less than $10,000 | 0 | 0.0% |
| $10,000 to $14,999 | 0 | 0.0% |
| $15,000 to $24,999 | 0 | 0.0% |
| $25,000 to $34,999 | 0 | 0.0% |
| $35,000 to $49,999 | 0 | 0.0% |
| $50,000 to $74,999 | 19 | 19.6% |
| $75,000 to $99,999 | 15 | 15.5% |
| $100,000 to $149,999 | 8 | 8.2% |
| $150,000 to $199,999 | 39 | 40.2% |
| $200,000+ | 16 | 16.5% |
Family Income by Famaliy Size in Edna
| Income Bracket | # Families | Median Income |
| 2-Person Families | 27 (27.8%) | $0 |
| 3-Person Families | 16 (16.5%) | $0 |
| 4-Person Families | 54 (55.7%) | $0 |
| 5-Person Families | 0 (0.0%) | $0 |
| 6-Person Families | 0 (0.0%) | $0 |
| 7+ Person Families | 0 (0.0%) | $0 |
| Total | 97 (100.0%) | $157,917 |
Family Income by Number of Earners in Edna
| Number of Earners | # Families | Median Income |
| No Earners | 27 (27.8%) | $0 |
| 1 Earner | 15 (15.5%) | $0 |
| 2 Earners | 55 (56.7%) | $0 |
| 3+ Earners | 0 (0.0%) | $0 |
| Total | 97 (100.0%) | $157,917 |
Household Income in Edna
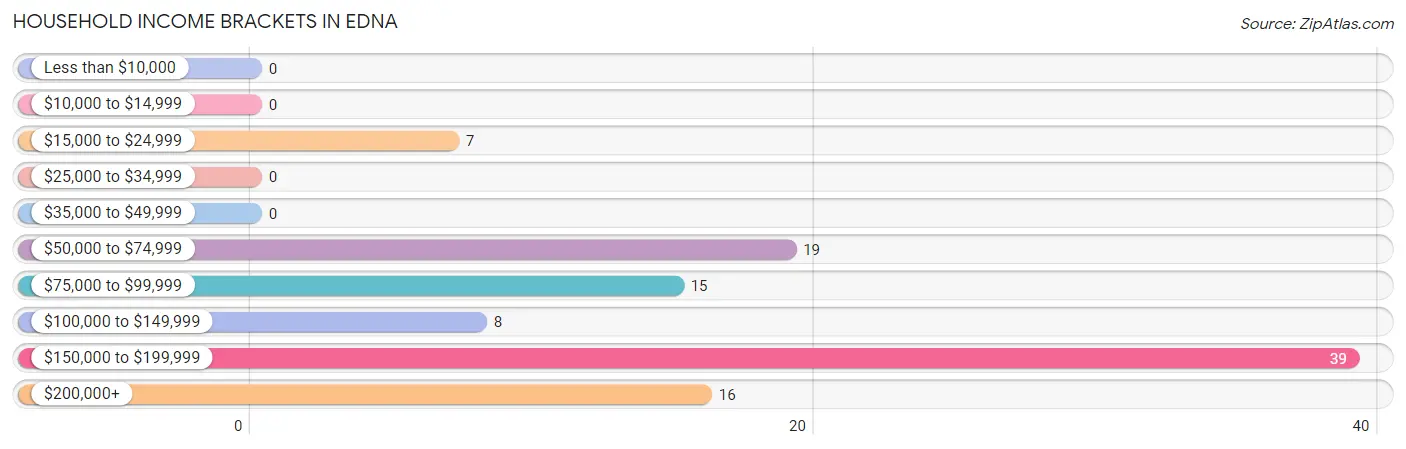
Household Income Brackets in Edna
With 39 households falling in the category, the $150,000 to $199,999 income range is the most frequent in Edna, accounting for 37.5% of all households.
| Income Bracket | # Households | % Households |
| Less than $10,000 | 0 | 0.0% |
| $10,000 to $14,999 | 0 | 0.0% |
| $15,000 to $24,999 | 7 | 6.7% |
| $25,000 to $34,999 | 0 | 0.0% |
| $35,000 to $49,999 | 0 | 0.0% |
| $50,000 to $74,999 | 19 | 18.3% |
| $75,000 to $99,999 | 15 | 14.4% |
| $100,000 to $149,999 | 8 | 7.7% |
| $150,000 to $199,999 | 39 | 37.5% |
| $200,000+ | 16 | 15.4% |
Household Income by Householder Age in Edna
The median household income in Edna is $157,692, with the highest median household income of $52,303 found in the 65+ years age bracket for the primary householder. A total of 49 households (47.1%) fall into this category.
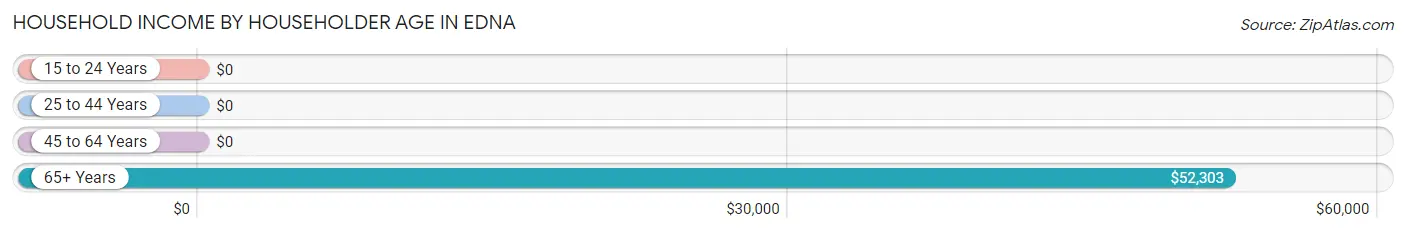
| Income Bracket | # Households | Median Income |
| 15 to 24 Years | 0 (0.0%) | $0 |
| 25 to 44 Years | 39 (37.5%) | $0 |
| 45 to 64 Years | 16 (15.4%) | $0 |
| 65+ Years | 49 (47.1%) | $52,303 |
| Total | 104 (100.0%) | $157,692 |
Poverty in Edna
Income Below Poverty by Sex and Age in Edna
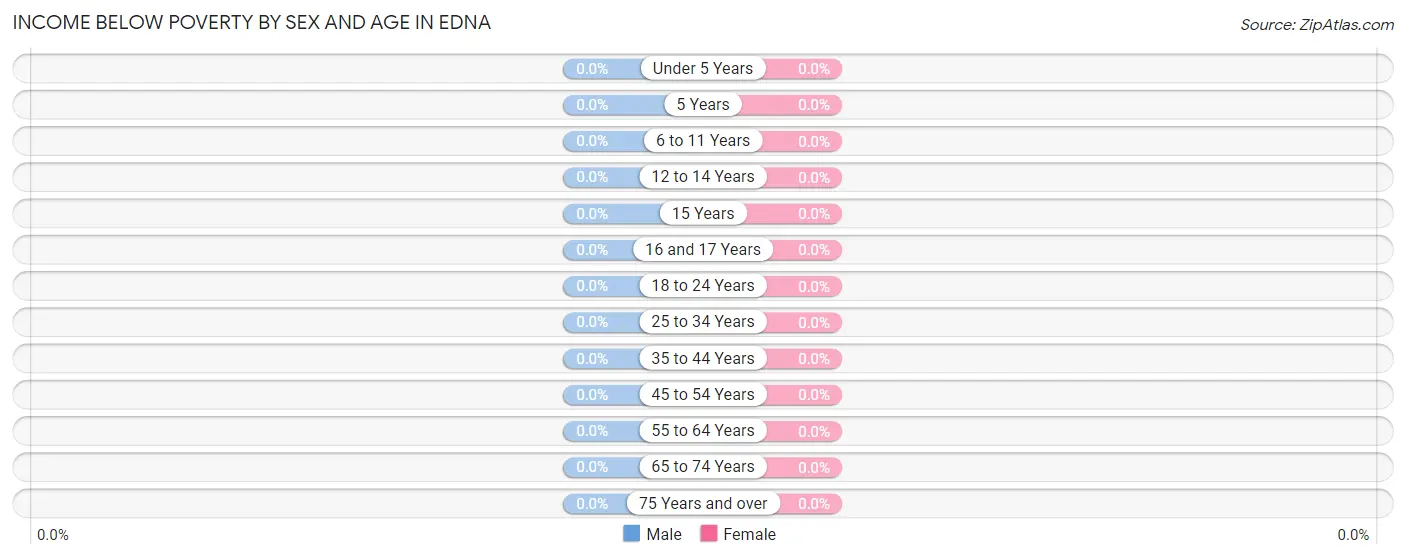
| Age Bracket | Male | Female |
| Under 5 Years | 0 (0.0%) | 0 (0.0%) |
| 5 Years | 0 (0.0%) | 0 (0.0%) |
| 6 to 11 Years | 0 (0.0%) | 0 (0.0%) |
| 12 to 14 Years | 0 (0.0%) | 0 (0.0%) |
| 15 Years | 0 (0.0%) | 0 (0.0%) |
| 16 and 17 Years | 0 (0.0%) | 0 (0.0%) |
| 18 to 24 Years | 0 (0.0%) | 0 (0.0%) |
| 25 to 34 Years | 0 (0.0%) | 0 (0.0%) |
| 35 to 44 Years | 0 (0.0%) | 0 (0.0%) |
| 45 to 54 Years | 0 (0.0%) | 0 (0.0%) |
| 55 to 64 Years | 0 (0.0%) | 0 (0.0%) |
| 65 to 74 Years | 0 (0.0%) | 0 (0.0%) |
| 75 Years and over | 0 (0.0%) | 0 (0.0%) |
| Total | 0 (0.0%) | 0 (0.0%) |
Income Above Poverty by Sex and Age in Edna
According to the poverty statistics in Edna, males aged under 5 years and females aged 18 to 24 years are the age groups that are most secure financially, with 100.0% of males and 100.0% of females in these age groups living above the poverty line.
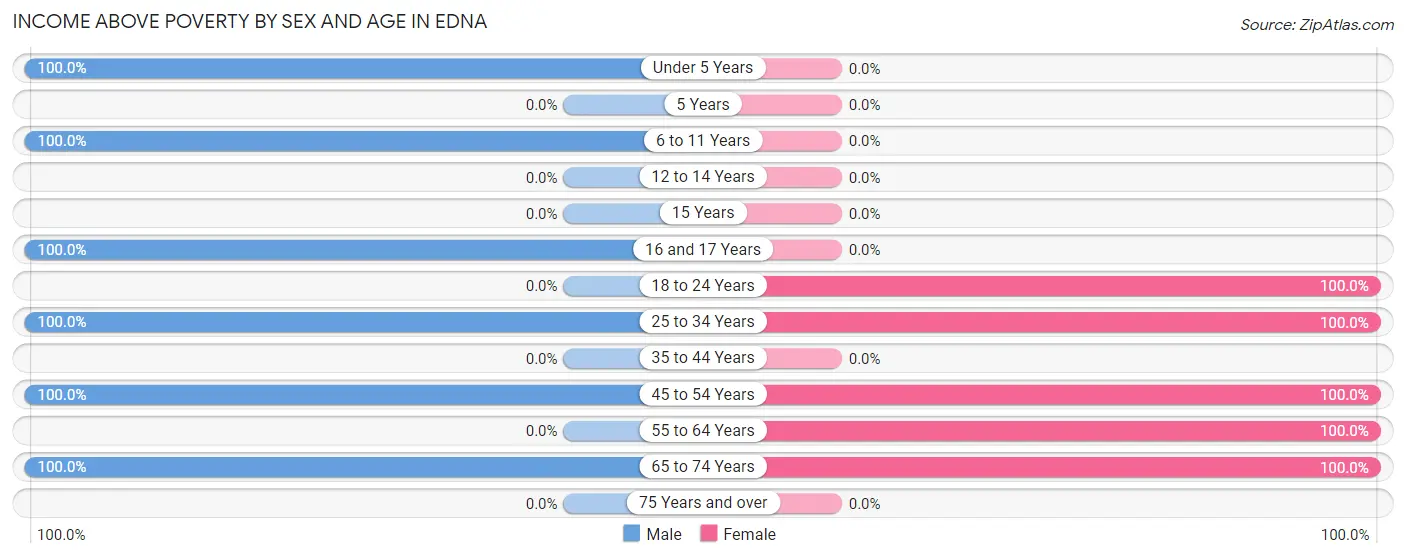
| Age Bracket | Male | Female |
| Under 5 Years | 45 (100.0%) | 0 (0.0%) |
| 5 Years | 0 (0.0%) | 0 (0.0%) |
| 6 to 11 Years | 62 (100.0%) | 0 (0.0%) |
| 12 to 14 Years | 0 (0.0%) | 0 (0.0%) |
| 15 Years | 0 (0.0%) | 0 (0.0%) |
| 16 and 17 Years | 17 (100.0%) | 0 (0.0%) |
| 18 to 24 Years | 0 (0.0%) | 26 (100.0%) |
| 25 to 34 Years | 41 (100.0%) | 39 (100.0%) |
| 35 to 44 Years | 0 (0.0%) | 0 (0.0%) |
| 45 to 54 Years | 17 (100.0%) | 16 (100.0%) |
| 55 to 64 Years | 0 (0.0%) | 8 (100.0%) |
| 65 to 74 Years | 43 (100.0%) | 41 (100.0%) |
| 75 Years and over | 0 (0.0%) | 0 (0.0%) |
| Total | 225 (100.0%) | 130 (100.0%) |
Income Below Poverty Among Married-Couple Families in Edna
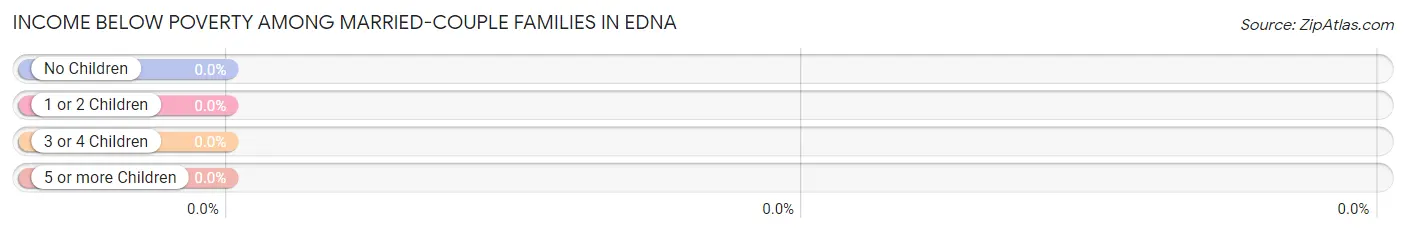
| Children | Above Poverty | Below Poverty |
| No Children | 27 (100.0%) | 0 (0.0%) |
| 1 or 2 Children | 70 (100.0%) | 0 (0.0%) |
| 3 or 4 Children | 0 (0.0%) | 0 (0.0%) |
| 5 or more Children | 0 (0.0%) | 0 (0.0%) |
| Total | 97 (100.0%) | 0 (0.0%) |
Income Below Poverty Among Single-Parent Households in Edna
| Children | Single Father | Single Mother |
| No Children | 0 (0.0%) | 0 (0.0%) |
| 1 or 2 Children | 0 (0.0%) | 0 (0.0%) |
| 3 or 4 Children | 0 (0.0%) | 0 (0.0%) |
| 5 or more Children | 0 (0.0%) | 0 (0.0%) |
| Total | 0 (0.0%) | 0 (0.0%) |
Income Below Poverty Among Married-Couple vs Single-Parent Households in Edna
| Children | Married-Couple Families | Single-Parent Households |
| No Children | 0 (0.0%) | 0 (0.0%) |
| 1 or 2 Children | 0 (0.0%) | 0 (0.0%) |
| 3 or 4 Children | 0 (0.0%) | 0 (0.0%) |
| 5 or more Children | 0 (0.0%) | 0 (0.0%) |
| Total | 0 (0.0%) | 0 (0.0%) |
Race in Edna
The most populous races in Edna are , and White / Caucasian (355 | 100.0%).
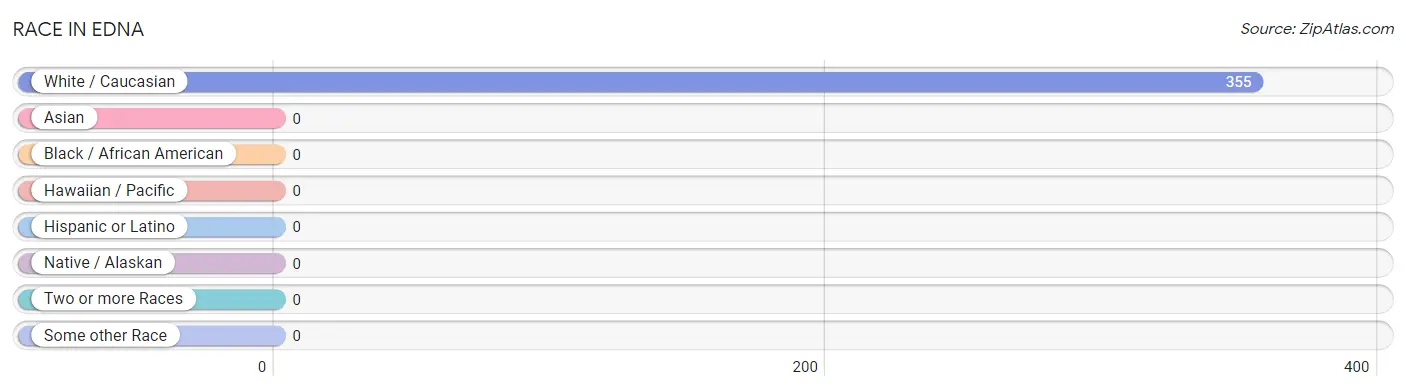
| Race | # Population | % Population |
| Asian | 0 | 0.0% |
| Black / African American | 0 | 0.0% |
| Hawaiian / Pacific | 0 | 0.0% |
| Hispanic or Latino | 0 | 0.0% |
| Native / Alaskan | 0 | 0.0% |
| White / Caucasian | 355 | 100.0% |
| Two or more Races | 0 | 0.0% |
| Some other Race | 0 | 0.0% |
| Total | 355 | 100.0% |
Ancestry in Edna
The most populous ancestries reported in Edna are Italian (73 | 20.6%), English (39 | 11.0%), Irish (34 | 9.6%), Hungarian (32 | 9.0%), and Norwegian (22 | 6.2%), together accounting for 56.3% of all Edna residents.
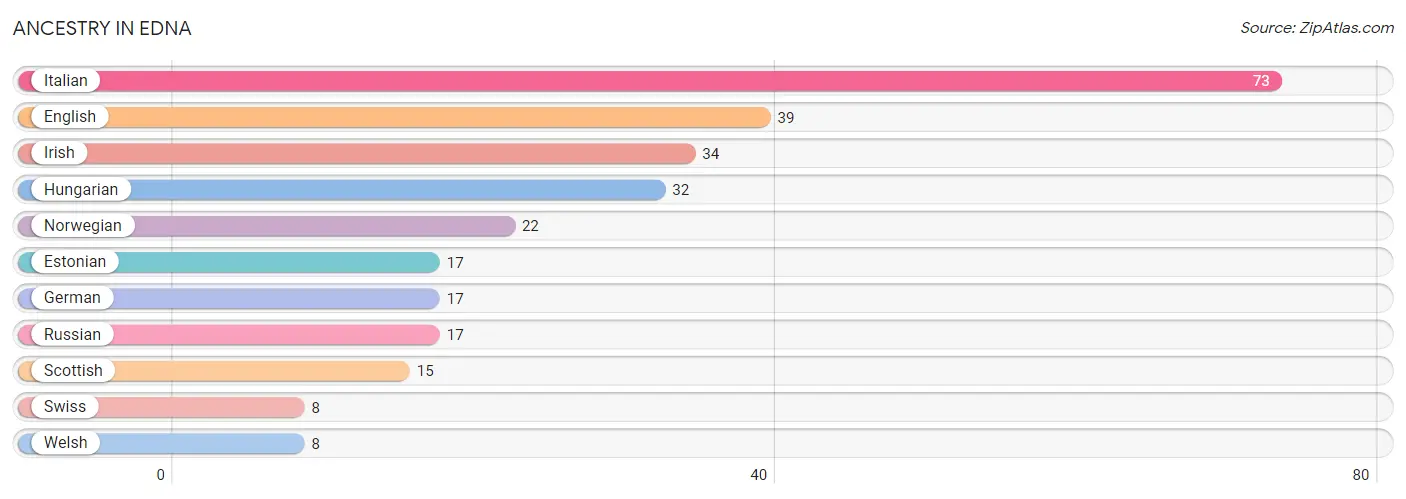
| Ancestry | # Population | % Population |
| English | 39 | 11.0% |
| Estonian | 17 | 4.8% |
| German | 17 | 4.8% |
| Hungarian | 32 | 9.0% |
| Irish | 34 | 9.6% |
| Italian | 73 | 20.6% |
| Norwegian | 22 | 6.2% |
| Russian | 17 | 4.8% |
| Scottish | 15 | 4.2% |
| Swiss | 8 | 2.2% |
| Welsh | 8 | 2.2% | View All 11 Rows |
Immigrants in Edna
The most numerous immigrant groups reported in Edna came from Europe (56 | 15.8%), Eastern Europe (36 | 10.1%), Germany (20 | 5.6%), Western Europe (20 | 5.6%), and Czechoslovakia (19 | 5.3%), together accounting for 42.5% of all Edna residents.
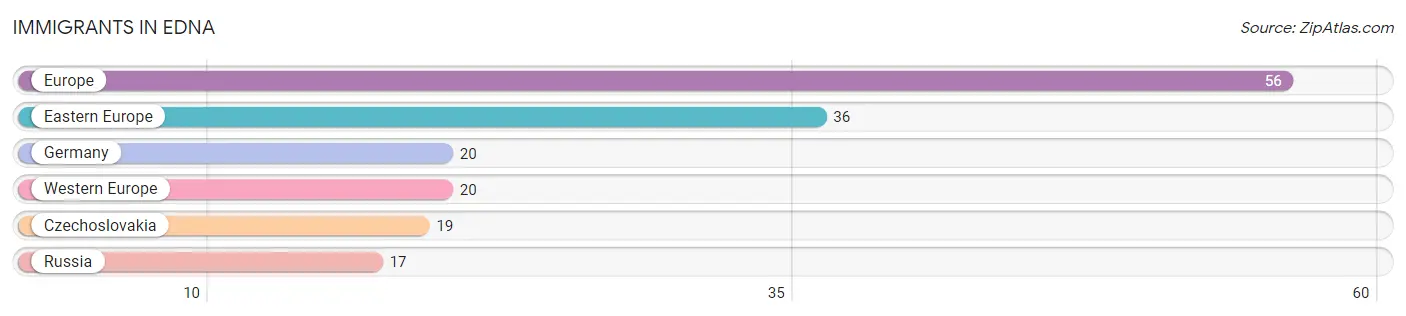
| Immigration Origin | # Population | % Population |
| Czechoslovakia | 19 | 5.3% |
| Eastern Europe | 36 | 10.1% |
| Europe | 56 | 15.8% |
| Germany | 20 | 5.6% |
| Russia | 17 | 4.8% |
| Western Europe | 20 | 5.6% | View All 6 Rows |
Sex and Age in Edna
Sex and Age in Edna
The most populous age groups in Edna are 5 to 9 Years (46 | 20.4%) for men and 65 to 69 Years (41 | 31.5%) for women.
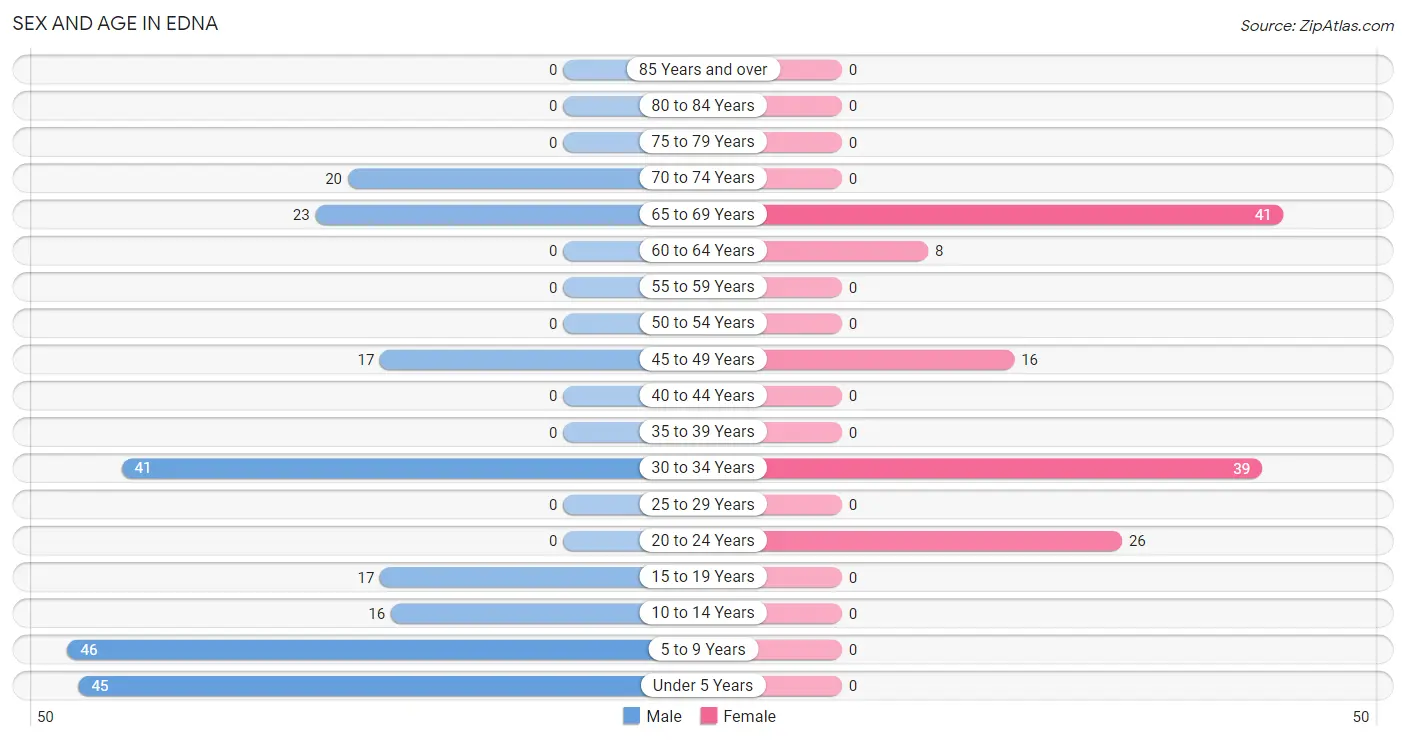
| Age Bracket | Male | Female |
| Under 5 Years | 45 (20.0%) | 0 (0.0%) |
| 5 to 9 Years | 46 (20.4%) | 0 (0.0%) |
| 10 to 14 Years | 16 (7.1%) | 0 (0.0%) |
| 15 to 19 Years | 17 (7.6%) | 0 (0.0%) |
| 20 to 24 Years | 0 (0.0%) | 26 (20.0%) |
| 25 to 29 Years | 0 (0.0%) | 0 (0.0%) |
| 30 to 34 Years | 41 (18.2%) | 39 (30.0%) |
| 35 to 39 Years | 0 (0.0%) | 0 (0.0%) |
| 40 to 44 Years | 0 (0.0%) | 0 (0.0%) |
| 45 to 49 Years | 17 (7.6%) | 16 (12.3%) |
| 50 to 54 Years | 0 (0.0%) | 0 (0.0%) |
| 55 to 59 Years | 0 (0.0%) | 0 (0.0%) |
| 60 to 64 Years | 0 (0.0%) | 8 (6.1%) |
| 65 to 69 Years | 23 (10.2%) | 41 (31.5%) |
| 70 to 74 Years | 20 (8.9%) | 0 (0.0%) |
| 75 to 79 Years | 0 (0.0%) | 0 (0.0%) |
| 80 to 84 Years | 0 (0.0%) | 0 (0.0%) |
| 85 Years and over | 0 (0.0%) | 0 (0.0%) |
| Total | 225 (100.0%) | 130 (100.0%) |
Families and Households in Edna
Median Family Size in Edna
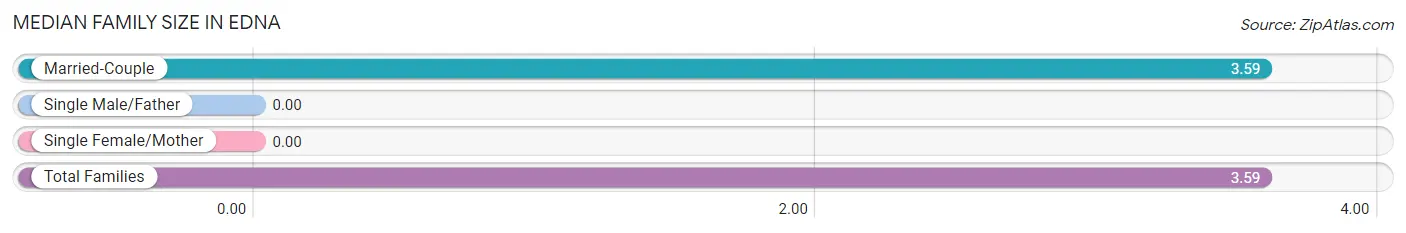
| Family Type | # Families | Family Size |
| Married-Couple | 97 (100.0%) | 3.59 |
| Single Male/Father | 0 (0.0%) | - |
| Single Female/Mother | 0 (0.0%) | - |
| Total Families | 97 (100.0%) | 3.59 |
Median Household Size in Edna
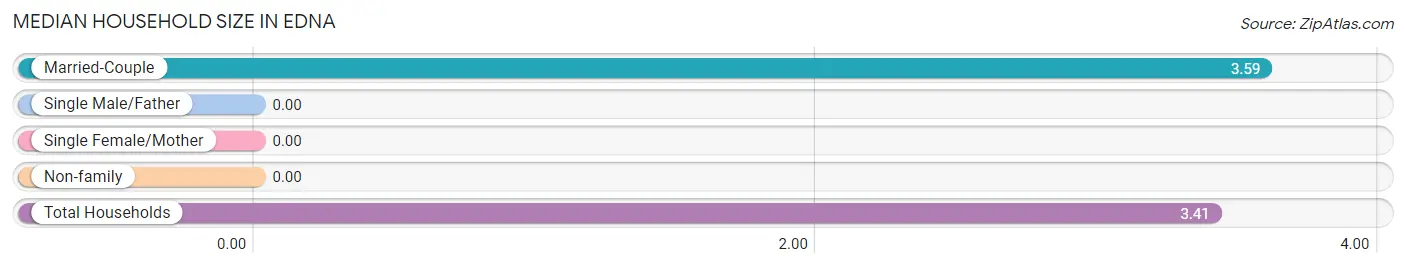
| Household Type | # Households | Household Size |
| Married-Couple | 97 (93.3%) | 3.59 |
| Single Male/Father | 0 (0.0%) | - |
| Single Female/Mother | 0 (0.0%) | - |
| Non-family | 7 (6.7%) | - |
| Total Households | 104 (100.0%) | 3.41 |
Household Size by Marriage Status in Edna
Out of a total of 104 households in Edna, 97 (93.3%) are family households, while 7 (6.7%) are nonfamily households. The most numerous type of family households are 4-person households, comprising 54, and the most common type of nonfamily households are 1-person households, comprising 7.
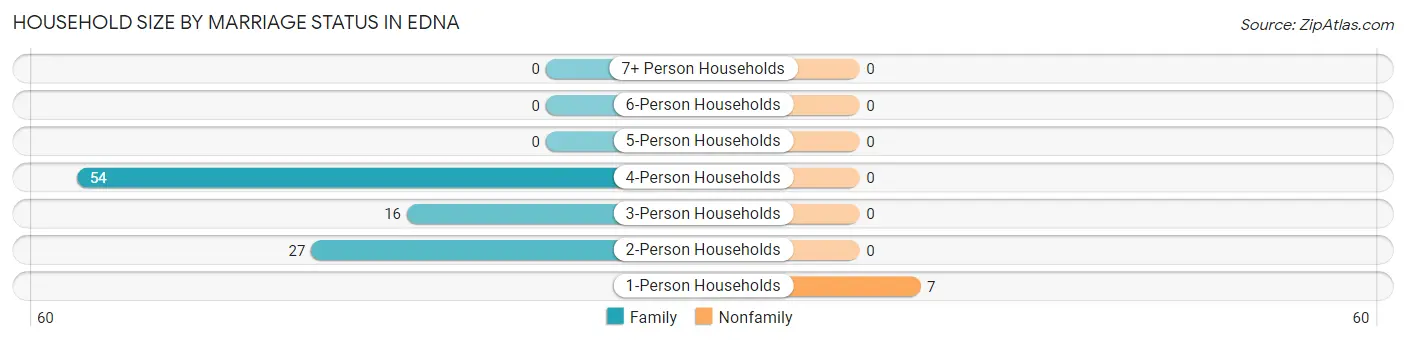
| Household Size | Family Households | Nonfamily Households |
| 1-Person Households | - | 7 (6.7%) |
| 2-Person Households | 27 (26.0%) | 0 (0.0%) |
| 3-Person Households | 16 (15.4%) | 0 (0.0%) |
| 4-Person Households | 54 (51.9%) | 0 (0.0%) |
| 5-Person Households | 0 (0.0%) | 0 (0.0%) |
| 6-Person Households | 0 (0.0%) | 0 (0.0%) |
| 7+ Person Households | 0 (0.0%) | 0 (0.0%) |
| Total | 97 (93.3%) | 7 (6.7%) |
Female Fertility in Edna
Fertility by Age in Edna
| Age Bracket | Women with Births | Births / 1,000 Women |
| 15 to 19 years | 0 (0.0%) | 0.0 |
| 20 to 34 years | 0 (0.0%) | 0.0 |
| 35 to 50 years | 0 (0.0%) | 0.0 |
| Total | 0 (0.0%) | 0.0 |
Fertility by Age by Marriage Status in Edna
| Age Bracket | Married | Unmarried |
| 15 to 19 years | 0 (0.0%) | 0 (0.0%) |
| 20 to 34 years | 0 (0.0%) | 0 (0.0%) |
| 35 to 50 years | 0 (0.0%) | 0 (0.0%) |
| Total | 0 (0.0%) | 0 (0.0%) |
Fertility by Education in Edna
| Educational Attainment | Women with Births | Births / 1,000 Women |
| Less than High School | 0 (0.0%) | 0.0 |
| High School Diploma | 0 (0.0%) | 0.0 |
| College or Associate's Degree | 0 (0.0%) | 0.0 |
| Bachelor's Degree | 0 (0.0%) | 0.0 |
| Graduate Degree | 0 (0.0%) | 0.0 |
| Total | 0 (0.0%) | 0.0 |
Fertility by Education by Marriage Status in Edna
| Educational Attainment | Married | Unmarried |
| Less than High School | 0 (0.0%) | 0 (0.0%) |
| High School Diploma | 0 (0.0%) | 0 (0.0%) |
| College or Associate's Degree | 0 (0.0%) | 0 (0.0%) |
| Bachelor's Degree | 0 (0.0%) | 0 (0.0%) |
| Graduate Degree | 0 (0.0%) | 0 (0.0%) |
| Total | 0 (0.0%) | 0 (0.0%) |
Employment Characteristics in Edna
Employment by Class of Employer in Edna
Among the 89 employed individuals in Edna, self-employed (incorporated) (41 | 46.1%), self-employed (not incorporated) (17 | 19.1%), and private company employees (16 | 18.0%) make up the most common classes of employment.
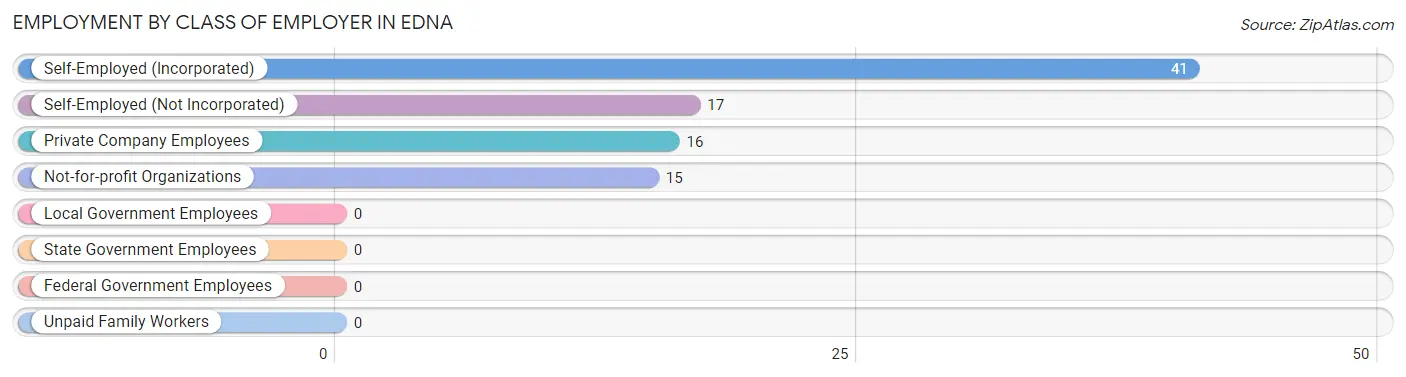
| Employer Class | # Employees | % Employees |
| Private Company Employees | 16 | 18.0% |
| Self-Employed (Incorporated) | 41 | 46.1% |
| Self-Employed (Not Incorporated) | 17 | 19.1% |
| Not-for-profit Organizations | 15 | 16.9% |
| Local Government Employees | 0 | 0.0% |
| State Government Employees | 0 | 0.0% |
| Federal Government Employees | 0 | 0.0% |
| Unpaid Family Workers | 0 | 0.0% |
| Total | 89 | 100.0% |
Employment Status by Age in Edna
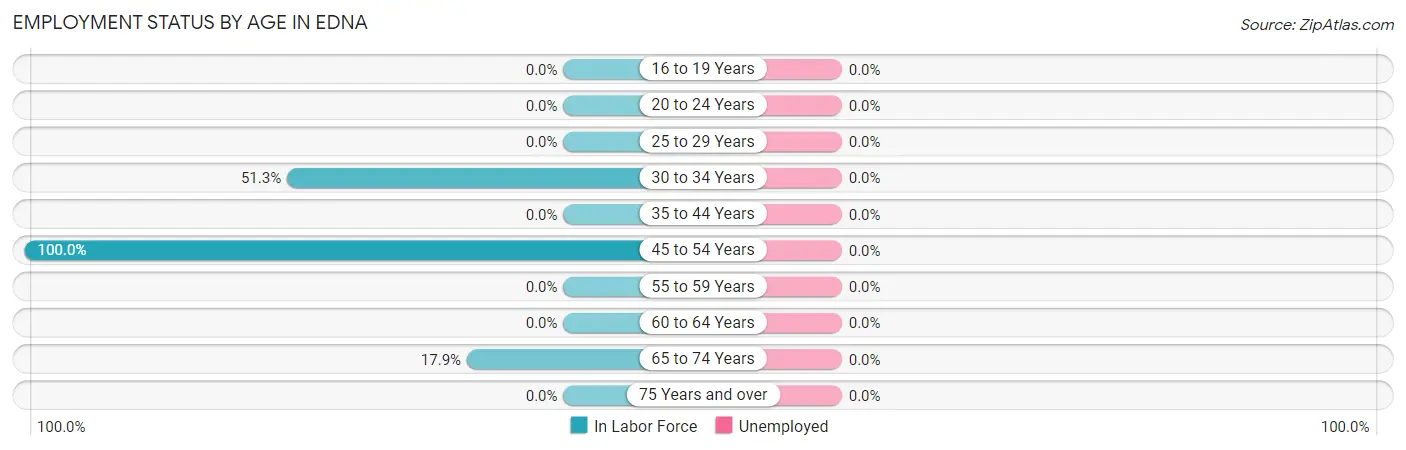
| Age Bracket | In Labor Force | Unemployed |
| 16 to 19 Years | 0 (0.0%) | 0 (0.0%) |
| 20 to 24 Years | 0 (0.0%) | 0 (0.0%) |
| 25 to 29 Years | 0 (0.0%) | 0 (0.0%) |
| 30 to 34 Years | 41 (51.3%) | 0 (0.0%) |
| 35 to 44 Years | 0 (0.0%) | 0 (0.0%) |
| 45 to 54 Years | 33 (100.0%) | 0 (0.0%) |
| 55 to 59 Years | 0 (0.0%) | 0 (0.0%) |
| 60 to 64 Years | 0 (0.0%) | 0 (0.0%) |
| 65 to 74 Years | 15 (17.9%) | 0 (0.0%) |
| 75 Years and over | 0 (0.0%) | 0 (0.0%) |
| Total | 89 (35.9%) | 0 (0.0%) |
Employment Status by Educational Attainment in Edna
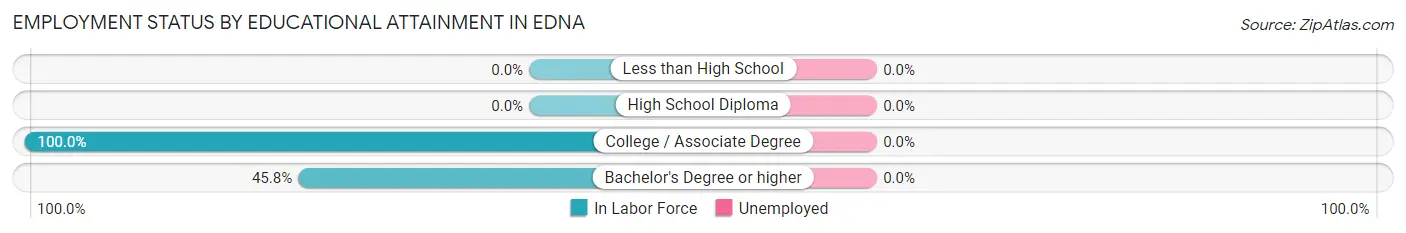
| Educational Attainment | In Labor Force | Unemployed |
| Less than High School | 0 (0.0%) | 0 (0.0%) |
| High School Diploma | 0 (0.0%) | 0 (0.0%) |
| College / Associate Degree | 41 (100.0%) | 0 (0.0%) |
| Bachelor's Degree or higher | 33 (45.8%) | 0 (0.0%) |
| Total | 74 (61.2%) | 0 (0.0%) |
Employment Occupations by Sex in Edna
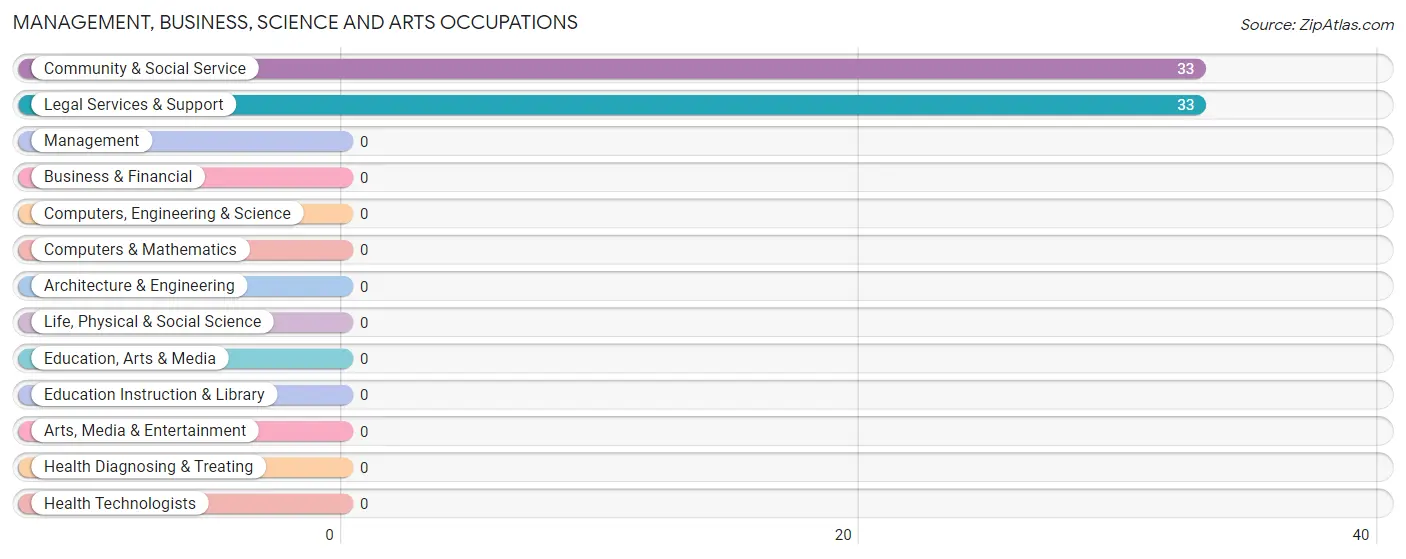
Management, Business, Science and Arts Occupations
The most common Management, Business, Science and Arts occupations in Edna are Community & Social Service (33 | 37.1%), and Legal Services & Support (33 | 37.1%).
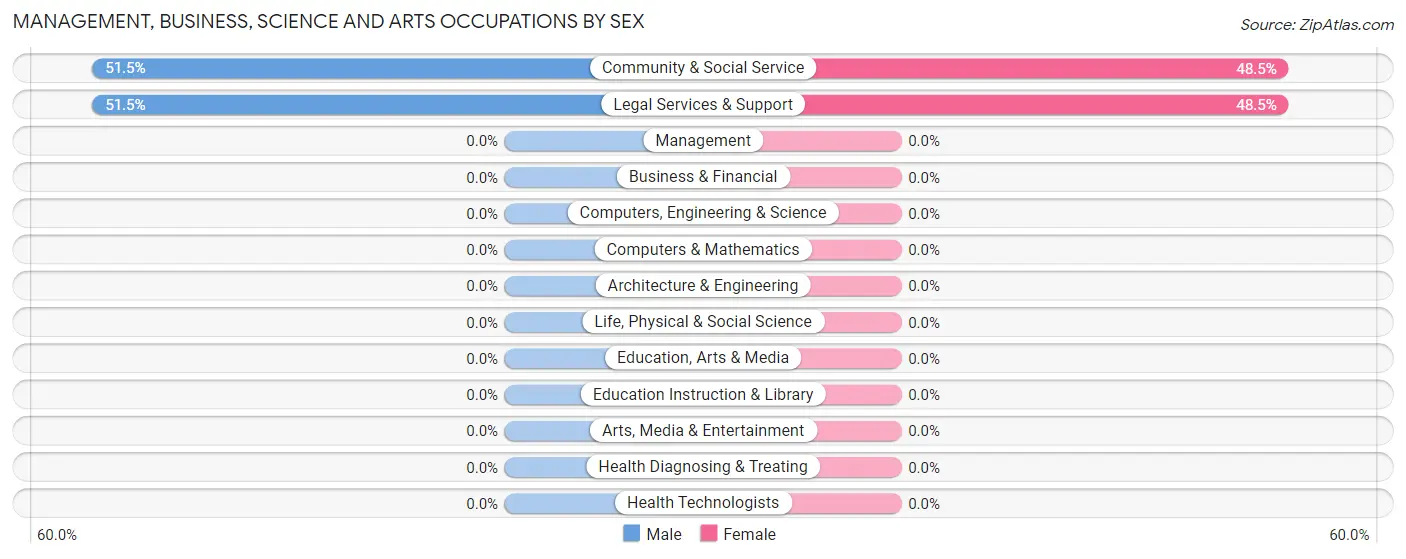
Management, Business, Science and Arts Occupations by Sex
Within the Management, Business, Science and Arts occupations in Edna, the most male-oriented occupations are Community & Social Service (51.5%), and Legal Services & Support (51.5%), while the most female-oriented occupations are Community & Social Service (48.5%), and Legal Services & Support (48.5%).
| Occupation | Male | Female |
| Management | 0 (0.0%) | 0 (0.0%) |
| Business & Financial | 0 (0.0%) | 0 (0.0%) |
| Computers, Engineering & Science | 0 (0.0%) | 0 (0.0%) |
| Computers & Mathematics | 0 (0.0%) | 0 (0.0%) |
| Architecture & Engineering | 0 (0.0%) | 0 (0.0%) |
| Life, Physical & Social Science | 0 (0.0%) | 0 (0.0%) |
| Community & Social Service | 17 (51.5%) | 16 (48.5%) |
| Education, Arts & Media | 0 (0.0%) | 0 (0.0%) |
| Legal Services & Support | 17 (51.5%) | 16 (48.5%) |
| Education Instruction & Library | 0 (0.0%) | 0 (0.0%) |
| Arts, Media & Entertainment | 0 (0.0%) | 0 (0.0%) |
| Health Diagnosing & Treating | 0 (0.0%) | 0 (0.0%) |
| Health Technologists | 0 (0.0%) | 0 (0.0%) |
| Total (Category) | 17 (51.5%) | 16 (48.5%) |
| Total (Overall) | 73 (82.0%) | 16 (18.0%) |
Services Occupations
Services Occupations by Sex
| Occupation | Male | Female |
| Healthcare Support | 0 (0.0%) | 0 (0.0%) |
| Security & Protection | 0 (0.0%) | 0 (0.0%) |
| Firefighting & Prevention | 0 (0.0%) | 0 (0.0%) |
| Law Enforcement | 0 (0.0%) | 0 (0.0%) |
| Food Preparation & Serving | 0 (0.0%) | 0 (0.0%) |
| Cleaning & Maintenance | 0 (0.0%) | 0 (0.0%) |
| Personal Care & Service | 0 (0.0%) | 0 (0.0%) |
| Total (Category) | 0 (0.0%) | 0 (0.0%) |
| Total (Overall) | 73 (82.0%) | 16 (18.0%) |
Sales and Office Occupations
Sales and Office Occupations by Sex
| Occupation | Male | Female |
| Sales & Related | 0 (0.0%) | 0 (0.0%) |
| Office & Administration | 0 (0.0%) | 0 (0.0%) |
| Total (Category) | 0 (0.0%) | 0 (0.0%) |
| Total (Overall) | 73 (82.0%) | 16 (18.0%) |
Natural Resources, Construction and Maintenance Occupations
The most common Natural Resources, Construction and Maintenance occupations in Edna are , and Farming, Fishing & Forestry (41 | 46.1%).
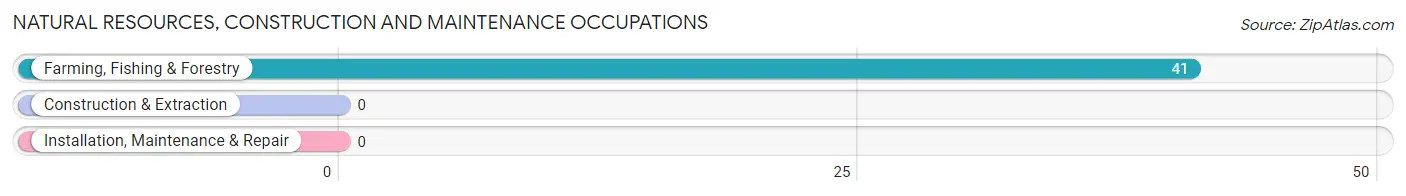
Natural Resources, Construction and Maintenance Occupations by Sex
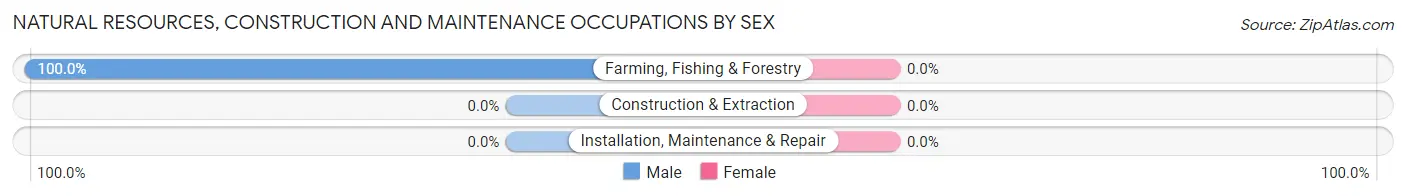
| Occupation | Male | Female |
| Farming, Fishing & Forestry | 41 (100.0%) | 0 (0.0%) |
| Construction & Extraction | 0 (0.0%) | 0 (0.0%) |
| Installation, Maintenance & Repair | 0 (0.0%) | 0 (0.0%) |
| Total (Category) | 41 (100.0%) | 0 (0.0%) |
| Total (Overall) | 73 (82.0%) | 16 (18.0%) |
Production, Transportation and Moving Occupations
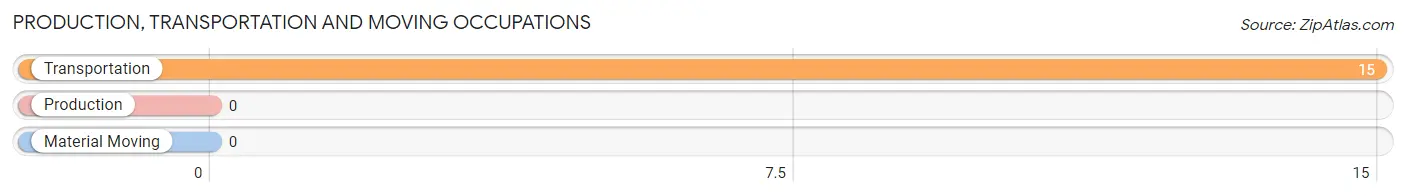
The most common Production, Transportation and Moving occupations in Edna are , and Transportation (15 | 16.9%).
Production, Transportation and Moving Occupations by Sex
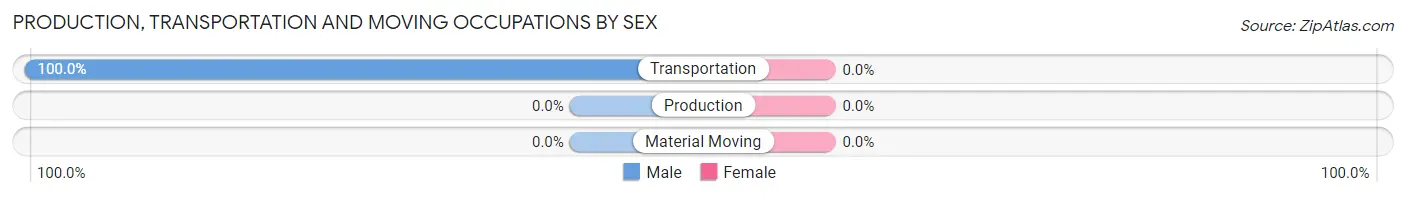
| Occupation | Male | Female |
| Production | 0 (0.0%) | 0 (0.0%) |
| Transportation | 15 (100.0%) | 0 (0.0%) |
| Material Moving | 0 (0.0%) | 0 (0.0%) |
| Total (Category) | 15 (100.0%) | 0 (0.0%) |
| Total (Overall) | 73 (82.0%) | 16 (18.0%) |
Employment Industries by Sex in Edna
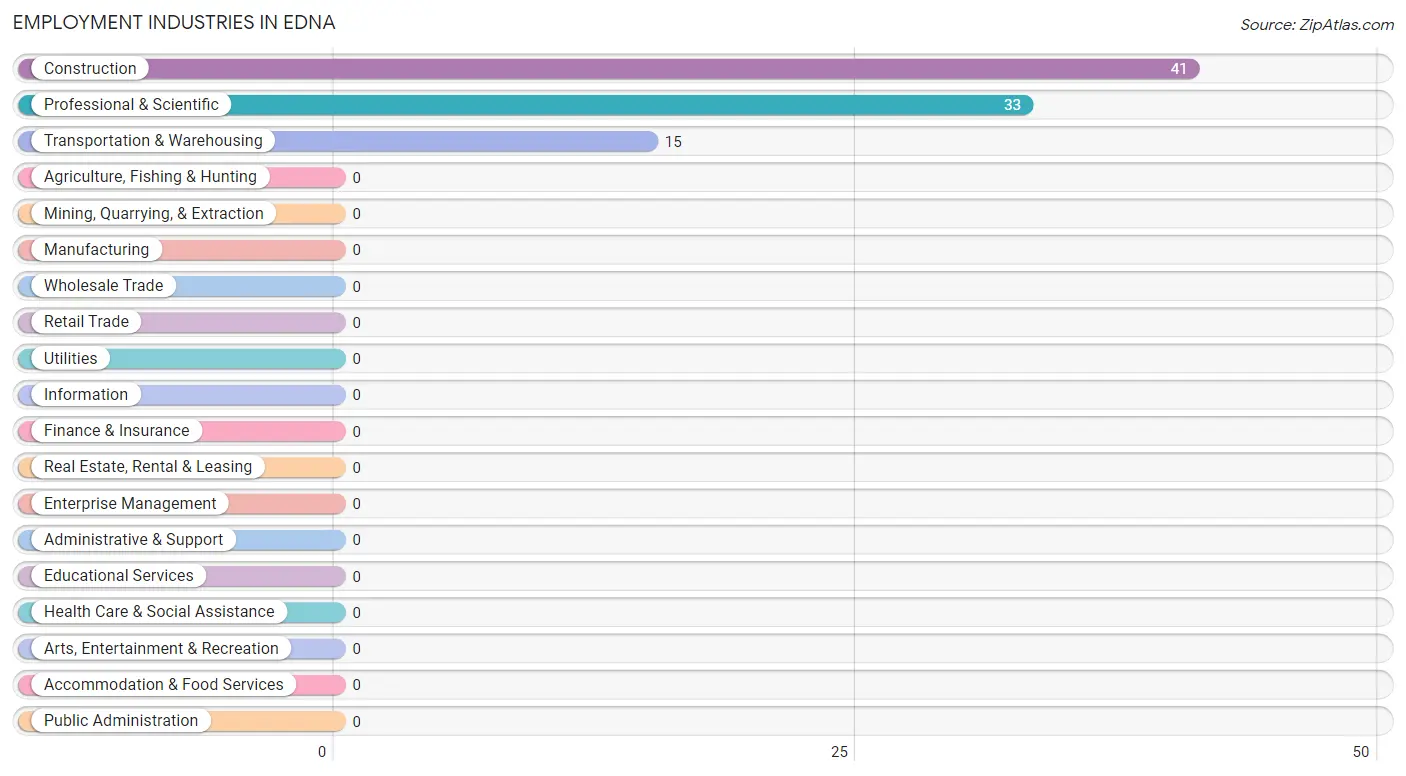
Employment Industries in Edna
The major employment industries in Edna include Construction (41 | 46.1%), Professional & Scientific (33 | 37.1%), and Transportation & Warehousing (15 | 16.9%).
Employment Industries by Sex in Edna
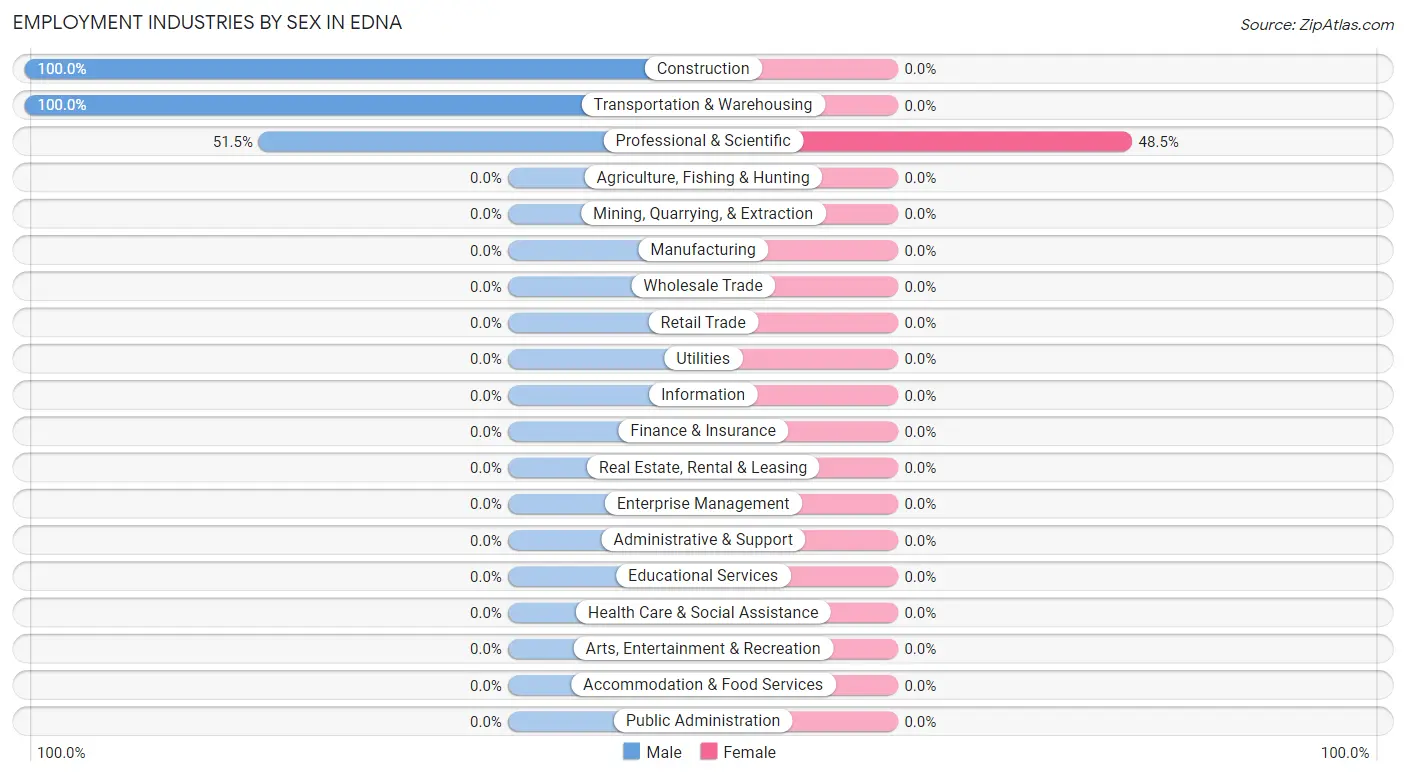
| Industry | Male | Female |
| Agriculture, Fishing & Hunting | 0 (0.0%) | 0 (0.0%) |
| Mining, Quarrying, & Extraction | 0 (0.0%) | 0 (0.0%) |
| Construction | 41 (100.0%) | 0 (0.0%) |
| Manufacturing | 0 (0.0%) | 0 (0.0%) |
| Wholesale Trade | 0 (0.0%) | 0 (0.0%) |
| Retail Trade | 0 (0.0%) | 0 (0.0%) |
| Transportation & Warehousing | 15 (100.0%) | 0 (0.0%) |
| Utilities | 0 (0.0%) | 0 (0.0%) |
| Information | 0 (0.0%) | 0 (0.0%) |
| Finance & Insurance | 0 (0.0%) | 0 (0.0%) |
| Real Estate, Rental & Leasing | 0 (0.0%) | 0 (0.0%) |
| Professional & Scientific | 17 (51.5%) | 16 (48.5%) |
| Enterprise Management | 0 (0.0%) | 0 (0.0%) |
| Administrative & Support | 0 (0.0%) | 0 (0.0%) |
| Educational Services | 0 (0.0%) | 0 (0.0%) |
| Health Care & Social Assistance | 0 (0.0%) | 0 (0.0%) |
| Arts, Entertainment & Recreation | 0 (0.0%) | 0 (0.0%) |
| Accommodation & Food Services | 0 (0.0%) | 0 (0.0%) |
| Public Administration | 0 (0.0%) | 0 (0.0%) |
| Total | 73 (82.0%) | 16 (18.0%) |
Education in Edna
School Enrollment in Edna
The most common levels of schooling among the 150 students in Edna are kindergarten (46 | 30.7%), nursery / preschool (45 | 30.0%), and college / undergraduate (26 | 17.3%).
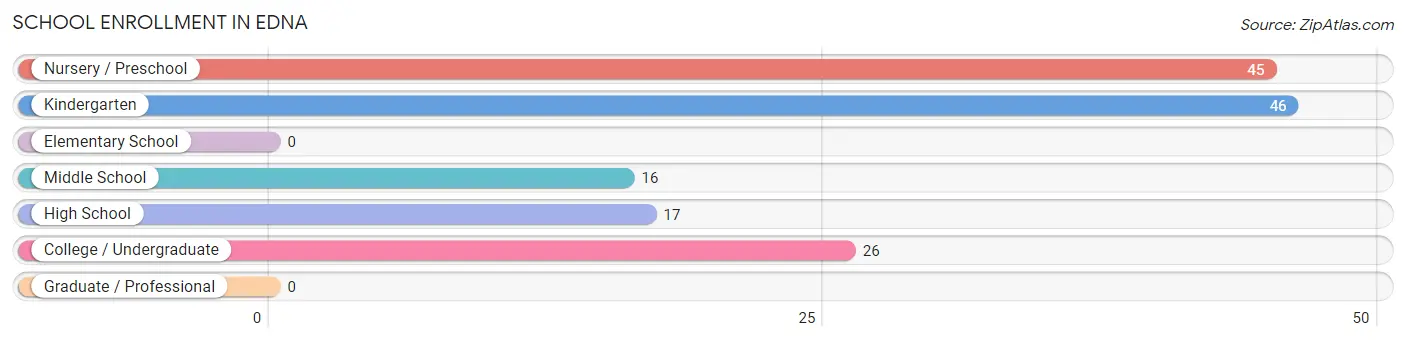
| School Level | # Students | % Students |
| Nursery / Preschool | 45 | 30.0% |
| Kindergarten | 46 | 30.7% |
| Elementary School | 0 | 0.0% |
| Middle School | 16 | 10.7% |
| High School | 17 | 11.3% |
| College / Undergraduate | 26 | 17.3% |
| Graduate / Professional | 0 | 0.0% |
| Total | 150 | 100.0% |
School Enrollment by Age by Funding Source in Edna
Out of a total of 150 students who are enrolled in schools in Edna, 107 (71.3%) attend a private institution, while the remaining 43 (28.7%) are enrolled in public schools. The age group of 3 to 4 year olds has the highest likelihood of being enrolled in private schools, with 45 (100.0% in the age bracket) enrolled. Conversely, the age group of 15 to 17 year olds has the lowest likelihood of being enrolled in a private school, with 17 (100.0% in the age bracket) attending a public institution.
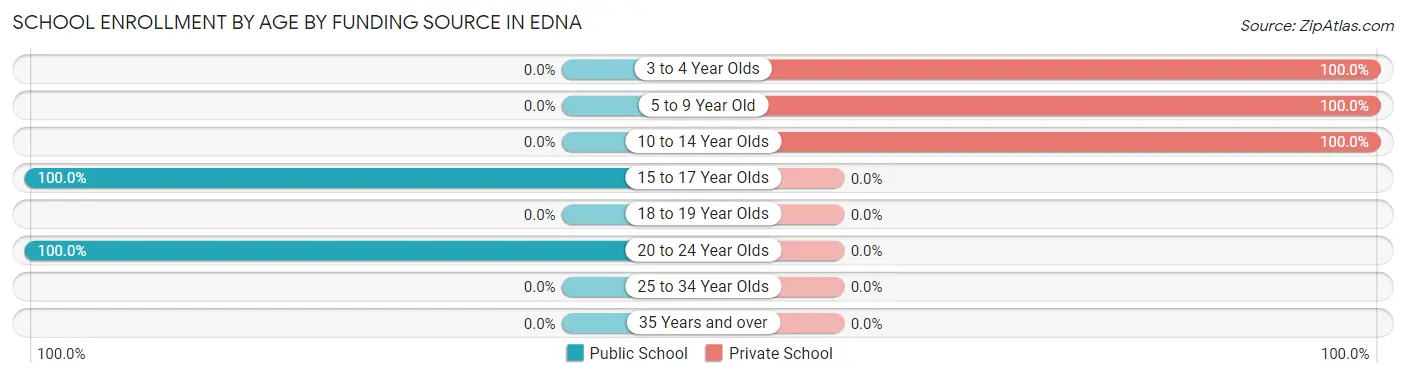
| Age Bracket | Public School | Private School |
| 3 to 4 Year Olds | 0 (0.0%) | 45 (100.0%) |
| 5 to 9 Year Old | 0 (0.0%) | 46 (100.0%) |
| 10 to 14 Year Olds | 0 (0.0%) | 16 (100.0%) |
| 15 to 17 Year Olds | 17 (100.0%) | 0 (0.0%) |
| 18 to 19 Year Olds | 0 (0.0%) | 0 (0.0%) |
| 20 to 24 Year Olds | 26 (100.0%) | 0 (0.0%) |
| 25 to 34 Year Olds | 0 (0.0%) | 0 (0.0%) |
| 35 Years and over | 0 (0.0%) | 0 (0.0%) |
| Total | 43 (28.7%) | 107 (71.3%) |
Educational Attainment by Field of Study in Edna
Engineering (39 | 34.5%), psychology (26 | 23.0%), social sciences (17 | 15.0%), literature & languages (16 | 14.2%), and liberal arts & history (15 | 13.3%) are the most common fields of study among 113 individuals in Edna who have obtained a bachelor's degree or higher.
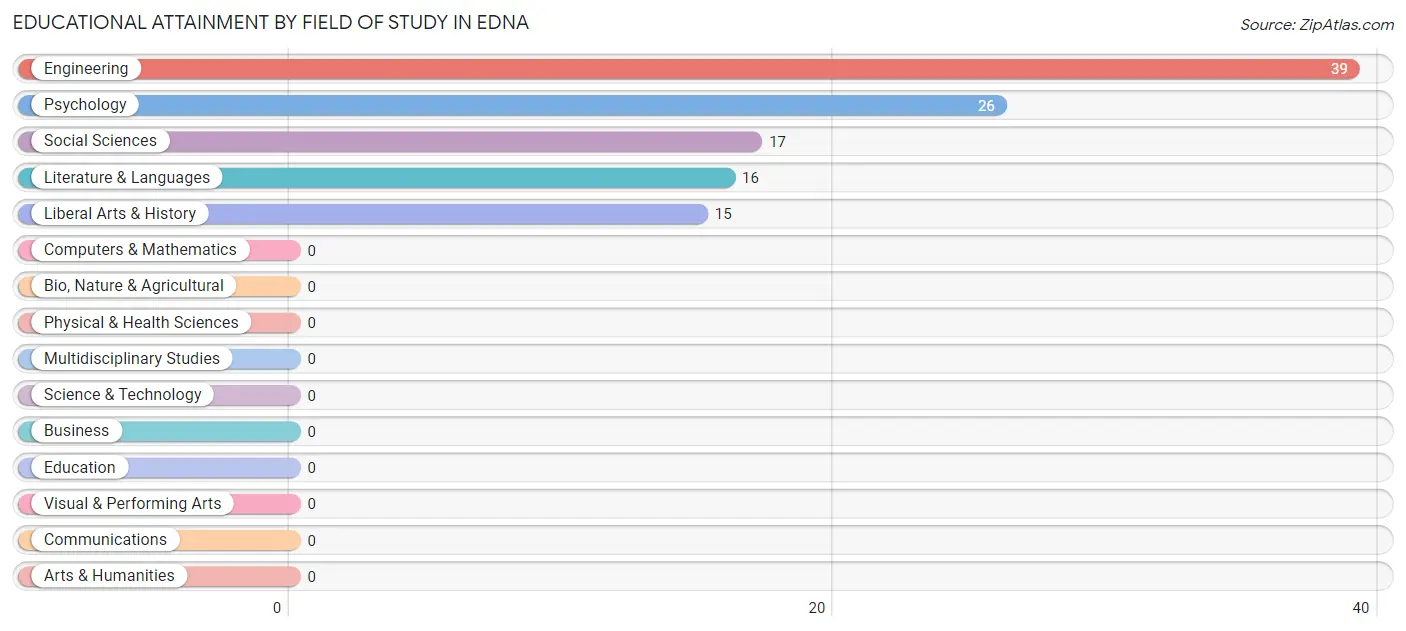
| Field of Study | # Graduates | % Graduates |
| Computers & Mathematics | 0 | 0.0% |
| Bio, Nature & Agricultural | 0 | 0.0% |
| Physical & Health Sciences | 0 | 0.0% |
| Psychology | 26 | 23.0% |
| Social Sciences | 17 | 15.0% |
| Engineering | 39 | 34.5% |
| Multidisciplinary Studies | 0 | 0.0% |
| Science & Technology | 0 | 0.0% |
| Business | 0 | 0.0% |
| Education | 0 | 0.0% |
| Literature & Languages | 16 | 14.2% |
| Liberal Arts & History | 15 | 13.3% |
| Visual & Performing Arts | 0 | 0.0% |
| Communications | 0 | 0.0% |
| Arts & Humanities | 0 | 0.0% |
| Total | 113 | 100.0% |
Transportation & Commute in Edna
Vehicle Availability by Sex in Edna
The most prevalent vehicle ownership categories in Edna are males with 2 vehicles (56, accounting for 76.7%) and females with 2 vehicles (0, making up 350.0%).
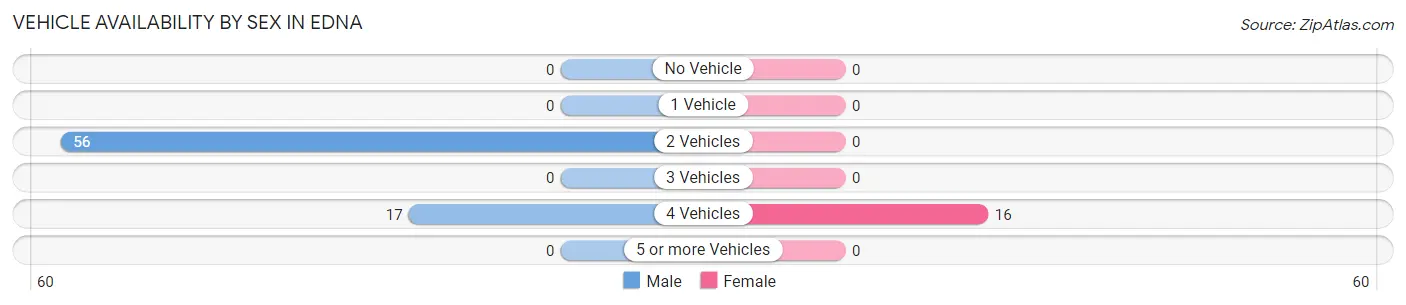
| Vehicles Available | Male | Female |
| No Vehicle | 0 (0.0%) | 0 (0.0%) |
| 1 Vehicle | 0 (0.0%) | 0 (0.0%) |
| 2 Vehicles | 56 (76.7%) | 0 (0.0%) |
| 3 Vehicles | 0 (0.0%) | 0 (0.0%) |
| 4 Vehicles | 17 (23.3%) | 16 (100.0%) |
| 5 or more Vehicles | 0 (0.0%) | 0 (0.0%) |
| Total | 73 (100.0%) | 16 (100.0%) |
Commute Time in Edna
The most frequently occuring commute durations in Edna are 15 to 19 minutes (56 commuters, 77.8%), 10 to 14 minutes (16 commuters, 22.2%), and less than 5 minutes (0 commuters, 0.0%).
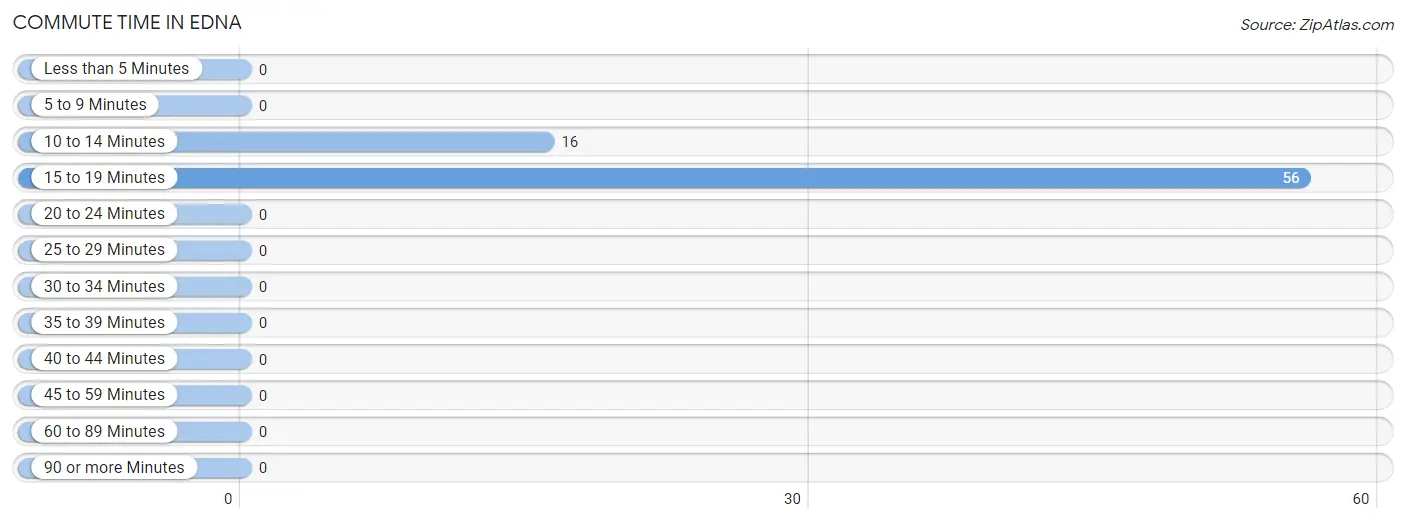
| Commute Time | # Commuters | % Commuters |
| Less than 5 Minutes | 0 | 0.0% |
| 5 to 9 Minutes | 0 | 0.0% |
| 10 to 14 Minutes | 16 | 22.2% |
| 15 to 19 Minutes | 56 | 77.8% |
| 20 to 24 Minutes | 0 | 0.0% |
| 25 to 29 Minutes | 0 | 0.0% |
| 30 to 34 Minutes | 0 | 0.0% |
| 35 to 39 Minutes | 0 | 0.0% |
| 40 to 44 Minutes | 0 | 0.0% |
| 45 to 59 Minutes | 0 | 0.0% |
| 60 to 89 Minutes | 0 | 0.0% |
| 90 or more Minutes | 0 | 0.0% |
Commute Time by Sex in Edna
The most common commute times in Edna are 15 to 19 minutes (56 commuters, 100.0%) for males and 10 to 14 minutes (16 commuters, 100.0%) for females.
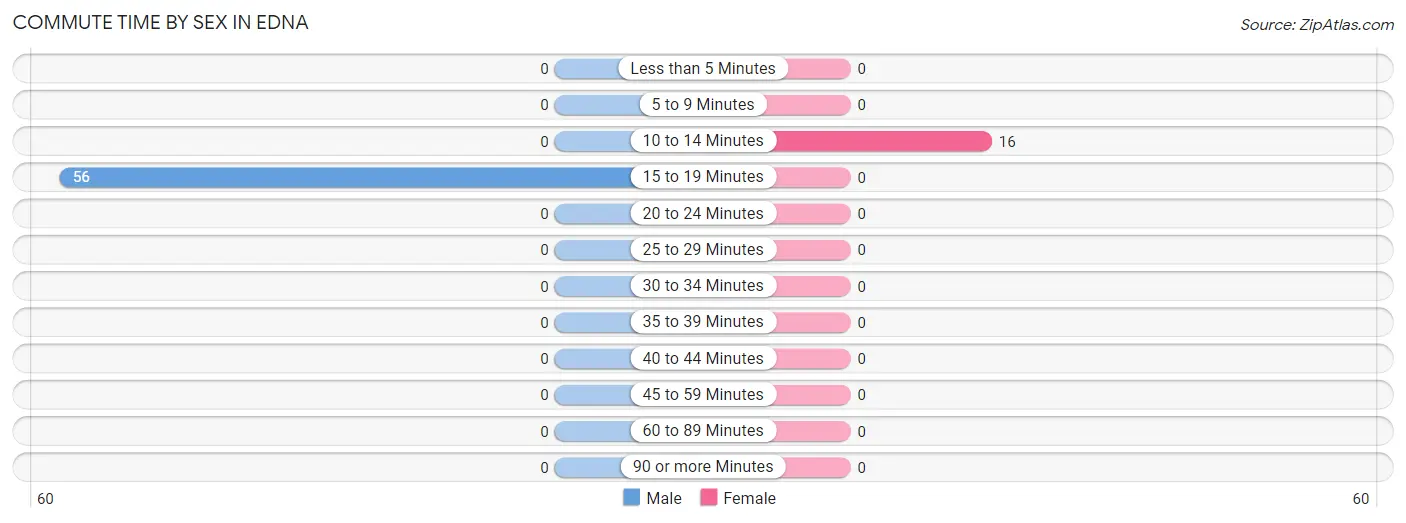
| Commute Time | Male | Female |
| Less than 5 Minutes | 0 (0.0%) | 0 (0.0%) |
| 5 to 9 Minutes | 0 (0.0%) | 0 (0.0%) |
| 10 to 14 Minutes | 0 (0.0%) | 16 (100.0%) |
| 15 to 19 Minutes | 56 (100.0%) | 0 (0.0%) |
| 20 to 24 Minutes | 0 (0.0%) | 0 (0.0%) |
| 25 to 29 Minutes | 0 (0.0%) | 0 (0.0%) |
| 30 to 34 Minutes | 0 (0.0%) | 0 (0.0%) |
| 35 to 39 Minutes | 0 (0.0%) | 0 (0.0%) |
| 40 to 44 Minutes | 0 (0.0%) | 0 (0.0%) |
| 45 to 59 Minutes | 0 (0.0%) | 0 (0.0%) |
| 60 to 89 Minutes | 0 (0.0%) | 0 (0.0%) |
| 90 or more Minutes | 0 (0.0%) | 0 (0.0%) |
Time of Departure to Work by Sex in Edna
The most frequent times of departure to work in Edna are 8:00 AM to 8:29 AM (41, 73.2%) for males and 7:30 AM to 7:59 AM (16, 100.0%) for females.
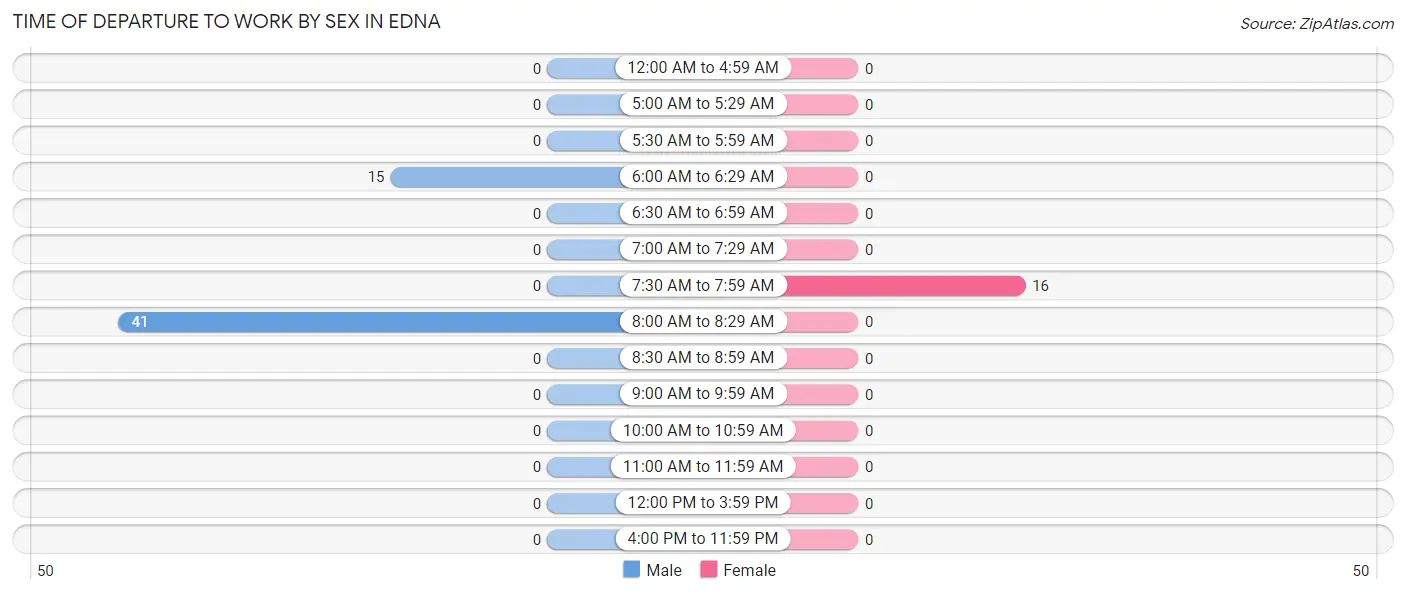
| Time of Departure | Male | Female |
| 12:00 AM to 4:59 AM | 0 (0.0%) | 0 (0.0%) |
| 5:00 AM to 5:29 AM | 0 (0.0%) | 0 (0.0%) |
| 5:30 AM to 5:59 AM | 0 (0.0%) | 0 (0.0%) |
| 6:00 AM to 6:29 AM | 15 (26.8%) | 0 (0.0%) |
| 6:30 AM to 6:59 AM | 0 (0.0%) | 0 (0.0%) |
| 7:00 AM to 7:29 AM | 0 (0.0%) | 0 (0.0%) |
| 7:30 AM to 7:59 AM | 0 (0.0%) | 16 (100.0%) |
| 8:00 AM to 8:29 AM | 41 (73.2%) | 0 (0.0%) |
| 8:30 AM to 8:59 AM | 0 (0.0%) | 0 (0.0%) |
| 9:00 AM to 9:59 AM | 0 (0.0%) | 0 (0.0%) |
| 10:00 AM to 10:59 AM | 0 (0.0%) | 0 (0.0%) |
| 11:00 AM to 11:59 AM | 0 (0.0%) | 0 (0.0%) |
| 12:00 PM to 3:59 PM | 0 (0.0%) | 0 (0.0%) |
| 4:00 PM to 11:59 PM | 0 (0.0%) | 0 (0.0%) |
| Total | 56 (100.0%) | 16 (100.0%) |
Housing Occupancy in Edna
Occupancy by Ownership in Edna
Of the total 104 dwellings in Edna, owner-occupied units account for 104 (100.0%), while renter-occupied units make up 0 (0.0%).
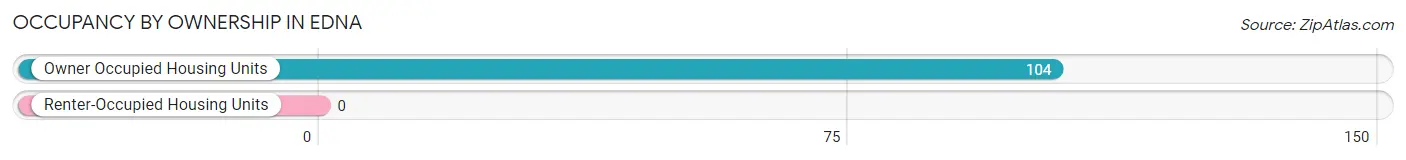
| Occupancy | # Housing Units | % Housing Units |
| Owner Occupied Housing Units | 104 | 100.0% |
| Renter-Occupied Housing Units | 0 | 0.0% |
| Total Occupied Housing Units | 104 | 100.0% |
Occupancy by Household Size in Edna
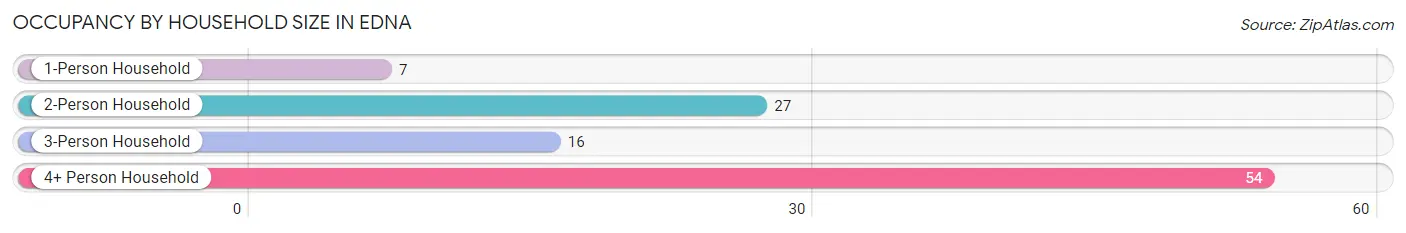
| Household Size | # Housing Units | % Housing Units |
| 1-Person Household | 7 | 6.7% |
| 2-Person Household | 27 | 26.0% |
| 3-Person Household | 16 | 15.4% |
| 4+ Person Household | 54 | 51.9% |
| Total Housing Units | 104 | 100.0% |
Occupancy by Ownership by Household Size in Edna
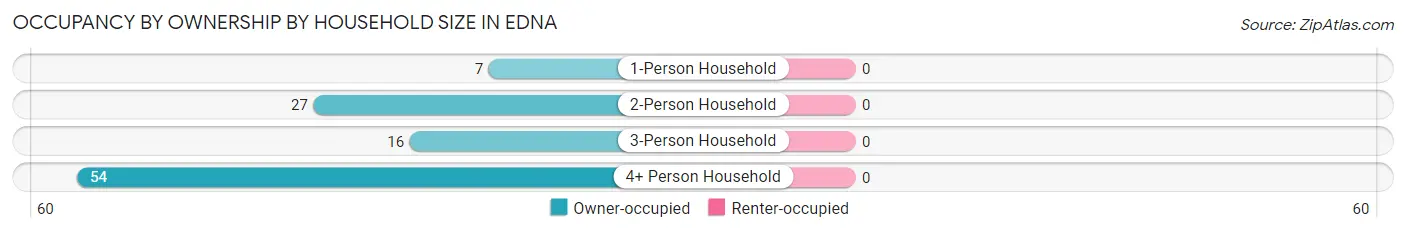
| Household Size | Owner-occupied | Renter-occupied |
| 1-Person Household | 7 (100.0%) | 0 (0.0%) |
| 2-Person Household | 27 (100.0%) | 0 (0.0%) |
| 3-Person Household | 16 (100.0%) | 0 (0.0%) |
| 4+ Person Household | 54 (100.0%) | 0 (0.0%) |
| Total Housing Units | 104 (100.0%) | 0 (0.0%) |
Occupancy by Educational Attainment in Edna
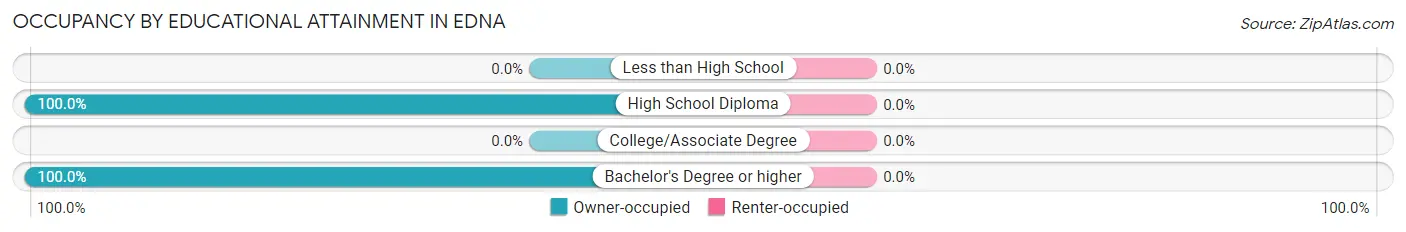
| Household Size | Owner-occupied | Renter-occupied |
| Less than High School | 0 (0.0%) | 0 (0.0%) |
| High School Diploma | 8 (100.0%) | 0 (0.0%) |
| College/Associate Degree | 0 (0.0%) | 0 (0.0%) |
| Bachelor's Degree or higher | 96 (100.0%) | 0 (0.0%) |
Occupancy by Age of Householder in Edna
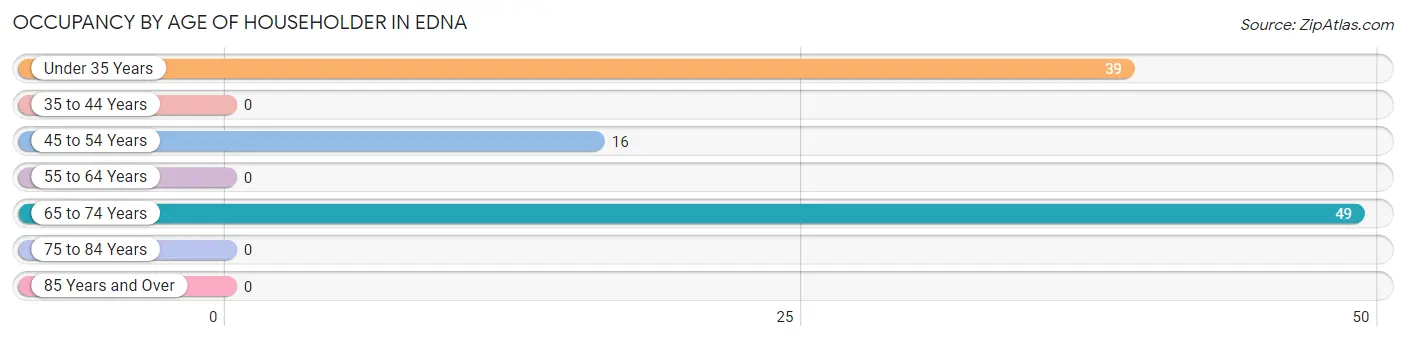
| Age Bracket | # Households | % Households |
| Under 35 Years | 39 | 37.5% |
| 35 to 44 Years | 0 | 0.0% |
| 45 to 54 Years | 16 | 15.4% |
| 55 to 64 Years | 0 | 0.0% |
| 65 to 74 Years | 49 | 47.1% |
| 75 to 84 Years | 0 | 0.0% |
| 85 Years and Over | 0 | 0.0% |
| Total | 104 | 100.0% |
Housing Finances in Edna
Median Income by Occupancy in Edna
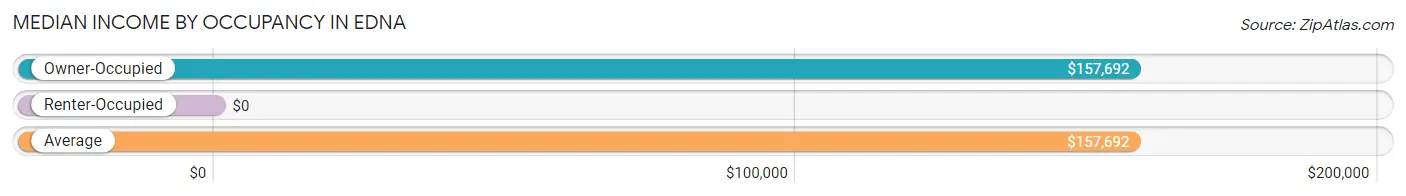
| Occupancy Type | # Households | Median Income |
| Owner-Occupied | 104 (100.0%) | $157,692 |
| Renter-Occupied | 0 (0.0%) | $0 |
| Average | 104 (100.0%) | $157,692 |
Occupancy by Householder Income Bracket in Edna
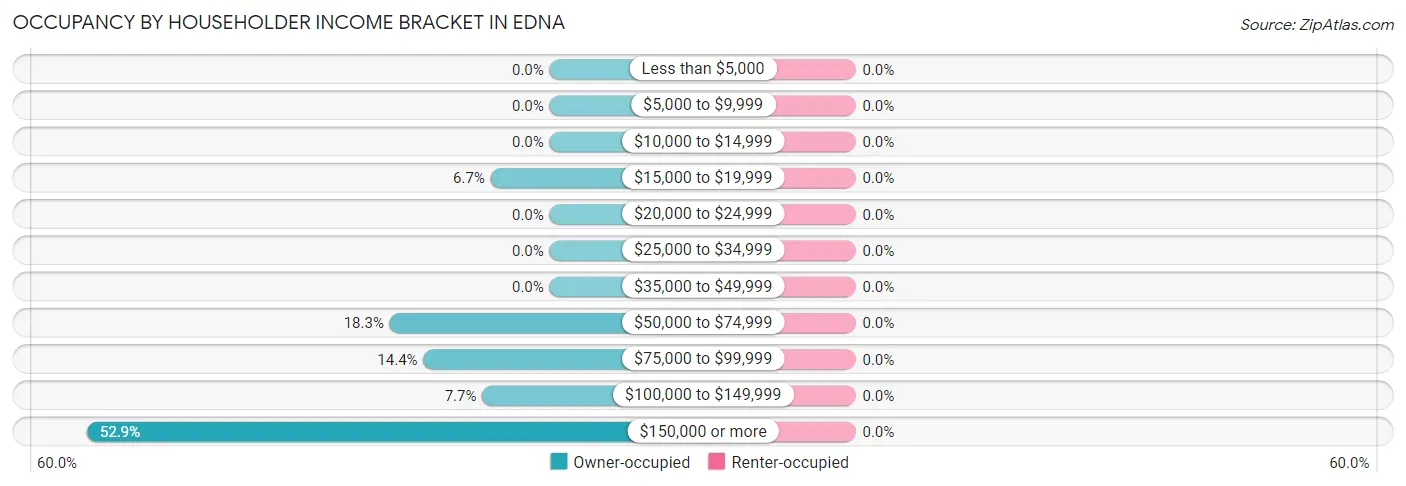
| Income Bracket | Owner-occupied | Renter-occupied |
| Less than $5,000 | 0 (0.0%) | 0 (0.0%) |
| $5,000 to $9,999 | 0 (0.0%) | 0 (0.0%) |
| $10,000 to $14,999 | 0 (0.0%) | 0 (0.0%) |
| $15,000 to $19,999 | 7 (6.7%) | 0 (0.0%) |
| $20,000 to $24,999 | 0 (0.0%) | 0 (0.0%) |
| $25,000 to $34,999 | 0 (0.0%) | 0 (0.0%) |
| $35,000 to $49,999 | 0 (0.0%) | 0 (0.0%) |
| $50,000 to $74,999 | 19 (18.3%) | 0 (0.0%) |
| $75,000 to $99,999 | 15 (14.4%) | 0 (0.0%) |
| $100,000 to $149,999 | 8 (7.7%) | 0 (0.0%) |
| $150,000 or more | 55 (52.9%) | 0 (0.0%) |
| Total | 104 (100.0%) | 0 (0.0%) |
Monthly Housing Cost Tiers in Edna
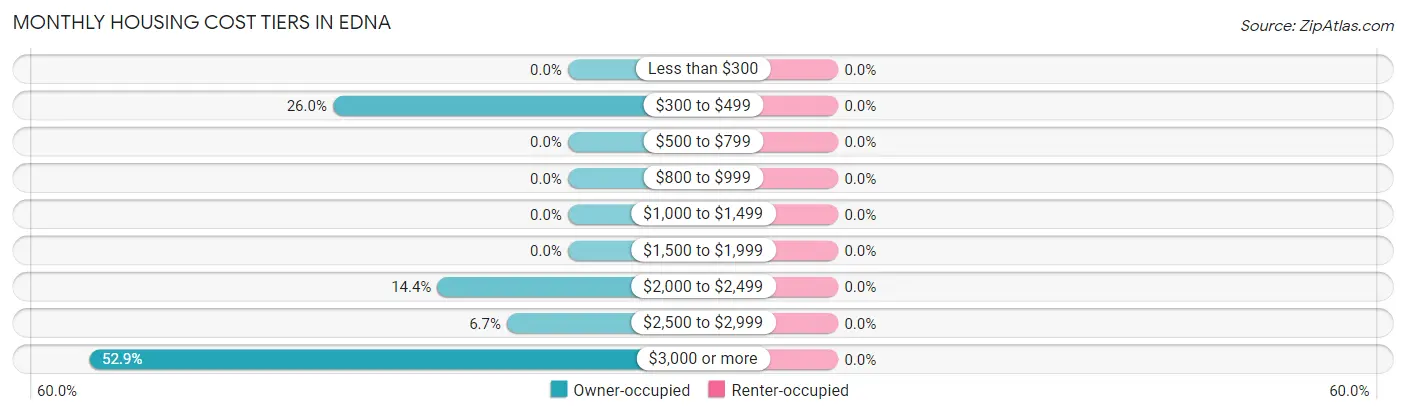
| Monthly Cost | Owner-occupied | Renter-occupied |
| Less than $300 | 0 (0.0%) | 0 (0.0%) |
| $300 to $499 | 27 (26.0%) | 0 (0.0%) |
| $500 to $799 | 0 (0.0%) | 0 (0.0%) |
| $800 to $999 | 0 (0.0%) | 0 (0.0%) |
| $1,000 to $1,499 | 0 (0.0%) | 0 (0.0%) |
| $1,500 to $1,999 | 0 (0.0%) | 0 (0.0%) |
| $2,000 to $2,499 | 15 (14.4%) | 0 (0.0%) |
| $2,500 to $2,999 | 7 (6.7%) | 0 (0.0%) |
| $3,000 or more | 55 (52.9%) | 0 (0.0%) |
| Total | 104 (100.0%) | 0 (0.0%) |
Physical Housing Characteristics in Edna
Housing Structures in Edna
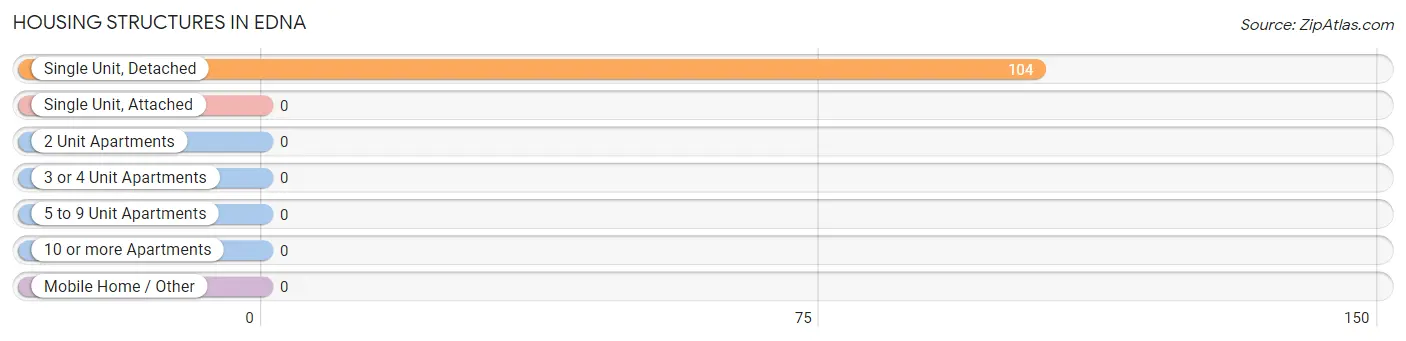
| Structure Type | # Housing Units | % Housing Units |
| Single Unit, Detached | 104 | 100.0% |
| Single Unit, Attached | 0 | 0.0% |
| 2 Unit Apartments | 0 | 0.0% |
| 3 or 4 Unit Apartments | 0 | 0.0% |
| 5 to 9 Unit Apartments | 0 | 0.0% |
| 10 or more Apartments | 0 | 0.0% |
| Mobile Home / Other | 0 | 0.0% |
| Total | 104 | 100.0% |
Housing Structures by Occupancy in Edna
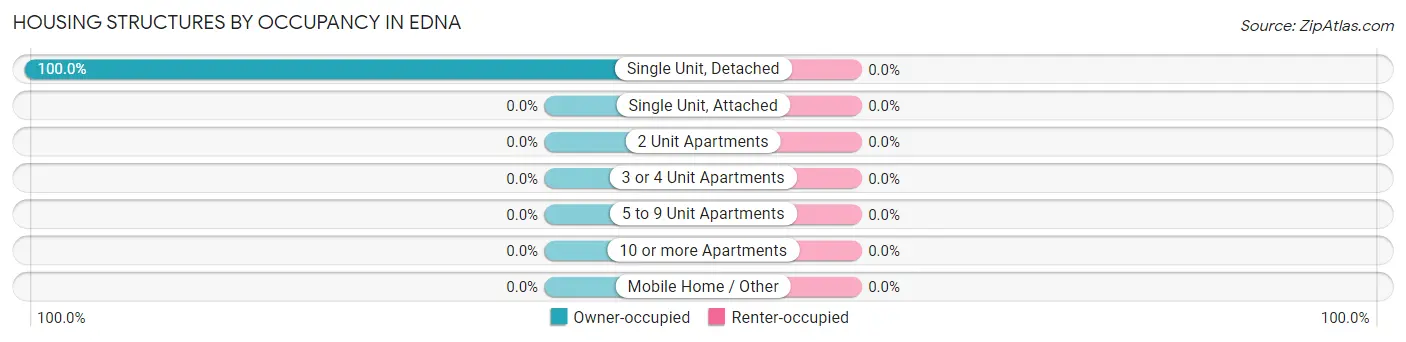
| Structure Type | Owner-occupied | Renter-occupied |
| Single Unit, Detached | 104 (100.0%) | 0 (0.0%) |
| Single Unit, Attached | 0 (0.0%) | 0 (0.0%) |
| 2 Unit Apartments | 0 (0.0%) | 0 (0.0%) |
| 3 or 4 Unit Apartments | 0 (0.0%) | 0 (0.0%) |
| 5 to 9 Unit Apartments | 0 (0.0%) | 0 (0.0%) |
| 10 or more Apartments | 0 (0.0%) | 0 (0.0%) |
| Mobile Home / Other | 0 (0.0%) | 0 (0.0%) |
| Total | 104 (100.0%) | 0 (0.0%) |
Housing Structures by Number of Rooms in Edna
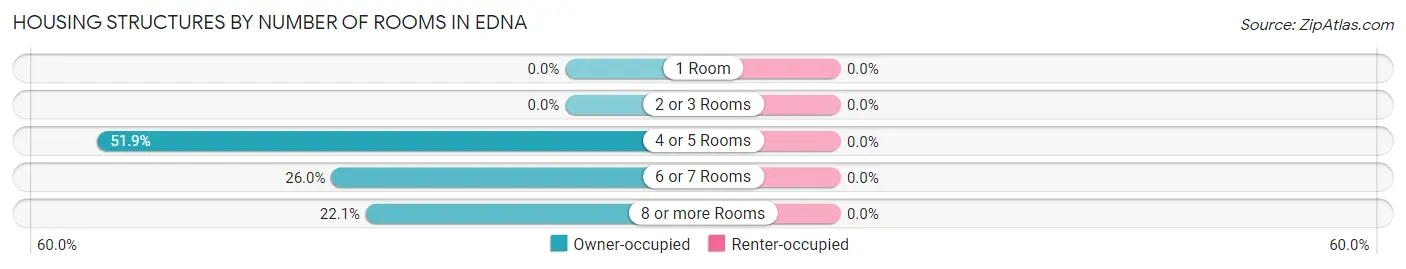
| Number of Rooms | Owner-occupied | Renter-occupied |
| 1 Room | 0 (0.0%) | 0 (0.0%) |
| 2 or 3 Rooms | 0 (0.0%) | 0 (0.0%) |
| 4 or 5 Rooms | 54 (51.9%) | 0 (0.0%) |
| 6 or 7 Rooms | 27 (26.0%) | 0 (0.0%) |
| 8 or more Rooms | 23 (22.1%) | 0 (0.0%) |
| Total | 104 (100.0%) | 0 (0.0%) |
Housing Structure by Heating Type in Edna
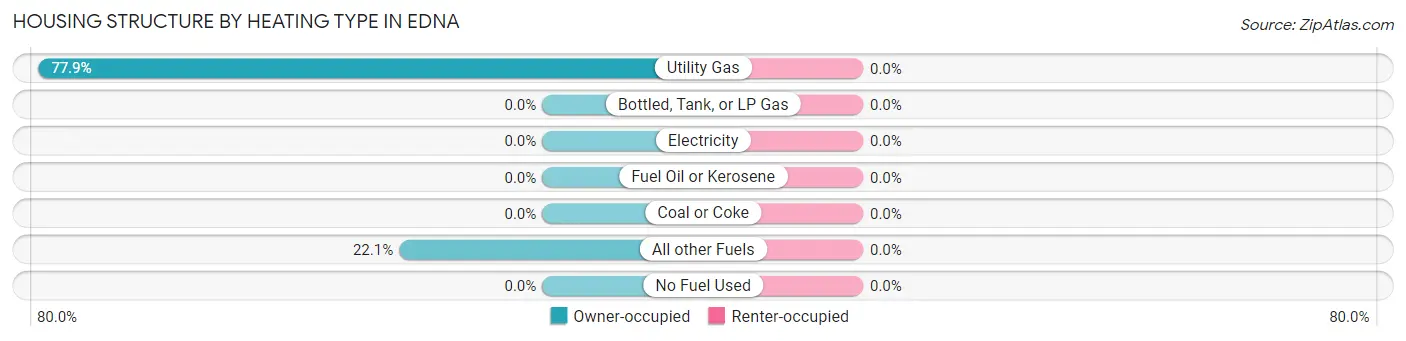
| Heating Type | Owner-occupied | Renter-occupied |
| Utility Gas | 81 (77.9%) | 0 (0.0%) |
| Bottled, Tank, or LP Gas | 0 (0.0%) | 0 (0.0%) |
| Electricity | 0 (0.0%) | 0 (0.0%) |
| Fuel Oil or Kerosene | 0 (0.0%) | 0 (0.0%) |
| Coal or Coke | 0 (0.0%) | 0 (0.0%) |
| All other Fuels | 23 (22.1%) | 0 (0.0%) |
| No Fuel Used | 0 (0.0%) | 0 (0.0%) |
| Total | 104 (100.0%) | 0 (0.0%) |
Household Vehicle Usage in Edna
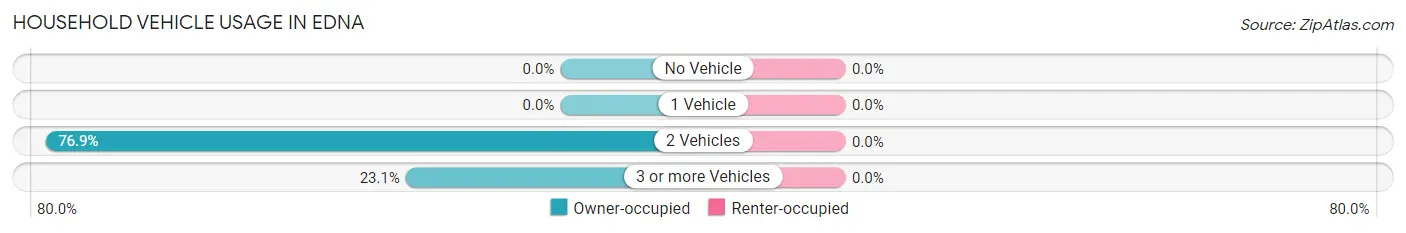
| Vehicles per Household | Owner-occupied | Renter-occupied |
| No Vehicle | 0 (0.0%) | 0 (0.0%) |
| 1 Vehicle | 0 (0.0%) | 0 (0.0%) |
| 2 Vehicles | 80 (76.9%) | 0 (0.0%) |
| 3 or more Vehicles | 24 (23.1%) | 0 (0.0%) |
| Total | 104 (100.0%) | 0 (0.0%) |
Real Estate & Mortgages in Edna
Real Estate and Mortgage Overview in Edna
| Characteristic | Without Mortgage | With Mortgage |
| Housing Units | 27 | 77 |
| Median Property Value | - | - |
| Median Household Income | - | - |
| Monthly Housing Costs | - | - |
| Real Estate Taxes | - | - |
Property Value by Mortgage Status in Edna
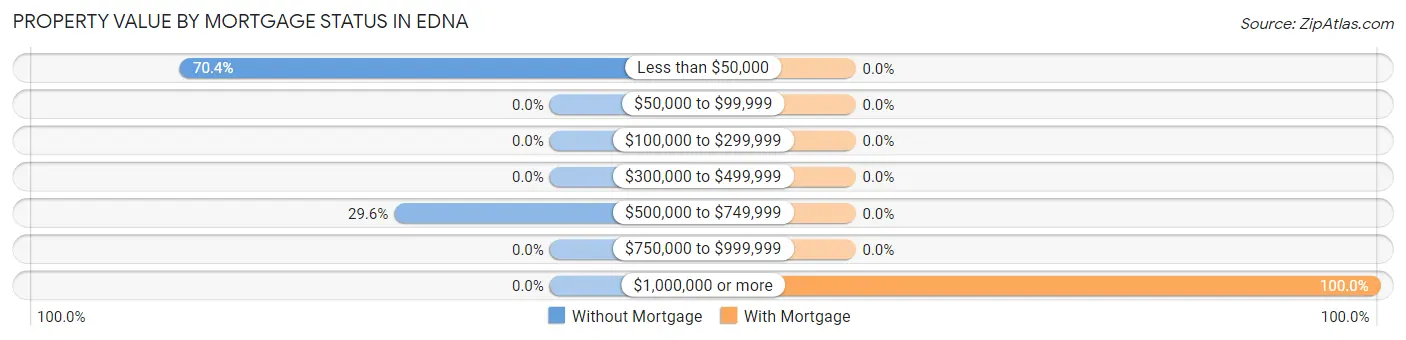
| Property Value | Without Mortgage | With Mortgage |
| Less than $50,000 | 19 (70.4%) | 0 (0.0%) |
| $50,000 to $99,999 | 0 (0.0%) | 0 (0.0%) |
| $100,000 to $299,999 | 0 (0.0%) | 0 (0.0%) |
| $300,000 to $499,999 | 0 (0.0%) | 0 (0.0%) |
| $500,000 to $749,999 | 8 (29.6%) | 0 (0.0%) |
| $750,000 to $999,999 | 0 (0.0%) | 0 (0.0%) |
| $1,000,000 or more | 0 (0.0%) | 77 (100.0%) |
| Total | 27 (100.0%) | 77 (100.0%) |
Household Income by Mortgage Status in Edna
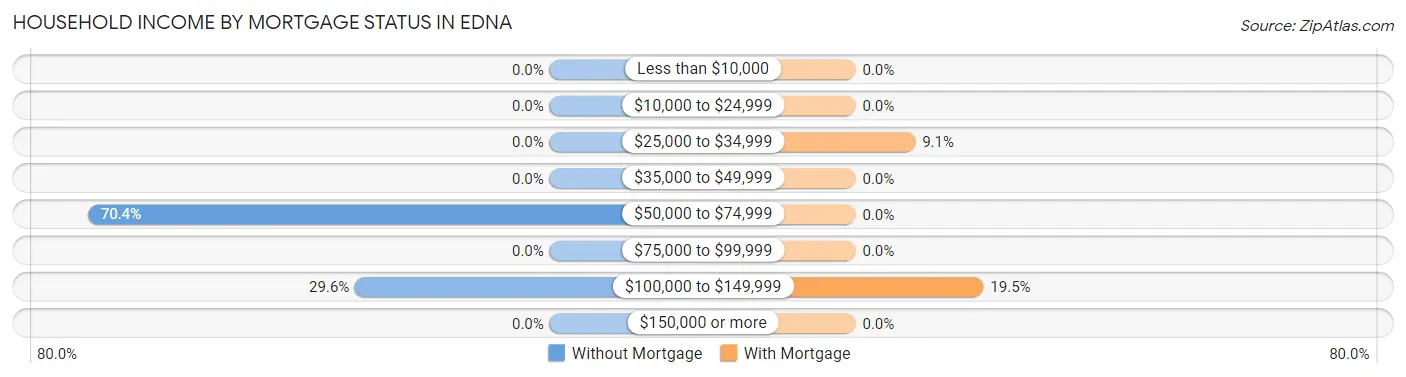
| Household Income | Without Mortgage | With Mortgage |
| Less than $10,000 | 0 (0.0%) | 0 (0.0%) |
| $10,000 to $24,999 | 0 (0.0%) | 0 (0.0%) |
| $25,000 to $34,999 | 0 (0.0%) | 7 (9.1%) |
| $35,000 to $49,999 | 0 (0.0%) | 0 (0.0%) |
| $50,000 to $74,999 | 19 (70.4%) | 0 (0.0%) |
| $75,000 to $99,999 | 0 (0.0%) | 0 (0.0%) |
| $100,000 to $149,999 | 8 (29.6%) | 15 (19.5%) |
| $150,000 or more | 0 (0.0%) | 0 (0.0%) |
| Total | 27 (100.0%) | 77 (100.0%) |
Property Value to Household Income Ratio in Edna
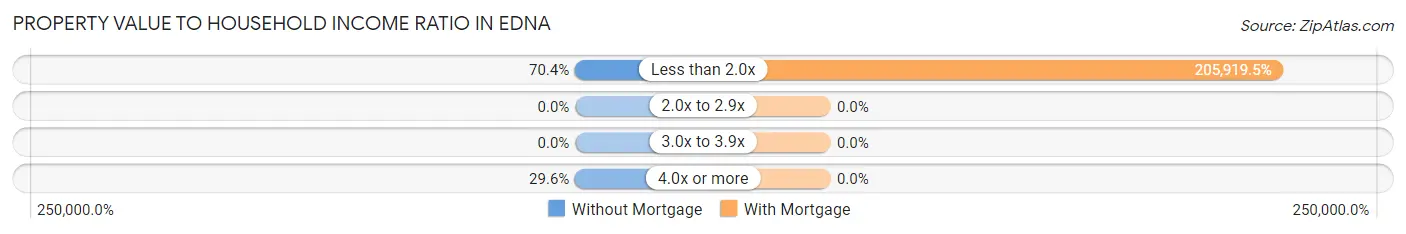
| Value-to-Income Ratio | Without Mortgage | With Mortgage |
| Less than 2.0x | 19 (70.4%) | 158,558 (205,919.5%) |
| 2.0x to 2.9x | 0 (0.0%) | 0 (0.0%) |
| 3.0x to 3.9x | 0 (0.0%) | 0 (0.0%) |
| 4.0x or more | 8 (29.6%) | 0 (0.0%) |
| Total | 27 (100.0%) | 77 (100.0%) |
Real Estate Taxes by Mortgage Status in Edna
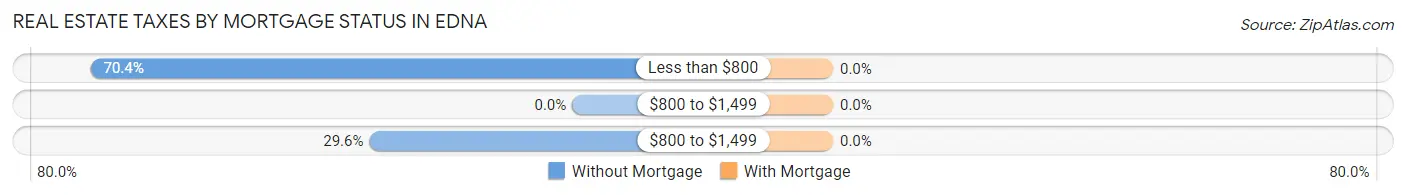
| Property Taxes | Without Mortgage | With Mortgage |
| Less than $800 | 19 (70.4%) | 0 (0.0%) |
| $800 to $1,499 | 0 (0.0%) | 0 (0.0%) |
| $800 to $1,499 | 8 (29.6%) | 0 (0.0%) |
| Total | 27 (100.0%) | 77 (100.0%) |
Health & Disability in Edna
Health Insurance Coverage by Age in Edna
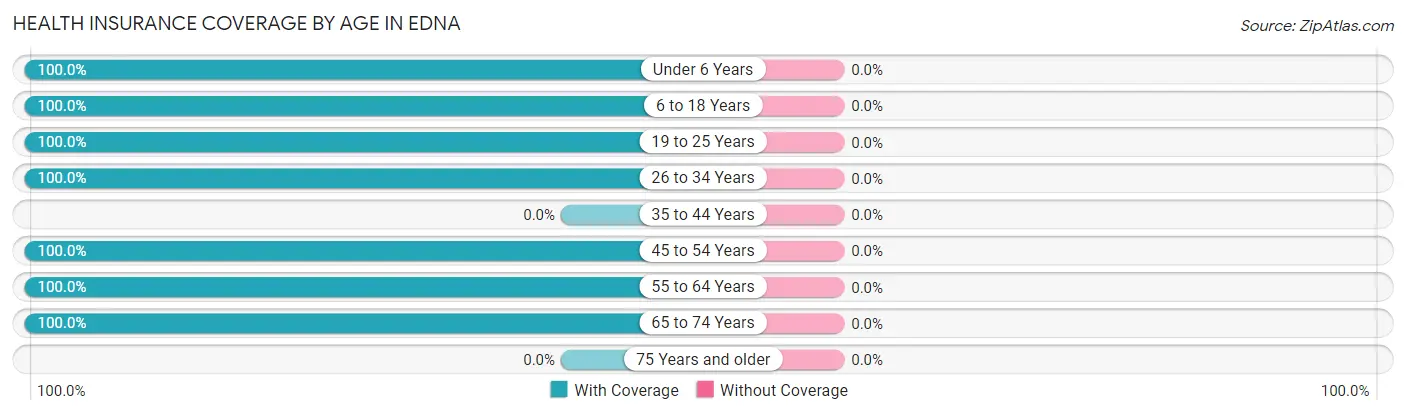
| Age Bracket | With Coverage | Without Coverage |
| Under 6 Years | 45 (100.0%) | 0 (0.0%) |
| 6 to 18 Years | 79 (100.0%) | 0 (0.0%) |
| 19 to 25 Years | 26 (100.0%) | 0 (0.0%) |
| 26 to 34 Years | 80 (100.0%) | 0 (0.0%) |
| 35 to 44 Years | 0 (0.0%) | 0 (0.0%) |
| 45 to 54 Years | 33 (100.0%) | 0 (0.0%) |
| 55 to 64 Years | 8 (100.0%) | 0 (0.0%) |
| 65 to 74 Years | 84 (100.0%) | 0 (0.0%) |
| 75 Years and older | 0 (0.0%) | 0 (0.0%) |
| Total | 355 (100.0%) | 0 (0.0%) |
Health Insurance Coverage by Citizenship Status in Edna
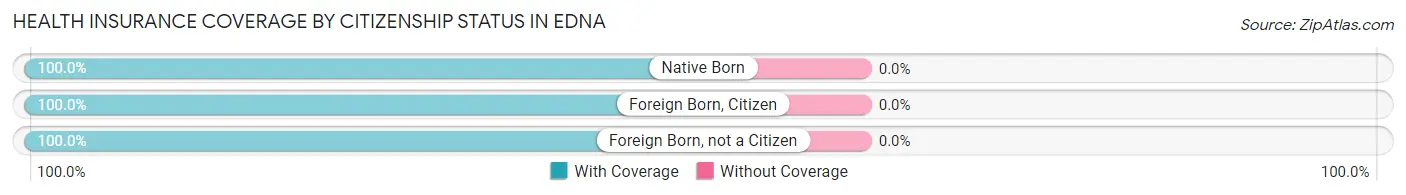
| Citizenship Status | With Coverage | Without Coverage |
| Native Born | 45 (100.0%) | 0 (0.0%) |
| Foreign Born, Citizen | 79 (100.0%) | 0 (0.0%) |
| Foreign Born, not a Citizen | 26 (100.0%) | 0 (0.0%) |
Health Insurance Coverage by Household Income in Edna
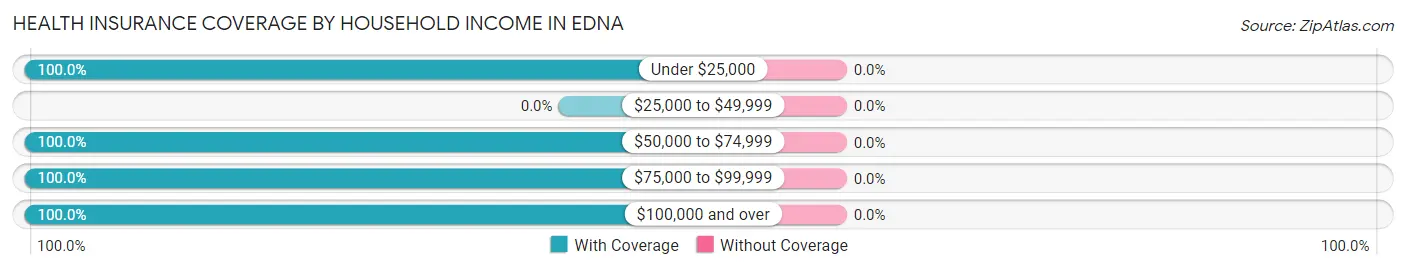
| Household Income | With Coverage | Without Coverage |
| Under $25,000 | 7 (100.0%) | 0 (0.0%) |
| $25,000 to $49,999 | 0 (0.0%) | 0 (0.0%) |
| $50,000 to $74,999 | 39 (100.0%) | 0 (0.0%) |
| $75,000 to $99,999 | 73 (100.0%) | 0 (0.0%) |
| $100,000 and over | 236 (100.0%) | 0 (0.0%) |
Public vs Private Health Insurance Coverage by Age in Edna
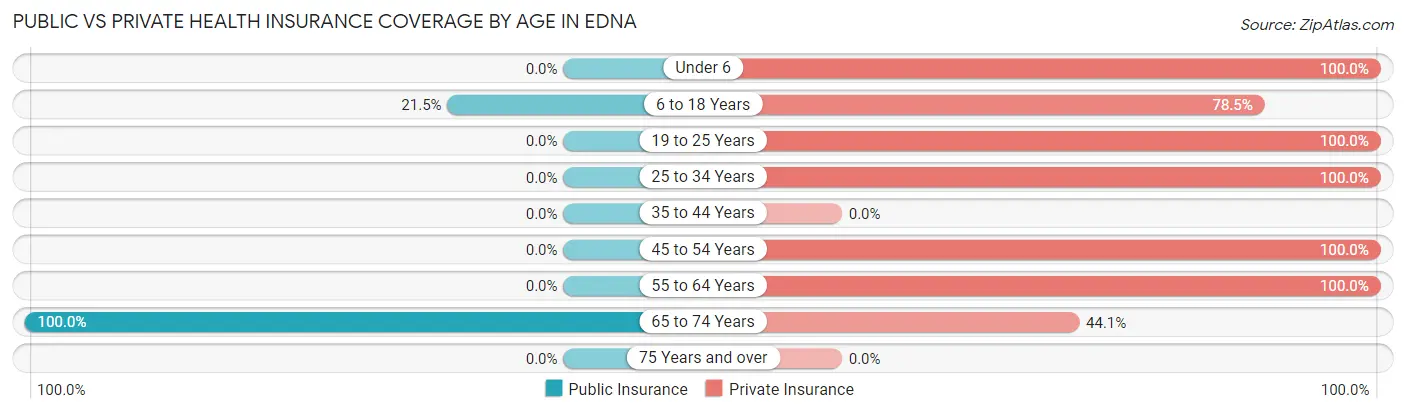
| Age Bracket | Public Insurance | Private Insurance |
| Under 6 | 0 (0.0%) | 45 (100.0%) |
| 6 to 18 Years | 17 (21.5%) | 62 (78.5%) |
| 19 to 25 Years | 0 (0.0%) | 26 (100.0%) |
| 25 to 34 Years | 0 (0.0%) | 80 (100.0%) |
| 35 to 44 Years | 0 (0.0%) | 0 (0.0%) |
| 45 to 54 Years | 0 (0.0%) | 33 (100.0%) |
| 55 to 64 Years | 0 (0.0%) | 8 (100.0%) |
| 65 to 74 Years | 84 (100.0%) | 37 (44.1%) |
| 75 Years and over | 0 (0.0%) | 0 (0.0%) |
| Total | 101 (28.4%) | 291 (82.0%) |
Disability Status by Sex by Age in Edna
| Age Bracket | Male | Female |
| Under 5 Years | 0 (0.0%) | 0 (0.0%) |
| 5 to 17 Years | 0 (0.0%) | 0 (0.0%) |
| 18 to 34 Years | 0 (0.0%) | 0 (0.0%) |
| 35 to 64 Years | 0 (0.0%) | 0 (0.0%) |
| 65 to 74 Years | 0 (0.0%) | 0 (0.0%) |
| 75 Years and over | 0 (0.0%) | 0 (0.0%) |
Disability Class by Sex by Age in Edna
Disability Class: Hearing Difficulty
| Age Bracket | Male | Female |
| Under 5 Years | 0 (0.0%) | 0 (0.0%) |
| 5 to 17 Years | 0 (0.0%) | 0 (0.0%) |
| 18 to 34 Years | 0 (0.0%) | 0 (0.0%) |
| 35 to 64 Years | 0 (0.0%) | 0 (0.0%) |
| 65 to 74 Years | 0 (0.0%) | 0 (0.0%) |
| 75 Years and over | 0 (0.0%) | 0 (0.0%) |
Disability Class: Vision Difficulty
| Age Bracket | Male | Female |
| Under 5 Years | 0 (0.0%) | 0 (0.0%) |
| 5 to 17 Years | 0 (0.0%) | 0 (0.0%) |
| 18 to 34 Years | 0 (0.0%) | 0 (0.0%) |
| 35 to 64 Years | 0 (0.0%) | 0 (0.0%) |
| 65 to 74 Years | 0 (0.0%) | 0 (0.0%) |
| 75 Years and over | 0 (0.0%) | 0 (0.0%) |
Disability Class: Cognitive Difficulty
| Age Bracket | Male | Female |
| 5 to 17 Years | 0 (0.0%) | 0 (0.0%) |
| 18 to 34 Years | 0 (0.0%) | 0 (0.0%) |
| 35 to 64 Years | 0 (0.0%) | 0 (0.0%) |
| 65 to 74 Years | 0 (0.0%) | 0 (0.0%) |
| 75 Years and over | 0 (0.0%) | 0 (0.0%) |
Disability Class: Ambulatory Difficulty
| Age Bracket | Male | Female |
| 5 to 17 Years | 0 (0.0%) | 0 (0.0%) |
| 18 to 34 Years | 0 (0.0%) | 0 (0.0%) |
| 35 to 64 Years | 0 (0.0%) | 0 (0.0%) |
| 65 to 74 Years | 0 (0.0%) | 0 (0.0%) |
| 75 Years and over | 0 (0.0%) | 0 (0.0%) |
Disability Class: Self-Care Difficulty
| Age Bracket | Male | Female |
| 5 to 17 Years | 0 (0.0%) | 0 (0.0%) |
| 18 to 34 Years | 0 (0.0%) | 0 (0.0%) |
| 35 to 64 Years | 0 (0.0%) | 0 (0.0%) |
| 65 to 74 Years | 0 (0.0%) | 0 (0.0%) |
| 75 Years and over | 0 (0.0%) | 0 (0.0%) |
Technology Access in Edna
Computing Device Access in Edna
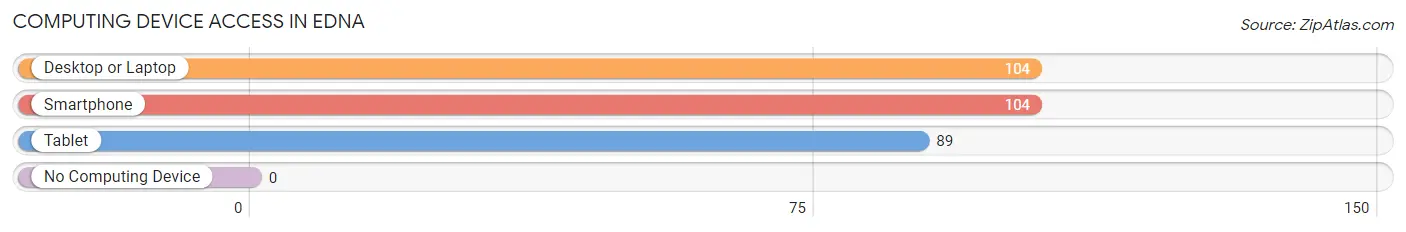
| Device Type | # Households | % Households |
| Desktop or Laptop | 104 | 100.0% |
| Smartphone | 104 | 100.0% |
| Tablet | 89 | 85.6% |
| No Computing Device | 0 | 0.0% |
| Total | 104 | 100.0% |
Internet Access in Edna
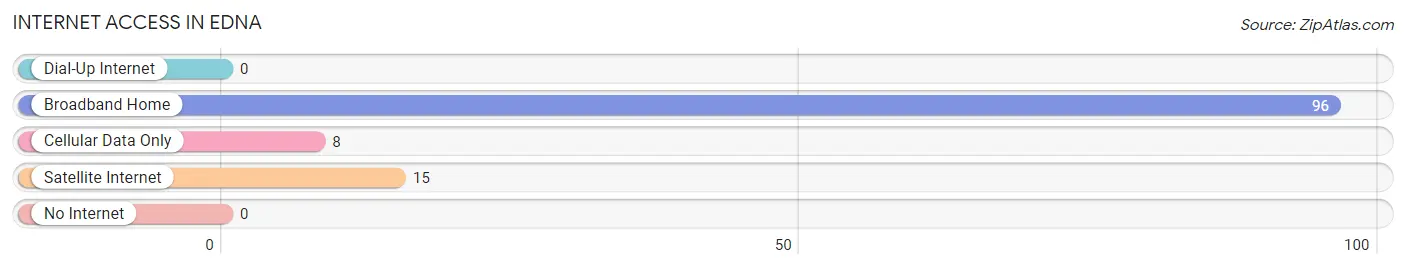
| Internet Type | # Households | % Households |
| Dial-Up Internet | 0 | 0.0% |
| Broadband Home | 96 | 92.3% |
| Cellular Data Only | 8 | 7.7% |
| Satellite Internet | 15 | 14.4% |
| No Internet | 0 | 0.0% |
| Total | 104 | 100.0% |
Edna Summary
Edna, California is a small unincorporated community located in the Central Valley of California. It is situated in the northern part of Fresno County, approximately 20 miles south of Fresno. The population of Edna is estimated to be around 1,000 people.
Geography
Edna is located in the Central Valley of California, which is a large agricultural region in the state. The Central Valley is bordered by the Sierra Nevada Mountains to the east and the Coast Ranges to the west. The climate in Edna is semi-arid, with hot summers and mild winters. The average annual precipitation is around 10 inches.
The terrain in Edna is mostly flat, with some rolling hills. The soil is mostly sandy loam, which is ideal for growing crops. The area is also known for its abundance of wildlife, including deer, coyotes, and wild turkeys.
History
Edna was founded in 1891 by a group of settlers from the Midwest. The town was named after the wife of one of the settlers, Edna Smith. The settlers were attracted to the area due to its fertile soil and mild climate.
The town quickly grew and by the early 1900s, Edna had a population of around 500 people. The town was home to a variety of businesses, including a general store, a blacksmith shop, and a hotel.
In the 1920s, Edna began to decline as the population moved away to larger cities. By the 1950s, the population had dropped to around 200 people.
Economy
The economy of Edna is largely based on agriculture. The area is known for its production of almonds, grapes, and other fruits and vegetables. The town also has a few small businesses, including a gas station, a grocery store, and a few restaurants.
Demographics
The population of Edna is estimated to be around 1,000 people. The majority of the population is of Hispanic or Latino descent. The median household income is around $30,000, and the median age is around 35 years old.
Conclusion
Edna, California is a small unincorporated community located in the Central Valley of California. It is known for its agricultural production and its mild climate. The population of Edna is estimated to be around 1,000 people, and the majority of the population is of Hispanic or Latino descent. The economy of Edna is largely based on agriculture, and the town also has a few small businesses.
Common Questions
What is Per Capita Income in Edna?
Per Capita income in Edna is $60,238.
What is the Median Family Income in Edna?
Median Family Income in Edna is $157,917.
What is the Median Household income in Edna?
Median Household Income in Edna is $157,692.
What is Inequality or Gini Index in Edna?
Inequality or Gini Index in Edna is 0.49.
What is the Total Population of Edna?
Total Population of Edna is 355.
What is the Total Male Population of Edna?
Total Male Population of Edna is 225.
What is the Total Female Population of Edna?
Total Female Population of Edna is 130.
What is the Ratio of Males per 100 Females in Edna?
There are 173.08 Males per 100 Females in Edna.
What is the Ratio of Females per 100 Males in Edna?
There are 57.78 Females per 100 Males in Edna.
What is the Median Population Age in Edna?
Median Population Age in Edna is 32.7 Years.
What is the Average Family Size in Edna
Average Family Size in Edna is 3.6 People.
What is the Average Household Size in Edna
Average Household Size in Edna is 3.4 People.
How Large is the Labor Force in Edna?
There are 89 People in the Labor Forcein in Edna.
What is the Percentage of People in the Labor Force in Edna?
35.9% of People are in the Labor Force in Edna.