Fort Benton, MT Map & Demographics
Fort Benton Map
Fort Benton Overview
$27,309
PER CAPITA INCOME
$90,346
AVG FAMILY INCOME
$67,656
AVG HOUSEHOLD INCOME
66.6%
WAGE / INCOME GAP [ % ]
33.4¢/ $1
WAGE / INCOME GAP [ $ ]
0.38
INEQUALITY / GINI INDEX
1,544
TOTAL POPULATION
740
MALE POPULATION
804
FEMALE POPULATION
92.04
MALES / 100 FEMALES
108.65
FEMALES / 100 MALES
36.6
MEDIAN AGE
3.8
AVG FAMILY SIZE
2.7
AVG HOUSEHOLD SIZE
653
LABOR FORCE [ PEOPLE ]
56.2%
PERCENT IN LABOR FORCE
6.4%
UNEMPLOYMENT RATE
Fort Benton Zip Codes
Fort Benton Area Codes
Income in Fort Benton
Income Overview in Fort Benton
Per Capita Income in Fort Benton is $27,309, while median incomes of families and households are $90,346 and $67,656 respectively.
| Characteristic | Number | Measure |
| Per Capita Income | 1,544 | $27,309 |
| Median Family Income | 311 | $90,346 |
| Mean Family Income | 311 | $93,362 |
| Median Household Income | 548 | $67,656 |
| Mean Household Income | 548 | $72,251 |
| Income Deficit | 311 | $0 |
| Wage / Income Gap (%) | 1,544 | 66.60% |
| Wage / Income Gap ($) | 1,544 | 33.40¢ per $1 |
| Gini / Inequality Index | 1,544 | 0.38 |
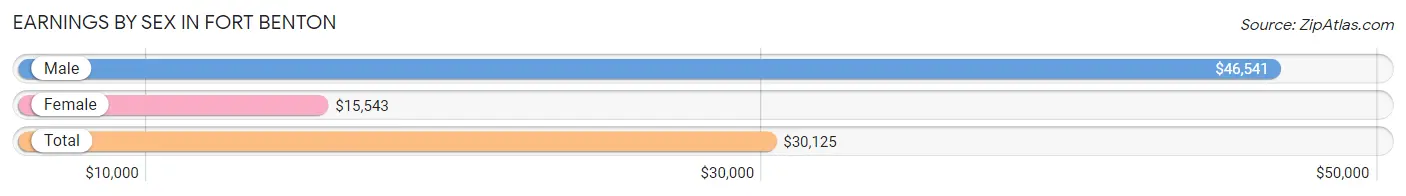
Earnings by Sex in Fort Benton
Average Earnings in Fort Benton are $30,125, $46,541 for men and $15,543 for women, a difference of 66.6%.
| Sex | Number | Average Earnings |
| Male | 349 (50.1%) | $46,541 |
| Female | 348 (49.9%) | $15,543 |
| Total | 697 (100.0%) | $30,125 |
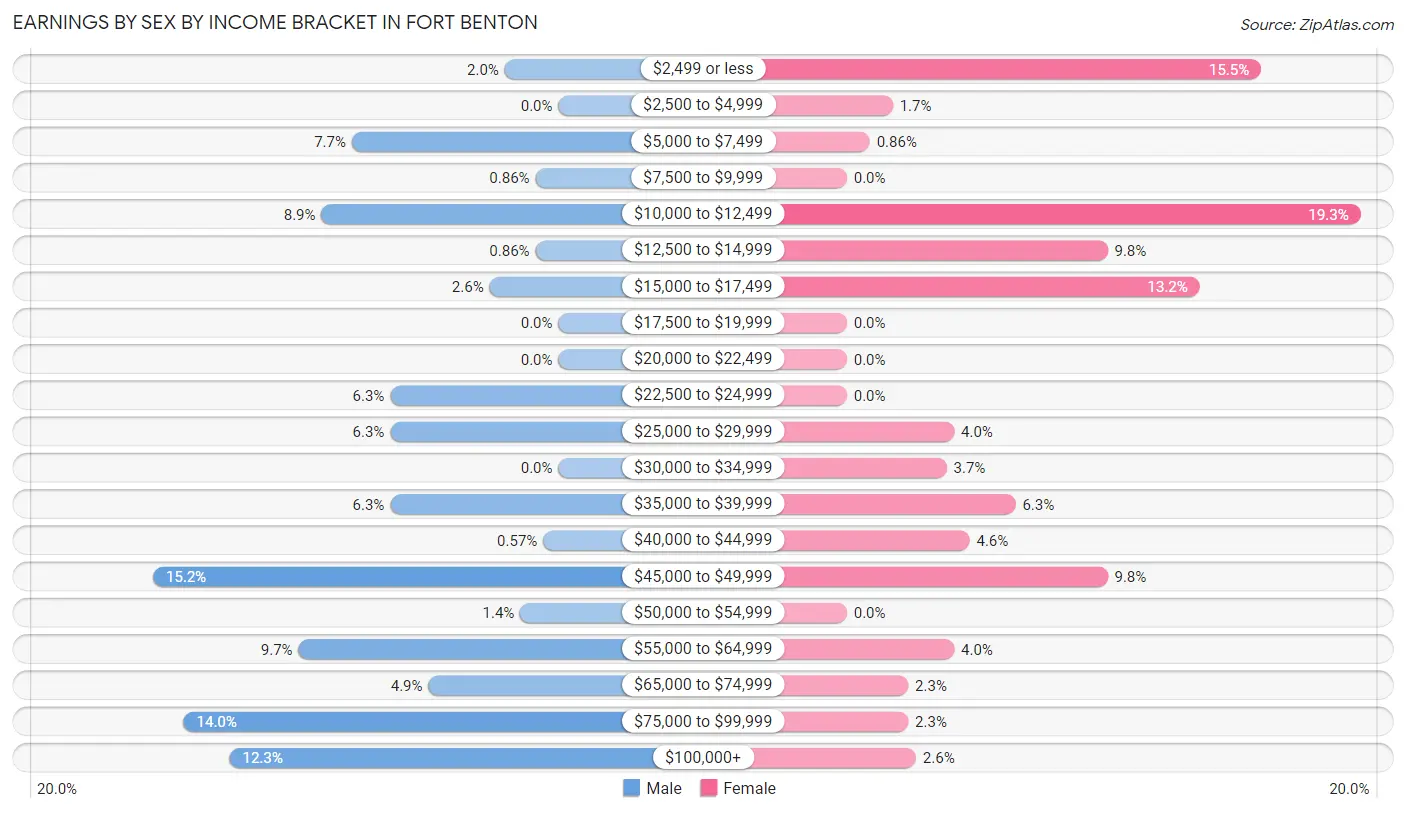
Earnings by Sex by Income Bracket in Fort Benton
The most common earnings brackets in Fort Benton are $45,000 to $49,999 for men (53 | 15.2%) and $10,000 to $12,499 for women (67 | 19.3%).
| Income | Male | Female |
| $2,499 or less | 7 (2.0%) | 54 (15.5%) |
| $2,500 to $4,999 | 0 (0.0%) | 6 (1.7%) |
| $5,000 to $7,499 | 27 (7.7%) | 3 (0.9%) |
| $7,500 to $9,999 | 3 (0.9%) | 0 (0.0%) |
| $10,000 to $12,499 | 31 (8.9%) | 67 (19.3%) |
| $12,500 to $14,999 | 3 (0.9%) | 34 (9.8%) |
| $15,000 to $17,499 | 9 (2.6%) | 46 (13.2%) |
| $17,500 to $19,999 | 0 (0.0%) | 0 (0.0%) |
| $20,000 to $22,499 | 0 (0.0%) | 0 (0.0%) |
| $22,500 to $24,999 | 22 (6.3%) | 0 (0.0%) |
| $25,000 to $29,999 | 22 (6.3%) | 14 (4.0%) |
| $30,000 to $34,999 | 0 (0.0%) | 13 (3.7%) |
| $35,000 to $39,999 | 22 (6.3%) | 22 (6.3%) |
| $40,000 to $44,999 | 2 (0.6%) | 16 (4.6%) |
| $45,000 to $49,999 | 53 (15.2%) | 34 (9.8%) |
| $50,000 to $54,999 | 5 (1.4%) | 0 (0.0%) |
| $55,000 to $64,999 | 34 (9.7%) | 14 (4.0%) |
| $65,000 to $74,999 | 17 (4.9%) | 8 (2.3%) |
| $75,000 to $99,999 | 49 (14.0%) | 8 (2.3%) |
| $100,000+ | 43 (12.3%) | 9 (2.6%) |
| Total | 349 (100.0%) | 348 (100.0%) |
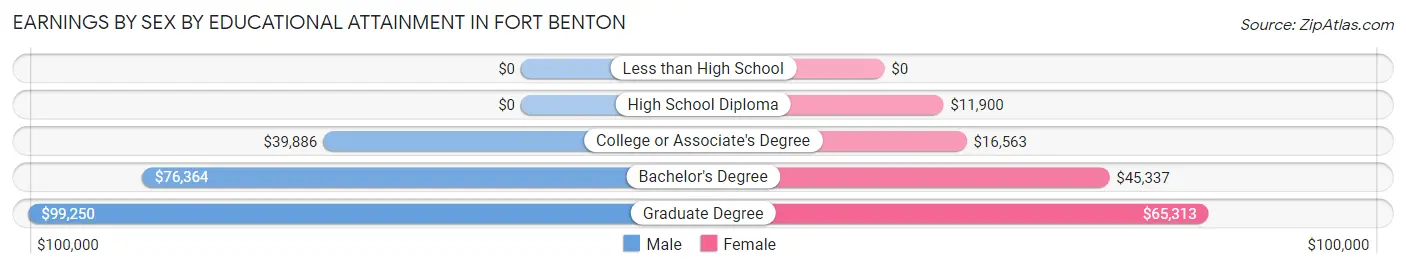
Earnings by Sex by Educational Attainment in Fort Benton
Average earnings in Fort Benton are $46,890 for men and $27,768 for women, a difference of 40.8%. Men with an educational attainment of graduate degree enjoy the highest average annual earnings of $99,250, while those with college or associate's degree education earn the least with $39,886. Women with an educational attainment of graduate degree earn the most with the average annual earnings of $65,313, while those with high school diploma education have the smallest earnings of $11,900.
| Educational Attainment | Male Income | Female Income |
| Less than High School | - | - |
| High School Diploma | - | - |
| College or Associate's Degree | $39,886 | $16,563 |
| Bachelor's Degree | $76,364 | $45,337 |
| Graduate Degree | $99,250 | $65,313 |
| Total | $46,890 | $27,768 |
Family Income in Fort Benton
Family Income Brackets in Fort Benton
According to the Fort Benton family income data, there are 106 families falling into the $75,000 to $99,999 income range, which is the most common income bracket and makes up 34.1% of all families.
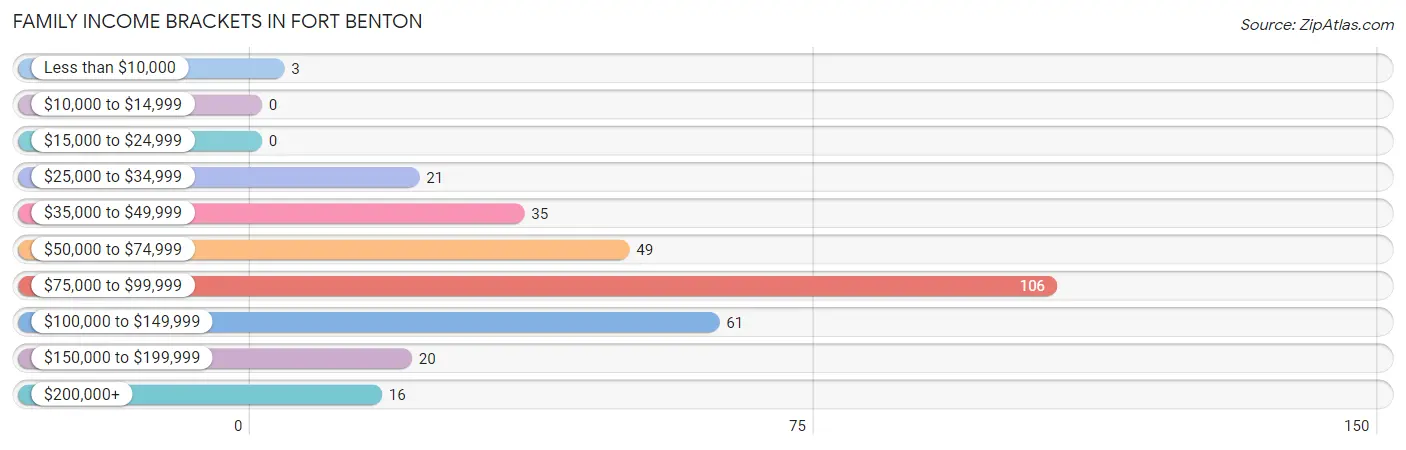
| Income Bracket | # Families | % Families |
| Less than $10,000 | 3 | 1.0% |
| $10,000 to $14,999 | 0 | 0.0% |
| $15,000 to $24,999 | 0 | 0.0% |
| $25,000 to $34,999 | 21 | 6.8% |
| $35,000 to $49,999 | 35 | 11.3% |
| $50,000 to $74,999 | 49 | 15.8% |
| $75,000 to $99,999 | 106 | 34.1% |
| $100,000 to $149,999 | 61 | 19.6% |
| $150,000 to $199,999 | 20 | 6.4% |
| $200,000+ | 16 | 5.1% |
Family Income by Famaliy Size in Fort Benton
5-person families (24 | 7.7%) account for the highest median family income in Fort Benton with $100,833 per family, while 2-person families (138 | 44.4%) have the highest median income of $40,208 per family member.
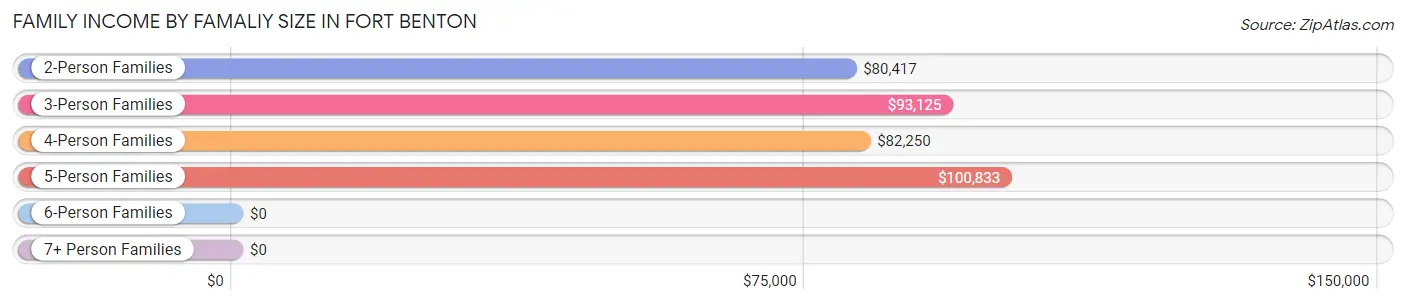
| Income Bracket | # Families | Median Income |
| 2-Person Families | 138 (44.4%) | $80,417 |
| 3-Person Families | 89 (28.6%) | $93,125 |
| 4-Person Families | 43 (13.8%) | $82,250 |
| 5-Person Families | 24 (7.7%) | $100,833 |
| 6-Person Families | 8 (2.6%) | $0 |
| 7+ Person Families | 9 (2.9%) | $0 |
| Total | 311 (100.0%) | $90,346 |
Family Income by Number of Earners in Fort Benton
The median family income in Fort Benton is $90,346, with families comprising 3+ earners (25) having the highest median family income of $115,288, while families with no earners (56) have the lowest median family income of $48,571, accounting for 8.0% and 18.0% of families, respectively.
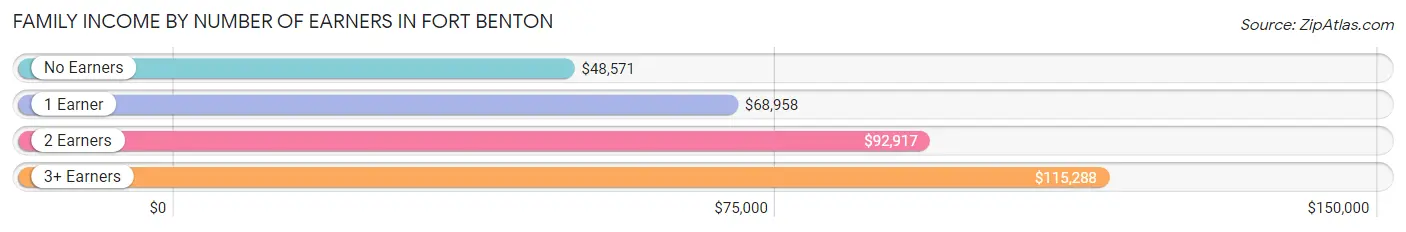
| Number of Earners | # Families | Median Income |
| No Earners | 56 (18.0%) | $48,571 |
| 1 Earner | 73 (23.5%) | $68,958 |
| 2 Earners | 157 (50.5%) | $92,917 |
| 3+ Earners | 25 (8.0%) | $115,288 |
| Total | 311 (100.0%) | $90,346 |
Household Income in Fort Benton
Household Income Brackets in Fort Benton
With 122 households falling in the category, the $75,000 to $99,999 income range is the most frequent in Fort Benton, accounting for 22.3% of all households. In contrast, only 11 households (2.0%) fall into the less than $10,000 income bracket, making it the least populous group.
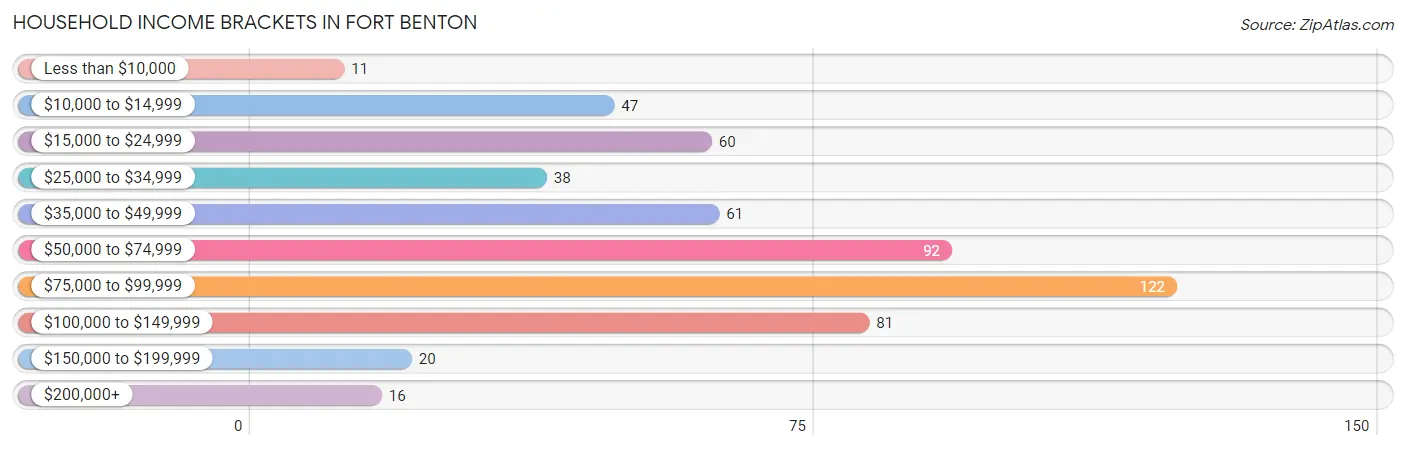
| Income Bracket | # Households | % Households |
| Less than $10,000 | 11 | 2.0% |
| $10,000 to $14,999 | 47 | 8.6% |
| $15,000 to $24,999 | 60 | 10.9% |
| $25,000 to $34,999 | 38 | 6.9% |
| $35,000 to $49,999 | 61 | 11.1% |
| $50,000 to $74,999 | 92 | 16.8% |
| $75,000 to $99,999 | 122 | 22.3% |
| $100,000 to $149,999 | 81 | 14.8% |
| $150,000 to $199,999 | 20 | 3.6% |
| $200,000+ | 16 | 2.9% |
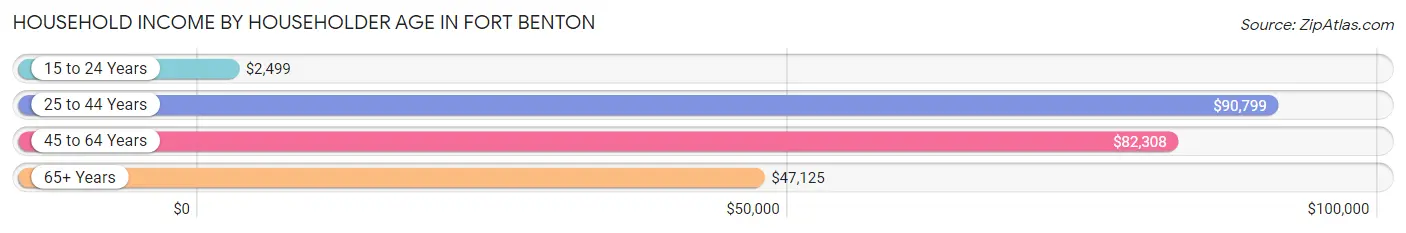
Household Income by Householder Age in Fort Benton
The median household income in Fort Benton is $67,656, with the highest median household income of $90,799 found in the 25 to 44 years age bracket for the primary householder. A total of 155 households (28.3%) fall into this category. Meanwhile, the 15 to 24 years age bracket for the primary householder has the lowest median household income of $2,499, with 9 households (1.6%) in this group.
| Income Bracket | # Households | Median Income |
| 15 to 24 Years | 9 (1.6%) | $2,499 |
| 25 to 44 Years | 155 (28.3%) | $90,799 |
| 45 to 64 Years | 156 (28.5%) | $82,308 |
| 65+ Years | 228 (41.6%) | $47,125 |
| Total | 548 (100.0%) | $67,656 |
Poverty in Fort Benton
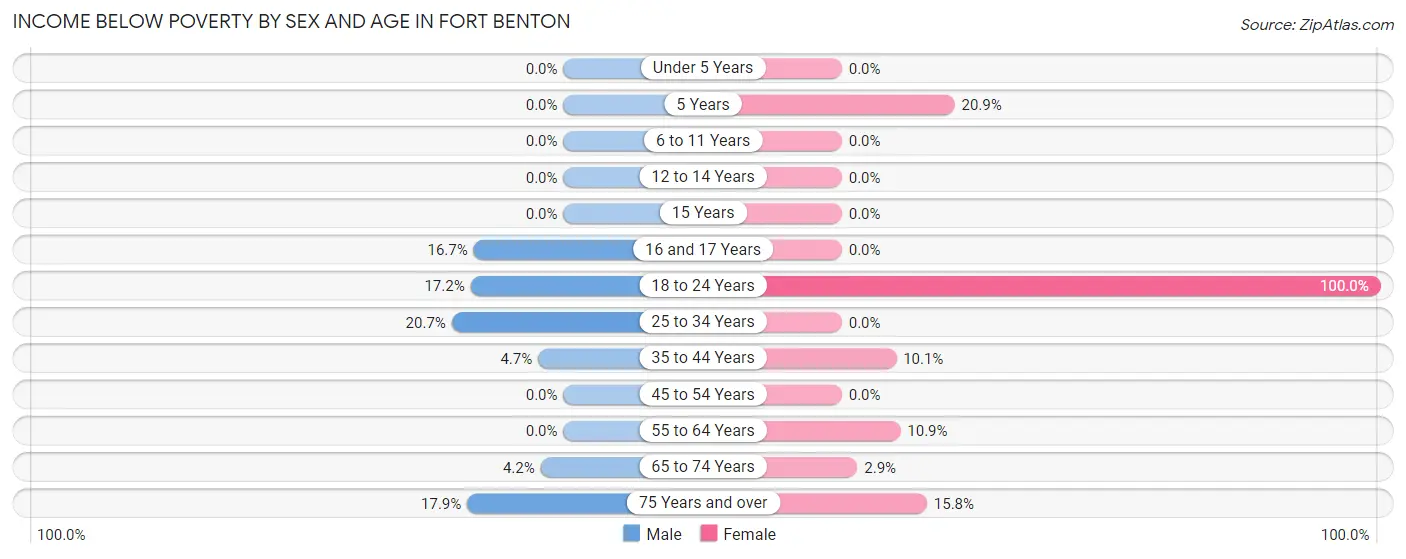
Income Below Poverty by Sex and Age in Fort Benton
With 6.5% poverty level for males and 10.1% for females among the residents of Fort Benton, 25 to 34 year old males and 18 to 24 year old females are the most vulnerable to poverty, with 17 males (20.7%) and 34 females (100.0%) in their respective age groups living below the poverty level.
| Age Bracket | Male | Female |
| Under 5 Years | 0 (0.0%) | 0 (0.0%) |
| 5 Years | 0 (0.0%) | 9 (20.9%) |
| 6 to 11 Years | 0 (0.0%) | 0 (0.0%) |
| 12 to 14 Years | 0 (0.0%) | 0 (0.0%) |
| 15 Years | 0 (0.0%) | 0 (0.0%) |
| 16 and 17 Years | 5 (16.7%) | 0 (0.0%) |
| 18 to 24 Years | 5 (17.2%) | 34 (100.0%) |
| 25 to 34 Years | 17 (20.7%) | 0 (0.0%) |
| 35 to 44 Years | 6 (4.7%) | 10 (10.1%) |
| 45 to 54 Years | 0 (0.0%) | 0 (0.0%) |
| 55 to 64 Years | 0 (0.0%) | 5 (10.9%) |
| 65 to 74 Years | 3 (4.2%) | 3 (2.9%) |
| 75 Years and over | 10 (17.9%) | 18 (15.8%) |
| Total | 46 (6.5%) | 79 (10.1%) |
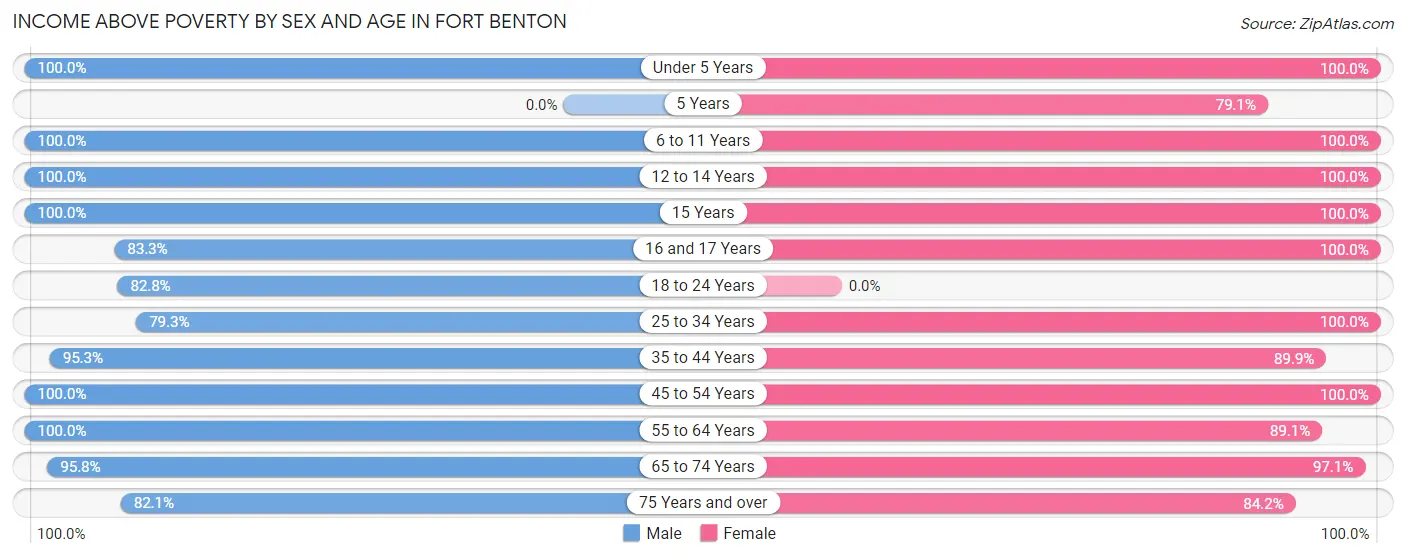
Income Above Poverty by Sex and Age in Fort Benton
According to the poverty statistics in Fort Benton, males aged under 5 years and females aged under 5 years are the age groups that are most secure financially, with 100.0% of males and 100.0% of females in these age groups living above the poverty line.
| Age Bracket | Male | Female |
| Under 5 Years | 46 (100.0%) | 92 (100.0%) |
| 5 Years | 0 (0.0%) | 34 (79.1%) |
| 6 to 11 Years | 89 (100.0%) | 31 (100.0%) |
| 12 to 14 Years | 20 (100.0%) | 15 (100.0%) |
| 15 Years | 15 (100.0%) | 22 (100.0%) |
| 16 and 17 Years | 25 (83.3%) | 41 (100.0%) |
| 18 to 24 Years | 24 (82.8%) | 0 (0.0%) |
| 25 to 34 Years | 65 (79.3%) | 97 (100.0%) |
| 35 to 44 Years | 122 (95.3%) | 89 (89.9%) |
| 45 to 54 Years | 81 (100.0%) | 42 (100.0%) |
| 55 to 64 Years | 60 (100.0%) | 41 (89.1%) |
| 65 to 74 Years | 68 (95.8%) | 101 (97.1%) |
| 75 Years and over | 46 (82.1%) | 96 (84.2%) |
| Total | 661 (93.5%) | 701 (89.9%) |
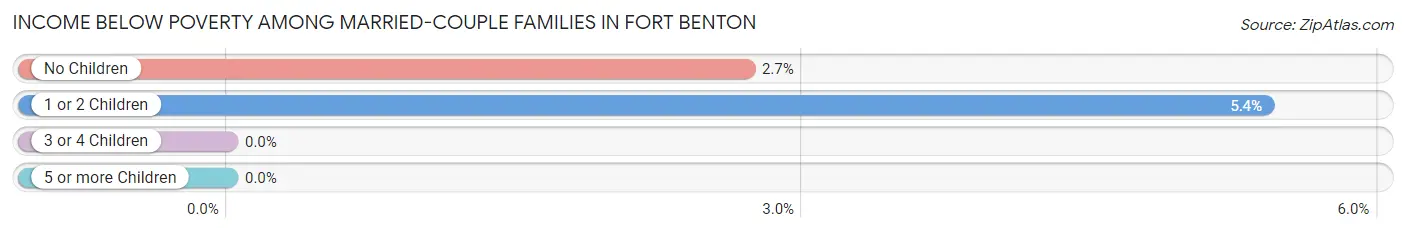
Income Below Poverty Among Married-Couple Families in Fort Benton
The poverty statistics for married-couple families in Fort Benton show that 3.5% or 9 of the total 254 families live below the poverty line. Families with 1 or 2 children have the highest poverty rate of 5.4%, comprising of 6 families. On the other hand, families with 3 or 4 children have the lowest poverty rate of 0.0%, which includes 0 families.
| Children | Above Poverty | Below Poverty |
| No Children | 108 (97.3%) | 3 (2.7%) |
| 1 or 2 Children | 105 (94.6%) | 6 (5.4%) |
| 3 or 4 Children | 32 (100.0%) | 0 (0.0%) |
| 5 or more Children | 0 (0.0%) | 0 (0.0%) |
| Total | 245 (96.5%) | 9 (3.5%) |
Income Below Poverty Among Single-Parent Households in Fort Benton
| Children | Single Father | Single Mother |
| No Children | 0 (0.0%) | 0 (0.0%) |
| 1 or 2 Children | 0 (0.0%) | 0 (0.0%) |
| 3 or 4 Children | 0 (0.0%) | 0 (0.0%) |
| 5 or more Children | 0 (0.0%) | 0 (0.0%) |
| Total | 0 (0.0%) | 0 (0.0%) |
Income Below Poverty Among Married-Couple vs Single-Parent Households in Fort Benton
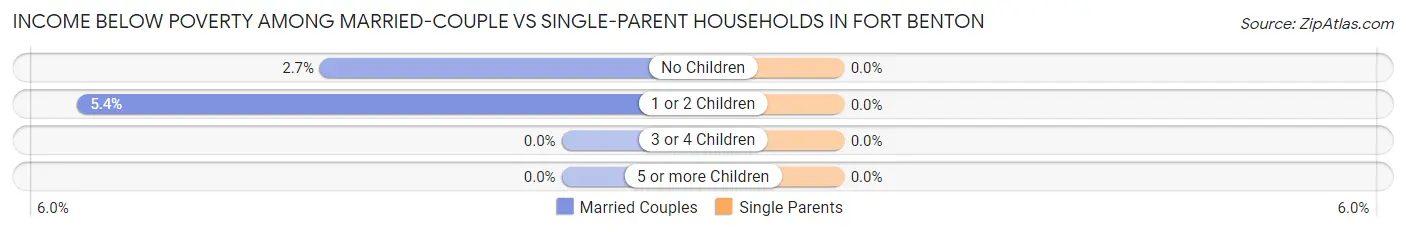
| Children | Married-Couple Families | Single-Parent Households |
| No Children | 3 (2.7%) | 0 (0.0%) |
| 1 or 2 Children | 6 (5.4%) | 0 (0.0%) |
| 3 or 4 Children | 0 (0.0%) | 0 (0.0%) |
| 5 or more Children | 0 (0.0%) | 0 (0.0%) |
| Total | 9 (3.5%) | 0 (0.0%) |
Race in Fort Benton
The most populous races in Fort Benton are White / Caucasian (1,432 | 92.7%), Hispanic or Latino (120 | 7.8%), and Two or more Races (99 | 6.4%).
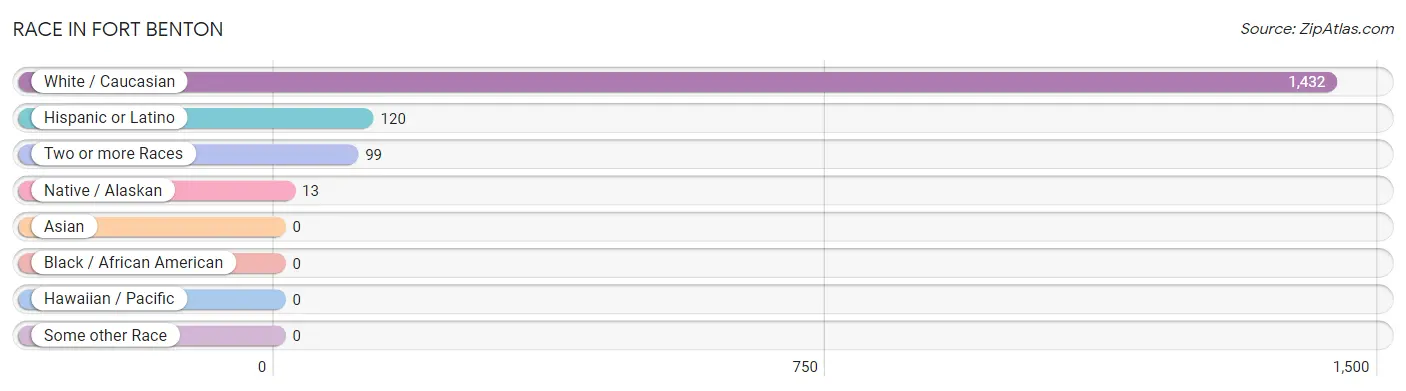
| Race | # Population | % Population |
| Asian | 0 | 0.0% |
| Black / African American | 0 | 0.0% |
| Hawaiian / Pacific | 0 | 0.0% |
| Hispanic or Latino | 120 | 7.8% |
| Native / Alaskan | 13 | 0.8% |
| White / Caucasian | 1,432 | 92.7% |
| Two or more Races | 99 | 6.4% |
| Some other Race | 0 | 0.0% |
| Total | 1,544 | 100.0% |
Ancestry in Fort Benton
The most populous ancestries reported in Fort Benton are American (314 | 20.3%), Irish (302 | 19.6%), English (246 | 15.9%), German (233 | 15.1%), and European (147 | 9.5%), together accounting for 80.4% of all Fort Benton residents.
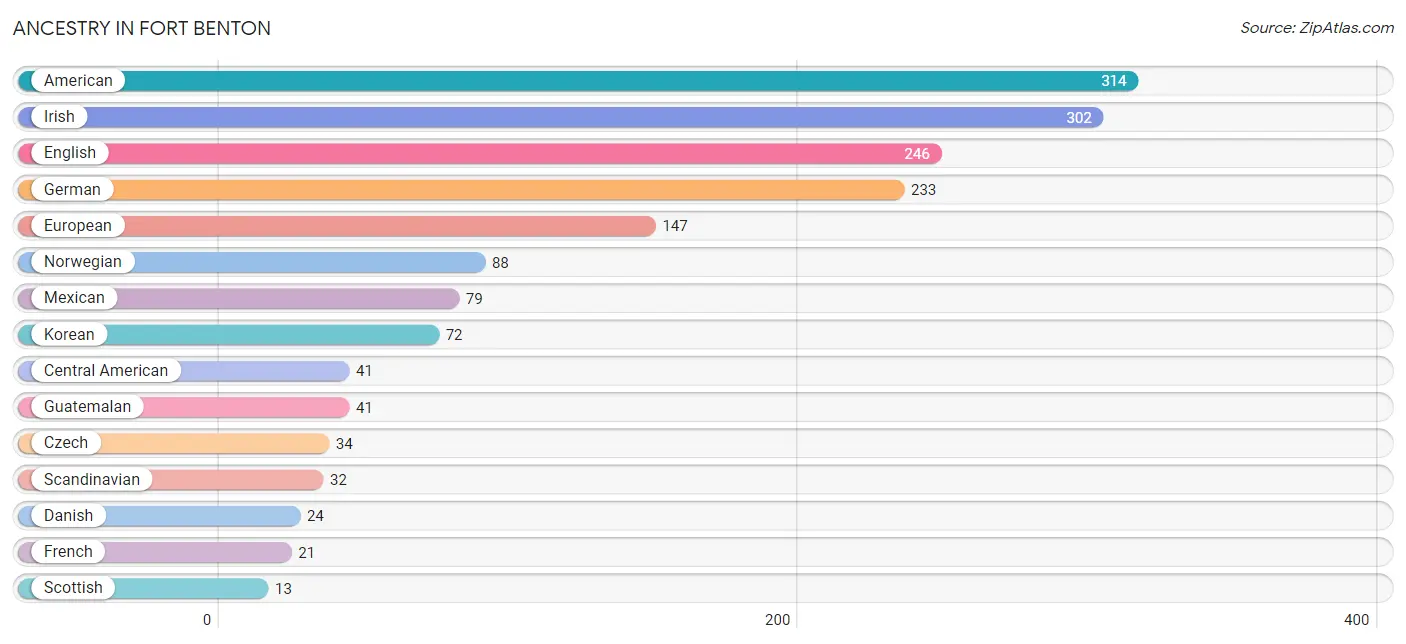
| Ancestry | # Population | % Population |
| American | 314 | 20.3% |
| Blackfeet | 1 | 0.1% |
| British | 12 | 0.8% |
| Central American | 41 | 2.7% |
| Czech | 34 | 2.2% |
| Danish | 24 | 1.5% |
| Dutch | 6 | 0.4% |
| English | 246 | 15.9% |
| Estonian | 9 | 0.6% |
| European | 147 | 9.5% |
| Finnish | 5 | 0.3% |
| French | 21 | 1.4% |
| French American Indian | 3 | 0.2% |
| French Canadian | 4 | 0.3% |
| German | 233 | 15.1% |
| Guatemalan | 41 | 2.7% |
| Irish | 302 | 19.6% |
| Italian | 3 | 0.2% |
| Korean | 72 | 4.7% |
| Mexican | 79 | 5.1% |
| Norwegian | 88 | 5.7% |
| Polish | 6 | 0.4% |
| Scandinavian | 32 | 2.1% |
| Scotch-Irish | 3 | 0.2% |
| Scottish | 13 | 0.8% |
| Slovak | 2 | 0.1% |
| Sri Lankan | 5 | 0.3% |
| Swedish | 10 | 0.6% |
| Swiss | 13 | 0.8% | View All 29 Rows |
Immigrants in Fort Benton

| Immigration Origin | # Population | % Population | View All 0 Rows |
Sex and Age in Fort Benton
Sex and Age in Fort Benton
The most populous age groups in Fort Benton are 35 to 39 Years (82 | 11.1%) for men and Under 5 Years (92 | 11.4%) for women.
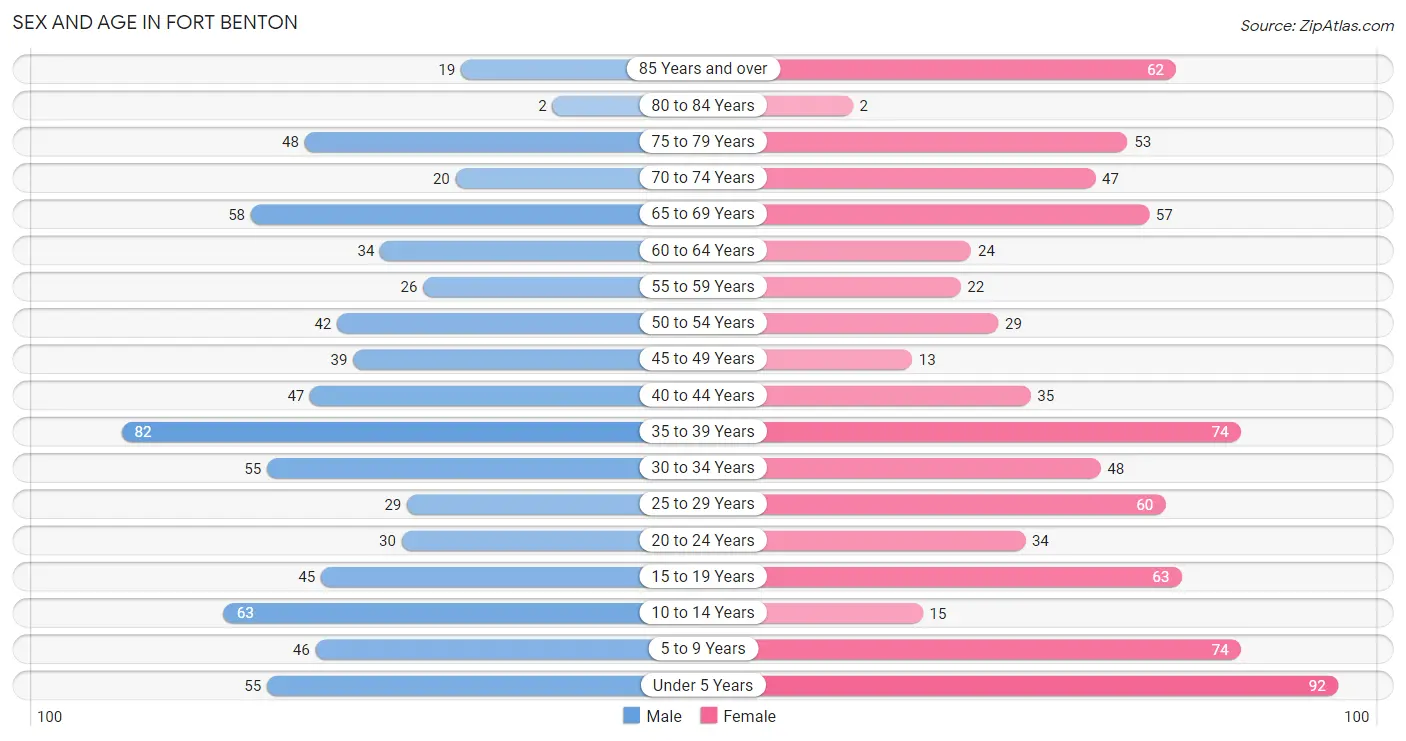
| Age Bracket | Male | Female |
| Under 5 Years | 55 (7.4%) | 92 (11.4%) |
| 5 to 9 Years | 46 (6.2%) | 74 (9.2%) |
| 10 to 14 Years | 63 (8.5%) | 15 (1.9%) |
| 15 to 19 Years | 45 (6.1%) | 63 (7.8%) |
| 20 to 24 Years | 30 (4.1%) | 34 (4.2%) |
| 25 to 29 Years | 29 (3.9%) | 60 (7.5%) |
| 30 to 34 Years | 55 (7.4%) | 48 (6.0%) |
| 35 to 39 Years | 82 (11.1%) | 74 (9.2%) |
| 40 to 44 Years | 47 (6.4%) | 35 (4.3%) |
| 45 to 49 Years | 39 (5.3%) | 13 (1.6%) |
| 50 to 54 Years | 42 (5.7%) | 29 (3.6%) |
| 55 to 59 Years | 26 (3.5%) | 22 (2.7%) |
| 60 to 64 Years | 34 (4.6%) | 24 (3.0%) |
| 65 to 69 Years | 58 (7.8%) | 57 (7.1%) |
| 70 to 74 Years | 20 (2.7%) | 47 (5.9%) |
| 75 to 79 Years | 48 (6.5%) | 53 (6.6%) |
| 80 to 84 Years | 2 (0.3%) | 2 (0.3%) |
| 85 Years and over | 19 (2.6%) | 62 (7.7%) |
| Total | 740 (100.0%) | 804 (100.0%) |
Families and Households in Fort Benton
Median Family Size in Fort Benton
The median family size in Fort Benton is 3.82 persons per family, with single female/mother families (23 | 7.4%) accounting for the largest median family size of 8.39 persons per family. On the other hand, married-couple families (254 | 81.7%) represent the smallest median family size with 3.39 persons per family.
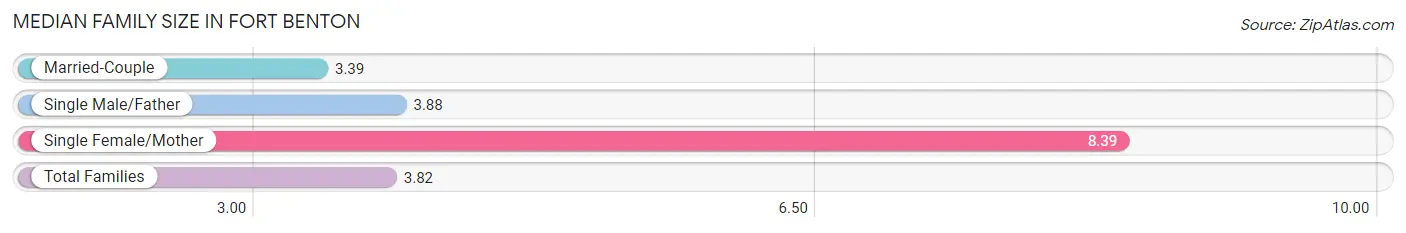
| Family Type | # Families | Family Size |
| Married-Couple | 254 (81.7%) | 3.39 |
| Single Male/Father | 34 (10.9%) | 3.88 |
| Single Female/Mother | 23 (7.4%) | 8.39 |
| Total Families | 311 (100.0%) | 3.82 |
Median Household Size in Fort Benton
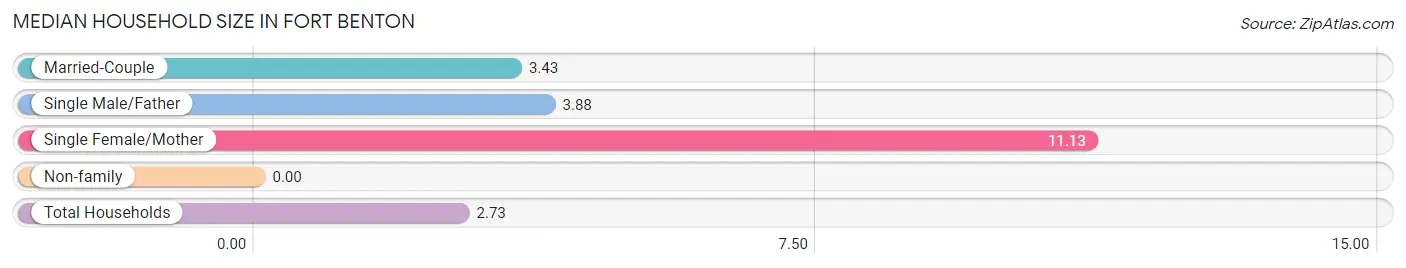
| Household Type | # Households | Household Size |
| Married-Couple | 254 (46.4%) | 3.43 |
| Single Male/Father | 34 (6.2%) | 3.88 |
| Single Female/Mother | 23 (4.2%) | 11.13 |
| Non-family | 237 (43.2%) | - |
| Total Households | 548 (100.0%) | 2.73 |
Household Size by Marriage Status in Fort Benton
Out of a total of 548 households in Fort Benton, 311 (56.8%) are family households, while 237 (43.2%) are nonfamily households. The most numerous type of family households are 2-person households, comprising 135, and the most common type of nonfamily households are 1-person households, comprising 237.
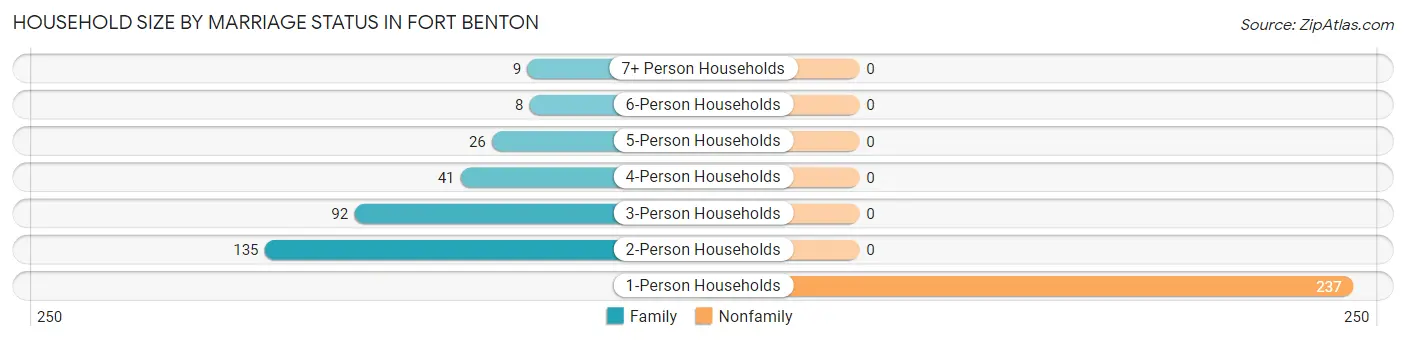
| Household Size | Family Households | Nonfamily Households |
| 1-Person Households | - | 237 (43.2%) |
| 2-Person Households | 135 (24.6%) | 0 (0.0%) |
| 3-Person Households | 92 (16.8%) | 0 (0.0%) |
| 4-Person Households | 41 (7.5%) | 0 (0.0%) |
| 5-Person Households | 26 (4.7%) | 0 (0.0%) |
| 6-Person Households | 8 (1.5%) | 0 (0.0%) |
| 7+ Person Households | 9 (1.6%) | 0 (0.0%) |
| Total | 311 (56.8%) | 237 (43.2%) |
Female Fertility in Fort Benton
Fertility by Age in Fort Benton
Average fertility rate in Fort Benton is 26.0 births per 1,000 women. Women in the age bracket of 20 to 34 years have the highest fertility rate with 63.0 births per 1,000 women. Women in the age bracket of 20 to 34 years acount for 100.0% of all women with births.
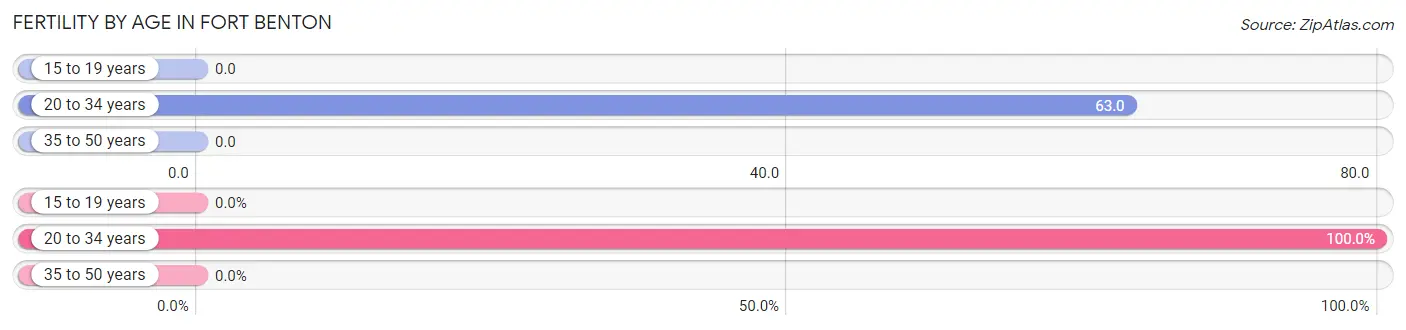
| Age Bracket | Women with Births | Births / 1,000 Women |
| 15 to 19 years | 0 (0.0%) | 0.0 |
| 20 to 34 years | 9 (100.0%) | 63.0 |
| 35 to 50 years | 0 (0.0%) | 0.0 |
| Total | 9 (100.0%) | 26.0 |
Fertility by Age by Marriage Status in Fort Benton
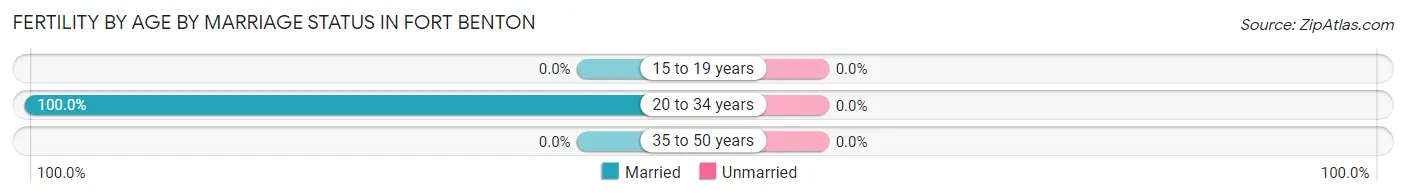
| Age Bracket | Married | Unmarried |
| 15 to 19 years | 0 (0.0%) | 0 (0.0%) |
| 20 to 34 years | 9 (100.0%) | 0 (0.0%) |
| 35 to 50 years | 0 (0.0%) | 0 (0.0%) |
| Total | 9 (100.0%) | 0 (0.0%) |
Fertility by Education in Fort Benton

| Educational Attainment | Women with Births | Births / 1,000 Women |
| Less than High School | 0 (0.0%) | 0.0 |
| High School Diploma | 0 (0.0%) | 0.0 |
| College or Associate's Degree | 0 (0.0%) | 0.0 |
| Bachelor's Degree | 9 (100.0%) | 153.0 |
| Graduate Degree | 0 (0.0%) | 0.0 |
| Total | 9 (100.0%) | 26.0 |
Fertility by Education by Marriage Status in Fort Benton
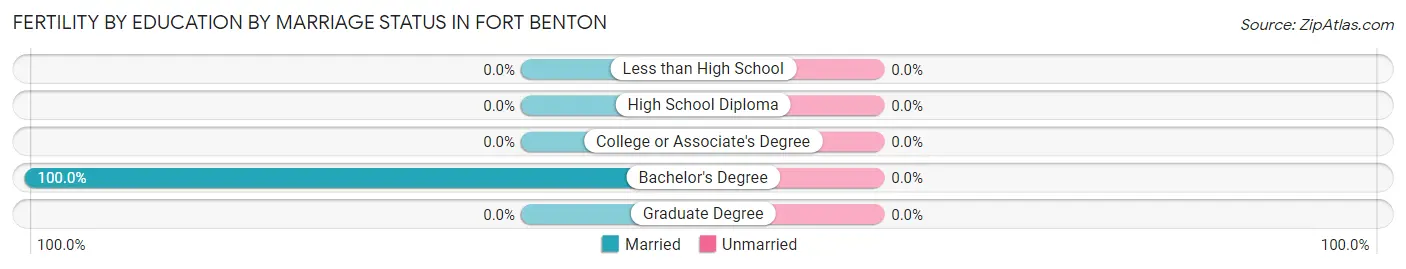
| Educational Attainment | Married | Unmarried |
| Less than High School | 0 (0.0%) | 0 (0.0%) |
| High School Diploma | 0 (0.0%) | 0 (0.0%) |
| College or Associate's Degree | 0 (0.0%) | 0 (0.0%) |
| Bachelor's Degree | 9 (100.0%) | 0 (0.0%) |
| Graduate Degree | 0 (0.0%) | 0 (0.0%) |
| Total | 9 (100.0%) | 0 (0.0%) |
Employment Characteristics in Fort Benton
Employment by Class of Employer in Fort Benton
Among the 610 employed individuals in Fort Benton, private company employees (326 | 53.4%), local government employees (87 | 14.3%), and not-for-profit organizations (59 | 9.7%) make up the most common classes of employment.
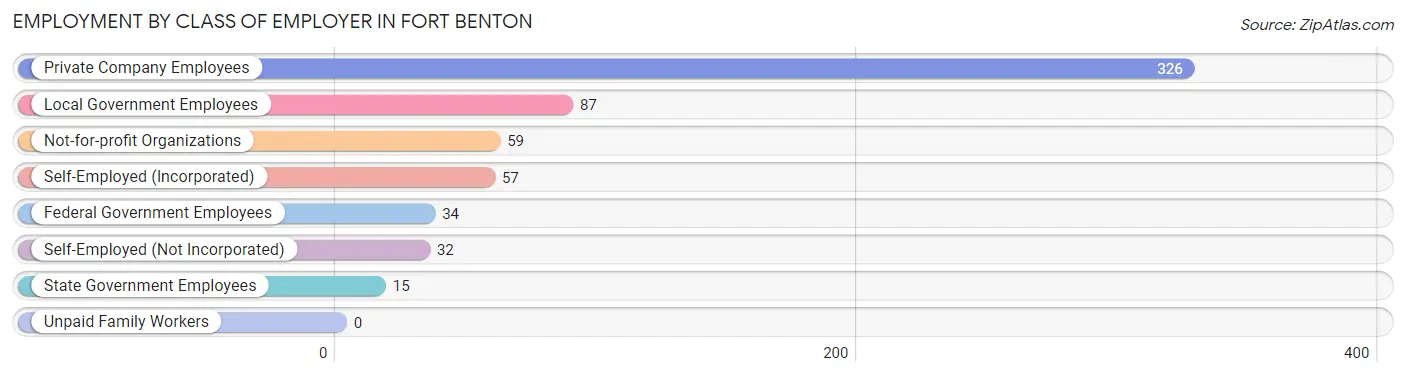
| Employer Class | # Employees | % Employees |
| Private Company Employees | 326 | 53.4% |
| Self-Employed (Incorporated) | 57 | 9.3% |
| Self-Employed (Not Incorporated) | 32 | 5.2% |
| Not-for-profit Organizations | 59 | 9.7% |
| Local Government Employees | 87 | 14.3% |
| State Government Employees | 15 | 2.5% |
| Federal Government Employees | 34 | 5.6% |
| Unpaid Family Workers | 0 | 0.0% |
| Total | 610 | 100.0% |
Employment Status by Age in Fort Benton
According to the labor force statistics for Fort Benton, out of the total population over 16 years of age (1,162), 56.2% or 653 individuals are in the labor force, with 6.4% or 42 of them unemployed. The age group with the highest labor force participation rate is 55 to 59 years, with 97.9% or 47 individuals in the labor force. Within the labor force, the 16 to 19 years age range has the highest percentage of unemployed individuals, with 100.0% or 41 of them being unemployed.
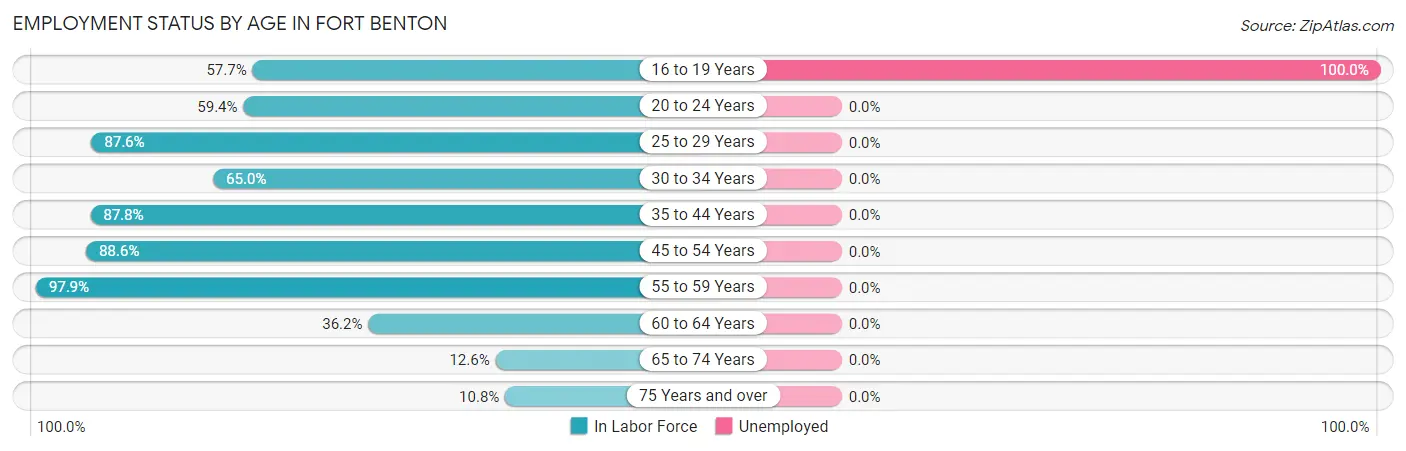
| Age Bracket | In Labor Force | Unemployed |
| 16 to 19 Years | 41 (57.7%) | 41 (100.0%) |
| 20 to 24 Years | 38 (59.4%) | 0 (0.0%) |
| 25 to 29 Years | 78 (87.6%) | 0 (0.0%) |
| 30 to 34 Years | 67 (65.0%) | 0 (0.0%) |
| 35 to 44 Years | 209 (87.8%) | 0 (0.0%) |
| 45 to 54 Years | 109 (88.6%) | 0 (0.0%) |
| 55 to 59 Years | 47 (97.9%) | 0 (0.0%) |
| 60 to 64 Years | 21 (36.2%) | 0 (0.0%) |
| 65 to 74 Years | 23 (12.6%) | 0 (0.0%) |
| 75 Years and over | 20 (10.8%) | 0 (0.0%) |
| Total | 653 (56.2%) | 42 (6.4%) |
Employment Status by Educational Attainment in Fort Benton
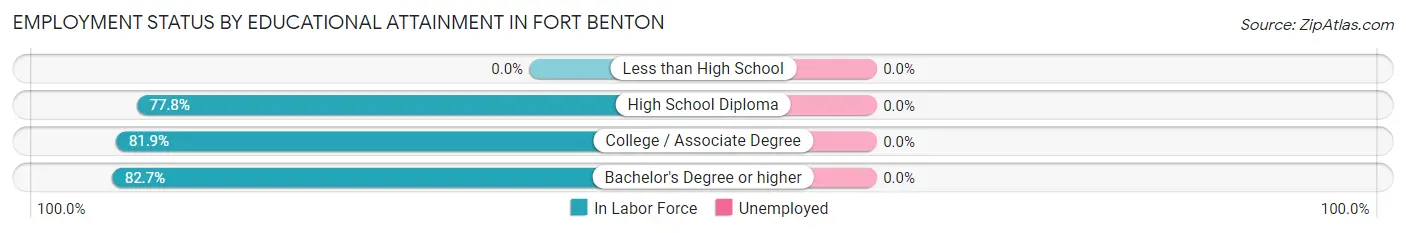
| Educational Attainment | In Labor Force | Unemployed |
| Less than High School | 0 (0.0%) | 0 (0.0%) |
| High School Diploma | 193 (77.8%) | 0 (0.0%) |
| College / Associate Degree | 176 (81.9%) | 0 (0.0%) |
| Bachelor's Degree or higher | 162 (82.7%) | 0 (0.0%) |
| Total | 531 (80.6%) | 0 (0.0%) |
Employment Occupations by Sex in Fort Benton
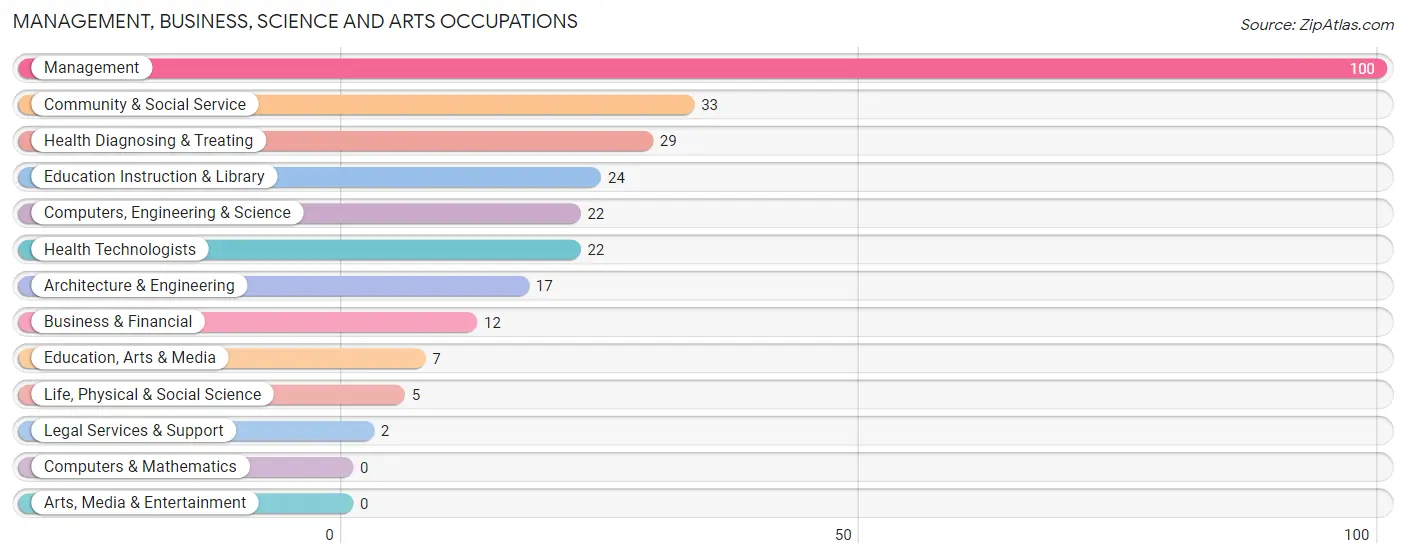
Management, Business, Science and Arts Occupations
The most common Management, Business, Science and Arts occupations in Fort Benton are Management (100 | 16.6%), Community & Social Service (33 | 5.5%), Health Diagnosing & Treating (29 | 4.8%), Education Instruction & Library (24 | 4.0%), and Computers, Engineering & Science (22 | 3.7%).
Management, Business, Science and Arts Occupations by Sex
Within the Management, Business, Science and Arts occupations in Fort Benton, the most male-oriented occupations are Architecture & Engineering (100.0%), Education, Arts & Media (100.0%), and Legal Services & Support (100.0%), while the most female-oriented occupations are Life, Physical & Social Science (100.0%), Business & Financial (91.7%), and Health Diagnosing & Treating (55.2%).
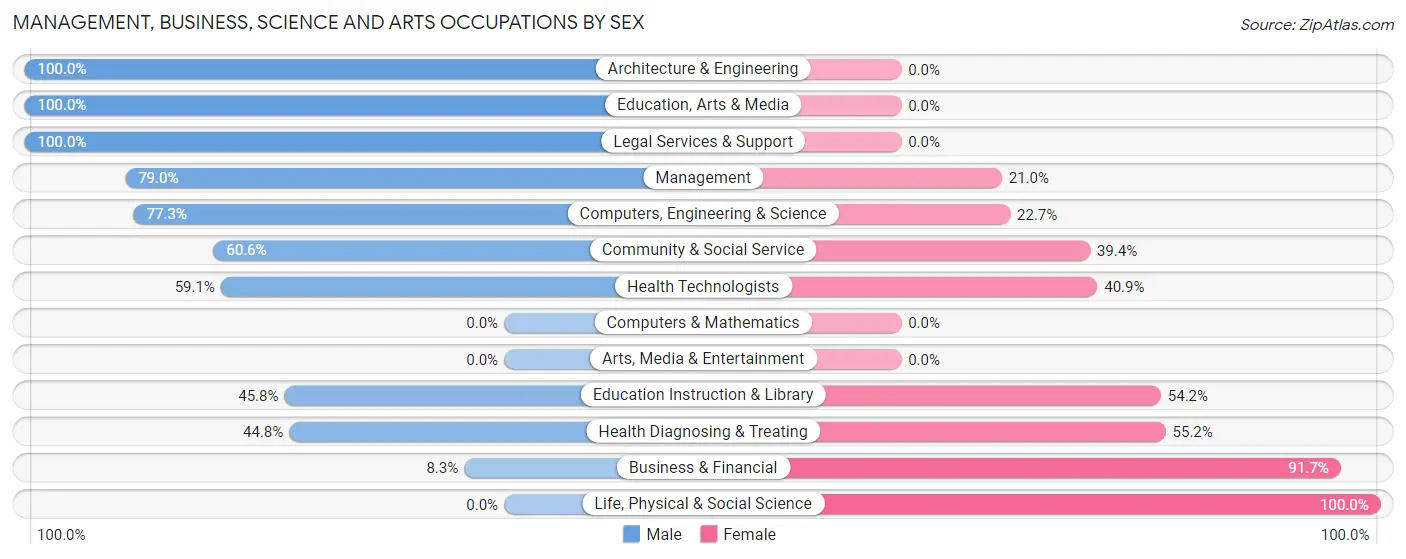
| Occupation | Male | Female |
| Management | 79 (79.0%) | 21 (21.0%) |
| Business & Financial | 1 (8.3%) | 11 (91.7%) |
| Computers, Engineering & Science | 17 (77.3%) | 5 (22.7%) |
| Computers & Mathematics | 0 (0.0%) | 0 (0.0%) |
| Architecture & Engineering | 17 (100.0%) | 0 (0.0%) |
| Life, Physical & Social Science | 0 (0.0%) | 5 (100.0%) |
| Community & Social Service | 20 (60.6%) | 13 (39.4%) |
| Education, Arts & Media | 7 (100.0%) | 0 (0.0%) |
| Legal Services & Support | 2 (100.0%) | 0 (0.0%) |
| Education Instruction & Library | 11 (45.8%) | 13 (54.2%) |
| Arts, Media & Entertainment | 0 (0.0%) | 0 (0.0%) |
| Health Diagnosing & Treating | 13 (44.8%) | 16 (55.2%) |
| Health Technologists | 13 (59.1%) | 9 (40.9%) |
| Total (Category) | 130 (66.3%) | 66 (33.7%) |
| Total (Overall) | 313 (52.1%) | 288 (47.9%) |
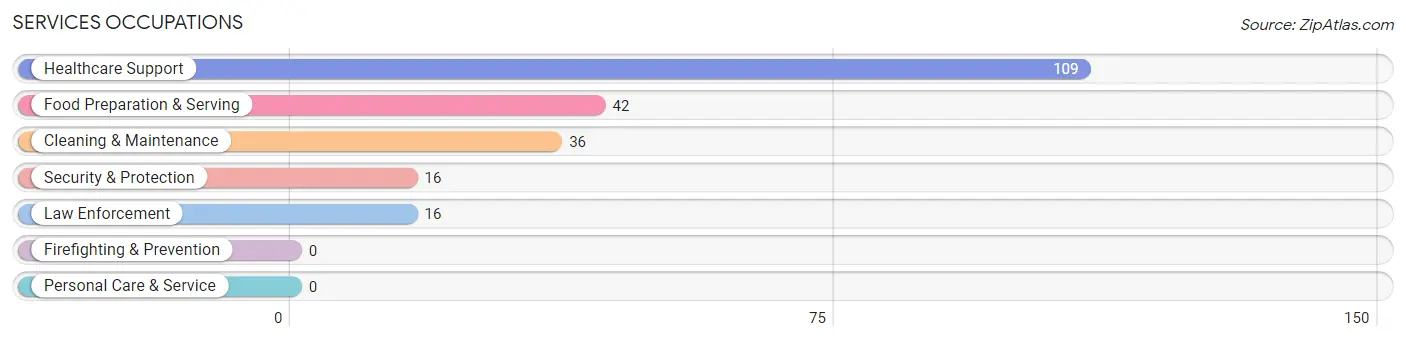
Services Occupations
The most common Services occupations in Fort Benton are Healthcare Support (109 | 18.1%), Food Preparation & Serving (42 | 7.0%), Cleaning & Maintenance (36 | 6.0%), Security & Protection (16 | 2.7%), and Law Enforcement (16 | 2.7%).
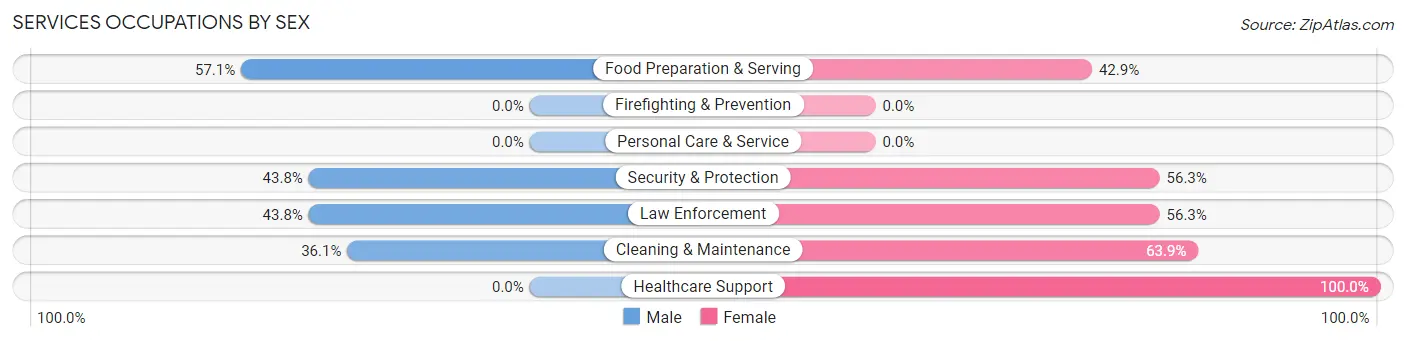
Services Occupations by Sex
Within the Services occupations in Fort Benton, the most male-oriented occupations are Food Preparation & Serving (57.1%), Security & Protection (43.8%), and Law Enforcement (43.8%), while the most female-oriented occupations are Healthcare Support (100.0%), Cleaning & Maintenance (63.9%), and Security & Protection (56.2%).
| Occupation | Male | Female |
| Healthcare Support | 0 (0.0%) | 109 (100.0%) |
| Security & Protection | 7 (43.8%) | 9 (56.2%) |
| Firefighting & Prevention | 0 (0.0%) | 0 (0.0%) |
| Law Enforcement | 7 (43.8%) | 9 (56.2%) |
| Food Preparation & Serving | 24 (57.1%) | 18 (42.9%) |
| Cleaning & Maintenance | 13 (36.1%) | 23 (63.9%) |
| Personal Care & Service | 0 (0.0%) | 0 (0.0%) |
| Total (Category) | 44 (21.7%) | 159 (78.3%) |
| Total (Overall) | 313 (52.1%) | 288 (47.9%) |
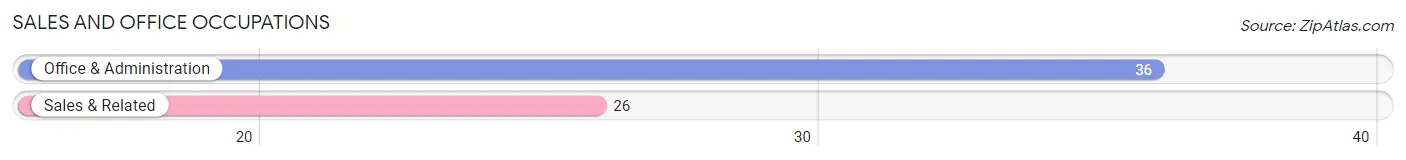
Sales and Office Occupations
The most common Sales and Office occupations in Fort Benton are Office & Administration (36 | 6.0%), and Sales & Related (26 | 4.3%).
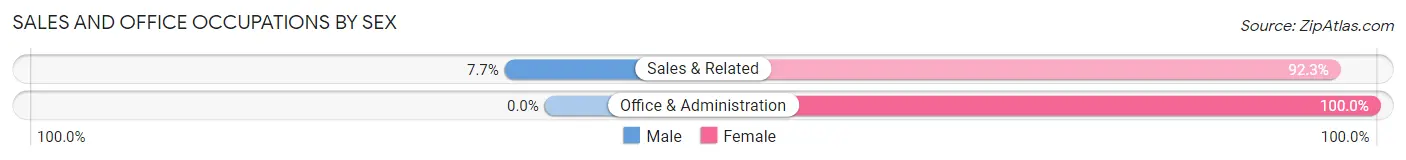
Sales and Office Occupations by Sex
| Occupation | Male | Female |
| Sales & Related | 2 (7.7%) | 24 (92.3%) |
| Office & Administration | 0 (0.0%) | 36 (100.0%) |
| Total (Category) | 2 (3.2%) | 60 (96.8%) |
| Total (Overall) | 313 (52.1%) | 288 (47.9%) |
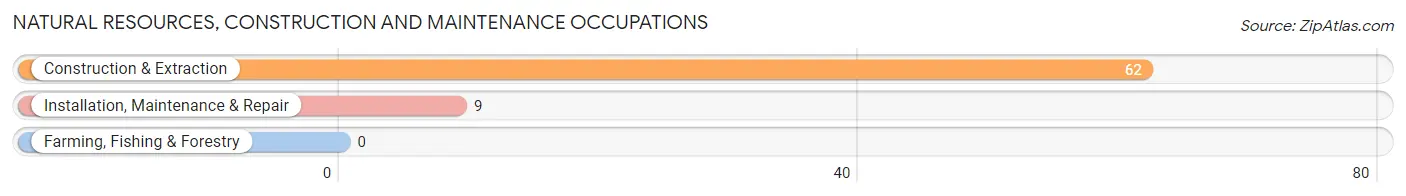
Natural Resources, Construction and Maintenance Occupations
The most common Natural Resources, Construction and Maintenance occupations in Fort Benton are Construction & Extraction (62 | 10.3%), and Installation, Maintenance & Repair (9 | 1.5%).
Natural Resources, Construction and Maintenance Occupations by Sex
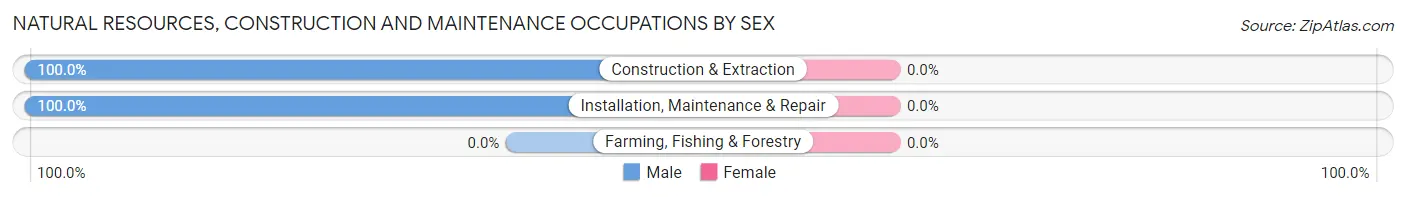
| Occupation | Male | Female |
| Farming, Fishing & Forestry | 0 (0.0%) | 0 (0.0%) |
| Construction & Extraction | 62 (100.0%) | 0 (0.0%) |
| Installation, Maintenance & Repair | 9 (100.0%) | 0 (0.0%) |
| Total (Category) | 71 (100.0%) | 0 (0.0%) |
| Total (Overall) | 313 (52.1%) | 288 (47.9%) |
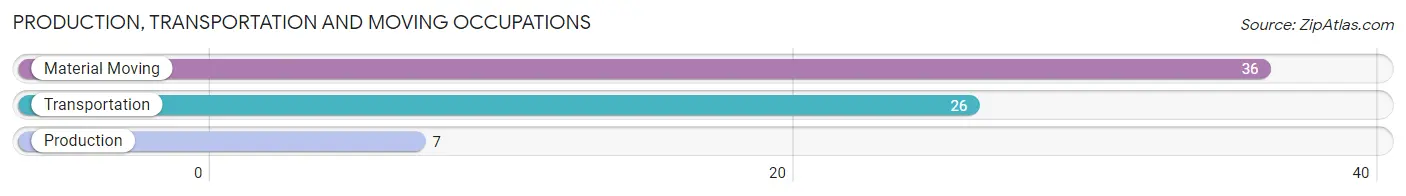
Production, Transportation and Moving Occupations
The most common Production, Transportation and Moving occupations in Fort Benton are Material Moving (36 | 6.0%), Transportation (26 | 4.3%), and Production (7 | 1.2%).
Production, Transportation and Moving Occupations by Sex
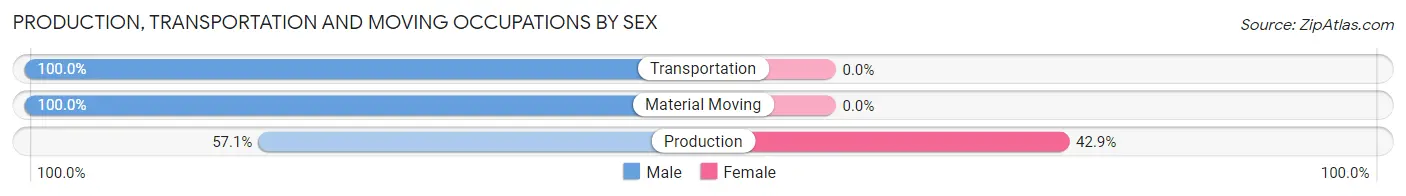
| Occupation | Male | Female |
| Production | 4 (57.1%) | 3 (42.9%) |
| Transportation | 26 (100.0%) | 0 (0.0%) |
| Material Moving | 36 (100.0%) | 0 (0.0%) |
| Total (Category) | 66 (95.7%) | 3 (4.3%) |
| Total (Overall) | 313 (52.1%) | 288 (47.9%) |
Employment Industries by Sex in Fort Benton
Employment Industries in Fort Benton
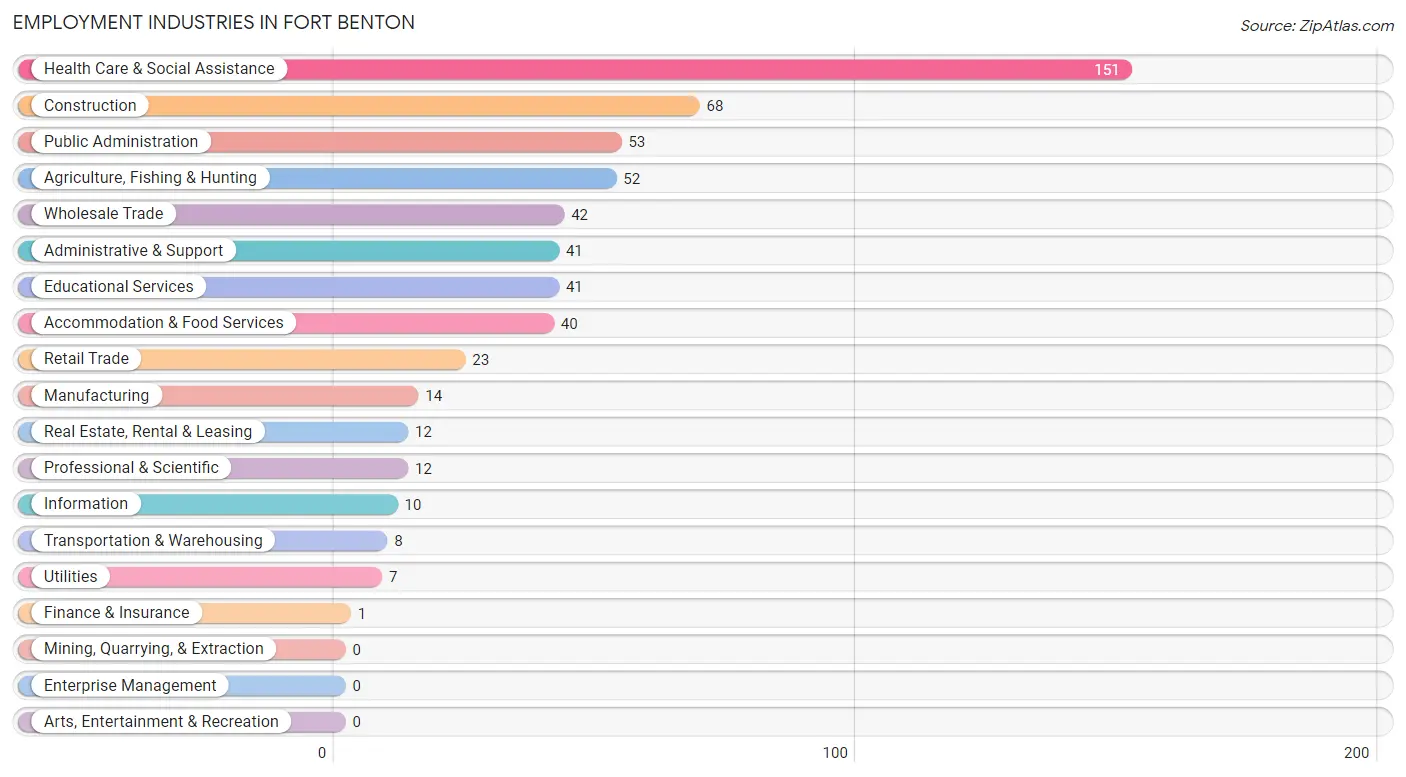
The major employment industries in Fort Benton include Health Care & Social Assistance (151 | 25.1%), Construction (68 | 11.3%), Public Administration (53 | 8.8%), Agriculture, Fishing & Hunting (52 | 8.6%), and Wholesale Trade (42 | 7.0%).
Employment Industries by Sex in Fort Benton
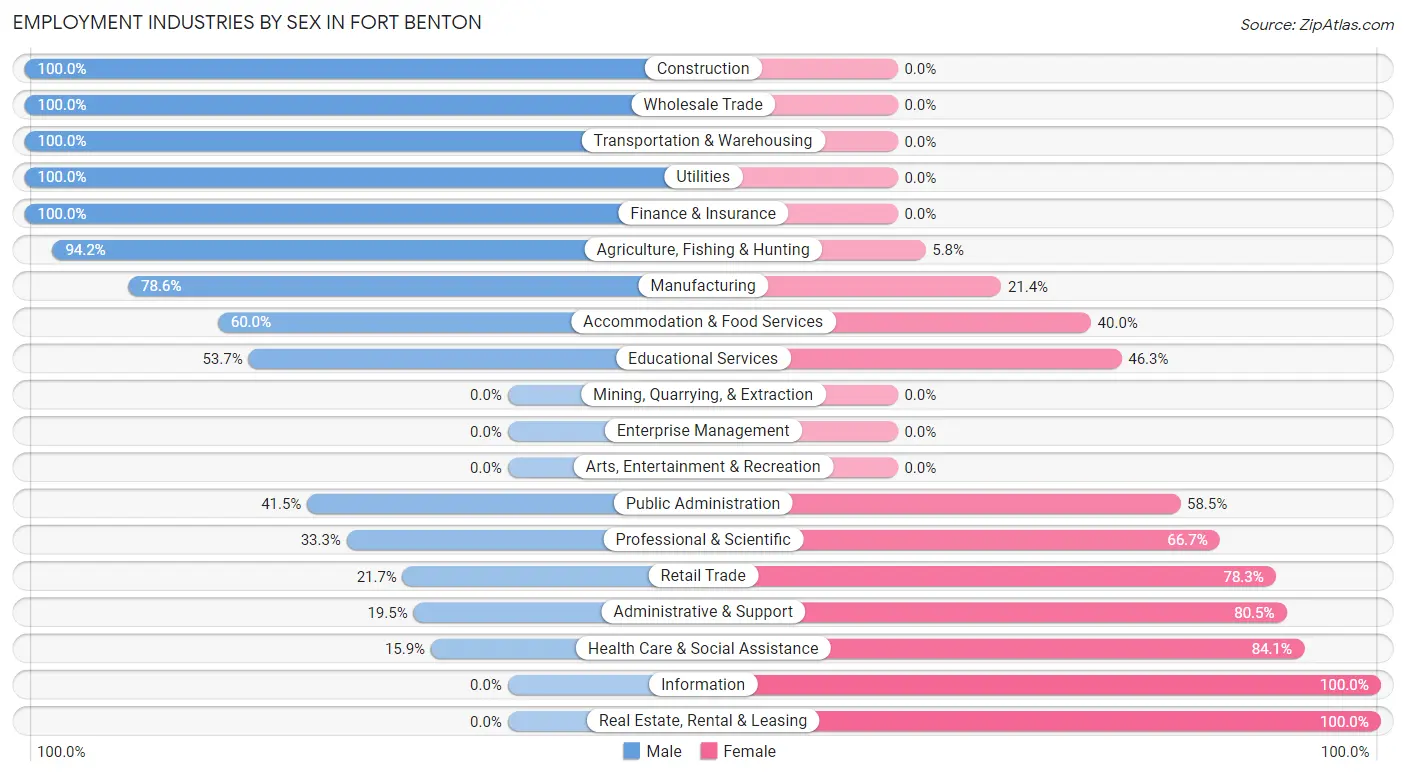
The Fort Benton industries that see more men than women are Construction (100.0%), Wholesale Trade (100.0%), and Transportation & Warehousing (100.0%), whereas the industries that tend to have a higher number of women are Information (100.0%), Real Estate, Rental & Leasing (100.0%), and Health Care & Social Assistance (84.1%).
| Industry | Male | Female |
| Agriculture, Fishing & Hunting | 49 (94.2%) | 3 (5.8%) |
| Mining, Quarrying, & Extraction | 0 (0.0%) | 0 (0.0%) |
| Construction | 68 (100.0%) | 0 (0.0%) |
| Manufacturing | 11 (78.6%) | 3 (21.4%) |
| Wholesale Trade | 42 (100.0%) | 0 (0.0%) |
| Retail Trade | 5 (21.7%) | 18 (78.3%) |
| Transportation & Warehousing | 8 (100.0%) | 0 (0.0%) |
| Utilities | 7 (100.0%) | 0 (0.0%) |
| Information | 0 (0.0%) | 10 (100.0%) |
| Finance & Insurance | 1 (100.0%) | 0 (0.0%) |
| Real Estate, Rental & Leasing | 0 (0.0%) | 12 (100.0%) |
| Professional & Scientific | 4 (33.3%) | 8 (66.7%) |
| Enterprise Management | 0 (0.0%) | 0 (0.0%) |
| Administrative & Support | 8 (19.5%) | 33 (80.5%) |
| Educational Services | 22 (53.7%) | 19 (46.3%) |
| Health Care & Social Assistance | 24 (15.9%) | 127 (84.1%) |
| Arts, Entertainment & Recreation | 0 (0.0%) | 0 (0.0%) |
| Accommodation & Food Services | 24 (60.0%) | 16 (40.0%) |
| Public Administration | 22 (41.5%) | 31 (58.5%) |
| Total | 313 (52.1%) | 288 (47.9%) |
Education in Fort Benton
School Enrollment in Fort Benton
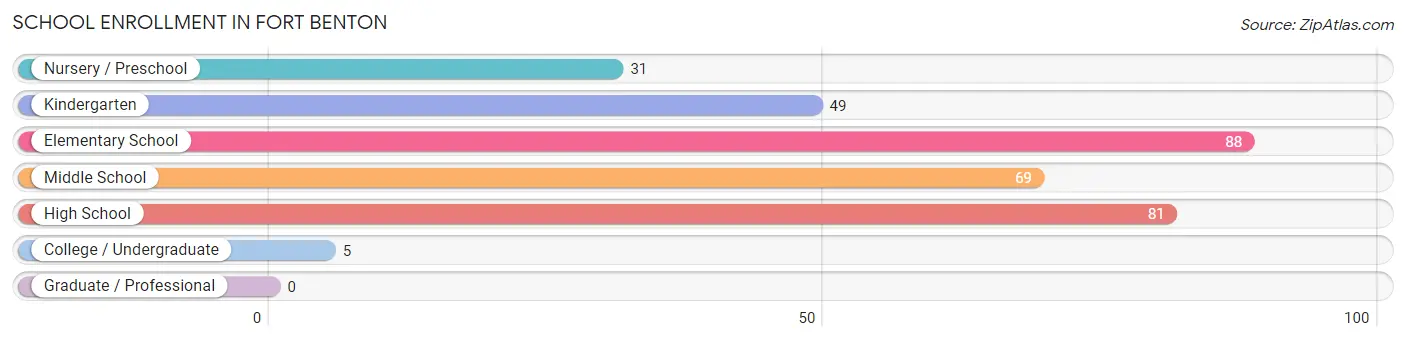
The most common levels of schooling among the 323 students in Fort Benton are elementary school (88 | 27.2%), high school (81 | 25.1%), and middle school (69 | 21.4%).
| School Level | # Students | % Students |
| Nursery / Preschool | 31 | 9.6% |
| Kindergarten | 49 | 15.2% |
| Elementary School | 88 | 27.2% |
| Middle School | 69 | 21.4% |
| High School | 81 | 25.1% |
| College / Undergraduate | 5 | 1.5% |
| Graduate / Professional | 0 | 0.0% |
| Total | 323 | 100.0% |
School Enrollment by Age by Funding Source in Fort Benton
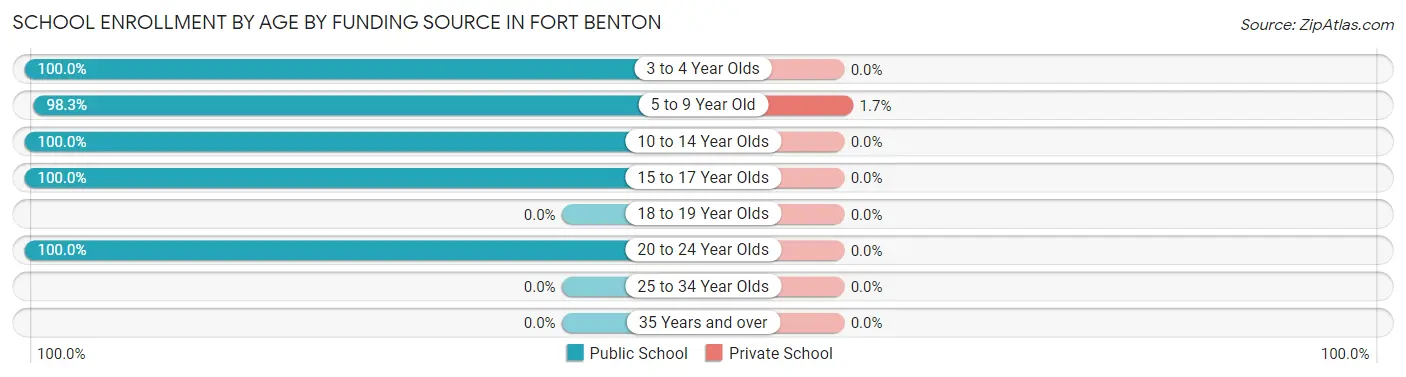
Out of a total of 323 students who are enrolled in schools in Fort Benton, 2 (0.6%) attend a private institution, while the remaining 321 (99.4%) are enrolled in public schools. The age group of 5 to 9 year old has the highest likelihood of being enrolled in private schools, with 2 (1.7% in the age bracket) enrolled. Conversely, the age group of 3 to 4 year olds has the lowest likelihood of being enrolled in a private school, with 12 (100.0% in the age bracket) attending a public institution.
| Age Bracket | Public School | Private School |
| 3 to 4 Year Olds | 12 (100.0%) | 0 (0.0%) |
| 5 to 9 Year Old | 118 (98.3%) | 2 (1.7%) |
| 10 to 14 Year Olds | 78 (100.0%) | 0 (0.0%) |
| 15 to 17 Year Olds | 108 (100.0%) | 0 (0.0%) |
| 18 to 19 Year Olds | 0 (0.0%) | 0 (0.0%) |
| 20 to 24 Year Olds | 5 (100.0%) | 0 (0.0%) |
| 25 to 34 Year Olds | 0 (0.0%) | 0 (0.0%) |
| 35 Years and over | 0 (0.0%) | 0 (0.0%) |
| Total | 321 (99.4%) | 2 (0.6%) |
Educational Attainment by Field of Study in Fort Benton
Education (103 | 28.7%), bio, nature & agricultural (45 | 12.5%), physical & health sciences (34 | 9.5%), science & technology (25 | 7.0%), and literature & languages (23 | 6.4%) are the most common fields of study among 359 individuals in Fort Benton who have obtained a bachelor's degree or higher.
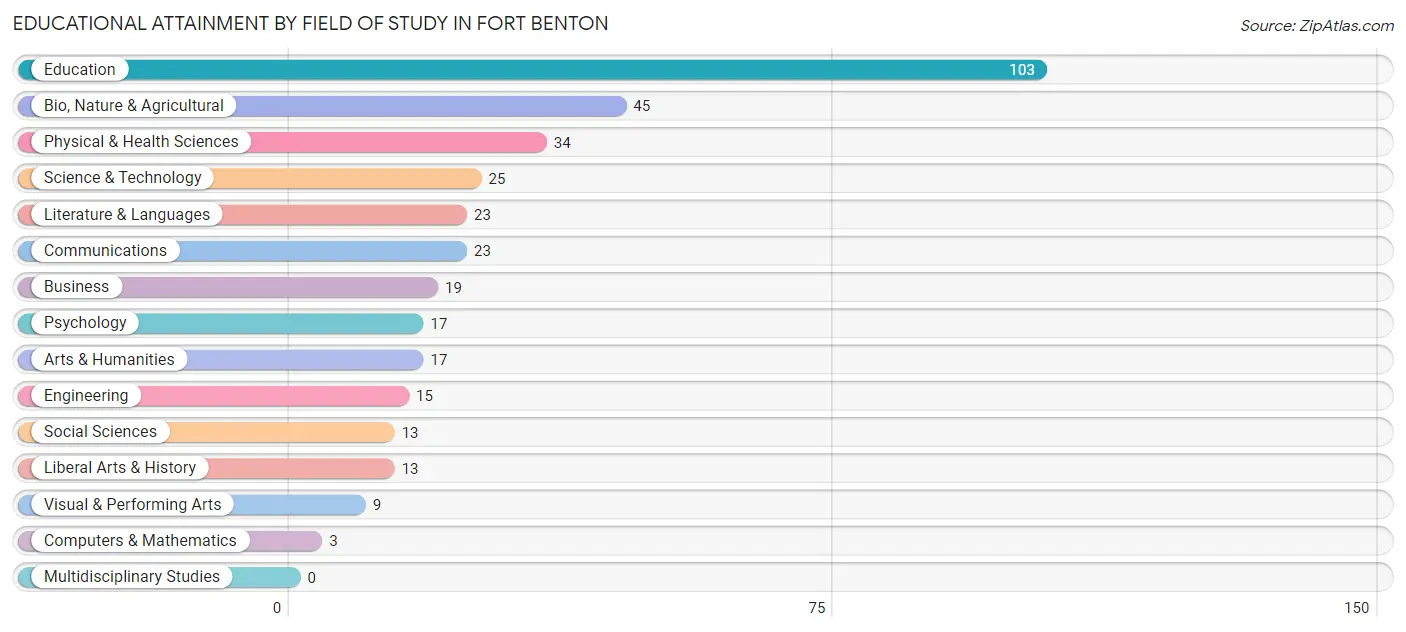
| Field of Study | # Graduates | % Graduates |
| Computers & Mathematics | 3 | 0.8% |
| Bio, Nature & Agricultural | 45 | 12.5% |
| Physical & Health Sciences | 34 | 9.5% |
| Psychology | 17 | 4.7% |
| Social Sciences | 13 | 3.6% |
| Engineering | 15 | 4.2% |
| Multidisciplinary Studies | 0 | 0.0% |
| Science & Technology | 25 | 7.0% |
| Business | 19 | 5.3% |
| Education | 103 | 28.7% |
| Literature & Languages | 23 | 6.4% |
| Liberal Arts & History | 13 | 3.6% |
| Visual & Performing Arts | 9 | 2.5% |
| Communications | 23 | 6.4% |
| Arts & Humanities | 17 | 4.7% |
| Total | 359 | 100.0% |
Transportation & Commute in Fort Benton
Vehicle Availability by Sex in Fort Benton
The most prevalent vehicle ownership categories in Fort Benton are males with 2 vehicles (177, accounting for 55.0%) and females with 2 vehicles (126, making up 61.5%).
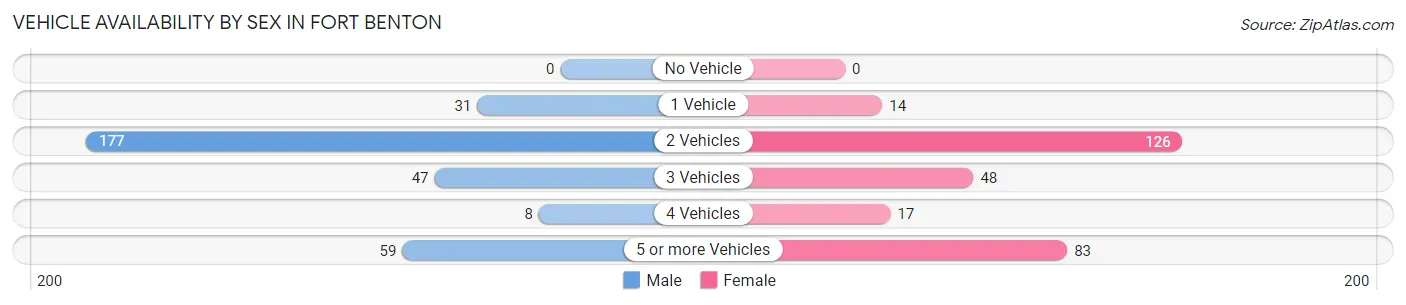
| Vehicles Available | Male | Female |
| No Vehicle | 0 (0.0%) | 0 (0.0%) |
| 1 Vehicle | 31 (9.6%) | 14 (4.9%) |
| 2 Vehicles | 177 (55.0%) | 126 (43.8%) |
| 3 Vehicles | 47 (14.6%) | 48 (16.7%) |
| 4 Vehicles | 8 (2.5%) | 17 (5.9%) |
| 5 or more Vehicles | 59 (18.3%) | 83 (28.8%) |
| Total | 322 (100.0%) | 288 (100.0%) |
Commute Time in Fort Benton
The most frequently occuring commute durations in Fort Benton are 15 to 19 minutes (145 commuters, 23.9%), 10 to 14 minutes (115 commuters, 19.0%), and 5 to 9 minutes (75 commuters, 12.4%).
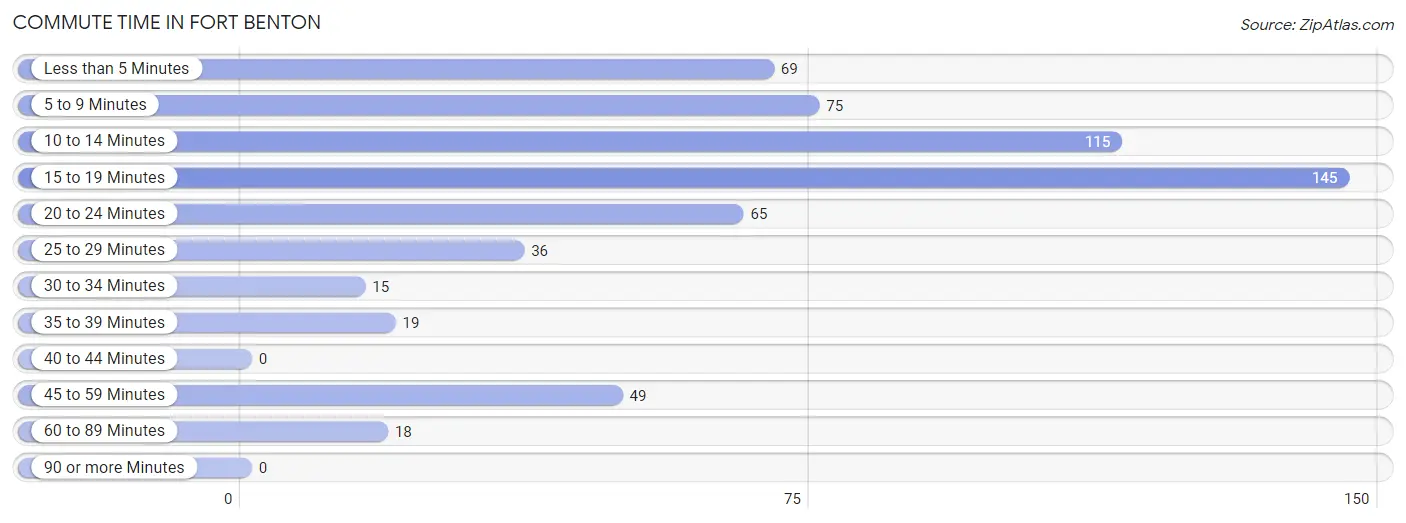
| Commute Time | # Commuters | % Commuters |
| Less than 5 Minutes | 69 | 11.4% |
| 5 to 9 Minutes | 75 | 12.4% |
| 10 to 14 Minutes | 115 | 19.0% |
| 15 to 19 Minutes | 145 | 23.9% |
| 20 to 24 Minutes | 65 | 10.7% |
| 25 to 29 Minutes | 36 | 5.9% |
| 30 to 34 Minutes | 15 | 2.5% |
| 35 to 39 Minutes | 19 | 3.1% |
| 40 to 44 Minutes | 0 | 0.0% |
| 45 to 59 Minutes | 49 | 8.1% |
| 60 to 89 Minutes | 18 | 3.0% |
| 90 or more Minutes | 0 | 0.0% |
Commute Time by Sex in Fort Benton
The most common commute times in Fort Benton are 15 to 19 minutes (76 commuters, 23.7%) for males and 15 to 19 minutes (69 commuters, 24.2%) for females.
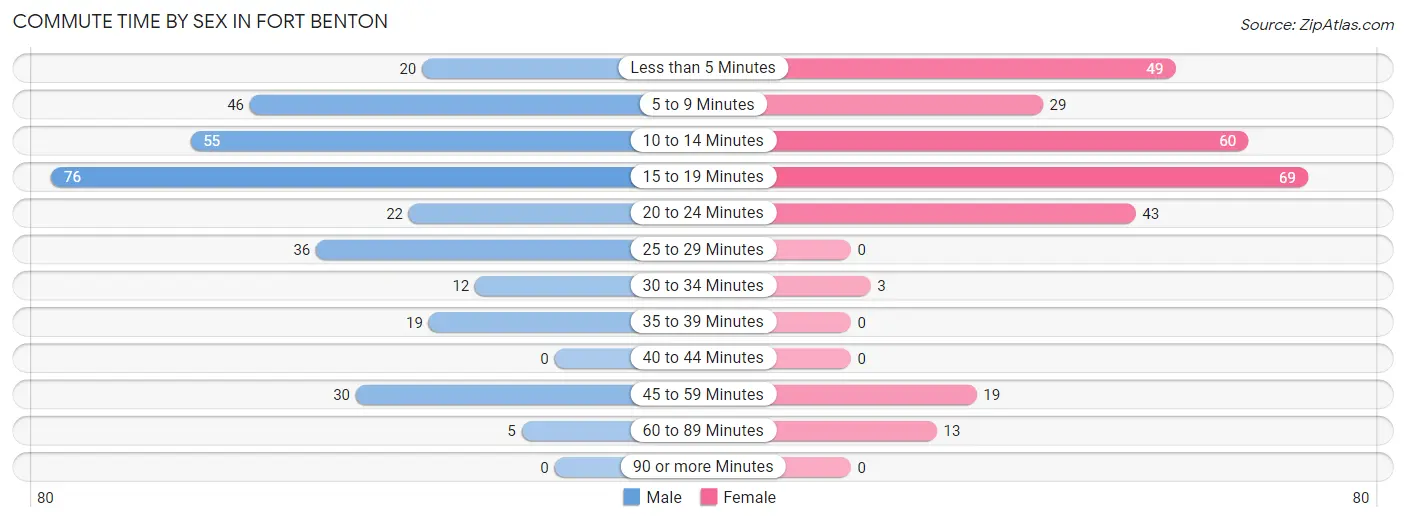
| Commute Time | Male | Female |
| Less than 5 Minutes | 20 (6.2%) | 49 (17.2%) |
| 5 to 9 Minutes | 46 (14.3%) | 29 (10.2%) |
| 10 to 14 Minutes | 55 (17.1%) | 60 (21.0%) |
| 15 to 19 Minutes | 76 (23.7%) | 69 (24.2%) |
| 20 to 24 Minutes | 22 (6.9%) | 43 (15.1%) |
| 25 to 29 Minutes | 36 (11.2%) | 0 (0.0%) |
| 30 to 34 Minutes | 12 (3.7%) | 3 (1.1%) |
| 35 to 39 Minutes | 19 (5.9%) | 0 (0.0%) |
| 40 to 44 Minutes | 0 (0.0%) | 0 (0.0%) |
| 45 to 59 Minutes | 30 (9.3%) | 19 (6.7%) |
| 60 to 89 Minutes | 5 (1.6%) | 13 (4.6%) |
| 90 or more Minutes | 0 (0.0%) | 0 (0.0%) |
Time of Departure to Work by Sex in Fort Benton
The most frequent times of departure to work in Fort Benton are 6:30 AM to 6:59 AM (82, 25.6%) for males and 7:30 AM to 7:59 AM (109, 38.3%) for females.
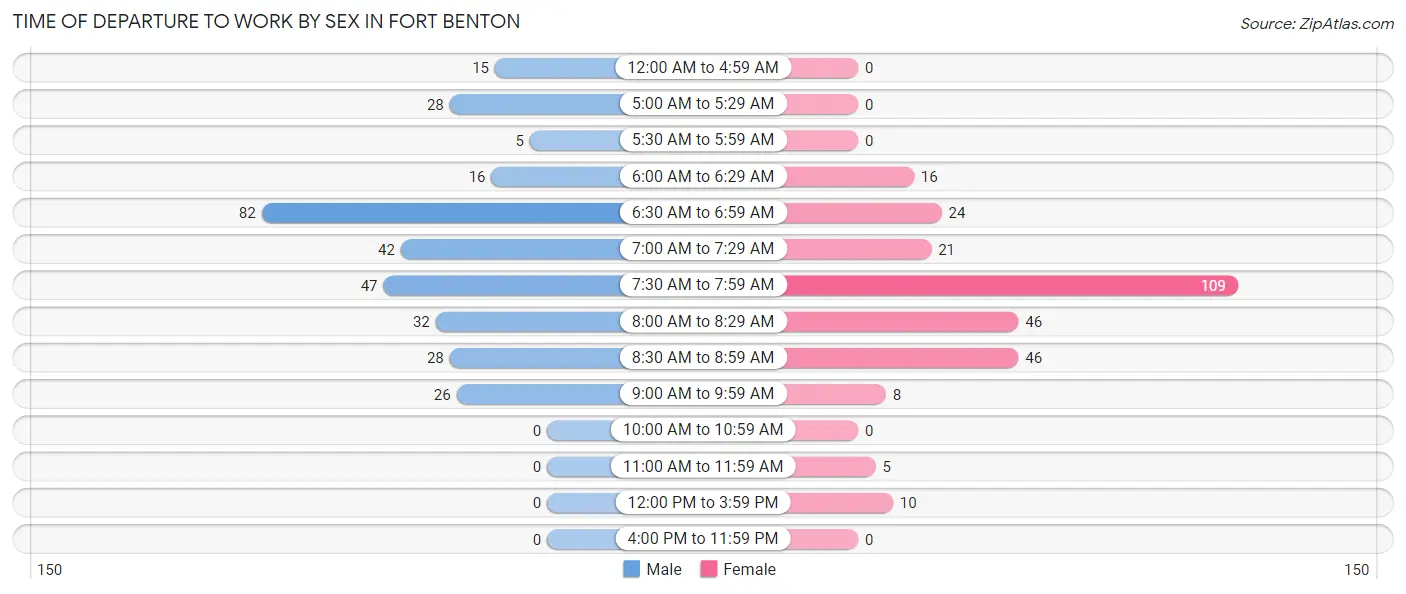
| Time of Departure | Male | Female |
| 12:00 AM to 4:59 AM | 15 (4.7%) | 0 (0.0%) |
| 5:00 AM to 5:29 AM | 28 (8.7%) | 0 (0.0%) |
| 5:30 AM to 5:59 AM | 5 (1.6%) | 0 (0.0%) |
| 6:00 AM to 6:29 AM | 16 (5.0%) | 16 (5.6%) |
| 6:30 AM to 6:59 AM | 82 (25.6%) | 24 (8.4%) |
| 7:00 AM to 7:29 AM | 42 (13.1%) | 21 (7.4%) |
| 7:30 AM to 7:59 AM | 47 (14.6%) | 109 (38.3%) |
| 8:00 AM to 8:29 AM | 32 (10.0%) | 46 (16.1%) |
| 8:30 AM to 8:59 AM | 28 (8.7%) | 46 (16.1%) |
| 9:00 AM to 9:59 AM | 26 (8.1%) | 8 (2.8%) |
| 10:00 AM to 10:59 AM | 0 (0.0%) | 0 (0.0%) |
| 11:00 AM to 11:59 AM | 0 (0.0%) | 5 (1.8%) |
| 12:00 PM to 3:59 PM | 0 (0.0%) | 10 (3.5%) |
| 4:00 PM to 11:59 PM | 0 (0.0%) | 0 (0.0%) |
| Total | 321 (100.0%) | 285 (100.0%) |
Housing Occupancy in Fort Benton
Occupancy by Ownership in Fort Benton
Of the total 548 dwellings in Fort Benton, owner-occupied units account for 429 (78.3%), while renter-occupied units make up 119 (21.7%).
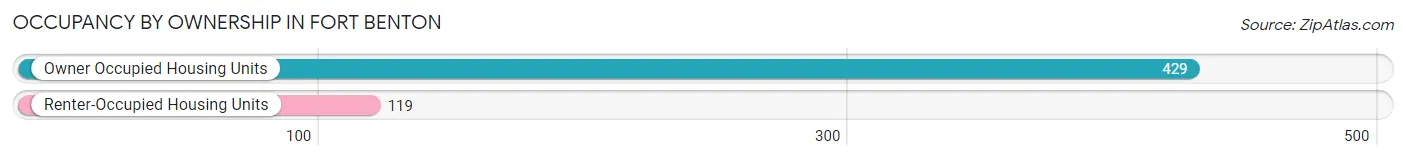
| Occupancy | # Housing Units | % Housing Units |
| Owner Occupied Housing Units | 429 | 78.3% |
| Renter-Occupied Housing Units | 119 | 21.7% |
| Total Occupied Housing Units | 548 | 100.0% |
Occupancy by Household Size in Fort Benton
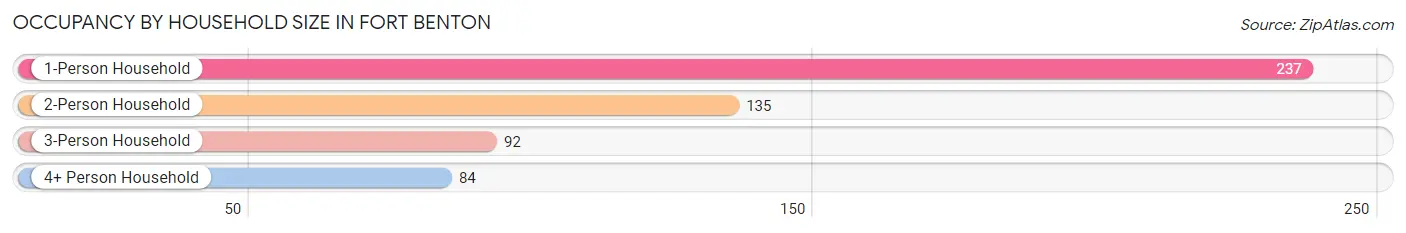
| Household Size | # Housing Units | % Housing Units |
| 1-Person Household | 237 | 43.2% |
| 2-Person Household | 135 | 24.6% |
| 3-Person Household | 92 | 16.8% |
| 4+ Person Household | 84 | 15.3% |
| Total Housing Units | 548 | 100.0% |
Occupancy by Ownership by Household Size in Fort Benton
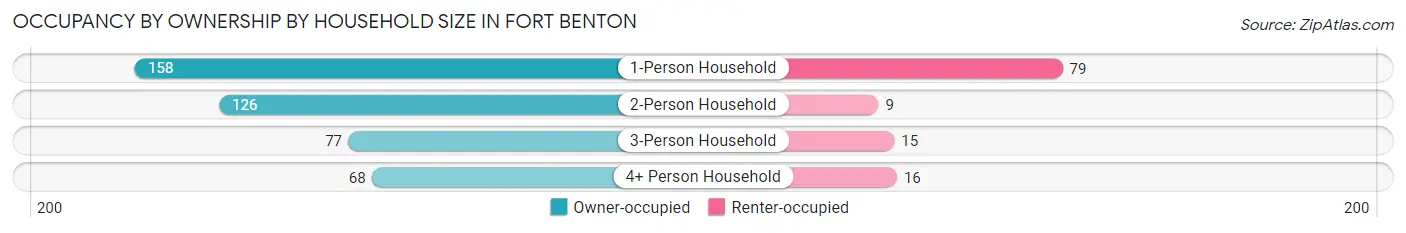
| Household Size | Owner-occupied | Renter-occupied |
| 1-Person Household | 158 (66.7%) | 79 (33.3%) |
| 2-Person Household | 126 (93.3%) | 9 (6.7%) |
| 3-Person Household | 77 (83.7%) | 15 (16.3%) |
| 4+ Person Household | 68 (80.9%) | 16 (19.1%) |
| Total Housing Units | 429 (78.3%) | 119 (21.7%) |
Occupancy by Educational Attainment in Fort Benton
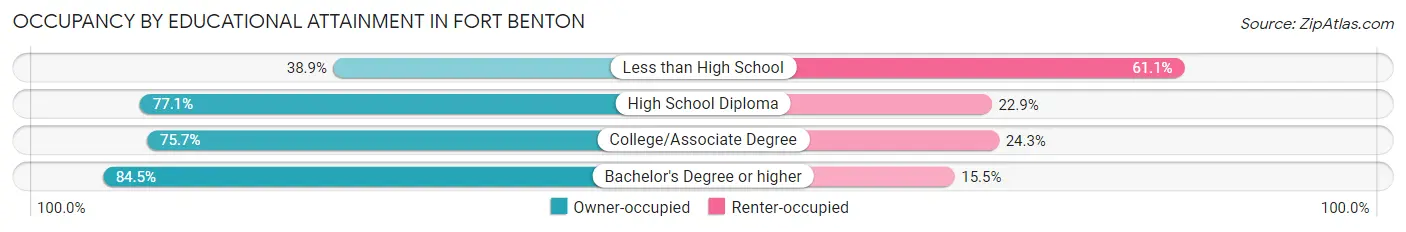
| Household Size | Owner-occupied | Renter-occupied |
| Less than High School | 7 (38.9%) | 11 (61.1%) |
| High School Diploma | 108 (77.1%) | 32 (22.9%) |
| College/Associate Degree | 134 (75.7%) | 43 (24.3%) |
| Bachelor's Degree or higher | 180 (84.5%) | 33 (15.5%) |
Occupancy by Age of Householder in Fort Benton
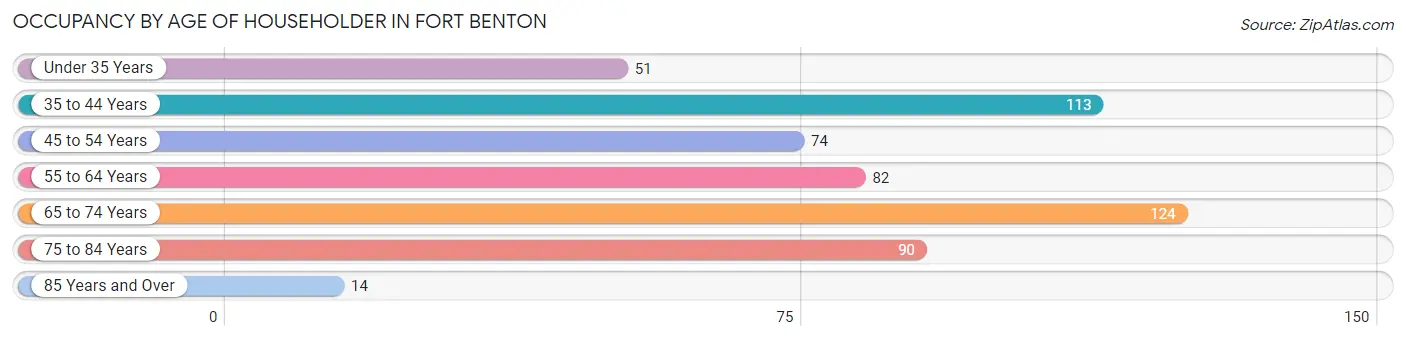
| Age Bracket | # Households | % Households |
| Under 35 Years | 51 | 9.3% |
| 35 to 44 Years | 113 | 20.6% |
| 45 to 54 Years | 74 | 13.5% |
| 55 to 64 Years | 82 | 15.0% |
| 65 to 74 Years | 124 | 22.6% |
| 75 to 84 Years | 90 | 16.4% |
| 85 Years and Over | 14 | 2.5% |
| Total | 548 | 100.0% |
Housing Finances in Fort Benton
Median Income by Occupancy in Fort Benton
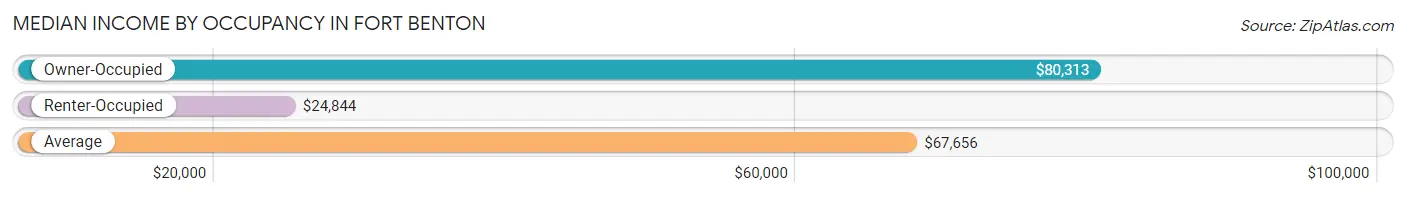
| Occupancy Type | # Households | Median Income |
| Owner-Occupied | 429 (78.3%) | $80,313 |
| Renter-Occupied | 119 (21.7%) | $24,844 |
| Average | 548 (100.0%) | $67,656 |
Occupancy by Householder Income Bracket in Fort Benton
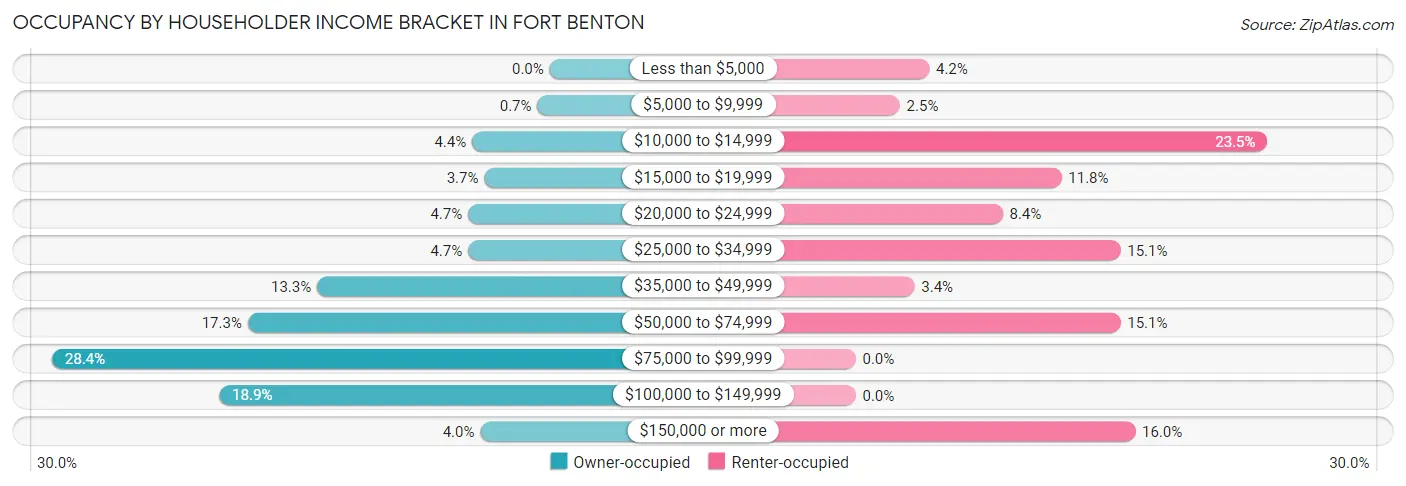
| Income Bracket | Owner-occupied | Renter-occupied |
| Less than $5,000 | 0 (0.0%) | 5 (4.2%) |
| $5,000 to $9,999 | 3 (0.7%) | 3 (2.5%) |
| $10,000 to $14,999 | 19 (4.4%) | 28 (23.5%) |
| $15,000 to $19,999 | 16 (3.7%) | 14 (11.8%) |
| $20,000 to $24,999 | 20 (4.7%) | 10 (8.4%) |
| $25,000 to $34,999 | 20 (4.7%) | 18 (15.1%) |
| $35,000 to $49,999 | 57 (13.3%) | 4 (3.4%) |
| $50,000 to $74,999 | 74 (17.2%) | 18 (15.1%) |
| $75,000 to $99,999 | 122 (28.4%) | 0 (0.0%) |
| $100,000 to $149,999 | 81 (18.9%) | 0 (0.0%) |
| $150,000 or more | 17 (4.0%) | 19 (16.0%) |
| Total | 429 (100.0%) | 119 (100.0%) |
Monthly Housing Cost Tiers in Fort Benton
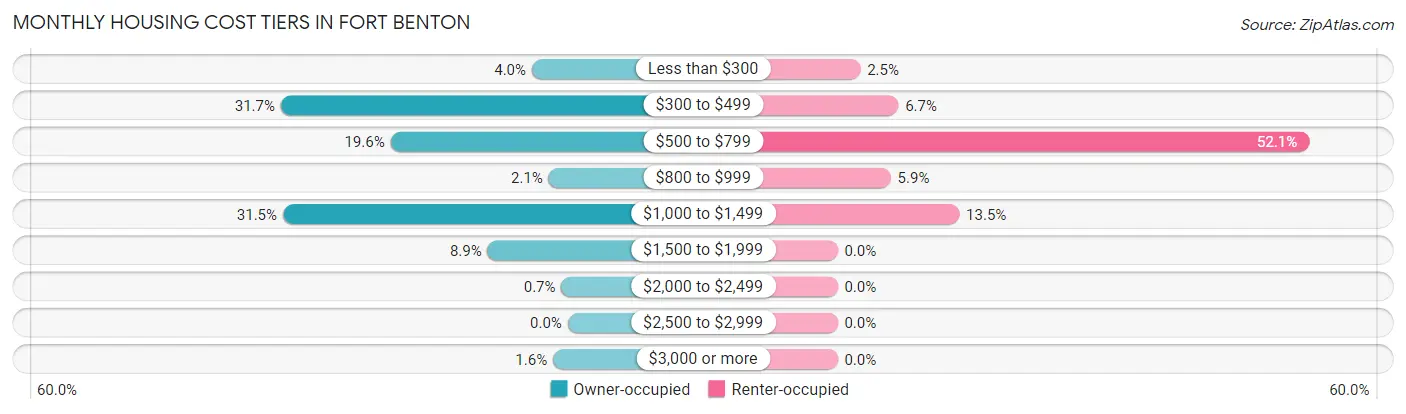
| Monthly Cost | Owner-occupied | Renter-occupied |
| Less than $300 | 17 (4.0%) | 3 (2.5%) |
| $300 to $499 | 136 (31.7%) | 8 (6.7%) |
| $500 to $799 | 84 (19.6%) | 62 (52.1%) |
| $800 to $999 | 9 (2.1%) | 7 (5.9%) |
| $1,000 to $1,499 | 135 (31.5%) | 16 (13.5%) |
| $1,500 to $1,999 | 38 (8.9%) | 0 (0.0%) |
| $2,000 to $2,499 | 3 (0.7%) | 0 (0.0%) |
| $2,500 to $2,999 | 0 (0.0%) | 0 (0.0%) |
| $3,000 or more | 7 (1.6%) | 0 (0.0%) |
| Total | 429 (100.0%) | 119 (100.0%) |
Physical Housing Characteristics in Fort Benton
Housing Structures in Fort Benton
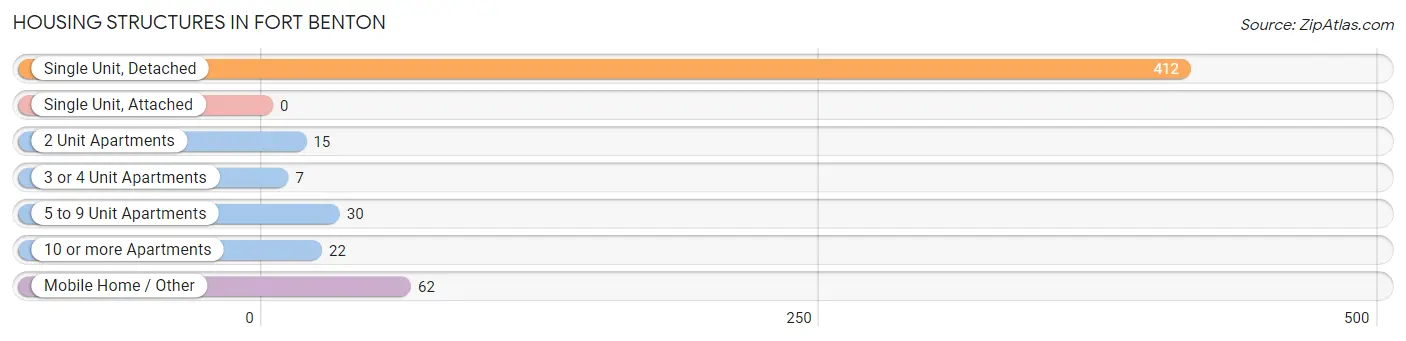
| Structure Type | # Housing Units | % Housing Units |
| Single Unit, Detached | 412 | 75.2% |
| Single Unit, Attached | 0 | 0.0% |
| 2 Unit Apartments | 15 | 2.7% |
| 3 or 4 Unit Apartments | 7 | 1.3% |
| 5 to 9 Unit Apartments | 30 | 5.5% |
| 10 or more Apartments | 22 | 4.0% |
| Mobile Home / Other | 62 | 11.3% |
| Total | 548 | 100.0% |
Housing Structures by Occupancy in Fort Benton
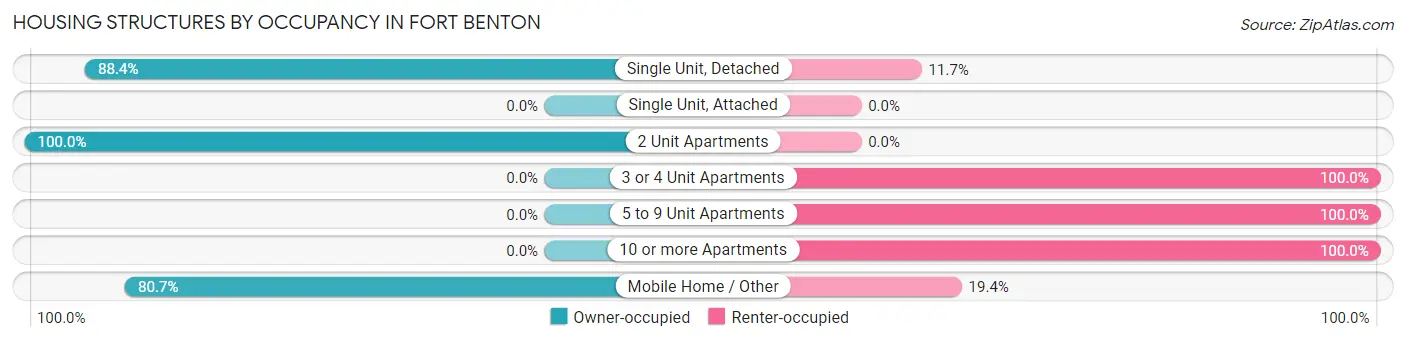
| Structure Type | Owner-occupied | Renter-occupied |
| Single Unit, Detached | 364 (88.3%) | 48 (11.7%) |
| Single Unit, Attached | 0 (0.0%) | 0 (0.0%) |
| 2 Unit Apartments | 15 (100.0%) | 0 (0.0%) |
| 3 or 4 Unit Apartments | 0 (0.0%) | 7 (100.0%) |
| 5 to 9 Unit Apartments | 0 (0.0%) | 30 (100.0%) |
| 10 or more Apartments | 0 (0.0%) | 22 (100.0%) |
| Mobile Home / Other | 50 (80.6%) | 12 (19.4%) |
| Total | 429 (78.3%) | 119 (21.7%) |
Housing Structures by Number of Rooms in Fort Benton
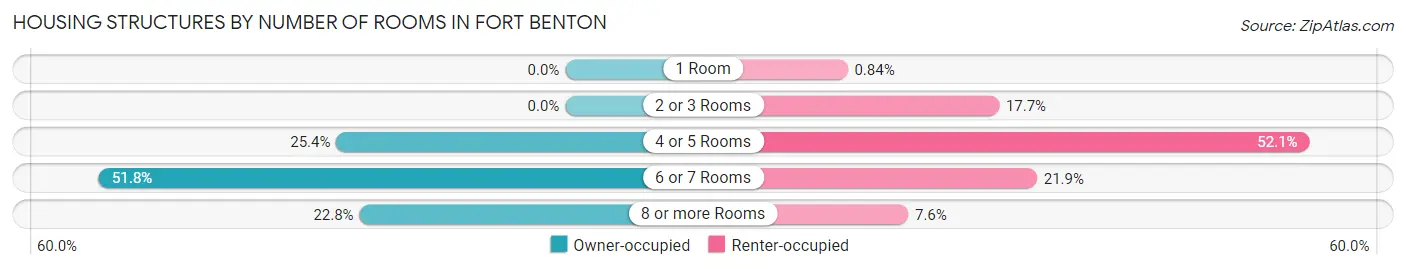
| Number of Rooms | Owner-occupied | Renter-occupied |
| 1 Room | 0 (0.0%) | 1 (0.8%) |
| 2 or 3 Rooms | 0 (0.0%) | 21 (17.6%) |
| 4 or 5 Rooms | 109 (25.4%) | 62 (52.1%) |
| 6 or 7 Rooms | 222 (51.7%) | 26 (21.8%) |
| 8 or more Rooms | 98 (22.8%) | 9 (7.6%) |
| Total | 429 (100.0%) | 119 (100.0%) |
Housing Structure by Heating Type in Fort Benton
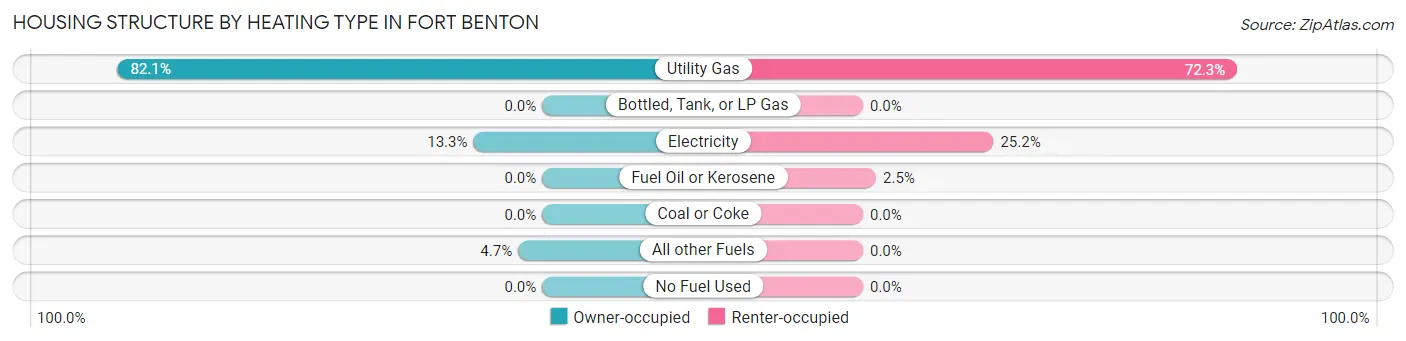
| Heating Type | Owner-occupied | Renter-occupied |
| Utility Gas | 352 (82.1%) | 86 (72.3%) |
| Bottled, Tank, or LP Gas | 0 (0.0%) | 0 (0.0%) |
| Electricity | 57 (13.3%) | 30 (25.2%) |
| Fuel Oil or Kerosene | 0 (0.0%) | 3 (2.5%) |
| Coal or Coke | 0 (0.0%) | 0 (0.0%) |
| All other Fuels | 20 (4.7%) | 0 (0.0%) |
| No Fuel Used | 0 (0.0%) | 0 (0.0%) |
| Total | 429 (100.0%) | 119 (100.0%) |
Household Vehicle Usage in Fort Benton
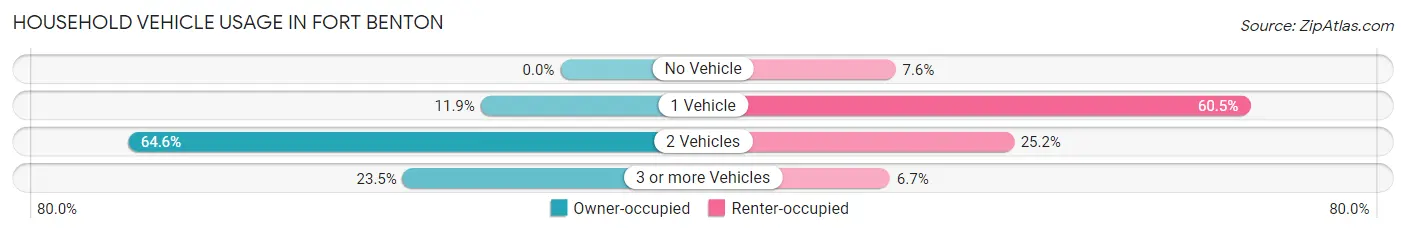
| Vehicles per Household | Owner-occupied | Renter-occupied |
| No Vehicle | 0 (0.0%) | 9 (7.6%) |
| 1 Vehicle | 51 (11.9%) | 72 (60.5%) |
| 2 Vehicles | 277 (64.6%) | 30 (25.2%) |
| 3 or more Vehicles | 101 (23.5%) | 8 (6.7%) |
| Total | 429 (100.0%) | 119 (100.0%) |
Real Estate & Mortgages in Fort Benton
Real Estate and Mortgage Overview in Fort Benton
| Characteristic | Without Mortgage | With Mortgage |
| Housing Units | 228 | 201 |
| Median Property Value | $170,000 | $199,000 |
| Median Household Income | $66,379 | $15 |
| Monthly Housing Costs | $438 | $7 |
| Real Estate Taxes | $1,523 | $0 |
Property Value by Mortgage Status in Fort Benton
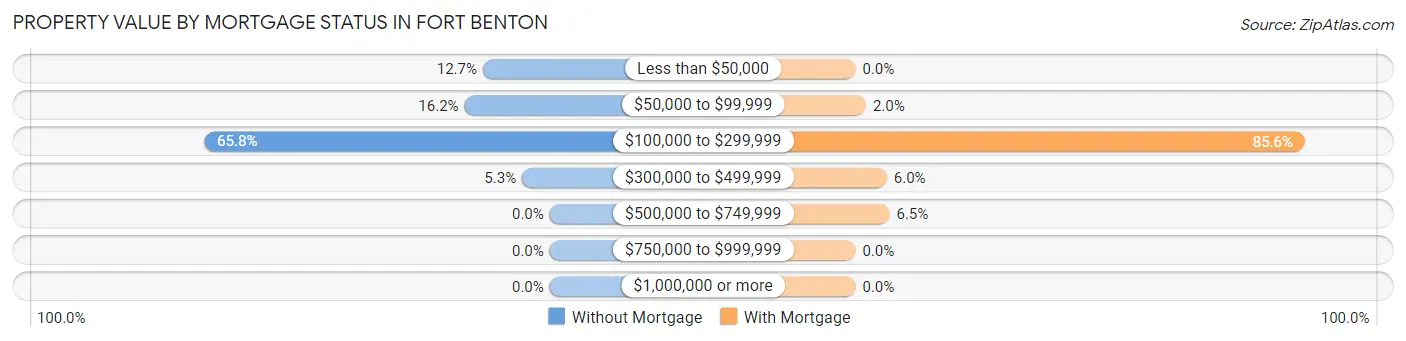
| Property Value | Without Mortgage | With Mortgage |
| Less than $50,000 | 29 (12.7%) | 0 (0.0%) |
| $50,000 to $99,999 | 37 (16.2%) | 4 (2.0%) |
| $100,000 to $299,999 | 150 (65.8%) | 172 (85.6%) |
| $300,000 to $499,999 | 12 (5.3%) | 12 (6.0%) |
| $500,000 to $749,999 | 0 (0.0%) | 13 (6.5%) |
| $750,000 to $999,999 | 0 (0.0%) | 0 (0.0%) |
| $1,000,000 or more | 0 (0.0%) | 0 (0.0%) |
| Total | 228 (100.0%) | 201 (100.0%) |
Household Income by Mortgage Status in Fort Benton
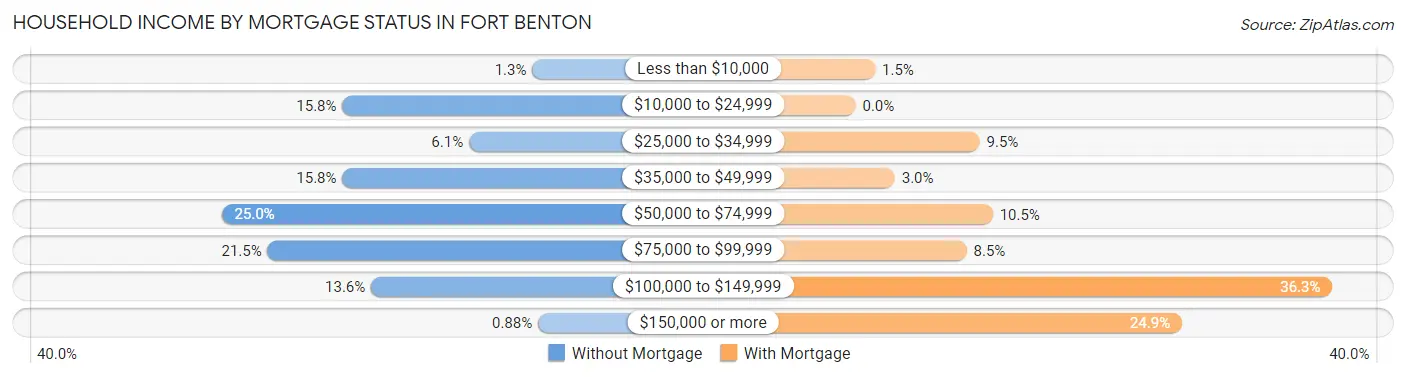
| Household Income | Without Mortgage | With Mortgage |
| Less than $10,000 | 3 (1.3%) | 3 (1.5%) |
| $10,000 to $24,999 | 36 (15.8%) | 0 (0.0%) |
| $25,000 to $34,999 | 14 (6.1%) | 19 (9.5%) |
| $35,000 to $49,999 | 36 (15.8%) | 6 (3.0%) |
| $50,000 to $74,999 | 57 (25.0%) | 21 (10.4%) |
| $75,000 to $99,999 | 49 (21.5%) | 17 (8.5%) |
| $100,000 to $149,999 | 31 (13.6%) | 73 (36.3%) |
| $150,000 or more | 2 (0.9%) | 50 (24.9%) |
| Total | 228 (100.0%) | 201 (100.0%) |
Property Value to Household Income Ratio in Fort Benton
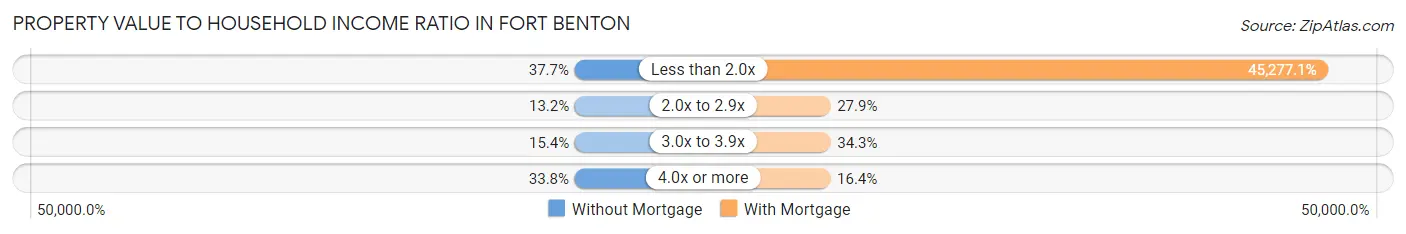
| Value-to-Income Ratio | Without Mortgage | With Mortgage |
| Less than 2.0x | 86 (37.7%) | 91,007 (45,277.1%) |
| 2.0x to 2.9x | 30 (13.2%) | 56 (27.9%) |
| 3.0x to 3.9x | 35 (15.3%) | 69 (34.3%) |
| 4.0x or more | 77 (33.8%) | 33 (16.4%) |
| Total | 228 (100.0%) | 201 (100.0%) |
Real Estate Taxes by Mortgage Status in Fort Benton
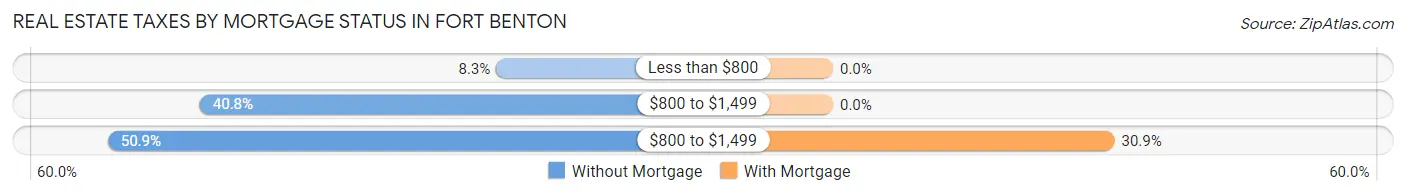
| Property Taxes | Without Mortgage | With Mortgage |
| Less than $800 | 19 (8.3%) | 0 (0.0%) |
| $800 to $1,499 | 93 (40.8%) | 0 (0.0%) |
| $800 to $1,499 | 116 (50.9%) | 62 (30.8%) |
| Total | 228 (100.0%) | 201 (100.0%) |
Health & Disability in Fort Benton
Health Insurance Coverage by Age in Fort Benton
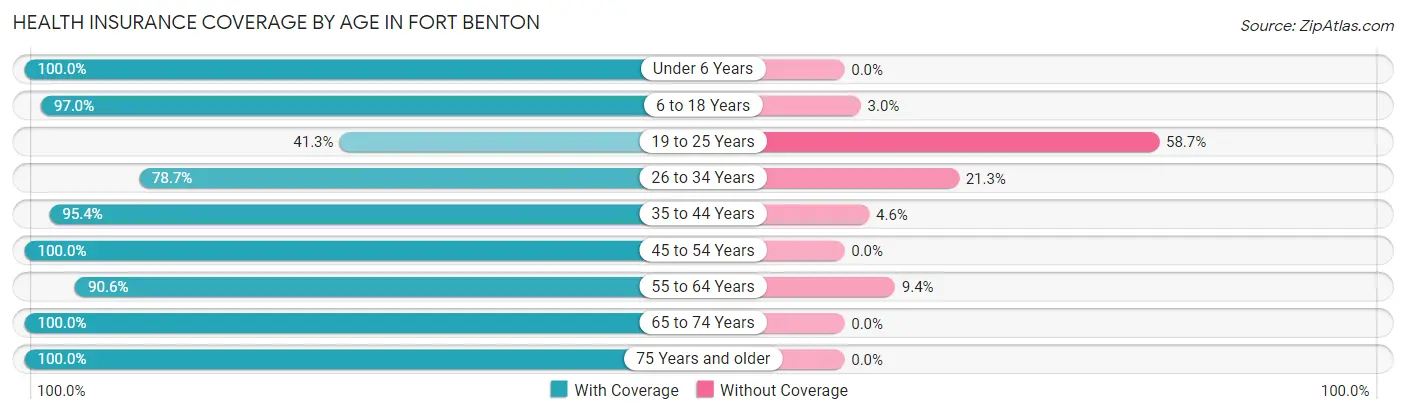
| Age Bracket | With Coverage | Without Coverage |
| Under 6 Years | 190 (100.0%) | 0 (0.0%) |
| 6 to 18 Years | 255 (97.0%) | 8 (3.0%) |
| 19 to 25 Years | 38 (41.3%) | 54 (58.7%) |
| 26 to 34 Years | 118 (78.7%) | 32 (21.3%) |
| 35 to 44 Years | 206 (95.4%) | 10 (4.6%) |
| 45 to 54 Years | 123 (100.0%) | 0 (0.0%) |
| 55 to 64 Years | 96 (90.6%) | 10 (9.4%) |
| 65 to 74 Years | 175 (100.0%) | 0 (0.0%) |
| 75 Years and older | 170 (100.0%) | 0 (0.0%) |
| Total | 1,371 (92.3%) | 114 (7.7%) |
Health Insurance Coverage by Citizenship Status in Fort Benton
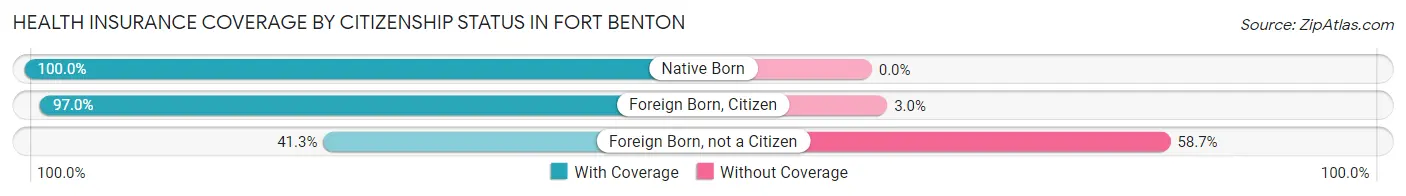
| Citizenship Status | With Coverage | Without Coverage |
| Native Born | 190 (100.0%) | 0 (0.0%) |
| Foreign Born, Citizen | 255 (97.0%) | 8 (3.0%) |
| Foreign Born, not a Citizen | 38 (41.3%) | 54 (58.7%) |
Health Insurance Coverage by Household Income in Fort Benton
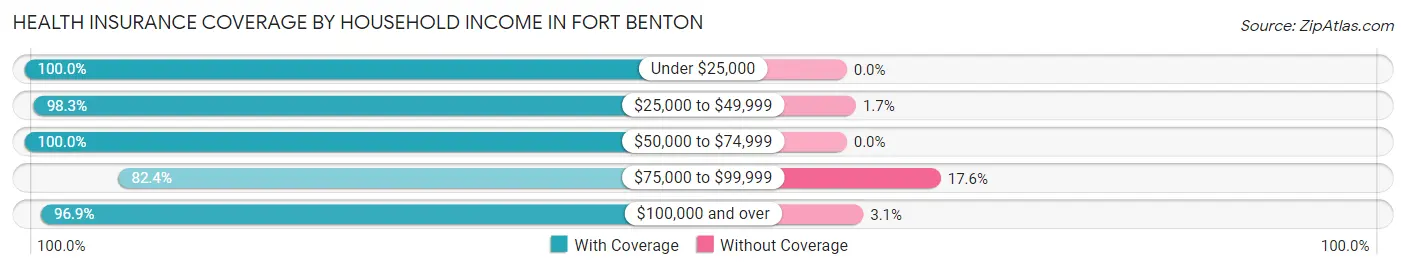
| Household Income | With Coverage | Without Coverage |
| Under $25,000 | 121 (100.0%) | 0 (0.0%) |
| $25,000 to $49,999 | 228 (98.3%) | 4 (1.7%) |
| $50,000 to $74,999 | 240 (100.0%) | 0 (0.0%) |
| $75,000 to $99,999 | 468 (82.4%) | 100 (17.6%) |
| $100,000 and over | 314 (96.9%) | 10 (3.1%) |
Public vs Private Health Insurance Coverage by Age in Fort Benton
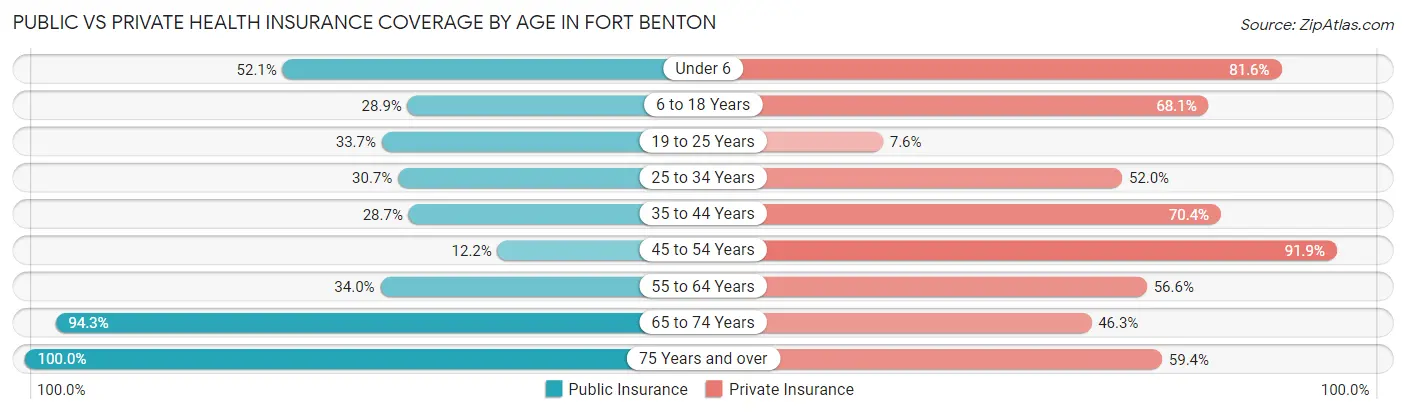
| Age Bracket | Public Insurance | Private Insurance |
| Under 6 | 99 (52.1%) | 155 (81.6%) |
| 6 to 18 Years | 76 (28.9%) | 179 (68.1%) |
| 19 to 25 Years | 31 (33.7%) | 7 (7.6%) |
| 25 to 34 Years | 46 (30.7%) | 78 (52.0%) |
| 35 to 44 Years | 62 (28.7%) | 152 (70.4%) |
| 45 to 54 Years | 15 (12.2%) | 113 (91.9%) |
| 55 to 64 Years | 36 (34.0%) | 60 (56.6%) |
| 65 to 74 Years | 165 (94.3%) | 81 (46.3%) |
| 75 Years and over | 170 (100.0%) | 101 (59.4%) |
| Total | 700 (47.1%) | 926 (62.4%) |
Disability Status by Sex by Age in Fort Benton
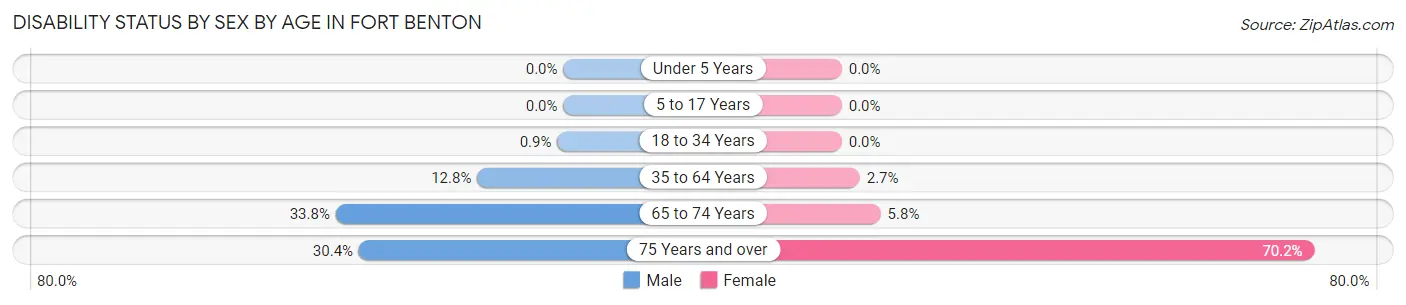
| Age Bracket | Male | Female |
| Under 5 Years | 0 (0.0%) | 0 (0.0%) |
| 5 to 17 Years | 0 (0.0%) | 0 (0.0%) |
| 18 to 34 Years | 1 (0.9%) | 0 (0.0%) |
| 35 to 64 Years | 33 (12.8%) | 5 (2.7%) |
| 65 to 74 Years | 24 (33.8%) | 6 (5.8%) |
| 75 Years and over | 17 (30.4%) | 80 (70.2%) |
Disability Class by Sex by Age in Fort Benton
Disability Class: Hearing Difficulty
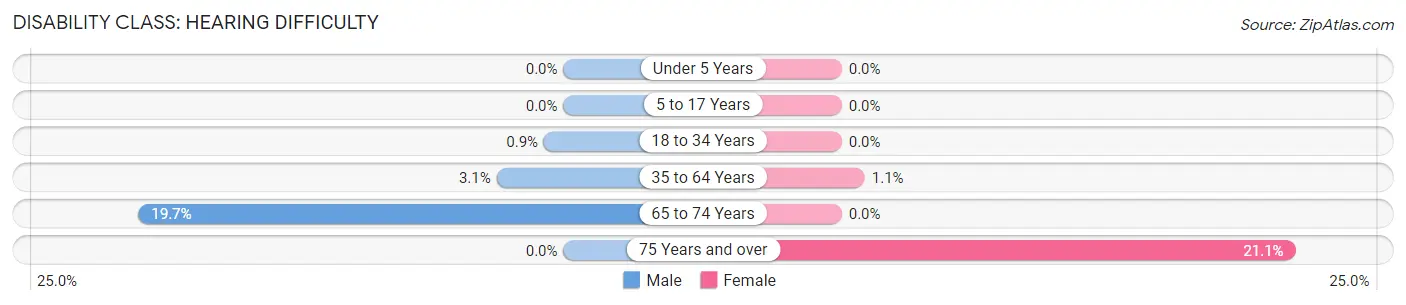
| Age Bracket | Male | Female |
| Under 5 Years | 0 (0.0%) | 0 (0.0%) |
| 5 to 17 Years | 0 (0.0%) | 0 (0.0%) |
| 18 to 34 Years | 1 (0.9%) | 0 (0.0%) |
| 35 to 64 Years | 8 (3.1%) | 2 (1.1%) |
| 65 to 74 Years | 14 (19.7%) | 0 (0.0%) |
| 75 Years and over | 0 (0.0%) | 24 (21.0%) |
Disability Class: Vision Difficulty
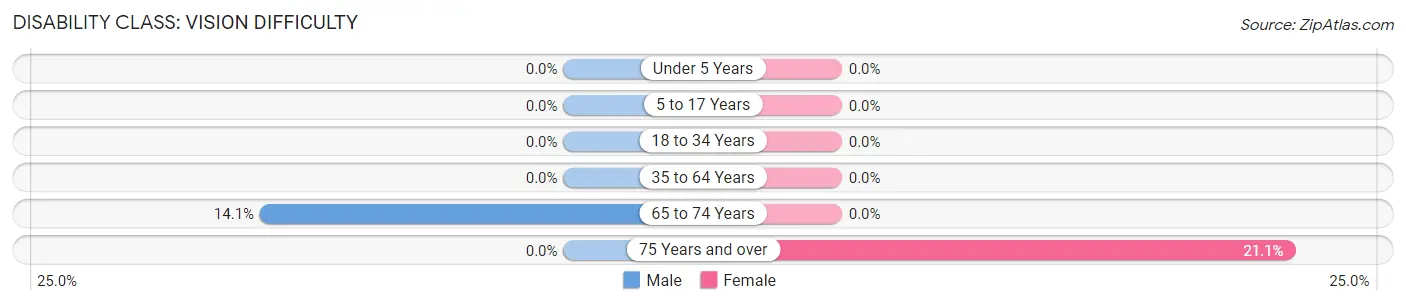
| Age Bracket | Male | Female |
| Under 5 Years | 0 (0.0%) | 0 (0.0%) |
| 5 to 17 Years | 0 (0.0%) | 0 (0.0%) |
| 18 to 34 Years | 0 (0.0%) | 0 (0.0%) |
| 35 to 64 Years | 0 (0.0%) | 0 (0.0%) |
| 65 to 74 Years | 10 (14.1%) | 0 (0.0%) |
| 75 Years and over | 0 (0.0%) | 24 (21.0%) |
Disability Class: Cognitive Difficulty
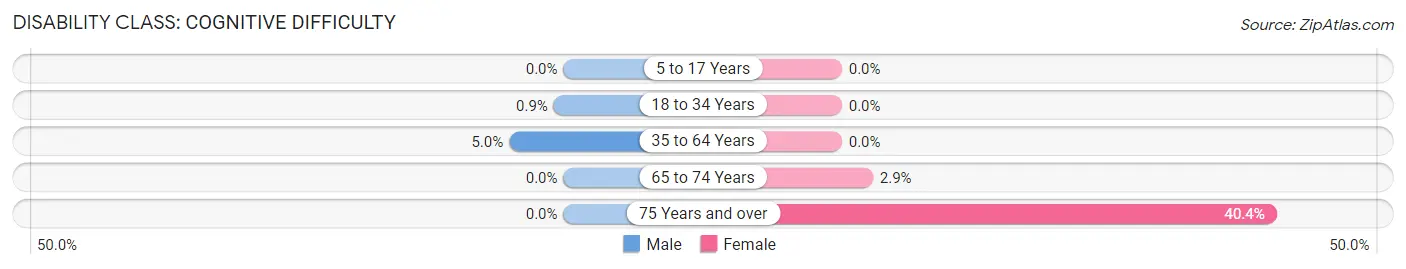
| Age Bracket | Male | Female |
| 5 to 17 Years | 0 (0.0%) | 0 (0.0%) |
| 18 to 34 Years | 1 (0.9%) | 0 (0.0%) |
| 35 to 64 Years | 13 (5.0%) | 0 (0.0%) |
| 65 to 74 Years | 0 (0.0%) | 3 (2.9%) |
| 75 Years and over | 0 (0.0%) | 46 (40.4%) |
Disability Class: Ambulatory Difficulty
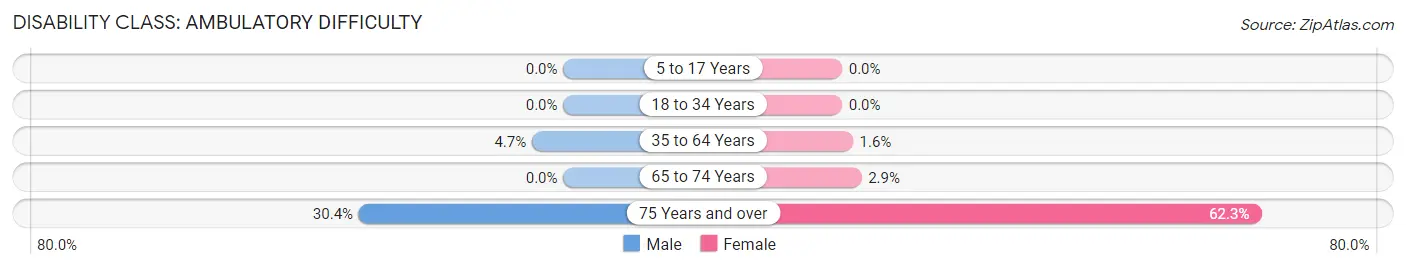
| Age Bracket | Male | Female |
| 5 to 17 Years | 0 (0.0%) | 0 (0.0%) |
| 18 to 34 Years | 0 (0.0%) | 0 (0.0%) |
| 35 to 64 Years | 12 (4.6%) | 3 (1.6%) |
| 65 to 74 Years | 0 (0.0%) | 3 (2.9%) |
| 75 Years and over | 17 (30.4%) | 71 (62.3%) |
Disability Class: Self-Care Difficulty
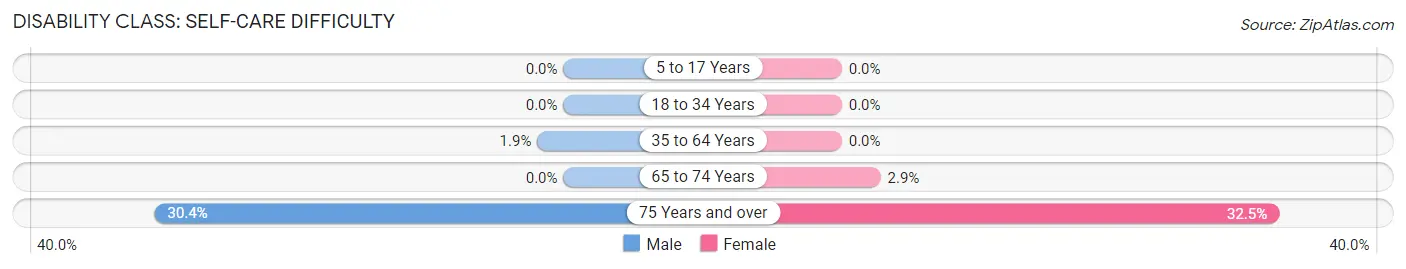
| Age Bracket | Male | Female |
| 5 to 17 Years | 0 (0.0%) | 0 (0.0%) |
| 18 to 34 Years | 0 (0.0%) | 0 (0.0%) |
| 35 to 64 Years | 5 (1.9%) | 0 (0.0%) |
| 65 to 74 Years | 0 (0.0%) | 3 (2.9%) |
| 75 Years and over | 17 (30.4%) | 37 (32.5%) |
Technology Access in Fort Benton
Computing Device Access in Fort Benton
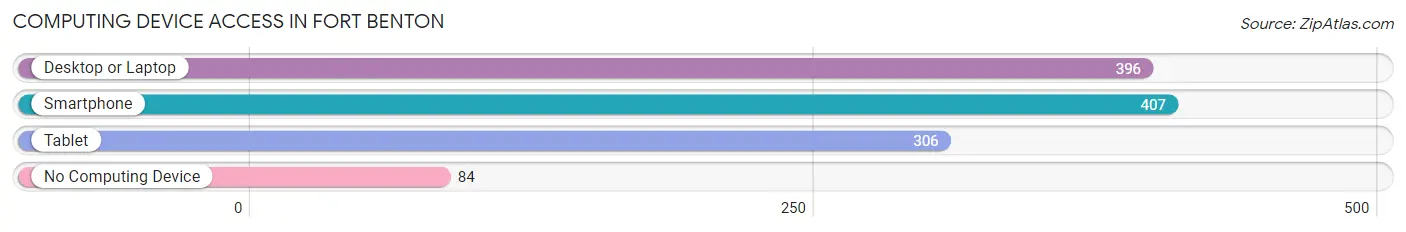
| Device Type | # Households | % Households |
| Desktop or Laptop | 396 | 72.3% |
| Smartphone | 407 | 74.3% |
| Tablet | 306 | 55.8% |
| No Computing Device | 84 | 15.3% |
| Total | 548 | 100.0% |
Internet Access in Fort Benton
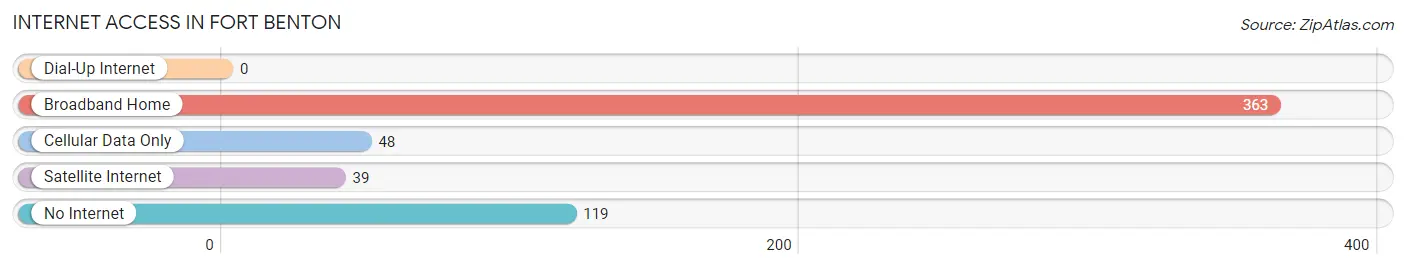
| Internet Type | # Households | % Households |
| Dial-Up Internet | 0 | 0.0% |
| Broadband Home | 363 | 66.2% |
| Cellular Data Only | 48 | 8.8% |
| Satellite Internet | 39 | 7.1% |
| No Internet | 119 | 21.7% |
| Total | 548 | 100.0% |
Fort Benton Summary
Fort Benton, Montana is a small town located in the north-central part of the state, along the Missouri River. It is the county seat of Chouteau County and is the oldest settlement in the state. The town was founded in 1846 by Alexander Culbertson, a fur trader for the American Fur Company. It was named after Thomas Hart Benton, a senator from Missouri.
Fort Benton is located in the Great Plains region of Montana, and is surrounded by rolling hills and prairies. The town is situated at an elevation of 2,890 feet above sea level. The climate is semi-arid, with hot summers and cold winters. The average annual precipitation is 13.5 inches.
The population of Fort Benton was 1,464 in the 2010 census. The median age of the population is 44.7 years, and the median household income is $37,917. The town is predominantly white, with a small Native American population.
The economy of Fort Benton is largely based on agriculture and tourism. The town is home to several grain elevators, and is a major center for wheat production. The town is also home to several tourist attractions, including the Fort Benton Historic District, the Missouri River Museum, and the Chouteau County Museum.
Fort Benton is served by two major highways, US Highway 87 and Montana Highway 80. The town is also served by the Great Falls International Airport, located about 50 miles away.
Fort Benton has a rich history, dating back to its founding in 1846. The town was an important trading post for the American Fur Company, and was the site of the first steamboat to travel up the Missouri River. The town was also the site of the first bridge to span the Missouri River, and the first public school in Montana.
The town has also been the site of several important events in Montana's history. In 1876, the town was the site of the Battle of the Little Big Horn, in which General George Custer and his troops were defeated by the Lakota and Cheyenne tribes. In 1877, the town was the site of the signing of the Treaty of Fort Benton, which ended the Blackfeet War.
Fort Benton is a small town with a rich history and a vibrant economy. The town is home to several tourist attractions, and is a major center for wheat production. The town is served by two major highways, and is located near the Great Falls International Airport. The population of the town is predominantly white, with a small Native American population. The median age of the population is 44.7 years, and the median household income is $37,917. Fort Benton is a great place to live, work, and visit.
Common Questions
What is Per Capita Income in Fort Benton?
Per Capita income in Fort Benton is $27,309.
What is the Median Family Income in Fort Benton?
Median Family Income in Fort Benton is $90,346.
What is the Median Household income in Fort Benton?
Median Household Income in Fort Benton is $67,656.
What is Income or Wage Gap in Fort Benton?
Income or Wage Gap in Fort Benton is 66.6%.
Women in Fort Benton earn 33.4 cents for every dollar earned by a man.
What is Inequality or Gini Index in Fort Benton?
Inequality or Gini Index in Fort Benton is 0.38.
What is the Total Population of Fort Benton?
Total Population of Fort Benton is 1,544.
What is the Total Male Population of Fort Benton?
Total Male Population of Fort Benton is 740.
What is the Total Female Population of Fort Benton?
Total Female Population of Fort Benton is 804.
What is the Ratio of Males per 100 Females in Fort Benton?
There are 92.04 Males per 100 Females in Fort Benton.
What is the Ratio of Females per 100 Males in Fort Benton?
There are 108.65 Females per 100 Males in Fort Benton.
What is the Median Population Age in Fort Benton?
Median Population Age in Fort Benton is 36.6 Years.
What is the Average Family Size in Fort Benton
Average Family Size in Fort Benton is 3.8 People.
What is the Average Household Size in Fort Benton
Average Household Size in Fort Benton is 2.7 People.
How Large is the Labor Force in Fort Benton?
There are 653 People in the Labor Forcein in Fort Benton.
What is the Percentage of People in the Labor Force in Fort Benton?
56.2% of People are in the Labor Force in Fort Benton.
What is the Unemployment Rate in Fort Benton?
Unemployment Rate in Fort Benton is 6.4%.