Terrebonne, OR Map & Demographics
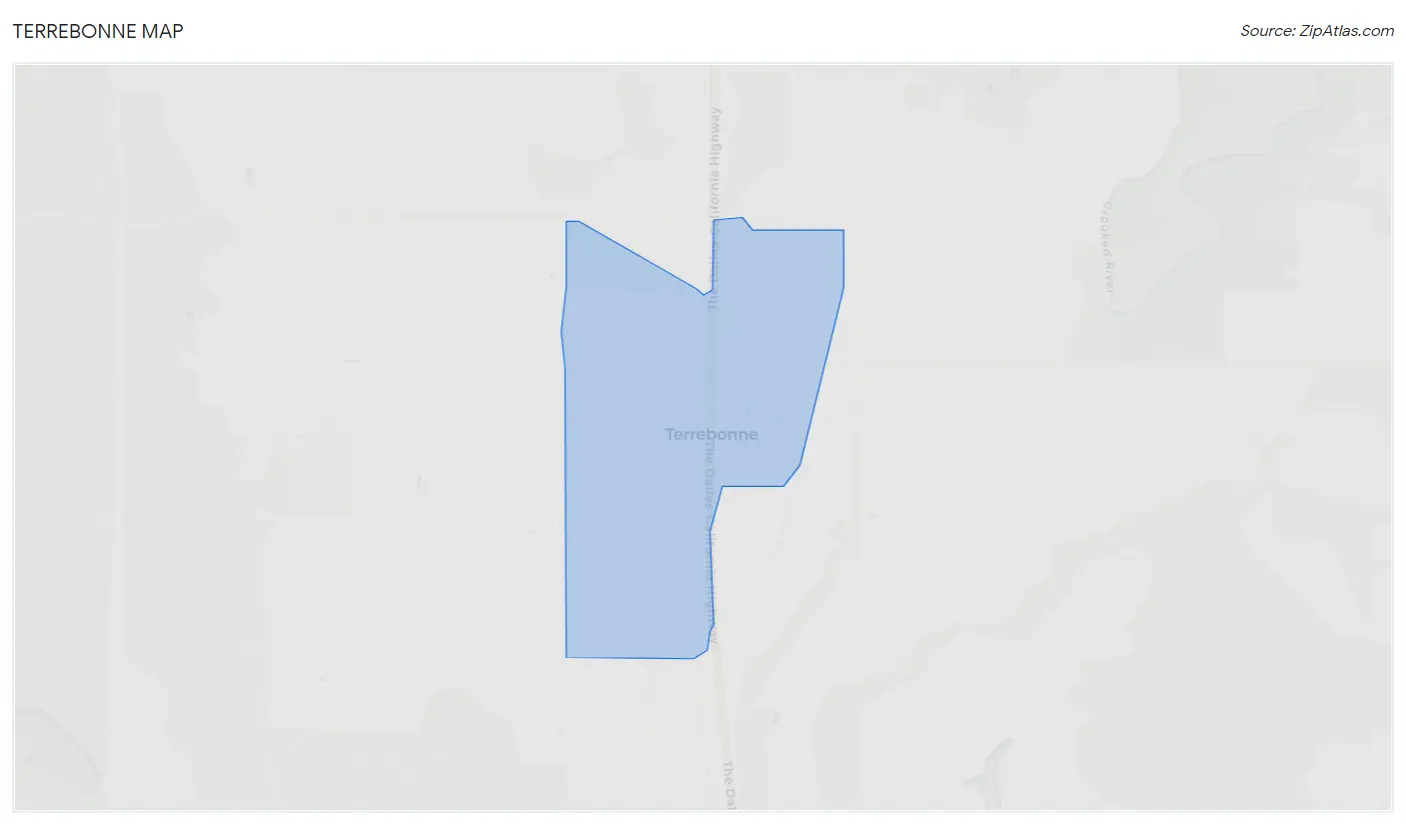
Terrebonne Map
Terrebonne Overview
$40,323
PER CAPITA INCOME
$123,690
AVG FAMILY INCOME
$70,526
AVG HOUSEHOLD INCOME
0.50
INEQUALITY / GINI INDEX
1,298
TOTAL POPULATION
539
MALE POPULATION
759
FEMALE POPULATION
71.01
MALES / 100 FEMALES
140.82
FEMALES / 100 MALES
38.7
MEDIAN AGE
3.5
AVG FAMILY SIZE
2.9
AVG HOUSEHOLD SIZE
727
LABOR FORCE [ PEOPLE ]
69.2%
PERCENT IN LABOR FORCE
26.3%
UNEMPLOYMENT RATE
Terrebonne Zip Codes
Income in Terrebonne
Income Overview in Terrebonne
Per Capita Income in Terrebonne is $40,323, while median incomes of families and households are $123,690 and $70,526 respectively.
| Characteristic | Number | Measure |
| Per Capita Income | 1,298 | $40,323 |
| Median Family Income | 326 | $123,690 |
| Mean Family Income | 326 | $138,690 |
| Median Household Income | 450 | $70,526 |
| Mean Household Income | 450 | $109,029 |
| Income Deficit | 326 | $0 |
| Wage / Income Gap (%) | 1,298 | 0.00% |
| Wage / Income Gap ($) | 1,298 | 100.00¢ per $1 |
| Gini / Inequality Index | 1,298 | 0.50 |
Earnings by Sex in Terrebonne
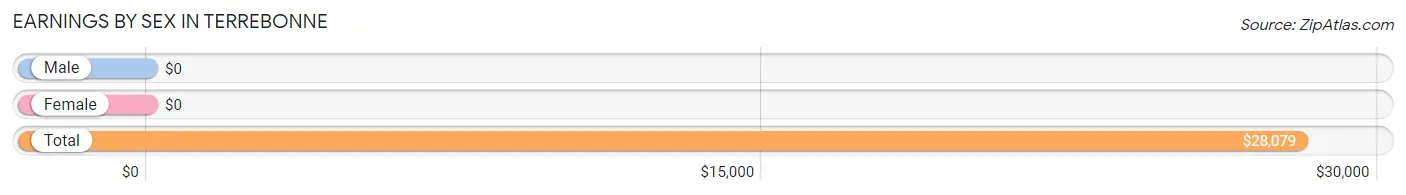
| Sex | Number | Average Earnings |
| Male | 421 (55.5%) | $0 |
| Female | 337 (44.5%) | $0 |
| Total | 758 (100.0%) | $28,079 |
Earnings by Sex by Income Bracket in Terrebonne
The most common earnings brackets in Terrebonne are $12,500 to $14,999 for men (113 | 26.8%) and $5,000 to $7,499 for women (79 | 23.4%).
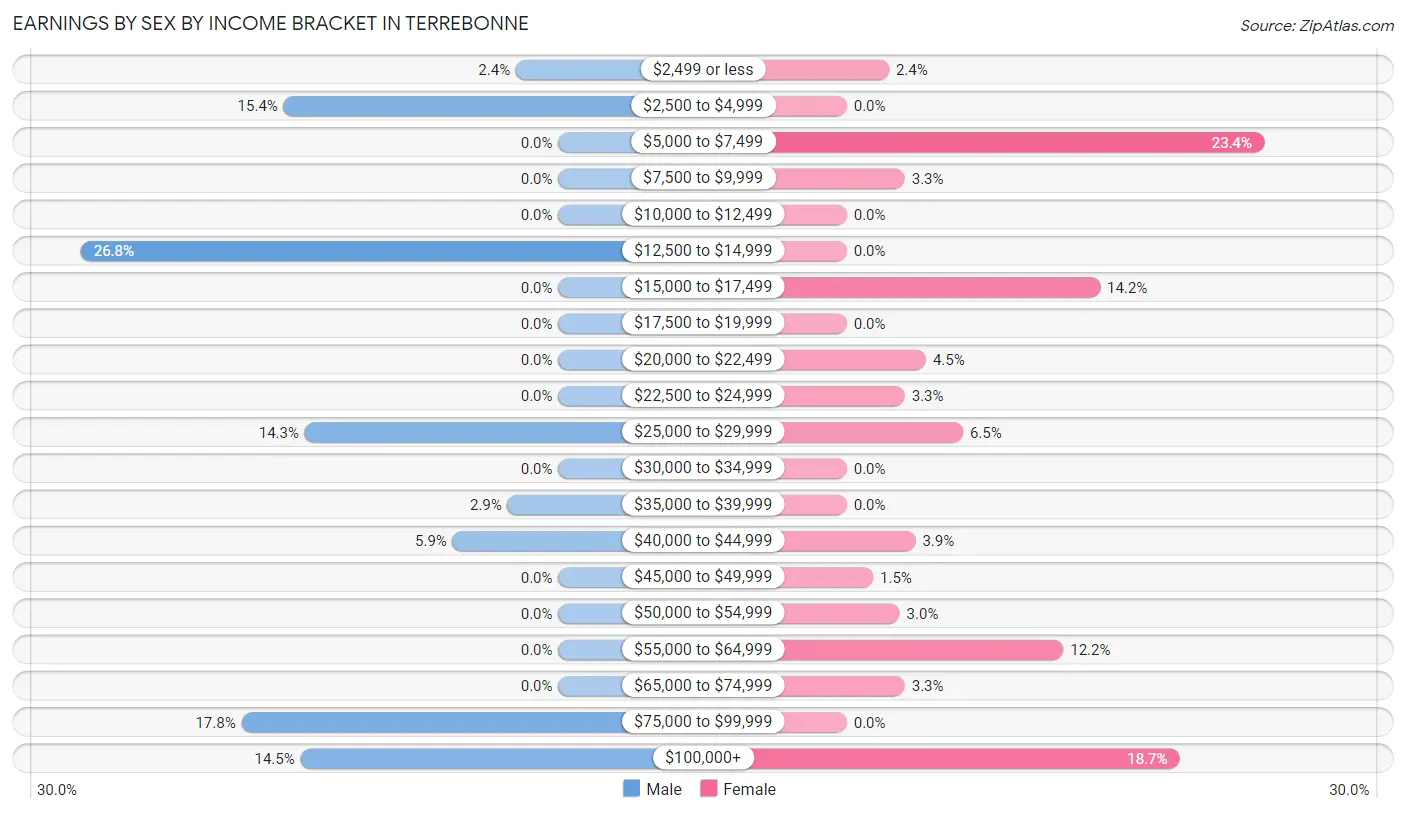
| Income | Male | Female |
| $2,499 or less | 10 (2.4%) | 8 (2.4%) |
| $2,500 to $4,999 | 65 (15.4%) | 0 (0.0%) |
| $5,000 to $7,499 | 0 (0.0%) | 79 (23.4%) |
| $7,500 to $9,999 | 0 (0.0%) | 11 (3.3%) |
| $10,000 to $12,499 | 0 (0.0%) | 0 (0.0%) |
| $12,500 to $14,999 | 113 (26.8%) | 0 (0.0%) |
| $15,000 to $17,499 | 0 (0.0%) | 48 (14.2%) |
| $17,500 to $19,999 | 0 (0.0%) | 0 (0.0%) |
| $20,000 to $22,499 | 0 (0.0%) | 15 (4.4%) |
| $22,500 to $24,999 | 0 (0.0%) | 11 (3.3%) |
| $25,000 to $29,999 | 60 (14.2%) | 22 (6.5%) |
| $30,000 to $34,999 | 0 (0.0%) | 0 (0.0%) |
| $35,000 to $39,999 | 12 (2.9%) | 0 (0.0%) |
| $40,000 to $44,999 | 25 (5.9%) | 13 (3.9%) |
| $45,000 to $49,999 | 0 (0.0%) | 5 (1.5%) |
| $50,000 to $54,999 | 0 (0.0%) | 10 (3.0%) |
| $55,000 to $64,999 | 0 (0.0%) | 41 (12.2%) |
| $65,000 to $74,999 | 0 (0.0%) | 11 (3.3%) |
| $75,000 to $99,999 | 75 (17.8%) | 0 (0.0%) |
| $100,000+ | 61 (14.5%) | 63 (18.7%) |
| Total | 421 (100.0%) | 337 (100.0%) |
Earnings by Sex by Educational Attainment in Terrebonne
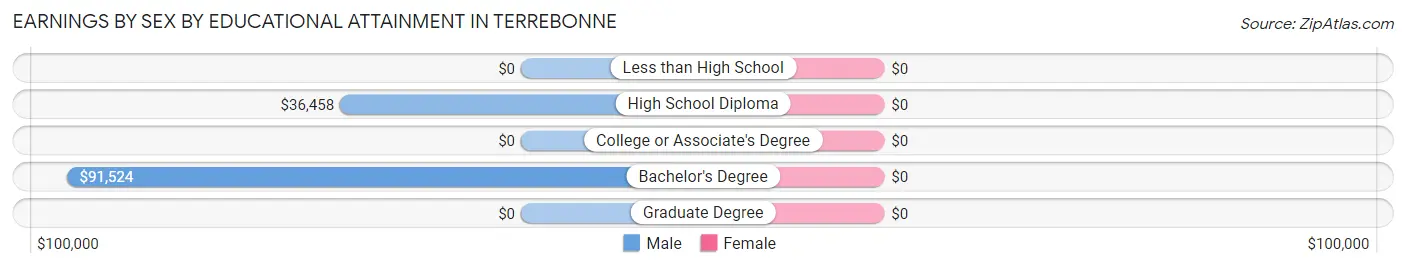
| Educational Attainment | Male Income | Female Income |
| Less than High School | - | - |
| High School Diploma | $36,458 | $0 |
| College or Associate's Degree | - | - |
| Bachelor's Degree | $91,524 | $0 |
| Graduate Degree | - | - |
| Total | - | - |
Family Income in Terrebonne
Family Income Brackets in Terrebonne
According to the Terrebonne family income data, there are 104 families falling into the $200,000+ income range, which is the most common income bracket and makes up 31.9% of all families.
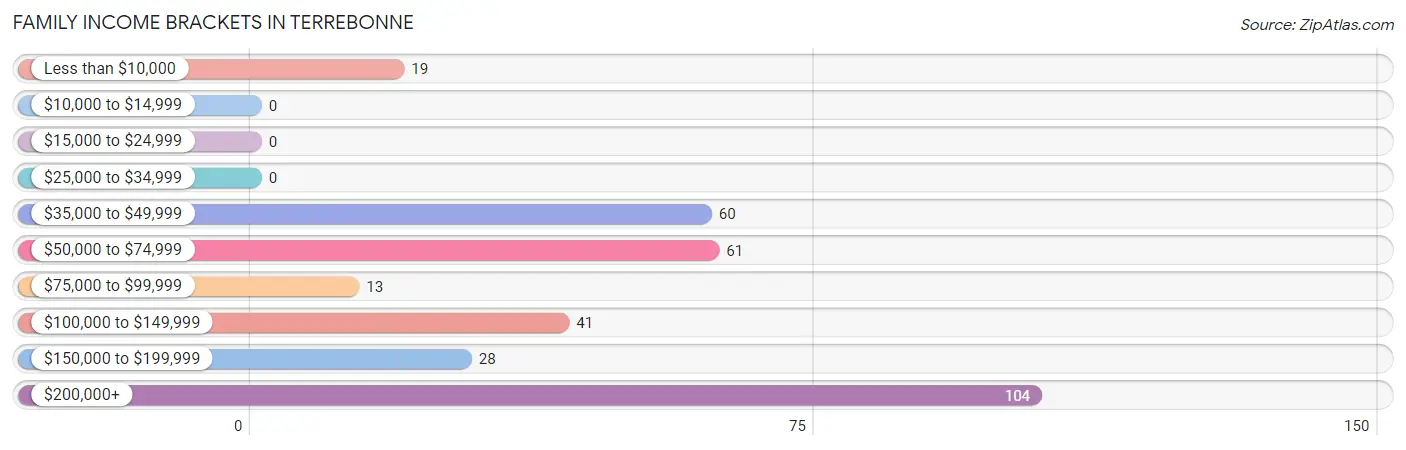
| Income Bracket | # Families | % Families |
| Less than $10,000 | 19 | 5.8% |
| $10,000 to $14,999 | 0 | 0.0% |
| $15,000 to $24,999 | 0 | 0.0% |
| $25,000 to $34,999 | 0 | 0.0% |
| $35,000 to $49,999 | 60 | 18.4% |
| $50,000 to $74,999 | 61 | 18.7% |
| $75,000 to $99,999 | 13 | 4.0% |
| $100,000 to $149,999 | 41 | 12.6% |
| $150,000 to $199,999 | 28 | 8.6% |
| $200,000+ | 104 | 31.9% |
Family Income by Famaliy Size in Terrebonne
2-person families (220 | 67.5%) account for the highest median family income in Terrebonne with $123,000 per family, while 2-person families (220 | 67.5%) have the highest median income of $61,500 per family member.
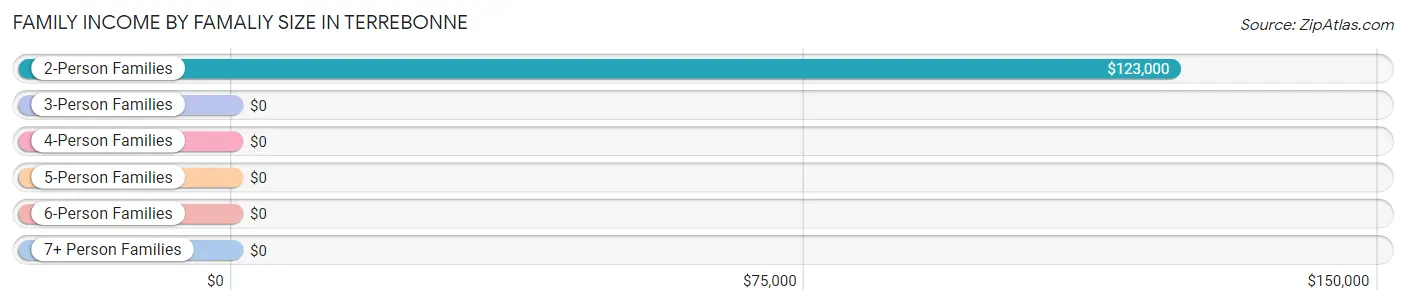
| Income Bracket | # Families | Median Income |
| 2-Person Families | 220 (67.5%) | $123,000 |
| 3-Person Families | 30 (9.2%) | $0 |
| 4-Person Families | 44 (13.5%) | $0 |
| 5-Person Families | 6 (1.8%) | $0 |
| 6-Person Families | 26 (8.0%) | $0 |
| 7+ Person Families | 0 (0.0%) | $0 |
| Total | 326 (100.0%) | $123,690 |
Family Income by Number of Earners in Terrebonne
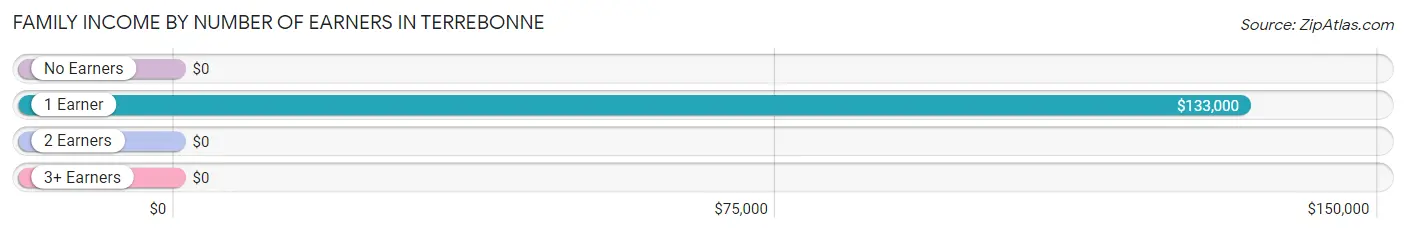
| Number of Earners | # Families | Median Income |
| No Earners | 16 (4.9%) | $0 |
| 1 Earner | 92 (28.2%) | $133,000 |
| 2 Earners | 212 (65.0%) | $0 |
| 3+ Earners | 6 (1.8%) | $0 |
| Total | 326 (100.0%) | $123,690 |
Household Income in Terrebonne
Household Income Brackets in Terrebonne
With 104 households falling in the category, the $200,000+ income range is the most frequent in Terrebonne, accounting for 23.1% of all households. In contrast, only 15 households (3.3%) fall into the $25,000 to $34,999 income bracket, making it the least populous group.
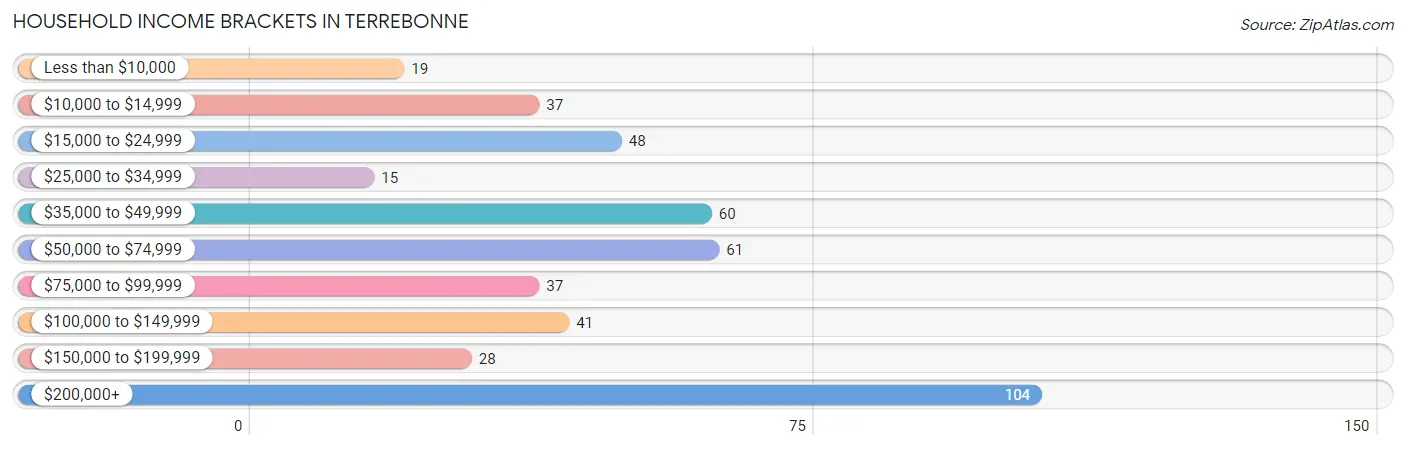
| Income Bracket | # Households | % Households |
| Less than $10,000 | 19 | 4.2% |
| $10,000 to $14,999 | 37 | 8.2% |
| $15,000 to $24,999 | 48 | 10.7% |
| $25,000 to $34,999 | 15 | 3.3% |
| $35,000 to $49,999 | 60 | 13.3% |
| $50,000 to $74,999 | 61 | 13.6% |
| $75,000 to $99,999 | 37 | 8.2% |
| $100,000 to $149,999 | 41 | 9.1% |
| $150,000 to $199,999 | 28 | 6.2% |
| $200,000+ | 104 | 23.1% |
Household Income by Householder Age in Terrebonne
The median household income in Terrebonne is $70,526, with the highest median household income of $59,279 found in the 65+ years age bracket for the primary householder. A total of 153 households (34.0%) fall into this category. Meanwhile, the 15 to 24 years age bracket for the primary householder has the lowest median household income of $0, with 11 households (2.4%) in this group.
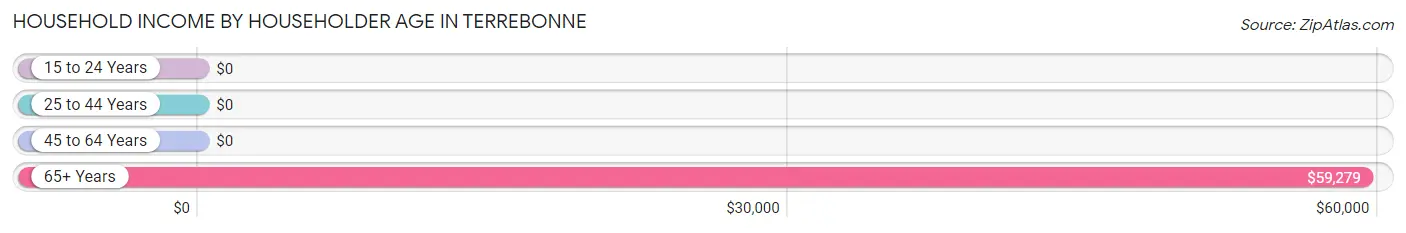
| Income Bracket | # Households | Median Income |
| 15 to 24 Years | 11 (2.4%) | $0 |
| 25 to 44 Years | 51 (11.3%) | $0 |
| 45 to 64 Years | 235 (52.2%) | $0 |
| 65+ Years | 153 (34.0%) | $59,279 |
| Total | 450 (100.0%) | $70,526 |
Poverty in Terrebonne
Income Below Poverty by Sex and Age in Terrebonne
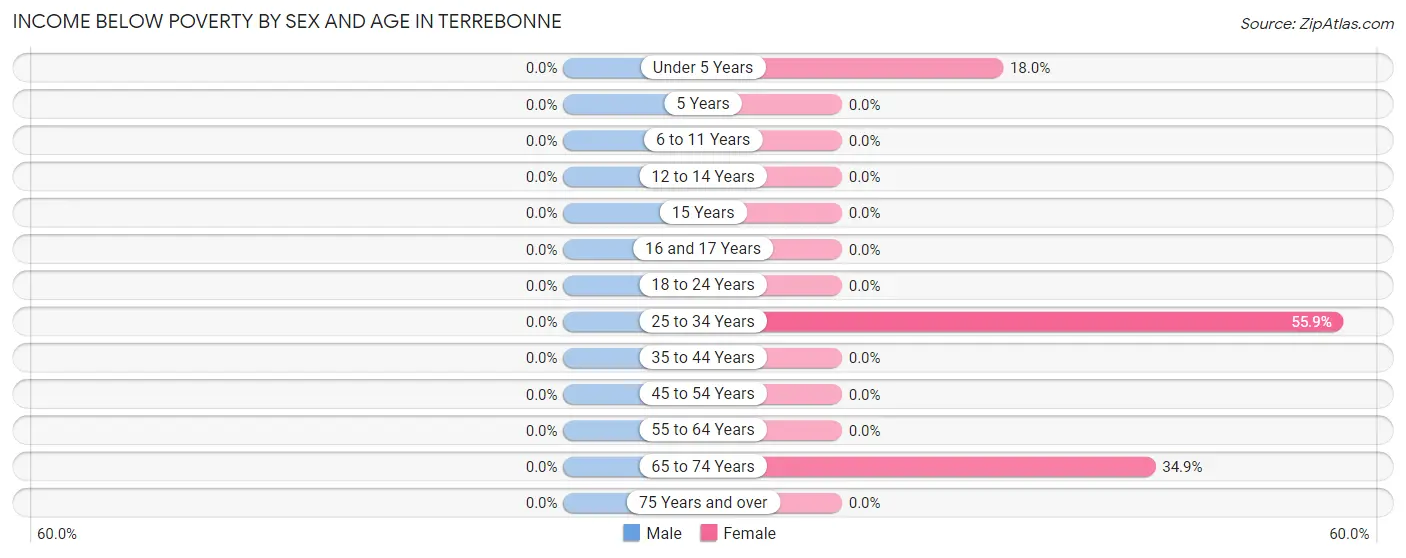
| Age Bracket | Male | Female |
| Under 5 Years | 0 (0.0%) | 21 (17.9%) |
| 5 Years | 0 (0.0%) | 0 (0.0%) |
| 6 to 11 Years | 0 (0.0%) | 0 (0.0%) |
| 12 to 14 Years | 0 (0.0%) | 0 (0.0%) |
| 15 Years | 0 (0.0%) | 0 (0.0%) |
| 16 and 17 Years | 0 (0.0%) | 0 (0.0%) |
| 18 to 24 Years | 0 (0.0%) | 0 (0.0%) |
| 25 to 34 Years | 0 (0.0%) | 19 (55.9%) |
| 35 to 44 Years | 0 (0.0%) | 0 (0.0%) |
| 45 to 54 Years | 0 (0.0%) | 0 (0.0%) |
| 55 to 64 Years | 0 (0.0%) | 0 (0.0%) |
| 65 to 74 Years | 0 (0.0%) | 37 (34.9%) |
| 75 Years and over | 0 (0.0%) | 0 (0.0%) |
| Total | 0 (0.0%) | 77 (10.3%) |
Income Above Poverty by Sex and Age in Terrebonne
According to the poverty statistics in Terrebonne, males aged under 5 years and females aged 6 to 11 years are the age groups that are most secure financially, with 100.0% of males and 100.0% of females in these age groups living above the poverty line.
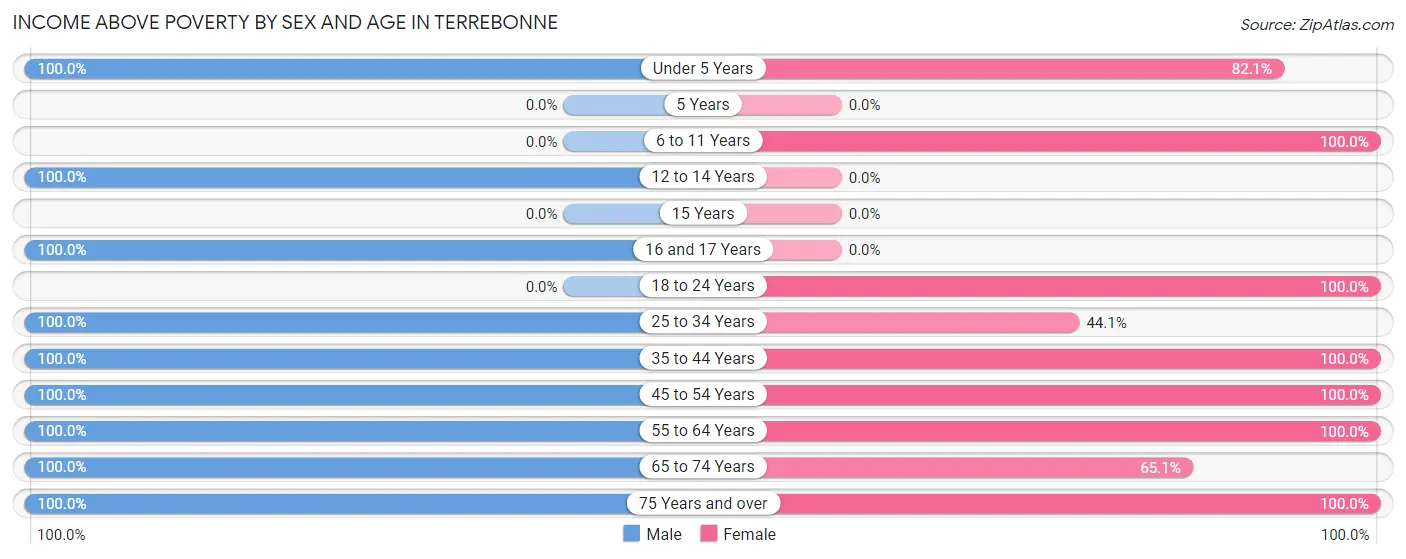
| Age Bracket | Male | Female |
| Under 5 Years | 20 (100.0%) | 96 (82.1%) |
| 5 Years | 0 (0.0%) | 0 (0.0%) |
| 6 to 11 Years | 0 (0.0%) | 68 (100.0%) |
| 12 to 14 Years | 33 (100.0%) | 0 (0.0%) |
| 15 Years | 0 (0.0%) | 0 (0.0%) |
| 16 and 17 Years | 65 (100.0%) | 0 (0.0%) |
| 18 to 24 Years | 0 (0.0%) | 92 (100.0%) |
| 25 to 34 Years | 51 (100.0%) | 15 (44.1%) |
| 35 to 44 Years | 182 (100.0%) | 13 (100.0%) |
| 45 to 54 Years | 50 (100.0%) | 93 (100.0%) |
| 55 to 64 Years | 63 (100.0%) | 192 (100.0%) |
| 65 to 74 Years | 47 (100.0%) | 69 (65.1%) |
| 75 Years and over | 28 (100.0%) | 34 (100.0%) |
| Total | 539 (100.0%) | 672 (89.7%) |
Income Below Poverty Among Married-Couple Families in Terrebonne
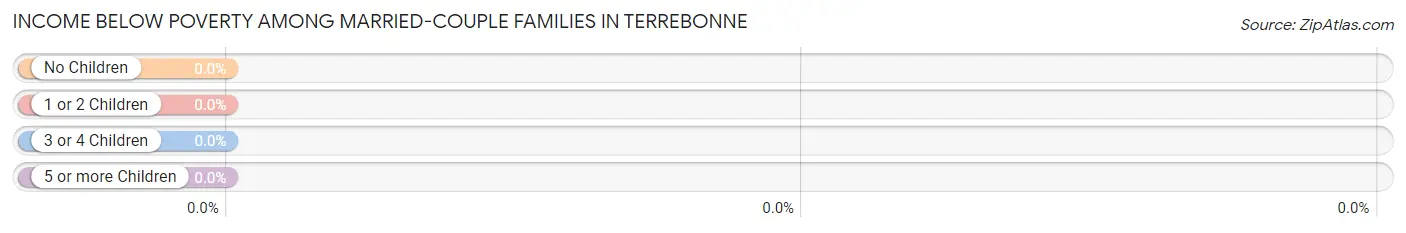
| Children | Above Poverty | Below Poverty |
| No Children | 207 (100.0%) | 0 (0.0%) |
| 1 or 2 Children | 74 (100.0%) | 0 (0.0%) |
| 3 or 4 Children | 0 (0.0%) | 0 (0.0%) |
| 5 or more Children | 0 (0.0%) | 0 (0.0%) |
| Total | 281 (100.0%) | 0 (0.0%) |
Income Below Poverty Among Single-Parent Households in Terrebonne
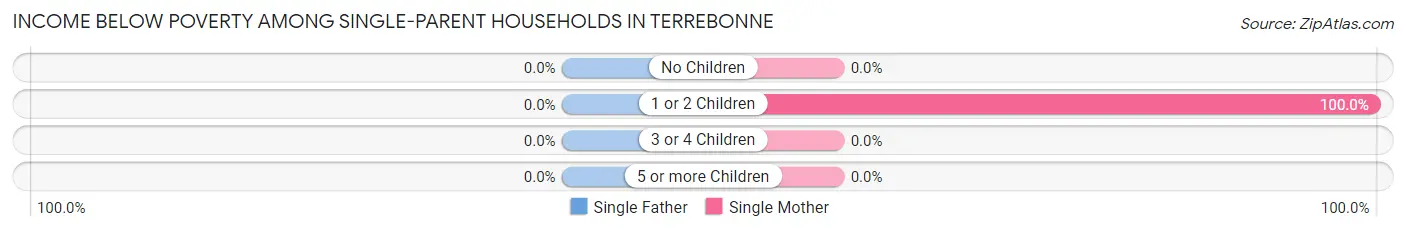
| Children | Single Father | Single Mother |
| No Children | 0 (0.0%) | 0 (0.0%) |
| 1 or 2 Children | 0 (0.0%) | 19 (100.0%) |
| 3 or 4 Children | 0 (0.0%) | 0 (0.0%) |
| 5 or more Children | 0 (0.0%) | 0 (0.0%) |
| Total | 0 (0.0%) | 19 (42.2%) |
Income Below Poverty Among Married-Couple vs Single-Parent Households in Terrebonne
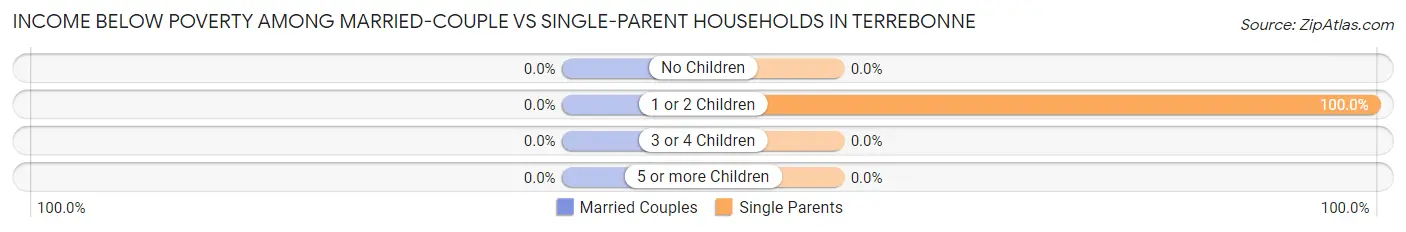
| Children | Married-Couple Families | Single-Parent Households |
| No Children | 0 (0.0%) | 0 (0.0%) |
| 1 or 2 Children | 0 (0.0%) | 19 (100.0%) |
| 3 or 4 Children | 0 (0.0%) | 0 (0.0%) |
| 5 or more Children | 0 (0.0%) | 0 (0.0%) |
| Total | 0 (0.0%) | 19 (42.2%) |
Race in Terrebonne
The most populous races in Terrebonne are White / Caucasian (878 | 67.6%), Hispanic or Latino (410 | 31.6%), and Some other Race (398 | 30.7%).
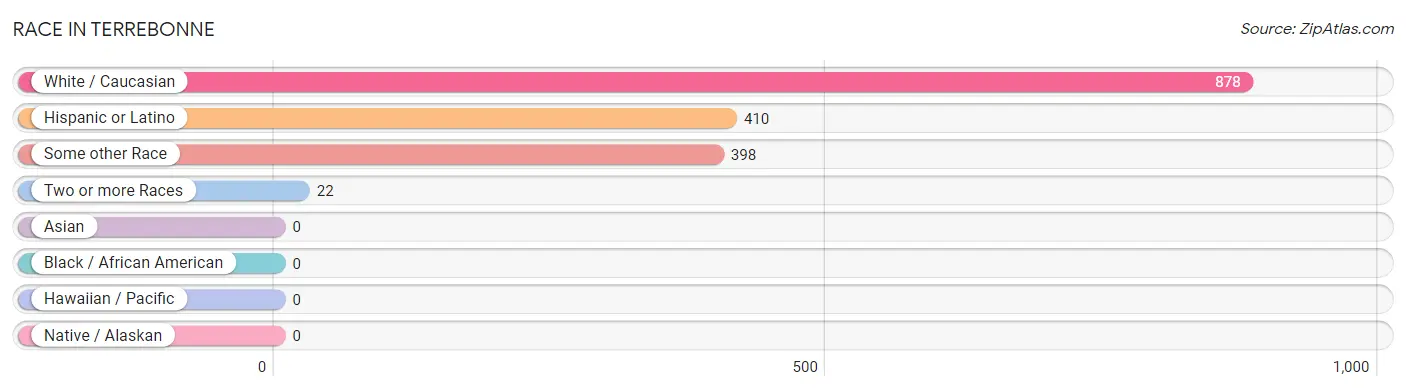
| Race | # Population | % Population |
| Asian | 0 | 0.0% |
| Black / African American | 0 | 0.0% |
| Hawaiian / Pacific | 0 | 0.0% |
| Hispanic or Latino | 410 | 31.6% |
| Native / Alaskan | 0 | 0.0% |
| White / Caucasian | 878 | 67.6% |
| Two or more Races | 22 | 1.7% |
| Some other Race | 398 | 30.7% |
| Total | 1,298 | 100.0% |
Ancestry in Terrebonne
The most populous ancestries reported in Terrebonne are American (270 | 20.8%), Italian (186 | 14.3%), English (152 | 11.7%), Mexican (151 | 11.6%), and German (113 | 8.7%), together accounting for 67.2% of all Terrebonne residents.
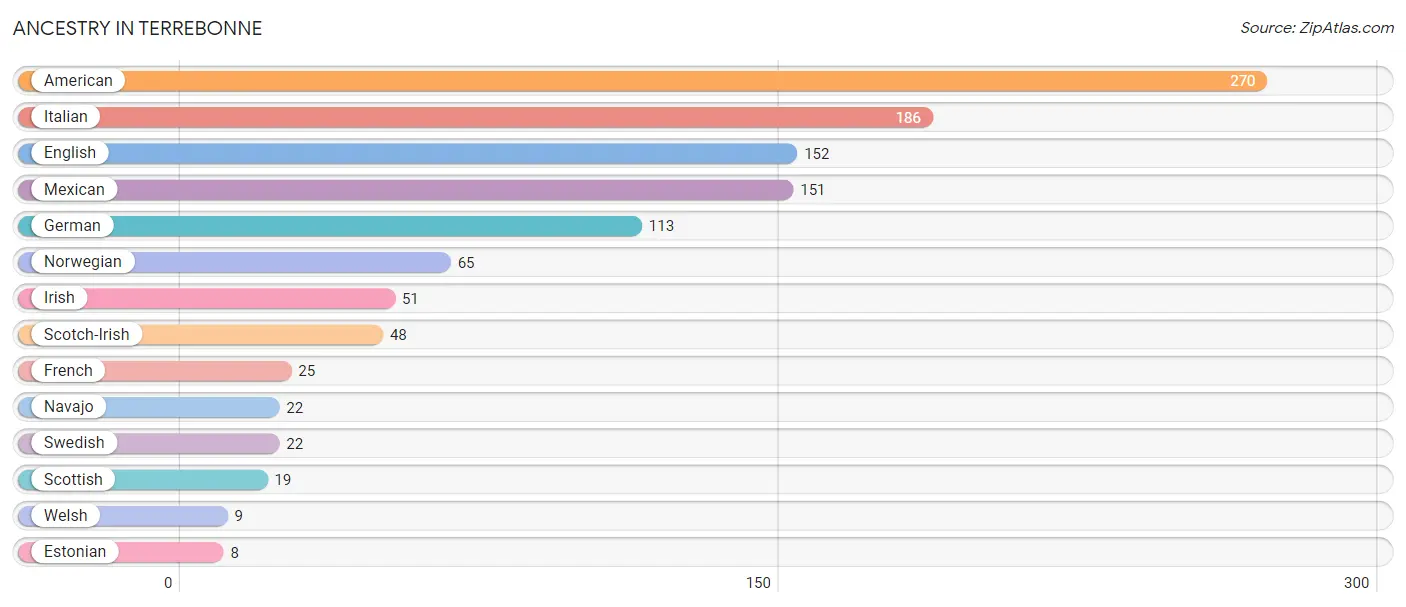
| Ancestry | # Population | % Population |
| American | 270 | 20.8% |
| English | 152 | 11.7% |
| Estonian | 8 | 0.6% |
| French | 25 | 1.9% |
| German | 113 | 8.7% |
| Irish | 51 | 3.9% |
| Italian | 186 | 14.3% |
| Mexican | 151 | 11.6% |
| Navajo | 22 | 1.7% |
| Norwegian | 65 | 5.0% |
| Scotch-Irish | 48 | 3.7% |
| Scottish | 19 | 1.5% |
| Swedish | 22 | 1.7% |
| Welsh | 9 | 0.7% | View All 14 Rows |
Immigrants in Terrebonne
The most numerous immigrant groups reported in Terrebonne came from Central America (139 | 10.7%), Latin America (139 | 10.7%), Mexico (139 | 10.7%), and Canada (22 | 1.7%), together accounting for 33.8% of all Terrebonne residents.
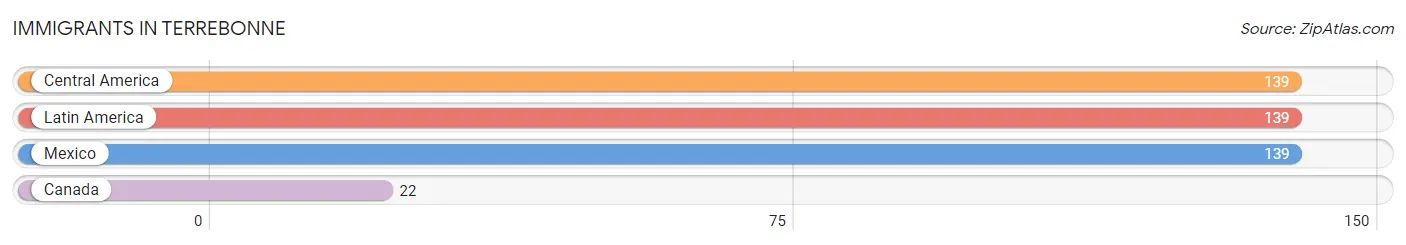
| Immigration Origin | # Population | % Population |
| Canada | 22 | 1.7% |
| Central America | 139 | 10.7% |
| Latin America | 139 | 10.7% |
| Mexico | 139 | 10.7% | View All 4 Rows |
Sex and Age in Terrebonne
Sex and Age in Terrebonne
The most populous age groups in Terrebonne are 35 to 39 Years (182 | 33.8%) for men and 55 to 59 Years (149 | 19.6%) for women.
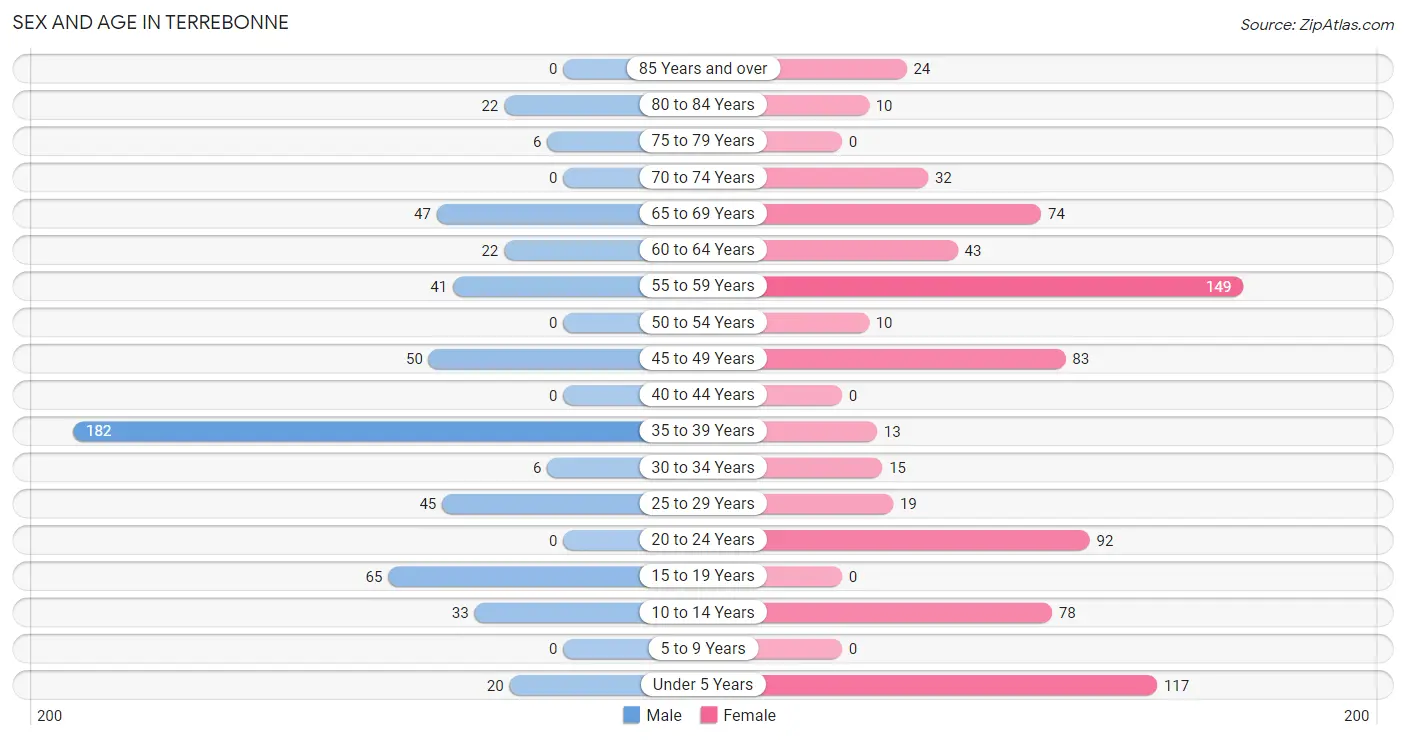
| Age Bracket | Male | Female |
| Under 5 Years | 20 (3.7%) | 117 (15.4%) |
| 5 to 9 Years | 0 (0.0%) | 0 (0.0%) |
| 10 to 14 Years | 33 (6.1%) | 78 (10.3%) |
| 15 to 19 Years | 65 (12.1%) | 0 (0.0%) |
| 20 to 24 Years | 0 (0.0%) | 92 (12.1%) |
| 25 to 29 Years | 45 (8.4%) | 19 (2.5%) |
| 30 to 34 Years | 6 (1.1%) | 15 (2.0%) |
| 35 to 39 Years | 182 (33.8%) | 13 (1.7%) |
| 40 to 44 Years | 0 (0.0%) | 0 (0.0%) |
| 45 to 49 Years | 50 (9.3%) | 83 (10.9%) |
| 50 to 54 Years | 0 (0.0%) | 10 (1.3%) |
| 55 to 59 Years | 41 (7.6%) | 149 (19.6%) |
| 60 to 64 Years | 22 (4.1%) | 43 (5.7%) |
| 65 to 69 Years | 47 (8.7%) | 74 (9.8%) |
| 70 to 74 Years | 0 (0.0%) | 32 (4.2%) |
| 75 to 79 Years | 6 (1.1%) | 0 (0.0%) |
| 80 to 84 Years | 22 (4.1%) | 10 (1.3%) |
| 85 Years and over | 0 (0.0%) | 24 (3.2%) |
| Total | 539 (100.0%) | 759 (100.0%) |
Families and Households in Terrebonne
Median Family Size in Terrebonne
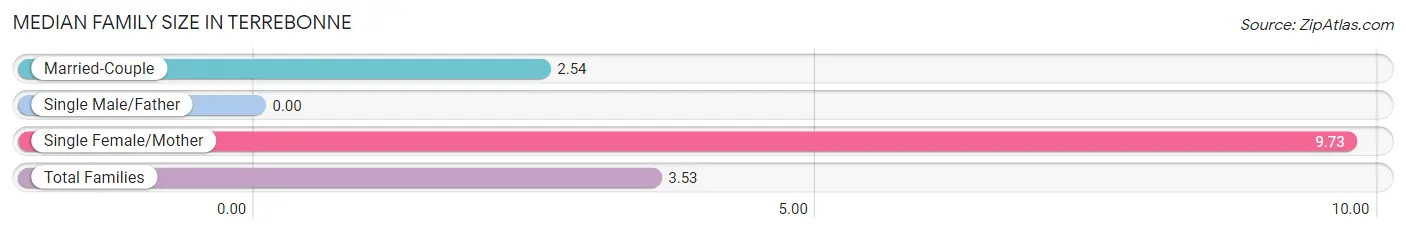
| Family Type | # Families | Family Size |
| Married-Couple | 281 (86.2%) | 2.54 |
| Single Male/Father | 0 (0.0%) | - |
| Single Female/Mother | 45 (13.8%) | 9.73 |
| Total Families | 326 (100.0%) | 3.53 |
Median Household Size in Terrebonne
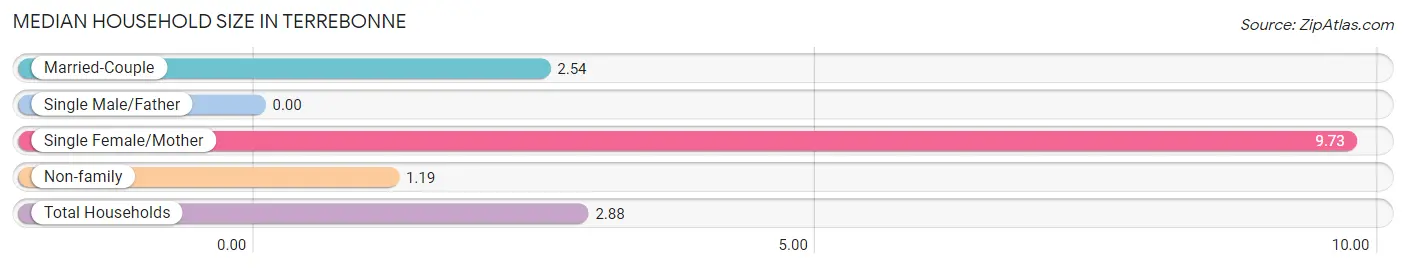
| Household Type | # Households | Household Size |
| Married-Couple | 281 (62.4%) | 2.54 |
| Single Male/Father | 0 (0.0%) | - |
| Single Female/Mother | 45 (10.0%) | 9.73 |
| Non-family | 124 (27.6%) | 1.19 |
| Total Households | 450 (100.0%) | 2.88 |
Household Size by Marriage Status in Terrebonne
Out of a total of 450 households in Terrebonne, 326 (72.4%) are family households, while 124 (27.6%) are nonfamily households. The most numerous type of family households are 2-person households, comprising 220, and the most common type of nonfamily households are 1-person households, comprising 114.
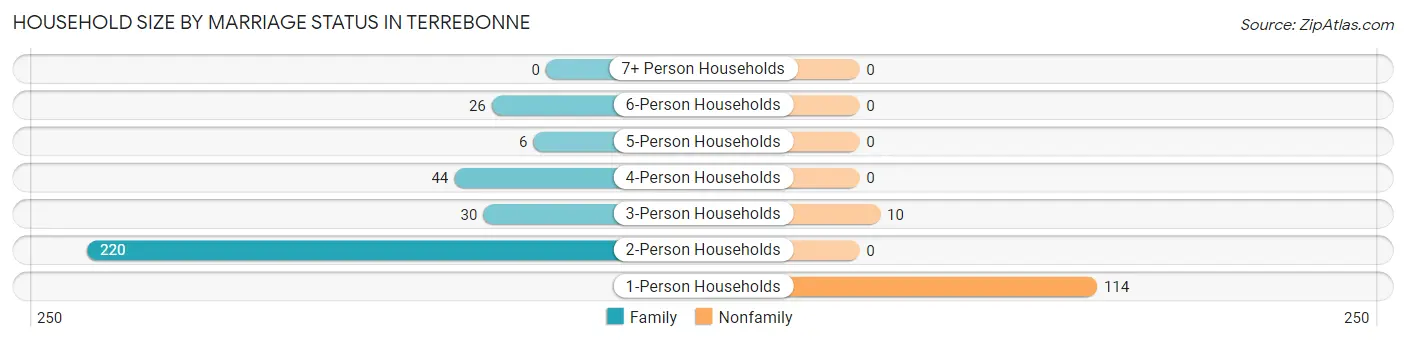
| Household Size | Family Households | Nonfamily Households |
| 1-Person Households | - | 114 (25.3%) |
| 2-Person Households | 220 (48.9%) | 0 (0.0%) |
| 3-Person Households | 30 (6.7%) | 10 (2.2%) |
| 4-Person Households | 44 (9.8%) | 0 (0.0%) |
| 5-Person Households | 6 (1.3%) | 0 (0.0%) |
| 6-Person Households | 26 (5.8%) | 0 (0.0%) |
| 7+ Person Households | 0 (0.0%) | 0 (0.0%) |
| Total | 326 (72.4%) | 124 (27.6%) |
Female Fertility in Terrebonne
Fertility by Age in Terrebonne
Average fertility rate in Terrebonne is 142.0 births per 1,000 women. Women in the age bracket of 20 to 34 years have the highest fertility rate with 262.0 births per 1,000 women. Women in the age bracket of 20 to 34 years acount for 100.0% of all women with births.
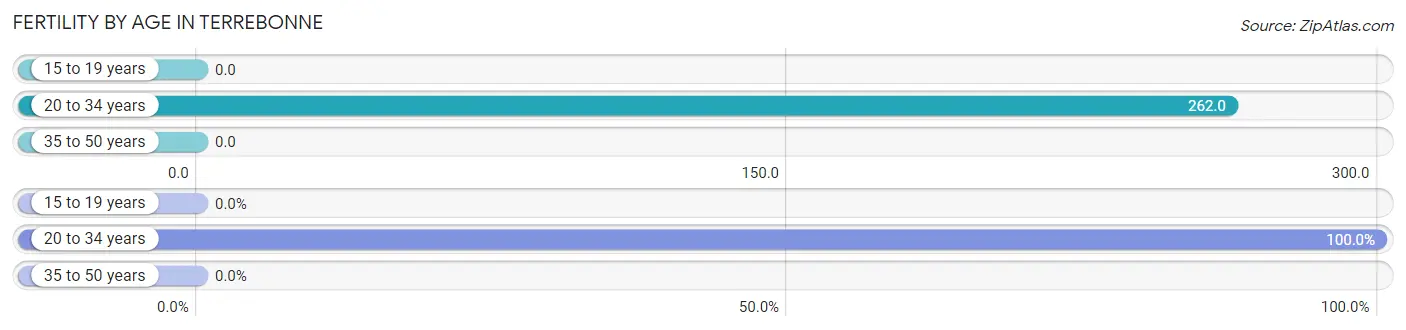
| Age Bracket | Women with Births | Births / 1,000 Women |
| 15 to 19 years | 0 (0.0%) | 0.0 |
| 20 to 34 years | 33 (100.0%) | 262.0 |
| 35 to 50 years | 0 (0.0%) | 0.0 |
| Total | 33 (100.0%) | 142.0 |
Fertility by Age by Marriage Status in Terrebonne
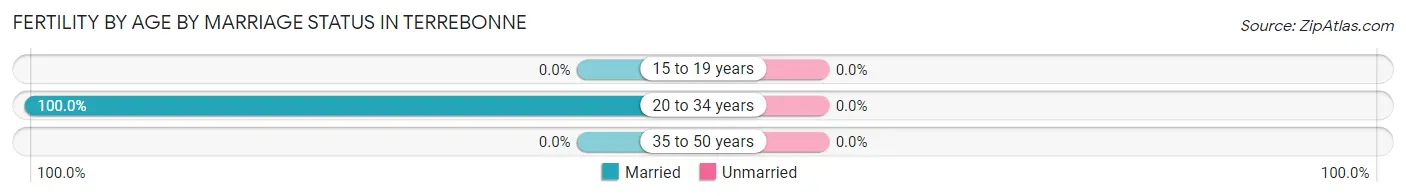
| Age Bracket | Married | Unmarried |
| 15 to 19 years | 0 (0.0%) | 0 (0.0%) |
| 20 to 34 years | 33 (100.0%) | 0 (0.0%) |
| 35 to 50 years | 0 (0.0%) | 0 (0.0%) |
| Total | 33 (100.0%) | 0 (0.0%) |
Fertility by Education in Terrebonne
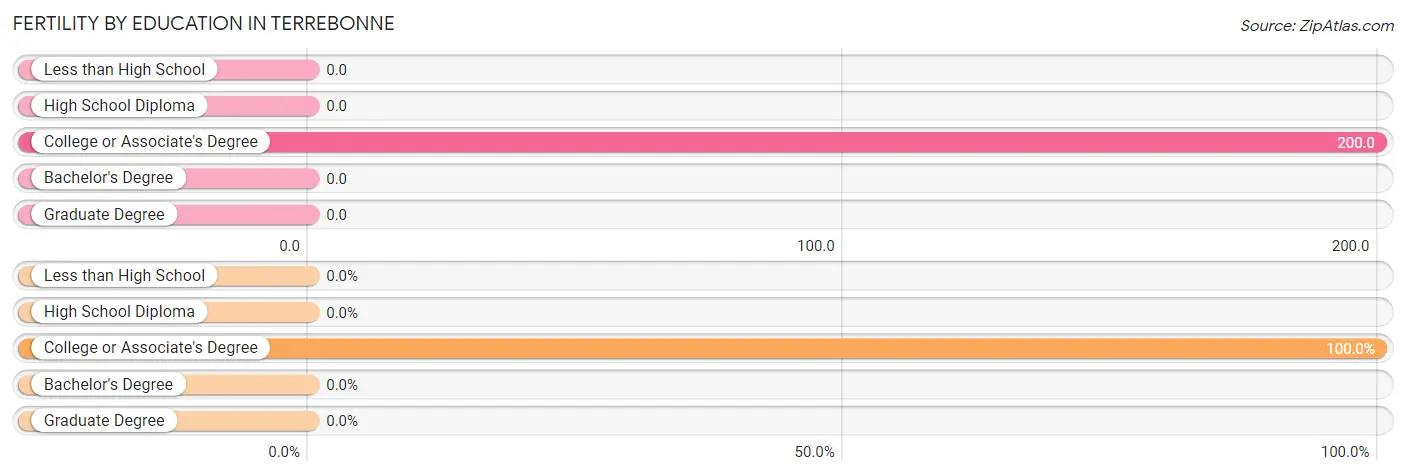
| Educational Attainment | Women with Births | Births / 1,000 Women |
| Less than High School | 0 (0.0%) | 0.0 |
| High School Diploma | 0 (0.0%) | 0.0 |
| College or Associate's Degree | 33 (100.0%) | 200.0 |
| Bachelor's Degree | 0 (0.0%) | 0.0 |
| Graduate Degree | 0 (0.0%) | 0.0 |
| Total | 33 (100.0%) | 142.0 |
Fertility by Education by Marriage Status in Terrebonne
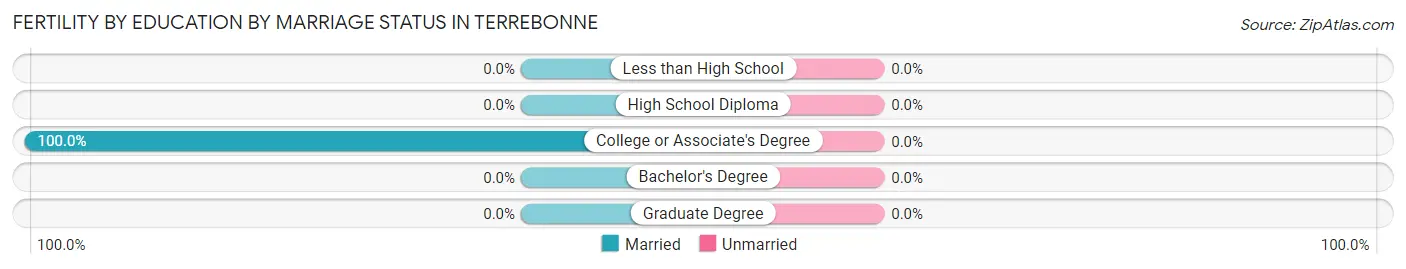
| Educational Attainment | Married | Unmarried |
| Less than High School | 0 (0.0%) | 0 (0.0%) |
| High School Diploma | 0 (0.0%) | 0 (0.0%) |
| College or Associate's Degree | 33 (100.0%) | 0 (0.0%) |
| Bachelor's Degree | 0 (0.0%) | 0 (0.0%) |
| Graduate Degree | 0 (0.0%) | 0 (0.0%) |
| Total | 33 (100.0%) | 0 (0.0%) |
Employment Characteristics in Terrebonne
Employment by Class of Employer in Terrebonne
Among the 527 employed individuals in Terrebonne, private company employees (261 | 49.5%), self-employed (not incorporated) (113 | 21.4%), and not-for-profit organizations (59 | 11.2%) make up the most common classes of employment.
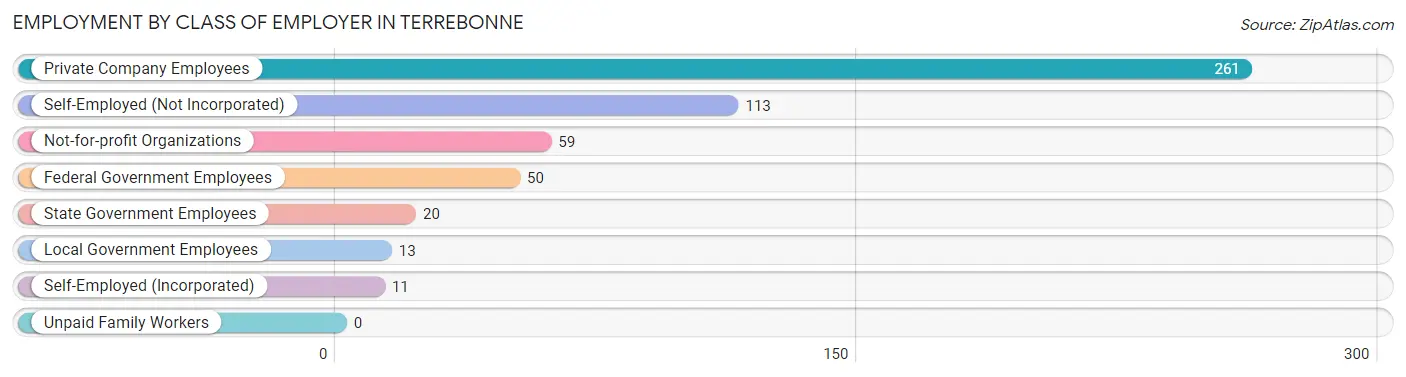
| Employer Class | # Employees | % Employees |
| Private Company Employees | 261 | 49.5% |
| Self-Employed (Incorporated) | 11 | 2.1% |
| Self-Employed (Not Incorporated) | 113 | 21.4% |
| Not-for-profit Organizations | 59 | 11.2% |
| Local Government Employees | 13 | 2.5% |
| State Government Employees | 20 | 3.8% |
| Federal Government Employees | 50 | 9.5% |
| Unpaid Family Workers | 0 | 0.0% |
| Total | 527 | 100.0% |
Employment Status by Age in Terrebonne
According to the labor force statistics for Terrebonne, out of the total population over 16 years of age (1,050), 69.2% or 727 individuals are in the labor force, with 26.3% or 191 of them unemployed. The age group with the highest labor force participation rate is 16 to 19 years, with 100.0% or 65 individuals in the labor force. Within the labor force, the 16 to 19 years age range has the highest percentage of unemployed individuals, with 100.0% or 65 of them being unemployed.
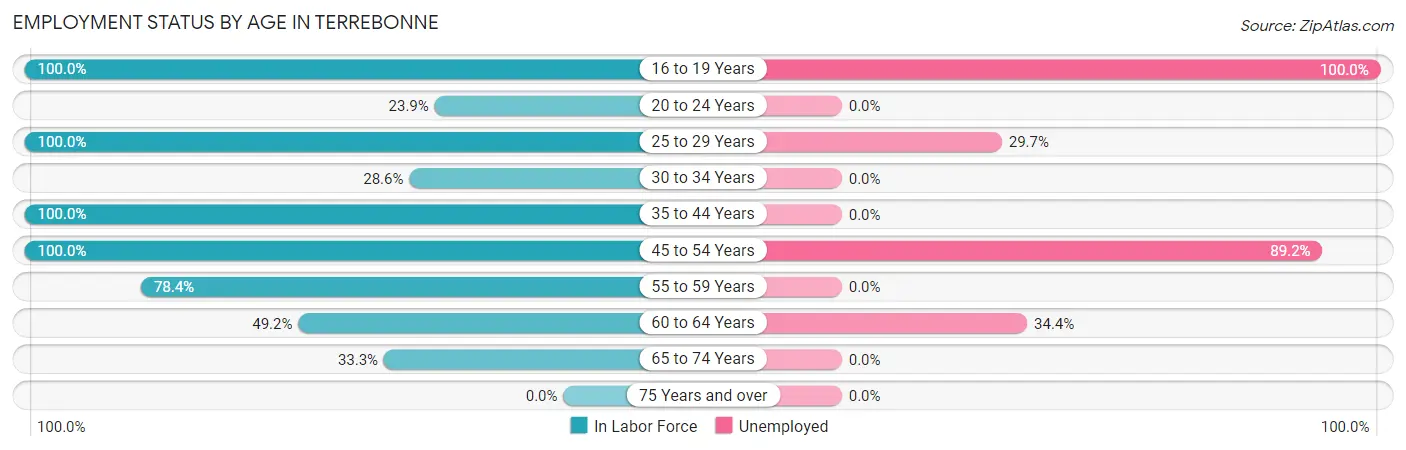
| Age Bracket | In Labor Force | Unemployed |
| 16 to 19 Years | 65 (100.0%) | 65 (100.0%) |
| 20 to 24 Years | 22 (23.9%) | 0 (0.0%) |
| 25 to 29 Years | 64 (100.0%) | 19 (29.7%) |
| 30 to 34 Years | 6 (28.6%) | 0 (0.0%) |
| 35 to 44 Years | 195 (100.0%) | 0 (0.0%) |
| 45 to 54 Years | 143 (100.0%) | 128 (89.2%) |
| 55 to 59 Years | 149 (78.4%) | 0 (0.0%) |
| 60 to 64 Years | 32 (49.2%) | 11 (34.4%) |
| 65 to 74 Years | 51 (33.3%) | 0 (0.0%) |
| 75 Years and over | 0 (0.0%) | 0 (0.0%) |
| Total | 727 (69.2%) | 191 (26.3%) |
Employment Status by Educational Attainment in Terrebonne
According to labor force statistics for Terrebonne, 86.9% of individuals (589) out of the total population between 25 and 64 years of age (678) are in the labor force, with 21.0% or 124 of them being unemployed. The group with the highest labor force participation rate are those with the educational attainment of less than high school, with 100.0% or 169 individuals in the labor force. Within the labor force, individuals with high school diploma education have the highest percentage of unemployment, with 35.8% or 39 of them being unemployed.
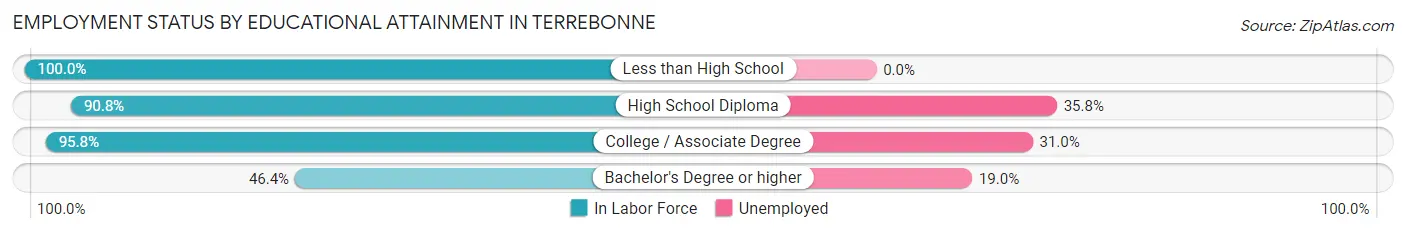
| Educational Attainment | In Labor Force | Unemployed |
| Less than High School | 169 (100.0%) | 0 (0.0%) |
| High School Diploma | 109 (90.8%) | 43 (35.8%) |
| College / Associate Degree | 253 (95.8%) | 82 (31.0%) |
| Bachelor's Degree or higher | 58 (46.4%) | 24 (19.0%) |
| Total | 589 (86.9%) | 142 (21.0%) |
Employment Occupations by Sex in Terrebonne
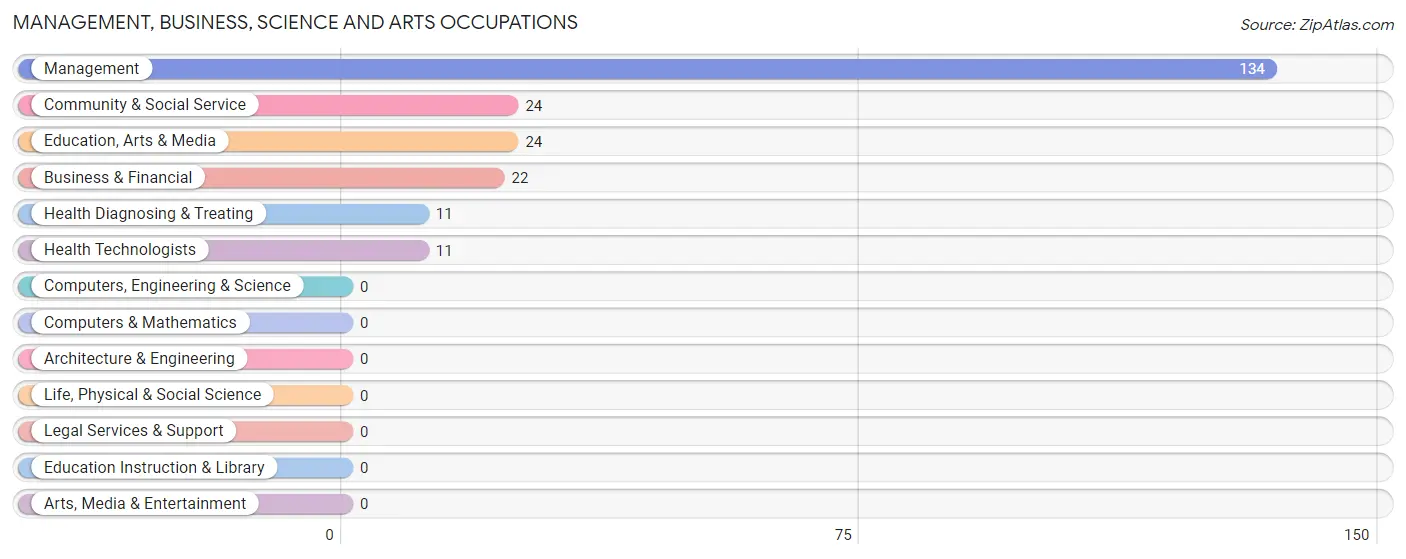
Management, Business, Science and Arts Occupations
The most common Management, Business, Science and Arts occupations in Terrebonne are Management (134 | 26.9%), Community & Social Service (24 | 4.8%), Education, Arts & Media (24 | 4.8%), Business & Financial (22 | 4.4%), and Health Diagnosing & Treating (11 | 2.2%).
Management, Business, Science and Arts Occupations by Sex
Within the Management, Business, Science and Arts occupations in Terrebonne, the most male-oriented occupations are Health Diagnosing & Treating (100.0%), Health Technologists (100.0%), and Management (92.5%), while the most female-oriented occupations are Community & Social Service (100.0%), Education, Arts & Media (100.0%), and Business & Financial (40.9%).
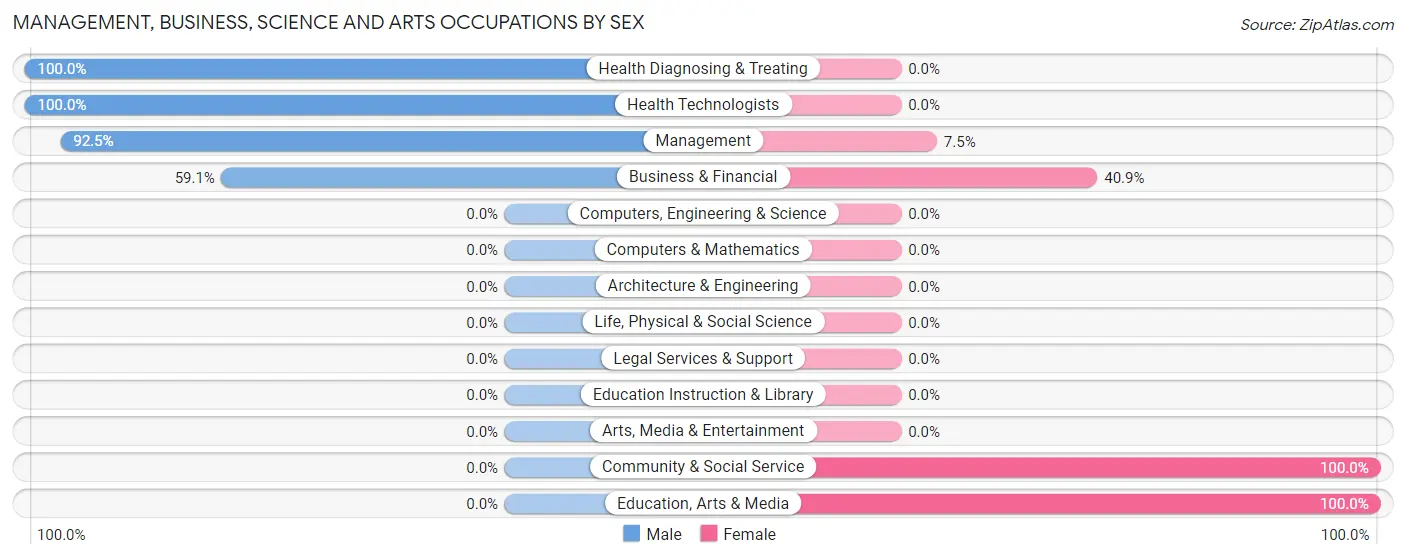
| Occupation | Male | Female |
| Management | 124 (92.5%) | 10 (7.5%) |
| Business & Financial | 13 (59.1%) | 9 (40.9%) |
| Computers, Engineering & Science | 0 (0.0%) | 0 (0.0%) |
| Computers & Mathematics | 0 (0.0%) | 0 (0.0%) |
| Architecture & Engineering | 0 (0.0%) | 0 (0.0%) |
| Life, Physical & Social Science | 0 (0.0%) | 0 (0.0%) |
| Community & Social Service | 0 (0.0%) | 24 (100.0%) |
| Education, Arts & Media | 0 (0.0%) | 24 (100.0%) |
| Legal Services & Support | 0 (0.0%) | 0 (0.0%) |
| Education Instruction & Library | 0 (0.0%) | 0 (0.0%) |
| Arts, Media & Entertainment | 0 (0.0%) | 0 (0.0%) |
| Health Diagnosing & Treating | 11 (100.0%) | 0 (0.0%) |
| Health Technologists | 11 (100.0%) | 0 (0.0%) |
| Total (Category) | 148 (77.5%) | 43 (22.5%) |
| Total (Overall) | 255 (51.1%) | 244 (48.9%) |
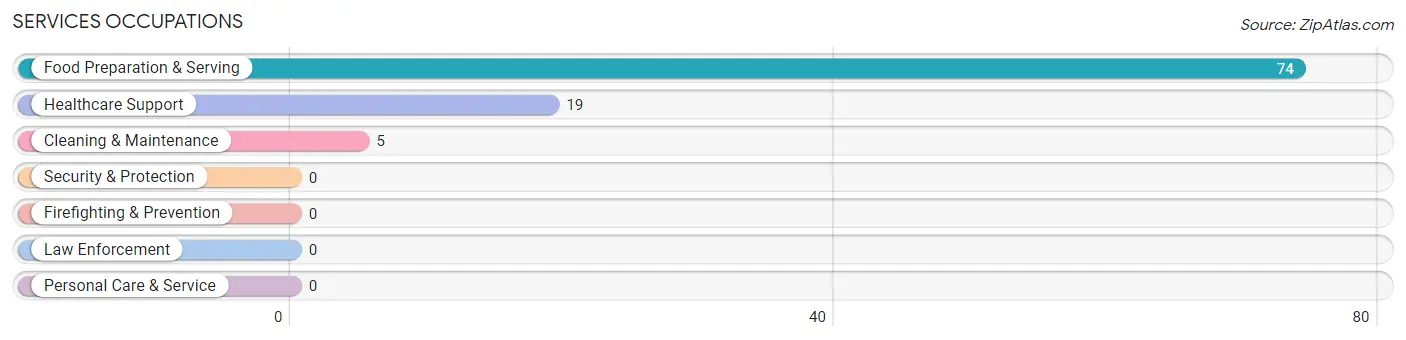
Services Occupations
The most common Services occupations in Terrebonne are Food Preparation & Serving (74 | 14.8%), Healthcare Support (19 | 3.8%), and Cleaning & Maintenance (5 | 1.0%).
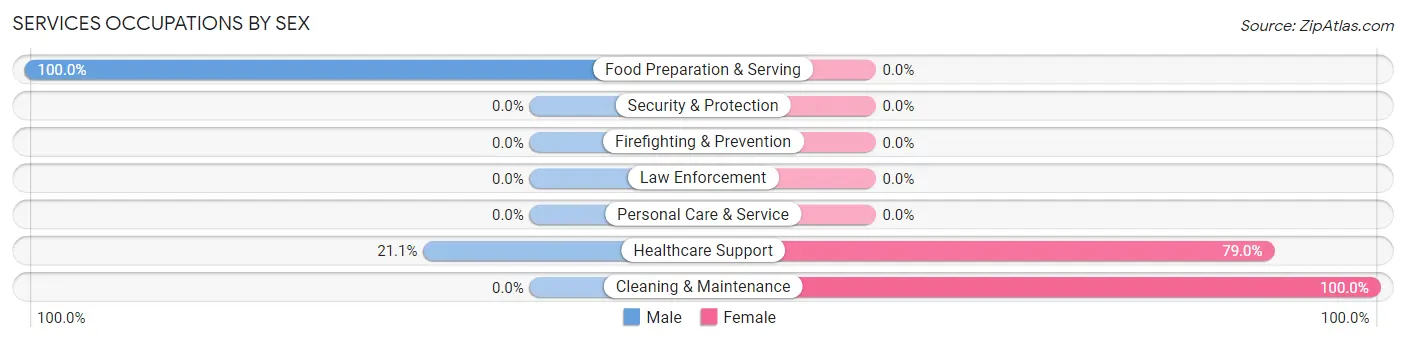
Services Occupations by Sex
Within the Services occupations in Terrebonne, the most male-oriented occupations are Food Preparation & Serving (100.0%), and Healthcare Support (21.0%), while the most female-oriented occupations are Cleaning & Maintenance (100.0%), and Healthcare Support (78.9%).
| Occupation | Male | Female |
| Healthcare Support | 4 (21.0%) | 15 (78.9%) |
| Security & Protection | 0 (0.0%) | 0 (0.0%) |
| Firefighting & Prevention | 0 (0.0%) | 0 (0.0%) |
| Law Enforcement | 0 (0.0%) | 0 (0.0%) |
| Food Preparation & Serving | 74 (100.0%) | 0 (0.0%) |
| Cleaning & Maintenance | 0 (0.0%) | 5 (100.0%) |
| Personal Care & Service | 0 (0.0%) | 0 (0.0%) |
| Total (Category) | 78 (79.6%) | 20 (20.4%) |
| Total (Overall) | 255 (51.1%) | 244 (48.9%) |
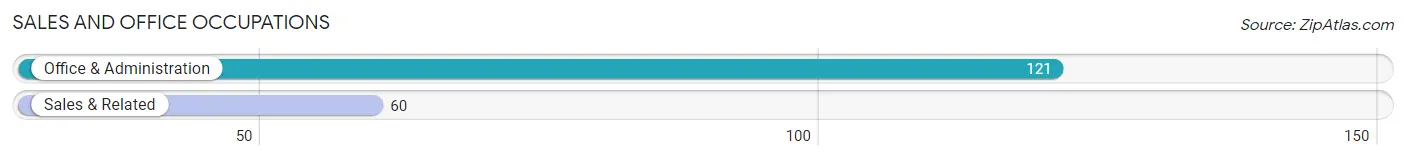
Sales and Office Occupations
The most common Sales and Office occupations in Terrebonne are Office & Administration (121 | 24.2%), and Sales & Related (60 | 12.0%).
Sales and Office Occupations by Sex
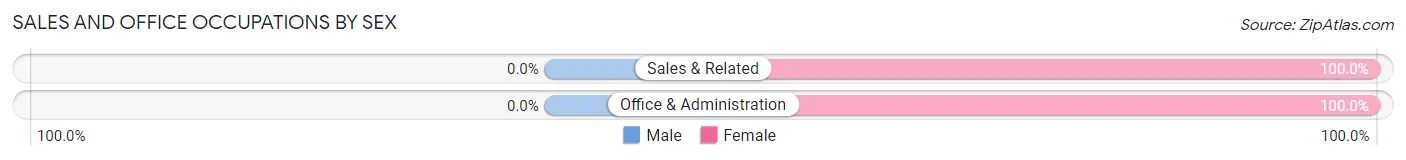
| Occupation | Male | Female |
| Sales & Related | 0 (0.0%) | 60 (100.0%) |
| Office & Administration | 0 (0.0%) | 121 (100.0%) |
| Total (Category) | 0 (0.0%) | 181 (100.0%) |
| Total (Overall) | 255 (51.1%) | 244 (48.9%) |
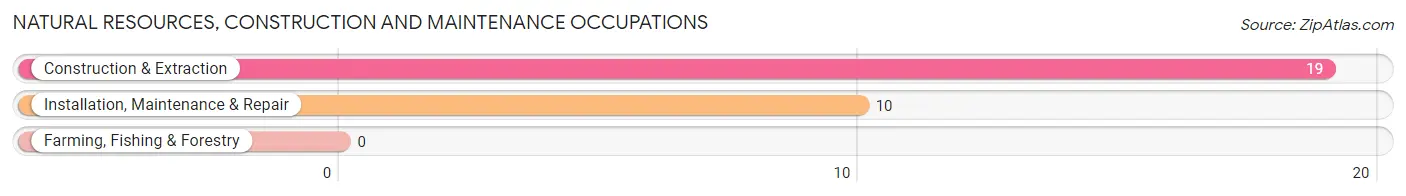
Natural Resources, Construction and Maintenance Occupations
The most common Natural Resources, Construction and Maintenance occupations in Terrebonne are Construction & Extraction (19 | 3.8%), and Installation, Maintenance & Repair (10 | 2.0%).
Natural Resources, Construction and Maintenance Occupations by Sex
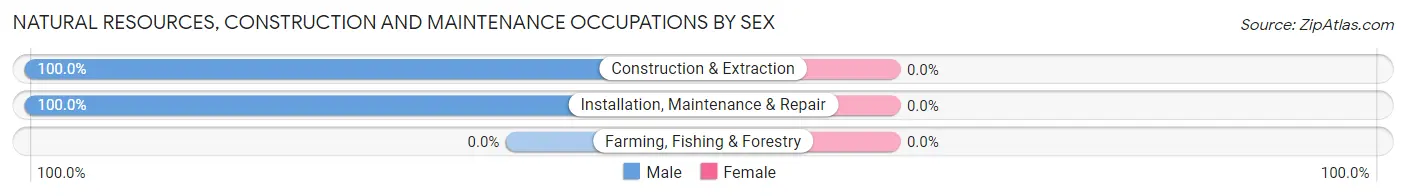
| Occupation | Male | Female |
| Farming, Fishing & Forestry | 0 (0.0%) | 0 (0.0%) |
| Construction & Extraction | 19 (100.0%) | 0 (0.0%) |
| Installation, Maintenance & Repair | 10 (100.0%) | 0 (0.0%) |
| Total (Category) | 29 (100.0%) | 0 (0.0%) |
| Total (Overall) | 255 (51.1%) | 244 (48.9%) |
Production, Transportation and Moving Occupations
Production, Transportation and Moving Occupations by Sex
| Occupation | Male | Female |
| Production | 0 (0.0%) | 0 (0.0%) |
| Transportation | 0 (0.0%) | 0 (0.0%) |
| Material Moving | 0 (0.0%) | 0 (0.0%) |
| Total (Category) | 0 (0.0%) | 0 (0.0%) |
| Total (Overall) | 255 (51.1%) | 244 (48.9%) |
Employment Industries by Sex in Terrebonne
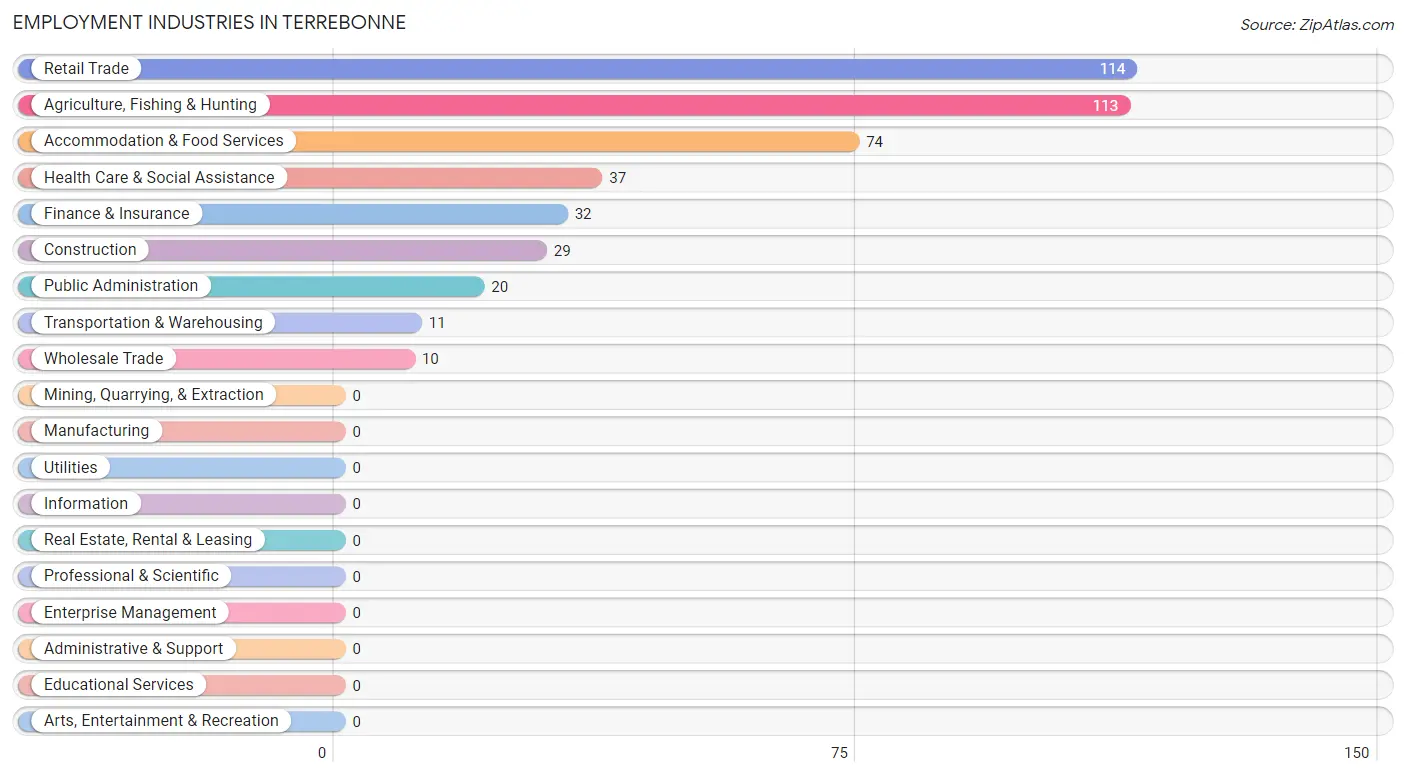
Employment Industries in Terrebonne
The major employment industries in Terrebonne include Retail Trade (114 | 22.9%), Agriculture, Fishing & Hunting (113 | 22.7%), Accommodation & Food Services (74 | 14.8%), Health Care & Social Assistance (37 | 7.4%), and Finance & Insurance (32 | 6.4%).
Employment Industries by Sex in Terrebonne
The Terrebonne industries that see more men than women are Agriculture, Fishing & Hunting (100.0%), Construction (100.0%), and Transportation & Warehousing (100.0%), whereas the industries that tend to have a higher number of women are Wholesale Trade (100.0%), Finance & Insurance (100.0%), and Health Care & Social Assistance (89.2%).
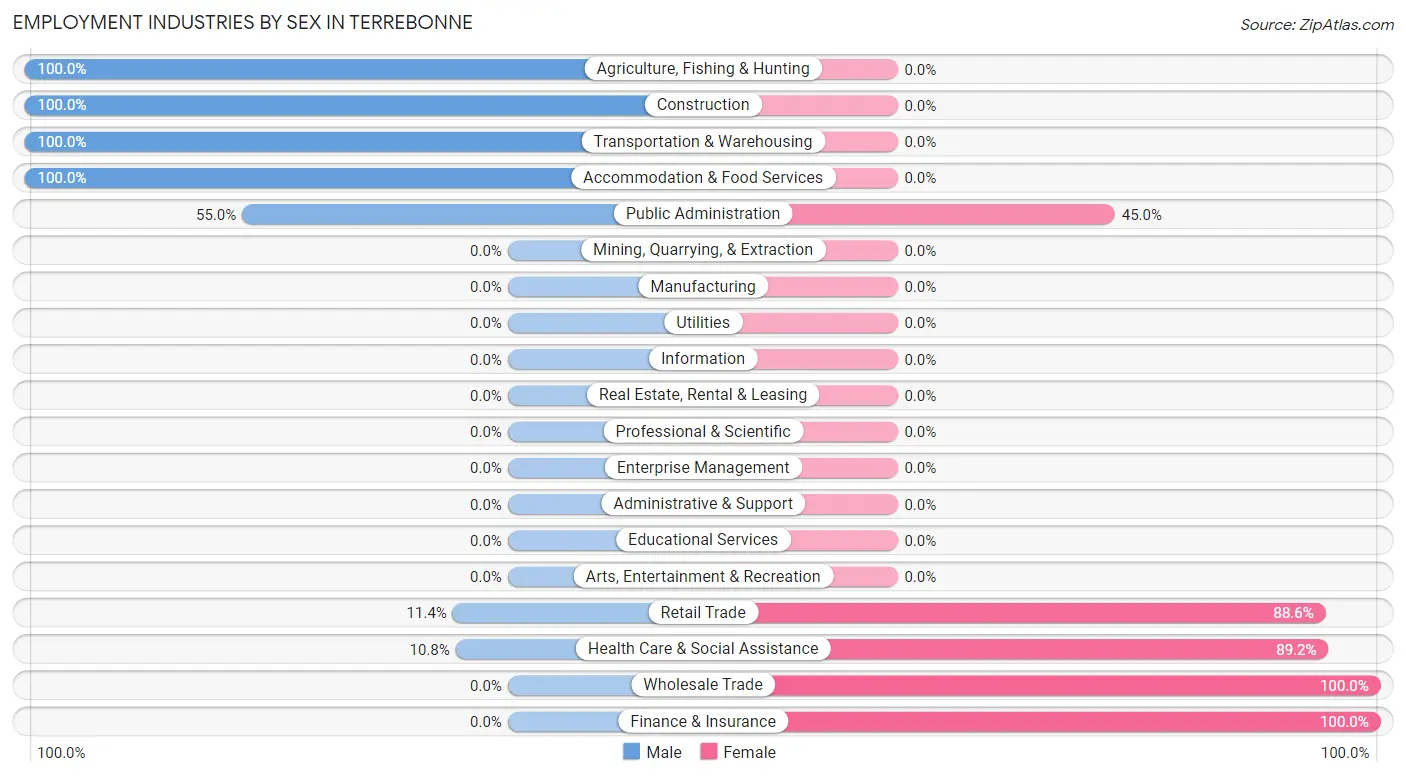
| Industry | Male | Female |
| Agriculture, Fishing & Hunting | 113 (100.0%) | 0 (0.0%) |
| Mining, Quarrying, & Extraction | 0 (0.0%) | 0 (0.0%) |
| Construction | 29 (100.0%) | 0 (0.0%) |
| Manufacturing | 0 (0.0%) | 0 (0.0%) |
| Wholesale Trade | 0 (0.0%) | 10 (100.0%) |
| Retail Trade | 13 (11.4%) | 101 (88.6%) |
| Transportation & Warehousing | 11 (100.0%) | 0 (0.0%) |
| Utilities | 0 (0.0%) | 0 (0.0%) |
| Information | 0 (0.0%) | 0 (0.0%) |
| Finance & Insurance | 0 (0.0%) | 32 (100.0%) |
| Real Estate, Rental & Leasing | 0 (0.0%) | 0 (0.0%) |
| Professional & Scientific | 0 (0.0%) | 0 (0.0%) |
| Enterprise Management | 0 (0.0%) | 0 (0.0%) |
| Administrative & Support | 0 (0.0%) | 0 (0.0%) |
| Educational Services | 0 (0.0%) | 0 (0.0%) |
| Health Care & Social Assistance | 4 (10.8%) | 33 (89.2%) |
| Arts, Entertainment & Recreation | 0 (0.0%) | 0 (0.0%) |
| Accommodation & Food Services | 74 (100.0%) | 0 (0.0%) |
| Public Administration | 11 (55.0%) | 9 (45.0%) |
| Total | 255 (51.1%) | 244 (48.9%) |
Education in Terrebonne
School Enrollment in Terrebonne
The most common levels of schooling among the 335 students in Terrebonne are middle school (111 | 33.1%), nursery / preschool (87 | 26.0%), and high school (65 | 19.4%).
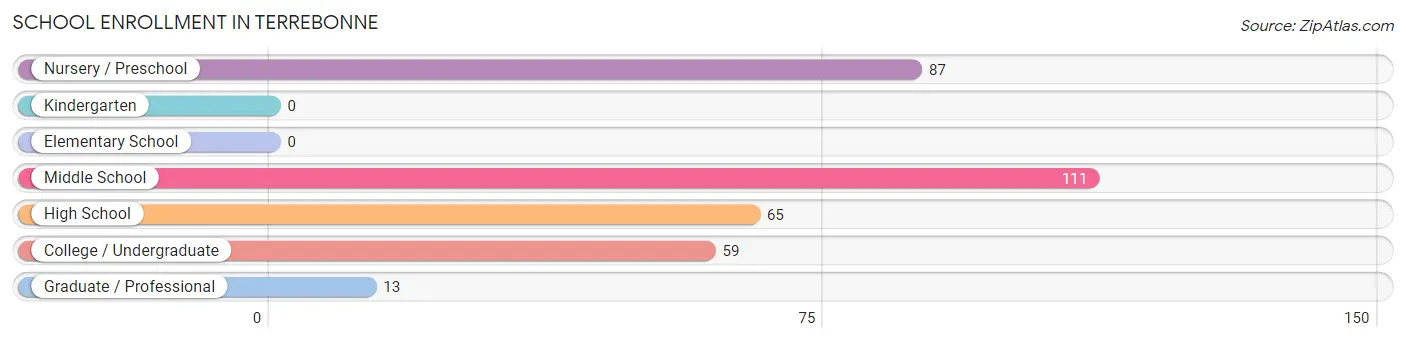
| School Level | # Students | % Students |
| Nursery / Preschool | 87 | 26.0% |
| Kindergarten | 0 | 0.0% |
| Elementary School | 0 | 0.0% |
| Middle School | 111 | 33.1% |
| High School | 65 | 19.4% |
| College / Undergraduate | 59 | 17.6% |
| Graduate / Professional | 13 | 3.9% |
| Total | 335 | 100.0% |
School Enrollment by Age by Funding Source in Terrebonne
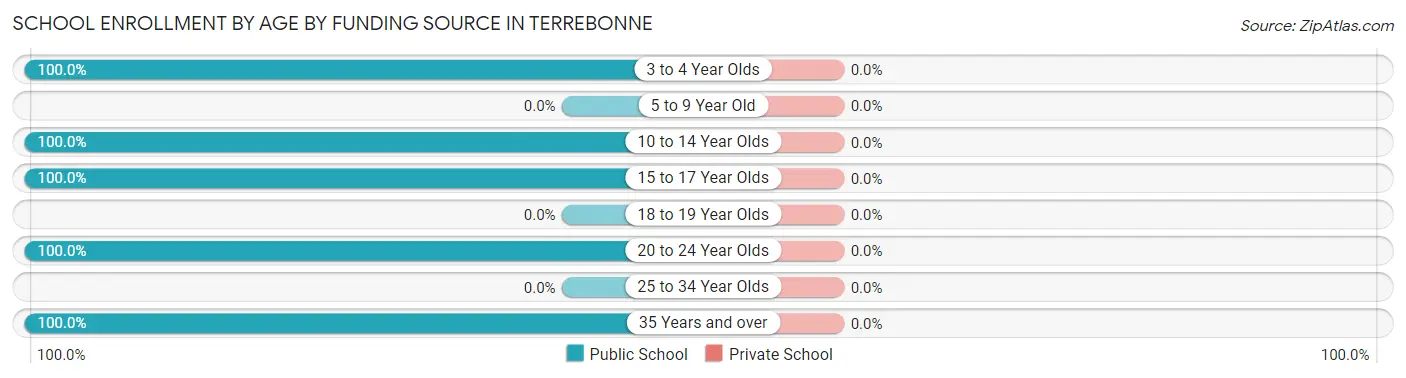
| Age Bracket | Public School | Private School |
| 3 to 4 Year Olds | 87 (100.0%) | 0 (0.0%) |
| 5 to 9 Year Old | 0 (0.0%) | 0 (0.0%) |
| 10 to 14 Year Olds | 111 (100.0%) | 0 (0.0%) |
| 15 to 17 Year Olds | 65 (100.0%) | 0 (0.0%) |
| 18 to 19 Year Olds | 0 (0.0%) | 0 (0.0%) |
| 20 to 24 Year Olds | 59 (100.0%) | 0 (0.0%) |
| 25 to 34 Year Olds | 0 (0.0%) | 0 (0.0%) |
| 35 Years and over | 13 (100.0%) | 0 (0.0%) |
| Total | 335 (100.0%) | 0 (0.0%) |
Educational Attainment by Field of Study in Terrebonne
Liberal arts & history (60 | 29.3%), social sciences (52 | 25.4%), engineering (36 | 17.6%), education (20 | 9.8%), and psychology (13 | 6.3%) are the most common fields of study among 205 individuals in Terrebonne who have obtained a bachelor's degree or higher.
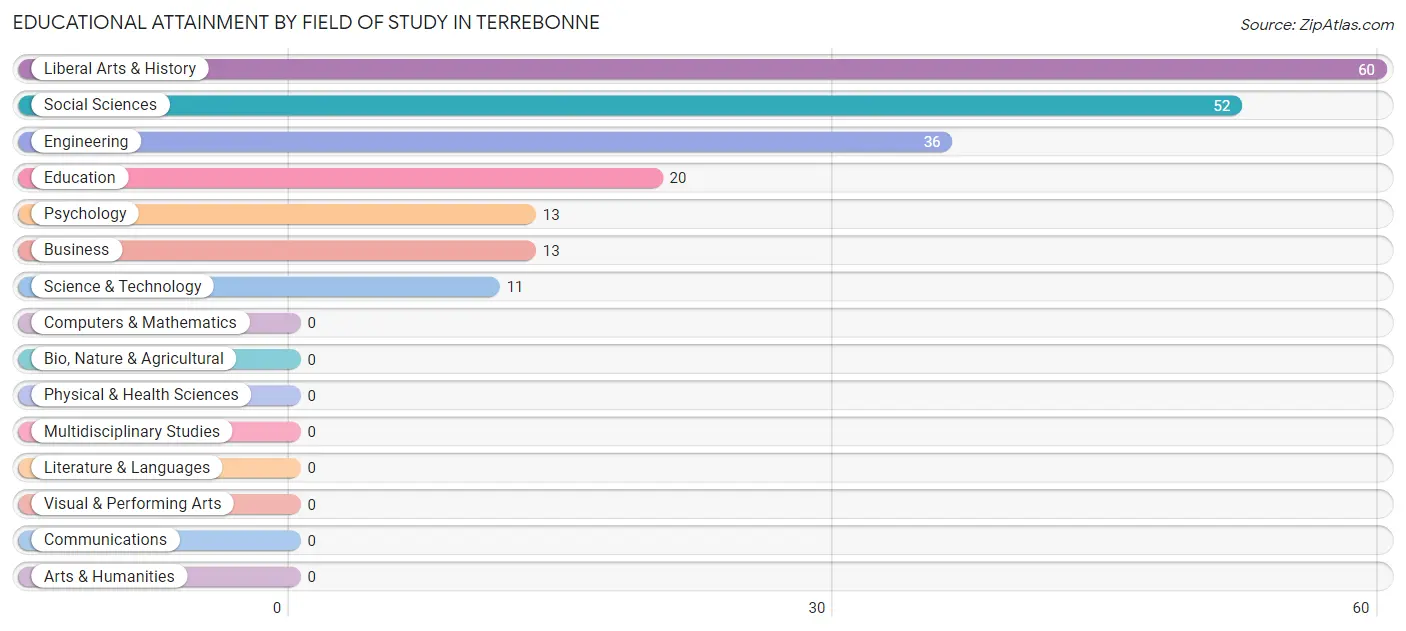
| Field of Study | # Graduates | % Graduates |
| Computers & Mathematics | 0 | 0.0% |
| Bio, Nature & Agricultural | 0 | 0.0% |
| Physical & Health Sciences | 0 | 0.0% |
| Psychology | 13 | 6.3% |
| Social Sciences | 52 | 25.4% |
| Engineering | 36 | 17.6% |
| Multidisciplinary Studies | 0 | 0.0% |
| Science & Technology | 11 | 5.4% |
| Business | 13 | 6.3% |
| Education | 20 | 9.8% |
| Literature & Languages | 0 | 0.0% |
| Liberal Arts & History | 60 | 29.3% |
| Visual & Performing Arts | 0 | 0.0% |
| Communications | 0 | 0.0% |
| Arts & Humanities | 0 | 0.0% |
| Total | 205 | 100.0% |
Transportation & Commute in Terrebonne
Vehicle Availability by Sex in Terrebonne
The most prevalent vehicle ownership categories in Terrebonne are males with 3 vehicles (193, accounting for 63.3%) and females with 3 vehicles (50, making up 86.9%).
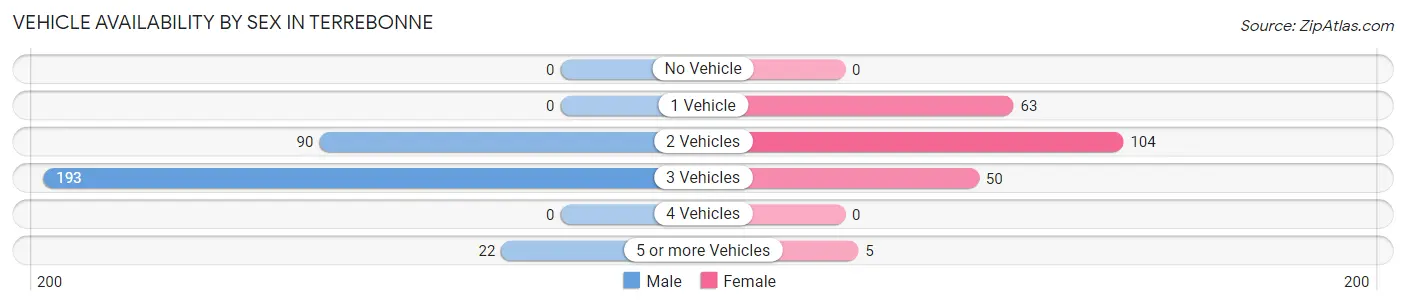
| Vehicles Available | Male | Female |
| No Vehicle | 0 (0.0%) | 0 (0.0%) |
| 1 Vehicle | 0 (0.0%) | 63 (28.4%) |
| 2 Vehicles | 90 (29.5%) | 104 (46.9%) |
| 3 Vehicles | 193 (63.3%) | 50 (22.5%) |
| 4 Vehicles | 0 (0.0%) | 0 (0.0%) |
| 5 or more Vehicles | 22 (7.2%) | 5 (2.2%) |
| Total | 305 (100.0%) | 222 (100.0%) |
Commute Time in Terrebonne
The most frequently occuring commute durations in Terrebonne are 60 to 89 minutes (113 commuters, 28.0%), 15 to 19 minutes (60 commuters, 14.9%), and 5 to 9 minutes (56 commuters, 13.9%).
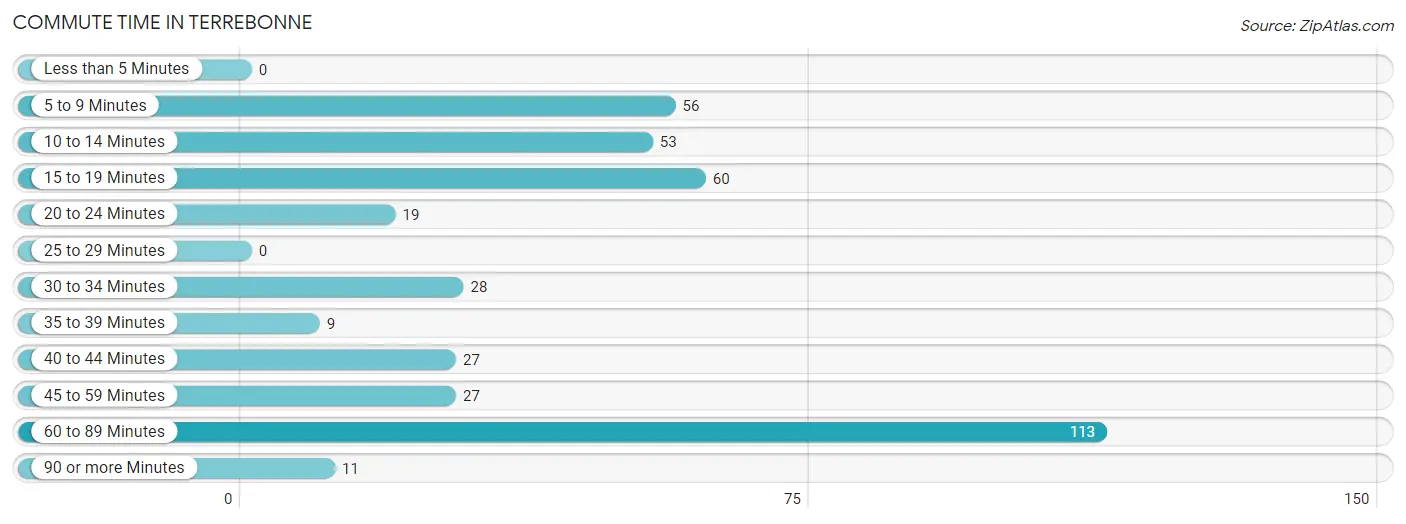
| Commute Time | # Commuters | % Commuters |
| Less than 5 Minutes | 0 | 0.0% |
| 5 to 9 Minutes | 56 | 13.9% |
| 10 to 14 Minutes | 53 | 13.2% |
| 15 to 19 Minutes | 60 | 14.9% |
| 20 to 24 Minutes | 19 | 4.7% |
| 25 to 29 Minutes | 0 | 0.0% |
| 30 to 34 Minutes | 28 | 7.0% |
| 35 to 39 Minutes | 9 | 2.2% |
| 40 to 44 Minutes | 27 | 6.7% |
| 45 to 59 Minutes | 27 | 6.7% |
| 60 to 89 Minutes | 113 | 28.0% |
| 90 or more Minutes | 11 | 2.7% |
Commute Time by Sex in Terrebonne
The most common commute times in Terrebonne are 60 to 89 minutes (113 commuters, 46.7%) for males and 15 to 19 minutes (60 commuters, 37.3%) for females.
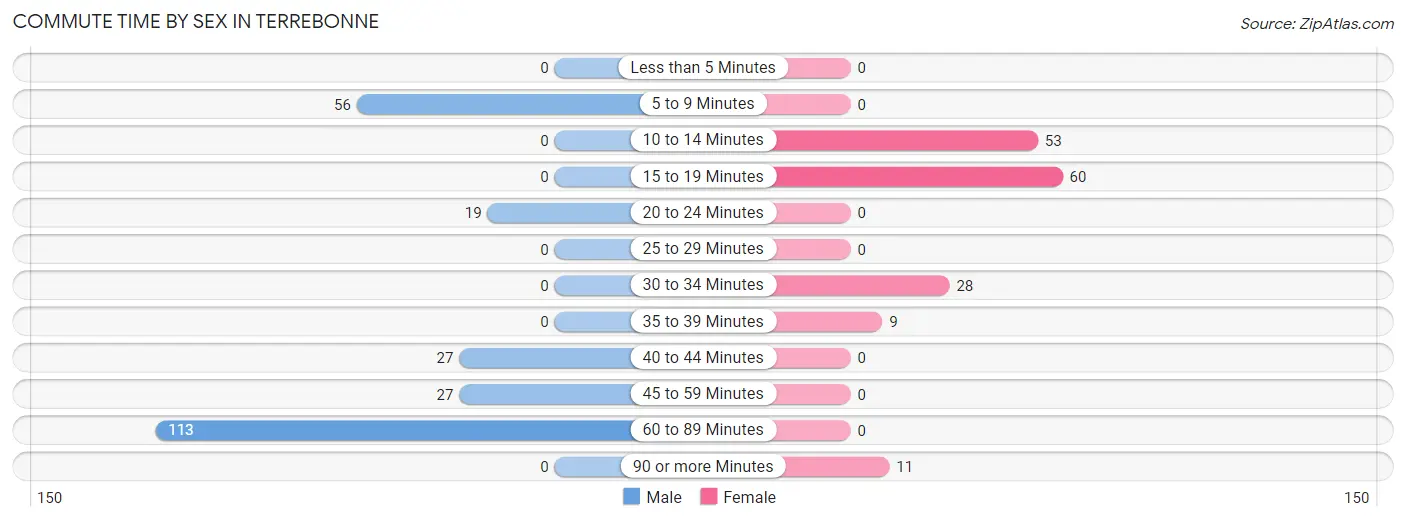
| Commute Time | Male | Female |
| Less than 5 Minutes | 0 (0.0%) | 0 (0.0%) |
| 5 to 9 Minutes | 56 (23.1%) | 0 (0.0%) |
| 10 to 14 Minutes | 0 (0.0%) | 53 (32.9%) |
| 15 to 19 Minutes | 0 (0.0%) | 60 (37.3%) |
| 20 to 24 Minutes | 19 (7.9%) | 0 (0.0%) |
| 25 to 29 Minutes | 0 (0.0%) | 0 (0.0%) |
| 30 to 34 Minutes | 0 (0.0%) | 28 (17.4%) |
| 35 to 39 Minutes | 0 (0.0%) | 9 (5.6%) |
| 40 to 44 Minutes | 27 (11.2%) | 0 (0.0%) |
| 45 to 59 Minutes | 27 (11.2%) | 0 (0.0%) |
| 60 to 89 Minutes | 113 (46.7%) | 0 (0.0%) |
| 90 or more Minutes | 0 (0.0%) | 11 (6.8%) |
Time of Departure to Work by Sex in Terrebonne
The most frequent times of departure to work in Terrebonne are 12:00 AM to 4:59 AM (113, 46.7%) for males and 5:00 AM to 5:29 AM (60, 37.3%) for females.
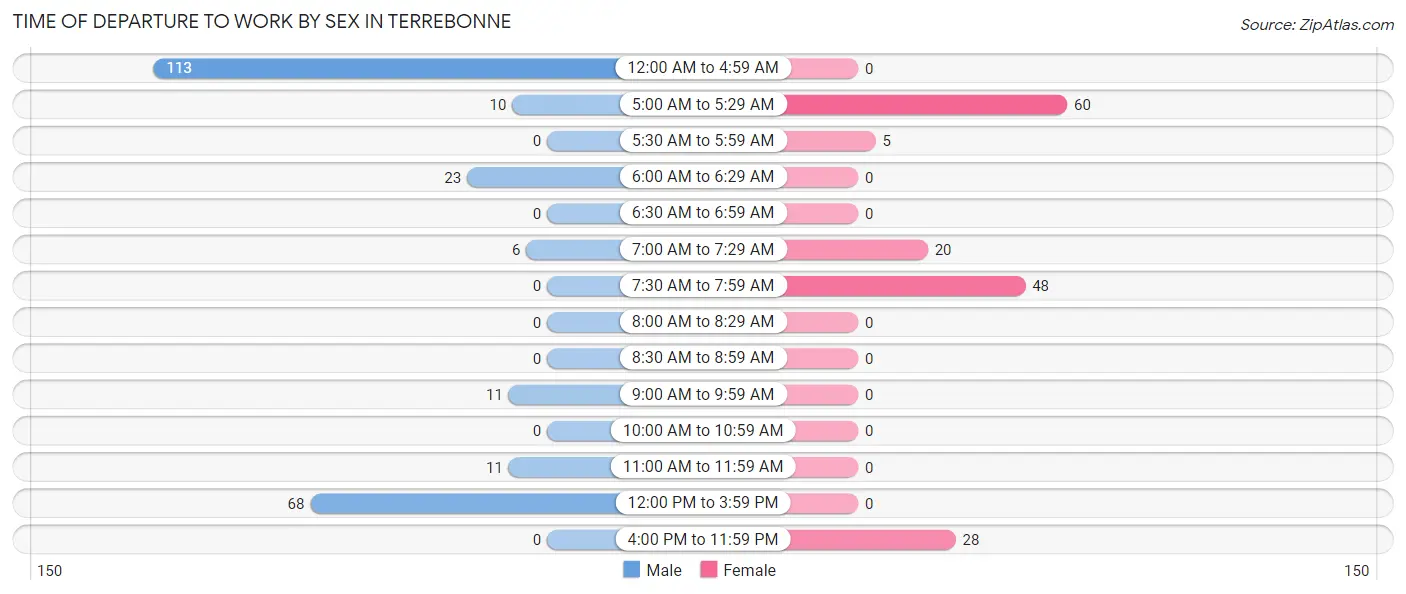
| Time of Departure | Male | Female |
| 12:00 AM to 4:59 AM | 113 (46.7%) | 0 (0.0%) |
| 5:00 AM to 5:29 AM | 10 (4.1%) | 60 (37.3%) |
| 5:30 AM to 5:59 AM | 0 (0.0%) | 5 (3.1%) |
| 6:00 AM to 6:29 AM | 23 (9.5%) | 0 (0.0%) |
| 6:30 AM to 6:59 AM | 0 (0.0%) | 0 (0.0%) |
| 7:00 AM to 7:29 AM | 6 (2.5%) | 20 (12.4%) |
| 7:30 AM to 7:59 AM | 0 (0.0%) | 48 (29.8%) |
| 8:00 AM to 8:29 AM | 0 (0.0%) | 0 (0.0%) |
| 8:30 AM to 8:59 AM | 0 (0.0%) | 0 (0.0%) |
| 9:00 AM to 9:59 AM | 11 (4.5%) | 0 (0.0%) |
| 10:00 AM to 10:59 AM | 0 (0.0%) | 0 (0.0%) |
| 11:00 AM to 11:59 AM | 11 (4.5%) | 0 (0.0%) |
| 12:00 PM to 3:59 PM | 68 (28.1%) | 0 (0.0%) |
| 4:00 PM to 11:59 PM | 0 (0.0%) | 28 (17.4%) |
| Total | 242 (100.0%) | 161 (100.0%) |
Housing Occupancy in Terrebonne
Occupancy by Ownership in Terrebonne
Of the total 450 dwellings in Terrebonne, owner-occupied units account for 371 (82.4%), while renter-occupied units make up 79 (17.6%).
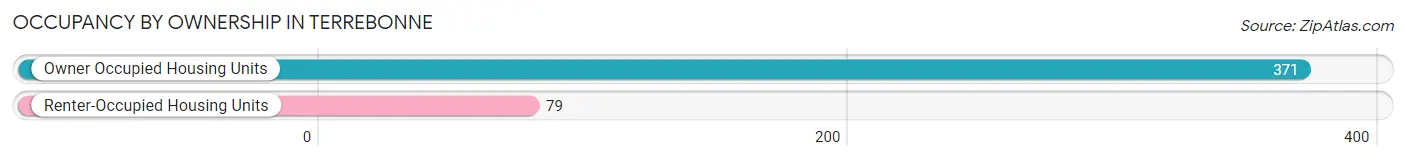
| Occupancy | # Housing Units | % Housing Units |
| Owner Occupied Housing Units | 371 | 82.4% |
| Renter-Occupied Housing Units | 79 | 17.6% |
| Total Occupied Housing Units | 450 | 100.0% |
Occupancy by Household Size in Terrebonne
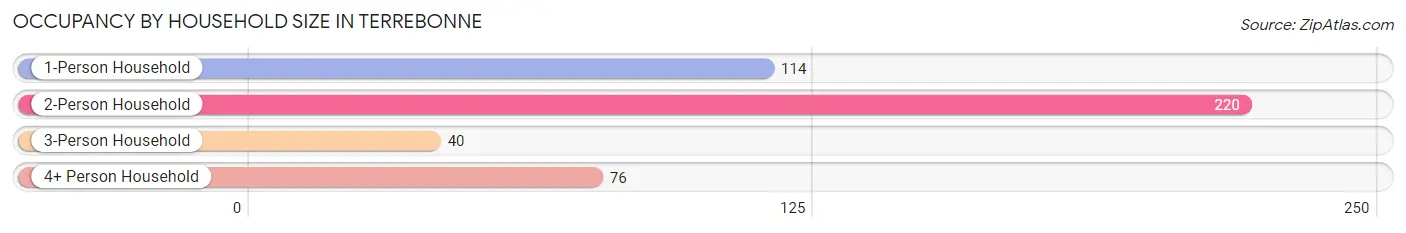
| Household Size | # Housing Units | % Housing Units |
| 1-Person Household | 114 | 25.3% |
| 2-Person Household | 220 | 48.9% |
| 3-Person Household | 40 | 8.9% |
| 4+ Person Household | 76 | 16.9% |
| Total Housing Units | 450 | 100.0% |
Occupancy by Ownership by Household Size in Terrebonne
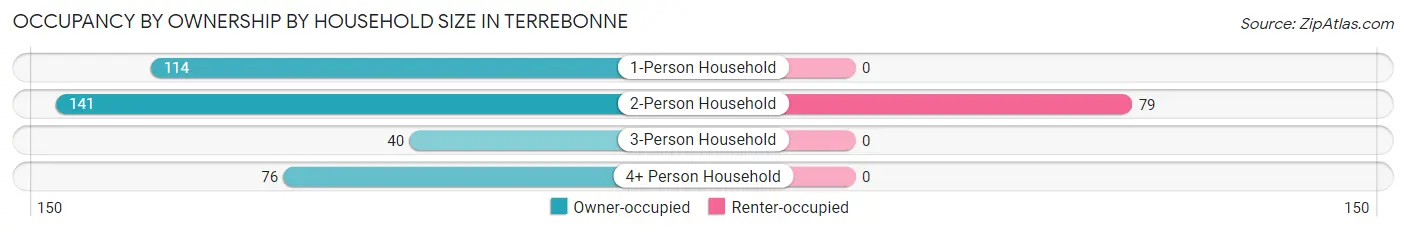
| Household Size | Owner-occupied | Renter-occupied |
| 1-Person Household | 114 (100.0%) | 0 (0.0%) |
| 2-Person Household | 141 (64.1%) | 79 (35.9%) |
| 3-Person Household | 40 (100.0%) | 0 (0.0%) |
| 4+ Person Household | 76 (100.0%) | 0 (0.0%) |
| Total Housing Units | 371 (82.4%) | 79 (17.6%) |
Occupancy by Educational Attainment in Terrebonne
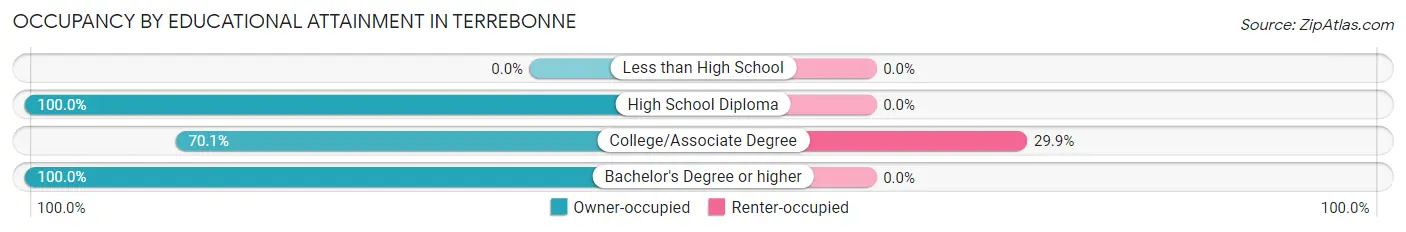
| Household Size | Owner-occupied | Renter-occupied |
| Less than High School | 0 (0.0%) | 0 (0.0%) |
| High School Diploma | 132 (100.0%) | 0 (0.0%) |
| College/Associate Degree | 185 (70.1%) | 79 (29.9%) |
| Bachelor's Degree or higher | 54 (100.0%) | 0 (0.0%) |
Occupancy by Age of Householder in Terrebonne
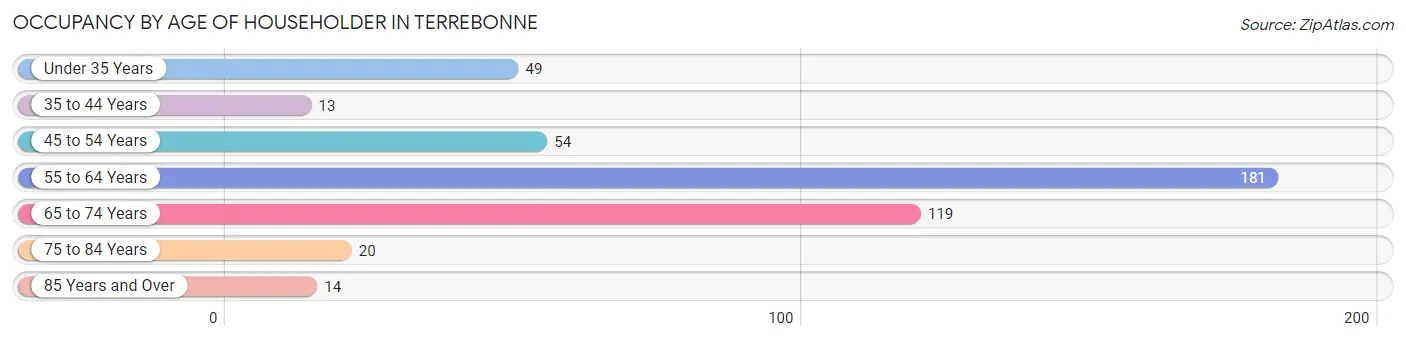
| Age Bracket | # Households | % Households |
| Under 35 Years | 49 | 10.9% |
| 35 to 44 Years | 13 | 2.9% |
| 45 to 54 Years | 54 | 12.0% |
| 55 to 64 Years | 181 | 40.2% |
| 65 to 74 Years | 119 | 26.4% |
| 75 to 84 Years | 20 | 4.4% |
| 85 Years and Over | 14 | 3.1% |
| Total | 450 | 100.0% |
Housing Finances in Terrebonne
Median Income by Occupancy in Terrebonne
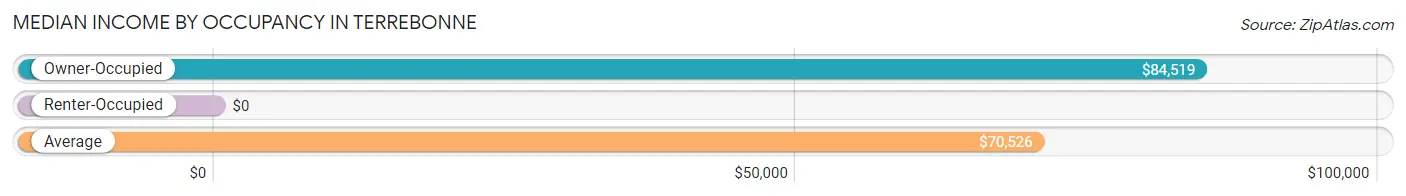
| Occupancy Type | # Households | Median Income |
| Owner-Occupied | 371 (82.4%) | $84,519 |
| Renter-Occupied | 79 (17.6%) | $0 |
| Average | 450 (100.0%) | $70,526 |
Occupancy by Householder Income Bracket in Terrebonne
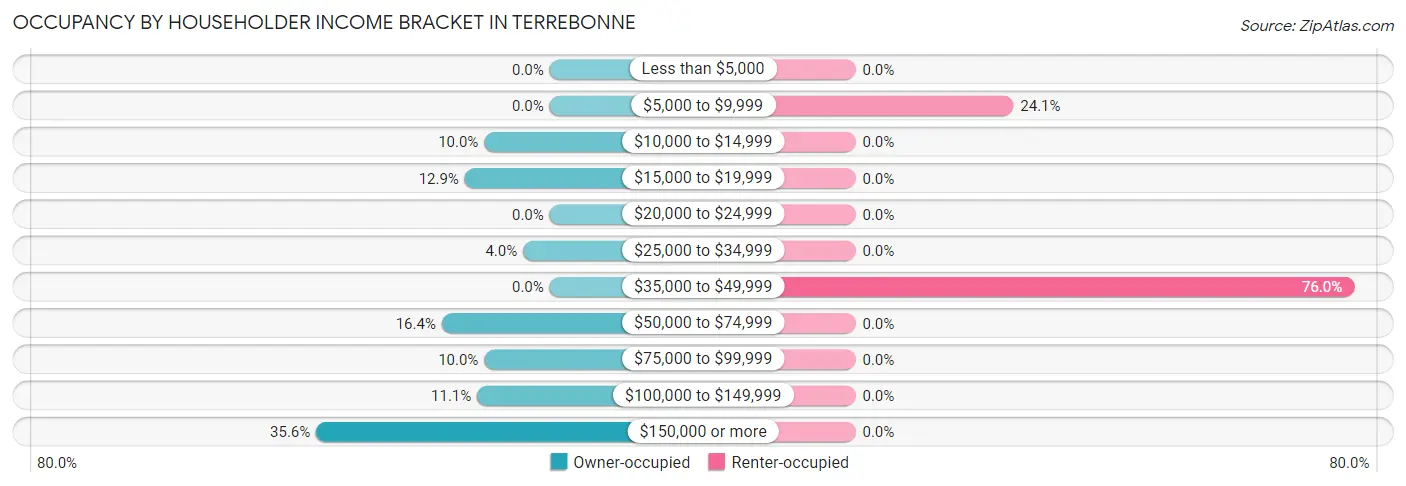
| Income Bracket | Owner-occupied | Renter-occupied |
| Less than $5,000 | 0 (0.0%) | 0 (0.0%) |
| $5,000 to $9,999 | 0 (0.0%) | 19 (24.0%) |
| $10,000 to $14,999 | 37 (10.0%) | 0 (0.0%) |
| $15,000 to $19,999 | 48 (12.9%) | 0 (0.0%) |
| $20,000 to $24,999 | 0 (0.0%) | 0 (0.0%) |
| $25,000 to $34,999 | 15 (4.0%) | 0 (0.0%) |
| $35,000 to $49,999 | 0 (0.0%) | 60 (75.9%) |
| $50,000 to $74,999 | 61 (16.4%) | 0 (0.0%) |
| $75,000 to $99,999 | 37 (10.0%) | 0 (0.0%) |
| $100,000 to $149,999 | 41 (11.1%) | 0 (0.0%) |
| $150,000 or more | 132 (35.6%) | 0 (0.0%) |
| Total | 371 (100.0%) | 79 (100.0%) |
Monthly Housing Cost Tiers in Terrebonne
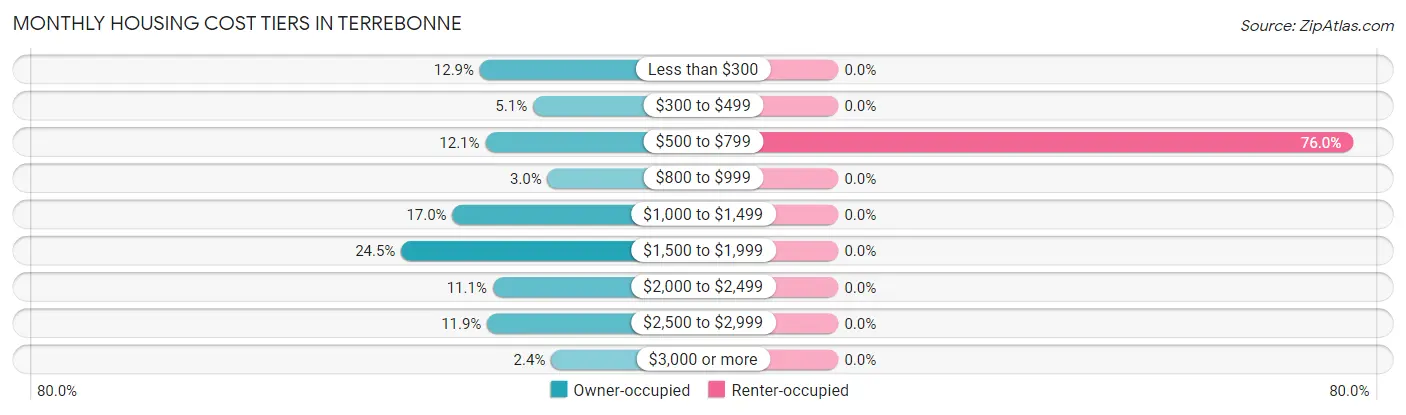
| Monthly Cost | Owner-occupied | Renter-occupied |
| Less than $300 | 48 (12.9%) | 0 (0.0%) |
| $300 to $499 | 19 (5.1%) | 0 (0.0%) |
| $500 to $799 | 45 (12.1%) | 60 (75.9%) |
| $800 to $999 | 11 (3.0%) | 0 (0.0%) |
| $1,000 to $1,499 | 63 (17.0%) | 0 (0.0%) |
| $1,500 to $1,999 | 91 (24.5%) | 0 (0.0%) |
| $2,000 to $2,499 | 41 (11.1%) | 0 (0.0%) |
| $2,500 to $2,999 | 44 (11.9%) | 0 (0.0%) |
| $3,000 or more | 9 (2.4%) | 0 (0.0%) |
| Total | 371 (100.0%) | 79 (100.0%) |
Physical Housing Characteristics in Terrebonne
Housing Structures in Terrebonne
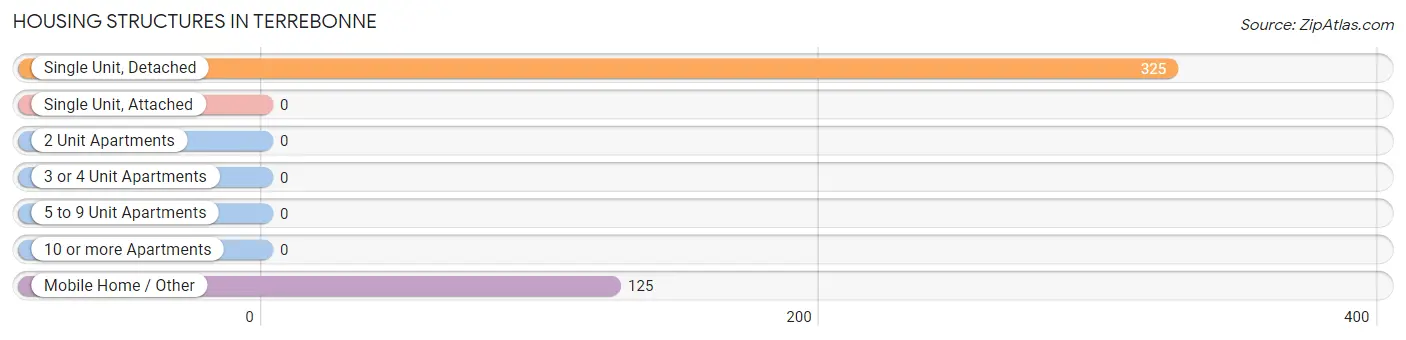
| Structure Type | # Housing Units | % Housing Units |
| Single Unit, Detached | 325 | 72.2% |
| Single Unit, Attached | 0 | 0.0% |
| 2 Unit Apartments | 0 | 0.0% |
| 3 or 4 Unit Apartments | 0 | 0.0% |
| 5 to 9 Unit Apartments | 0 | 0.0% |
| 10 or more Apartments | 0 | 0.0% |
| Mobile Home / Other | 125 | 27.8% |
| Total | 450 | 100.0% |
Housing Structures by Occupancy in Terrebonne
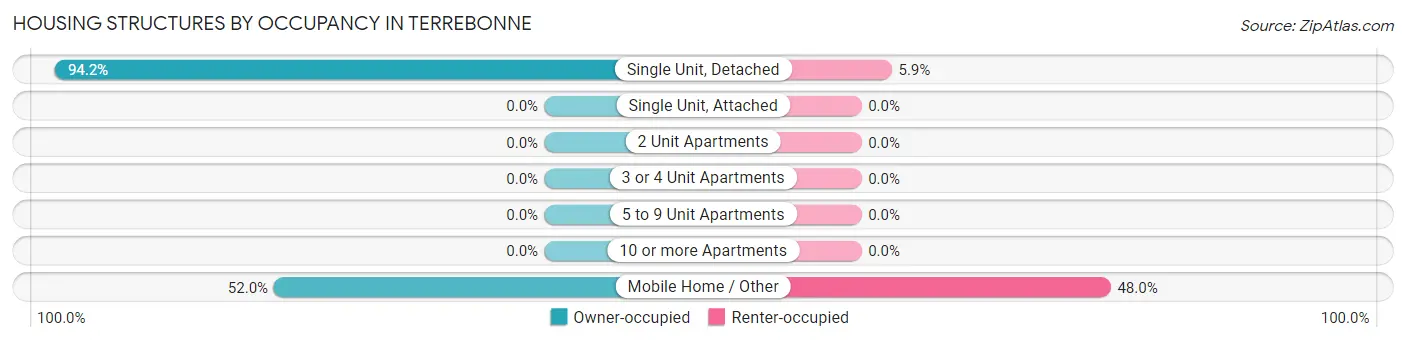
| Structure Type | Owner-occupied | Renter-occupied |
| Single Unit, Detached | 306 (94.2%) | 19 (5.9%) |
| Single Unit, Attached | 0 (0.0%) | 0 (0.0%) |
| 2 Unit Apartments | 0 (0.0%) | 0 (0.0%) |
| 3 or 4 Unit Apartments | 0 (0.0%) | 0 (0.0%) |
| 5 to 9 Unit Apartments | 0 (0.0%) | 0 (0.0%) |
| 10 or more Apartments | 0 (0.0%) | 0 (0.0%) |
| Mobile Home / Other | 65 (52.0%) | 60 (48.0%) |
| Total | 371 (82.4%) | 79 (17.6%) |
Housing Structures by Number of Rooms in Terrebonne
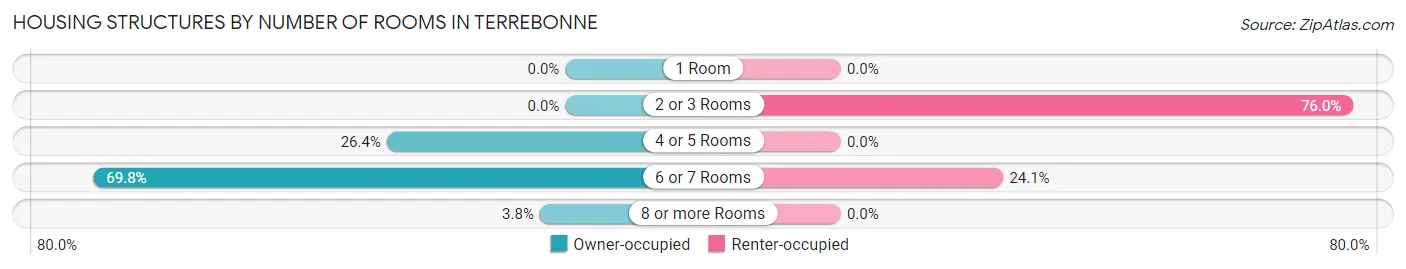
| Number of Rooms | Owner-occupied | Renter-occupied |
| 1 Room | 0 (0.0%) | 0 (0.0%) |
| 2 or 3 Rooms | 0 (0.0%) | 60 (75.9%) |
| 4 or 5 Rooms | 98 (26.4%) | 0 (0.0%) |
| 6 or 7 Rooms | 259 (69.8%) | 19 (24.0%) |
| 8 or more Rooms | 14 (3.8%) | 0 (0.0%) |
| Total | 371 (100.0%) | 79 (100.0%) |
Housing Structure by Heating Type in Terrebonne
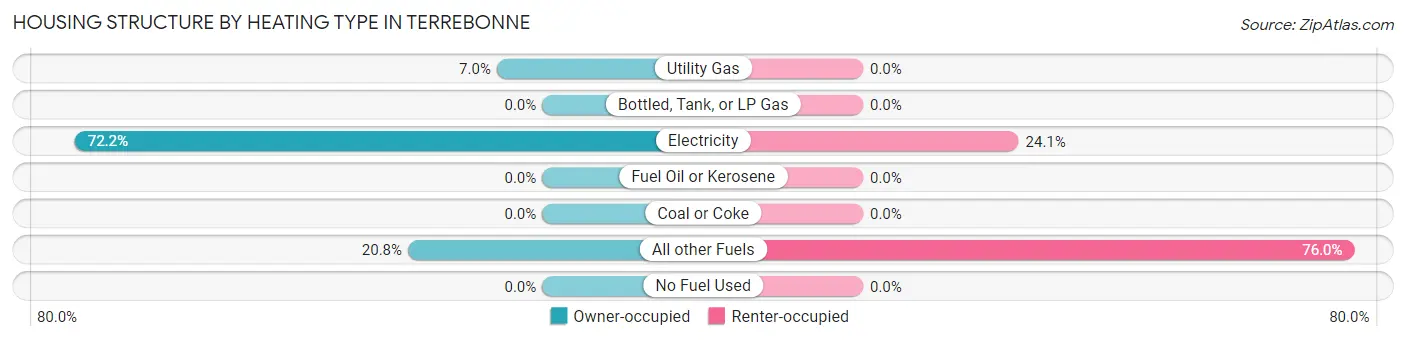
| Heating Type | Owner-occupied | Renter-occupied |
| Utility Gas | 26 (7.0%) | 0 (0.0%) |
| Bottled, Tank, or LP Gas | 0 (0.0%) | 0 (0.0%) |
| Electricity | 268 (72.2%) | 19 (24.0%) |
| Fuel Oil or Kerosene | 0 (0.0%) | 0 (0.0%) |
| Coal or Coke | 0 (0.0%) | 0 (0.0%) |
| All other Fuels | 77 (20.7%) | 60 (75.9%) |
| No Fuel Used | 0 (0.0%) | 0 (0.0%) |
| Total | 371 (100.0%) | 79 (100.0%) |
Household Vehicle Usage in Terrebonne
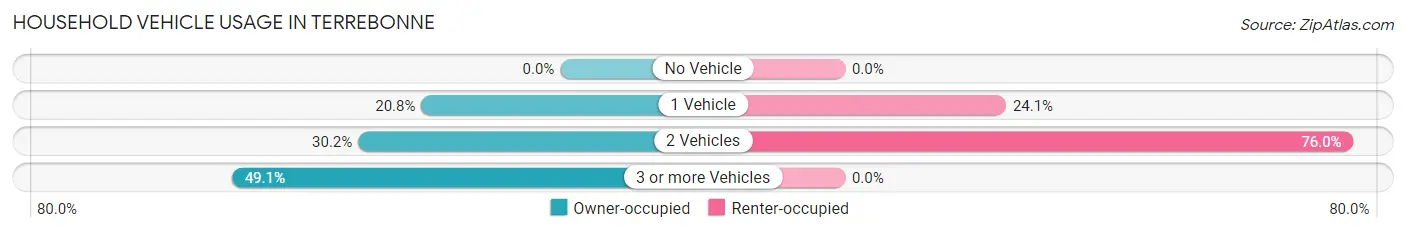
| Vehicles per Household | Owner-occupied | Renter-occupied |
| No Vehicle | 0 (0.0%) | 0 (0.0%) |
| 1 Vehicle | 77 (20.7%) | 19 (24.0%) |
| 2 Vehicles | 112 (30.2%) | 60 (75.9%) |
| 3 or more Vehicles | 182 (49.1%) | 0 (0.0%) |
| Total | 371 (100.0%) | 79 (100.0%) |
Real Estate & Mortgages in Terrebonne
Real Estate and Mortgage Overview in Terrebonne
| Characteristic | Without Mortgage | With Mortgage |
| Housing Units | 123 | 248 |
| Median Property Value | - | - |
| Median Household Income | - | - |
| Monthly Housing Costs | $471 | $9 |
| Real Estate Taxes | $3,120 | $0 |
Property Value by Mortgage Status in Terrebonne
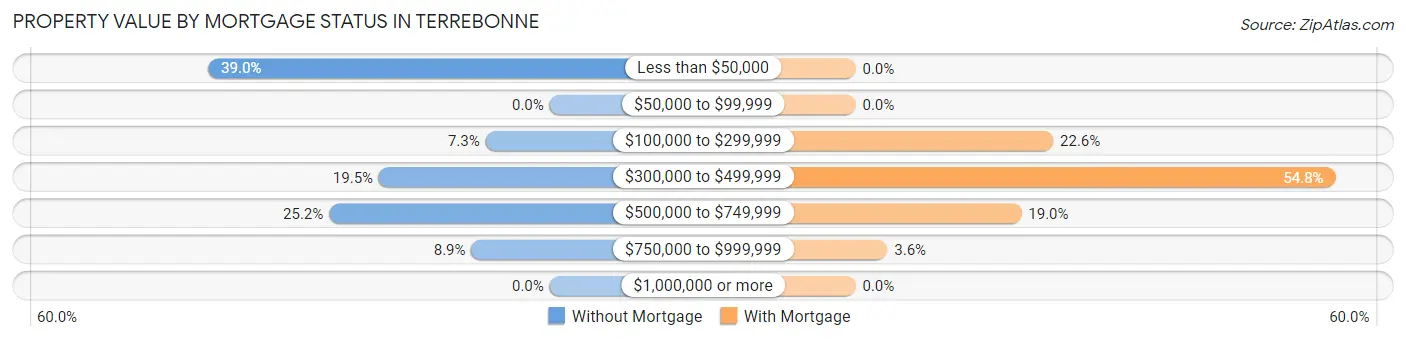
| Property Value | Without Mortgage | With Mortgage |
| Less than $50,000 | 48 (39.0%) | 0 (0.0%) |
| $50,000 to $99,999 | 0 (0.0%) | 0 (0.0%) |
| $100,000 to $299,999 | 9 (7.3%) | 56 (22.6%) |
| $300,000 to $499,999 | 24 (19.5%) | 136 (54.8%) |
| $500,000 to $749,999 | 31 (25.2%) | 47 (19.0%) |
| $750,000 to $999,999 | 11 (8.9%) | 9 (3.6%) |
| $1,000,000 or more | 0 (0.0%) | 0 (0.0%) |
| Total | 123 (100.0%) | 248 (100.0%) |
Household Income by Mortgage Status in Terrebonne
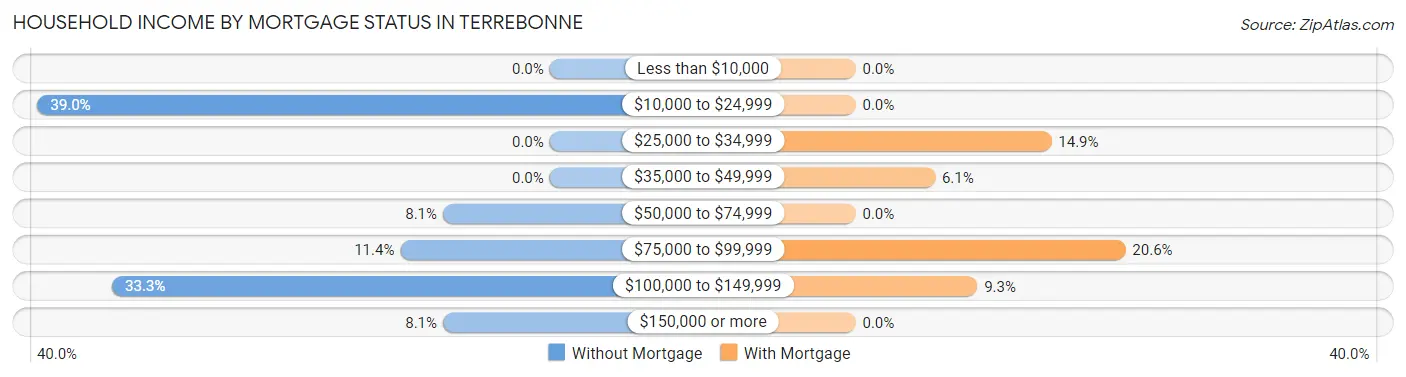
| Household Income | Without Mortgage | With Mortgage |
| Less than $10,000 | 0 (0.0%) | 0 (0.0%) |
| $10,000 to $24,999 | 48 (39.0%) | 0 (0.0%) |
| $25,000 to $34,999 | 0 (0.0%) | 37 (14.9%) |
| $35,000 to $49,999 | 0 (0.0%) | 15 (6.0%) |
| $50,000 to $74,999 | 10 (8.1%) | 0 (0.0%) |
| $75,000 to $99,999 | 14 (11.4%) | 51 (20.6%) |
| $100,000 to $149,999 | 41 (33.3%) | 23 (9.3%) |
| $150,000 or more | 10 (8.1%) | 0 (0.0%) |
| Total | 123 (100.0%) | 248 (100.0%) |
Property Value to Household Income Ratio in Terrebonne
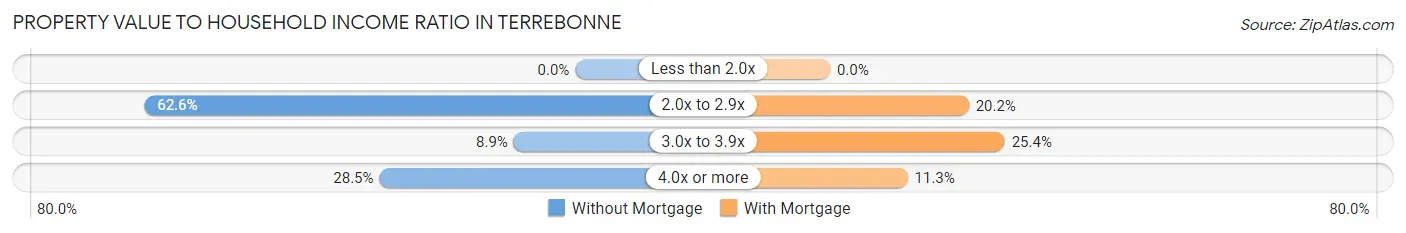
| Value-to-Income Ratio | Without Mortgage | With Mortgage |
| Less than 2.0x | 0 (0.0%) | 0 (0.0%) |
| 2.0x to 2.9x | 77 (62.6%) | 50 (20.2%) |
| 3.0x to 3.9x | 11 (8.9%) | 63 (25.4%) |
| 4.0x or more | 35 (28.5%) | 28 (11.3%) |
| Total | 123 (100.0%) | 248 (100.0%) |
Real Estate Taxes by Mortgage Status in Terrebonne
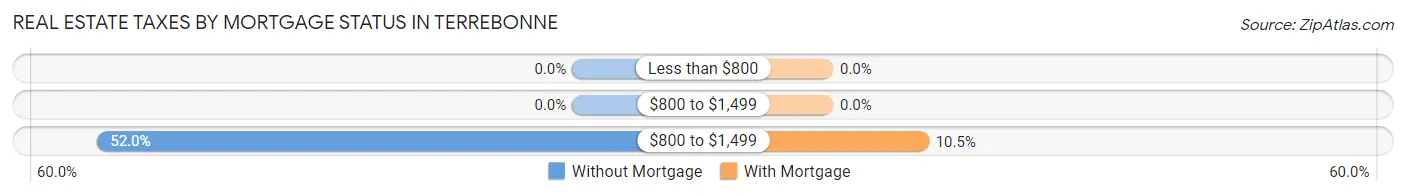
| Property Taxes | Without Mortgage | With Mortgage |
| Less than $800 | 0 (0.0%) | 0 (0.0%) |
| $800 to $1,499 | 0 (0.0%) | 0 (0.0%) |
| $800 to $1,499 | 64 (52.0%) | 26 (10.5%) |
| Total | 123 (100.0%) | 248 (100.0%) |
Health & Disability in Terrebonne
Health Insurance Coverage by Age in Terrebonne
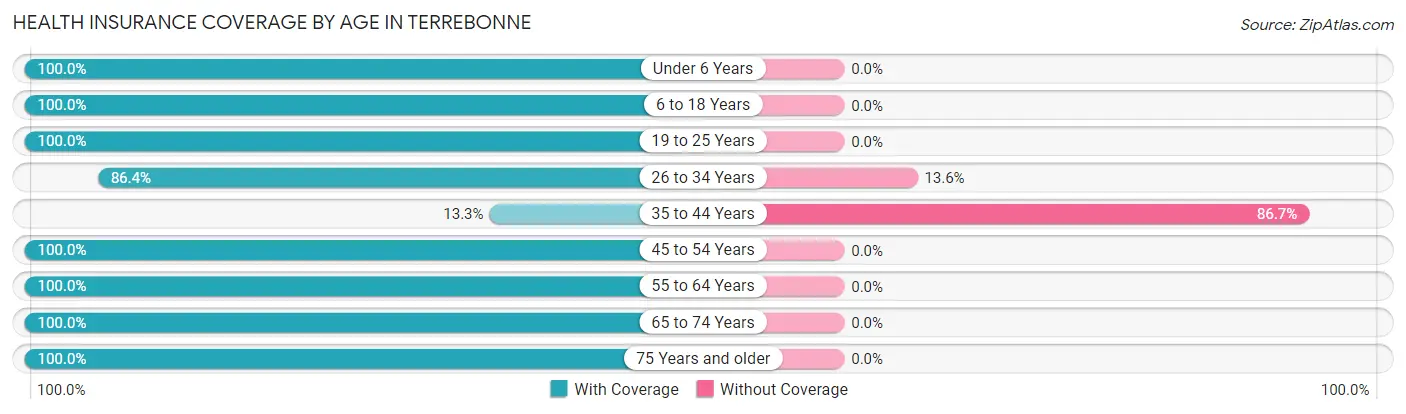
| Age Bracket | With Coverage | Without Coverage |
| Under 6 Years | 137 (100.0%) | 0 (0.0%) |
| 6 to 18 Years | 176 (100.0%) | 0 (0.0%) |
| 19 to 25 Years | 133 (100.0%) | 0 (0.0%) |
| 26 to 34 Years | 38 (86.4%) | 6 (13.6%) |
| 35 to 44 Years | 26 (13.3%) | 169 (86.7%) |
| 45 to 54 Years | 93 (100.0%) | 0 (0.0%) |
| 55 to 64 Years | 255 (100.0%) | 0 (0.0%) |
| 65 to 74 Years | 153 (100.0%) | 0 (0.0%) |
| 75 Years and older | 62 (100.0%) | 0 (0.0%) |
| Total | 1,073 (86.0%) | 175 (14.0%) |
Health Insurance Coverage by Citizenship Status in Terrebonne
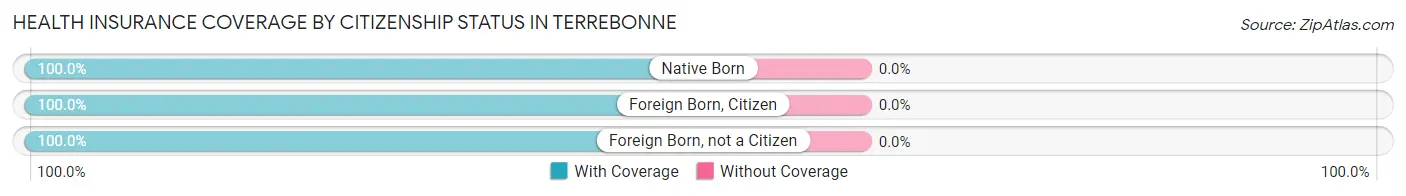
| Citizenship Status | With Coverage | Without Coverage |
| Native Born | 137 (100.0%) | 0 (0.0%) |
| Foreign Born, Citizen | 176 (100.0%) | 0 (0.0%) |
| Foreign Born, not a Citizen | 133 (100.0%) | 0 (0.0%) |
Health Insurance Coverage by Household Income in Terrebonne
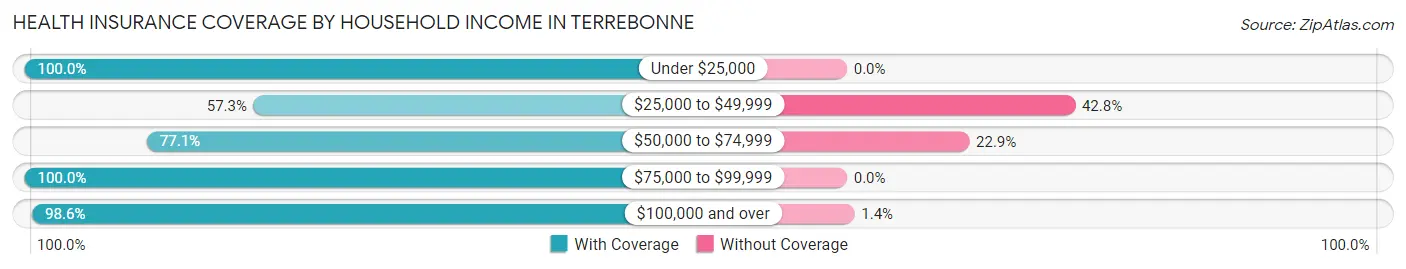
| Household Income | With Coverage | Without Coverage |
| Under $25,000 | 125 (100.0%) | 0 (0.0%) |
| $25,000 to $49,999 | 75 (57.3%) | 56 (42.7%) |
| $50,000 to $74,999 | 380 (77.1%) | 113 (22.9%) |
| $75,000 to $99,999 | 75 (100.0%) | 0 (0.0%) |
| $100,000 and over | 418 (98.6%) | 6 (1.4%) |
Public vs Private Health Insurance Coverage by Age in Terrebonne
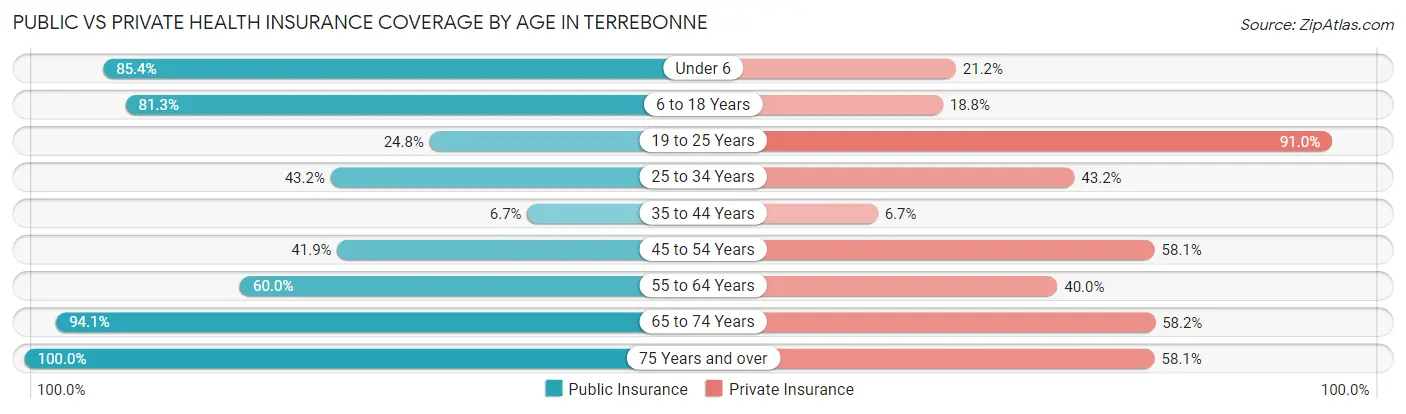
| Age Bracket | Public Insurance | Private Insurance |
| Under 6 | 117 (85.4%) | 29 (21.2%) |
| 6 to 18 Years | 143 (81.2%) | 33 (18.8%) |
| 19 to 25 Years | 33 (24.8%) | 121 (91.0%) |
| 25 to 34 Years | 19 (43.2%) | 19 (43.2%) |
| 35 to 44 Years | 13 (6.7%) | 13 (6.7%) |
| 45 to 54 Years | 39 (41.9%) | 54 (58.1%) |
| 55 to 64 Years | 153 (60.0%) | 102 (40.0%) |
| 65 to 74 Years | 144 (94.1%) | 89 (58.2%) |
| 75 Years and over | 62 (100.0%) | 36 (58.1%) |
| Total | 723 (57.9%) | 496 (39.7%) |
Disability Status by Sex by Age in Terrebonne
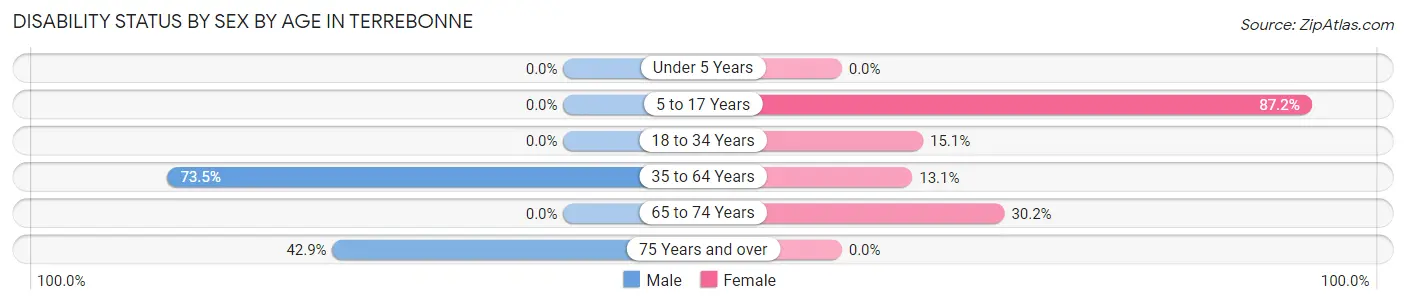
| Age Bracket | Male | Female |
| Under 5 Years | 0 (0.0%) | 0 (0.0%) |
| 5 to 17 Years | 0 (0.0%) | 68 (87.2%) |
| 18 to 34 Years | 0 (0.0%) | 19 (15.1%) |
| 35 to 64 Years | 180 (73.5%) | 39 (13.1%) |
| 65 to 74 Years | 0 (0.0%) | 32 (30.2%) |
| 75 Years and over | 12 (42.9%) | 0 (0.0%) |
Disability Class by Sex by Age in Terrebonne
Disability Class: Hearing Difficulty
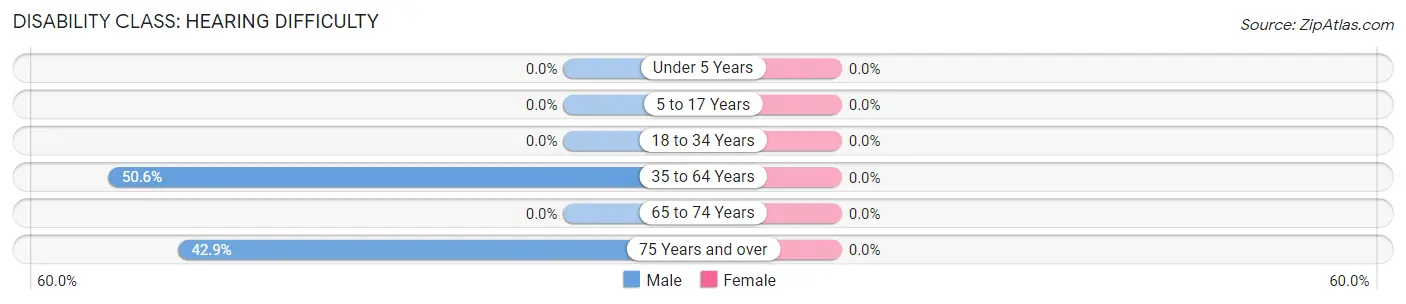
| Age Bracket | Male | Female |
| Under 5 Years | 0 (0.0%) | 0 (0.0%) |
| 5 to 17 Years | 0 (0.0%) | 0 (0.0%) |
| 18 to 34 Years | 0 (0.0%) | 0 (0.0%) |
| 35 to 64 Years | 124 (50.6%) | 0 (0.0%) |
| 65 to 74 Years | 0 (0.0%) | 0 (0.0%) |
| 75 Years and over | 12 (42.9%) | 0 (0.0%) |
Disability Class: Vision Difficulty
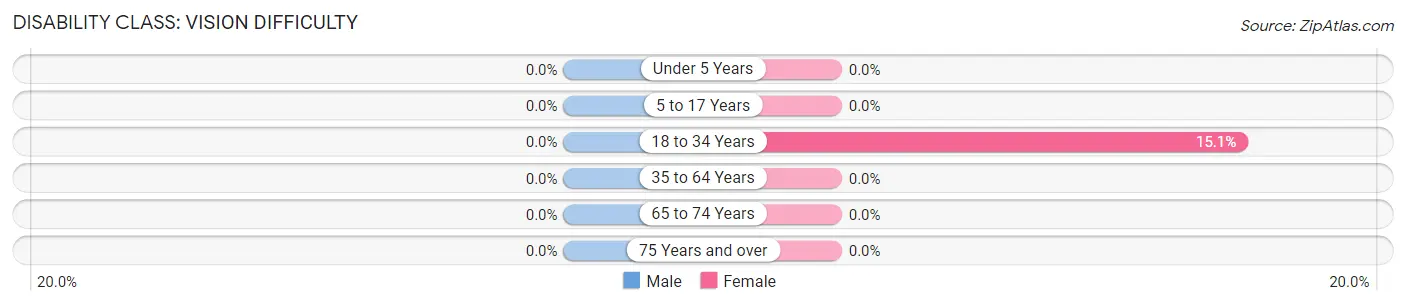
| Age Bracket | Male | Female |
| Under 5 Years | 0 (0.0%) | 0 (0.0%) |
| 5 to 17 Years | 0 (0.0%) | 0 (0.0%) |
| 18 to 34 Years | 0 (0.0%) | 19 (15.1%) |
| 35 to 64 Years | 0 (0.0%) | 0 (0.0%) |
| 65 to 74 Years | 0 (0.0%) | 0 (0.0%) |
| 75 Years and over | 0 (0.0%) | 0 (0.0%) |
Disability Class: Cognitive Difficulty
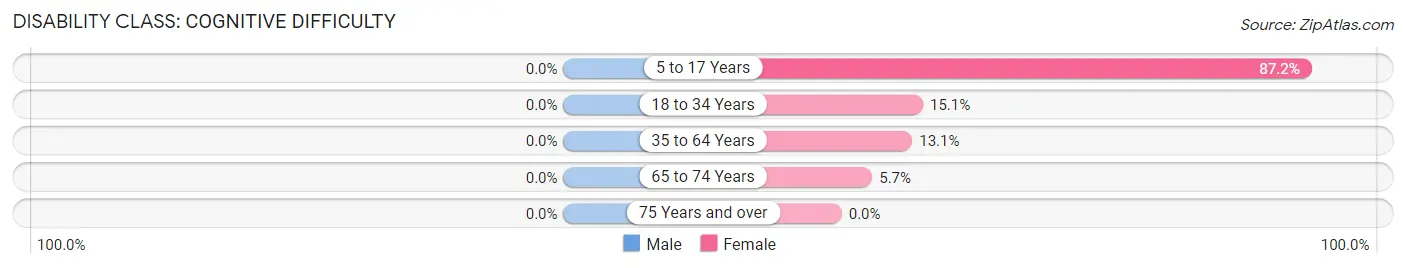
| Age Bracket | Male | Female |
| 5 to 17 Years | 0 (0.0%) | 68 (87.2%) |
| 18 to 34 Years | 0 (0.0%) | 19 (15.1%) |
| 35 to 64 Years | 0 (0.0%) | 39 (13.1%) |
| 65 to 74 Years | 0 (0.0%) | 6 (5.7%) |
| 75 Years and over | 0 (0.0%) | 0 (0.0%) |
Disability Class: Ambulatory Difficulty
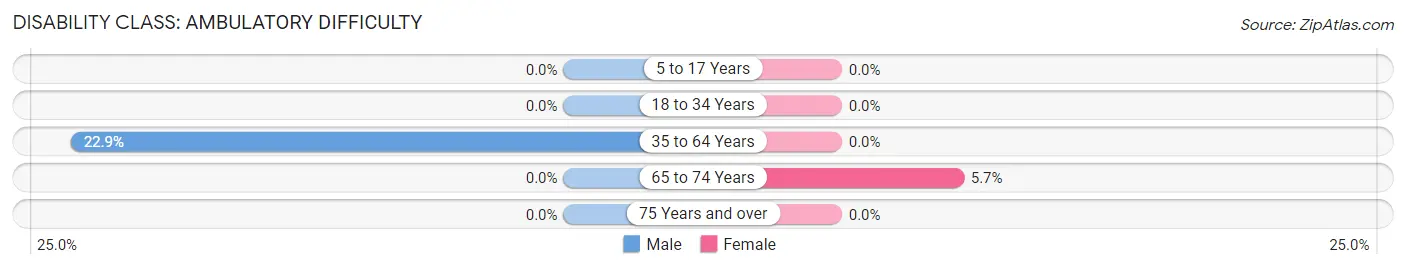
| Age Bracket | Male | Female |
| 5 to 17 Years | 0 (0.0%) | 0 (0.0%) |
| 18 to 34 Years | 0 (0.0%) | 0 (0.0%) |
| 35 to 64 Years | 56 (22.9%) | 0 (0.0%) |
| 65 to 74 Years | 0 (0.0%) | 6 (5.7%) |
| 75 Years and over | 0 (0.0%) | 0 (0.0%) |
Disability Class: Self-Care Difficulty
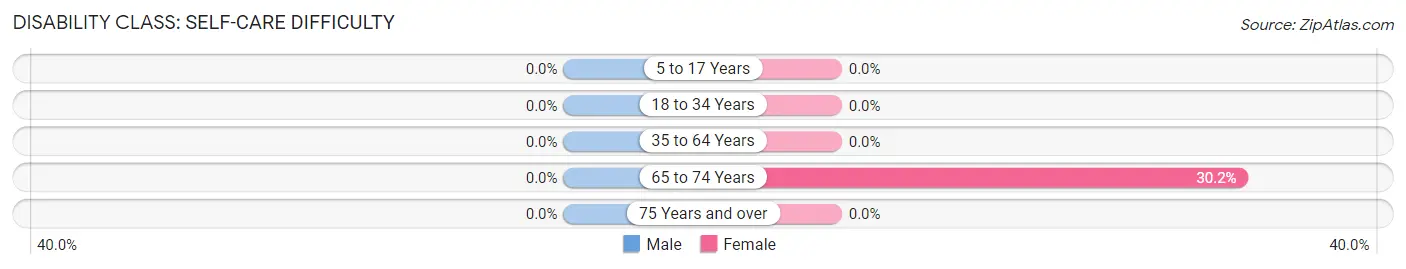
| Age Bracket | Male | Female |
| 5 to 17 Years | 0 (0.0%) | 0 (0.0%) |
| 18 to 34 Years | 0 (0.0%) | 0 (0.0%) |
| 35 to 64 Years | 0 (0.0%) | 0 (0.0%) |
| 65 to 74 Years | 0 (0.0%) | 32 (30.2%) |
| 75 Years and over | 0 (0.0%) | 0 (0.0%) |
Technology Access in Terrebonne
Computing Device Access in Terrebonne
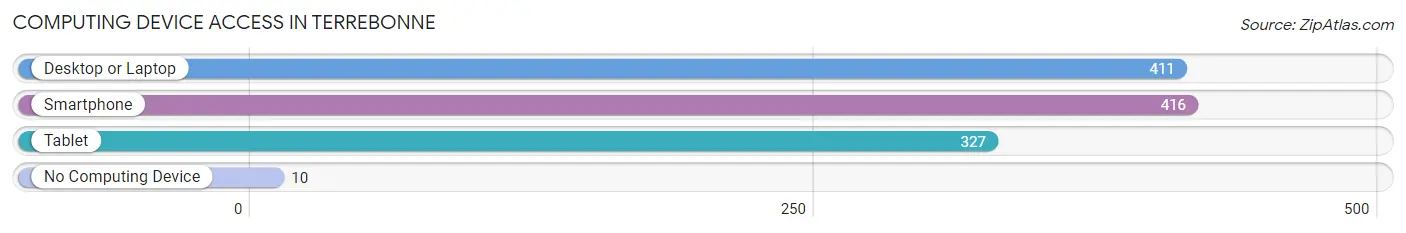
| Device Type | # Households | % Households |
| Desktop or Laptop | 411 | 91.3% |
| Smartphone | 416 | 92.4% |
| Tablet | 327 | 72.7% |
| No Computing Device | 10 | 2.2% |
| Total | 450 | 100.0% |
Internet Access in Terrebonne
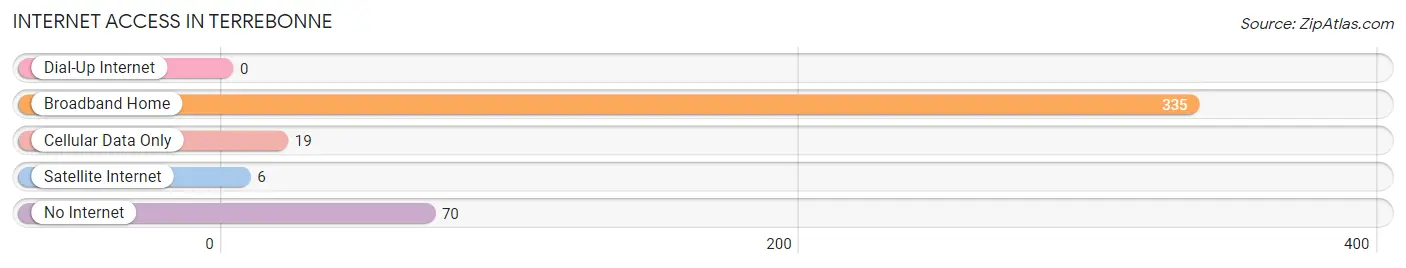
| Internet Type | # Households | % Households |
| Dial-Up Internet | 0 | 0.0% |
| Broadband Home | 335 | 74.4% |
| Cellular Data Only | 19 | 4.2% |
| Satellite Internet | 6 | 1.3% |
| No Internet | 70 | 15.6% |
| Total | 450 | 100.0% |
Terrebonne Summary
Terrebonne is a small unincorporated community located in Deschutes County, Oregon, United States. It is situated in the foothills of the Cascade Mountains, approximately 10 miles (16 km) northwest of Redmond and 20 miles (32 km) northeast of Bend. The population of Terrebonne was estimated to be 1,845 in 2019.
History
The area that is now Terrebonne was originally inhabited by the Northern Paiute people. The first non-native settlers arrived in the area in the late 1800s, and the town was officially established in 1891. The name Terrebonne is derived from the French phrase terre bonne, which means “good land.”
The town was initially a farming and ranching community, but in the early 1900s, the lumber industry began to take off. The town was home to several sawmills, and the lumber industry was the primary source of employment for many of the town’s residents.
In the 1950s, the lumber industry began to decline, and the town’s economy shifted to focus on tourism. The town is now home to several wineries, breweries, and distilleries, as well as a variety of outdoor recreation activities.
Geography
Terrebonne is located in the foothills of the Cascade Mountains, approximately 10 miles (16 km) northwest of Redmond and 20 miles (32 km) northeast of Bend. The town is situated at an elevation of 2,845 feet (867 m).
The terrain around Terrebonne is mostly flat, with some rolling hills. The area is covered in a mix of grassland, sagebrush, and juniper trees. The nearby Deschutes River provides a source of water for the town.
Economy
The economy of Terrebonne is largely based on tourism. The town is home to several wineries, breweries, and distilleries, as well as a variety of outdoor recreation activities. The nearby Deschutes River provides a source of water for the town, and is popular for fishing, rafting, and kayaking.
The town is also home to several small businesses, including restaurants, shops, and galleries. The town is also home to a number of small farms and ranches, which produce a variety of crops and livestock.
Demographics
As of 2019, the population of Terrebonne was estimated to be 1,845. The town is predominantly white (93.3%), with a small Hispanic population (3.2%). The median household income in Terrebonne is $50,945, and the median home value is $269,400. The town has a low unemployment rate (3.2%) and a high rate of homeownership (77.2%).
Common Questions
What is Per Capita Income in Terrebonne?
Per Capita income in Terrebonne is $40,323.
What is the Median Family Income in Terrebonne?
Median Family Income in Terrebonne is $123,690.
What is the Median Household income in Terrebonne?
Median Household Income in Terrebonne is $70,526.
What is Inequality or Gini Index in Terrebonne?
Inequality or Gini Index in Terrebonne is 0.50.
What is the Total Population of Terrebonne?
Total Population of Terrebonne is 1,298.
What is the Total Male Population of Terrebonne?
Total Male Population of Terrebonne is 539.
What is the Total Female Population of Terrebonne?
Total Female Population of Terrebonne is 759.
What is the Ratio of Males per 100 Females in Terrebonne?
There are 71.01 Males per 100 Females in Terrebonne.
What is the Ratio of Females per 100 Males in Terrebonne?
There are 140.82 Females per 100 Males in Terrebonne.
What is the Median Population Age in Terrebonne?
Median Population Age in Terrebonne is 38.7 Years.
What is the Average Family Size in Terrebonne
Average Family Size in Terrebonne is 3.5 People.
What is the Average Household Size in Terrebonne
Average Household Size in Terrebonne is 2.9 People.
How Large is the Labor Force in Terrebonne?
There are 727 People in the Labor Forcein in Terrebonne.
What is the Percentage of People in the Labor Force in Terrebonne?
69.2% of People are in the Labor Force in Terrebonne.
What is the Unemployment Rate in Terrebonne?
Unemployment Rate in Terrebonne is 26.3%.