Napeague, NY Map & Demographics
Napeague Map
Napeague Overview
$29,047
PER CAPITA INCOME
$80,240
AVG FAMILY INCOME
$80,865
AVG HOUSEHOLD INCOME
0.12
INEQUALITY / GINI INDEX
154
TOTAL POPULATION
77
MALE POPULATION
77
FEMALE POPULATION
100.00
MALES / 100 FEMALES
100.00
FEMALES / 100 MALES
45.5
MEDIAN AGE
3.0
AVG FAMILY SIZE
2.6
AVG HOUSEHOLD SIZE
83
LABOR FORCE [ PEOPLE ]
70.3%
PERCENT IN LABOR FORCE
Income in Napeague
Income Overview in Napeague
Per Capita Income in Napeague is $29,047, while median incomes of families and households are $80,240 and $80,865 respectively.
| Characteristic | Number | Measure |
| Per Capita Income | 154 | $29,047 |
| Median Family Income | 47 | $80,240 |
| Mean Family Income | 47 | $73,623 |
| Median Household Income | 60 | $80,865 |
| Mean Household Income | 60 | $81,785 |
| Income Deficit | 47 | $0 |
| Wage / Income Gap (%) | 154 | 0.00% |
| Wage / Income Gap ($) | 154 | 100.00¢ per $1 |
| Gini / Inequality Index | 154 | 0.12 |
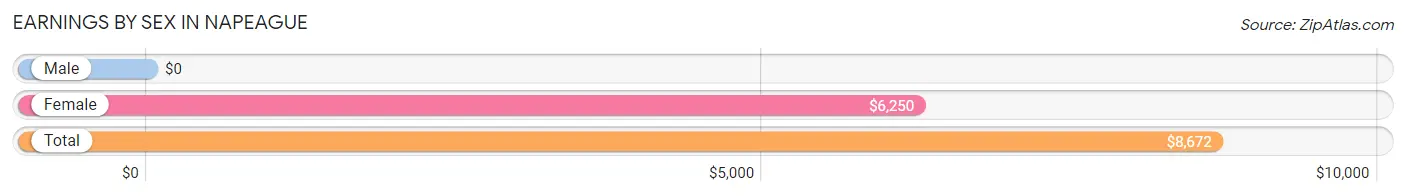
Earnings by Sex in Napeague
| Sex | Number | Average Earnings |
| Male | 41 (41.4%) | $0 |
| Female | 58 (58.6%) | $6,250 |
| Total | 99 (100.0%) | $8,672 |
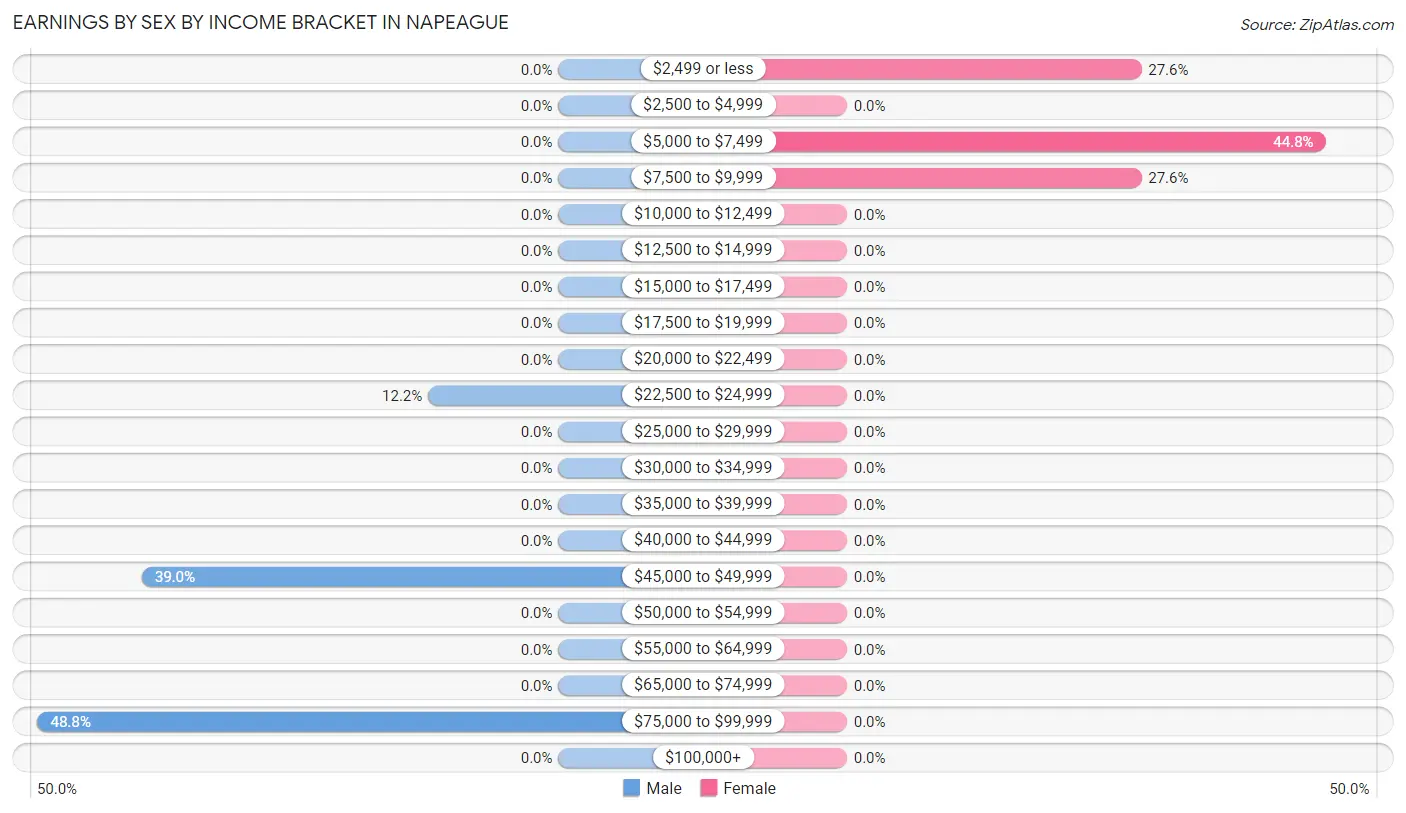
Earnings by Sex by Income Bracket in Napeague
The most common earnings brackets in Napeague are $75,000 to $99,999 for men (20 | 48.8%) and $5,000 to $7,499 for women (26 | 44.8%).
| Income | Male | Female |
| $2,499 or less | 0 (0.0%) | 16 (27.6%) |
| $2,500 to $4,999 | 0 (0.0%) | 0 (0.0%) |
| $5,000 to $7,499 | 0 (0.0%) | 26 (44.8%) |
| $7,500 to $9,999 | 0 (0.0%) | 16 (27.6%) |
| $10,000 to $12,499 | 0 (0.0%) | 0 (0.0%) |
| $12,500 to $14,999 | 0 (0.0%) | 0 (0.0%) |
| $15,000 to $17,499 | 0 (0.0%) | 0 (0.0%) |
| $17,500 to $19,999 | 0 (0.0%) | 0 (0.0%) |
| $20,000 to $22,499 | 0 (0.0%) | 0 (0.0%) |
| $22,500 to $24,999 | 5 (12.2%) | 0 (0.0%) |
| $25,000 to $29,999 | 0 (0.0%) | 0 (0.0%) |
| $30,000 to $34,999 | 0 (0.0%) | 0 (0.0%) |
| $35,000 to $39,999 | 0 (0.0%) | 0 (0.0%) |
| $40,000 to $44,999 | 0 (0.0%) | 0 (0.0%) |
| $45,000 to $49,999 | 16 (39.0%) | 0 (0.0%) |
| $50,000 to $54,999 | 0 (0.0%) | 0 (0.0%) |
| $55,000 to $64,999 | 0 (0.0%) | 0 (0.0%) |
| $65,000 to $74,999 | 0 (0.0%) | 0 (0.0%) |
| $75,000 to $99,999 | 20 (48.8%) | 0 (0.0%) |
| $100,000+ | 0 (0.0%) | 0 (0.0%) |
| Total | 41 (100.0%) | 58 (100.0%) |
Earnings by Sex by Educational Attainment in Napeague
| Educational Attainment | Male Income | Female Income |
| Less than High School | - | - |
| High School Diploma | - | - |
| College or Associate's Degree | - | - |
| Bachelor's Degree | - | - |
| Graduate Degree | - | - |
| Total | - | - |
Family Income in Napeague
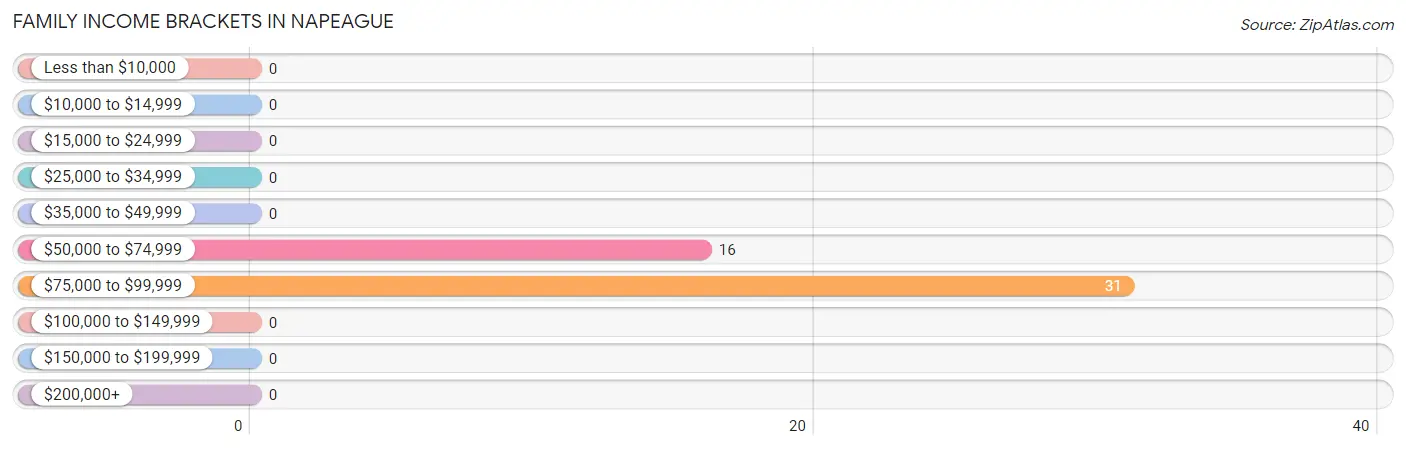
Family Income Brackets in Napeague
According to the Napeague family income data, there are 31 families falling into the $75,000 to $99,999 income range, which is the most common income bracket and makes up 66.0% of all families.
| Income Bracket | # Families | % Families |
| Less than $10,000 | 0 | 0.0% |
| $10,000 to $14,999 | 0 | 0.0% |
| $15,000 to $24,999 | 0 | 0.0% |
| $25,000 to $34,999 | 0 | 0.0% |
| $35,000 to $49,999 | 0 | 0.0% |
| $50,000 to $74,999 | 16 | 34.0% |
| $75,000 to $99,999 | 31 | 66.0% |
| $100,000 to $149,999 | 0 | 0.0% |
| $150,000 to $199,999 | 0 | 0.0% |
| $200,000+ | 0 | 0.0% |
Family Income by Famaliy Size in Napeague
| Income Bracket | # Families | Median Income |
| 2-Person Families | 5 (10.6%) | $0 |
| 3-Person Families | 16 (34.0%) | $0 |
| 4-Person Families | 26 (55.3%) | $0 |
| 5-Person Families | 0 (0.0%) | $0 |
| 6-Person Families | 0 (0.0%) | $0 |
| 7+ Person Families | 0 (0.0%) | $0 |
| Total | 47 (100.0%) | $80,240 |
Family Income by Number of Earners in Napeague
| Number of Earners | # Families | Median Income |
| No Earners | 0 (0.0%) | $0 |
| 1 Earner | 5 (10.6%) | $0 |
| 2 Earners | 26 (55.3%) | $0 |
| 3+ Earners | 16 (34.0%) | $0 |
| Total | 47 (100.0%) | $80,240 |
Household Income in Napeague
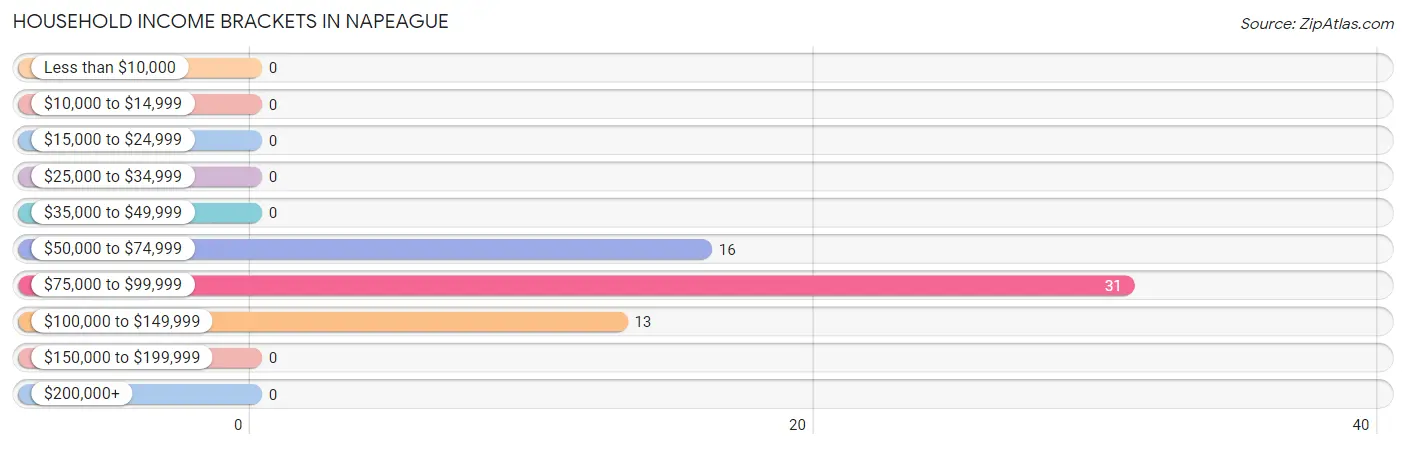
Household Income Brackets in Napeague
With 31 households falling in the category, the $75,000 to $99,999 income range is the most frequent in Napeague, accounting for 51.7% of all households.
| Income Bracket | # Households | % Households |
| Less than $10,000 | 0 | 0.0% |
| $10,000 to $14,999 | 0 | 0.0% |
| $15,000 to $24,999 | 0 | 0.0% |
| $25,000 to $34,999 | 0 | 0.0% |
| $35,000 to $49,999 | 0 | 0.0% |
| $50,000 to $74,999 | 16 | 26.7% |
| $75,000 to $99,999 | 31 | 51.7% |
| $100,000 to $149,999 | 13 | 21.7% |
| $150,000 to $199,999 | 0 | 0.0% |
| $200,000+ | 0 | 0.0% |
Household Income by Householder Age in Napeague
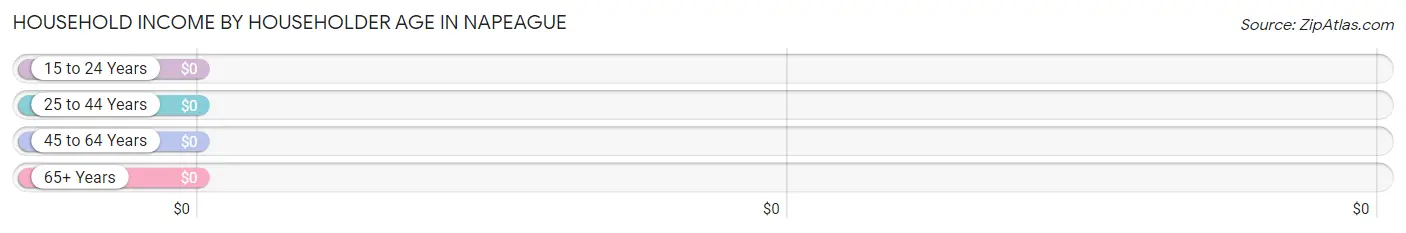
| Income Bracket | # Households | Median Income |
| 15 to 24 Years | 16 (26.7%) | $0 |
| 25 to 44 Years | 0 (0.0%) | $0 |
| 45 to 64 Years | 26 (43.3%) | $0 |
| 65+ Years | 18 (30.0%) | $0 |
| Total | 60 (100.0%) | $80,865 |
Poverty in Napeague
Income Below Poverty by Sex and Age in Napeague
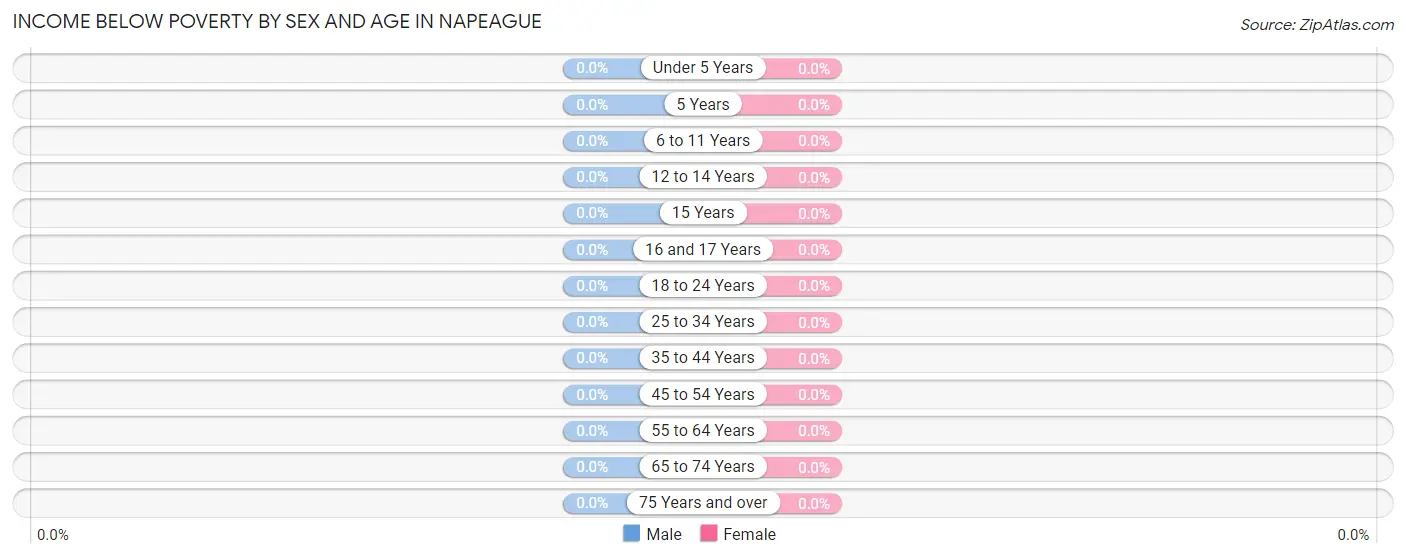
| Age Bracket | Male | Female |
| Under 5 Years | 0 (0.0%) | 0 (0.0%) |
| 5 Years | 0 (0.0%) | 0 (0.0%) |
| 6 to 11 Years | 0 (0.0%) | 0 (0.0%) |
| 12 to 14 Years | 0 (0.0%) | 0 (0.0%) |
| 15 Years | 0 (0.0%) | 0 (0.0%) |
| 16 and 17 Years | 0 (0.0%) | 0 (0.0%) |
| 18 to 24 Years | 0 (0.0%) | 0 (0.0%) |
| 25 to 34 Years | 0 (0.0%) | 0 (0.0%) |
| 35 to 44 Years | 0 (0.0%) | 0 (0.0%) |
| 45 to 54 Years | 0 (0.0%) | 0 (0.0%) |
| 55 to 64 Years | 0 (0.0%) | 0 (0.0%) |
| 65 to 74 Years | 0 (0.0%) | 0 (0.0%) |
| 75 Years and over | 0 (0.0%) | 0 (0.0%) |
| Total | 0 (0.0%) | 0 (0.0%) |
Income Above Poverty by Sex and Age in Napeague
According to the poverty statistics in Napeague, males aged 6 to 11 years and females aged 18 to 24 years are the age groups that are most secure financially, with 100.0% of males and 100.0% of females in these age groups living above the poverty line.
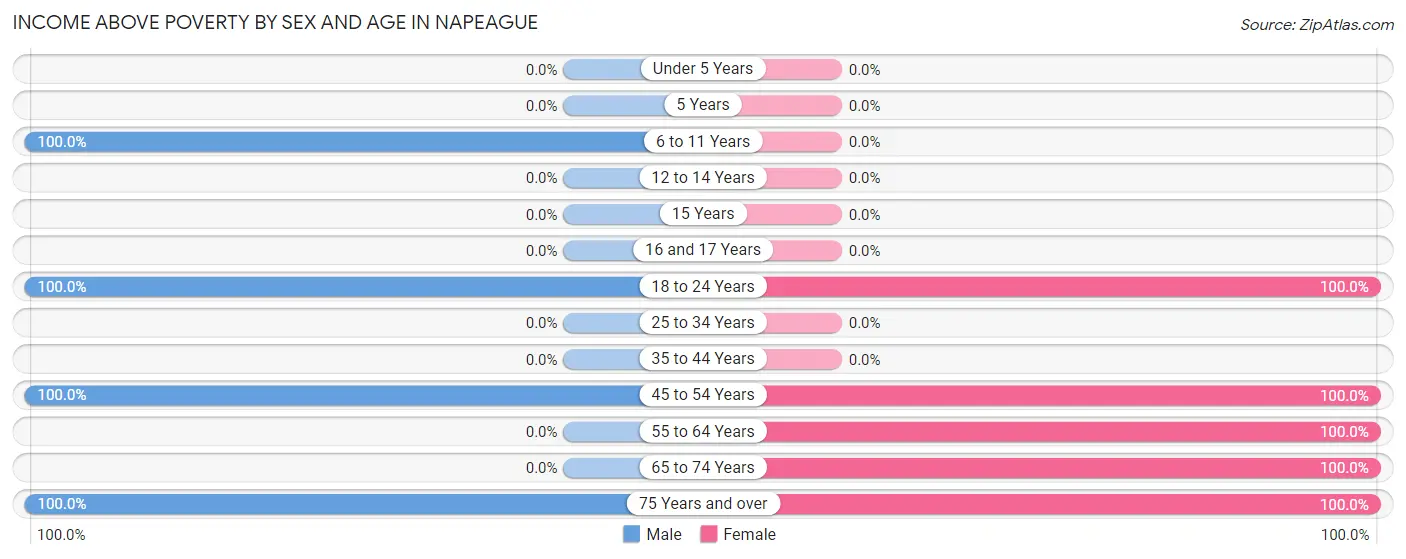
| Age Bracket | Male | Female |
| Under 5 Years | 0 (0.0%) | 0 (0.0%) |
| 5 Years | 0 (0.0%) | 0 (0.0%) |
| 6 to 11 Years | 36 (100.0%) | 0 (0.0%) |
| 12 to 14 Years | 0 (0.0%) | 0 (0.0%) |
| 15 Years | 0 (0.0%) | 0 (0.0%) |
| 16 and 17 Years | 0 (0.0%) | 0 (0.0%) |
| 18 to 24 Years | 16 (100.0%) | 16 (100.0%) |
| 25 to 34 Years | 0 (0.0%) | 0 (0.0%) |
| 35 to 44 Years | 0 (0.0%) | 0 (0.0%) |
| 45 to 54 Years | 20 (100.0%) | 26 (100.0%) |
| 55 to 64 Years | 0 (0.0%) | 16 (100.0%) |
| 65 to 74 Years | 0 (0.0%) | 13 (100.0%) |
| 75 Years and over | 5 (100.0%) | 6 (100.0%) |
| Total | 77 (100.0%) | 77 (100.0%) |
Income Below Poverty Among Married-Couple Families in Napeague
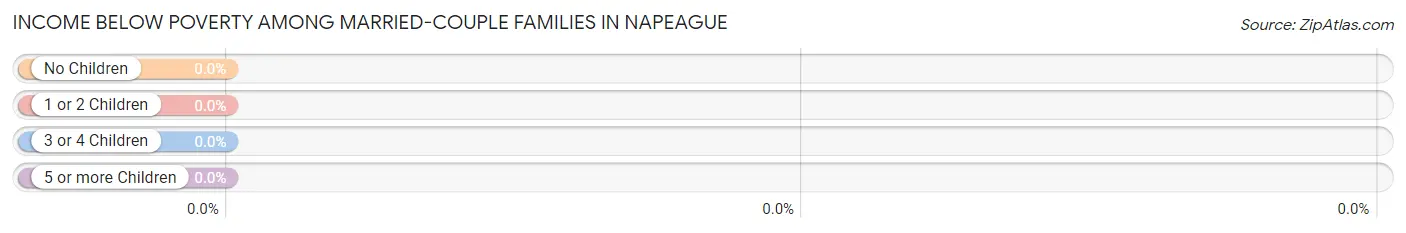
| Children | Above Poverty | Below Poverty |
| No Children | 5 (100.0%) | 0 (0.0%) |
| 1 or 2 Children | 26 (100.0%) | 0 (0.0%) |
| 3 or 4 Children | 0 (0.0%) | 0 (0.0%) |
| 5 or more Children | 0 (0.0%) | 0 (0.0%) |
| Total | 31 (100.0%) | 0 (0.0%) |
Income Below Poverty Among Single-Parent Households in Napeague
| Children | Single Father | Single Mother |
| No Children | 0 (0.0%) | 0 (0.0%) |
| 1 or 2 Children | 0 (0.0%) | 0 (0.0%) |
| 3 or 4 Children | 0 (0.0%) | 0 (0.0%) |
| 5 or more Children | 0 (0.0%) | 0 (0.0%) |
| Total | 0 (0.0%) | 0 (0.0%) |
Income Below Poverty Among Married-Couple vs Single-Parent Households in Napeague
| Children | Married-Couple Families | Single-Parent Households |
| No Children | 0 (0.0%) | 0 (0.0%) |
| 1 or 2 Children | 0 (0.0%) | 0 (0.0%) |
| 3 or 4 Children | 0 (0.0%) | 0 (0.0%) |
| 5 or more Children | 0 (0.0%) | 0 (0.0%) |
| Total | 0 (0.0%) | 0 (0.0%) |
Race in Napeague
The most populous races in Napeague are White / Caucasian (128 | 83.1%), Hispanic or Latino (48 | 31.2%), and Two or more Races (26 | 16.9%).
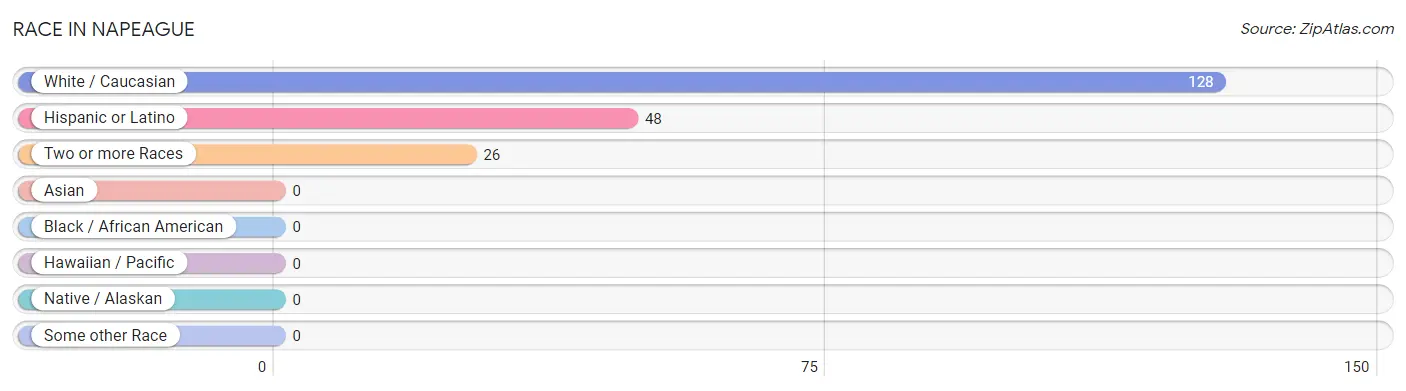
| Race | # Population | % Population |
| Asian | 0 | 0.0% |
| Black / African American | 0 | 0.0% |
| Hawaiian / Pacific | 0 | 0.0% |
| Hispanic or Latino | 48 | 31.2% |
| Native / Alaskan | 0 | 0.0% |
| White / Caucasian | 128 | 83.1% |
| Two or more Races | 26 | 16.9% |
| Some other Race | 0 | 0.0% |
| Total | 154 | 100.0% |
Ancestry in Napeague
The most populous ancestries reported in Napeague are German (62 | 40.3%), African (44 | 28.6%), Subsaharan African (44 | 28.6%), Italian (38 | 24.7%), and Mexican (32 | 20.8%), together accounting for 142.9% of all Napeague residents.
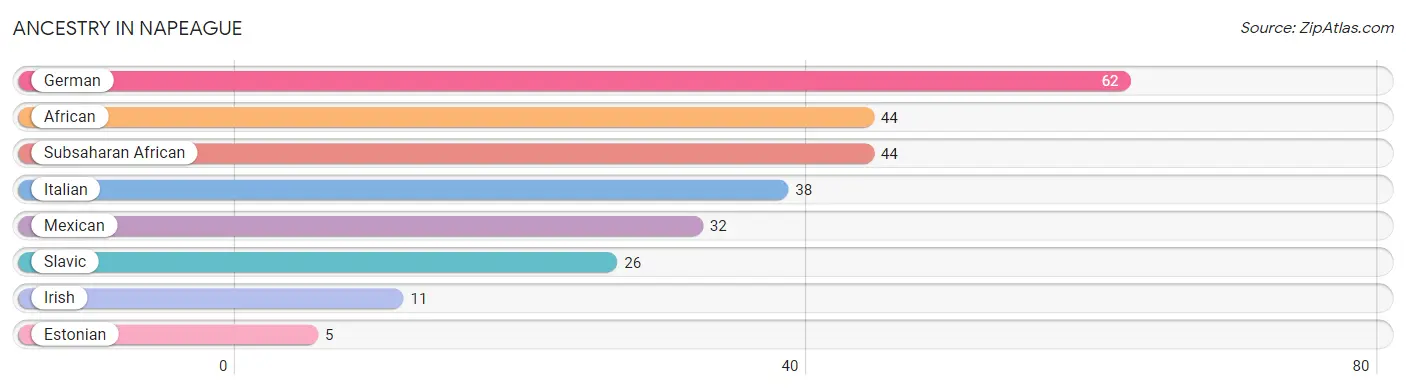
| Ancestry | # Population | % Population |
| African | 44 | 28.6% |
| Estonian | 5 | 3.3% |
| German | 62 | 40.3% |
| Irish | 11 | 7.1% |
| Italian | 38 | 24.7% |
| Mexican | 32 | 20.8% |
| Slavic | 26 | 16.9% |
| Subsaharan African | 44 | 28.6% | View All 8 Rows |
Immigrants in Napeague
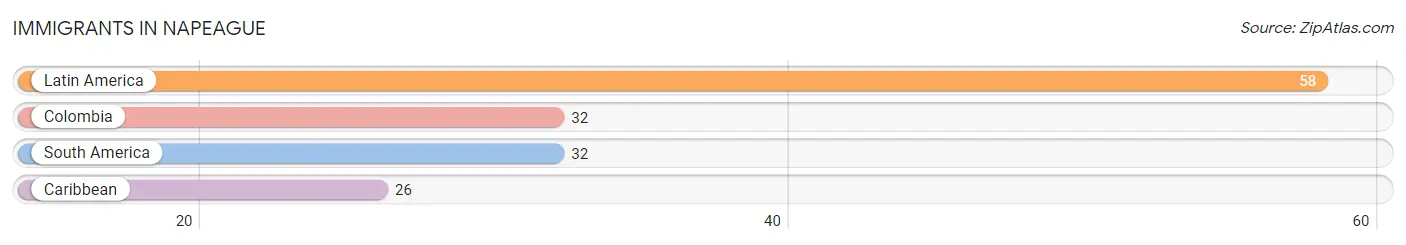
The most numerous immigrant groups reported in Napeague came from Latin America (58 | 37.7%), Colombia (32 | 20.8%), South America (32 | 20.8%), and Caribbean (26 | 16.9%), together accounting for 96.1% of all Napeague residents.
| Immigration Origin | # Population | % Population |
| Caribbean | 26 | 16.9% |
| Colombia | 32 | 20.8% |
| Latin America | 58 | 37.7% |
| South America | 32 | 20.8% | View All 4 Rows |
Sex and Age in Napeague
Sex and Age in Napeague
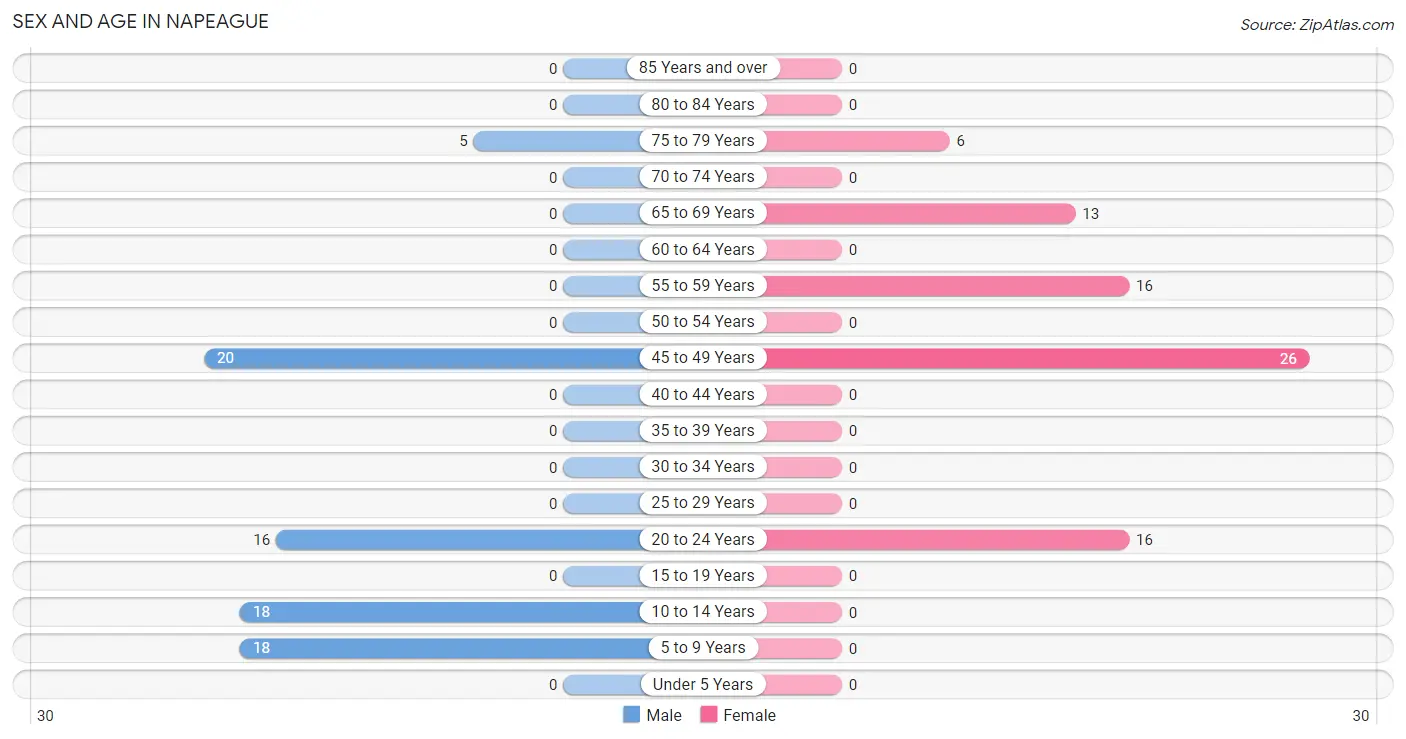
The most populous age groups in Napeague are 45 to 49 Years (20 | 26.0%) for men and 45 to 49 Years (26 | 33.8%) for women.
| Age Bracket | Male | Female |
| Under 5 Years | 0 (0.0%) | 0 (0.0%) |
| 5 to 9 Years | 18 (23.4%) | 0 (0.0%) |
| 10 to 14 Years | 18 (23.4%) | 0 (0.0%) |
| 15 to 19 Years | 0 (0.0%) | 0 (0.0%) |
| 20 to 24 Years | 16 (20.8%) | 16 (20.8%) |
| 25 to 29 Years | 0 (0.0%) | 0 (0.0%) |
| 30 to 34 Years | 0 (0.0%) | 0 (0.0%) |
| 35 to 39 Years | 0 (0.0%) | 0 (0.0%) |
| 40 to 44 Years | 0 (0.0%) | 0 (0.0%) |
| 45 to 49 Years | 20 (26.0%) | 26 (33.8%) |
| 50 to 54 Years | 0 (0.0%) | 0 (0.0%) |
| 55 to 59 Years | 0 (0.0%) | 16 (20.8%) |
| 60 to 64 Years | 0 (0.0%) | 0 (0.0%) |
| 65 to 69 Years | 0 (0.0%) | 13 (16.9%) |
| 70 to 74 Years | 0 (0.0%) | 0 (0.0%) |
| 75 to 79 Years | 5 (6.5%) | 6 (7.8%) |
| 80 to 84 Years | 0 (0.0%) | 0 (0.0%) |
| 85 Years and over | 0 (0.0%) | 0 (0.0%) |
| Total | 77 (100.0%) | 77 (100.0%) |
Families and Households in Napeague
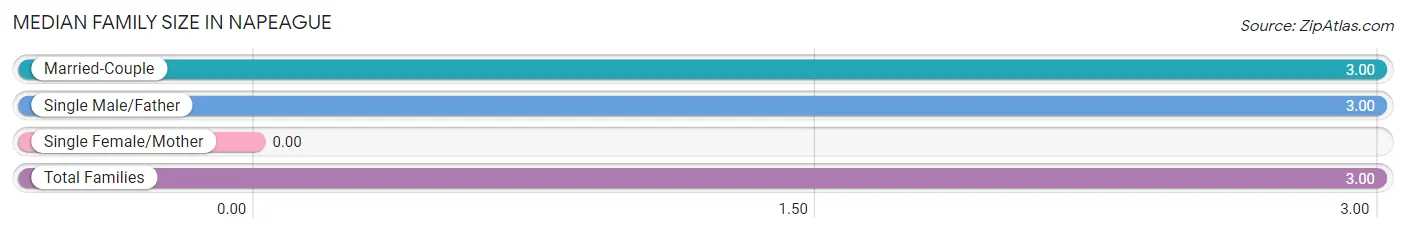
Median Family Size in Napeague
| Family Type | # Families | Family Size |
| Married-Couple | 31 (66.0%) | 3.00 |
| Single Male/Father | 16 (34.0%) | 3.00 |
| Single Female/Mother | 0 (0.0%) | - |
| Total Families | 47 (100.0%) | 3.00 |
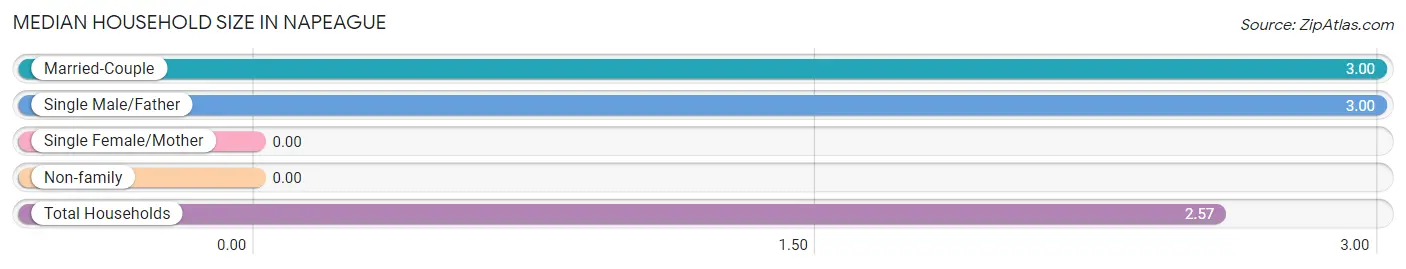
Median Household Size in Napeague
| Household Type | # Households | Household Size |
| Married-Couple | 31 (51.7%) | 3.00 |
| Single Male/Father | 16 (26.7%) | 3.00 |
| Single Female/Mother | 0 (0.0%) | - |
| Non-family | 13 (21.7%) | - |
| Total Households | 60 (100.0%) | 2.57 |
Household Size by Marriage Status in Napeague
Out of a total of 60 households in Napeague, 47 (78.3%) are family households, while 13 (21.7%) are nonfamily households. The most numerous type of family households are 4-person households, comprising 26, and the most common type of nonfamily households are 1-person households, comprising 13.
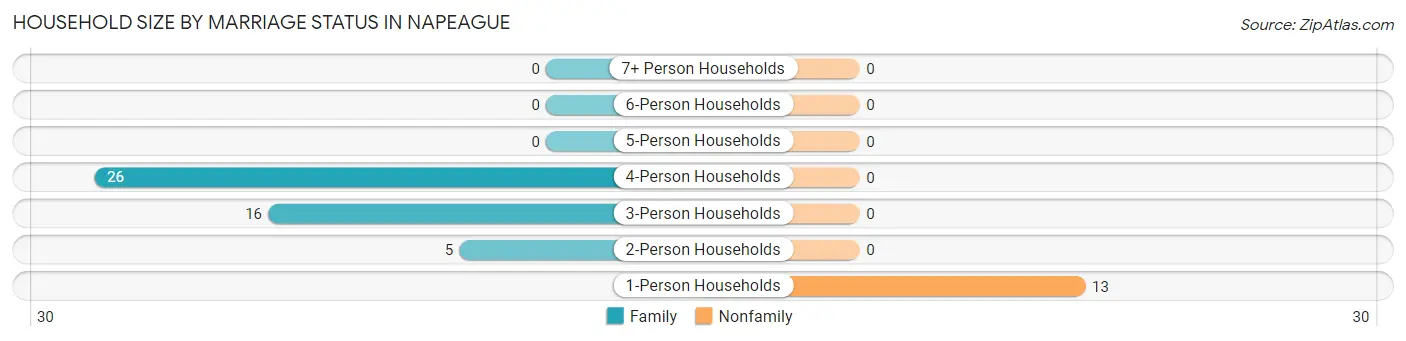
| Household Size | Family Households | Nonfamily Households |
| 1-Person Households | - | 13 (21.7%) |
| 2-Person Households | 5 (8.3%) | 0 (0.0%) |
| 3-Person Households | 16 (26.7%) | 0 (0.0%) |
| 4-Person Households | 26 (43.3%) | 0 (0.0%) |
| 5-Person Households | 0 (0.0%) | 0 (0.0%) |
| 6-Person Households | 0 (0.0%) | 0 (0.0%) |
| 7+ Person Households | 0 (0.0%) | 0 (0.0%) |
| Total | 47 (78.3%) | 13 (21.7%) |
Female Fertility in Napeague
Fertility by Age in Napeague
| Age Bracket | Women with Births | Births / 1,000 Women |
| 15 to 19 years | 0 (0.0%) | 0.0 |
| 20 to 34 years | 0 (0.0%) | 0.0 |
| 35 to 50 years | 0 (0.0%) | 0.0 |
| Total | 0 (0.0%) | 0.0 |
Fertility by Age by Marriage Status in Napeague
| Age Bracket | Married | Unmarried |
| 15 to 19 years | 0 (0.0%) | 0 (0.0%) |
| 20 to 34 years | 0 (0.0%) | 0 (0.0%) |
| 35 to 50 years | 0 (0.0%) | 0 (0.0%) |
| Total | 0 (0.0%) | 0 (0.0%) |
Fertility by Education in Napeague
| Educational Attainment | Women with Births | Births / 1,000 Women |
| Less than High School | 0 (0.0%) | 0.0 |
| High School Diploma | 0 (0.0%) | 0.0 |
| College or Associate's Degree | 0 (0.0%) | 0.0 |
| Bachelor's Degree | 0 (0.0%) | 0.0 |
| Graduate Degree | 0 (0.0%) | 0.0 |
| Total | 0 (0.0%) | 0.0 |
Fertility by Education by Marriage Status in Napeague
| Educational Attainment | Married | Unmarried |
| Less than High School | 0 (0.0%) | 0 (0.0%) |
| High School Diploma | 0 (0.0%) | 0 (0.0%) |
| College or Associate's Degree | 0 (0.0%) | 0 (0.0%) |
| Bachelor's Degree | 0 (0.0%) | 0 (0.0%) |
| Graduate Degree | 0 (0.0%) | 0 (0.0%) |
| Total | 0 (0.0%) | 0 (0.0%) |
Employment Characteristics in Napeague
Employment by Class of Employer in Napeague
Among the 83 employed individuals in Napeague, private company employees (36 | 43.4%), local government employees (26 | 31.3%), and self-employed (incorporated) (21 | 25.3%) make up the most common classes of employment.
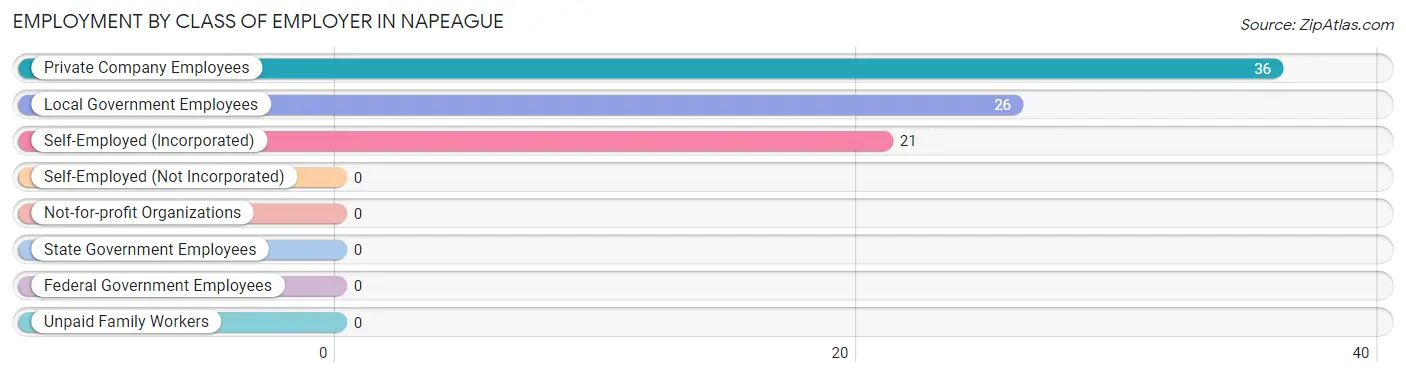
| Employer Class | # Employees | % Employees |
| Private Company Employees | 36 | 43.4% |
| Self-Employed (Incorporated) | 21 | 25.3% |
| Self-Employed (Not Incorporated) | 0 | 0.0% |
| Not-for-profit Organizations | 0 | 0.0% |
| Local Government Employees | 26 | 31.3% |
| State Government Employees | 0 | 0.0% |
| Federal Government Employees | 0 | 0.0% |
| Unpaid Family Workers | 0 | 0.0% |
| Total | 83 | 100.0% |
Employment Status by Age in Napeague
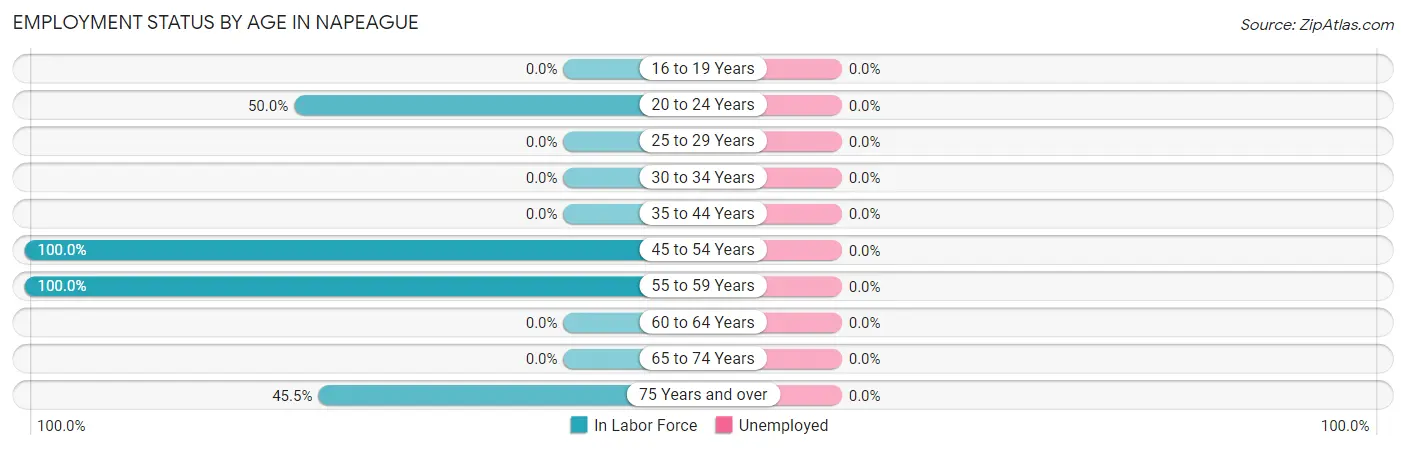
| Age Bracket | In Labor Force | Unemployed |
| 16 to 19 Years | 0 (0.0%) | 0 (0.0%) |
| 20 to 24 Years | 16 (50.0%) | 0 (0.0%) |
| 25 to 29 Years | 0 (0.0%) | 0 (0.0%) |
| 30 to 34 Years | 0 (0.0%) | 0 (0.0%) |
| 35 to 44 Years | 0 (0.0%) | 0 (0.0%) |
| 45 to 54 Years | 46 (100.0%) | 0 (0.0%) |
| 55 to 59 Years | 16 (100.0%) | 0 (0.0%) |
| 60 to 64 Years | 0 (0.0%) | 0 (0.0%) |
| 65 to 74 Years | 0 (0.0%) | 0 (0.0%) |
| 75 Years and over | 5 (45.5%) | 0 (0.0%) |
| Total | 83 (70.3%) | 0 (0.0%) |
Employment Status by Educational Attainment in Napeague
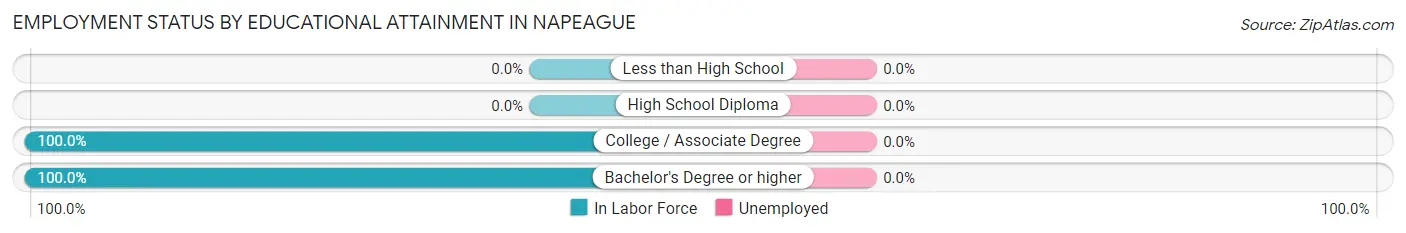
| Educational Attainment | In Labor Force | Unemployed |
| Less than High School | 0 (0.0%) | 0 (0.0%) |
| High School Diploma | 0 (0.0%) | 0 (0.0%) |
| College / Associate Degree | 20 (100.0%) | 0 (0.0%) |
| Bachelor's Degree or higher | 42 (100.0%) | 0 (0.0%) |
| Total | 62 (100.0%) | 0 (0.0%) |
Employment Occupations by Sex in Napeague
Management, Business, Science and Arts Occupations
The most common Management, Business, Science and Arts occupations in Napeague are Management (16 | 19.3%), and Business & Financial (5 | 6.0%).
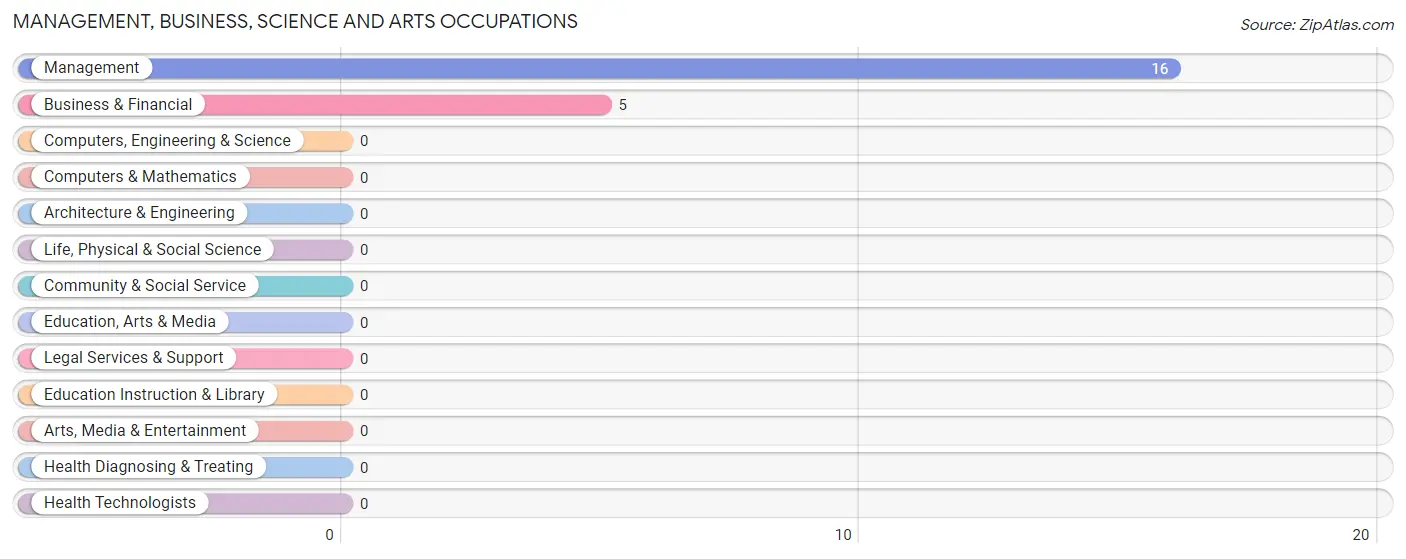
Management, Business, Science and Arts Occupations by Sex
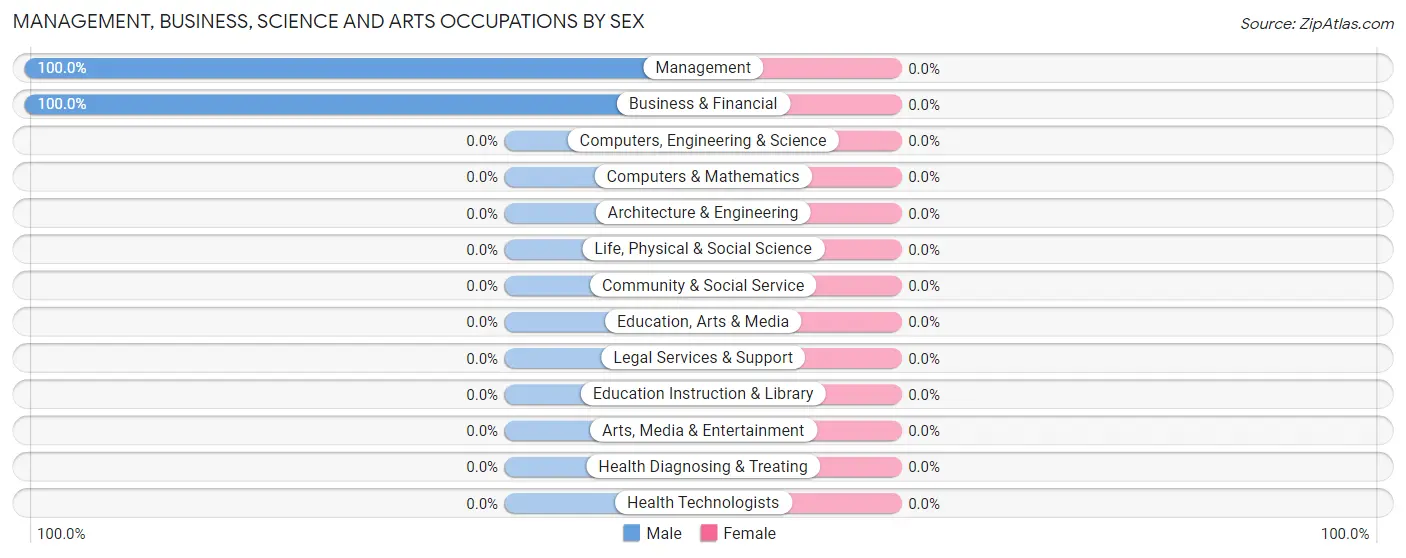
| Occupation | Male | Female |
| Management | 16 (100.0%) | 0 (0.0%) |
| Business & Financial | 5 (100.0%) | 0 (0.0%) |
| Computers, Engineering & Science | 0 (0.0%) | 0 (0.0%) |
| Computers & Mathematics | 0 (0.0%) | 0 (0.0%) |
| Architecture & Engineering | 0 (0.0%) | 0 (0.0%) |
| Life, Physical & Social Science | 0 (0.0%) | 0 (0.0%) |
| Community & Social Service | 0 (0.0%) | 0 (0.0%) |
| Education, Arts & Media | 0 (0.0%) | 0 (0.0%) |
| Legal Services & Support | 0 (0.0%) | 0 (0.0%) |
| Education Instruction & Library | 0 (0.0%) | 0 (0.0%) |
| Arts, Media & Entertainment | 0 (0.0%) | 0 (0.0%) |
| Health Diagnosing & Treating | 0 (0.0%) | 0 (0.0%) |
| Health Technologists | 0 (0.0%) | 0 (0.0%) |
| Total (Category) | 21 (100.0%) | 0 (0.0%) |
| Total (Overall) | 41 (49.4%) | 42 (50.6%) |
Services Occupations
The most common Services occupations in Napeague are Personal Care & Service (26 | 31.3%), and Cleaning & Maintenance (16 | 19.3%).
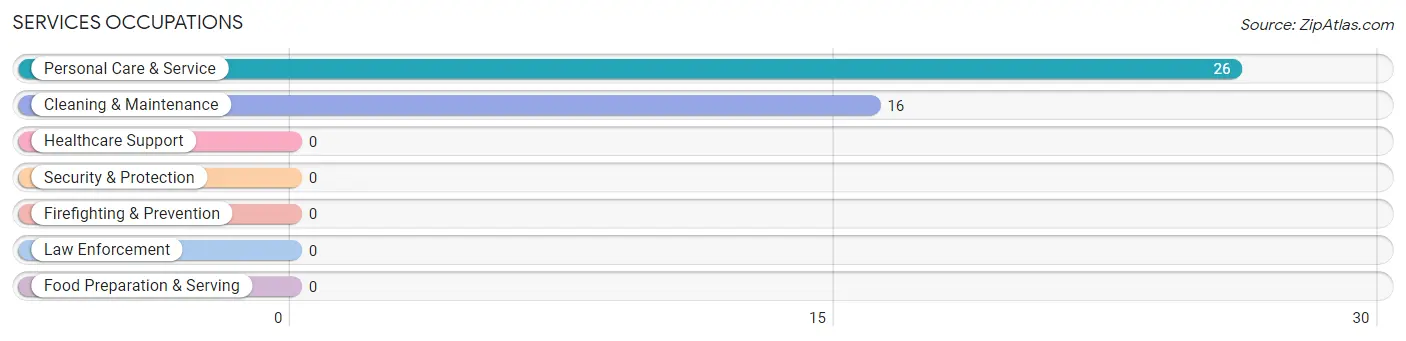
Services Occupations by Sex
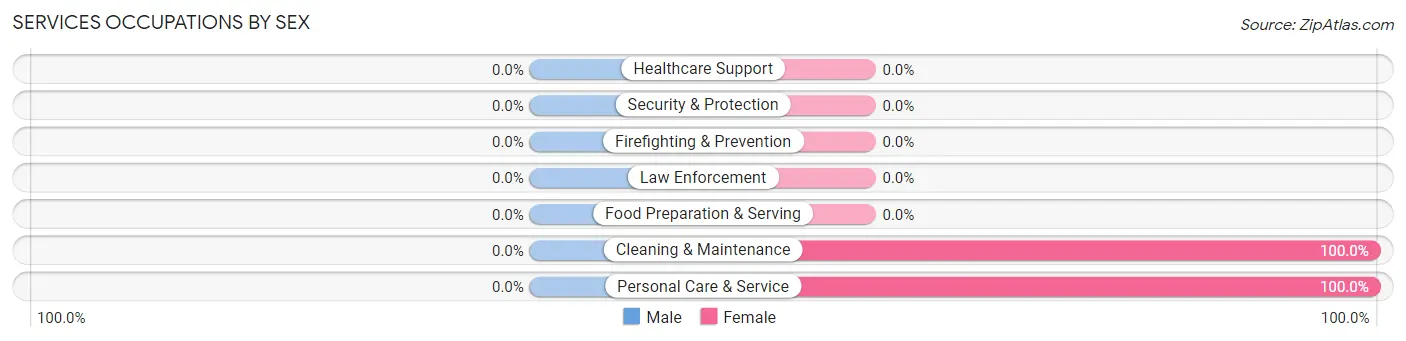
| Occupation | Male | Female |
| Healthcare Support | 0 (0.0%) | 0 (0.0%) |
| Security & Protection | 0 (0.0%) | 0 (0.0%) |
| Firefighting & Prevention | 0 (0.0%) | 0 (0.0%) |
| Law Enforcement | 0 (0.0%) | 0 (0.0%) |
| Food Preparation & Serving | 0 (0.0%) | 0 (0.0%) |
| Cleaning & Maintenance | 0 (0.0%) | 16 (100.0%) |
| Personal Care & Service | 0 (0.0%) | 26 (100.0%) |
| Total (Category) | 0 (0.0%) | 42 (100.0%) |
| Total (Overall) | 41 (49.4%) | 42 (50.6%) |
Sales and Office Occupations

Sales and Office Occupations by Sex
| Occupation | Male | Female |
| Sales & Related | 0 (0.0%) | 0 (0.0%) |
| Office & Administration | 0 (0.0%) | 0 (0.0%) |
| Total (Category) | 0 (0.0%) | 0 (0.0%) |
| Total (Overall) | 41 (49.4%) | 42 (50.6%) |
Natural Resources, Construction and Maintenance Occupations
Natural Resources, Construction and Maintenance Occupations by Sex
| Occupation | Male | Female |
| Farming, Fishing & Forestry | 0 (0.0%) | 0 (0.0%) |
| Construction & Extraction | 0 (0.0%) | 0 (0.0%) |
| Installation, Maintenance & Repair | 0 (0.0%) | 0 (0.0%) |
| Total (Category) | 0 (0.0%) | 0 (0.0%) |
| Total (Overall) | 41 (49.4%) | 42 (50.6%) |
Production, Transportation and Moving Occupations
The most common Production, Transportation and Moving occupations in Napeague are , and Transportation (20 | 24.1%).
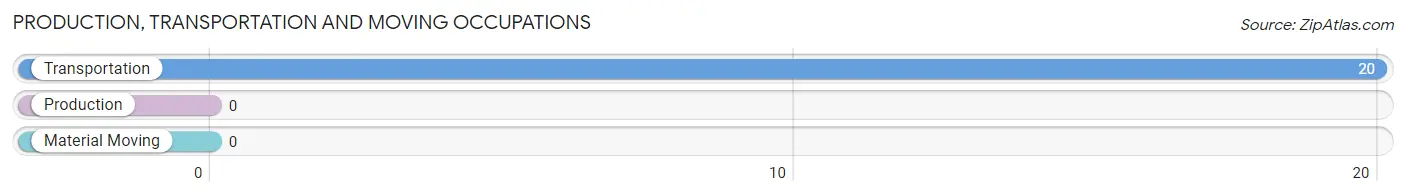
Production, Transportation and Moving Occupations by Sex
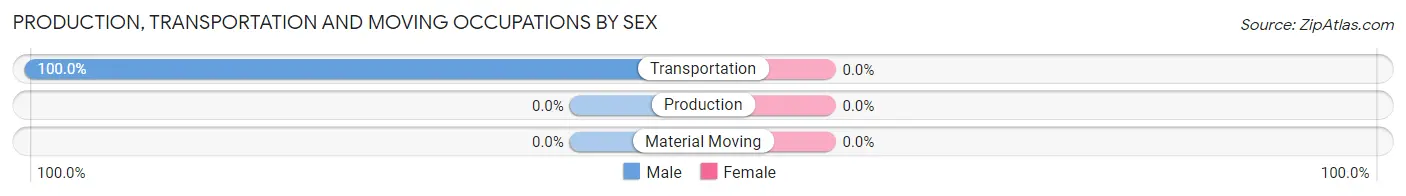
| Occupation | Male | Female |
| Production | 0 (0.0%) | 0 (0.0%) |
| Transportation | 20 (100.0%) | 0 (0.0%) |
| Material Moving | 0 (0.0%) | 0 (0.0%) |
| Total (Category) | 20 (100.0%) | 0 (0.0%) |
| Total (Overall) | 41 (49.4%) | 42 (50.6%) |
Employment Industries by Sex in Napeague
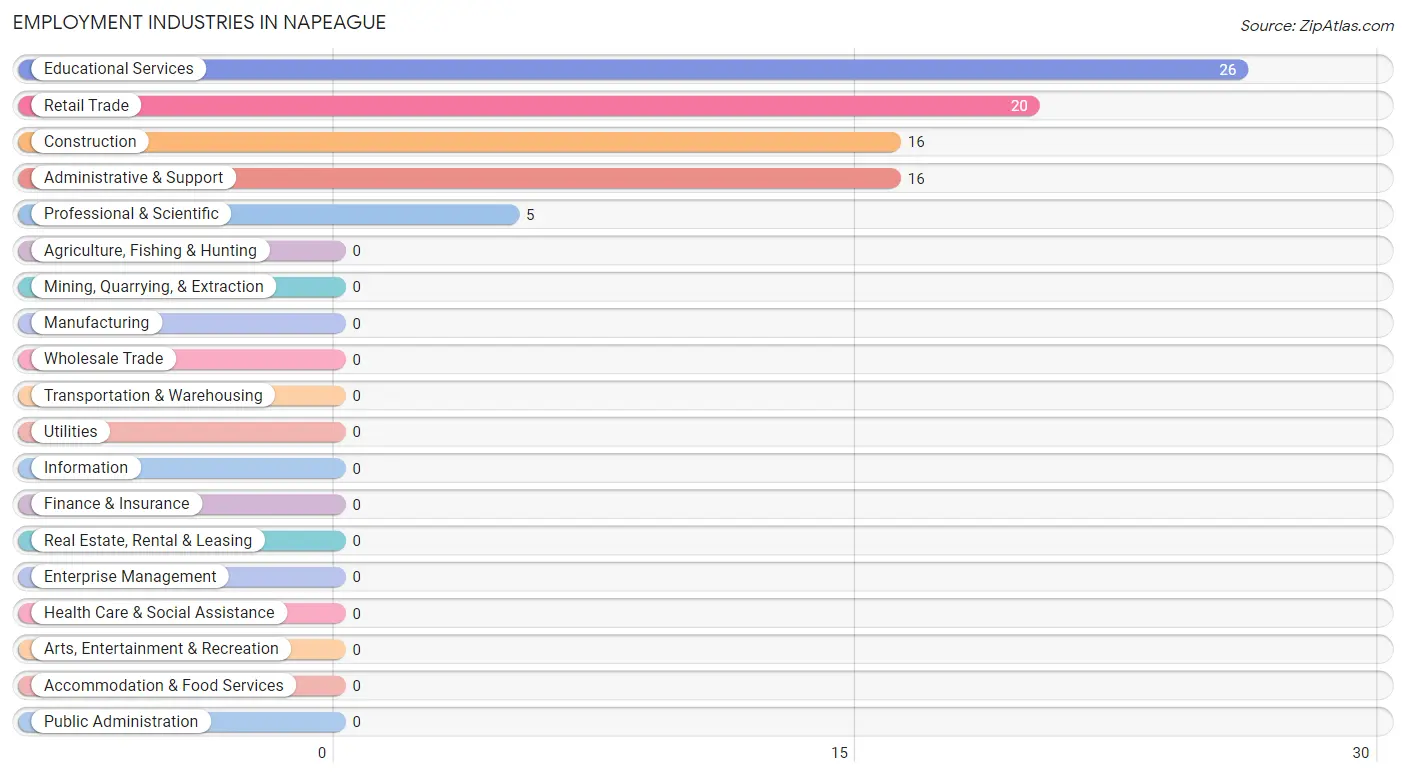
Employment Industries in Napeague
The major employment industries in Napeague include Educational Services (26 | 31.3%), Retail Trade (20 | 24.1%), Construction (16 | 19.3%), Administrative & Support (16 | 19.3%), and Professional & Scientific (5 | 6.0%).
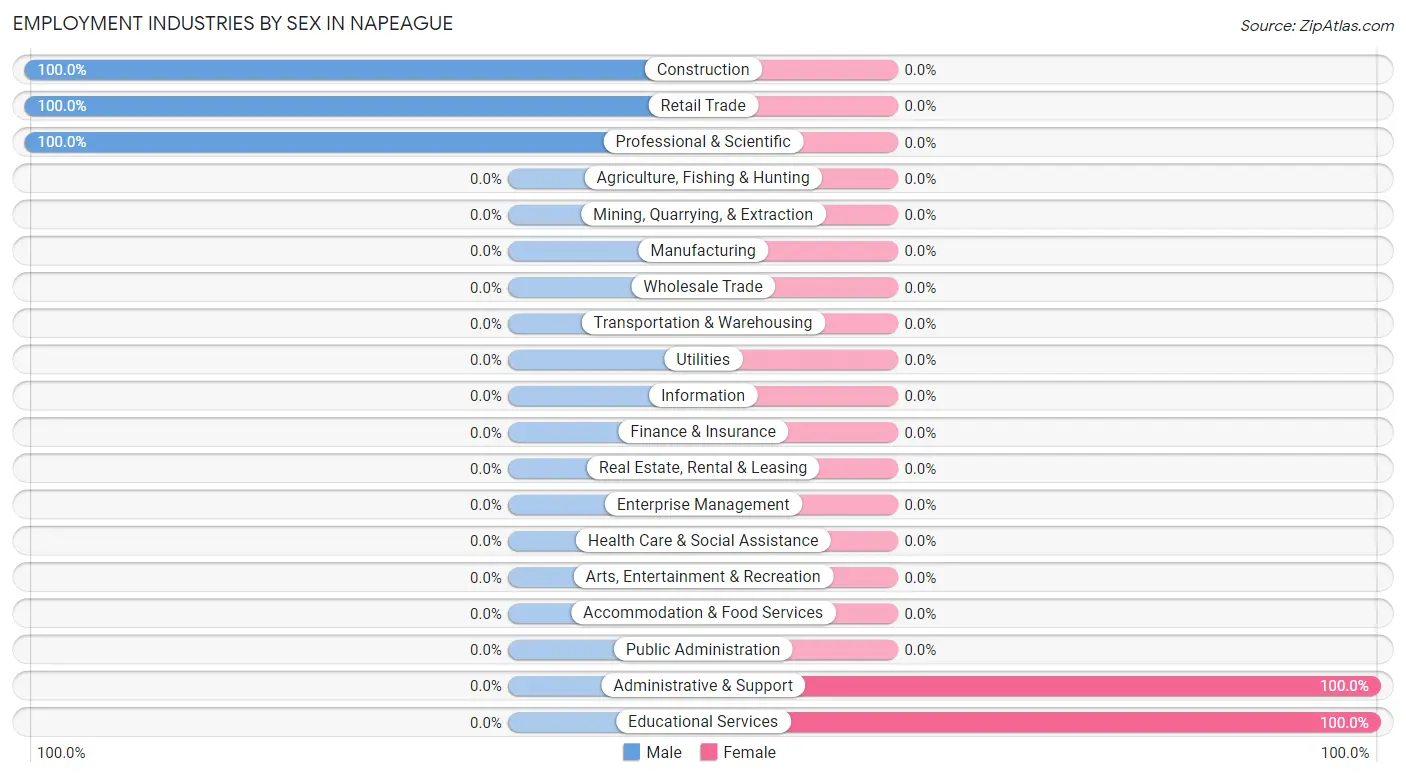
Employment Industries by Sex in Napeague
The Napeague industries that see more men than women are Construction (100.0%), Retail Trade (100.0%), and Professional & Scientific (100.0%), whereas the industries that tend to have a higher number of women are Administrative & Support (100.0%), and Educational Services (100.0%).
| Industry | Male | Female |
| Agriculture, Fishing & Hunting | 0 (0.0%) | 0 (0.0%) |
| Mining, Quarrying, & Extraction | 0 (0.0%) | 0 (0.0%) |
| Construction | 16 (100.0%) | 0 (0.0%) |
| Manufacturing | 0 (0.0%) | 0 (0.0%) |
| Wholesale Trade | 0 (0.0%) | 0 (0.0%) |
| Retail Trade | 20 (100.0%) | 0 (0.0%) |
| Transportation & Warehousing | 0 (0.0%) | 0 (0.0%) |
| Utilities | 0 (0.0%) | 0 (0.0%) |
| Information | 0 (0.0%) | 0 (0.0%) |
| Finance & Insurance | 0 (0.0%) | 0 (0.0%) |
| Real Estate, Rental & Leasing | 0 (0.0%) | 0 (0.0%) |
| Professional & Scientific | 5 (100.0%) | 0 (0.0%) |
| Enterprise Management | 0 (0.0%) | 0 (0.0%) |
| Administrative & Support | 0 (0.0%) | 16 (100.0%) |
| Educational Services | 0 (0.0%) | 26 (100.0%) |
| Health Care & Social Assistance | 0 (0.0%) | 0 (0.0%) |
| Arts, Entertainment & Recreation | 0 (0.0%) | 0 (0.0%) |
| Accommodation & Food Services | 0 (0.0%) | 0 (0.0%) |
| Public Administration | 0 (0.0%) | 0 (0.0%) |
| Total | 41 (49.4%) | 42 (50.6%) |
Education in Napeague
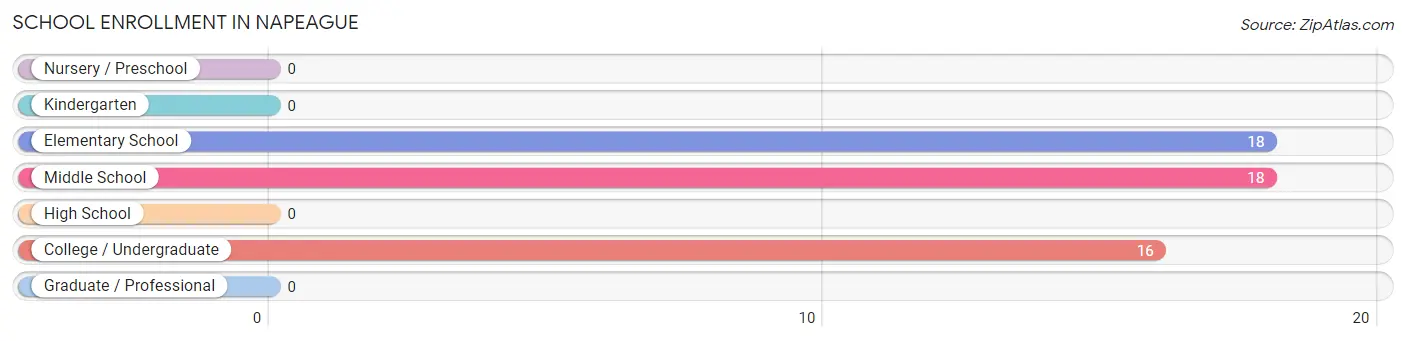
School Enrollment in Napeague
The most common levels of schooling among the 52 students in Napeague are elementary school (18 | 34.6%), middle school (18 | 34.6%), and college / undergraduate (16 | 30.8%).
| School Level | # Students | % Students |
| Nursery / Preschool | 0 | 0.0% |
| Kindergarten | 0 | 0.0% |
| Elementary School | 18 | 34.6% |
| Middle School | 18 | 34.6% |
| High School | 0 | 0.0% |
| College / Undergraduate | 16 | 30.8% |
| Graduate / Professional | 0 | 0.0% |
| Total | 52 | 100.0% |
School Enrollment by Age by Funding Source in Napeague
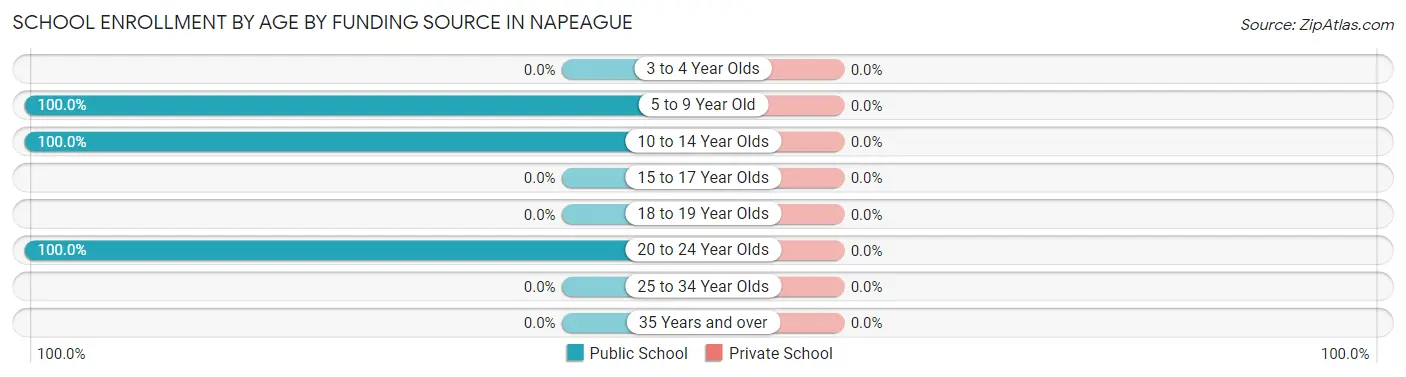
| Age Bracket | Public School | Private School |
| 3 to 4 Year Olds | 0 (0.0%) | 0 (0.0%) |
| 5 to 9 Year Old | 18 (100.0%) | 0 (0.0%) |
| 10 to 14 Year Olds | 18 (100.0%) | 0 (0.0%) |
| 15 to 17 Year Olds | 0 (0.0%) | 0 (0.0%) |
| 18 to 19 Year Olds | 0 (0.0%) | 0 (0.0%) |
| 20 to 24 Year Olds | 16 (100.0%) | 0 (0.0%) |
| 25 to 34 Year Olds | 0 (0.0%) | 0 (0.0%) |
| 35 Years and over | 0 (0.0%) | 0 (0.0%) |
| Total | 52 (100.0%) | 0 (0.0%) |
Educational Attainment by Field of Study in Napeague
Social sciences (26 | 43.3%), visual & performing arts (16 | 26.7%), computers & mathematics (13 | 21.7%), and business (5 | 8.3%) are the most common fields of study among 60 individuals in Napeague who have obtained a bachelor's degree or higher.
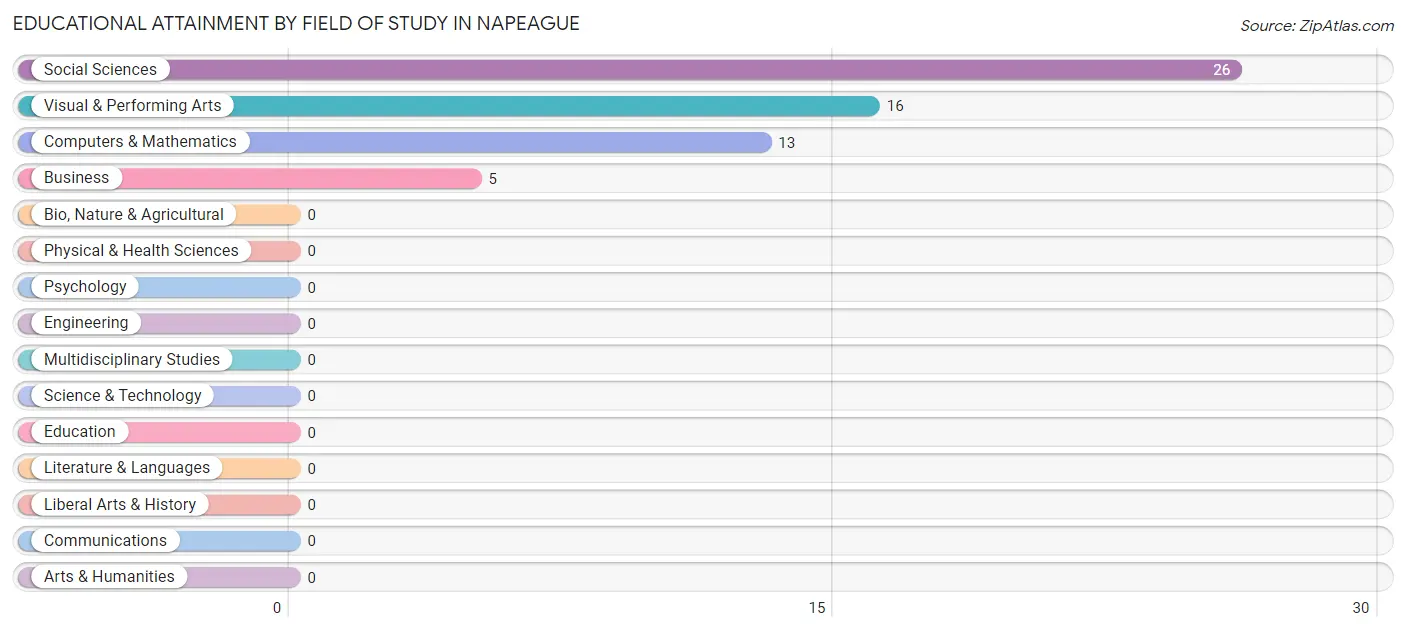
| Field of Study | # Graduates | % Graduates |
| Computers & Mathematics | 13 | 21.7% |
| Bio, Nature & Agricultural | 0 | 0.0% |
| Physical & Health Sciences | 0 | 0.0% |
| Psychology | 0 | 0.0% |
| Social Sciences | 26 | 43.3% |
| Engineering | 0 | 0.0% |
| Multidisciplinary Studies | 0 | 0.0% |
| Science & Technology | 0 | 0.0% |
| Business | 5 | 8.3% |
| Education | 0 | 0.0% |
| Literature & Languages | 0 | 0.0% |
| Liberal Arts & History | 0 | 0.0% |
| Visual & Performing Arts | 16 | 26.7% |
| Communications | 0 | 0.0% |
| Arts & Humanities | 0 | 0.0% |
| Total | 60 | 100.0% |
Transportation & Commute in Napeague
Vehicle Availability by Sex in Napeague
The most prevalent vehicle ownership categories in Napeague are males with 3 vehicles (20, accounting for 48.8%) and females with 3 vehicles (26, making up 47.6%).
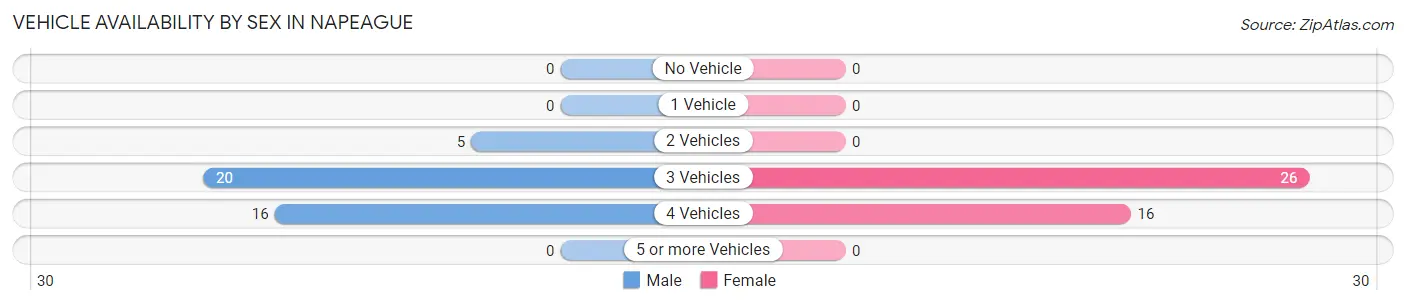
| Vehicles Available | Male | Female |
| No Vehicle | 0 (0.0%) | 0 (0.0%) |
| 1 Vehicle | 0 (0.0%) | 0 (0.0%) |
| 2 Vehicles | 5 (12.2%) | 0 (0.0%) |
| 3 Vehicles | 20 (48.8%) | 26 (61.9%) |
| 4 Vehicles | 16 (39.0%) | 16 (38.1%) |
| 5 or more Vehicles | 0 (0.0%) | 0 (0.0%) |
| Total | 41 (100.0%) | 42 (100.0%) |
Commute Time in Napeague
The most frequently occuring commute durations in Napeague are 15 to 19 minutes (42 commuters, 50.6%), 20 to 24 minutes (20 commuters, 24.1%), and 30 to 34 minutes (16 commuters, 19.3%).
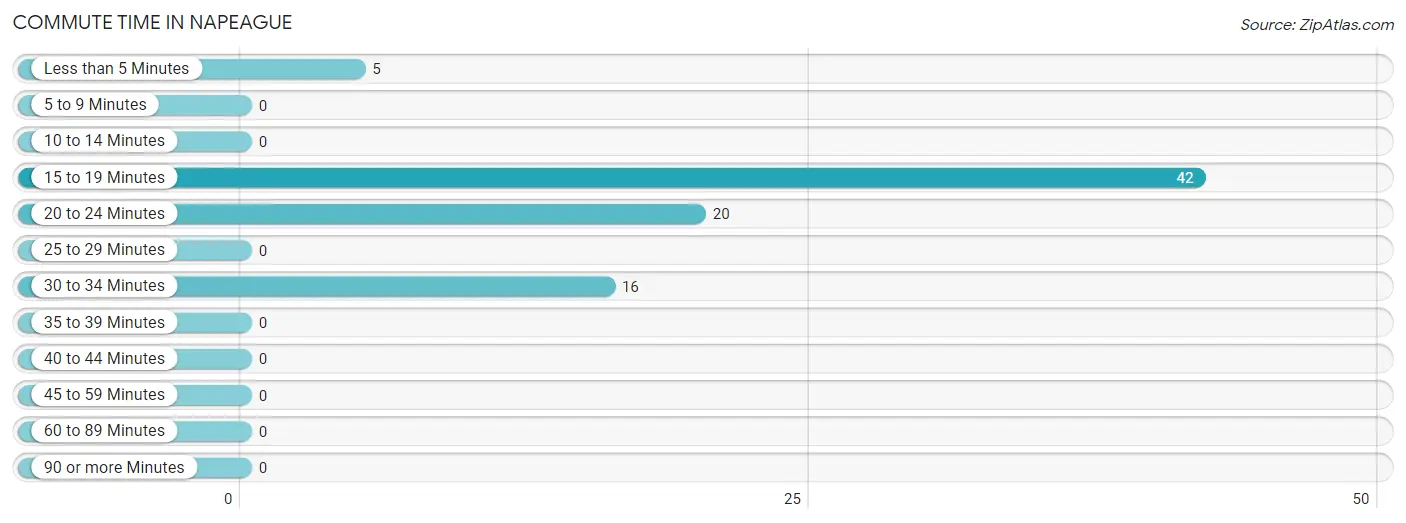
| Commute Time | # Commuters | % Commuters |
| Less than 5 Minutes | 5 | 6.0% |
| 5 to 9 Minutes | 0 | 0.0% |
| 10 to 14 Minutes | 0 | 0.0% |
| 15 to 19 Minutes | 42 | 50.6% |
| 20 to 24 Minutes | 20 | 24.1% |
| 25 to 29 Minutes | 0 | 0.0% |
| 30 to 34 Minutes | 16 | 19.3% |
| 35 to 39 Minutes | 0 | 0.0% |
| 40 to 44 Minutes | 0 | 0.0% |
| 45 to 59 Minutes | 0 | 0.0% |
| 60 to 89 Minutes | 0 | 0.0% |
| 90 or more Minutes | 0 | 0.0% |
Commute Time by Sex in Napeague
The most common commute times in Napeague are 20 to 24 minutes (20 commuters, 48.8%) for males and 15 to 19 minutes (26 commuters, 61.9%) for females.
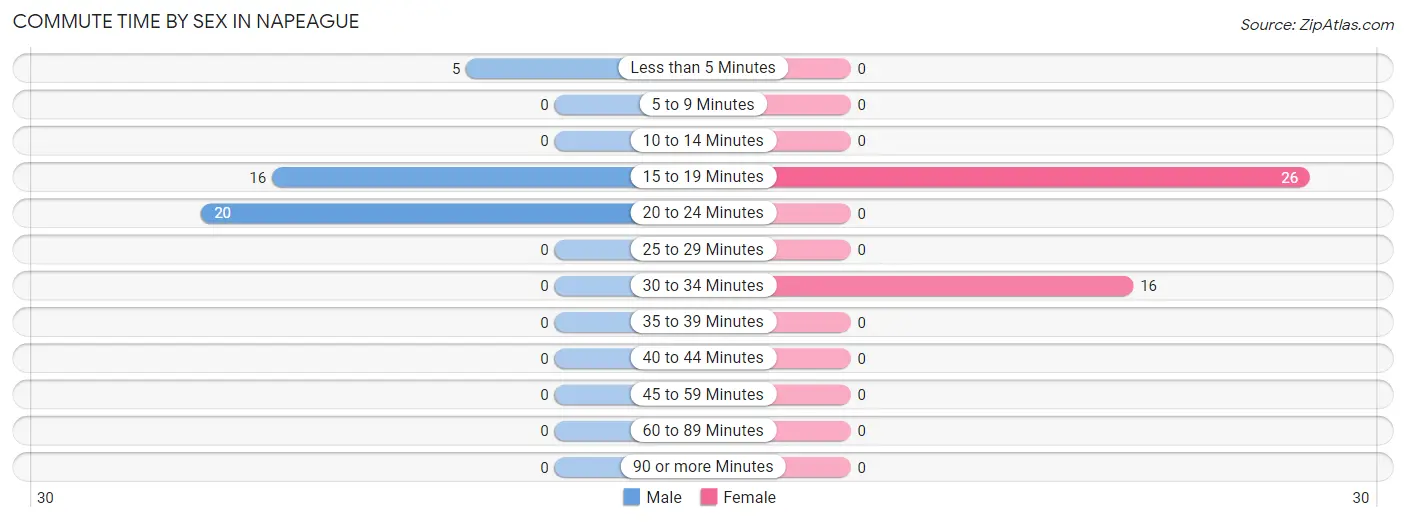
| Commute Time | Male | Female |
| Less than 5 Minutes | 5 (12.2%) | 0 (0.0%) |
| 5 to 9 Minutes | 0 (0.0%) | 0 (0.0%) |
| 10 to 14 Minutes | 0 (0.0%) | 0 (0.0%) |
| 15 to 19 Minutes | 16 (39.0%) | 26 (61.9%) |
| 20 to 24 Minutes | 20 (48.8%) | 0 (0.0%) |
| 25 to 29 Minutes | 0 (0.0%) | 0 (0.0%) |
| 30 to 34 Minutes | 0 (0.0%) | 16 (38.1%) |
| 35 to 39 Minutes | 0 (0.0%) | 0 (0.0%) |
| 40 to 44 Minutes | 0 (0.0%) | 0 (0.0%) |
| 45 to 59 Minutes | 0 (0.0%) | 0 (0.0%) |
| 60 to 89 Minutes | 0 (0.0%) | 0 (0.0%) |
| 90 or more Minutes | 0 (0.0%) | 0 (0.0%) |
Time of Departure to Work by Sex in Napeague
The most frequent times of departure to work in Napeague are 6:00 AM to 6:29 AM (20, 48.8%) for males and 10:00 AM to 10:59 AM (26, 61.9%) for females.
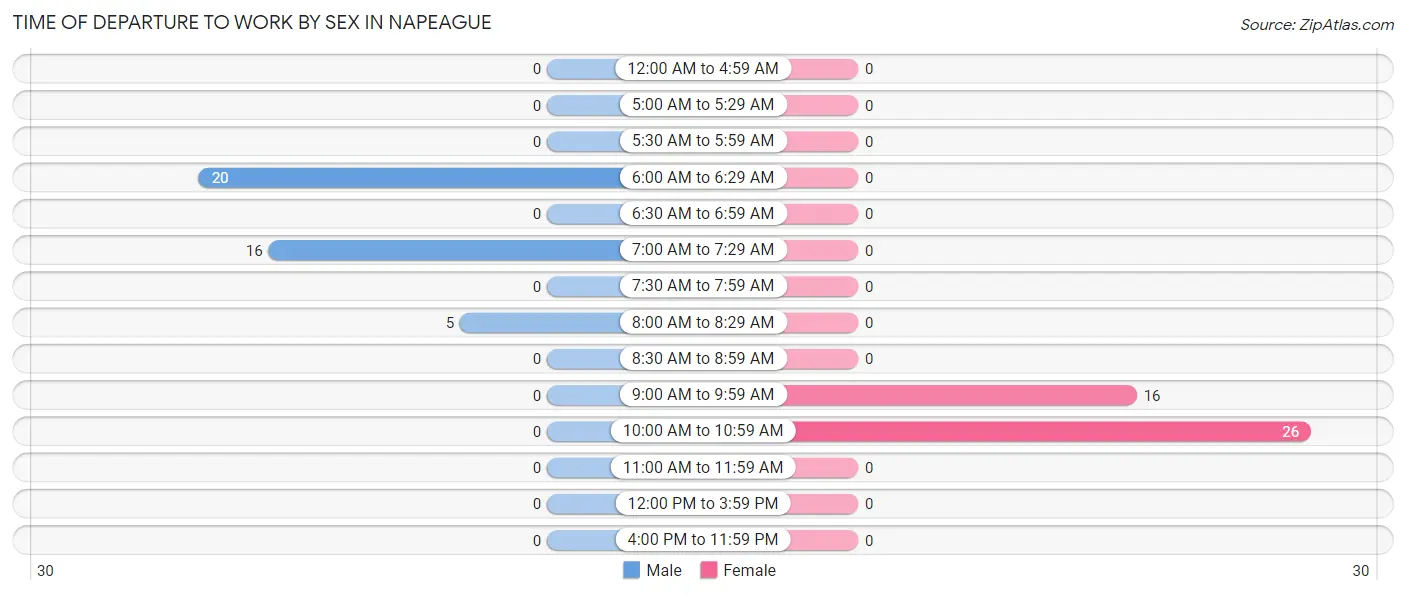
| Time of Departure | Male | Female |
| 12:00 AM to 4:59 AM | 0 (0.0%) | 0 (0.0%) |
| 5:00 AM to 5:29 AM | 0 (0.0%) | 0 (0.0%) |
| 5:30 AM to 5:59 AM | 0 (0.0%) | 0 (0.0%) |
| 6:00 AM to 6:29 AM | 20 (48.8%) | 0 (0.0%) |
| 6:30 AM to 6:59 AM | 0 (0.0%) | 0 (0.0%) |
| 7:00 AM to 7:29 AM | 16 (39.0%) | 0 (0.0%) |
| 7:30 AM to 7:59 AM | 0 (0.0%) | 0 (0.0%) |
| 8:00 AM to 8:29 AM | 5 (12.2%) | 0 (0.0%) |
| 8:30 AM to 8:59 AM | 0 (0.0%) | 0 (0.0%) |
| 9:00 AM to 9:59 AM | 0 (0.0%) | 16 (38.1%) |
| 10:00 AM to 10:59 AM | 0 (0.0%) | 26 (61.9%) |
| 11:00 AM to 11:59 AM | 0 (0.0%) | 0 (0.0%) |
| 12:00 PM to 3:59 PM | 0 (0.0%) | 0 (0.0%) |
| 4:00 PM to 11:59 PM | 0 (0.0%) | 0 (0.0%) |
| Total | 41 (100.0%) | 42 (100.0%) |
Housing Occupancy in Napeague
Occupancy by Ownership in Napeague
Of the total 60 dwellings in Napeague, owner-occupied units account for 18 (30.0%), while renter-occupied units make up 42 (70.0%).
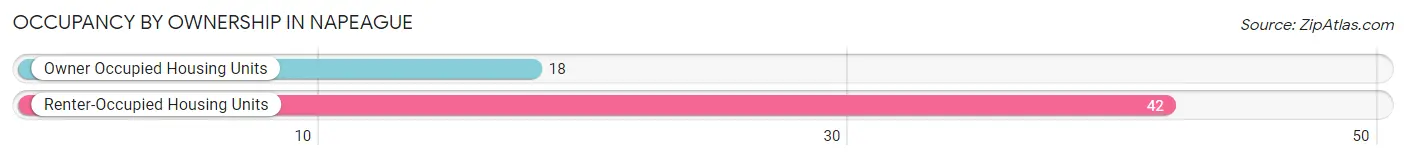
| Occupancy | # Housing Units | % Housing Units |
| Owner Occupied Housing Units | 18 | 30.0% |
| Renter-Occupied Housing Units | 42 | 70.0% |
| Total Occupied Housing Units | 60 | 100.0% |
Occupancy by Household Size in Napeague
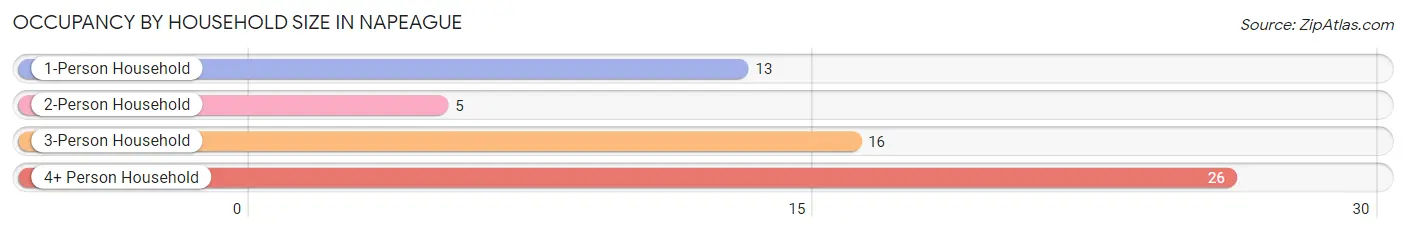
| Household Size | # Housing Units | % Housing Units |
| 1-Person Household | 13 | 21.7% |
| 2-Person Household | 5 | 8.3% |
| 3-Person Household | 16 | 26.7% |
| 4+ Person Household | 26 | 43.3% |
| Total Housing Units | 60 | 100.0% |
Occupancy by Ownership by Household Size in Napeague
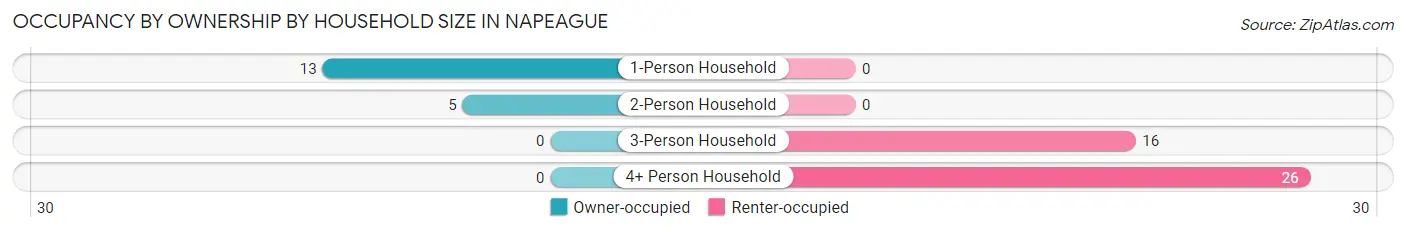
| Household Size | Owner-occupied | Renter-occupied |
| 1-Person Household | 13 (100.0%) | 0 (0.0%) |
| 2-Person Household | 5 (100.0%) | 0 (0.0%) |
| 3-Person Household | 0 (0.0%) | 16 (100.0%) |
| 4+ Person Household | 0 (0.0%) | 26 (100.0%) |
| Total Housing Units | 18 (30.0%) | 42 (70.0%) |
Occupancy by Educational Attainment in Napeague
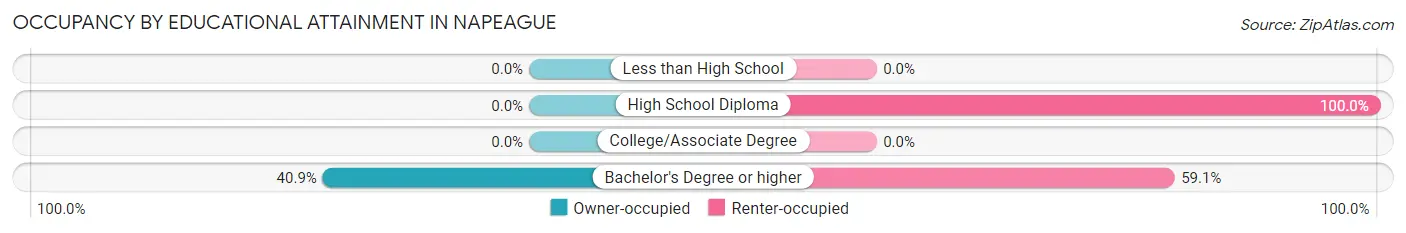
| Household Size | Owner-occupied | Renter-occupied |
| Less than High School | 0 (0.0%) | 0 (0.0%) |
| High School Diploma | 0 (0.0%) | 16 (100.0%) |
| College/Associate Degree | 0 (0.0%) | 0 (0.0%) |
| Bachelor's Degree or higher | 18 (40.9%) | 26 (59.1%) |
Occupancy by Age of Householder in Napeague
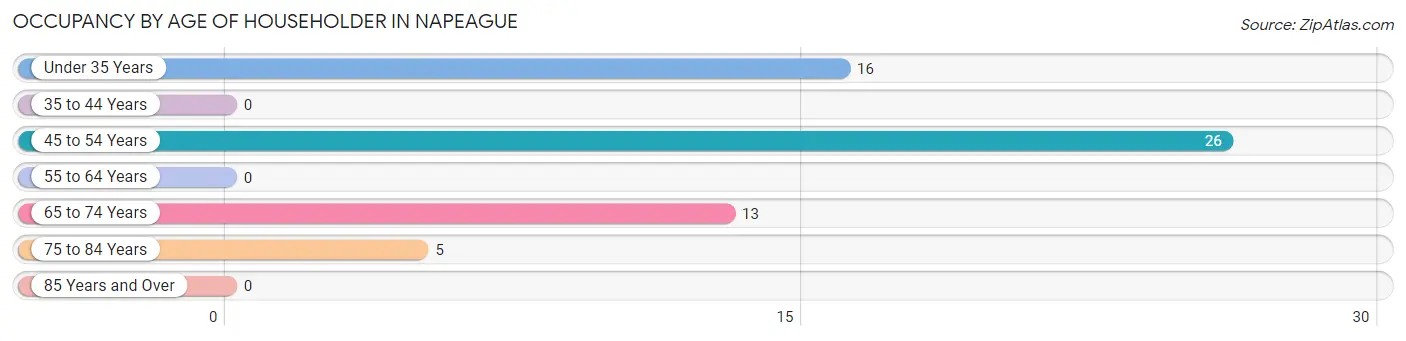
| Age Bracket | # Households | % Households |
| Under 35 Years | 16 | 26.7% |
| 35 to 44 Years | 0 | 0.0% |
| 45 to 54 Years | 26 | 43.3% |
| 55 to 64 Years | 0 | 0.0% |
| 65 to 74 Years | 13 | 21.7% |
| 75 to 84 Years | 5 | 8.3% |
| 85 Years and Over | 0 | 0.0% |
| Total | 60 | 100.0% |
Housing Finances in Napeague
Median Income by Occupancy in Napeague
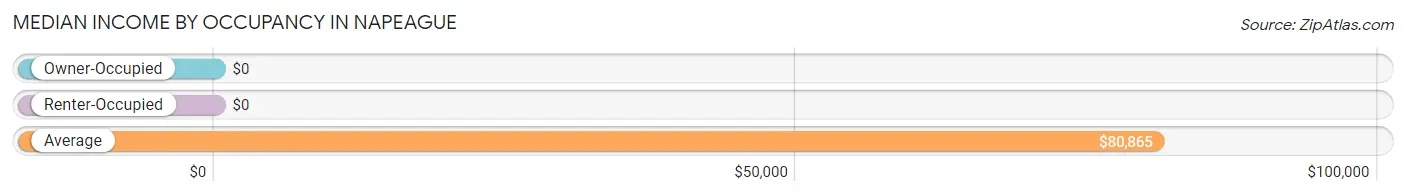
| Occupancy Type | # Households | Median Income |
| Owner-Occupied | 18 (30.0%) | $0 |
| Renter-Occupied | 42 (70.0%) | $0 |
| Average | 60 (100.0%) | $80,865 |
Occupancy by Householder Income Bracket in Napeague
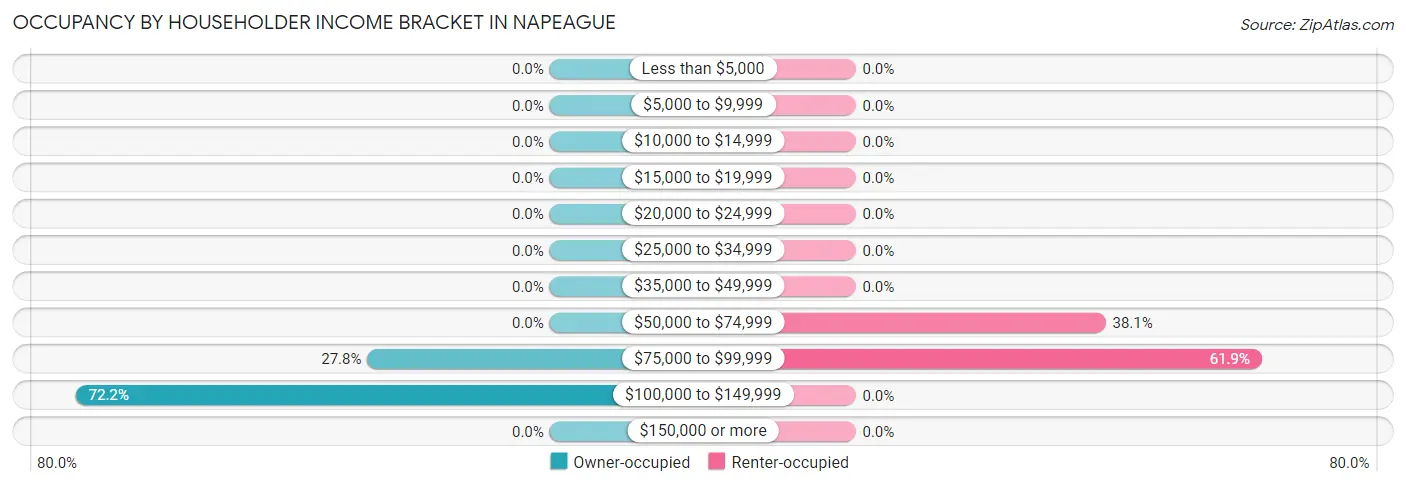
| Income Bracket | Owner-occupied | Renter-occupied |
| Less than $5,000 | 0 (0.0%) | 0 (0.0%) |
| $5,000 to $9,999 | 0 (0.0%) | 0 (0.0%) |
| $10,000 to $14,999 | 0 (0.0%) | 0 (0.0%) |
| $15,000 to $19,999 | 0 (0.0%) | 0 (0.0%) |
| $20,000 to $24,999 | 0 (0.0%) | 0 (0.0%) |
| $25,000 to $34,999 | 0 (0.0%) | 0 (0.0%) |
| $35,000 to $49,999 | 0 (0.0%) | 0 (0.0%) |
| $50,000 to $74,999 | 0 (0.0%) | 16 (38.1%) |
| $75,000 to $99,999 | 5 (27.8%) | 26 (61.9%) |
| $100,000 to $149,999 | 13 (72.2%) | 0 (0.0%) |
| $150,000 or more | 0 (0.0%) | 0 (0.0%) |
| Total | 18 (100.0%) | 42 (100.0%) |
Monthly Housing Cost Tiers in Napeague
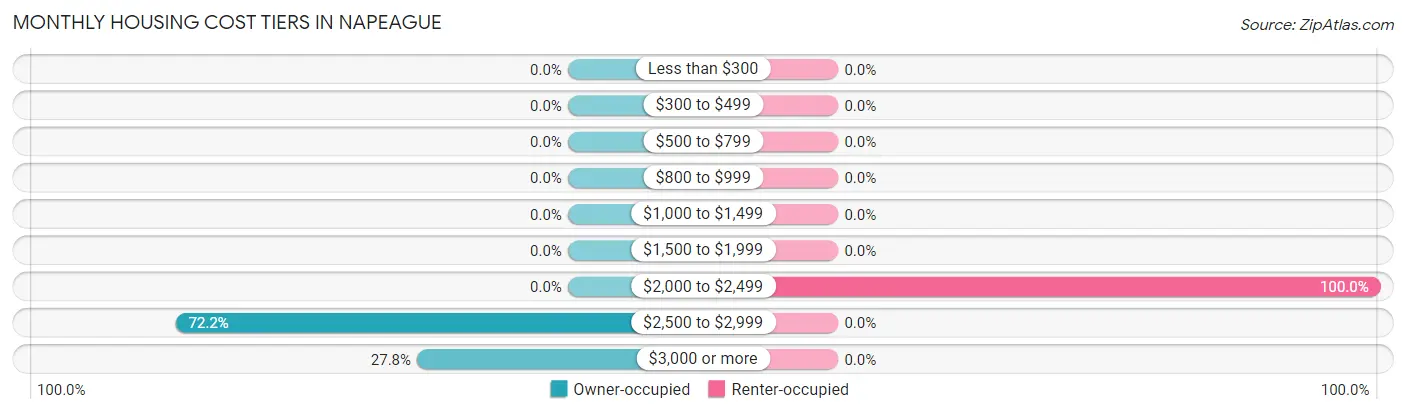
| Monthly Cost | Owner-occupied | Renter-occupied |
| Less than $300 | 0 (0.0%) | 0 (0.0%) |
| $300 to $499 | 0 (0.0%) | 0 (0.0%) |
| $500 to $799 | 0 (0.0%) | 0 (0.0%) |
| $800 to $999 | 0 (0.0%) | 0 (0.0%) |
| $1,000 to $1,499 | 0 (0.0%) | 0 (0.0%) |
| $1,500 to $1,999 | 0 (0.0%) | 0 (0.0%) |
| $2,000 to $2,499 | 0 (0.0%) | 42 (100.0%) |
| $2,500 to $2,999 | 13 (72.2%) | 0 (0.0%) |
| $3,000 or more | 5 (27.8%) | 0 (0.0%) |
| Total | 18 (100.0%) | 42 (100.0%) |
Physical Housing Characteristics in Napeague
Housing Structures in Napeague
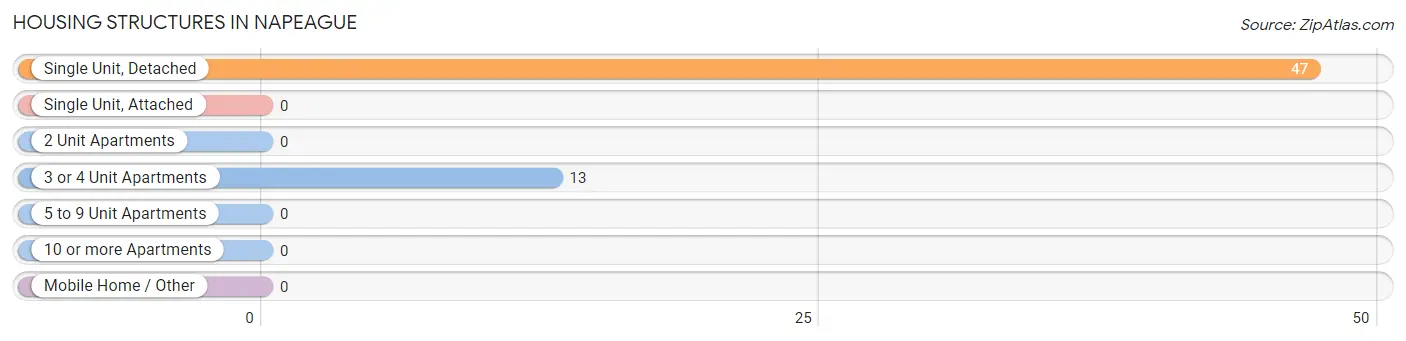
| Structure Type | # Housing Units | % Housing Units |
| Single Unit, Detached | 47 | 78.3% |
| Single Unit, Attached | 0 | 0.0% |
| 2 Unit Apartments | 0 | 0.0% |
| 3 or 4 Unit Apartments | 13 | 21.7% |
| 5 to 9 Unit Apartments | 0 | 0.0% |
| 10 or more Apartments | 0 | 0.0% |
| Mobile Home / Other | 0 | 0.0% |
| Total | 60 | 100.0% |
Housing Structures by Occupancy in Napeague
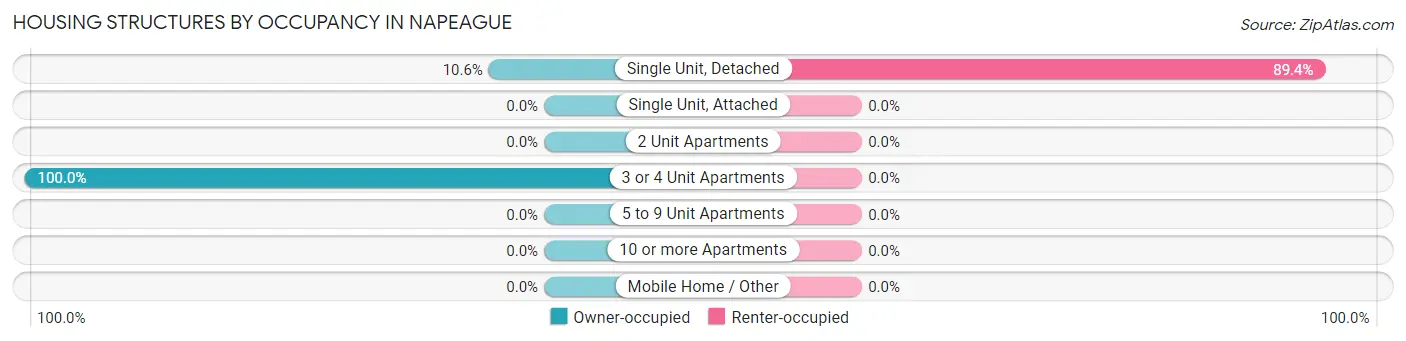
| Structure Type | Owner-occupied | Renter-occupied |
| Single Unit, Detached | 5 (10.6%) | 42 (89.4%) |
| Single Unit, Attached | 0 (0.0%) | 0 (0.0%) |
| 2 Unit Apartments | 0 (0.0%) | 0 (0.0%) |
| 3 or 4 Unit Apartments | 13 (100.0%) | 0 (0.0%) |
| 5 to 9 Unit Apartments | 0 (0.0%) | 0 (0.0%) |
| 10 or more Apartments | 0 (0.0%) | 0 (0.0%) |
| Mobile Home / Other | 0 (0.0%) | 0 (0.0%) |
| Total | 18 (30.0%) | 42 (70.0%) |
Housing Structures by Number of Rooms in Napeague
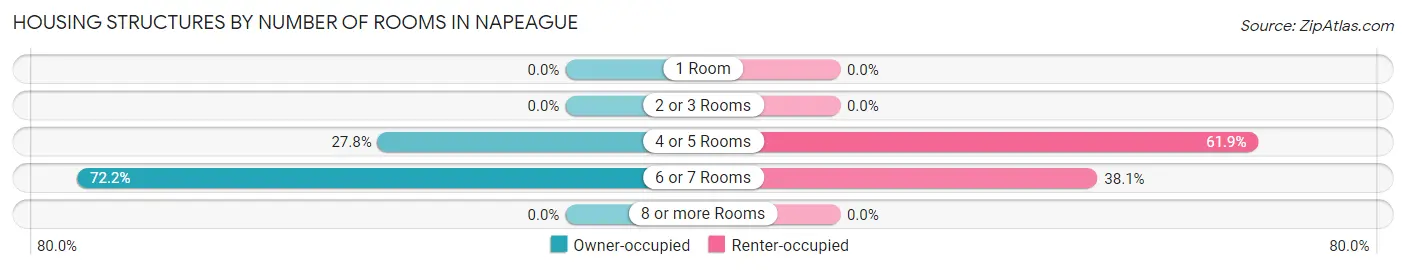
| Number of Rooms | Owner-occupied | Renter-occupied |
| 1 Room | 0 (0.0%) | 0 (0.0%) |
| 2 or 3 Rooms | 0 (0.0%) | 0 (0.0%) |
| 4 or 5 Rooms | 5 (27.8%) | 26 (61.9%) |
| 6 or 7 Rooms | 13 (72.2%) | 16 (38.1%) |
| 8 or more Rooms | 0 (0.0%) | 0 (0.0%) |
| Total | 18 (100.0%) | 42 (100.0%) |
Housing Structure by Heating Type in Napeague
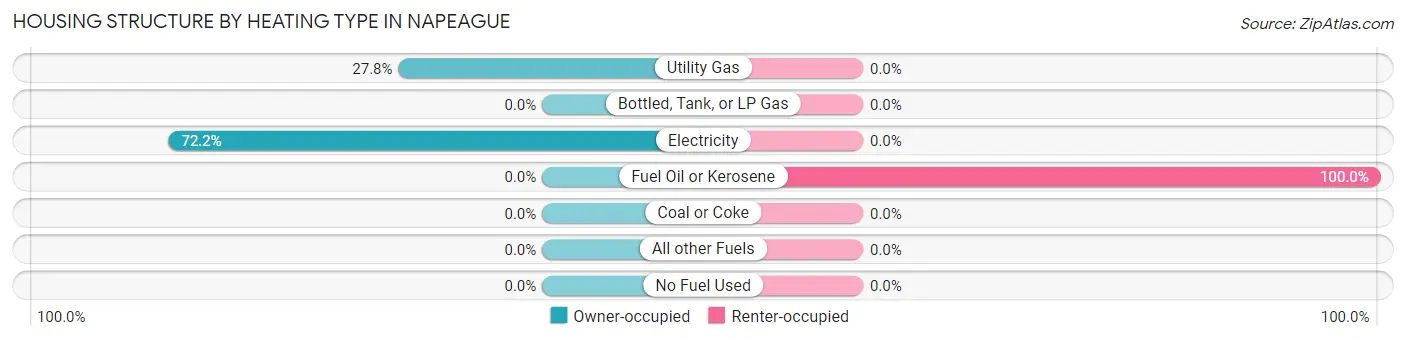
| Heating Type | Owner-occupied | Renter-occupied |
| Utility Gas | 5 (27.8%) | 0 (0.0%) |
| Bottled, Tank, or LP Gas | 0 (0.0%) | 0 (0.0%) |
| Electricity | 13 (72.2%) | 0 (0.0%) |
| Fuel Oil or Kerosene | 0 (0.0%) | 42 (100.0%) |
| Coal or Coke | 0 (0.0%) | 0 (0.0%) |
| All other Fuels | 0 (0.0%) | 0 (0.0%) |
| No Fuel Used | 0 (0.0%) | 0 (0.0%) |
| Total | 18 (100.0%) | 42 (100.0%) |
Household Vehicle Usage in Napeague
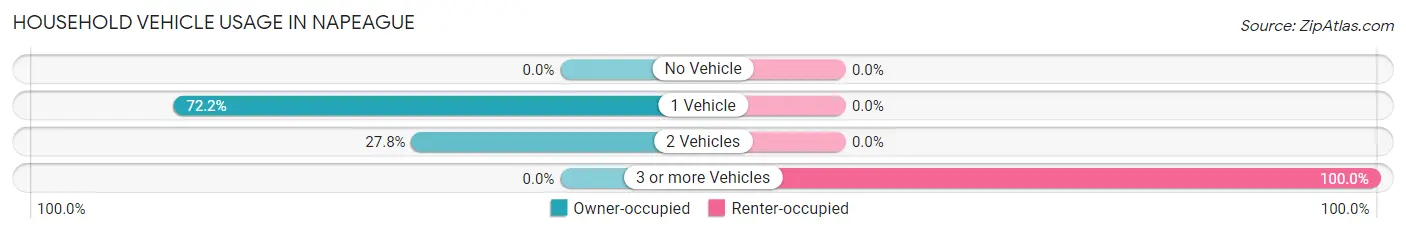
| Vehicles per Household | Owner-occupied | Renter-occupied |
| No Vehicle | 0 (0.0%) | 0 (0.0%) |
| 1 Vehicle | 13 (72.2%) | 0 (0.0%) |
| 2 Vehicles | 5 (27.8%) | 0 (0.0%) |
| 3 or more Vehicles | 0 (0.0%) | 42 (100.0%) |
| Total | 18 (100.0%) | 42 (100.0%) |
Real Estate & Mortgages in Napeague
Real Estate and Mortgage Overview in Napeague
| Characteristic | Without Mortgage | With Mortgage |
| Housing Units | 13 | 5 |
| Median Property Value | - | - |
| Median Household Income | - | - |
| Monthly Housing Costs | - | - |
| Real Estate Taxes | - | - |
Property Value by Mortgage Status in Napeague
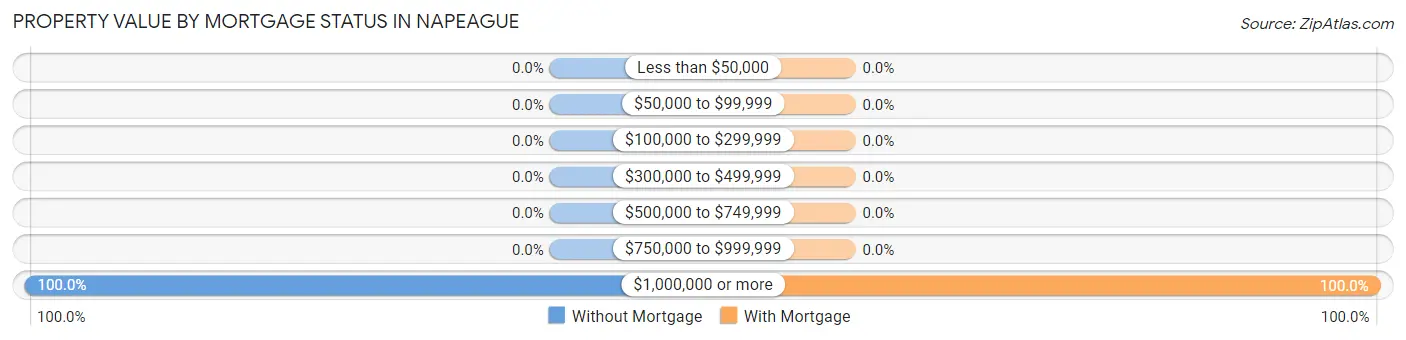
| Property Value | Without Mortgage | With Mortgage |
| Less than $50,000 | 0 (0.0%) | 0 (0.0%) |
| $50,000 to $99,999 | 0 (0.0%) | 0 (0.0%) |
| $100,000 to $299,999 | 0 (0.0%) | 0 (0.0%) |
| $300,000 to $499,999 | 0 (0.0%) | 0 (0.0%) |
| $500,000 to $749,999 | 0 (0.0%) | 0 (0.0%) |
| $750,000 to $999,999 | 0 (0.0%) | 0 (0.0%) |
| $1,000,000 or more | 13 (100.0%) | 5 (100.0%) |
| Total | 13 (100.0%) | 5 (100.0%) |
Household Income by Mortgage Status in Napeague
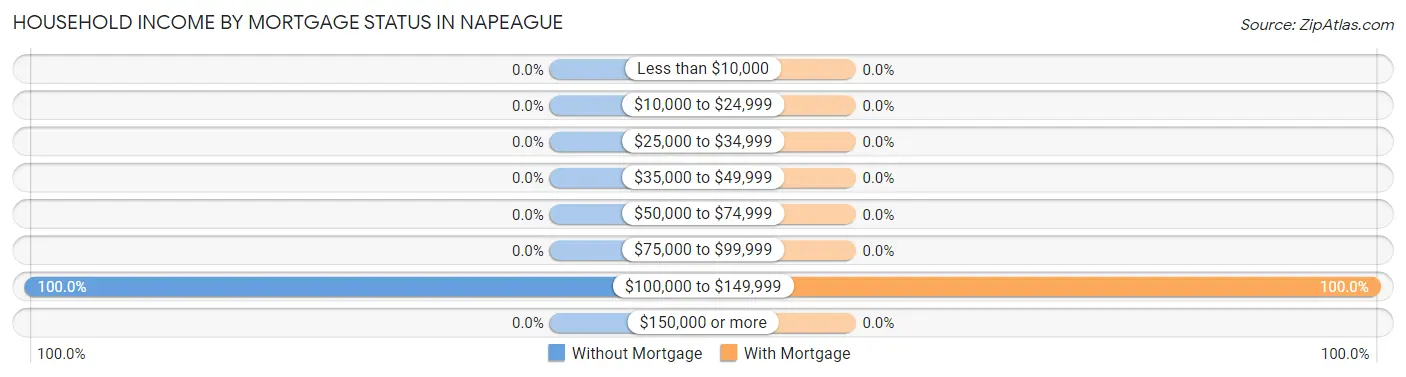
| Household Income | Without Mortgage | With Mortgage |
| Less than $10,000 | 0 (0.0%) | 0 (0.0%) |
| $10,000 to $24,999 | 0 (0.0%) | 0 (0.0%) |
| $25,000 to $34,999 | 0 (0.0%) | 0 (0.0%) |
| $35,000 to $49,999 | 0 (0.0%) | 0 (0.0%) |
| $50,000 to $74,999 | 0 (0.0%) | 0 (0.0%) |
| $75,000 to $99,999 | 0 (0.0%) | 0 (0.0%) |
| $100,000 to $149,999 | 13 (100.0%) | 5 (100.0%) |
| $150,000 or more | 0 (0.0%) | 0 (0.0%) |
| Total | 13 (100.0%) | 5 (100.0%) |
Property Value to Household Income Ratio in Napeague
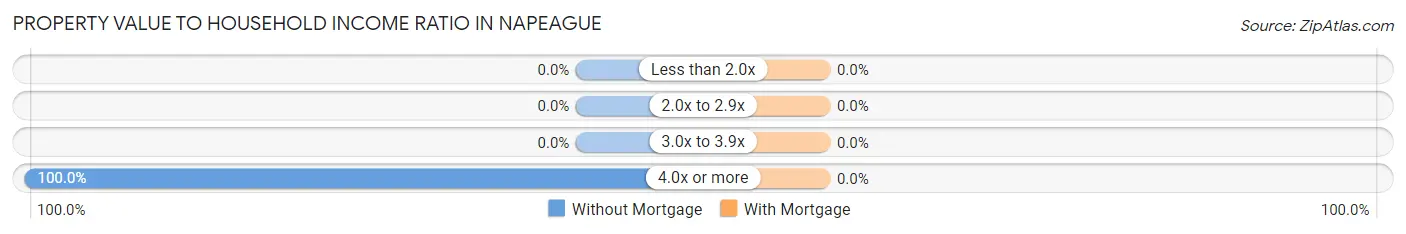
| Value-to-Income Ratio | Without Mortgage | With Mortgage |
| Less than 2.0x | 0 (0.0%) | 0 (0.0%) |
| 2.0x to 2.9x | 0 (0.0%) | 0 (0.0%) |
| 3.0x to 3.9x | 0 (0.0%) | 0 (0.0%) |
| 4.0x or more | 13 (100.0%) | 0 (0.0%) |
| Total | 13 (100.0%) | 5 (100.0%) |
Real Estate Taxes by Mortgage Status in Napeague
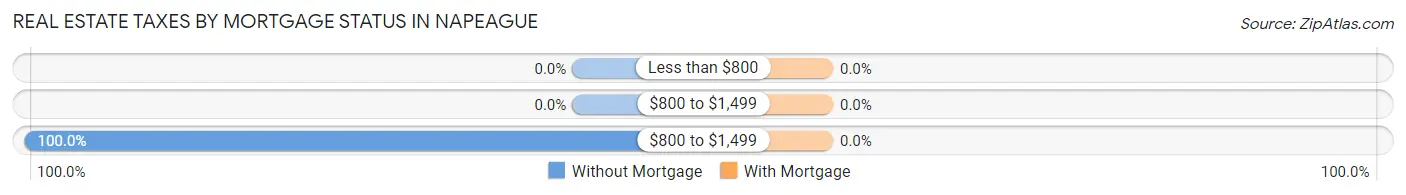
| Property Taxes | Without Mortgage | With Mortgage |
| Less than $800 | 0 (0.0%) | 0 (0.0%) |
| $800 to $1,499 | 0 (0.0%) | 0 (0.0%) |
| $800 to $1,499 | 13 (100.0%) | 0 (0.0%) |
| Total | 13 (100.0%) | 5 (100.0%) |
Health & Disability in Napeague
Health Insurance Coverage by Age in Napeague
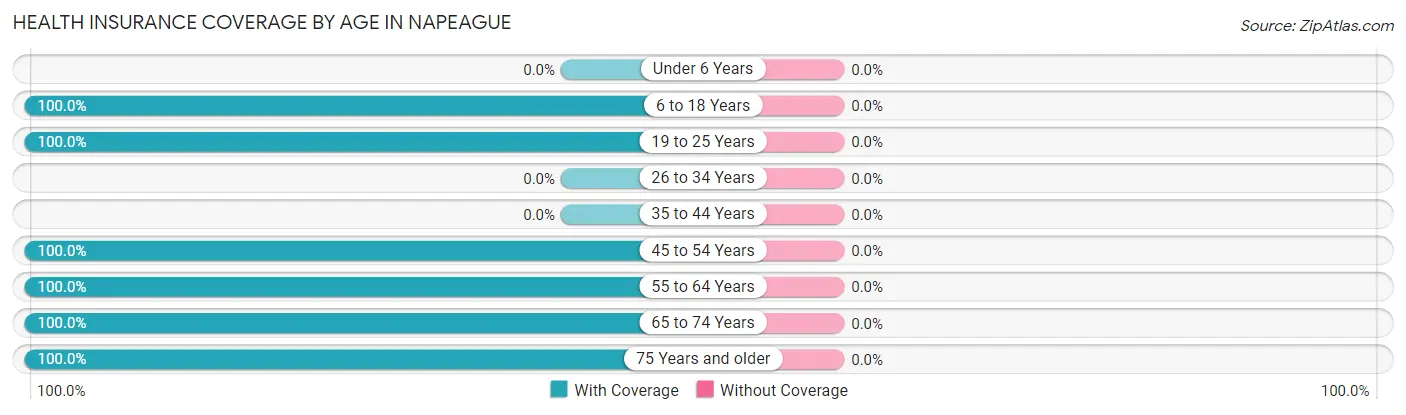
| Age Bracket | With Coverage | Without Coverage |
| Under 6 Years | 0 (0.0%) | 0 (0.0%) |
| 6 to 18 Years | 36 (100.0%) | 0 (0.0%) |
| 19 to 25 Years | 32 (100.0%) | 0 (0.0%) |
| 26 to 34 Years | 0 (0.0%) | 0 (0.0%) |
| 35 to 44 Years | 0 (0.0%) | 0 (0.0%) |
| 45 to 54 Years | 46 (100.0%) | 0 (0.0%) |
| 55 to 64 Years | 16 (100.0%) | 0 (0.0%) |
| 65 to 74 Years | 13 (100.0%) | 0 (0.0%) |
| 75 Years and older | 11 (100.0%) | 0 (0.0%) |
| Total | 154 (100.0%) | 0 (0.0%) |
Health Insurance Coverage by Citizenship Status in Napeague
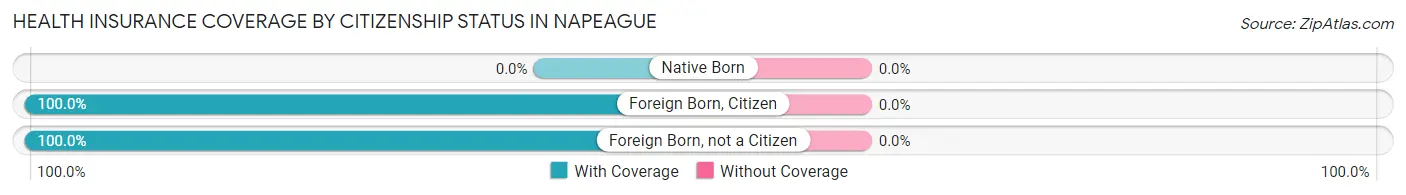
| Citizenship Status | With Coverage | Without Coverage |
| Native Born | 0 (0.0%) | 0 (0.0%) |
| Foreign Born, Citizen | 36 (100.0%) | 0 (0.0%) |
| Foreign Born, not a Citizen | 32 (100.0%) | 0 (0.0%) |
Health Insurance Coverage by Household Income in Napeague
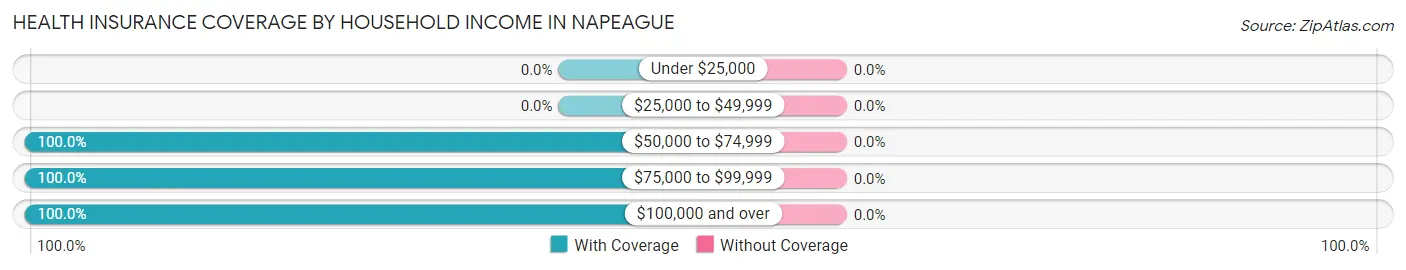
| Household Income | With Coverage | Without Coverage |
| Under $25,000 | 0 (0.0%) | 0 (0.0%) |
| $25,000 to $49,999 | 0 (0.0%) | 0 (0.0%) |
| $50,000 to $74,999 | 48 (100.0%) | 0 (0.0%) |
| $75,000 to $99,999 | 93 (100.0%) | 0 (0.0%) |
| $100,000 and over | 13 (100.0%) | 0 (0.0%) |
Public vs Private Health Insurance Coverage by Age in Napeague
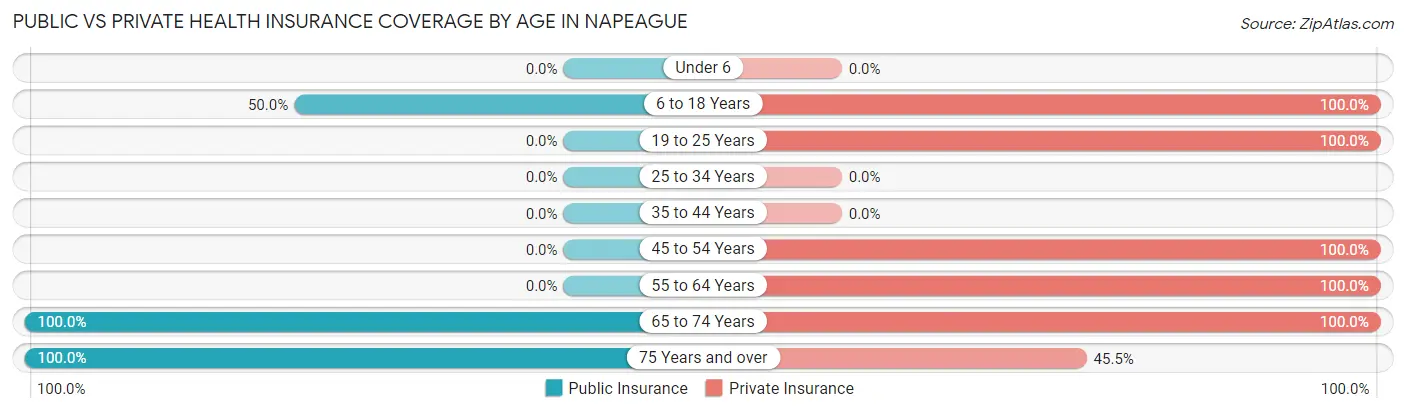
| Age Bracket | Public Insurance | Private Insurance |
| Under 6 | 0 (0.0%) | 0 (0.0%) |
| 6 to 18 Years | 18 (50.0%) | 36 (100.0%) |
| 19 to 25 Years | 0 (0.0%) | 32 (100.0%) |
| 25 to 34 Years | 0 (0.0%) | 0 (0.0%) |
| 35 to 44 Years | 0 (0.0%) | 0 (0.0%) |
| 45 to 54 Years | 0 (0.0%) | 46 (100.0%) |
| 55 to 64 Years | 0 (0.0%) | 16 (100.0%) |
| 65 to 74 Years | 13 (100.0%) | 13 (100.0%) |
| 75 Years and over | 11 (100.0%) | 5 (45.5%) |
| Total | 42 (27.3%) | 148 (96.1%) |
Disability Status by Sex by Age in Napeague
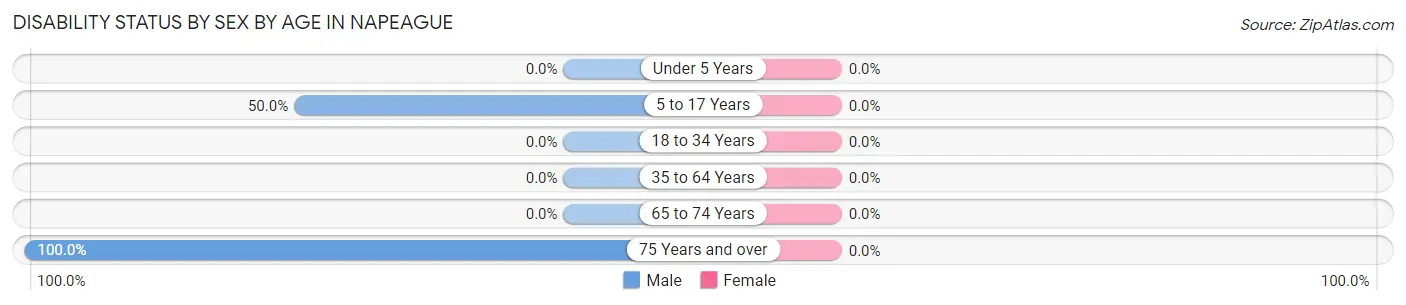
| Age Bracket | Male | Female |
| Under 5 Years | 0 (0.0%) | 0 (0.0%) |
| 5 to 17 Years | 18 (50.0%) | 0 (0.0%) |
| 18 to 34 Years | 0 (0.0%) | 0 (0.0%) |
| 35 to 64 Years | 0 (0.0%) | 0 (0.0%) |
| 65 to 74 Years | 0 (0.0%) | 0 (0.0%) |
| 75 Years and over | 5 (100.0%) | 0 (0.0%) |
Disability Class by Sex by Age in Napeague
Disability Class: Hearing Difficulty
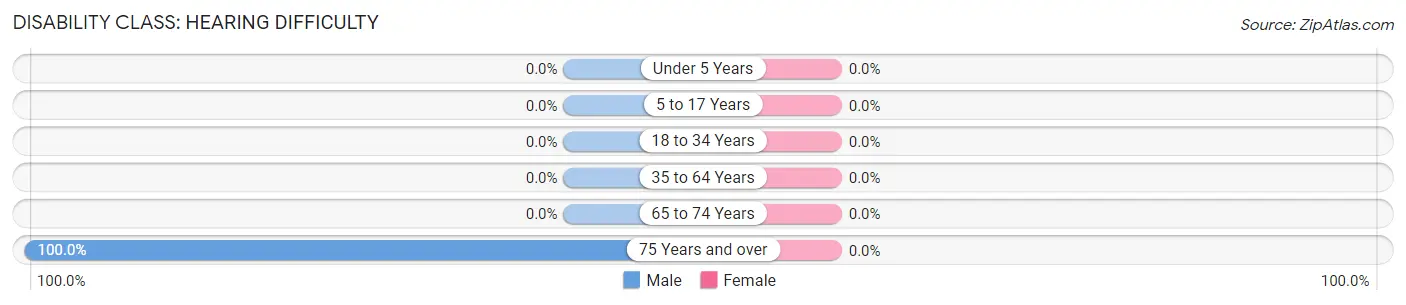
| Age Bracket | Male | Female |
| Under 5 Years | 0 (0.0%) | 0 (0.0%) |
| 5 to 17 Years | 0 (0.0%) | 0 (0.0%) |
| 18 to 34 Years | 0 (0.0%) | 0 (0.0%) |
| 35 to 64 Years | 0 (0.0%) | 0 (0.0%) |
| 65 to 74 Years | 0 (0.0%) | 0 (0.0%) |
| 75 Years and over | 5 (100.0%) | 0 (0.0%) |
Disability Class: Vision Difficulty
| Age Bracket | Male | Female |
| Under 5 Years | 0 (0.0%) | 0 (0.0%) |
| 5 to 17 Years | 0 (0.0%) | 0 (0.0%) |
| 18 to 34 Years | 0 (0.0%) | 0 (0.0%) |
| 35 to 64 Years | 0 (0.0%) | 0 (0.0%) |
| 65 to 74 Years | 0 (0.0%) | 0 (0.0%) |
| 75 Years and over | 0 (0.0%) | 0 (0.0%) |
Disability Class: Cognitive Difficulty
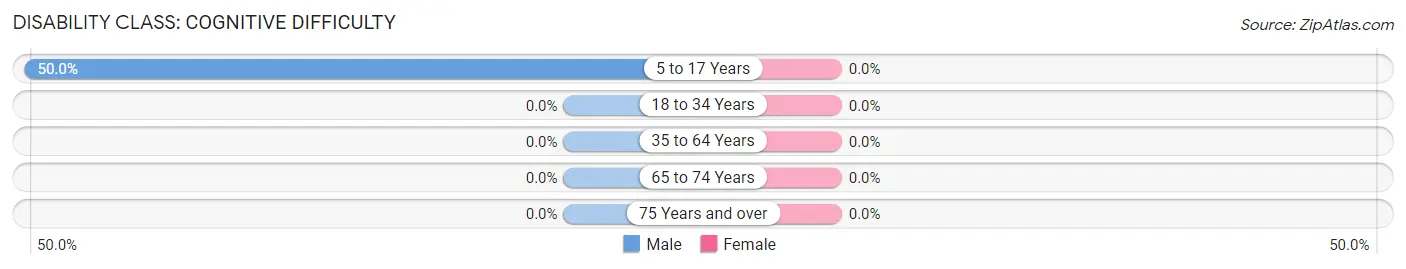
| Age Bracket | Male | Female |
| 5 to 17 Years | 18 (50.0%) | 0 (0.0%) |
| 18 to 34 Years | 0 (0.0%) | 0 (0.0%) |
| 35 to 64 Years | 0 (0.0%) | 0 (0.0%) |
| 65 to 74 Years | 0 (0.0%) | 0 (0.0%) |
| 75 Years and over | 0 (0.0%) | 0 (0.0%) |
Disability Class: Ambulatory Difficulty
| Age Bracket | Male | Female |
| 5 to 17 Years | 0 (0.0%) | 0 (0.0%) |
| 18 to 34 Years | 0 (0.0%) | 0 (0.0%) |
| 35 to 64 Years | 0 (0.0%) | 0 (0.0%) |
| 65 to 74 Years | 0 (0.0%) | 0 (0.0%) |
| 75 Years and over | 0 (0.0%) | 0 (0.0%) |
Disability Class: Self-Care Difficulty
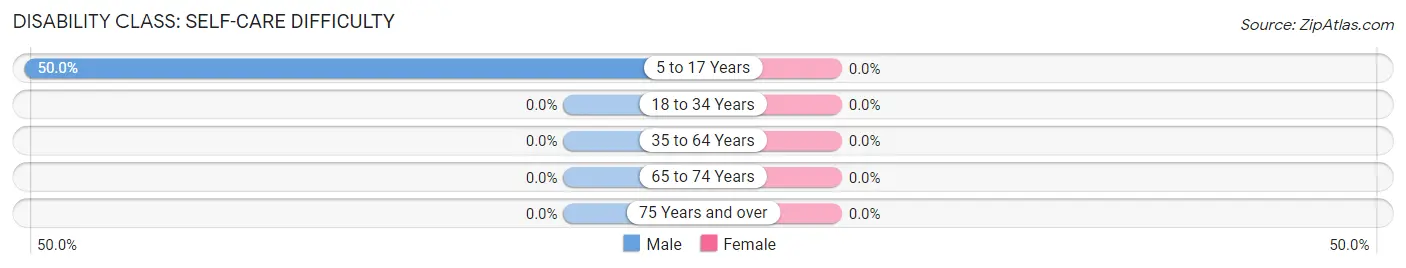
| Age Bracket | Male | Female |
| 5 to 17 Years | 18 (50.0%) | 0 (0.0%) |
| 18 to 34 Years | 0 (0.0%) | 0 (0.0%) |
| 35 to 64 Years | 0 (0.0%) | 0 (0.0%) |
| 65 to 74 Years | 0 (0.0%) | 0 (0.0%) |
| 75 Years and over | 0 (0.0%) | 0 (0.0%) |
Technology Access in Napeague
Computing Device Access in Napeague
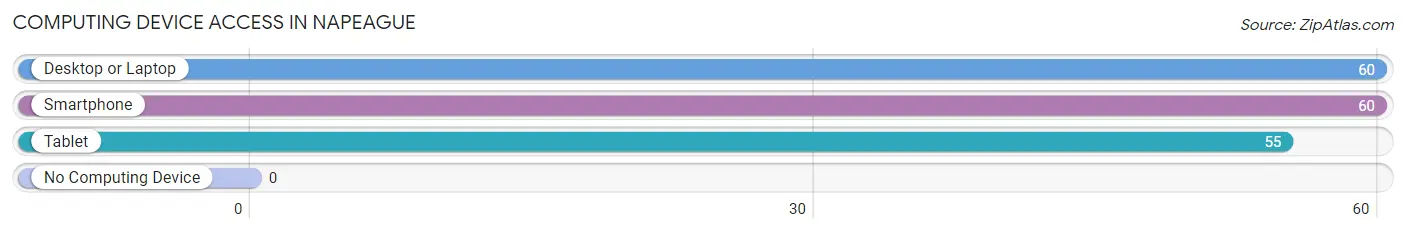
| Device Type | # Households | % Households |
| Desktop or Laptop | 60 | 100.0% |
| Smartphone | 60 | 100.0% |
| Tablet | 55 | 91.7% |
| No Computing Device | 0 | 0.0% |
| Total | 60 | 100.0% |
Internet Access in Napeague
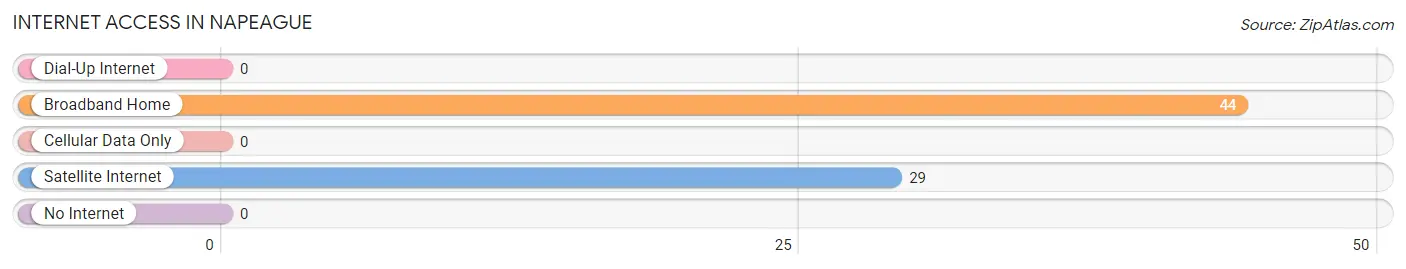
| Internet Type | # Households | % Households |
| Dial-Up Internet | 0 | 0.0% |
| Broadband Home | 44 | 73.3% |
| Cellular Data Only | 0 | 0.0% |
| Satellite Internet | 29 | 48.3% |
| No Internet | 0 | 0.0% |
| Total | 60 | 100.0% |
Napeague Summary
Napeague is a small hamlet located in the Town of East Hampton in Suffolk County, New York. It is situated on the eastern end of Long Island, approximately 100 miles east of New York City. Napeague is bordered by the Atlantic Ocean to the south, Gardiners Bay to the north, and Amagansett to the west. The hamlet is home to a variety of businesses, including a marina, a seafood market, and a few restaurants.
History
The area now known as Napeague was originally inhabited by the Montaukett Native American tribe. The Montaukett were a part of the Algonquian-speaking peoples who lived in the area for thousands of years before the arrival of Europeans. The first Europeans to settle in the area were English colonists in the late 17th century. The hamlet was originally known as "Napeague Harbor" and was a popular fishing and whaling port.
In the late 19th century, Napeague began to develop as a summer resort destination. The area was popular with wealthy New Yorkers who built large summer homes along the shoreline. The hamlet was also home to a number of hotels and inns, which catered to the summer visitors.
In the early 20th century, Napeague began to decline as a resort destination. The Great Depression and World War II caused many of the summer visitors to stay away. The hamlet was also affected by the construction of the Long Island Expressway, which cut off access to the area.
Geography
Napeague is located on the eastern end of Long Island, approximately 100 miles east of New York City. The hamlet is bordered by the Atlantic Ocean to the south, Gardiners Bay to the north, and Amagansett to the west. The area is mostly flat, with some low hills in the northern part of the hamlet.
The climate in Napeague is typical of the Northeastern United States, with cold winters and hot, humid summers. The average annual temperature is around 50°F (10°C). The average annual precipitation is around 45 inches (114 cm).
Economy
The economy of Napeague is largely based on tourism and fishing. The hamlet is home to a number of businesses, including a marina, a seafood market, and a few restaurants. The area is also popular with recreational fishermen, who come to the area to fish for striped bass, fluke, and other species.
Demographics
As of the 2010 census, the population of Napeague was 1,093. The racial makeup of the hamlet was 94.3% White, 1.2% African American, 0.3% Native American, 0.7% Asian, 0.1% Pacific Islander, and 3.4% from other races. The median household income was $68,750, and the median family income was $76,250.
Napeague is a small, close-knit community. The hamlet is home to a variety of businesses, including a marina, a seafood market, and a few restaurants. The area is also popular with recreational fishermen, who come to the area to fish for striped bass, fluke, and other species. The hamlet is also home to a number of summer homes, which are popular with wealthy New Yorkers.
Common Questions
What is Per Capita Income in Napeague?
Per Capita income in Napeague is $29,047.
What is the Median Family Income in Napeague?
Median Family Income in Napeague is $80,240.
What is the Median Household income in Napeague?
Median Household Income in Napeague is $80,865.
What is Inequality or Gini Index in Napeague?
Inequality or Gini Index in Napeague is 0.12.
What is the Total Population of Napeague?
Total Population of Napeague is 154.
What is the Total Male Population of Napeague?
Total Male Population of Napeague is 77.
What is the Total Female Population of Napeague?
Total Female Population of Napeague is 77.
What is the Ratio of Males per 100 Females in Napeague?
There are 100.00 Males per 100 Females in Napeague.
What is the Ratio of Females per 100 Males in Napeague?
There are 100.00 Females per 100 Males in Napeague.
What is the Median Population Age in Napeague?
Median Population Age in Napeague is 45.5 Years.
What is the Average Family Size in Napeague
Average Family Size in Napeague is 3.0 People.
What is the Average Household Size in Napeague
Average Household Size in Napeague is 2.6 People.
How Large is the Labor Force in Napeague?
There are 83 People in the Labor Forcein in Napeague.
What is the Percentage of People in the Labor Force in Napeague?
70.3% of People are in the Labor Force in Napeague.