Luverne, MN Map & Demographics
Luverne Map
Luverne Overview
$37,250
PER CAPITA INCOME
$92,000
AVG FAMILY INCOME
$66,394
AVG HOUSEHOLD INCOME
15.7%
WAGE / INCOME GAP [ % ]
84.3¢/ $1
WAGE / INCOME GAP [ $ ]
0.45
INEQUALITY / GINI INDEX
4,910
TOTAL POPULATION
2,300
MALE POPULATION
2,610
FEMALE POPULATION
88.12
MALES / 100 FEMALES
113.48
FEMALES / 100 MALES
38.5
MEDIAN AGE
3.0
AVG FAMILY SIZE
2.3
AVG HOUSEHOLD SIZE
2,558
LABOR FORCE [ PEOPLE ]
67.1%
PERCENT IN LABOR FORCE
2.2%
UNEMPLOYMENT RATE
Luverne Zip Codes
Luverne Area Codes
Income in Luverne
Income Overview in Luverne
Per Capita Income in Luverne is $37,250, while median incomes of families and households are $92,000 and $66,394 respectively.
| Characteristic | Number | Measure |
| Per Capita Income | 4,910 | $37,250 |
| Median Family Income | 1,222 | $92,000 |
| Mean Family Income | 1,222 | $98,158 |
| Median Household Income | 2,065 | $66,394 |
| Mean Household Income | 2,065 | $85,085 |
| Income Deficit | 1,222 | $0 |
| Wage / Income Gap (%) | 4,910 | 15.70% |
| Wage / Income Gap ($) | 4,910 | 84.30¢ per $1 |
| Gini / Inequality Index | 4,910 | 0.45 |
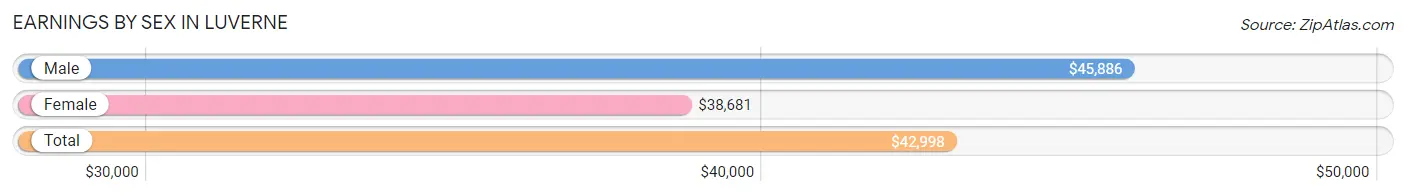
Earnings by Sex in Luverne
Average Earnings in Luverne are $42,998, $45,886 for men and $38,681 for women, a difference of 15.7%.
| Sex | Number | Average Earnings |
| Male | 1,309 (47.8%) | $45,886 |
| Female | 1,428 (52.2%) | $38,681 |
| Total | 2,737 (100.0%) | $42,998 |
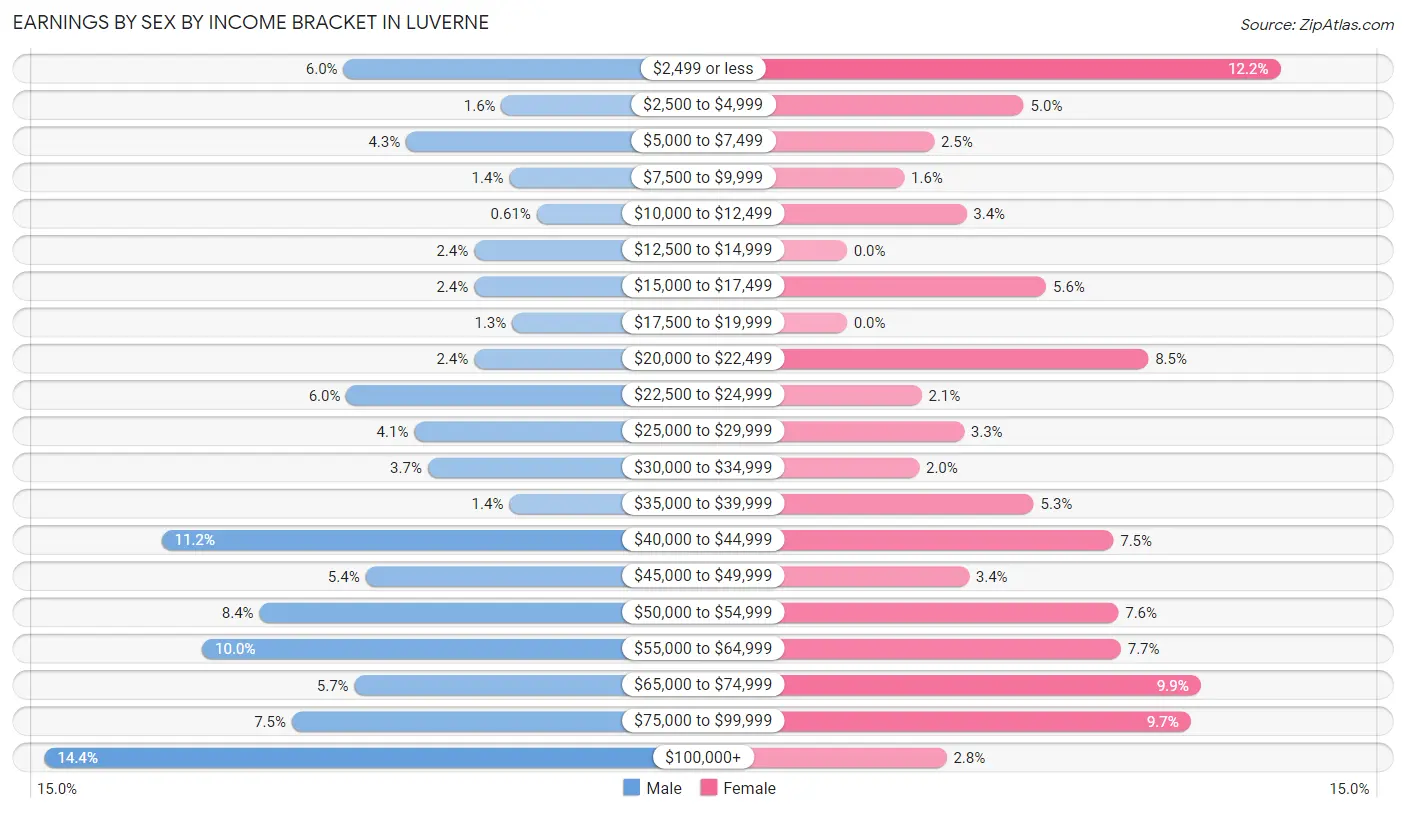
Earnings by Sex by Income Bracket in Luverne
The most common earnings brackets in Luverne are $100,000+ for men (189 | 14.4%) and $2,499 or less for women (174 | 12.2%).
| Income | Male | Female |
| $2,499 or less | 79 (6.0%) | 174 (12.2%) |
| $2,500 to $4,999 | 21 (1.6%) | 71 (5.0%) |
| $5,000 to $7,499 | 56 (4.3%) | 35 (2.5%) |
| $7,500 to $9,999 | 18 (1.4%) | 23 (1.6%) |
| $10,000 to $12,499 | 8 (0.6%) | 48 (3.4%) |
| $12,500 to $14,999 | 31 (2.4%) | 0 (0.0%) |
| $15,000 to $17,499 | 31 (2.4%) | 80 (5.6%) |
| $17,500 to $19,999 | 17 (1.3%) | 0 (0.0%) |
| $20,000 to $22,499 | 31 (2.4%) | 121 (8.5%) |
| $22,500 to $24,999 | 78 (6.0%) | 30 (2.1%) |
| $25,000 to $29,999 | 53 (4.1%) | 47 (3.3%) |
| $30,000 to $34,999 | 48 (3.7%) | 29 (2.0%) |
| $35,000 to $39,999 | 18 (1.4%) | 75 (5.2%) |
| $40,000 to $44,999 | 146 (11.2%) | 107 (7.5%) |
| $45,000 to $49,999 | 71 (5.4%) | 49 (3.4%) |
| $50,000 to $54,999 | 110 (8.4%) | 109 (7.6%) |
| $55,000 to $64,999 | 131 (10.0%) | 110 (7.7%) |
| $65,000 to $74,999 | 75 (5.7%) | 142 (9.9%) |
| $75,000 to $99,999 | 98 (7.5%) | 138 (9.7%) |
| $100,000+ | 189 (14.4%) | 40 (2.8%) |
| Total | 1,309 (100.0%) | 1,428 (100.0%) |
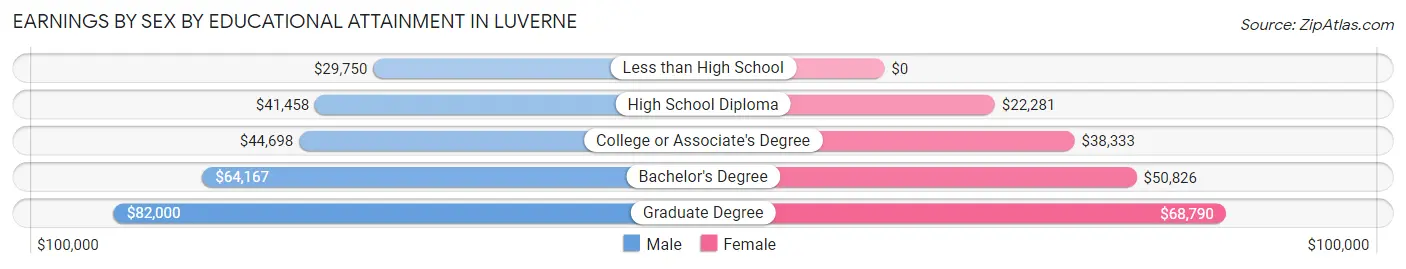
Earnings by Sex by Educational Attainment in Luverne
Average earnings in Luverne are $51,855 for men and $44,237 for women, a difference of 14.7%. Men with an educational attainment of graduate degree enjoy the highest average annual earnings of $82,000, while those with less than high school education earn the least with $29,750. Women with an educational attainment of graduate degree earn the most with the average annual earnings of $68,790, while those with high school diploma education have the smallest earnings of $22,281.
| Educational Attainment | Male Income | Female Income |
| Less than High School | $29,750 | $0 |
| High School Diploma | $41,458 | $22,281 |
| College or Associate's Degree | $44,698 | $38,333 |
| Bachelor's Degree | $64,167 | $50,826 |
| Graduate Degree | $82,000 | $68,790 |
| Total | $51,855 | $44,237 |
Family Income in Luverne
Family Income Brackets in Luverne
According to the Luverne family income data, there are 281 families falling into the $75,000 to $99,999 income range, which is the most common income bracket and makes up 23.0% of all families. Conversely, the less than $10,000 income bracket is the least frequent group with only 7 families (0.6%) belonging to this category.
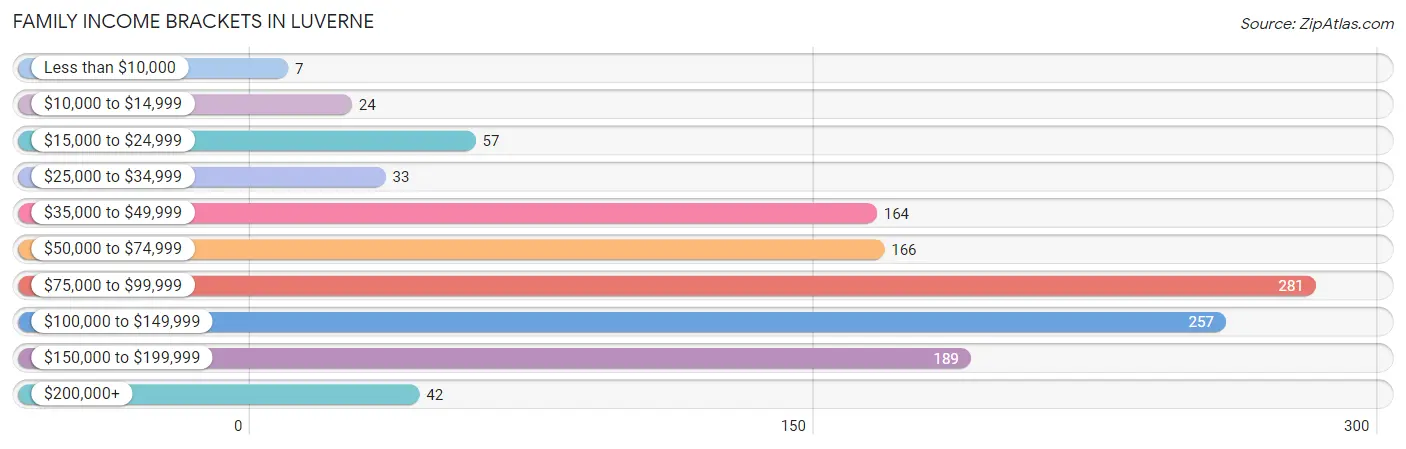
| Income Bracket | # Families | % Families |
| Less than $10,000 | 7 | 0.6% |
| $10,000 to $14,999 | 24 | 2.0% |
| $15,000 to $24,999 | 57 | 4.7% |
| $25,000 to $34,999 | 33 | 2.7% |
| $35,000 to $49,999 | 164 | 13.4% |
| $50,000 to $74,999 | 166 | 13.6% |
| $75,000 to $99,999 | 281 | 23.0% |
| $100,000 to $149,999 | 257 | 21.0% |
| $150,000 to $199,999 | 189 | 15.5% |
| $200,000+ | 42 | 3.4% |
Family Income by Famaliy Size in Luverne
6-person families (67 | 5.5%) account for the highest median family income in Luverne with $148,438 per family, while 2-person families (755 | 61.8%) have the highest median income of $44,114 per family member.
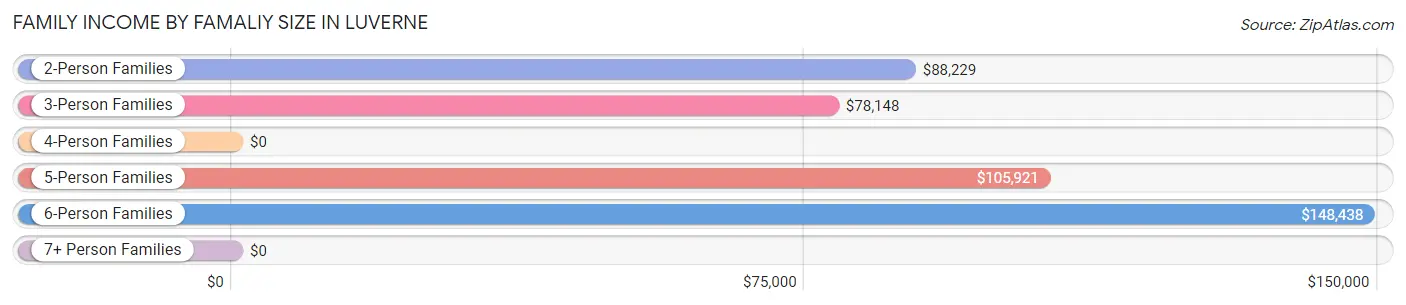
| Income Bracket | # Families | Median Income |
| 2-Person Families | 755 (61.8%) | $88,229 |
| 3-Person Families | 168 (13.8%) | $78,148 |
| 4-Person Families | 128 (10.5%) | $0 |
| 5-Person Families | 68 (5.6%) | $105,921 |
| 6-Person Families | 67 (5.5%) | $148,438 |
| 7+ Person Families | 36 (2.9%) | $0 |
| Total | 1,222 (100.0%) | $92,000 |
Family Income by Number of Earners in Luverne
The median family income in Luverne is $92,000, with families comprising 3+ earners (77) having the highest median family income of $117,679, while families with 1 earner (394) have the lowest median family income of $70,833, accounting for 6.3% and 32.2% of families, respectively.
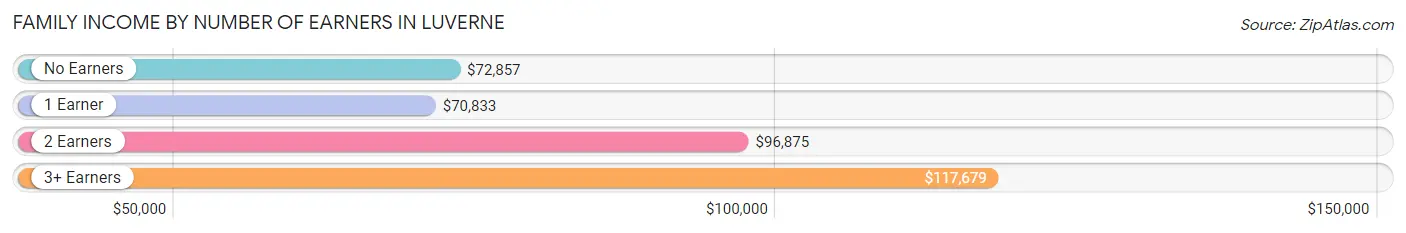
| Number of Earners | # Families | Median Income |
| No Earners | 120 (9.8%) | $72,857 |
| 1 Earner | 394 (32.2%) | $70,833 |
| 2 Earners | 631 (51.6%) | $96,875 |
| 3+ Earners | 77 (6.3%) | $117,679 |
| Total | 1,222 (100.0%) | $92,000 |
Household Income in Luverne
Household Income Brackets in Luverne
With 374 households falling in the category, the $75,000 to $99,999 income range is the most frequent in Luverne, accounting for 18.1% of all households. In contrast, only 87 households (4.2%) fall into the $10,000 to $14,999 income bracket, making it the least populous group.
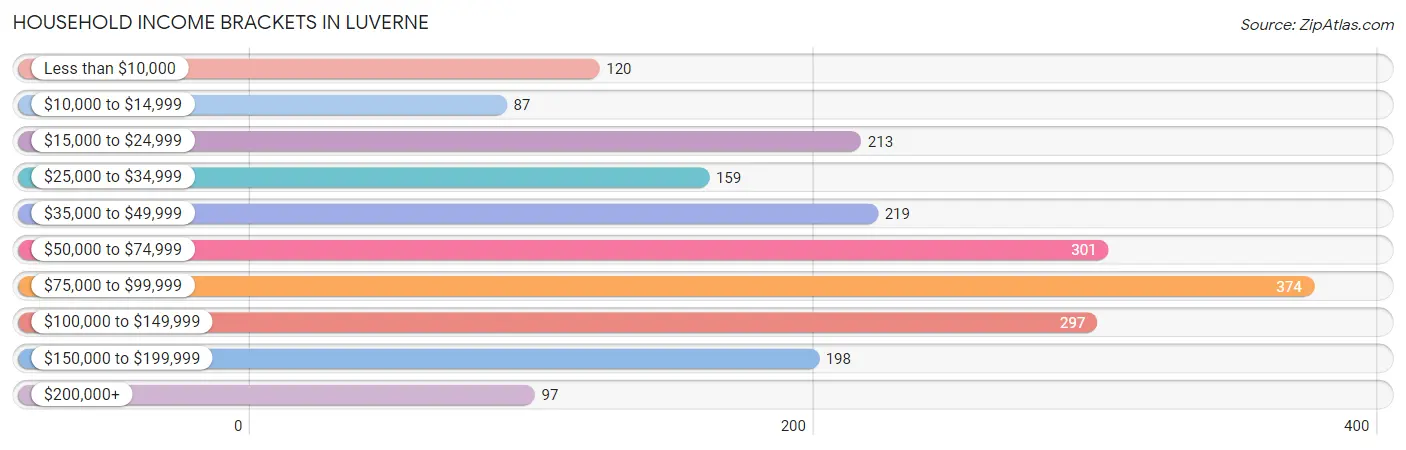
| Income Bracket | # Households | % Households |
| Less than $10,000 | 120 | 5.8% |
| $10,000 to $14,999 | 87 | 4.2% |
| $15,000 to $24,999 | 213 | 10.3% |
| $25,000 to $34,999 | 159 | 7.7% |
| $35,000 to $49,999 | 219 | 10.6% |
| $50,000 to $74,999 | 301 | 14.6% |
| $75,000 to $99,999 | 374 | 18.1% |
| $100,000 to $149,999 | 297 | 14.4% |
| $150,000 to $199,999 | 198 | 9.6% |
| $200,000+ | 97 | 4.7% |
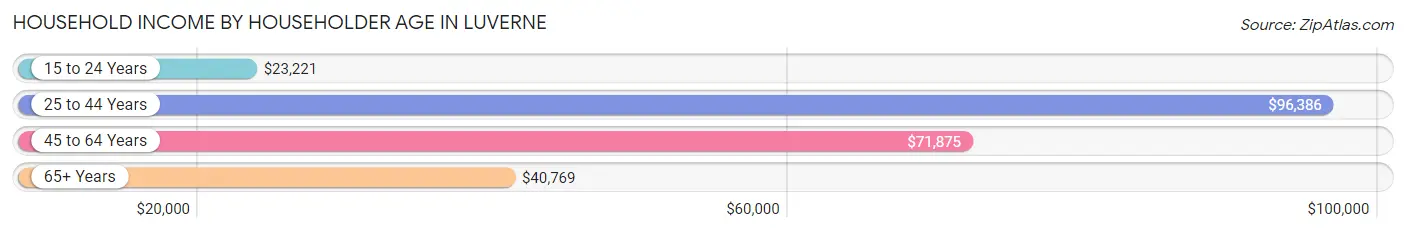
Household Income by Householder Age in Luverne
The median household income in Luverne is $66,394, with the highest median household income of $96,386 found in the 25 to 44 years age bracket for the primary householder. A total of 657 households (31.8%) fall into this category. Meanwhile, the 15 to 24 years age bracket for the primary householder has the lowest median household income of $23,221, with 125 households (6.0%) in this group.
| Income Bracket | # Households | Median Income |
| 15 to 24 Years | 125 (6.0%) | $23,221 |
| 25 to 44 Years | 657 (31.8%) | $96,386 |
| 45 to 64 Years | 623 (30.2%) | $71,875 |
| 65+ Years | 660 (32.0%) | $40,769 |
| Total | 2,065 (100.0%) | $66,394 |
Poverty in Luverne
Income Below Poverty by Sex and Age in Luverne
With 8.8% poverty level for males and 9.7% for females among the residents of Luverne, 18 to 24 year old males and 6 to 11 year old females are the most vulnerable to poverty, with 56 males (28.3%) and 48 females (22.6%) in their respective age groups living below the poverty level.
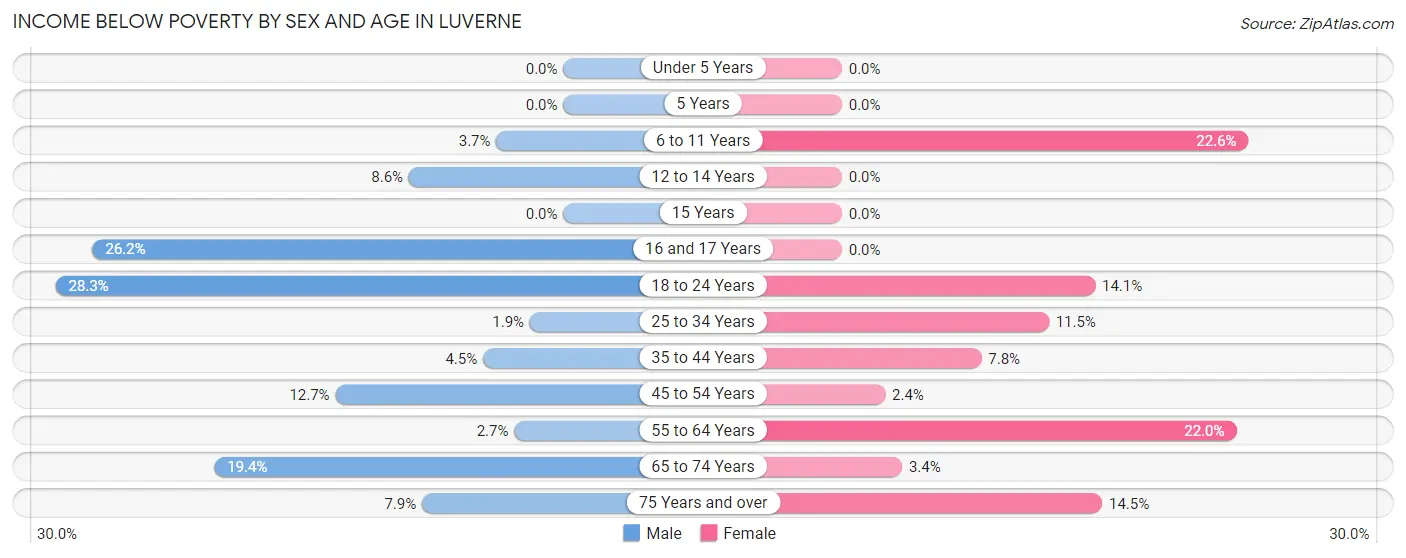
| Age Bracket | Male | Female |
| Under 5 Years | 0 (0.0%) | 0 (0.0%) |
| 5 Years | 0 (0.0%) | 0 (0.0%) |
| 6 to 11 Years | 9 (3.7%) | 48 (22.6%) |
| 12 to 14 Years | 8 (8.6%) | 0 (0.0%) |
| 15 Years | 0 (0.0%) | 0 (0.0%) |
| 16 and 17 Years | 16 (26.2%) | 0 (0.0%) |
| 18 to 24 Years | 56 (28.3%) | 22 (14.1%) |
| 25 to 34 Years | 6 (1.9%) | 38 (11.5%) |
| 35 to 44 Years | 11 (4.5%) | 24 (7.8%) |
| 45 to 54 Years | 25 (12.7%) | 7 (2.4%) |
| 55 to 64 Years | 7 (2.7%) | 58 (22.0%) |
| 65 to 74 Years | 42 (19.4%) | 9 (3.4%) |
| 75 Years and over | 14 (7.9%) | 40 (14.5%) |
| Total | 194 (8.8%) | 246 (9.7%) |
Income Above Poverty by Sex and Age in Luverne
According to the poverty statistics in Luverne, males aged under 5 years and females aged under 5 years are the age groups that are most secure financially, with 100.0% of males and 100.0% of females in these age groups living above the poverty line.
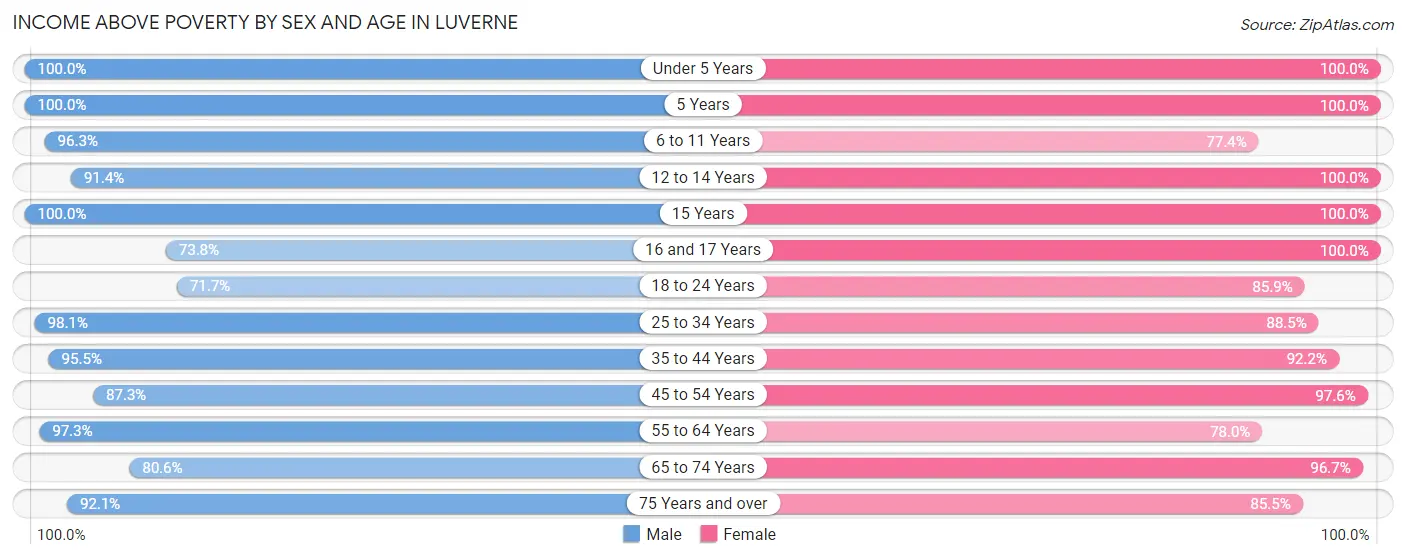
| Age Bracket | Male | Female |
| Under 5 Years | 136 (100.0%) | 133 (100.0%) |
| 5 Years | 44 (100.0%) | 16 (100.0%) |
| 6 to 11 Years | 232 (96.3%) | 164 (77.4%) |
| 12 to 14 Years | 85 (91.4%) | 172 (100.0%) |
| 15 Years | 20 (100.0%) | 24 (100.0%) |
| 16 and 17 Years | 45 (73.8%) | 75 (100.0%) |
| 18 to 24 Years | 142 (71.7%) | 134 (85.9%) |
| 25 to 34 Years | 317 (98.1%) | 292 (88.5%) |
| 35 to 44 Years | 235 (95.5%) | 285 (92.2%) |
| 45 to 54 Years | 172 (87.3%) | 284 (97.6%) |
| 55 to 64 Years | 249 (97.3%) | 206 (78.0%) |
| 65 to 74 Years | 174 (80.6%) | 260 (96.7%) |
| 75 Years and over | 164 (92.1%) | 236 (85.5%) |
| Total | 2,015 (91.2%) | 2,281 (90.3%) |
Income Below Poverty Among Married-Couple Families in Luverne
The poverty statistics for married-couple families in Luverne show that 3.4% or 31 of the total 920 families live below the poverty line. Families with 1 or 2 children have the highest poverty rate of 13.4%, comprising of 24 families. On the other hand, families with 3 or 4 children have the lowest poverty rate of 0.0%, which includes 0 families.
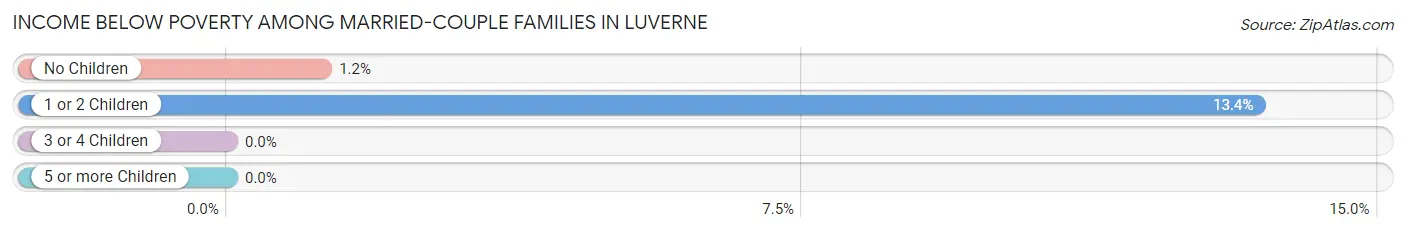
| Children | Above Poverty | Below Poverty |
| No Children | 563 (98.8%) | 7 (1.2%) |
| 1 or 2 Children | 155 (86.6%) | 24 (13.4%) |
| 3 or 4 Children | 135 (100.0%) | 0 (0.0%) |
| 5 or more Children | 36 (100.0%) | 0 (0.0%) |
| Total | 889 (96.6%) | 31 (3.4%) |
Income Below Poverty Among Single-Parent Households in Luverne
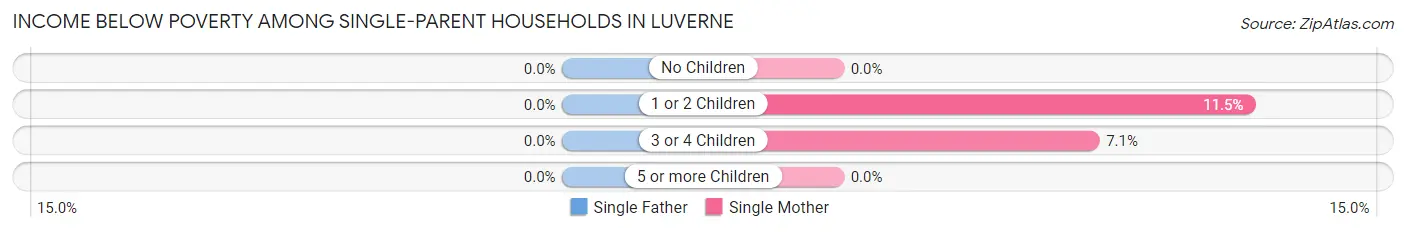
| Children | Single Father | Single Mother |
| No Children | 0 (0.0%) | 0 (0.0%) |
| 1 or 2 Children | 0 (0.0%) | 23 (11.5%) |
| 3 or 4 Children | 0 (0.0%) | 1 (7.1%) |
| 5 or more Children | 0 (0.0%) | 0 (0.0%) |
| Total | 0 (0.0%) | 24 (9.0%) |
Income Below Poverty Among Married-Couple vs Single-Parent Households in Luverne
The poverty data for Luverne shows that 31 of the married-couple family households (3.4%) and 24 of the single-parent households (8.0%) are living below the poverty level. Within the married-couple family households, those with 1 or 2 children have the highest poverty rate, with 24 households (13.4%) falling below the poverty line. Among the single-parent households, those with 1 or 2 children have the highest poverty rate, with 23 household (10.5%) living below poverty.
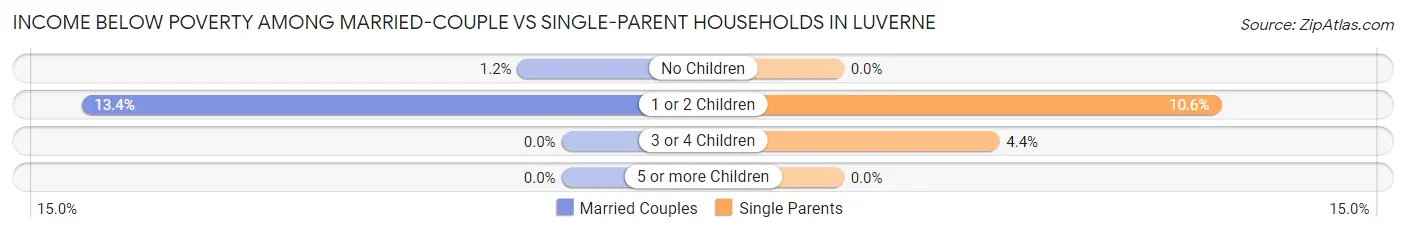
| Children | Married-Couple Families | Single-Parent Households |
| No Children | 7 (1.2%) | 0 (0.0%) |
| 1 or 2 Children | 24 (13.4%) | 23 (10.5%) |
| 3 or 4 Children | 0 (0.0%) | 1 (4.3%) |
| 5 or more Children | 0 (0.0%) | 0 (0.0%) |
| Total | 31 (3.4%) | 24 (8.0%) |
Race in Luverne
The most populous races in Luverne are White / Caucasian (4,641 | 94.5%), Two or more Races (201 | 4.1%), and Hispanic or Latino (181 | 3.7%).
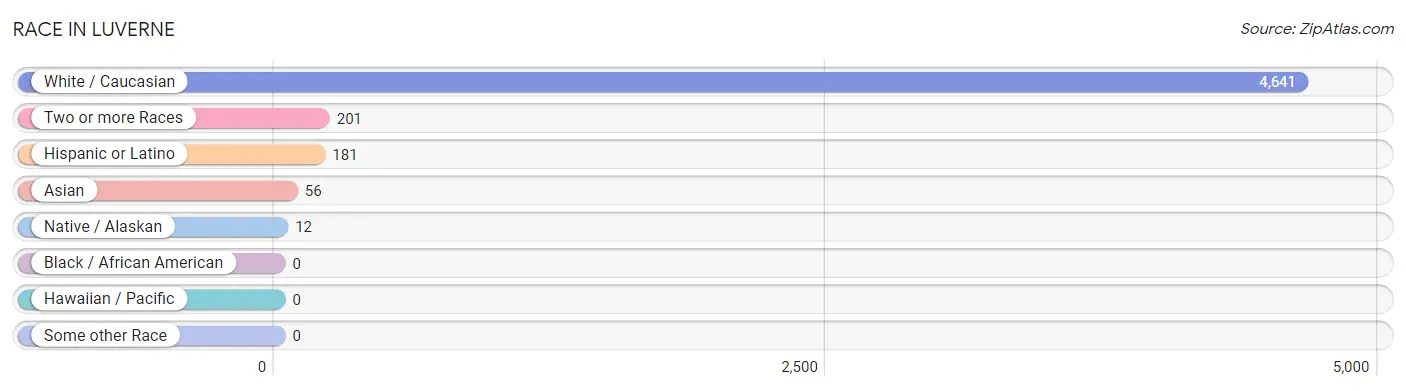
| Race | # Population | % Population |
| Asian | 56 | 1.1% |
| Black / African American | 0 | 0.0% |
| Hawaiian / Pacific | 0 | 0.0% |
| Hispanic or Latino | 181 | 3.7% |
| Native / Alaskan | 12 | 0.2% |
| White / Caucasian | 4,641 | 94.5% |
| Two or more Races | 201 | 4.1% |
| Some other Race | 0 | 0.0% |
| Total | 4,910 | 100.0% |
Ancestry in Luverne
The most populous ancestries reported in Luverne are German (2,148 | 43.8%), Norwegian (920 | 18.7%), Dutch (579 | 11.8%), Irish (364 | 7.4%), and English (174 | 3.5%), together accounting for 85.2% of all Luverne residents.
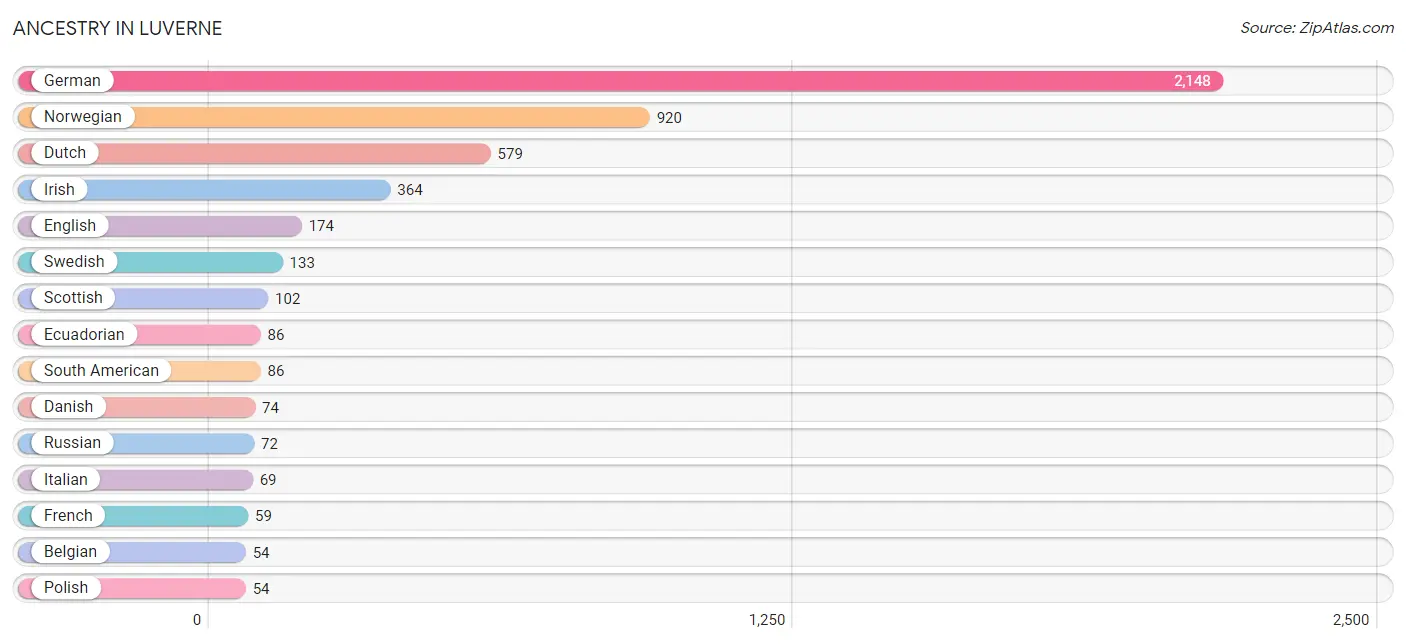
| Ancestry | # Population | % Population |
| American | 42 | 0.9% |
| Arab | 14 | 0.3% |
| Belgian | 54 | 1.1% |
| Canadian | 42 | 0.9% |
| Chippewa | 4 | 0.1% |
| Czech | 37 | 0.7% |
| Danish | 74 | 1.5% |
| Dominican | 37 | 0.7% |
| Dutch | 579 | 11.8% |
| Ecuadorian | 86 | 1.8% |
| Egyptian | 14 | 0.3% |
| English | 174 | 3.5% |
| Estonian | 46 | 0.9% |
| European | 38 | 0.8% |
| Finnish | 6 | 0.1% |
| French | 59 | 1.2% |
| French Canadian | 7 | 0.1% |
| German | 2,148 | 43.8% |
| Irish | 364 | 7.4% |
| Italian | 69 | 1.4% |
| Japanese | 53 | 1.1% |
| Korean | 29 | 0.6% |
| Luxembourger | 6 | 0.1% |
| Mexican | 34 | 0.7% |
| Norwegian | 920 | 18.7% |
| Polish | 54 | 1.1% |
| Puerto Rican | 12 | 0.2% |
| Russian | 72 | 1.5% |
| Scandinavian | 44 | 0.9% |
| Scottish | 102 | 2.1% |
| Sioux | 8 | 0.2% |
| Slovak | 14 | 0.3% |
| Slovene | 33 | 0.7% |
| South American | 86 | 1.8% |
| Swedish | 133 | 2.7% |
| Ukrainian | 11 | 0.2% |
| Welsh | 6 | 0.1% |
| Yugoslavian | 47 | 1.0% | View All 38 Rows |
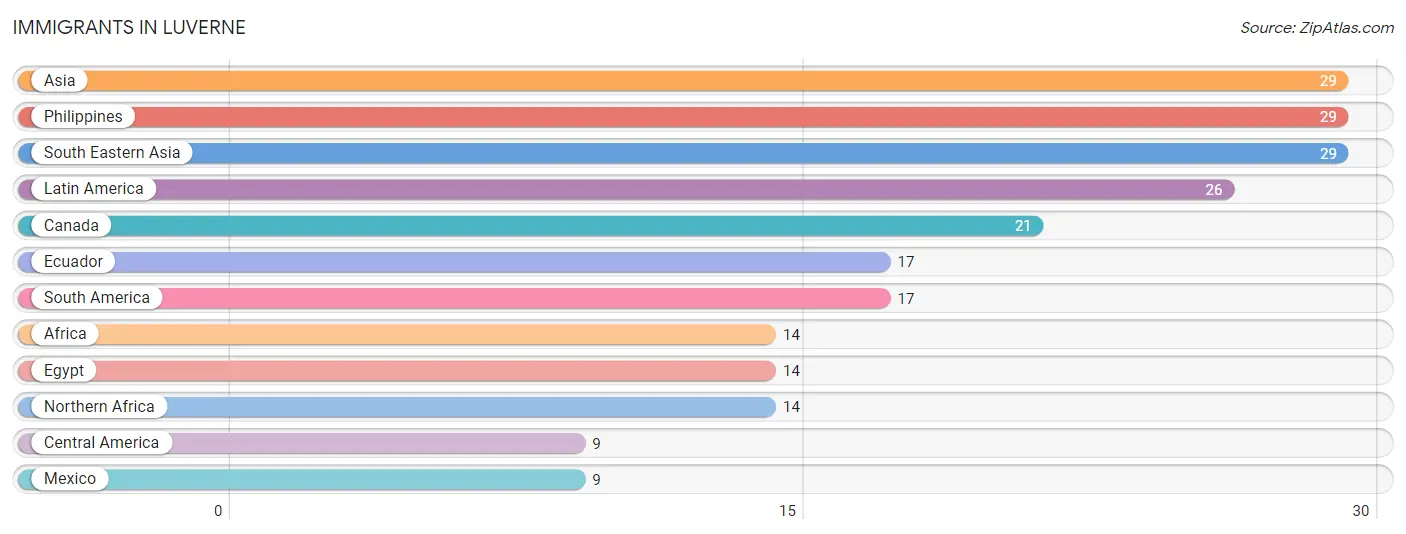
Immigrants in Luverne
The most numerous immigrant groups reported in Luverne came from Asia (29 | 0.6%), Philippines (29 | 0.6%), South Eastern Asia (29 | 0.6%), Latin America (26 | 0.5%), and Canada (21 | 0.4%), together accounting for 2.7% of all Luverne residents.
| Immigration Origin | # Population | % Population |
| Africa | 14 | 0.3% |
| Asia | 29 | 0.6% |
| Canada | 21 | 0.4% |
| Central America | 9 | 0.2% |
| Ecuador | 17 | 0.4% |
| Egypt | 14 | 0.3% |
| Latin America | 26 | 0.5% |
| Mexico | 9 | 0.2% |
| Northern Africa | 14 | 0.3% |
| Philippines | 29 | 0.6% |
| South America | 17 | 0.4% |
| South Eastern Asia | 29 | 0.6% | View All 12 Rows |
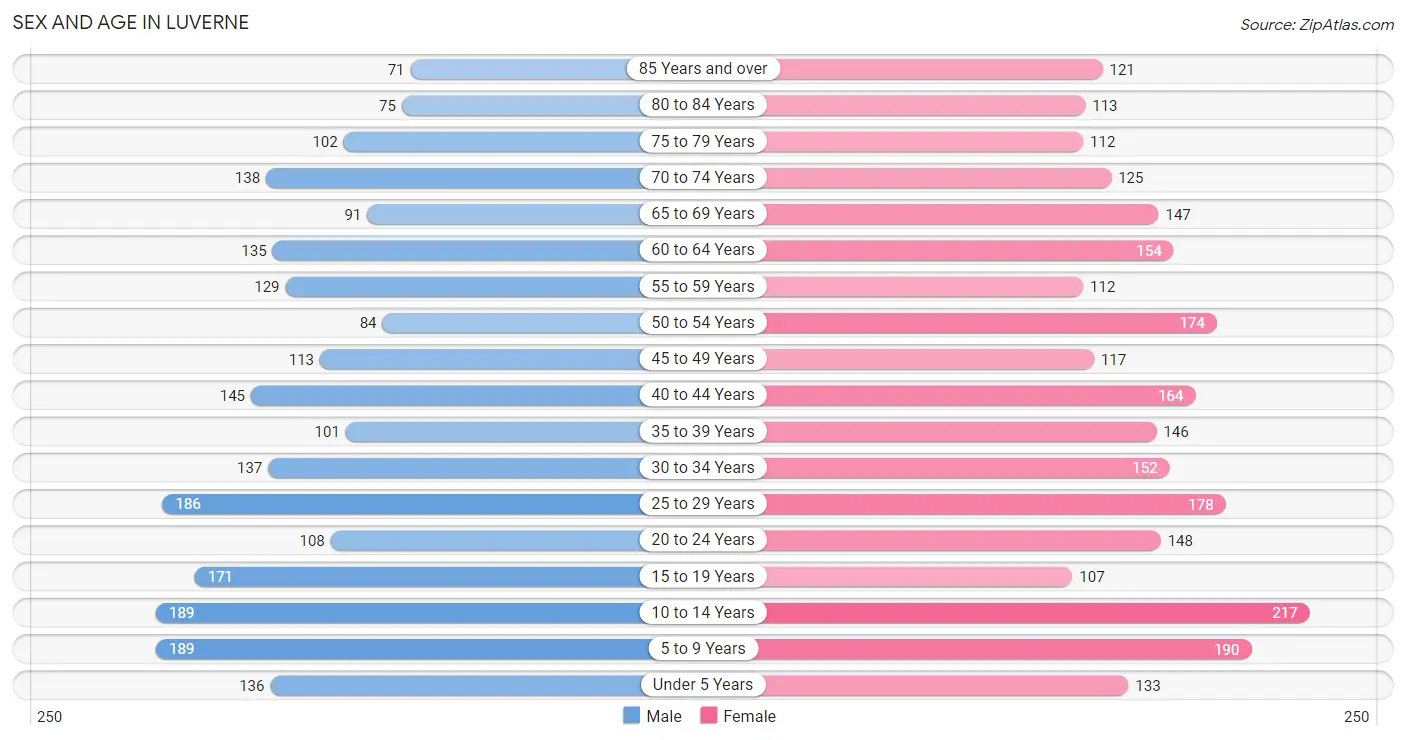
Sex and Age in Luverne
Sex and Age in Luverne
The most populous age groups in Luverne are 5 to 9 Years (189 | 8.2%) for men and 10 to 14 Years (217 | 8.3%) for women.
| Age Bracket | Male | Female |
| Under 5 Years | 136 (5.9%) | 133 (5.1%) |
| 5 to 9 Years | 189 (8.2%) | 190 (7.3%) |
| 10 to 14 Years | 189 (8.2%) | 217 (8.3%) |
| 15 to 19 Years | 171 (7.4%) | 107 (4.1%) |
| 20 to 24 Years | 108 (4.7%) | 148 (5.7%) |
| 25 to 29 Years | 186 (8.1%) | 178 (6.8%) |
| 30 to 34 Years | 137 (6.0%) | 152 (5.8%) |
| 35 to 39 Years | 101 (4.4%) | 146 (5.6%) |
| 40 to 44 Years | 145 (6.3%) | 164 (6.3%) |
| 45 to 49 Years | 113 (4.9%) | 117 (4.5%) |
| 50 to 54 Years | 84 (3.6%) | 174 (6.7%) |
| 55 to 59 Years | 129 (5.6%) | 112 (4.3%) |
| 60 to 64 Years | 135 (5.9%) | 154 (5.9%) |
| 65 to 69 Years | 91 (4.0%) | 147 (5.6%) |
| 70 to 74 Years | 138 (6.0%) | 125 (4.8%) |
| 75 to 79 Years | 102 (4.4%) | 112 (4.3%) |
| 80 to 84 Years | 75 (3.3%) | 113 (4.3%) |
| 85 Years and over | 71 (3.1%) | 121 (4.6%) |
| Total | 2,300 (100.0%) | 2,610 (100.0%) |
Families and Households in Luverne
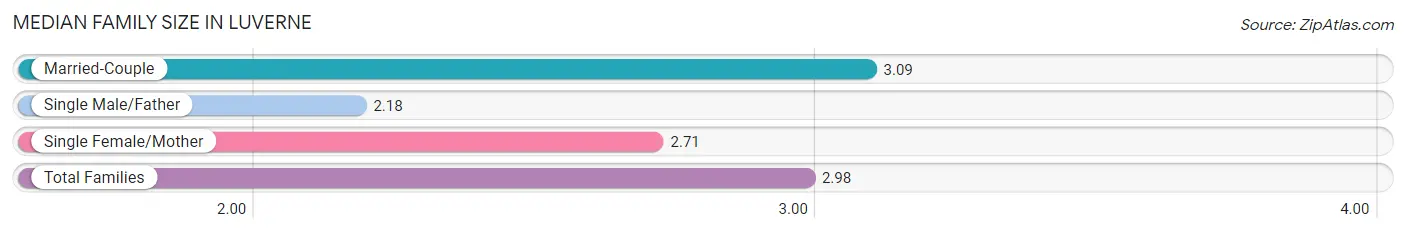
Median Family Size in Luverne
The median family size in Luverne is 2.98 persons per family, with married-couple families (920 | 75.3%) accounting for the largest median family size of 3.09 persons per family. On the other hand, single male/father families (34 | 2.8%) represent the smallest median family size with 2.18 persons per family.
| Family Type | # Families | Family Size |
| Married-Couple | 920 (75.3%) | 3.09 |
| Single Male/Father | 34 (2.8%) | 2.18 |
| Single Female/Mother | 268 (21.9%) | 2.71 |
| Total Families | 1,222 (100.0%) | 2.98 |
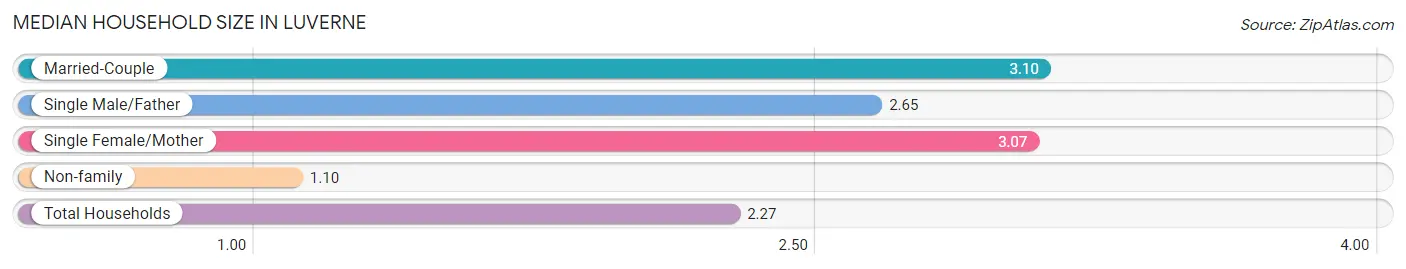
Median Household Size in Luverne
The median household size in Luverne is 2.27 persons per household, with married-couple households (920 | 44.6%) accounting for the largest median household size of 3.1 persons per household. non-family households (843 | 40.8%) represent the smallest median household size with 1.10 persons per household.
| Household Type | # Households | Household Size |
| Married-Couple | 920 (44.6%) | 3.10 |
| Single Male/Father | 34 (1.7%) | 2.65 |
| Single Female/Mother | 268 (13.0%) | 3.07 |
| Non-family | 843 (40.8%) | 1.10 |
| Total Households | 2,065 (100.0%) | 2.27 |
Household Size by Marriage Status in Luverne
Out of a total of 2,065 households in Luverne, 1,222 (59.2%) are family households, while 843 (40.8%) are nonfamily households. The most numerous type of family households are 2-person households, comprising 671, and the most common type of nonfamily households are 1-person households, comprising 749.
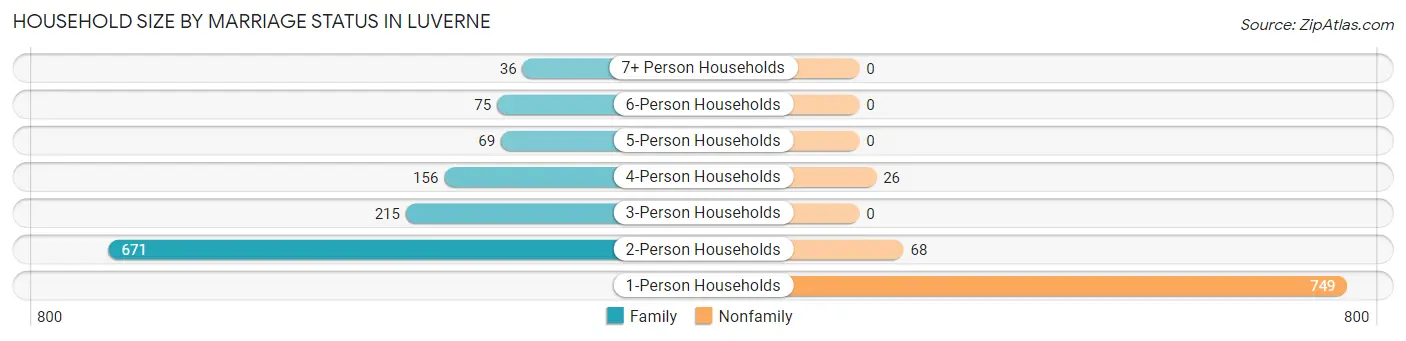
| Household Size | Family Households | Nonfamily Households |
| 1-Person Households | - | 749 (36.3%) |
| 2-Person Households | 671 (32.5%) | 68 (3.3%) |
| 3-Person Households | 215 (10.4%) | 0 (0.0%) |
| 4-Person Households | 156 (7.5%) | 26 (1.3%) |
| 5-Person Households | 69 (3.3%) | 0 (0.0%) |
| 6-Person Households | 75 (3.6%) | 0 (0.0%) |
| 7+ Person Households | 36 (1.7%) | 0 (0.0%) |
| Total | 1,222 (59.2%) | 843 (40.8%) |
Female Fertility in Luverne
Fertility by Age in Luverne
Average fertility rate in Luverne is 164.0 births per 1,000 women. Women in the age bracket of 20 to 34 years have the highest fertility rate with 358.0 births per 1,000 women. Women in the age bracket of 20 to 34 years acount for 100.0% of all women with births.
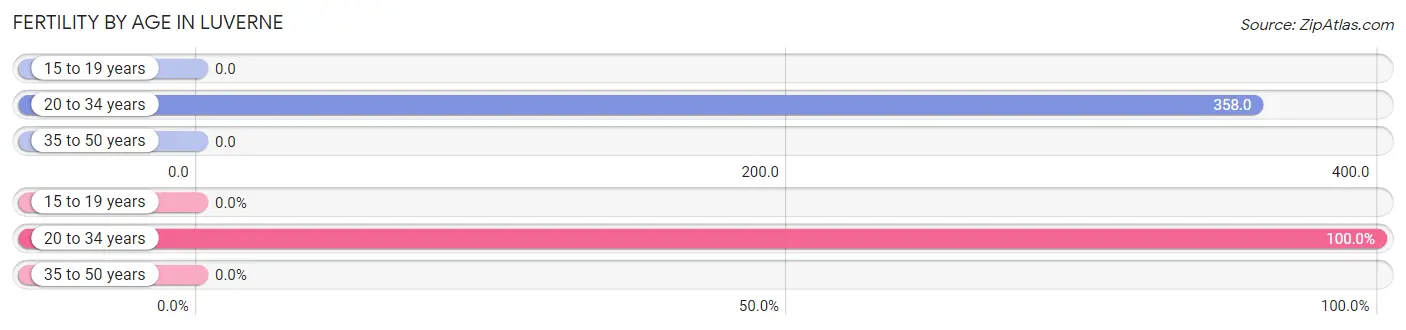
| Age Bracket | Women with Births | Births / 1,000 Women |
| 15 to 19 years | 0 (0.0%) | 0.0 |
| 20 to 34 years | 171 (100.0%) | 358.0 |
| 35 to 50 years | 0 (0.0%) | 0.0 |
| Total | 171 (100.0%) | 164.0 |
Fertility by Age by Marriage Status in Luverne
83.0% of women with births (171) in Luverne are married. The highest percentage of unmarried women with births falls into 20 to 34 years age bracket with 17.0% of them unmarried at the time of birth, while the lowest percentage of unmarried women with births belong to 20 to 34 years age bracket with 17.0% of them unmarried.
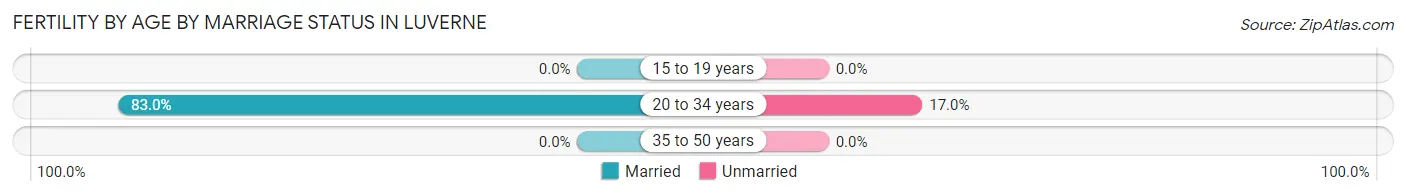
| Age Bracket | Married | Unmarried |
| 15 to 19 years | 0 (0.0%) | 0 (0.0%) |
| 20 to 34 years | 142 (83.0%) | 29 (17.0%) |
| 35 to 50 years | 0 (0.0%) | 0 (0.0%) |
| Total | 142 (83.0%) | 29 (17.0%) |
Fertility by Education in Luverne
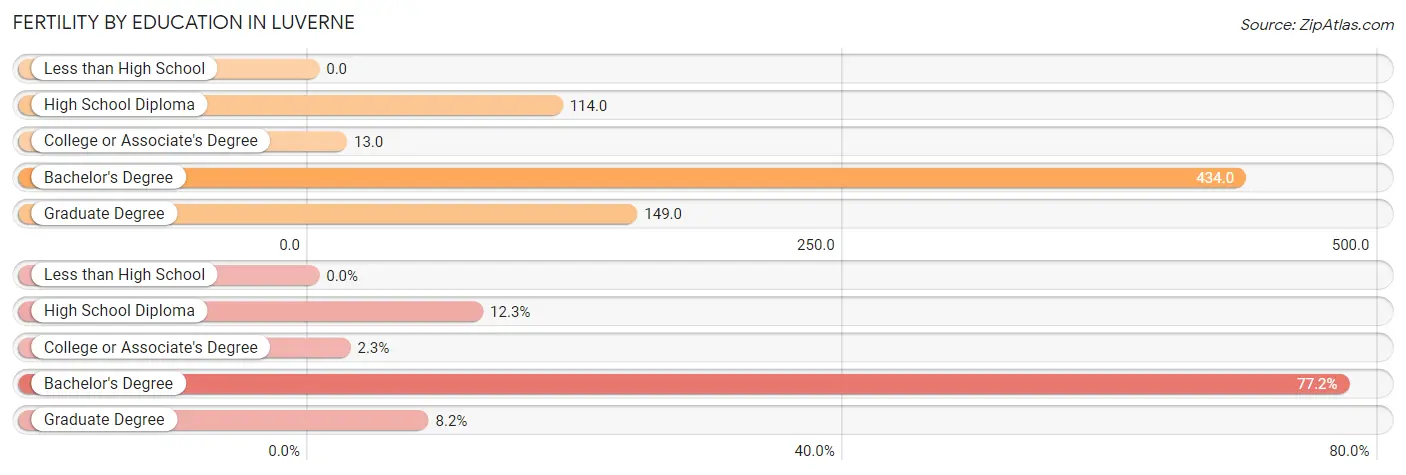
| Educational Attainment | Women with Births | Births / 1,000 Women |
| Less than High School | 0 (0.0%) | 0.0 |
| High School Diploma | 21 (12.3%) | 114.0 |
| College or Associate's Degree | 4 (2.3%) | 13.0 |
| Bachelor's Degree | 132 (77.2%) | 434.0 |
| Graduate Degree | 14 (8.2%) | 149.0 |
| Total | 171 (100.0%) | 164.0 |
Fertility by Education by Marriage Status in Luverne
17.0% of women with births in Luverne are unmarried. Women with the educational attainment of college or associate's degree are most likely to be married with 100.0% of them married at childbirth, while women with the educational attainment of high school diploma are least likely to be married with 100.0% of them unmarried at childbirth.
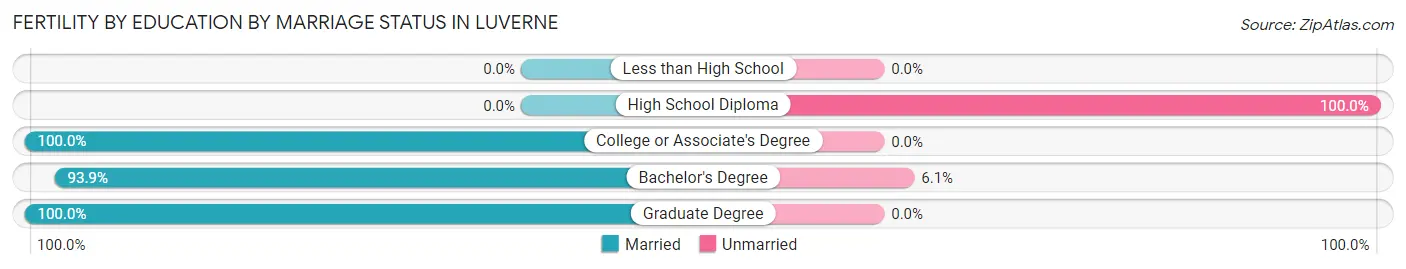
| Educational Attainment | Married | Unmarried |
| Less than High School | 0 (0.0%) | 0 (0.0%) |
| High School Diploma | 0 (0.0%) | 21 (100.0%) |
| College or Associate's Degree | 4 (100.0%) | 0 (0.0%) |
| Bachelor's Degree | 124 (93.9%) | 8 (6.1%) |
| Graduate Degree | 14 (100.0%) | 0 (0.0%) |
| Total | 142 (83.0%) | 29 (17.0%) |
Employment Characteristics in Luverne
Employment by Class of Employer in Luverne
Among the 2,461 employed individuals in Luverne, private company employees (1,377 | 55.9%), not-for-profit organizations (322 | 13.1%), and state government employees (318 | 12.9%) make up the most common classes of employment.
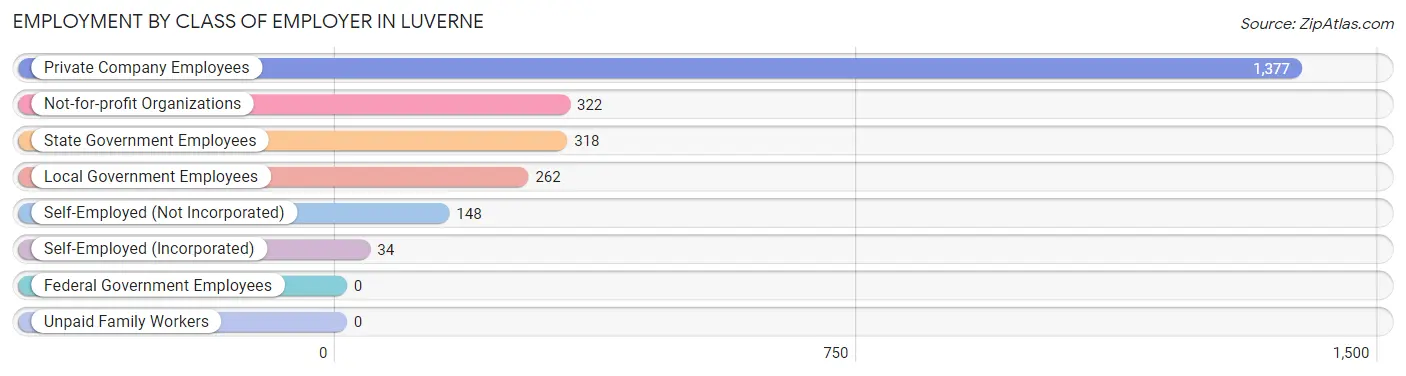
| Employer Class | # Employees | % Employees |
| Private Company Employees | 1,377 | 55.9% |
| Self-Employed (Incorporated) | 34 | 1.4% |
| Self-Employed (Not Incorporated) | 148 | 6.0% |
| Not-for-profit Organizations | 322 | 13.1% |
| Local Government Employees | 262 | 10.6% |
| State Government Employees | 318 | 12.9% |
| Federal Government Employees | 0 | 0.0% |
| Unpaid Family Workers | 0 | 0.0% |
| Total | 2,461 | 100.0% |
Employment Status by Age in Luverne
According to the labor force statistics for Luverne, out of the total population over 16 years of age (3,812), 67.1% or 2,558 individuals are in the labor force, with 2.2% or 56 of them unemployed. The age group with the highest labor force participation rate is 25 to 29 years, with 97.8% or 356 individuals in the labor force. Within the labor force, the 45 to 54 years age range has the highest percentage of unemployed individuals, with 8.3% or 36 of them being unemployed.
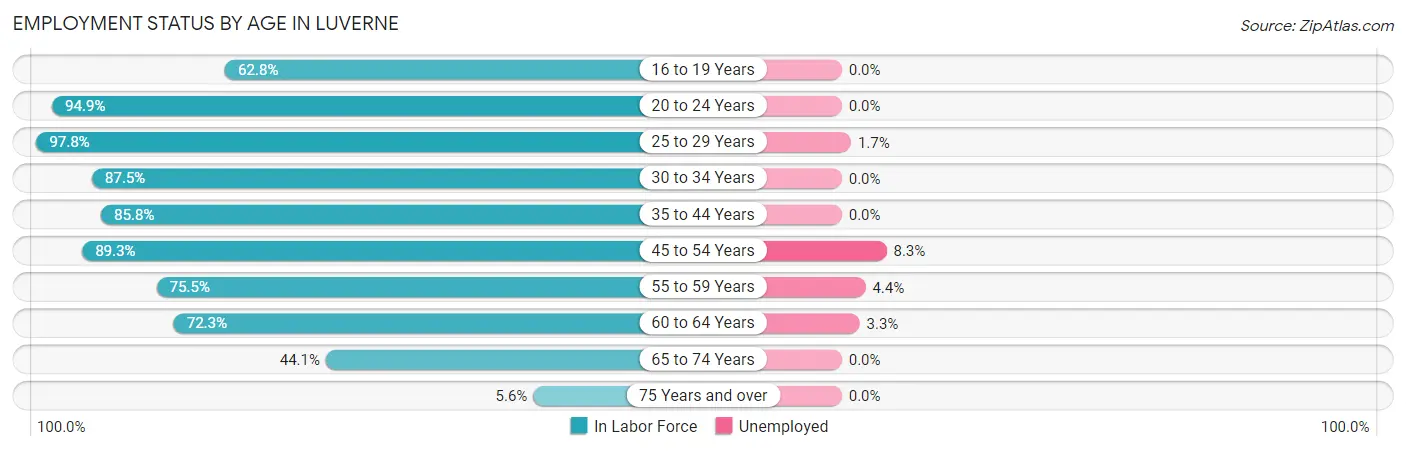
| Age Bracket | In Labor Force | Unemployed |
| 16 to 19 Years | 147 (62.8%) | 0 (0.0%) |
| 20 to 24 Years | 243 (94.9%) | 0 (0.0%) |
| 25 to 29 Years | 356 (97.8%) | 6 (1.7%) |
| 30 to 34 Years | 253 (87.5%) | 0 (0.0%) |
| 35 to 44 Years | 477 (85.8%) | 0 (0.0%) |
| 45 to 54 Years | 436 (89.3%) | 36 (8.3%) |
| 55 to 59 Years | 182 (75.5%) | 8 (4.4%) |
| 60 to 64 Years | 209 (72.3%) | 7 (3.3%) |
| 65 to 74 Years | 221 (44.1%) | 0 (0.0%) |
| 75 Years and over | 33 (5.6%) | 0 (0.0%) |
| Total | 2,558 (67.1%) | 56 (2.2%) |
Employment Status by Educational Attainment in Luverne
According to labor force statistics for Luverne, 85.9% of individuals (1,913) out of the total population between 25 and 64 years of age (2,227) are in the labor force, with 3.0% or 57 of them being unemployed. The group with the highest labor force participation rate are those with the educational attainment of bachelor's degree or higher, with 91.4% or 775 individuals in the labor force. Within the labor force, individuals with high school diploma education have the highest percentage of unemployment, with 9.6% or 42 of them being unemployed.
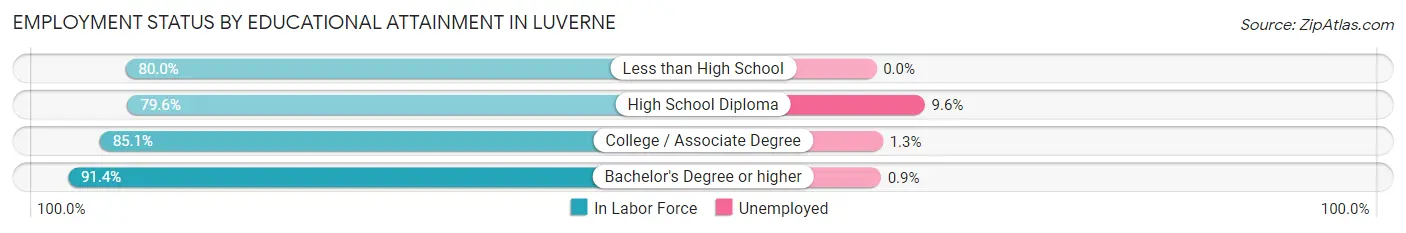
| Educational Attainment | In Labor Force | Unemployed |
| Less than High School | 80 (80.0%) | 0 (0.0%) |
| High School Diploma | 437 (79.6%) | 53 (9.6%) |
| College / Associate Degree | 621 (85.1%) | 9 (1.3%) |
| Bachelor's Degree or higher | 775 (91.4%) | 8 (0.9%) |
| Total | 1,913 (85.9%) | 67 (3.0%) |
Employment Occupations by Sex in Luverne
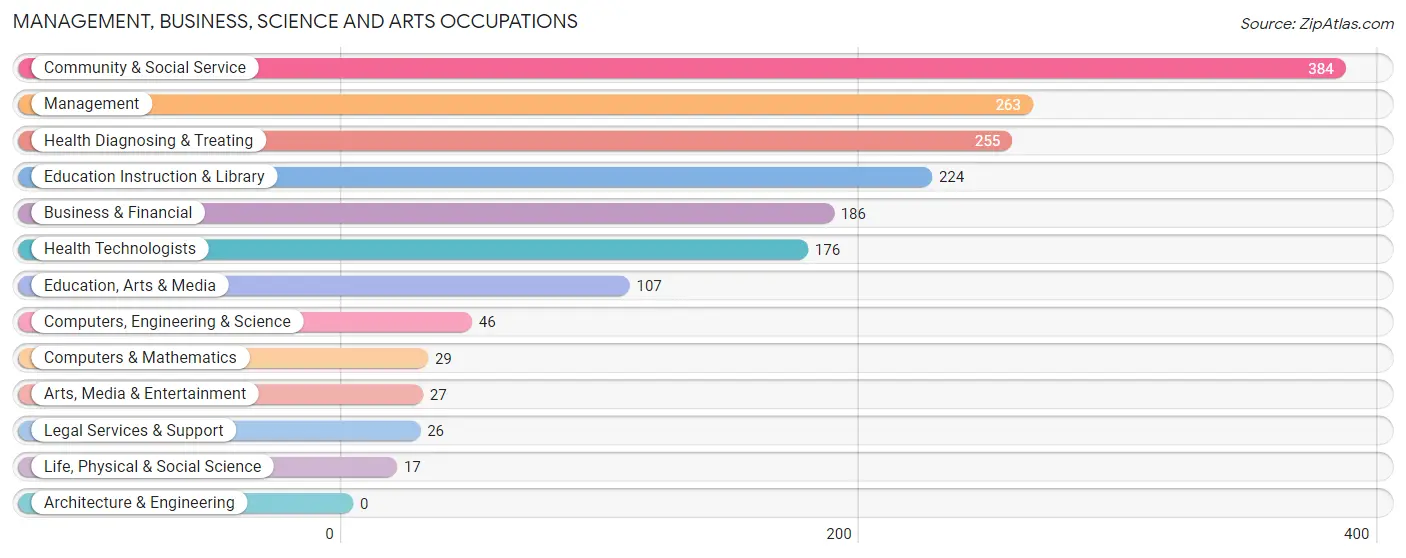
Management, Business, Science and Arts Occupations
The most common Management, Business, Science and Arts occupations in Luverne are Community & Social Service (384 | 15.4%), Management (263 | 10.5%), Health Diagnosing & Treating (255 | 10.2%), Education Instruction & Library (224 | 9.0%), and Business & Financial (186 | 7.4%).
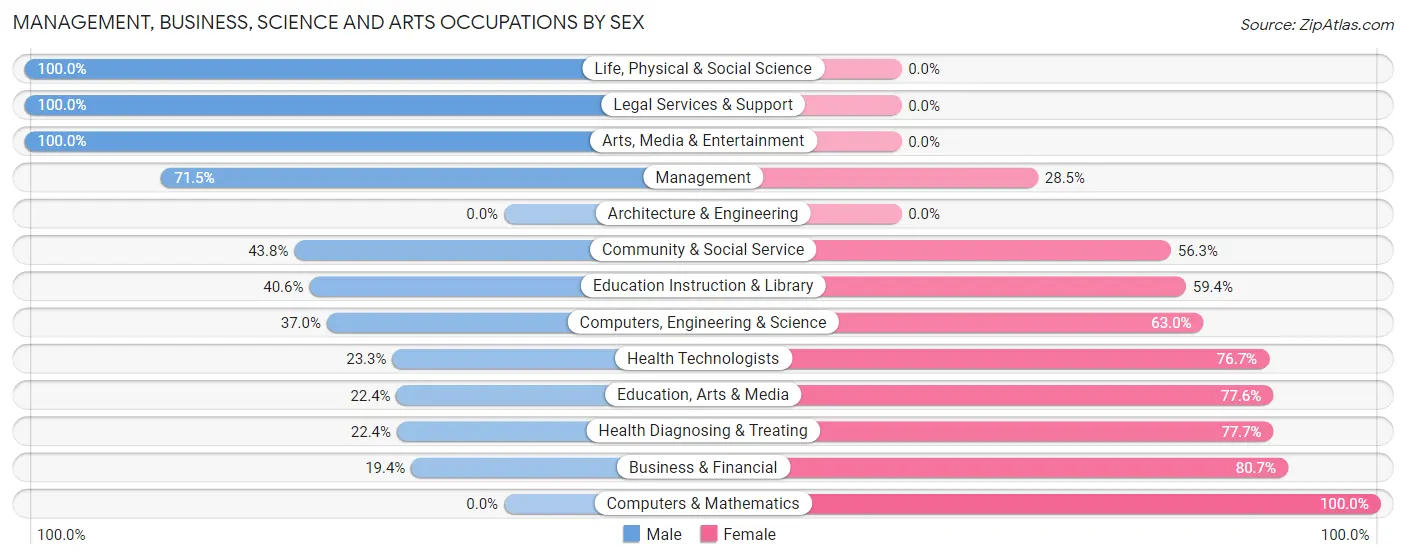
Management, Business, Science and Arts Occupations by Sex
Within the Management, Business, Science and Arts occupations in Luverne, the most male-oriented occupations are Life, Physical & Social Science (100.0%), Legal Services & Support (100.0%), and Arts, Media & Entertainment (100.0%), while the most female-oriented occupations are Computers & Mathematics (100.0%), Business & Financial (80.6%), and Health Diagnosing & Treating (77.6%).
| Occupation | Male | Female |
| Management | 188 (71.5%) | 75 (28.5%) |
| Business & Financial | 36 (19.4%) | 150 (80.6%) |
| Computers, Engineering & Science | 17 (37.0%) | 29 (63.0%) |
| Computers & Mathematics | 0 (0.0%) | 29 (100.0%) |
| Architecture & Engineering | 0 (0.0%) | 0 (0.0%) |
| Life, Physical & Social Science | 17 (100.0%) | 0 (0.0%) |
| Community & Social Service | 168 (43.8%) | 216 (56.2%) |
| Education, Arts & Media | 24 (22.4%) | 83 (77.6%) |
| Legal Services & Support | 26 (100.0%) | 0 (0.0%) |
| Education Instruction & Library | 91 (40.6%) | 133 (59.4%) |
| Arts, Media & Entertainment | 27 (100.0%) | 0 (0.0%) |
| Health Diagnosing & Treating | 57 (22.4%) | 198 (77.6%) |
| Health Technologists | 41 (23.3%) | 135 (76.7%) |
| Total (Category) | 466 (41.1%) | 668 (58.9%) |
| Total (Overall) | 1,233 (49.3%) | 1,267 (50.7%) |
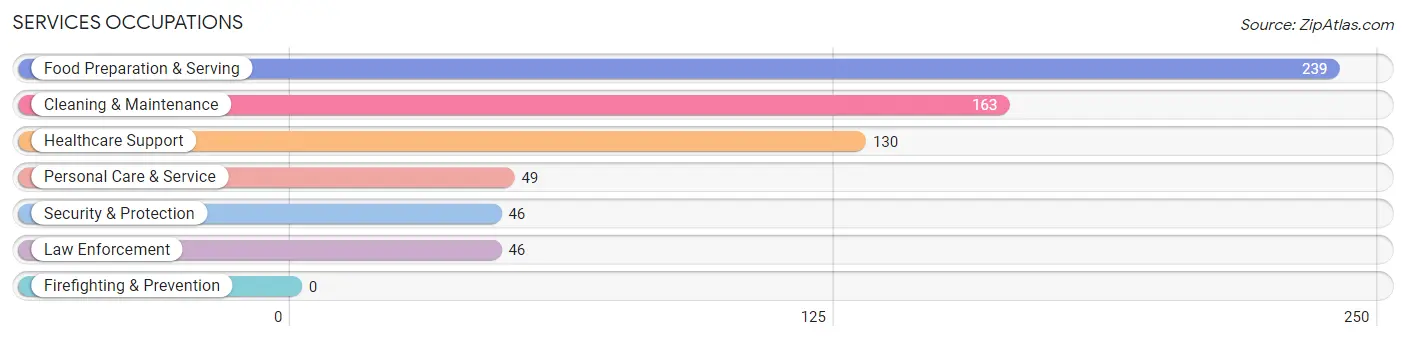
Services Occupations
The most common Services occupations in Luverne are Food Preparation & Serving (239 | 9.6%), Cleaning & Maintenance (163 | 6.5%), Healthcare Support (130 | 5.2%), Personal Care & Service (49 | 2.0%), and Security & Protection (46 | 1.8%).
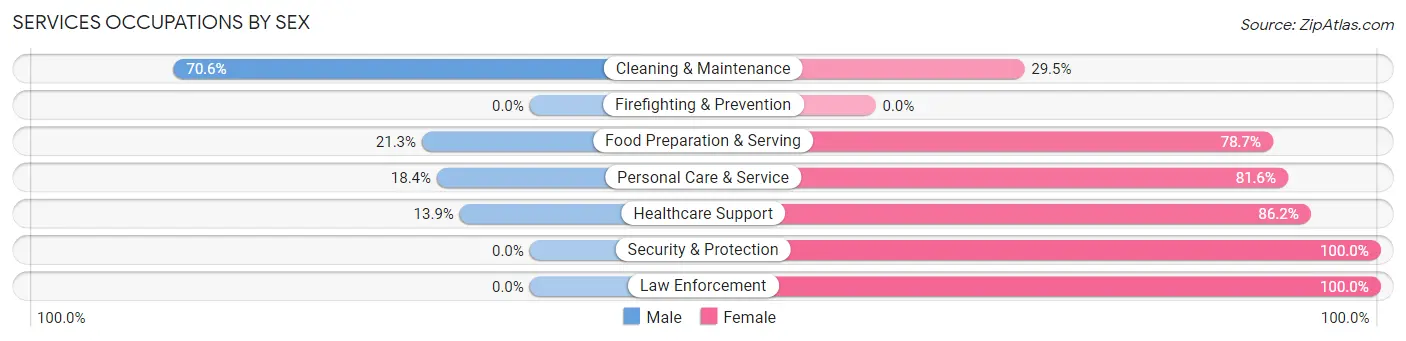
Services Occupations by Sex
Within the Services occupations in Luverne, the most male-oriented occupations are Cleaning & Maintenance (70.6%), Food Preparation & Serving (21.3%), and Personal Care & Service (18.4%), while the most female-oriented occupations are Security & Protection (100.0%), Law Enforcement (100.0%), and Healthcare Support (86.2%).
| Occupation | Male | Female |
| Healthcare Support | 18 (13.9%) | 112 (86.2%) |
| Security & Protection | 0 (0.0%) | 46 (100.0%) |
| Firefighting & Prevention | 0 (0.0%) | 0 (0.0%) |
| Law Enforcement | 0 (0.0%) | 46 (100.0%) |
| Food Preparation & Serving | 51 (21.3%) | 188 (78.7%) |
| Cleaning & Maintenance | 115 (70.6%) | 48 (29.4%) |
| Personal Care & Service | 9 (18.4%) | 40 (81.6%) |
| Total (Category) | 193 (30.8%) | 434 (69.2%) |
| Total (Overall) | 1,233 (49.3%) | 1,267 (50.7%) |
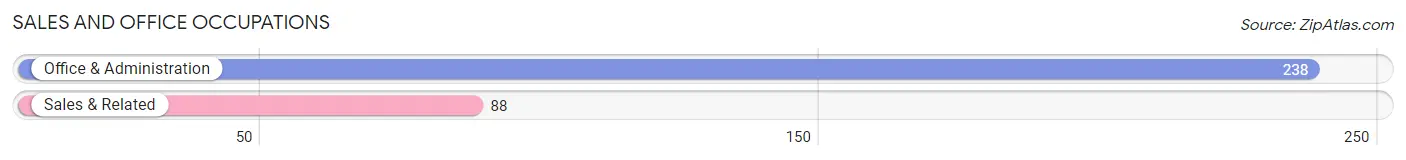
Sales and Office Occupations
The most common Sales and Office occupations in Luverne are Office & Administration (238 | 9.5%), and Sales & Related (88 | 3.5%).
Sales and Office Occupations by Sex

| Occupation | Male | Female |
| Sales & Related | 67 (76.1%) | 21 (23.9%) |
| Office & Administration | 112 (47.1%) | 126 (52.9%) |
| Total (Category) | 179 (54.9%) | 147 (45.1%) |
| Total (Overall) | 1,233 (49.3%) | 1,267 (50.7%) |
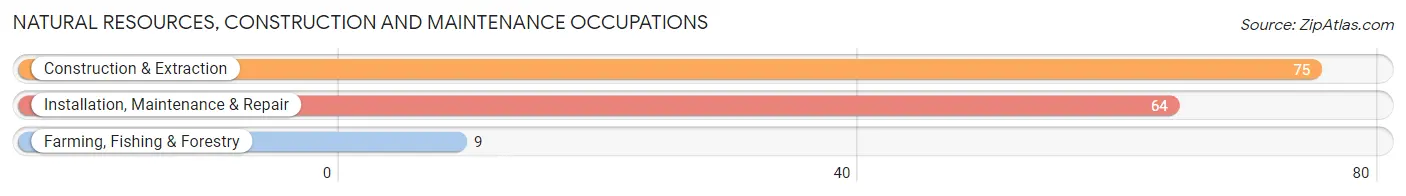
Natural Resources, Construction and Maintenance Occupations
The most common Natural Resources, Construction and Maintenance occupations in Luverne are Construction & Extraction (75 | 3.0%), Installation, Maintenance & Repair (64 | 2.6%), and Farming, Fishing & Forestry (9 | 0.4%).
Natural Resources, Construction and Maintenance Occupations by Sex

| Occupation | Male | Female |
| Farming, Fishing & Forestry | 9 (100.0%) | 0 (0.0%) |
| Construction & Extraction | 75 (100.0%) | 0 (0.0%) |
| Installation, Maintenance & Repair | 64 (100.0%) | 0 (0.0%) |
| Total (Category) | 148 (100.0%) | 0 (0.0%) |
| Total (Overall) | 1,233 (49.3%) | 1,267 (50.7%) |
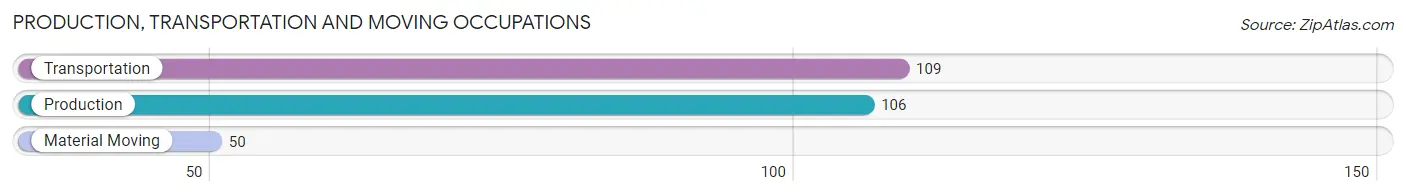
Production, Transportation and Moving Occupations
The most common Production, Transportation and Moving occupations in Luverne are Transportation (109 | 4.4%), Production (106 | 4.2%), and Material Moving (50 | 2.0%).
Production, Transportation and Moving Occupations by Sex
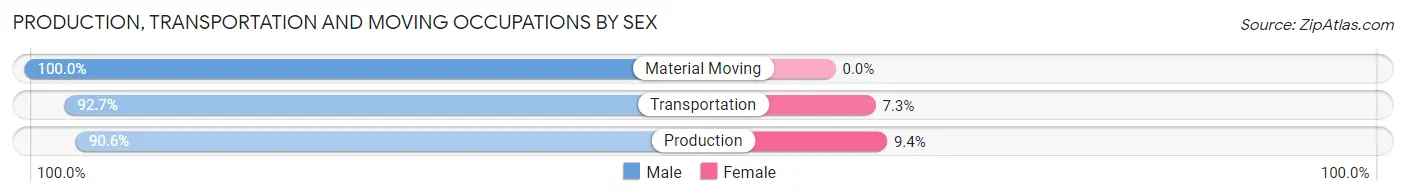
| Occupation | Male | Female |
| Production | 96 (90.6%) | 10 (9.4%) |
| Transportation | 101 (92.7%) | 8 (7.3%) |
| Material Moving | 50 (100.0%) | 0 (0.0%) |
| Total (Category) | 247 (93.2%) | 18 (6.8%) |
| Total (Overall) | 1,233 (49.3%) | 1,267 (50.7%) |
Employment Industries by Sex in Luverne
Employment Industries in Luverne
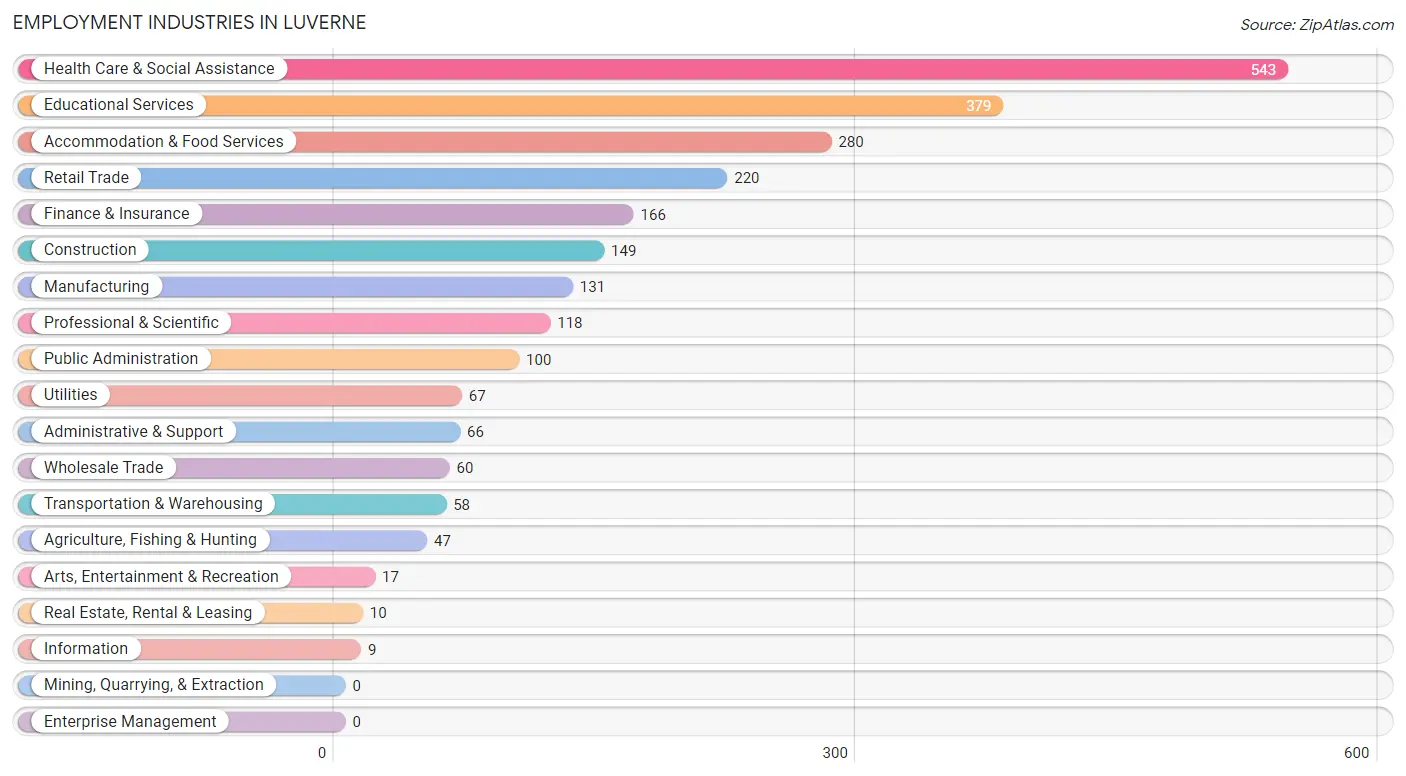
The major employment industries in Luverne include Health Care & Social Assistance (543 | 21.7%), Educational Services (379 | 15.2%), Accommodation & Food Services (280 | 11.2%), Retail Trade (220 | 8.8%), and Finance & Insurance (166 | 6.6%).
Employment Industries by Sex in Luverne
The Luverne industries that see more men than women are Agriculture, Fishing & Hunting (100.0%), Construction (100.0%), and Transportation & Warehousing (100.0%), whereas the industries that tend to have a higher number of women are Real Estate, Rental & Leasing (100.0%), Arts, Entertainment & Recreation (100.0%), and Public Administration (90.0%).
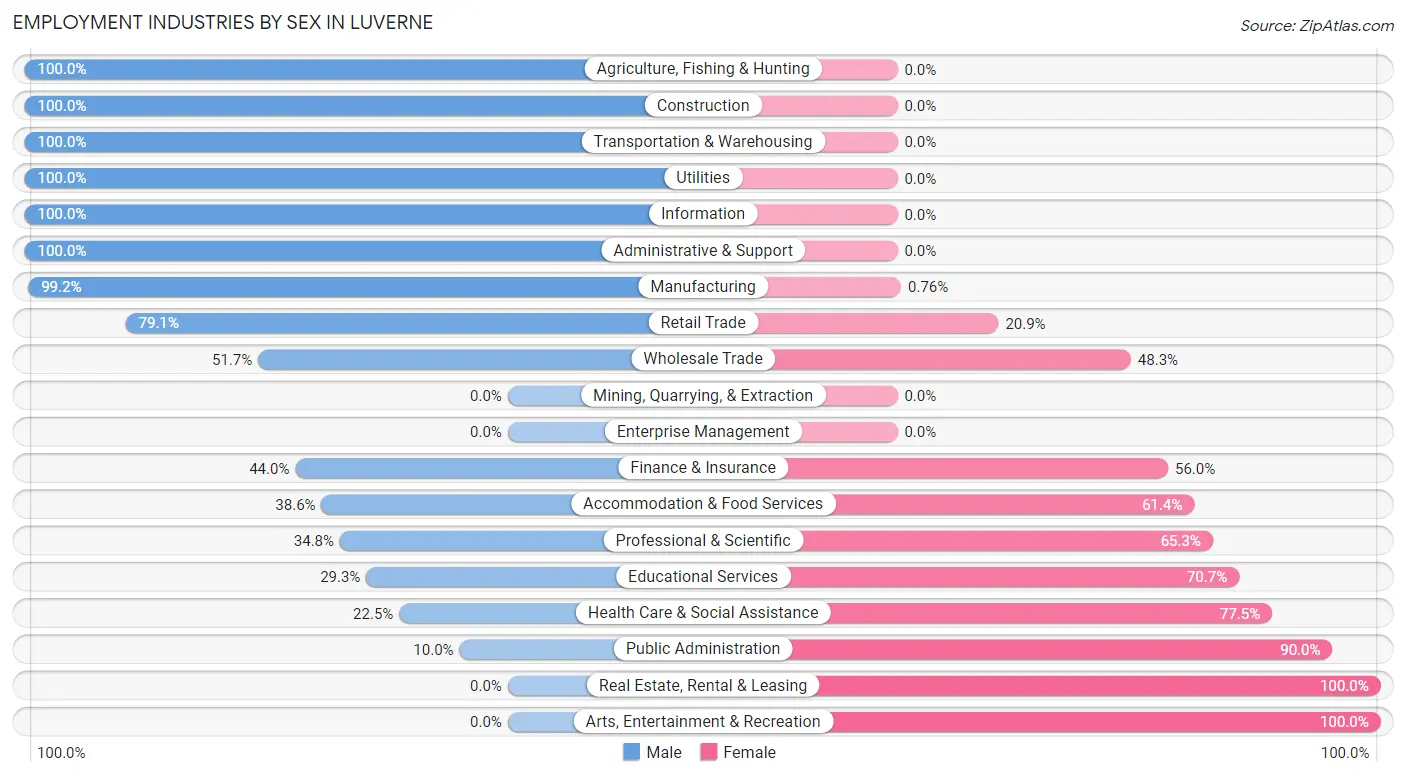
| Industry | Male | Female |
| Agriculture, Fishing & Hunting | 47 (100.0%) | 0 (0.0%) |
| Mining, Quarrying, & Extraction | 0 (0.0%) | 0 (0.0%) |
| Construction | 149 (100.0%) | 0 (0.0%) |
| Manufacturing | 130 (99.2%) | 1 (0.8%) |
| Wholesale Trade | 31 (51.7%) | 29 (48.3%) |
| Retail Trade | 174 (79.1%) | 46 (20.9%) |
| Transportation & Warehousing | 58 (100.0%) | 0 (0.0%) |
| Utilities | 67 (100.0%) | 0 (0.0%) |
| Information | 9 (100.0%) | 0 (0.0%) |
| Finance & Insurance | 73 (44.0%) | 93 (56.0%) |
| Real Estate, Rental & Leasing | 0 (0.0%) | 10 (100.0%) |
| Professional & Scientific | 41 (34.7%) | 77 (65.2%) |
| Enterprise Management | 0 (0.0%) | 0 (0.0%) |
| Administrative & Support | 66 (100.0%) | 0 (0.0%) |
| Educational Services | 111 (29.3%) | 268 (70.7%) |
| Health Care & Social Assistance | 122 (22.5%) | 421 (77.5%) |
| Arts, Entertainment & Recreation | 0 (0.0%) | 17 (100.0%) |
| Accommodation & Food Services | 108 (38.6%) | 172 (61.4%) |
| Public Administration | 10 (10.0%) | 90 (90.0%) |
| Total | 1,233 (49.3%) | 1,267 (50.7%) |
Education in Luverne
School Enrollment in Luverne
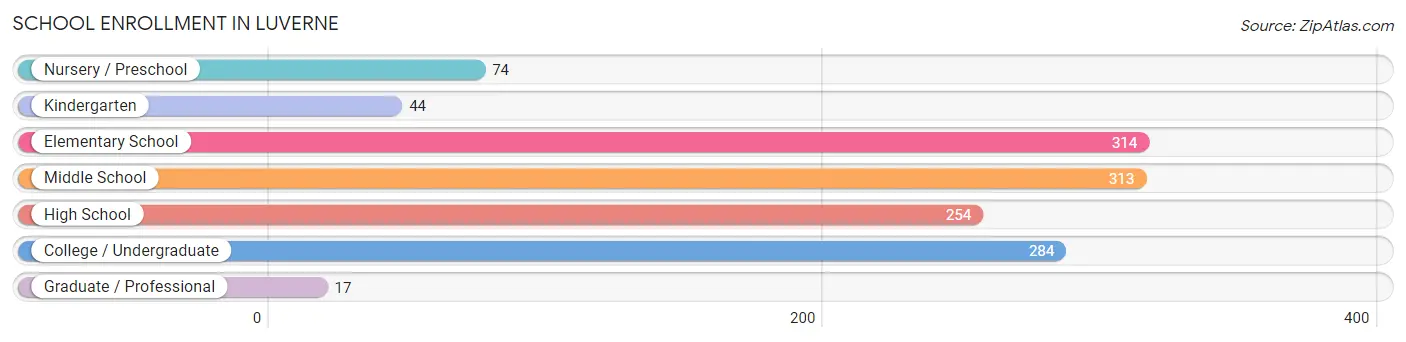
The most common levels of schooling among the 1,300 students in Luverne are elementary school (314 | 24.1%), middle school (313 | 24.1%), and college / undergraduate (284 | 21.8%).
| School Level | # Students | % Students |
| Nursery / Preschool | 74 | 5.7% |
| Kindergarten | 44 | 3.4% |
| Elementary School | 314 | 24.1% |
| Middle School | 313 | 24.1% |
| High School | 254 | 19.5% |
| College / Undergraduate | 284 | 21.8% |
| Graduate / Professional | 17 | 1.3% |
| Total | 1,300 | 100.0% |
School Enrollment by Age by Funding Source in Luverne
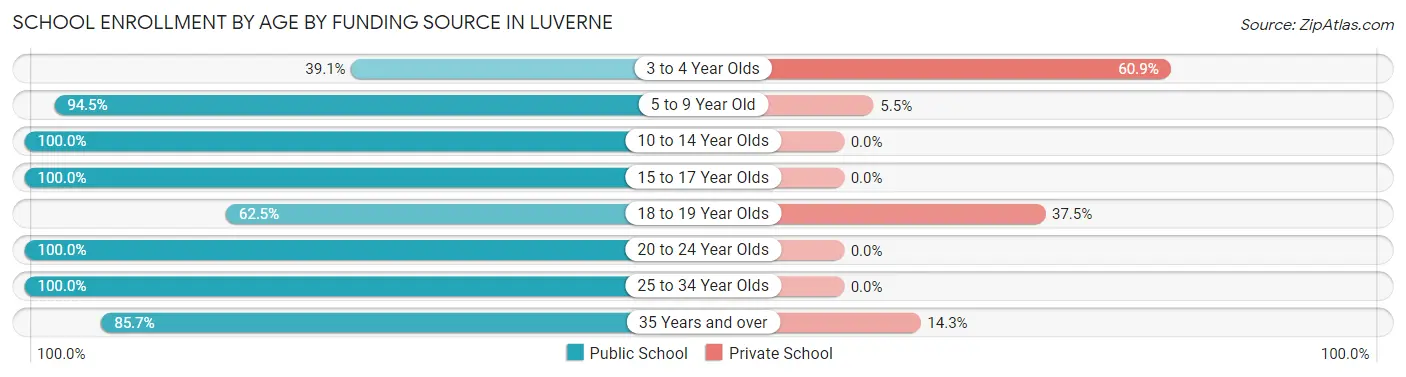
Out of a total of 1,300 students who are enrolled in schools in Luverne, 65 (5.0%) attend a private institution, while the remaining 1,235 (95.0%) are enrolled in public schools. The age group of 3 to 4 year olds has the highest likelihood of being enrolled in private schools, with 14 (60.9% in the age bracket) enrolled. Conversely, the age group of 10 to 14 year olds has the lowest likelihood of being enrolled in a private school, with 387 (100.0% in the age bracket) attending a public institution.
| Age Bracket | Public School | Private School |
| 3 to 4 Year Olds | 9 (39.1%) | 14 (60.9%) |
| 5 to 9 Year Old | 358 (94.5%) | 21 (5.5%) |
| 10 to 14 Year Olds | 387 (100.0%) | 0 (0.0%) |
| 15 to 17 Year Olds | 154 (100.0%) | 0 (0.0%) |
| 18 to 19 Year Olds | 30 (62.5%) | 18 (37.5%) |
| 20 to 24 Year Olds | 166 (100.0%) | 0 (0.0%) |
| 25 to 34 Year Olds | 59 (100.0%) | 0 (0.0%) |
| 35 Years and over | 72 (85.7%) | 12 (14.3%) |
| Total | 1,235 (95.0%) | 65 (5.0%) |
Educational Attainment by Field of Study in Luverne
Education (245 | 23.0%), business (160 | 15.0%), science & technology (102 | 9.6%), arts & humanities (98 | 9.2%), and bio, nature & agricultural (90 | 8.4%) are the most common fields of study among 1,067 individuals in Luverne who have obtained a bachelor's degree or higher.
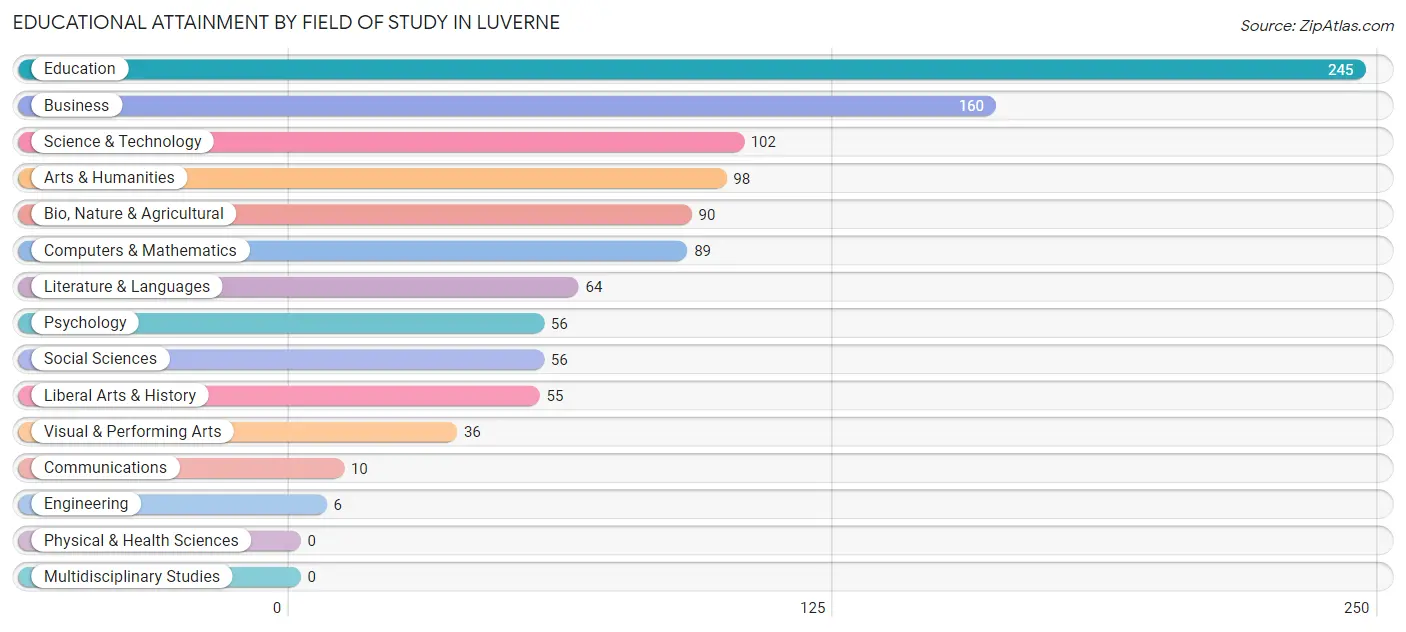
| Field of Study | # Graduates | % Graduates |
| Computers & Mathematics | 89 | 8.3% |
| Bio, Nature & Agricultural | 90 | 8.4% |
| Physical & Health Sciences | 0 | 0.0% |
| Psychology | 56 | 5.2% |
| Social Sciences | 56 | 5.2% |
| Engineering | 6 | 0.6% |
| Multidisciplinary Studies | 0 | 0.0% |
| Science & Technology | 102 | 9.6% |
| Business | 160 | 15.0% |
| Education | 245 | 23.0% |
| Literature & Languages | 64 | 6.0% |
| Liberal Arts & History | 55 | 5.1% |
| Visual & Performing Arts | 36 | 3.4% |
| Communications | 10 | 0.9% |
| Arts & Humanities | 98 | 9.2% |
| Total | 1,067 | 100.0% |
Transportation & Commute in Luverne
Vehicle Availability by Sex in Luverne
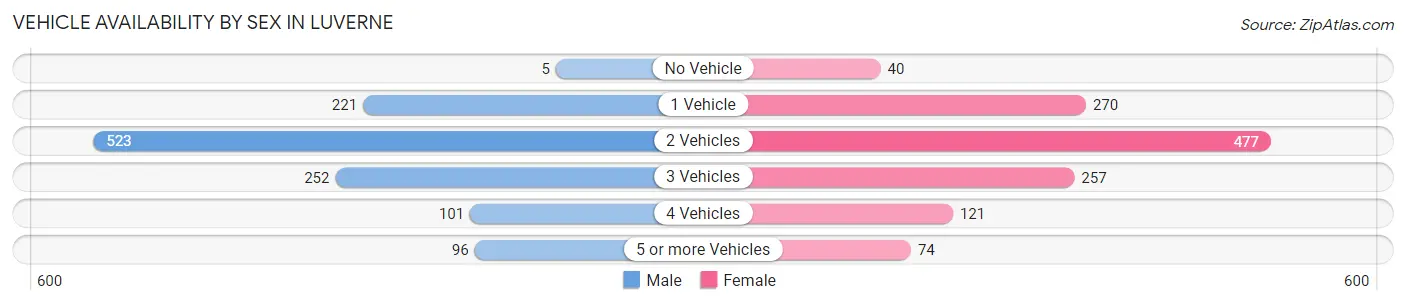
The most prevalent vehicle ownership categories in Luverne are males with 2 vehicles (523, accounting for 43.7%) and females with 2 vehicles (477, making up 42.2%).
| Vehicles Available | Male | Female |
| No Vehicle | 5 (0.4%) | 40 (3.2%) |
| 1 Vehicle | 221 (18.4%) | 270 (21.8%) |
| 2 Vehicles | 523 (43.7%) | 477 (38.5%) |
| 3 Vehicles | 252 (21.0%) | 257 (20.7%) |
| 4 Vehicles | 101 (8.4%) | 121 (9.8%) |
| 5 or more Vehicles | 96 (8.0%) | 74 (6.0%) |
| Total | 1,198 (100.0%) | 1,239 (100.0%) |
Commute Time in Luverne
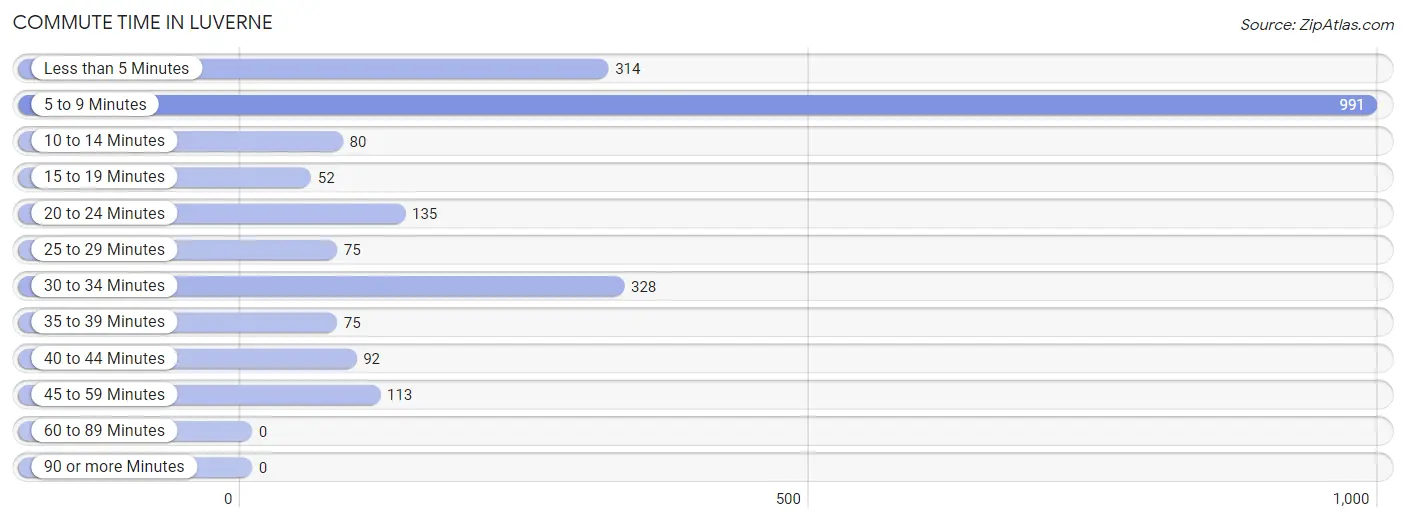
The most frequently occuring commute durations in Luverne are 5 to 9 minutes (991 commuters, 44.0%), 30 to 34 minutes (328 commuters, 14.5%), and less than 5 minutes (314 commuters, 13.9%).
| Commute Time | # Commuters | % Commuters |
| Less than 5 Minutes | 314 | 13.9% |
| 5 to 9 Minutes | 991 | 44.0% |
| 10 to 14 Minutes | 80 | 3.5% |
| 15 to 19 Minutes | 52 | 2.3% |
| 20 to 24 Minutes | 135 | 6.0% |
| 25 to 29 Minutes | 75 | 3.3% |
| 30 to 34 Minutes | 328 | 14.5% |
| 35 to 39 Minutes | 75 | 3.3% |
| 40 to 44 Minutes | 92 | 4.1% |
| 45 to 59 Minutes | 113 | 5.0% |
| 60 to 89 Minutes | 0 | 0.0% |
| 90 or more Minutes | 0 | 0.0% |
Commute Time by Sex in Luverne
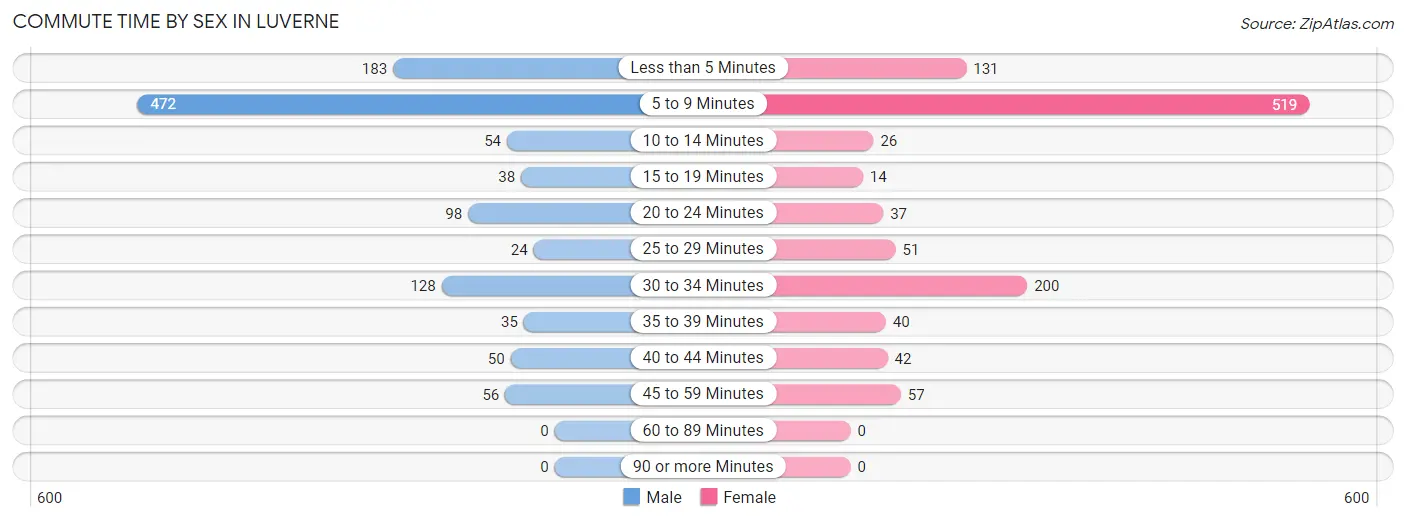
The most common commute times in Luverne are 5 to 9 minutes (472 commuters, 41.5%) for males and 5 to 9 minutes (519 commuters, 46.5%) for females.
| Commute Time | Male | Female |
| Less than 5 Minutes | 183 (16.1%) | 131 (11.7%) |
| 5 to 9 Minutes | 472 (41.5%) | 519 (46.5%) |
| 10 to 14 Minutes | 54 (4.8%) | 26 (2.3%) |
| 15 to 19 Minutes | 38 (3.3%) | 14 (1.3%) |
| 20 to 24 Minutes | 98 (8.6%) | 37 (3.3%) |
| 25 to 29 Minutes | 24 (2.1%) | 51 (4.6%) |
| 30 to 34 Minutes | 128 (11.3%) | 200 (17.9%) |
| 35 to 39 Minutes | 35 (3.1%) | 40 (3.6%) |
| 40 to 44 Minutes | 50 (4.4%) | 42 (3.8%) |
| 45 to 59 Minutes | 56 (4.9%) | 57 (5.1%) |
| 60 to 89 Minutes | 0 (0.0%) | 0 (0.0%) |
| 90 or more Minutes | 0 (0.0%) | 0 (0.0%) |
Time of Departure to Work by Sex in Luverne
The most frequent times of departure to work in Luverne are 7:00 AM to 7:29 AM (303, 26.6%) for males and 7:00 AM to 7:29 AM (352, 31.5%) for females.
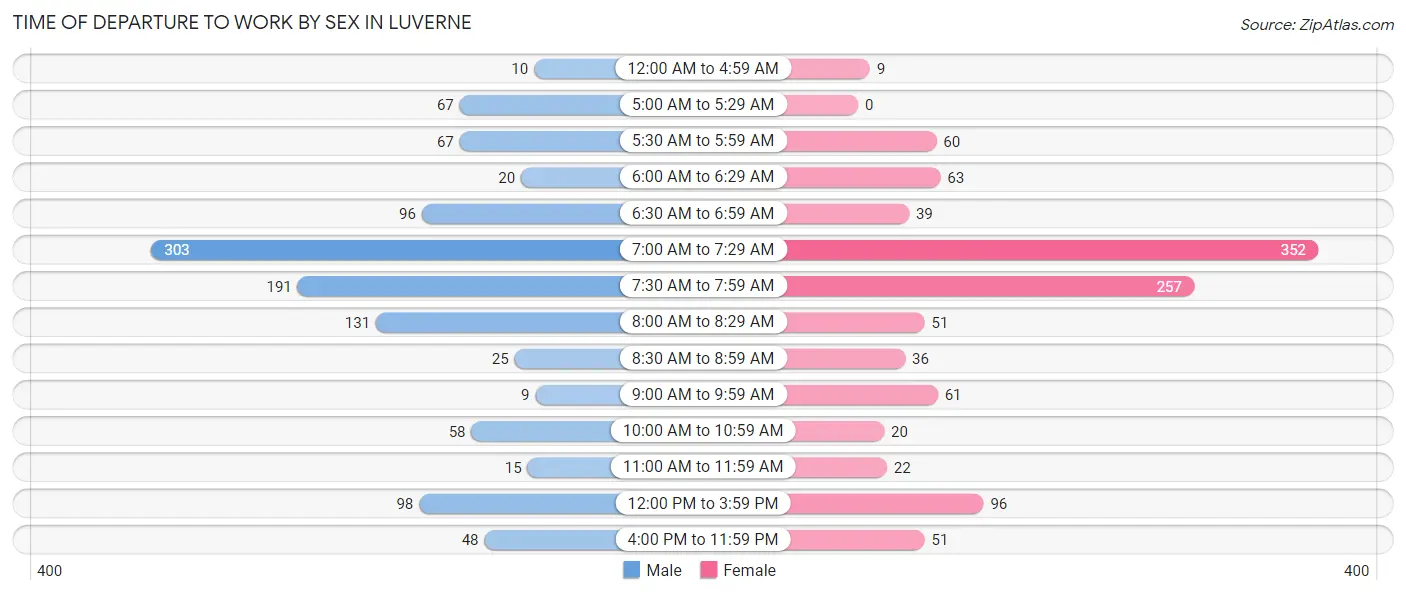
| Time of Departure | Male | Female |
| 12:00 AM to 4:59 AM | 10 (0.9%) | 9 (0.8%) |
| 5:00 AM to 5:29 AM | 67 (5.9%) | 0 (0.0%) |
| 5:30 AM to 5:59 AM | 67 (5.9%) | 60 (5.4%) |
| 6:00 AM to 6:29 AM | 20 (1.8%) | 63 (5.6%) |
| 6:30 AM to 6:59 AM | 96 (8.4%) | 39 (3.5%) |
| 7:00 AM to 7:29 AM | 303 (26.6%) | 352 (31.5%) |
| 7:30 AM to 7:59 AM | 191 (16.8%) | 257 (23.0%) |
| 8:00 AM to 8:29 AM | 131 (11.5%) | 51 (4.6%) |
| 8:30 AM to 8:59 AM | 25 (2.2%) | 36 (3.2%) |
| 9:00 AM to 9:59 AM | 9 (0.8%) | 61 (5.5%) |
| 10:00 AM to 10:59 AM | 58 (5.1%) | 20 (1.8%) |
| 11:00 AM to 11:59 AM | 15 (1.3%) | 22 (2.0%) |
| 12:00 PM to 3:59 PM | 98 (8.6%) | 96 (8.6%) |
| 4:00 PM to 11:59 PM | 48 (4.2%) | 51 (4.6%) |
| Total | 1,138 (100.0%) | 1,117 (100.0%) |
Housing Occupancy in Luverne
Occupancy by Ownership in Luverne
Of the total 2,065 dwellings in Luverne, owner-occupied units account for 1,488 (72.1%), while renter-occupied units make up 577 (27.9%).
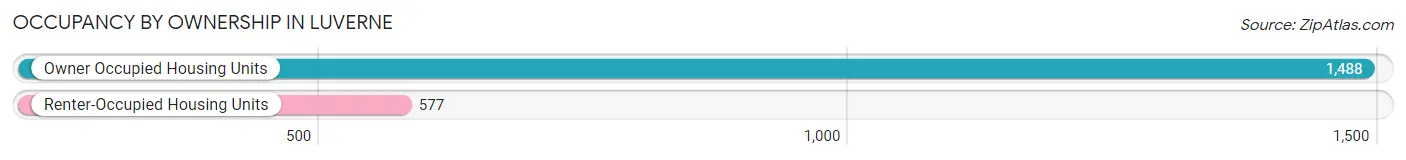
| Occupancy | # Housing Units | % Housing Units |
| Owner Occupied Housing Units | 1,488 | 72.1% |
| Renter-Occupied Housing Units | 577 | 27.9% |
| Total Occupied Housing Units | 2,065 | 100.0% |
Occupancy by Household Size in Luverne
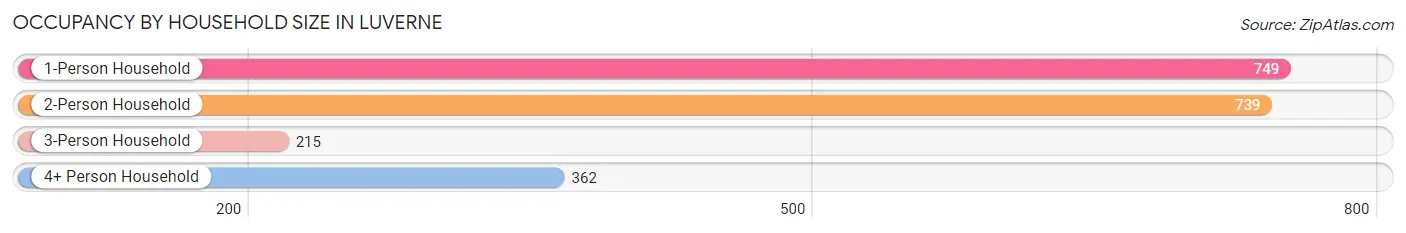
| Household Size | # Housing Units | % Housing Units |
| 1-Person Household | 749 | 36.3% |
| 2-Person Household | 739 | 35.8% |
| 3-Person Household | 215 | 10.4% |
| 4+ Person Household | 362 | 17.5% |
| Total Housing Units | 2,065 | 100.0% |
Occupancy by Ownership by Household Size in Luverne
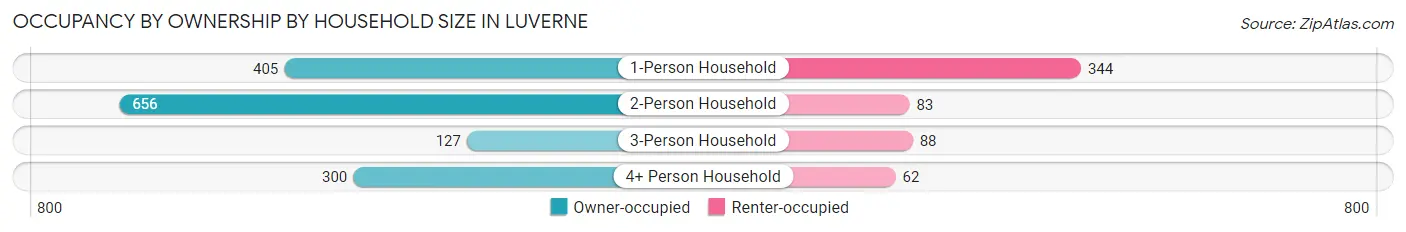
| Household Size | Owner-occupied | Renter-occupied |
| 1-Person Household | 405 (54.1%) | 344 (45.9%) |
| 2-Person Household | 656 (88.8%) | 83 (11.2%) |
| 3-Person Household | 127 (59.1%) | 88 (40.9%) |
| 4+ Person Household | 300 (82.9%) | 62 (17.1%) |
| Total Housing Units | 1,488 (72.1%) | 577 (27.9%) |
Occupancy by Educational Attainment in Luverne
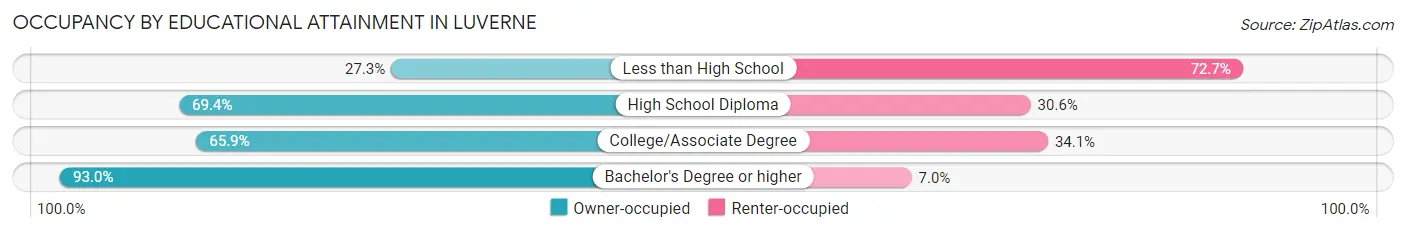
| Household Size | Owner-occupied | Renter-occupied |
| Less than High School | 38 (27.3%) | 101 (72.7%) |
| High School Diploma | 453 (69.4%) | 200 (30.6%) |
| College/Associate Degree | 455 (65.9%) | 235 (34.1%) |
| Bachelor's Degree or higher | 542 (93.0%) | 41 (7.0%) |
Occupancy by Age of Householder in Luverne
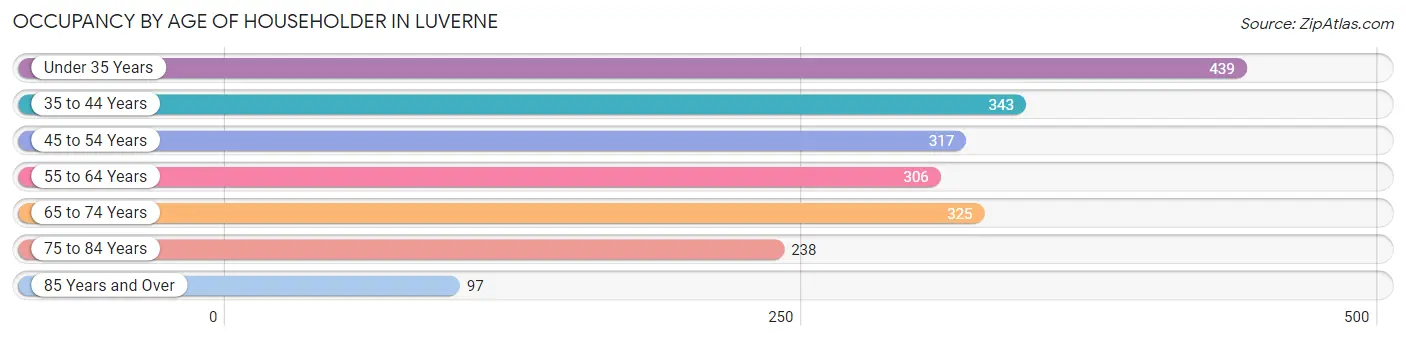
| Age Bracket | # Households | % Households |
| Under 35 Years | 439 | 21.3% |
| 35 to 44 Years | 343 | 16.6% |
| 45 to 54 Years | 317 | 15.3% |
| 55 to 64 Years | 306 | 14.8% |
| 65 to 74 Years | 325 | 15.7% |
| 75 to 84 Years | 238 | 11.5% |
| 85 Years and Over | 97 | 4.7% |
| Total | 2,065 | 100.0% |
Housing Finances in Luverne
Median Income by Occupancy in Luverne
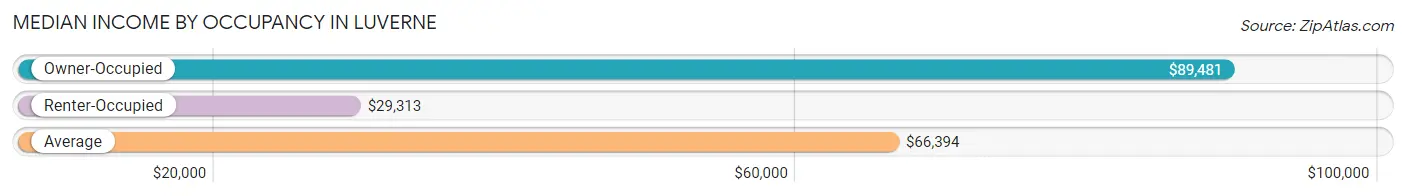
| Occupancy Type | # Households | Median Income |
| Owner-Occupied | 1,488 (72.1%) | $89,481 |
| Renter-Occupied | 577 (27.9%) | $29,313 |
| Average | 2,065 (100.0%) | $66,394 |
Occupancy by Householder Income Bracket in Luverne
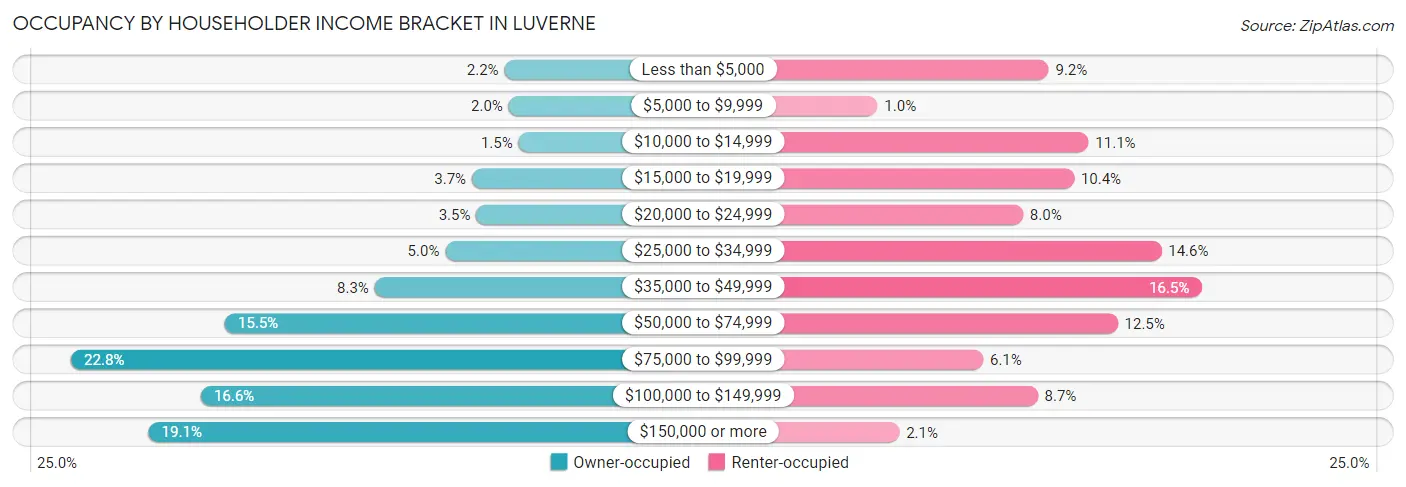
| Income Bracket | Owner-occupied | Renter-occupied |
| Less than $5,000 | 32 (2.1%) | 53 (9.2%) |
| $5,000 to $9,999 | 29 (1.9%) | 6 (1.0%) |
| $10,000 to $14,999 | 22 (1.5%) | 64 (11.1%) |
| $15,000 to $19,999 | 55 (3.7%) | 60 (10.4%) |
| $20,000 to $24,999 | 52 (3.5%) | 46 (8.0%) |
| $25,000 to $34,999 | 74 (5.0%) | 84 (14.6%) |
| $35,000 to $49,999 | 124 (8.3%) | 95 (16.5%) |
| $50,000 to $74,999 | 230 (15.5%) | 72 (12.5%) |
| $75,000 to $99,999 | 339 (22.8%) | 35 (6.1%) |
| $100,000 to $149,999 | 247 (16.6%) | 50 (8.7%) |
| $150,000 or more | 284 (19.1%) | 12 (2.1%) |
| Total | 1,488 (100.0%) | 577 (100.0%) |
Monthly Housing Cost Tiers in Luverne
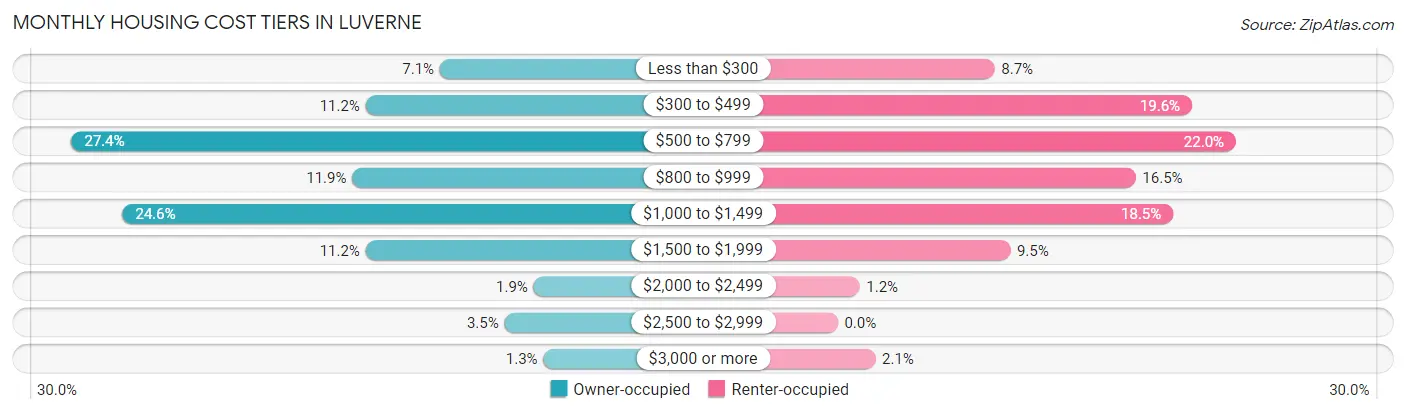
| Monthly Cost | Owner-occupied | Renter-occupied |
| Less than $300 | 105 (7.1%) | 50 (8.7%) |
| $300 to $499 | 166 (11.2%) | 113 (19.6%) |
| $500 to $799 | 408 (27.4%) | 127 (22.0%) |
| $800 to $999 | 177 (11.9%) | 95 (16.5%) |
| $1,000 to $1,499 | 366 (24.6%) | 107 (18.5%) |
| $1,500 to $1,999 | 166 (11.2%) | 55 (9.5%) |
| $2,000 to $2,499 | 28 (1.9%) | 7 (1.2%) |
| $2,500 to $2,999 | 52 (3.5%) | 0 (0.0%) |
| $3,000 or more | 20 (1.3%) | 12 (2.1%) |
| Total | 1,488 (100.0%) | 577 (100.0%) |
Physical Housing Characteristics in Luverne
Housing Structures in Luverne
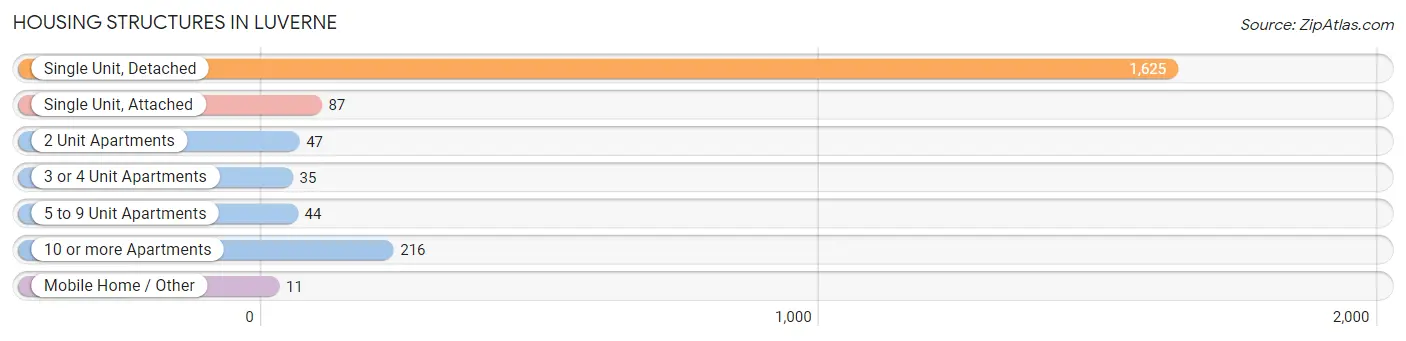
| Structure Type | # Housing Units | % Housing Units |
| Single Unit, Detached | 1,625 | 78.7% |
| Single Unit, Attached | 87 | 4.2% |
| 2 Unit Apartments | 47 | 2.3% |
| 3 or 4 Unit Apartments | 35 | 1.7% |
| 5 to 9 Unit Apartments | 44 | 2.1% |
| 10 or more Apartments | 216 | 10.5% |
| Mobile Home / Other | 11 | 0.5% |
| Total | 2,065 | 100.0% |
Housing Structures by Occupancy in Luverne
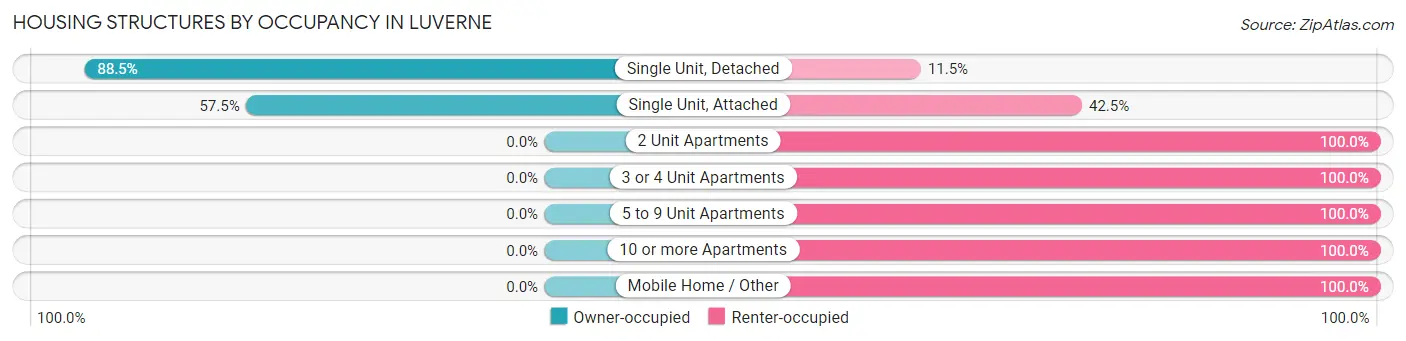
| Structure Type | Owner-occupied | Renter-occupied |
| Single Unit, Detached | 1,438 (88.5%) | 187 (11.5%) |
| Single Unit, Attached | 50 (57.5%) | 37 (42.5%) |
| 2 Unit Apartments | 0 (0.0%) | 47 (100.0%) |
| 3 or 4 Unit Apartments | 0 (0.0%) | 35 (100.0%) |
| 5 to 9 Unit Apartments | 0 (0.0%) | 44 (100.0%) |
| 10 or more Apartments | 0 (0.0%) | 216 (100.0%) |
| Mobile Home / Other | 0 (0.0%) | 11 (100.0%) |
| Total | 1,488 (72.1%) | 577 (27.9%) |
Housing Structures by Number of Rooms in Luverne
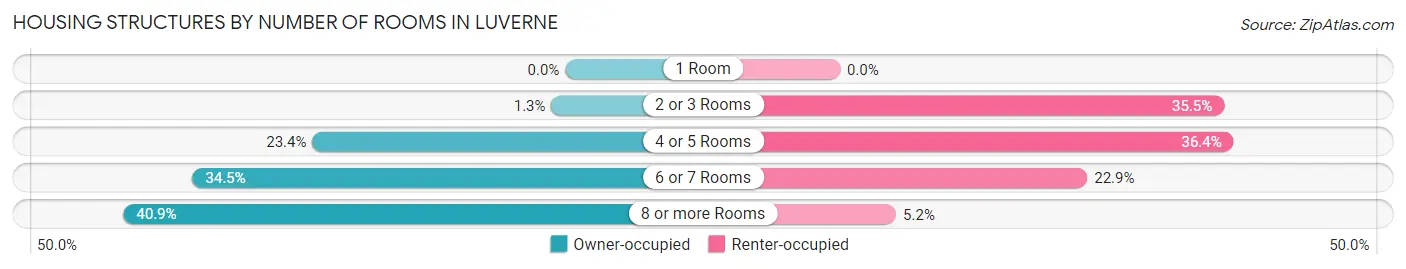
| Number of Rooms | Owner-occupied | Renter-occupied |
| 1 Room | 0 (0.0%) | 0 (0.0%) |
| 2 or 3 Rooms | 19 (1.3%) | 205 (35.5%) |
| 4 or 5 Rooms | 348 (23.4%) | 210 (36.4%) |
| 6 or 7 Rooms | 513 (34.5%) | 132 (22.9%) |
| 8 or more Rooms | 608 (40.9%) | 30 (5.2%) |
| Total | 1,488 (100.0%) | 577 (100.0%) |
Housing Structure by Heating Type in Luverne
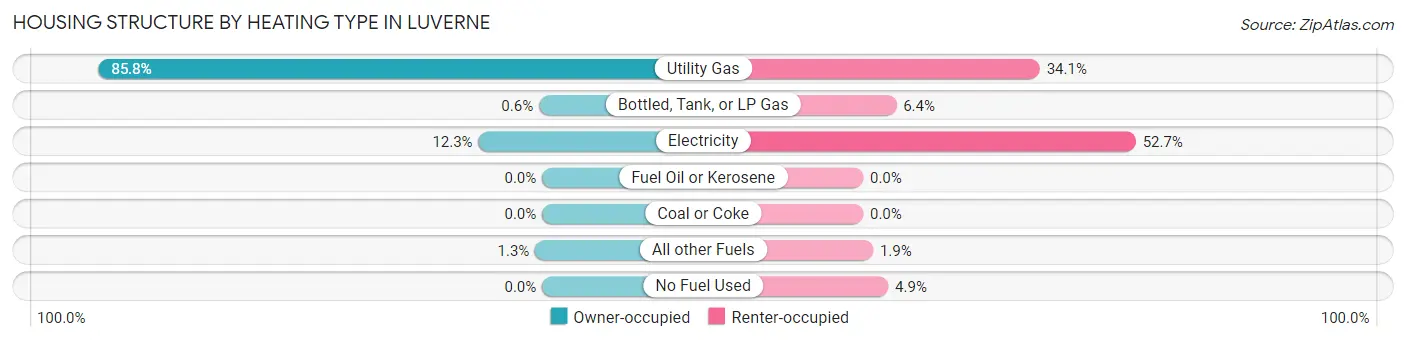
| Heating Type | Owner-occupied | Renter-occupied |
| Utility Gas | 1,276 (85.8%) | 197 (34.1%) |
| Bottled, Tank, or LP Gas | 9 (0.6%) | 37 (6.4%) |
| Electricity | 183 (12.3%) | 304 (52.7%) |
| Fuel Oil or Kerosene | 0 (0.0%) | 0 (0.0%) |
| Coal or Coke | 0 (0.0%) | 0 (0.0%) |
| All other Fuels | 20 (1.3%) | 11 (1.9%) |
| No Fuel Used | 0 (0.0%) | 28 (4.9%) |
| Total | 1,488 (100.0%) | 577 (100.0%) |
Household Vehicle Usage in Luverne
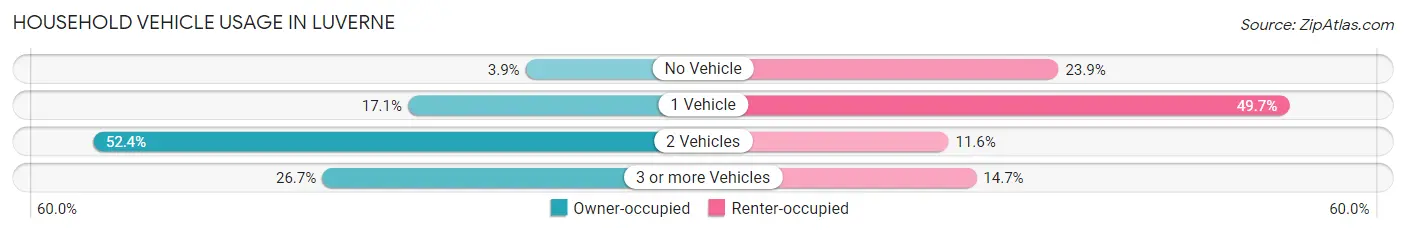
| Vehicles per Household | Owner-occupied | Renter-occupied |
| No Vehicle | 58 (3.9%) | 138 (23.9%) |
| 1 Vehicle | 254 (17.1%) | 287 (49.7%) |
| 2 Vehicles | 779 (52.3%) | 67 (11.6%) |
| 3 or more Vehicles | 397 (26.7%) | 85 (14.7%) |
| Total | 1,488 (100.0%) | 577 (100.0%) |
Real Estate & Mortgages in Luverne
Real Estate and Mortgage Overview in Luverne
| Characteristic | Without Mortgage | With Mortgage |
| Housing Units | 596 | 892 |
| Median Property Value | $176,300 | $172,200 |
| Median Household Income | $55,313 | $217 |
| Monthly Housing Costs | $517 | $20 |
| Real Estate Taxes | $1,461 | $4 |
Property Value by Mortgage Status in Luverne
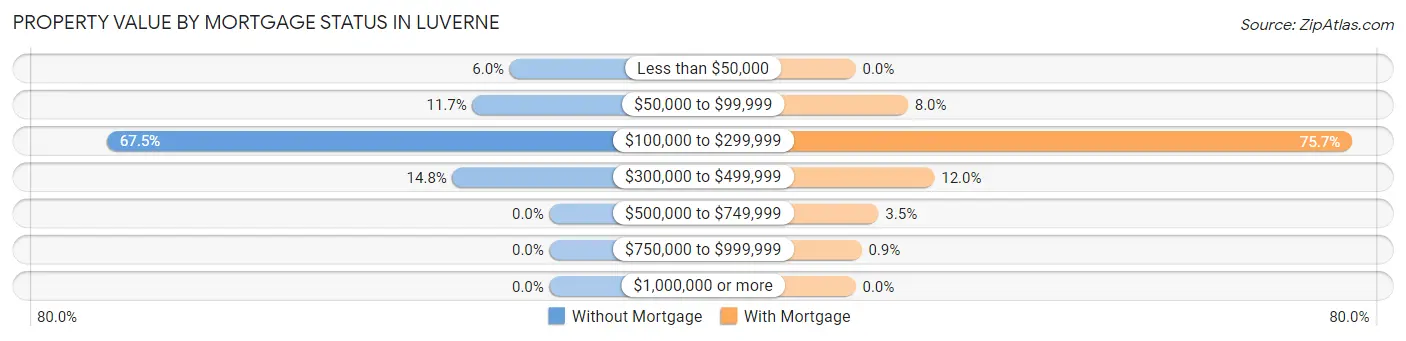
| Property Value | Without Mortgage | With Mortgage |
| Less than $50,000 | 36 (6.0%) | 0 (0.0%) |
| $50,000 to $99,999 | 70 (11.7%) | 71 (8.0%) |
| $100,000 to $299,999 | 402 (67.4%) | 675 (75.7%) |
| $300,000 to $499,999 | 88 (14.8%) | 107 (12.0%) |
| $500,000 to $749,999 | 0 (0.0%) | 31 (3.5%) |
| $750,000 to $999,999 | 0 (0.0%) | 8 (0.9%) |
| $1,000,000 or more | 0 (0.0%) | 0 (0.0%) |
| Total | 596 (100.0%) | 892 (100.0%) |
Household Income by Mortgage Status in Luverne
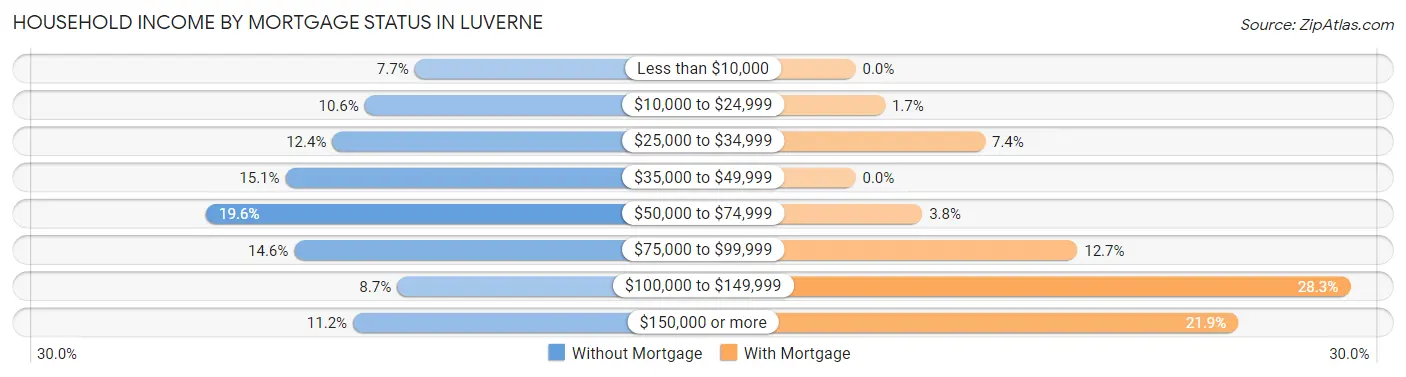
| Household Income | Without Mortgage | With Mortgage |
| Less than $10,000 | 46 (7.7%) | 0 (0.0%) |
| $10,000 to $24,999 | 63 (10.6%) | 15 (1.7%) |
| $25,000 to $34,999 | 74 (12.4%) | 66 (7.4%) |
| $35,000 to $49,999 | 90 (15.1%) | 0 (0.0%) |
| $50,000 to $74,999 | 117 (19.6%) | 34 (3.8%) |
| $75,000 to $99,999 | 87 (14.6%) | 113 (12.7%) |
| $100,000 to $149,999 | 52 (8.7%) | 252 (28.2%) |
| $150,000 or more | 67 (11.2%) | 195 (21.9%) |
| Total | 596 (100.0%) | 892 (100.0%) |
Property Value to Household Income Ratio in Luverne
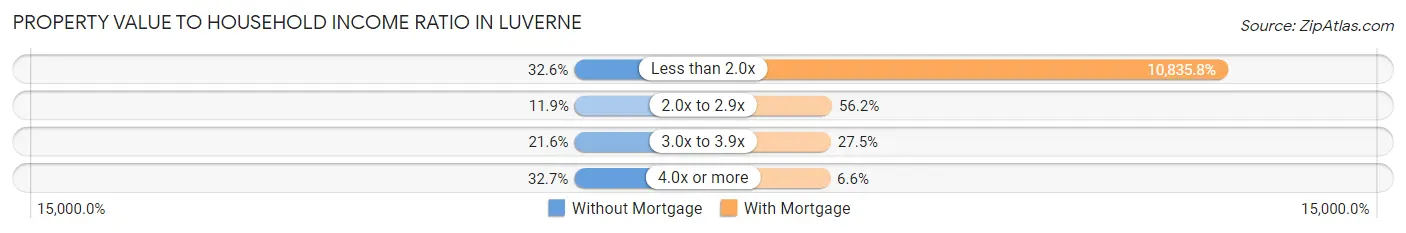
| Value-to-Income Ratio | Without Mortgage | With Mortgage |
| Less than 2.0x | 194 (32.6%) | 96,655 (10,835.8%) |
| 2.0x to 2.9x | 71 (11.9%) | 501 (56.2%) |
| 3.0x to 3.9x | 129 (21.6%) | 245 (27.5%) |
| 4.0x or more | 195 (32.7%) | 59 (6.6%) |
| Total | 596 (100.0%) | 892 (100.0%) |
Real Estate Taxes by Mortgage Status in Luverne
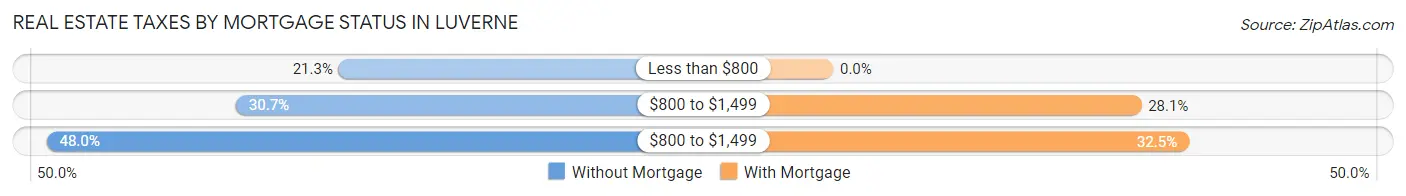
| Property Taxes | Without Mortgage | With Mortgage |
| Less than $800 | 127 (21.3%) | 0 (0.0%) |
| $800 to $1,499 | 183 (30.7%) | 251 (28.1%) |
| $800 to $1,499 | 286 (48.0%) | 290 (32.5%) |
| Total | 596 (100.0%) | 892 (100.0%) |
Health & Disability in Luverne
Health Insurance Coverage by Age in Luverne
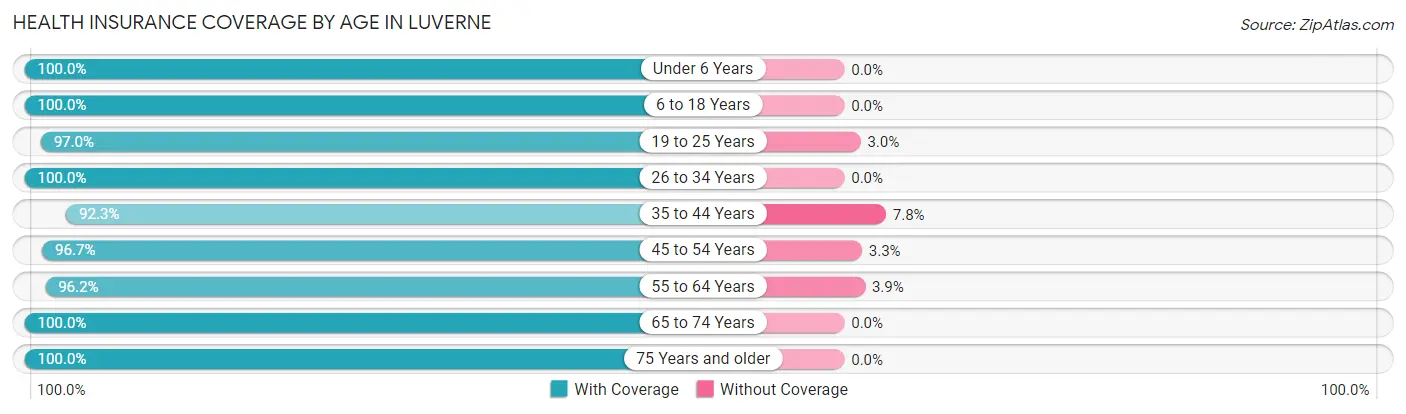
| Age Bracket | With Coverage | Without Coverage |
| Under 6 Years | 329 (100.0%) | 0 (0.0%) |
| 6 to 18 Years | 985 (100.0%) | 0 (0.0%) |
| 19 to 25 Years | 290 (97.0%) | 9 (3.0%) |
| 26 to 34 Years | 628 (100.0%) | 0 (0.0%) |
| 35 to 44 Years | 512 (92.2%) | 43 (7.7%) |
| 45 to 54 Years | 472 (96.7%) | 16 (3.3%) |
| 55 to 64 Years | 500 (96.2%) | 20 (3.8%) |
| 65 to 74 Years | 485 (100.0%) | 0 (0.0%) |
| 75 Years and older | 454 (100.0%) | 0 (0.0%) |
| Total | 4,655 (98.1%) | 88 (1.9%) |
Health Insurance Coverage by Citizenship Status in Luverne

| Citizenship Status | With Coverage | Without Coverage |
| Native Born | 329 (100.0%) | 0 (0.0%) |
| Foreign Born, Citizen | 985 (100.0%) | 0 (0.0%) |
| Foreign Born, not a Citizen | 290 (97.0%) | 9 (3.0%) |
Health Insurance Coverage by Household Income in Luverne
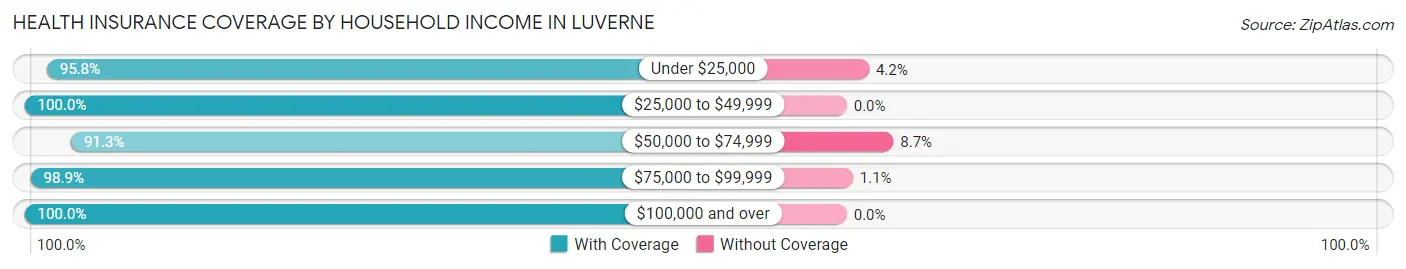
| Household Income | With Coverage | Without Coverage |
| Under $25,000 | 529 (95.8%) | 23 (4.2%) |
| $25,000 to $49,999 | 734 (100.0%) | 0 (0.0%) |
| $50,000 to $74,999 | 544 (91.3%) | 52 (8.7%) |
| $75,000 to $99,999 | 1,125 (98.9%) | 13 (1.1%) |
| $100,000 and over | 1,675 (100.0%) | 0 (0.0%) |
Public vs Private Health Insurance Coverage by Age in Luverne
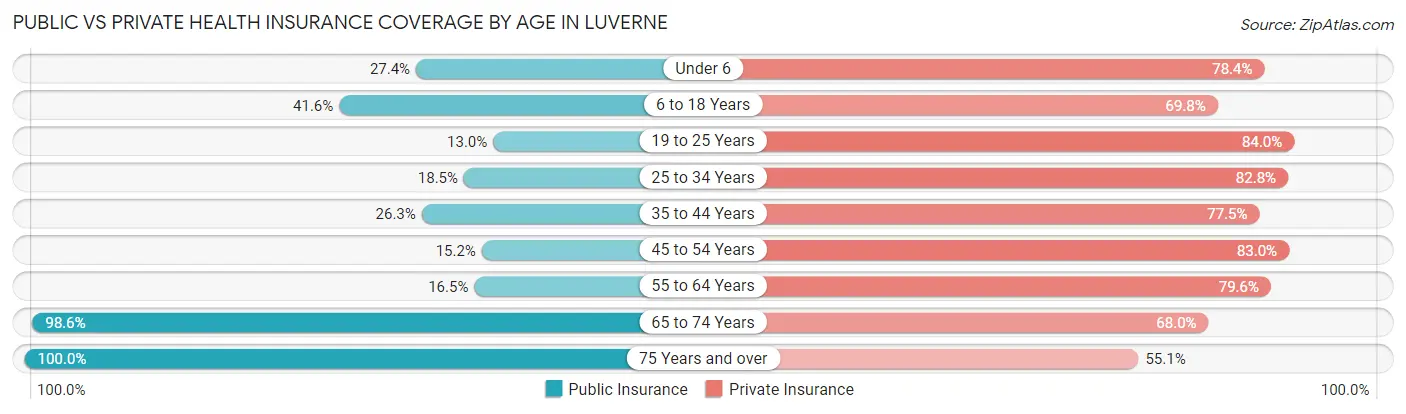
| Age Bracket | Public Insurance | Private Insurance |
| Under 6 | 90 (27.4%) | 258 (78.4%) |
| 6 to 18 Years | 410 (41.6%) | 687 (69.8%) |
| 19 to 25 Years | 39 (13.0%) | 251 (84.0%) |
| 25 to 34 Years | 116 (18.5%) | 520 (82.8%) |
| 35 to 44 Years | 146 (26.3%) | 430 (77.5%) |
| 45 to 54 Years | 74 (15.2%) | 405 (83.0%) |
| 55 to 64 Years | 86 (16.5%) | 414 (79.6%) |
| 65 to 74 Years | 478 (98.6%) | 330 (68.0%) |
| 75 Years and over | 454 (100.0%) | 250 (55.1%) |
| Total | 1,893 (39.9%) | 3,545 (74.7%) |
Disability Status by Sex by Age in Luverne
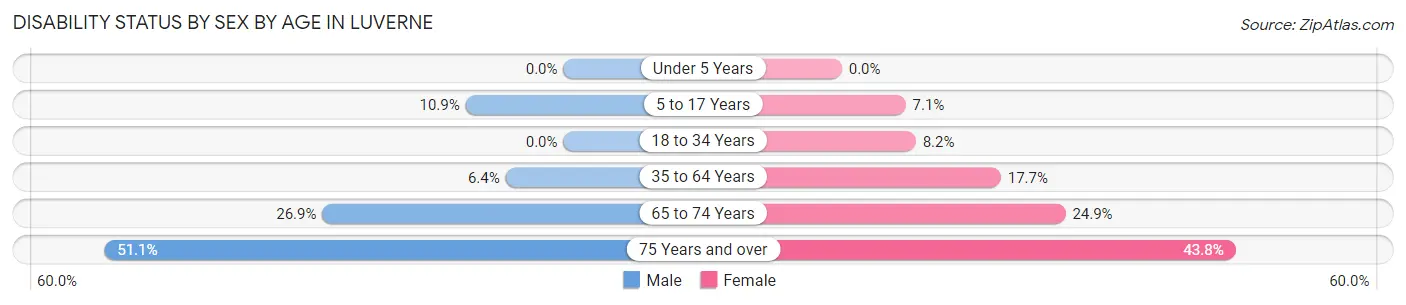
| Age Bracket | Male | Female |
| Under 5 Years | 0 (0.0%) | 0 (0.0%) |
| 5 to 17 Years | 50 (10.9%) | 36 (7.1%) |
| 18 to 34 Years | 0 (0.0%) | 40 (8.2%) |
| 35 to 64 Years | 45 (6.4%) | 153 (17.7%) |
| 65 to 74 Years | 58 (26.9%) | 67 (24.9%) |
| 75 Years and over | 91 (51.1%) | 121 (43.8%) |
Disability Class by Sex by Age in Luverne
Disability Class: Hearing Difficulty
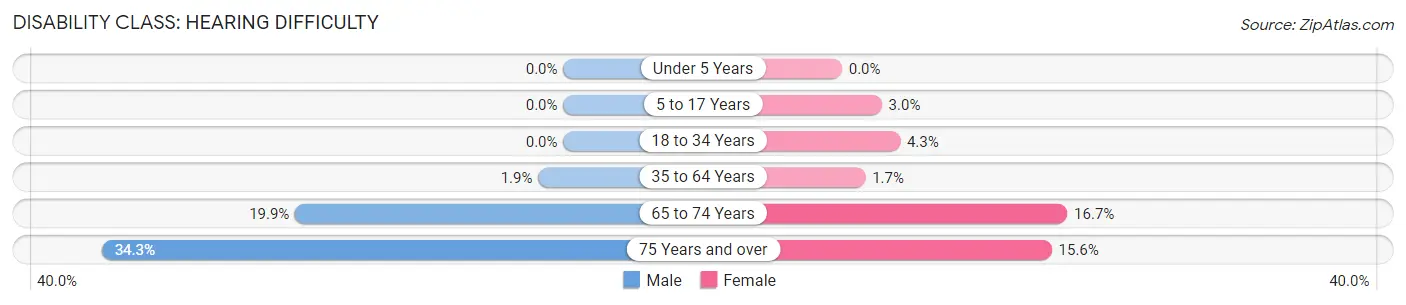
| Age Bracket | Male | Female |
| Under 5 Years | 0 (0.0%) | 0 (0.0%) |
| 5 to 17 Years | 0 (0.0%) | 15 (3.0%) |
| 18 to 34 Years | 0 (0.0%) | 21 (4.3%) |
| 35 to 64 Years | 13 (1.9%) | 15 (1.7%) |
| 65 to 74 Years | 43 (19.9%) | 45 (16.7%) |
| 75 Years and over | 61 (34.3%) | 43 (15.6%) |
Disability Class: Vision Difficulty
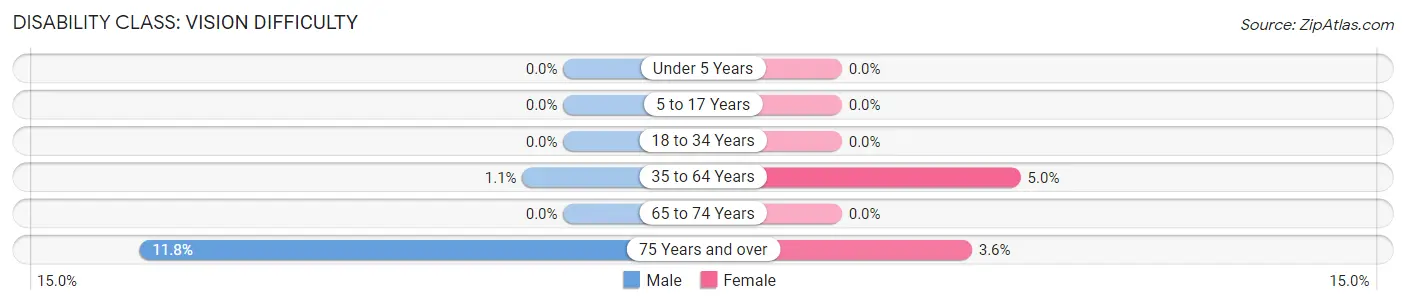
| Age Bracket | Male | Female |
| Under 5 Years | 0 (0.0%) | 0 (0.0%) |
| 5 to 17 Years | 0 (0.0%) | 0 (0.0%) |
| 18 to 34 Years | 0 (0.0%) | 0 (0.0%) |
| 35 to 64 Years | 8 (1.1%) | 43 (5.0%) |
| 65 to 74 Years | 0 (0.0%) | 0 (0.0%) |
| 75 Years and over | 21 (11.8%) | 10 (3.6%) |
Disability Class: Cognitive Difficulty
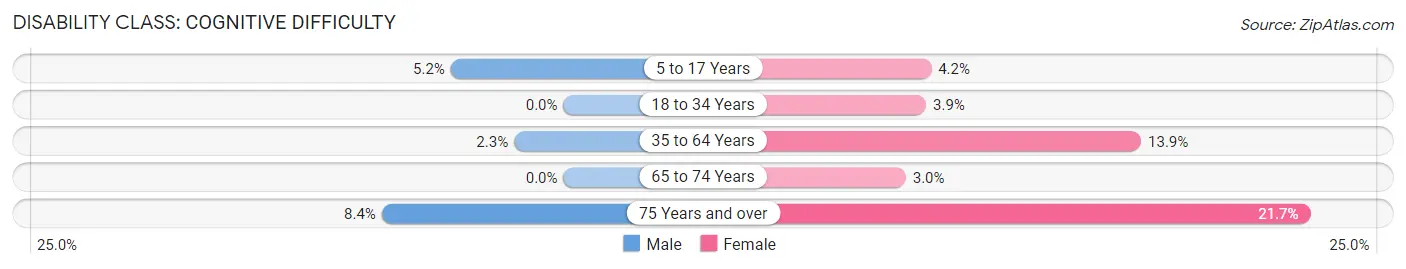
| Age Bracket | Male | Female |
| 5 to 17 Years | 24 (5.2%) | 21 (4.2%) |
| 18 to 34 Years | 0 (0.0%) | 19 (3.9%) |
| 35 to 64 Years | 16 (2.3%) | 120 (13.9%) |
| 65 to 74 Years | 0 (0.0%) | 8 (3.0%) |
| 75 Years and over | 15 (8.4%) | 60 (21.7%) |
Disability Class: Ambulatory Difficulty
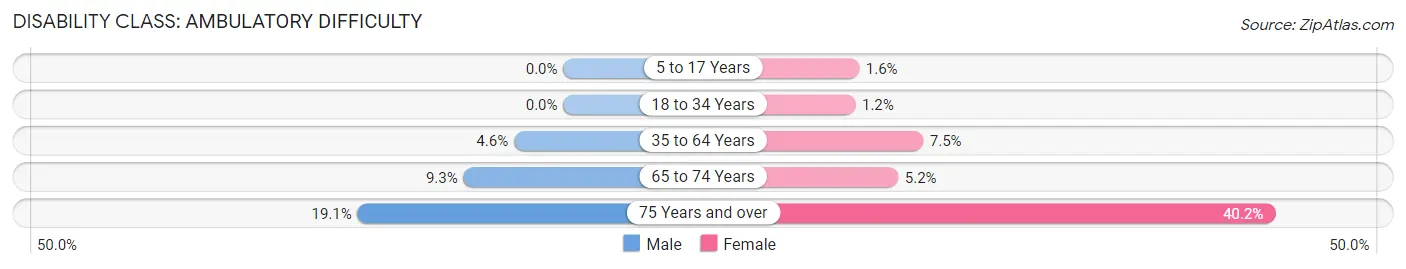
| Age Bracket | Male | Female |
| 5 to 17 Years | 0 (0.0%) | 8 (1.6%) |
| 18 to 34 Years | 0 (0.0%) | 6 (1.2%) |
| 35 to 64 Years | 32 (4.6%) | 65 (7.5%) |
| 65 to 74 Years | 20 (9.3%) | 14 (5.2%) |
| 75 Years and over | 34 (19.1%) | 111 (40.2%) |
Disability Class: Self-Care Difficulty
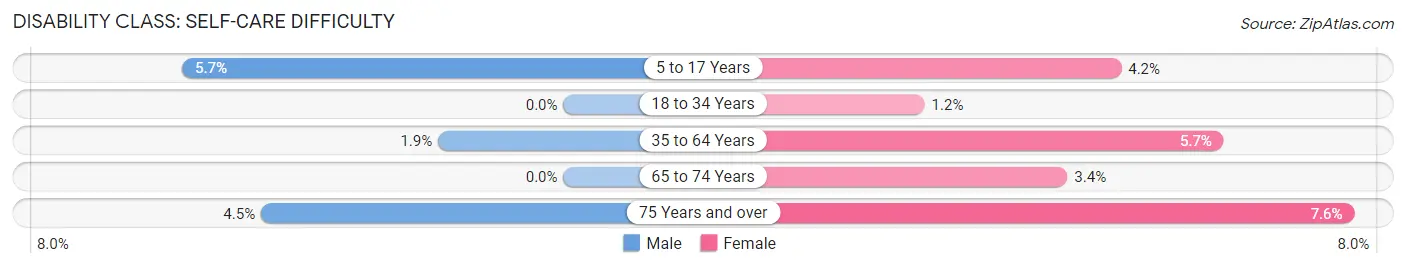
| Age Bracket | Male | Female |
| 5 to 17 Years | 26 (5.7%) | 21 (4.2%) |
| 18 to 34 Years | 0 (0.0%) | 6 (1.2%) |
| 35 to 64 Years | 13 (1.9%) | 49 (5.7%) |
| 65 to 74 Years | 0 (0.0%) | 9 (3.4%) |
| 75 Years and over | 8 (4.5%) | 21 (7.6%) |
Technology Access in Luverne
Computing Device Access in Luverne
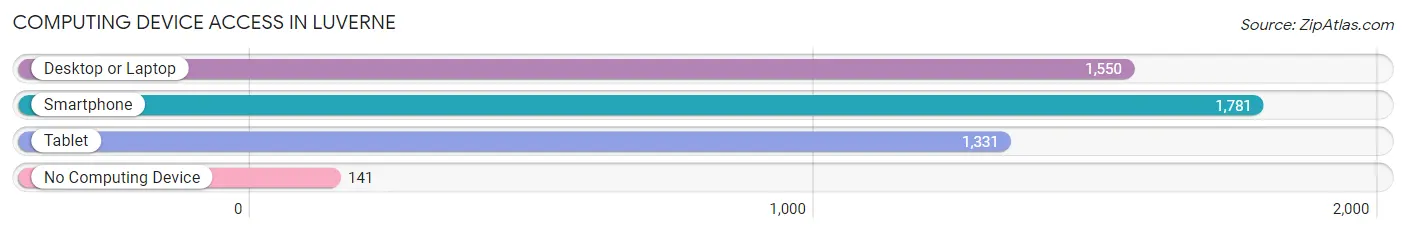
| Device Type | # Households | % Households |
| Desktop or Laptop | 1,550 | 75.1% |
| Smartphone | 1,781 | 86.3% |
| Tablet | 1,331 | 64.5% |
| No Computing Device | 141 | 6.8% |
| Total | 2,065 | 100.0% |
Internet Access in Luverne
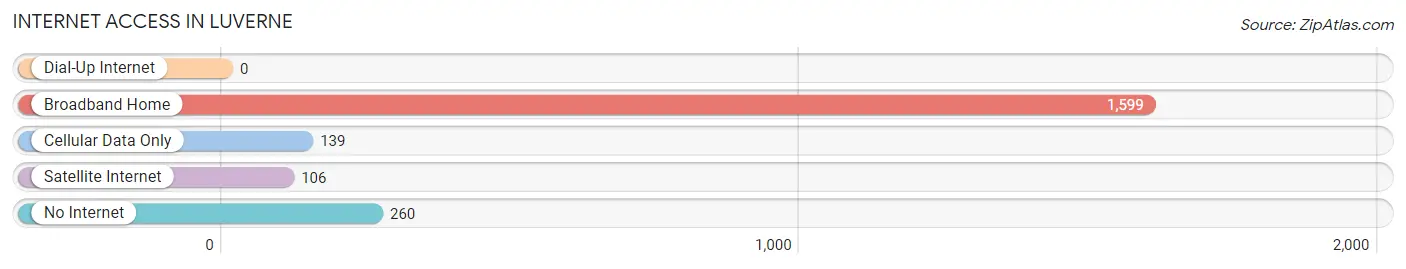
| Internet Type | # Households | % Households |
| Dial-Up Internet | 0 | 0.0% |
| Broadband Home | 1,599 | 77.4% |
| Cellular Data Only | 139 | 6.7% |
| Satellite Internet | 106 | 5.1% |
| No Internet | 260 | 12.6% |
| Total | 2,065 | 100.0% |
Luverne Summary
Luverne, Minnesota is a small city located in Rock County in the southwestern corner of the state. It is situated along the Rock River, which flows through the city and is a major source of recreation and economic activity. The city has a population of 4,717 as of the 2020 census, making it the largest city in Rock County.
History
The area that is now Luverne was first settled in 1871 by a group of settlers from Luverne, Iowa. The city was named after the Iowa town, and was incorporated in 1881. The city quickly grew, and by the turn of the century, it had become a major agricultural center. The city was also home to a number of businesses, including a flour mill, a creamery, and a brickyard.
In the early 1900s, the city began to diversify its economy, and by the 1920s, it had become a major center for manufacturing. The city was home to a number of factories, including a foundry, a machine shop, and a furniture factory. The city also had a number of retail stores, including a department store, a grocery store, and a drug store.
Geography
Luverne is located in the southwestern corner of Minnesota, in Rock County. The city is situated along the Rock River, which flows through the city and is a major source of recreation and economic activity. The city is located about 50 miles from Sioux Falls, South Dakota, and about 100 miles from Minneapolis, Minnesota.
The city has a total area of 4.2 square miles, all of which is land. The city is located at an elevation of 1,541 feet above sea level. The climate in Luverne is classified as humid continental, with cold winters and hot, humid summers.
Economy
The economy of Luverne is largely based on agriculture and manufacturing. The city is home to a number of agricultural businesses, including a feed mill, a grain elevator, and a dairy. The city is also home to a number of manufacturing businesses, including a foundry, a machine shop, and a furniture factory.
The city is also home to a number of retail stores, including a department store, a grocery store, and a drug store. The city is also home to a number of service businesses, including a hospital, a bank, and a post office.
Demographics
As of the 2020 census, the population of Luverne was 4,717. The population is predominantly white, with 92.3% of the population identifying as white. The city also has a small Hispanic population, with 4.2% of the population identifying as Hispanic or Latino.
The median household income in Luverne is $45,845, and the median home value is $117,400. The city has a poverty rate of 11.3%, and the unemployment rate is 3.7%. The city has a high school graduation rate of 92.3%, and the city has a high rate of homeownership, with 73.3% of the population owning their own homes.
Common Questions
What is Per Capita Income in Luverne?
Per Capita income in Luverne is $37,250.
What is the Median Family Income in Luverne?
Median Family Income in Luverne is $92,000.
What is the Median Household income in Luverne?
Median Household Income in Luverne is $66,394.
What is Income or Wage Gap in Luverne?
Income or Wage Gap in Luverne is 15.7%.
Women in Luverne earn 84.3 cents for every dollar earned by a man.
What is Inequality or Gini Index in Luverne?
Inequality or Gini Index in Luverne is 0.45.
What is the Total Population of Luverne?
Total Population of Luverne is 4,910.
What is the Total Male Population of Luverne?
Total Male Population of Luverne is 2,300.
What is the Total Female Population of Luverne?
Total Female Population of Luverne is 2,610.
What is the Ratio of Males per 100 Females in Luverne?
There are 88.12 Males per 100 Females in Luverne.
What is the Ratio of Females per 100 Males in Luverne?
There are 113.48 Females per 100 Males in Luverne.
What is the Median Population Age in Luverne?
Median Population Age in Luverne is 38.5 Years.
What is the Average Family Size in Luverne
Average Family Size in Luverne is 3.0 People.
What is the Average Household Size in Luverne
Average Household Size in Luverne is 2.3 People.
How Large is the Labor Force in Luverne?
There are 2,558 People in the Labor Forcein in Luverne.
What is the Percentage of People in the Labor Force in Luverne?
67.1% of People are in the Labor Force in Luverne.
What is the Unemployment Rate in Luverne?
Unemployment Rate in Luverne is 2.2%.