Wilton, NH Map & Demographics
Wilton Map
Wilton Overview
$44,050
PER CAPITA INCOME
$120,809
AVG FAMILY INCOME
$59,556
AVG HOUSEHOLD INCOME
46.0%
WAGE / INCOME GAP [ % ]
54.0¢/ $1
WAGE / INCOME GAP [ $ ]
0.33
INEQUALITY / GINI INDEX
1,333
TOTAL POPULATION
767
MALE POPULATION
566
FEMALE POPULATION
135.51
MALES / 100 FEMALES
73.79
FEMALES / 100 MALES
46.8
MEDIAN AGE
3.3
AVG FAMILY SIZE
2.0
AVG HOUSEHOLD SIZE
811
LABOR FORCE [ PEOPLE ]
70.0%
PERCENT IN LABOR FORCE
5.2%
UNEMPLOYMENT RATE
Wilton Zip Codes
Wilton Area Codes
Income in Wilton
Income Overview in Wilton
Per Capita Income in Wilton is $44,050, while median incomes of families and households are $120,809 and $59,556 respectively.
| Characteristic | Number | Measure |
| Per Capita Income | 1,333 | $44,050 |
| Median Family Income | 241 | $120,809 |
| Mean Family Income | 241 | $119,584 |
| Median Household Income | 676 | $59,556 |
| Mean Household Income | 676 | $85,955 |
| Income Deficit | 241 | $0 |
| Wage / Income Gap (%) | 1,333 | 46.01% |
| Wage / Income Gap ($) | 1,333 | 53.99¢ per $1 |
| Gini / Inequality Index | 1,333 | 0.33 |
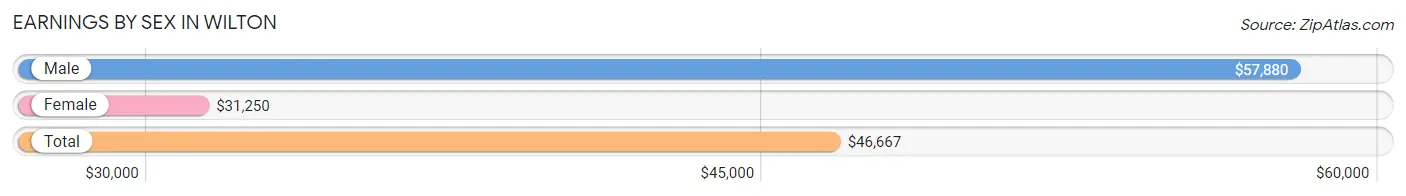
Earnings by Sex in Wilton
Average Earnings in Wilton are $46,667, $57,880 for men and $31,250 for women, a difference of 46.0%.
| Sex | Number | Average Earnings |
| Male | 543 (67.2%) | $57,880 |
| Female | 265 (32.8%) | $31,250 |
| Total | 808 (100.0%) | $46,667 |
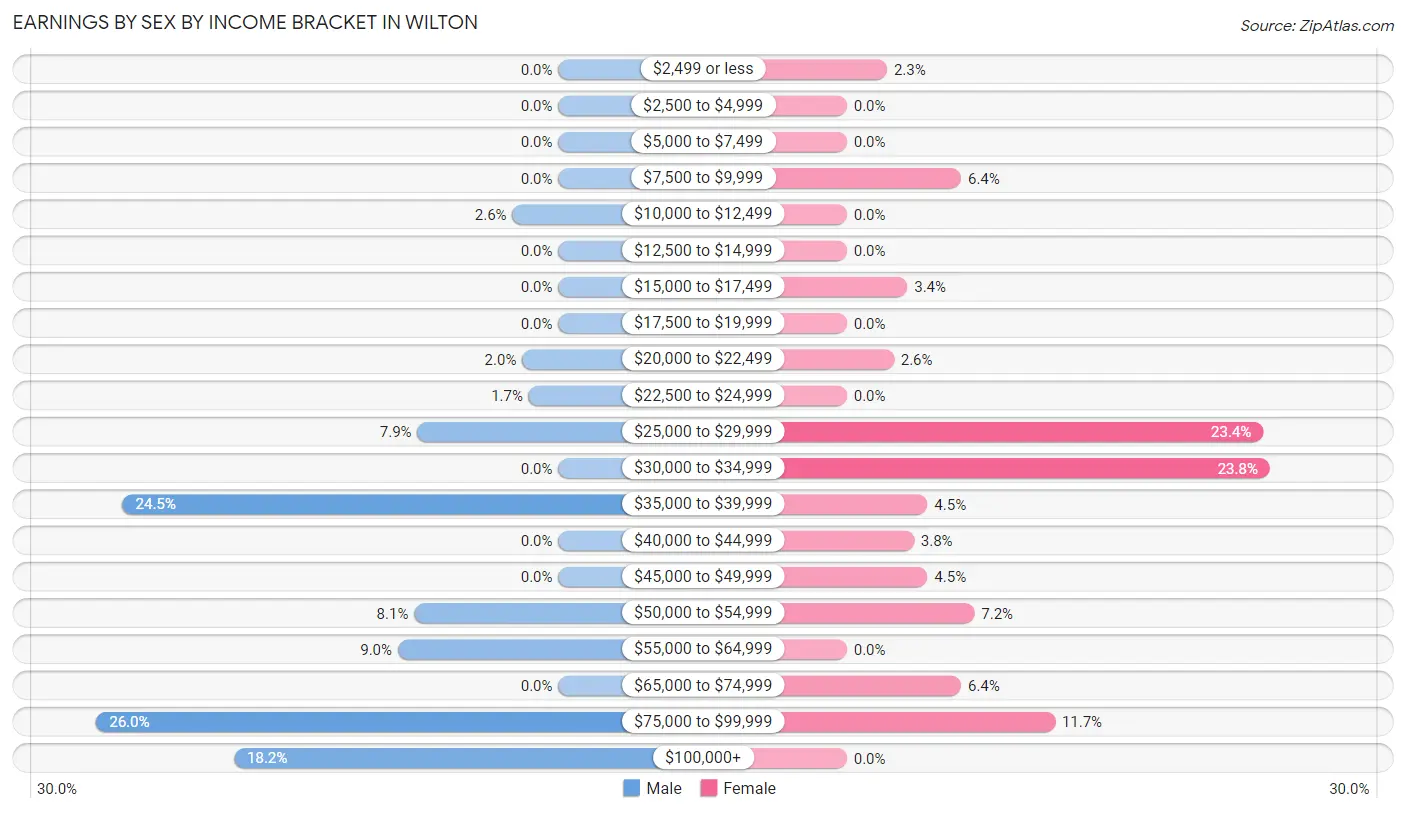
Earnings by Sex by Income Bracket in Wilton
The most common earnings brackets in Wilton are $75,000 to $99,999 for men (141 | 26.0%) and $30,000 to $34,999 for women (63 | 23.8%).
| Income | Male | Female |
| $2,499 or less | 0 (0.0%) | 6 (2.3%) |
| $2,500 to $4,999 | 0 (0.0%) | 0 (0.0%) |
| $5,000 to $7,499 | 0 (0.0%) | 0 (0.0%) |
| $7,500 to $9,999 | 0 (0.0%) | 17 (6.4%) |
| $10,000 to $12,499 | 14 (2.6%) | 0 (0.0%) |
| $12,500 to $14,999 | 0 (0.0%) | 0 (0.0%) |
| $15,000 to $17,499 | 0 (0.0%) | 9 (3.4%) |
| $17,500 to $19,999 | 0 (0.0%) | 0 (0.0%) |
| $20,000 to $22,499 | 11 (2.0%) | 7 (2.6%) |
| $22,500 to $24,999 | 9 (1.7%) | 0 (0.0%) |
| $25,000 to $29,999 | 43 (7.9%) | 62 (23.4%) |
| $30,000 to $34,999 | 0 (0.0%) | 63 (23.8%) |
| $35,000 to $39,999 | 133 (24.5%) | 12 (4.5%) |
| $40,000 to $44,999 | 0 (0.0%) | 10 (3.8%) |
| $45,000 to $49,999 | 0 (0.0%) | 12 (4.5%) |
| $50,000 to $54,999 | 44 (8.1%) | 19 (7.2%) |
| $55,000 to $64,999 | 49 (9.0%) | 0 (0.0%) |
| $65,000 to $74,999 | 0 (0.0%) | 17 (6.4%) |
| $75,000 to $99,999 | 141 (26.0%) | 31 (11.7%) |
| $100,000+ | 99 (18.2%) | 0 (0.0%) |
| Total | 543 (100.0%) | 265 (100.0%) |
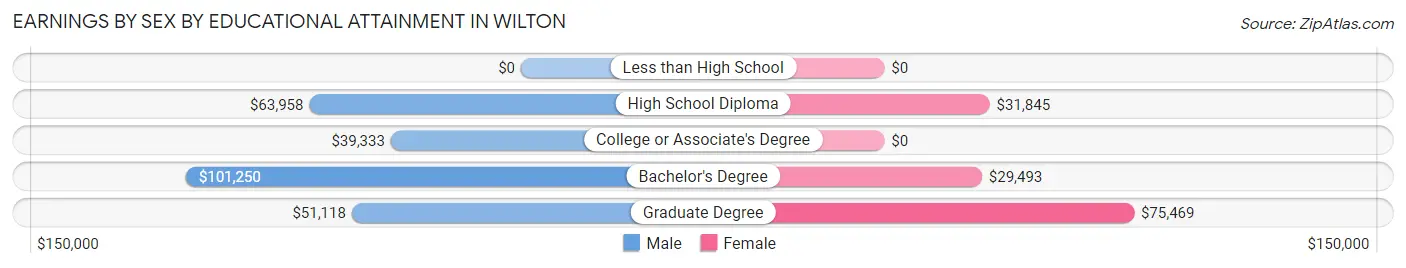
Earnings by Sex by Educational Attainment in Wilton
Average earnings in Wilton are $58,641 for men and $31,587 for women, a difference of 46.1%. Men with an educational attainment of bachelor's degree enjoy the highest average annual earnings of $101,250, while those with college or associate's degree education earn the least with $39,333. Women with an educational attainment of graduate degree earn the most with the average annual earnings of $75,469, while those with bachelor's degree education have the smallest earnings of $29,493.
| Educational Attainment | Male Income | Female Income |
| Less than High School | - | - |
| High School Diploma | $63,958 | $31,845 |
| College or Associate's Degree | $39,333 | $0 |
| Bachelor's Degree | $101,250 | $29,493 |
| Graduate Degree | $51,118 | $75,469 |
| Total | $58,641 | $31,587 |
Family Income in Wilton
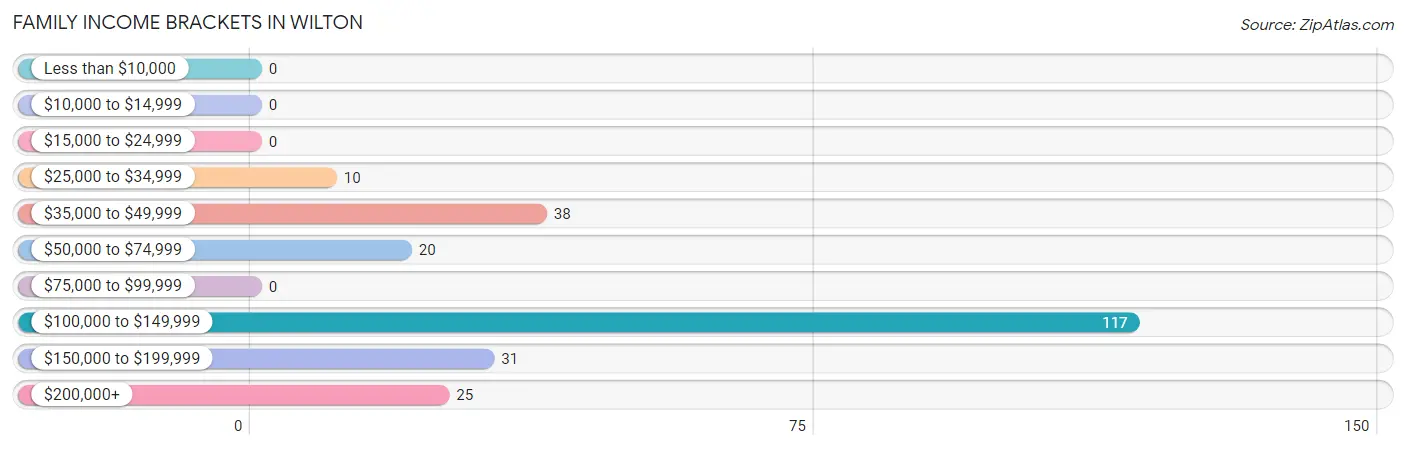
Family Income Brackets in Wilton
According to the Wilton family income data, there are 117 families falling into the $100,000 to $149,999 income range, which is the most common income bracket and makes up 48.5% of all families.
| Income Bracket | # Families | % Families |
| Less than $10,000 | 0 | 0.0% |
| $10,000 to $14,999 | 0 | 0.0% |
| $15,000 to $24,999 | 0 | 0.0% |
| $25,000 to $34,999 | 10 | 4.1% |
| $35,000 to $49,999 | 38 | 15.8% |
| $50,000 to $74,999 | 20 | 8.3% |
| $75,000 to $99,999 | 0 | 0.0% |
| $100,000 to $149,999 | 117 | 48.5% |
| $150,000 to $199,999 | 31 | 12.9% |
| $200,000+ | 25 | 10.4% |
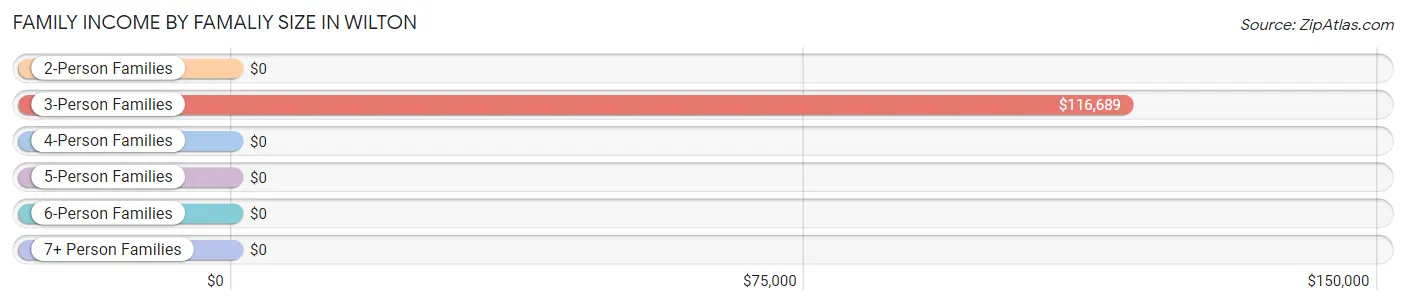
Family Income by Famaliy Size in Wilton
3-person families (70 | 29.0%) account for the highest median family income in Wilton with $116,689 per family, while 3-person families (70 | 29.0%) have the highest median income of $38,896 per family member.
| Income Bracket | # Families | Median Income |
| 2-Person Families | 114 (47.3%) | $0 |
| 3-Person Families | 70 (29.0%) | $116,689 |
| 4-Person Families | 39 (16.2%) | $0 |
| 5-Person Families | 0 (0.0%) | $0 |
| 6-Person Families | 0 (0.0%) | $0 |
| 7+ Person Families | 18 (7.5%) | $0 |
| Total | 241 (100.0%) | $120,809 |
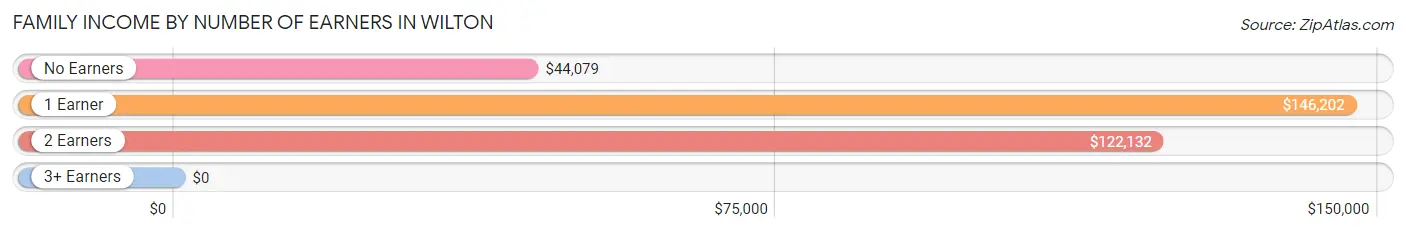
Family Income by Number of Earners in Wilton
| Number of Earners | # Families | Median Income |
| No Earners | 68 (28.2%) | $44,079 |
| 1 Earner | 45 (18.7%) | $146,202 |
| 2 Earners | 103 (42.7%) | $122,132 |
| 3+ Earners | 25 (10.4%) | $0 |
| Total | 241 (100.0%) | $120,809 |
Household Income in Wilton
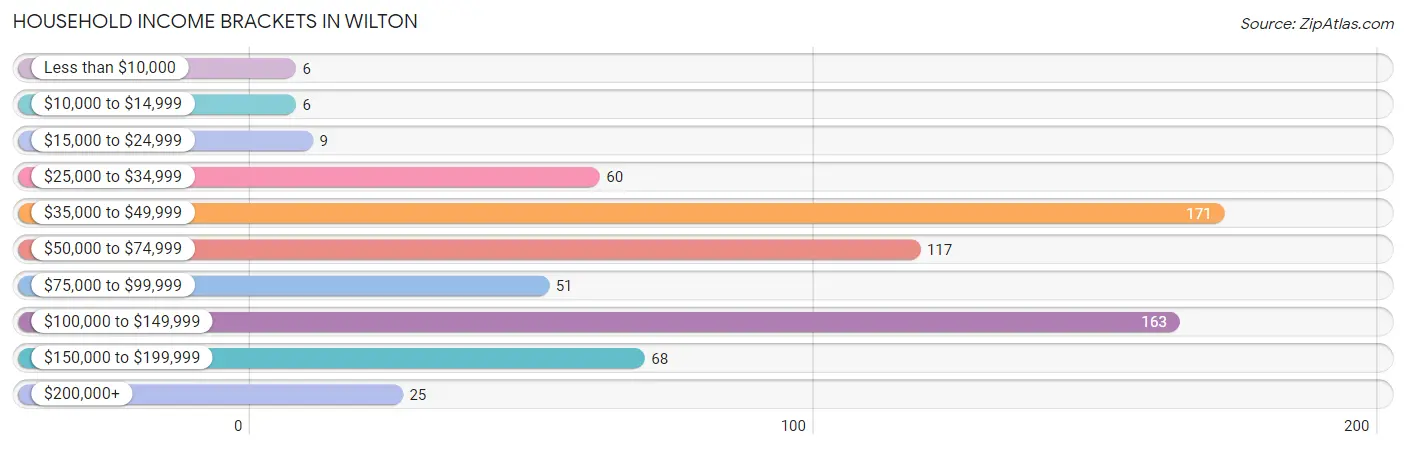
Household Income Brackets in Wilton
With 171 households falling in the category, the $35,000 to $49,999 income range is the most frequent in Wilton, accounting for 25.3% of all households. In contrast, only 6 households (0.9%) fall into the less than $10,000 income bracket, making it the least populous group.
| Income Bracket | # Households | % Households |
| Less than $10,000 | 6 | 0.9% |
| $10,000 to $14,999 | 6 | 0.9% |
| $15,000 to $24,999 | 9 | 1.3% |
| $25,000 to $34,999 | 60 | 8.9% |
| $35,000 to $49,999 | 171 | 25.3% |
| $50,000 to $74,999 | 117 | 17.3% |
| $75,000 to $99,999 | 51 | 7.5% |
| $100,000 to $149,999 | 163 | 24.1% |
| $150,000 to $199,999 | 68 | 10.1% |
| $200,000+ | 25 | 3.7% |
Household Income by Householder Age in Wilton
The median household income in Wilton is $59,556, with the highest median household income of $65,500 found in the 65+ years age bracket for the primary householder. A total of 116 households (17.2%) fall into this category.
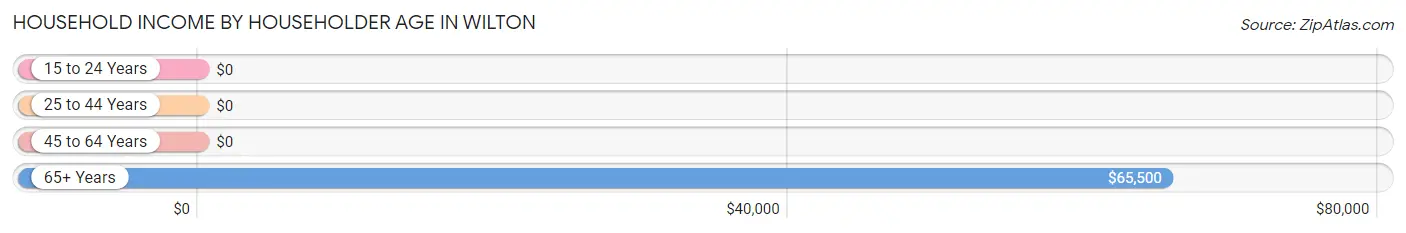
| Income Bracket | # Households | Median Income |
| 15 to 24 Years | 0 (0.0%) | $0 |
| 25 to 44 Years | 156 (23.1%) | $0 |
| 45 to 64 Years | 404 (59.8%) | $0 |
| 65+ Years | 116 (17.2%) | $65,500 |
| Total | 676 (100.0%) | $59,556 |
Poverty in Wilton
Income Below Poverty by Sex and Age in Wilton
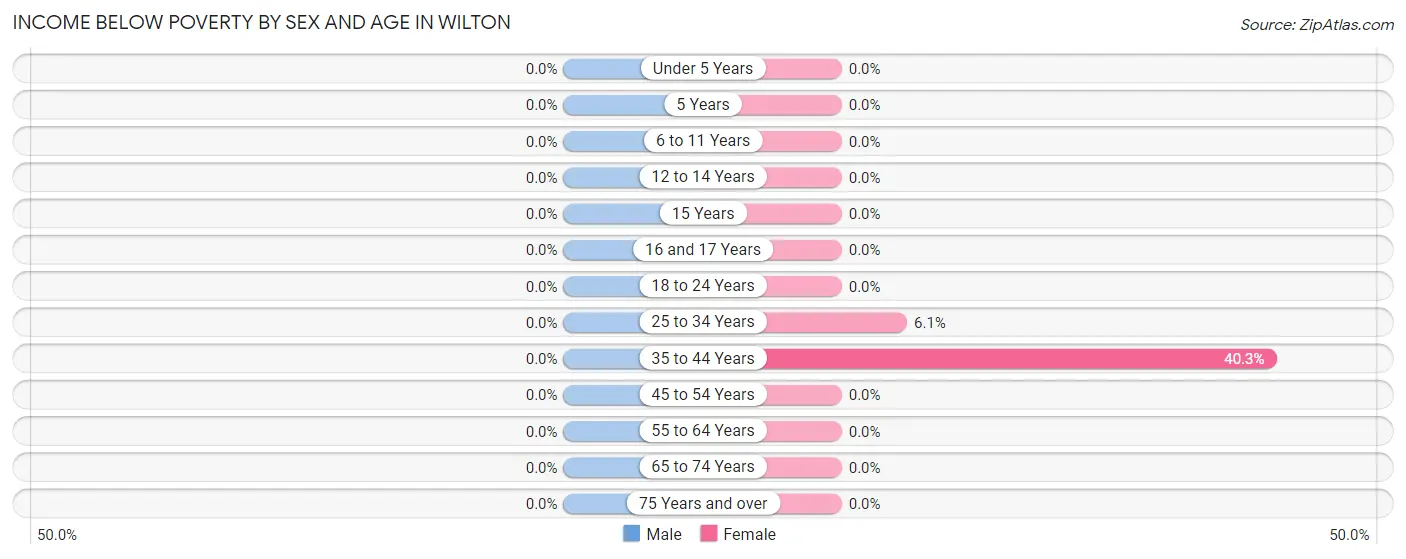
| Age Bracket | Male | Female |
| Under 5 Years | 0 (0.0%) | 0 (0.0%) |
| 5 Years | 0 (0.0%) | 0 (0.0%) |
| 6 to 11 Years | 0 (0.0%) | 0 (0.0%) |
| 12 to 14 Years | 0 (0.0%) | 0 (0.0%) |
| 15 Years | 0 (0.0%) | 0 (0.0%) |
| 16 and 17 Years | 0 (0.0%) | 0 (0.0%) |
| 18 to 24 Years | 0 (0.0%) | 0 (0.0%) |
| 25 to 34 Years | 0 (0.0%) | 6 (6.1%) |
| 35 to 44 Years | 0 (0.0%) | 25 (40.3%) |
| 45 to 54 Years | 0 (0.0%) | 0 (0.0%) |
| 55 to 64 Years | 0 (0.0%) | 0 (0.0%) |
| 65 to 74 Years | 0 (0.0%) | 0 (0.0%) |
| 75 Years and over | 0 (0.0%) | 0 (0.0%) |
| Total | 0 (0.0%) | 31 (5.5%) |
Income Above Poverty by Sex and Age in Wilton
According to the poverty statistics in Wilton, males aged under 5 years and females aged under 5 years are the age groups that are most secure financially, with 100.0% of males and 100.0% of females in these age groups living above the poverty line.
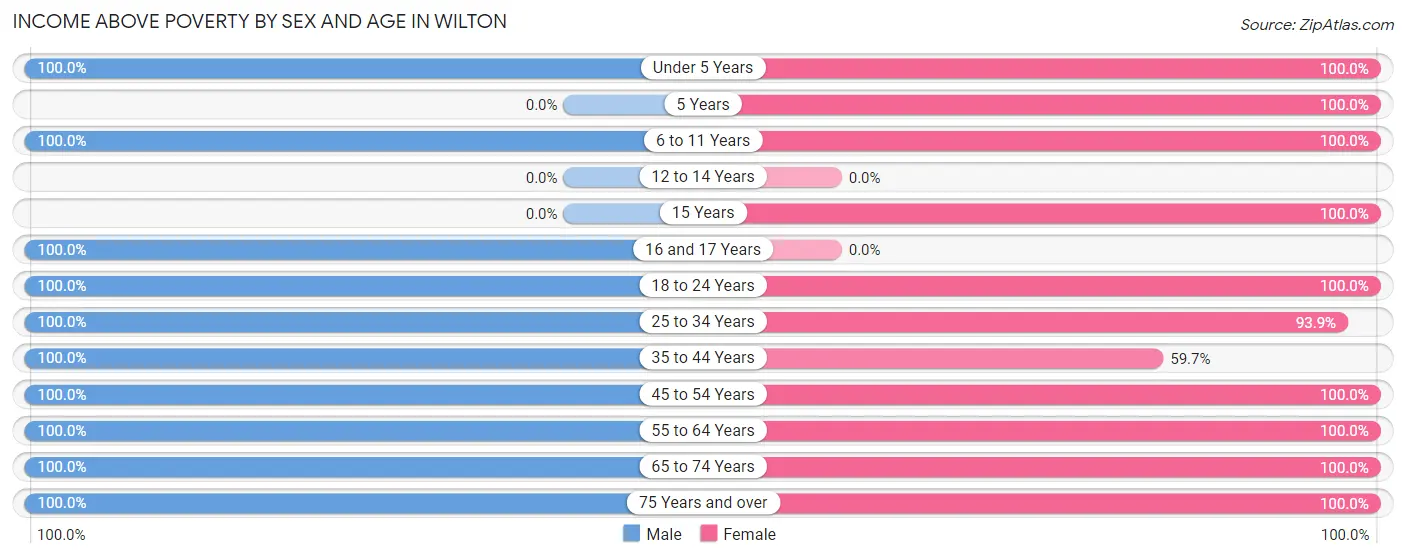
| Age Bracket | Male | Female |
| Under 5 Years | 10 (100.0%) | 36 (100.0%) |
| 5 Years | 0 (0.0%) | 20 (100.0%) |
| 6 to 11 Years | 39 (100.0%) | 20 (100.0%) |
| 12 to 14 Years | 0 (0.0%) | 0 (0.0%) |
| 15 Years | 0 (0.0%) | 49 (100.0%) |
| 16 and 17 Years | 23 (100.0%) | 0 (0.0%) |
| 18 to 24 Years | 45 (100.0%) | 17 (100.0%) |
| 25 to 34 Years | 96 (100.0%) | 93 (93.9%) |
| 35 to 44 Years | 51 (100.0%) | 37 (59.7%) |
| 45 to 54 Years | 145 (100.0%) | 134 (100.0%) |
| 55 to 64 Years | 275 (100.0%) | 57 (100.0%) |
| 65 to 74 Years | 72 (100.0%) | 37 (100.0%) |
| 75 Years and over | 11 (100.0%) | 35 (100.0%) |
| Total | 767 (100.0%) | 535 (94.5%) |
Income Below Poverty Among Married-Couple Families in Wilton
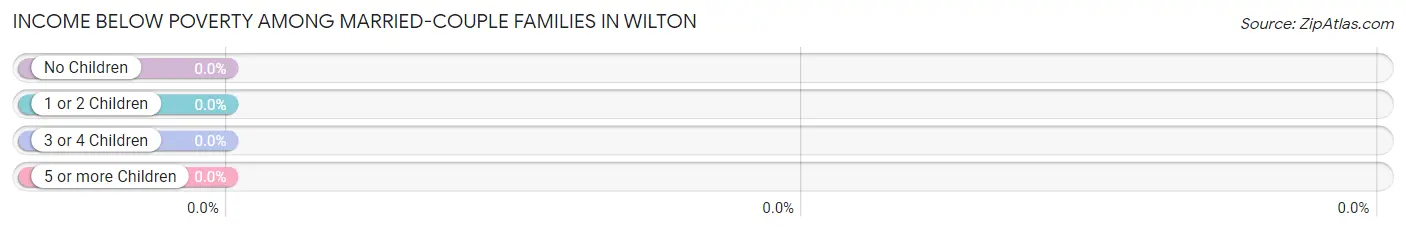
| Children | Above Poverty | Below Poverty |
| No Children | 139 (100.0%) | 0 (0.0%) |
| 1 or 2 Children | 84 (100.0%) | 0 (0.0%) |
| 3 or 4 Children | 0 (0.0%) | 0 (0.0%) |
| 5 or more Children | 18 (100.0%) | 0 (0.0%) |
| Total | 241 (100.0%) | 0 (0.0%) |
Income Below Poverty Among Single-Parent Households in Wilton
| Children | Single Father | Single Mother |
| No Children | 0 (0.0%) | 0 (0.0%) |
| 1 or 2 Children | 0 (0.0%) | 0 (0.0%) |
| 3 or 4 Children | 0 (0.0%) | 0 (0.0%) |
| 5 or more Children | 0 (0.0%) | 0 (0.0%) |
| Total | 0 (0.0%) | 0 (0.0%) |
Income Below Poverty Among Married-Couple vs Single-Parent Households in Wilton
| Children | Married-Couple Families | Single-Parent Households |
| No Children | 0 (0.0%) | 0 (0.0%) |
| 1 or 2 Children | 0 (0.0%) | 0 (0.0%) |
| 3 or 4 Children | 0 (0.0%) | 0 (0.0%) |
| 5 or more Children | 0 (0.0%) | 0 (0.0%) |
| Total | 0 (0.0%) | 0 (0.0%) |
Race in Wilton
The most populous races in Wilton are White / Caucasian (1,290 | 96.8%), Hispanic or Latino (43 | 3.2%), and Asian (25 | 1.9%).
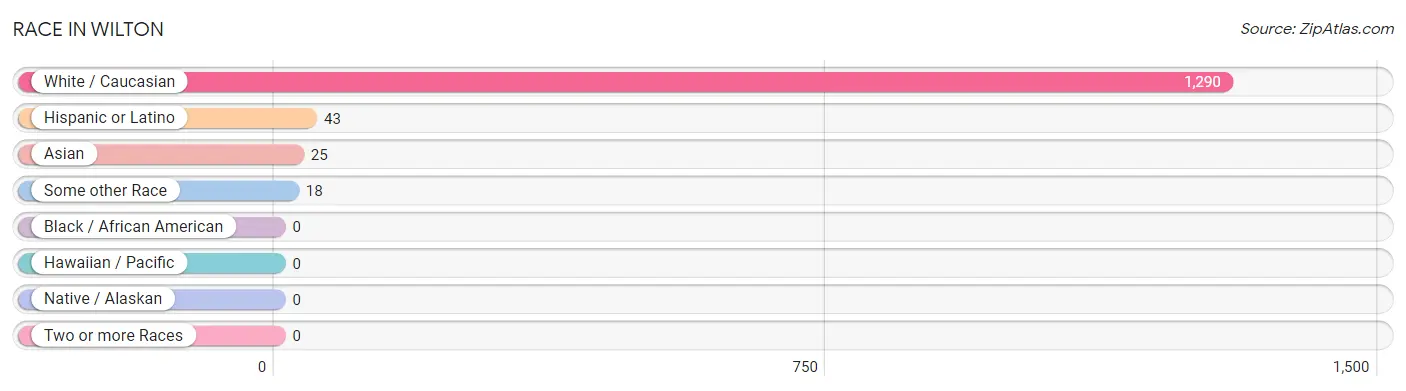
| Race | # Population | % Population |
| Asian | 25 | 1.9% |
| Black / African American | 0 | 0.0% |
| Hawaiian / Pacific | 0 | 0.0% |
| Hispanic or Latino | 43 | 3.2% |
| Native / Alaskan | 0 | 0.0% |
| White / Caucasian | 1,290 | 96.8% |
| Two or more Races | 0 | 0.0% |
| Some other Race | 18 | 1.3% |
| Total | 1,333 | 100.0% |
Ancestry in Wilton
The most populous ancestries reported in Wilton are Irish (533 | 40.0%), English (179 | 13.4%), Finnish (164 | 12.3%), French (143 | 10.7%), and French Canadian (100 | 7.5%), together accounting for 83.9% of all Wilton residents.
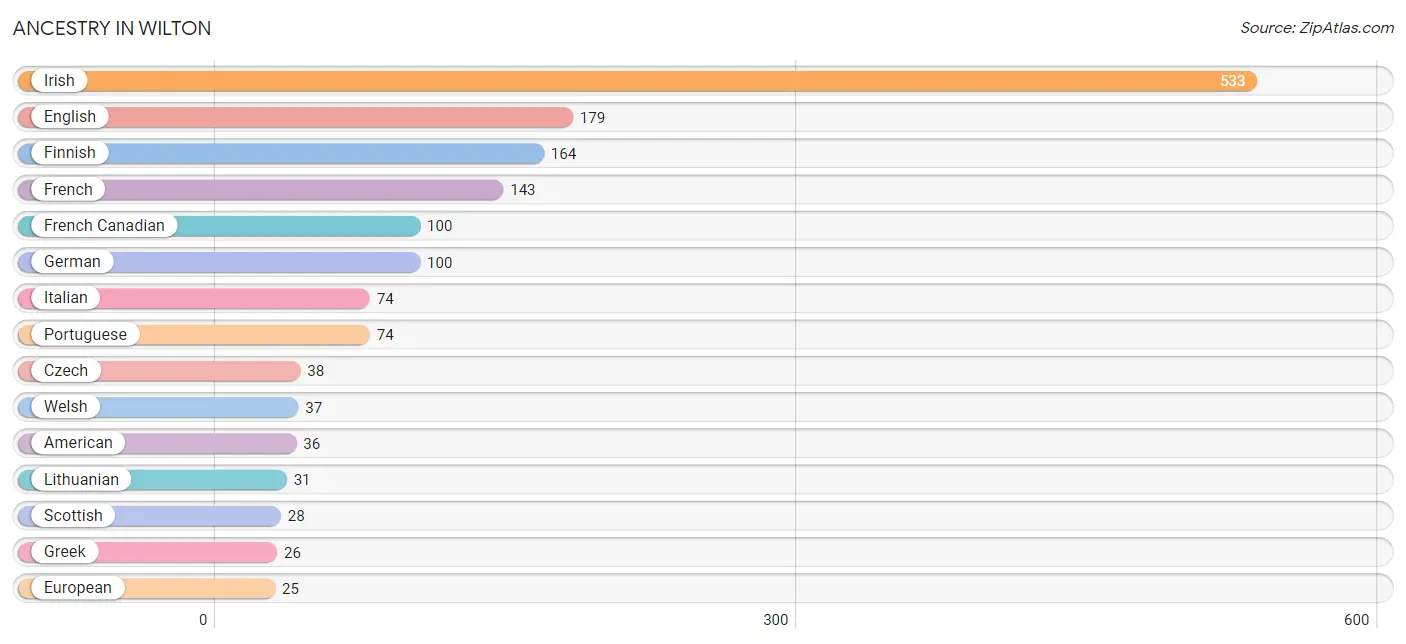
| Ancestry | # Population | % Population |
| American | 36 | 2.7% |
| Czech | 38 | 2.9% |
| Dominican | 18 | 1.3% |
| Dutch | 23 | 1.7% |
| Eastern European | 12 | 0.9% |
| English | 179 | 13.4% |
| Estonian | 9 | 0.7% |
| European | 25 | 1.9% |
| Finnish | 164 | 12.3% |
| French | 143 | 10.7% |
| French Canadian | 100 | 7.5% |
| German | 100 | 7.5% |
| Greek | 26 | 1.9% |
| Hungarian | 11 | 0.8% |
| Irish | 533 | 40.0% |
| Italian | 74 | 5.6% |
| Korean | 25 | 1.9% |
| Lithuanian | 31 | 2.3% |
| Mexican | 25 | 1.9% |
| Portuguese | 74 | 5.6% |
| Russian | 20 | 1.5% |
| Scottish | 28 | 2.1% |
| Swedish | 9 | 0.7% |
| Welsh | 37 | 2.8% | View All 24 Rows |
Immigrants in Wilton
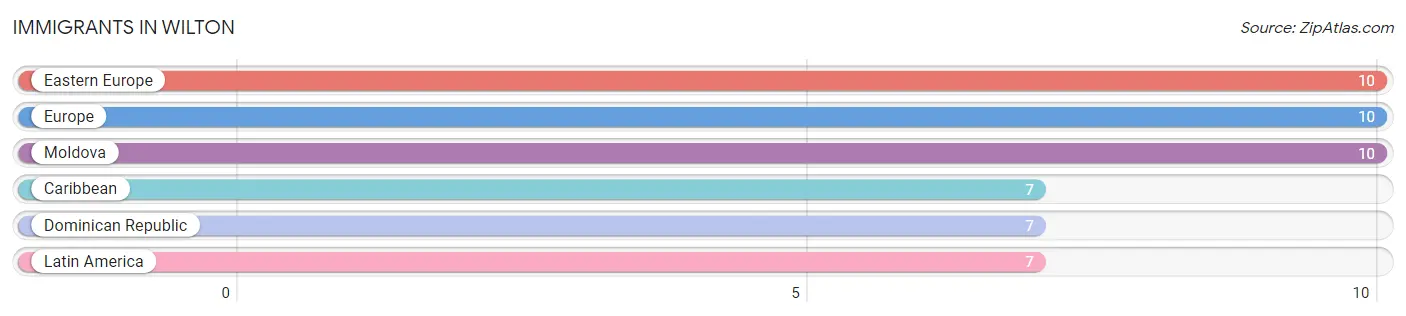
The most numerous immigrant groups reported in Wilton came from Eastern Europe (10 | 0.7%), Europe (10 | 0.7%), Moldova (10 | 0.7%), Caribbean (7 | 0.5%), and Dominican Republic (7 | 0.5%), together accounting for 3.3% of all Wilton residents.
| Immigration Origin | # Population | % Population |
| Caribbean | 7 | 0.5% |
| Dominican Republic | 7 | 0.5% |
| Eastern Europe | 10 | 0.7% |
| Europe | 10 | 0.7% |
| Latin America | 7 | 0.5% |
| Moldova | 10 | 0.7% | View All 6 Rows |
Sex and Age in Wilton
Sex and Age in Wilton
The most populous age groups in Wilton are 55 to 59 Years (238 | 31.0%) for men and 45 to 49 Years (85 | 15.0%) for women.
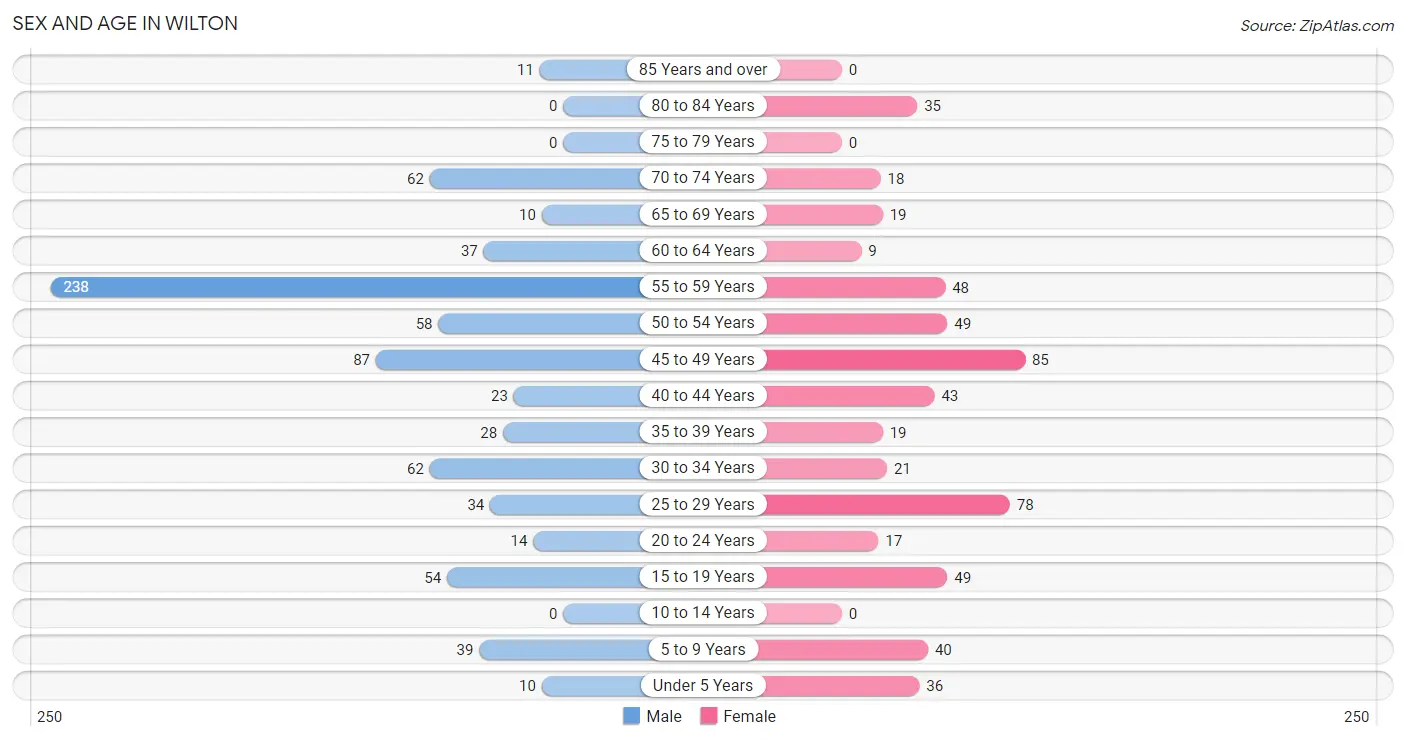
| Age Bracket | Male | Female |
| Under 5 Years | 10 (1.3%) | 36 (6.4%) |
| 5 to 9 Years | 39 (5.1%) | 40 (7.1%) |
| 10 to 14 Years | 0 (0.0%) | 0 (0.0%) |
| 15 to 19 Years | 54 (7.0%) | 49 (8.7%) |
| 20 to 24 Years | 14 (1.8%) | 17 (3.0%) |
| 25 to 29 Years | 34 (4.4%) | 78 (13.8%) |
| 30 to 34 Years | 62 (8.1%) | 21 (3.7%) |
| 35 to 39 Years | 28 (3.6%) | 19 (3.4%) |
| 40 to 44 Years | 23 (3.0%) | 43 (7.6%) |
| 45 to 49 Years | 87 (11.3%) | 85 (15.0%) |
| 50 to 54 Years | 58 (7.6%) | 49 (8.7%) |
| 55 to 59 Years | 238 (31.0%) | 48 (8.5%) |
| 60 to 64 Years | 37 (4.8%) | 9 (1.6%) |
| 65 to 69 Years | 10 (1.3%) | 19 (3.4%) |
| 70 to 74 Years | 62 (8.1%) | 18 (3.2%) |
| 75 to 79 Years | 0 (0.0%) | 0 (0.0%) |
| 80 to 84 Years | 0 (0.0%) | 35 (6.2%) |
| 85 Years and over | 11 (1.4%) | 0 (0.0%) |
| Total | 767 (100.0%) | 566 (100.0%) |
Families and Households in Wilton
Median Family Size in Wilton
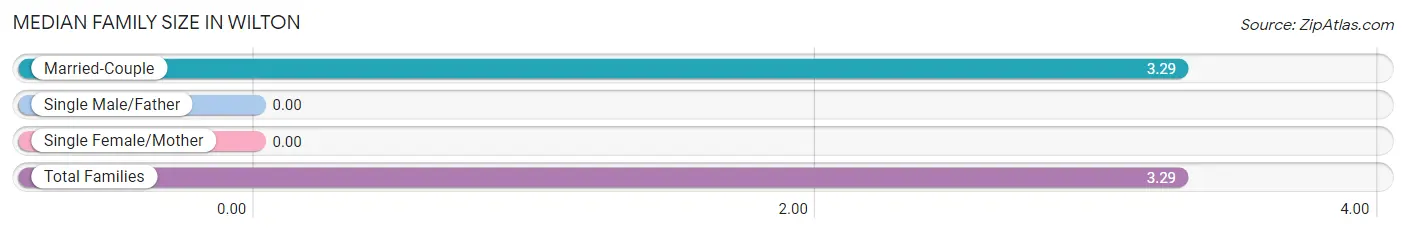
| Family Type | # Families | Family Size |
| Married-Couple | 241 (100.0%) | 3.29 |
| Single Male/Father | 0 (0.0%) | - |
| Single Female/Mother | 0 (0.0%) | - |
| Total Families | 241 (100.0%) | 3.29 |
Median Household Size in Wilton
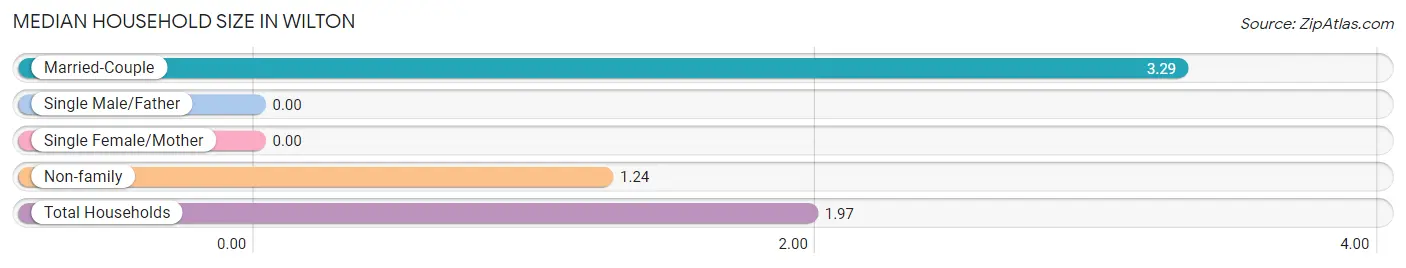
| Household Type | # Households | Household Size |
| Married-Couple | 241 (35.6%) | 3.29 |
| Single Male/Father | 0 (0.0%) | - |
| Single Female/Mother | 0 (0.0%) | - |
| Non-family | 435 (64.3%) | 1.24 |
| Total Households | 676 (100.0%) | 1.97 |
Household Size by Marriage Status in Wilton
Out of a total of 676 households in Wilton, 241 (35.6%) are family households, while 435 (64.3%) are nonfamily households. The most numerous type of family households are 2-person households, comprising 114, and the most common type of nonfamily households are 1-person households, comprising 333.
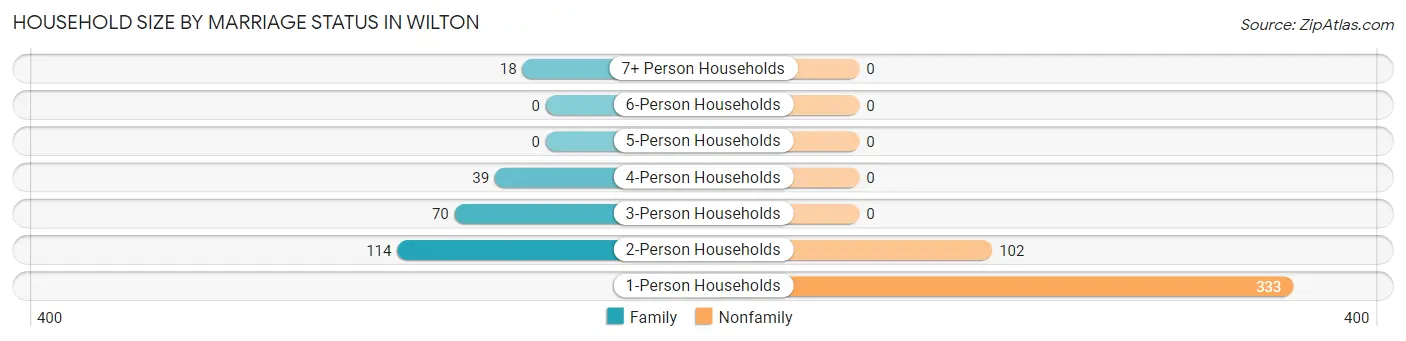
| Household Size | Family Households | Nonfamily Households |
| 1-Person Households | - | 333 (49.3%) |
| 2-Person Households | 114 (16.9%) | 102 (15.1%) |
| 3-Person Households | 70 (10.4%) | 0 (0.0%) |
| 4-Person Households | 39 (5.8%) | 0 (0.0%) |
| 5-Person Households | 0 (0.0%) | 0 (0.0%) |
| 6-Person Households | 0 (0.0%) | 0 (0.0%) |
| 7+ Person Households | 18 (2.7%) | 0 (0.0%) |
| Total | 241 (35.6%) | 435 (64.3%) |
Female Fertility in Wilton
Fertility by Age in Wilton
| Age Bracket | Women with Births | Births / 1,000 Women |
| 15 to 19 years | 0 (0.0%) | 0.0 |
| 20 to 34 years | 0 (0.0%) | 0.0 |
| 35 to 50 years | 0 (0.0%) | 0.0 |
| Total | 0 (0.0%) | 0.0 |
Fertility by Age by Marriage Status in Wilton
| Age Bracket | Married | Unmarried |
| 15 to 19 years | 0 (0.0%) | 0 (0.0%) |
| 20 to 34 years | 0 (0.0%) | 0 (0.0%) |
| 35 to 50 years | 0 (0.0%) | 0 (0.0%) |
| Total | 0 (0.0%) | 0 (0.0%) |
Fertility by Education in Wilton
| Educational Attainment | Women with Births | Births / 1,000 Women |
| Less than High School | 0 (0.0%) | 0.0 |
| High School Diploma | 0 (0.0%) | 0.0 |
| College or Associate's Degree | 0 (0.0%) | 0.0 |
| Bachelor's Degree | 0 (0.0%) | 0.0 |
| Graduate Degree | 0 (0.0%) | 0.0 |
| Total | 0 (0.0%) | 0.0 |
Fertility by Education by Marriage Status in Wilton
| Educational Attainment | Married | Unmarried |
| Less than High School | 0 (0.0%) | 0 (0.0%) |
| High School Diploma | 0 (0.0%) | 0 (0.0%) |
| College or Associate's Degree | 0 (0.0%) | 0 (0.0%) |
| Bachelor's Degree | 0 (0.0%) | 0 (0.0%) |
| Graduate Degree | 0 (0.0%) | 0 (0.0%) |
| Total | 0 (0.0%) | 0 (0.0%) |
Employment Characteristics in Wilton
Employment by Class of Employer in Wilton
Among the 769 employed individuals in Wilton, private company employees (482 | 62.7%), self-employed (not incorporated) (193 | 25.1%), and not-for-profit organizations (37 | 4.8%) make up the most common classes of employment.
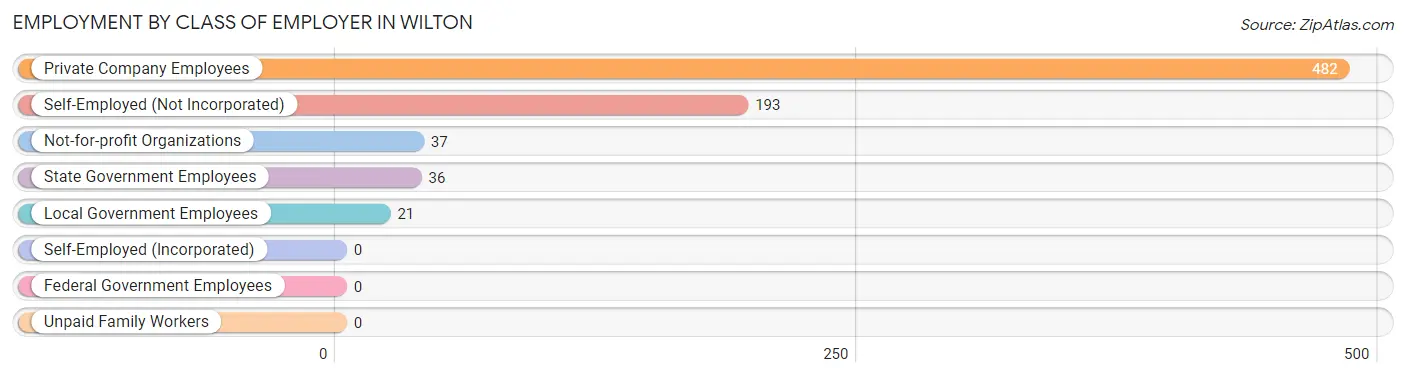
| Employer Class | # Employees | % Employees |
| Private Company Employees | 482 | 62.7% |
| Self-Employed (Incorporated) | 0 | 0.0% |
| Self-Employed (Not Incorporated) | 193 | 25.1% |
| Not-for-profit Organizations | 37 | 4.8% |
| Local Government Employees | 21 | 2.7% |
| State Government Employees | 36 | 4.7% |
| Federal Government Employees | 0 | 0.0% |
| Unpaid Family Workers | 0 | 0.0% |
| Total | 769 | 100.0% |
Employment Status by Age in Wilton
According to the labor force statistics for Wilton, out of the total population over 16 years of age (1,159), 70.0% or 811 individuals are in the labor force, with 5.2% or 42 of them unemployed. The age group with the highest labor force participation rate is 20 to 24 years, with 100.0% or 31 individuals in the labor force. Within the labor force, the 35 to 44 years age range has the highest percentage of unemployed individuals, with 39.3% or 42 of them being unemployed.
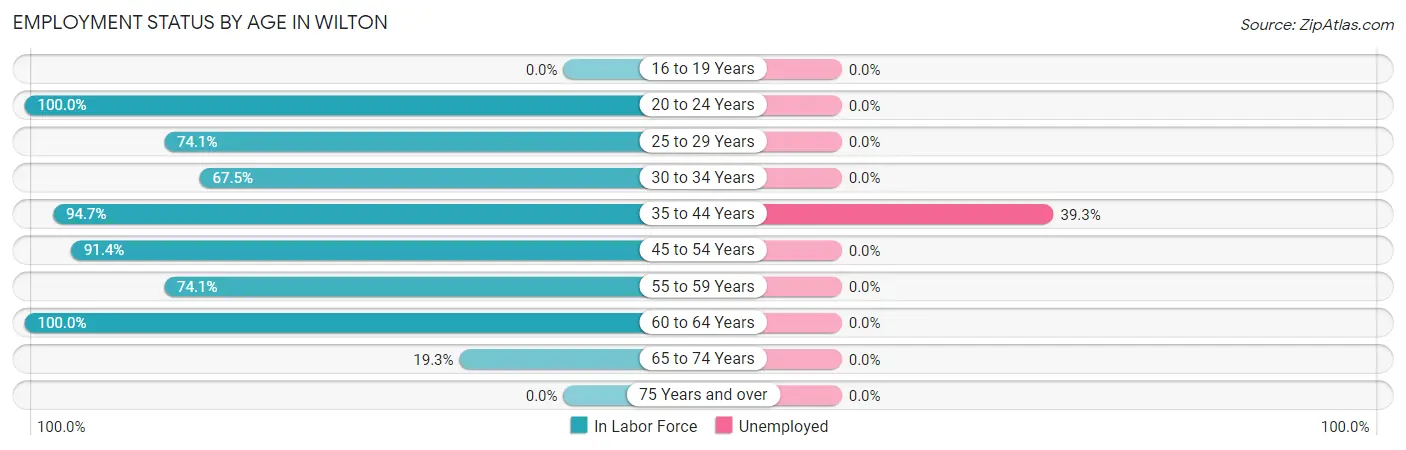
| Age Bracket | In Labor Force | Unemployed |
| 16 to 19 Years | 0 (0.0%) | 0 (0.0%) |
| 20 to 24 Years | 31 (100.0%) | 0 (0.0%) |
| 25 to 29 Years | 83 (74.1%) | 0 (0.0%) |
| 30 to 34 Years | 56 (67.5%) | 0 (0.0%) |
| 35 to 44 Years | 107 (94.7%) | 42 (39.3%) |
| 45 to 54 Years | 255 (91.4%) | 0 (0.0%) |
| 55 to 59 Years | 212 (74.1%) | 0 (0.0%) |
| 60 to 64 Years | 46 (100.0%) | 0 (0.0%) |
| 65 to 74 Years | 21 (19.3%) | 0 (0.0%) |
| 75 Years and over | 0 (0.0%) | 0 (0.0%) |
| Total | 811 (70.0%) | 42 (5.2%) |
Employment Status by Educational Attainment in Wilton
According to labor force statistics for Wilton, 82.6% of individuals (759) out of the total population between 25 and 64 years of age (919) are in the labor force, with 5.5% or 42 of them being unemployed. The group with the highest labor force participation rate are those with the educational attainment of less than high school, with 100.0% or 36 individuals in the labor force. Within the labor force, individuals with high school diploma education have the highest percentage of unemployment, with 16.4% or 42 of them being unemployed.
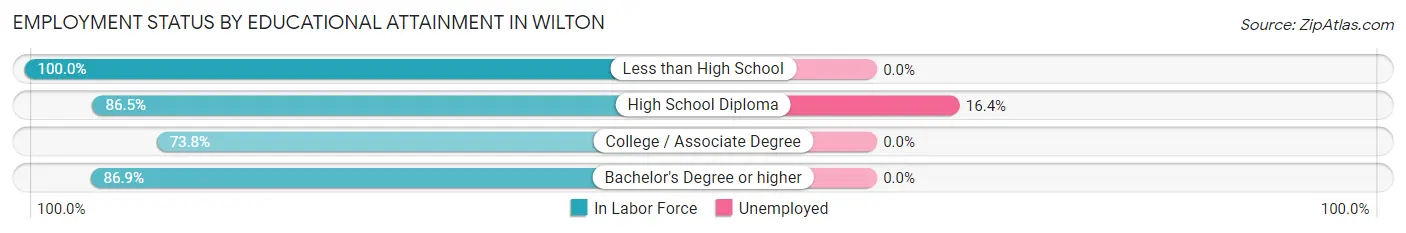
| Educational Attainment | In Labor Force | Unemployed |
| Less than High School | 36 (100.0%) | 0 (0.0%) |
| High School Diploma | 256 (86.5%) | 49 (16.4%) |
| College / Associate Degree | 242 (73.8%) | 0 (0.0%) |
| Bachelor's Degree or higher | 225 (86.9%) | 0 (0.0%) |
| Total | 759 (82.6%) | 51 (5.5%) |
Employment Occupations by Sex in Wilton
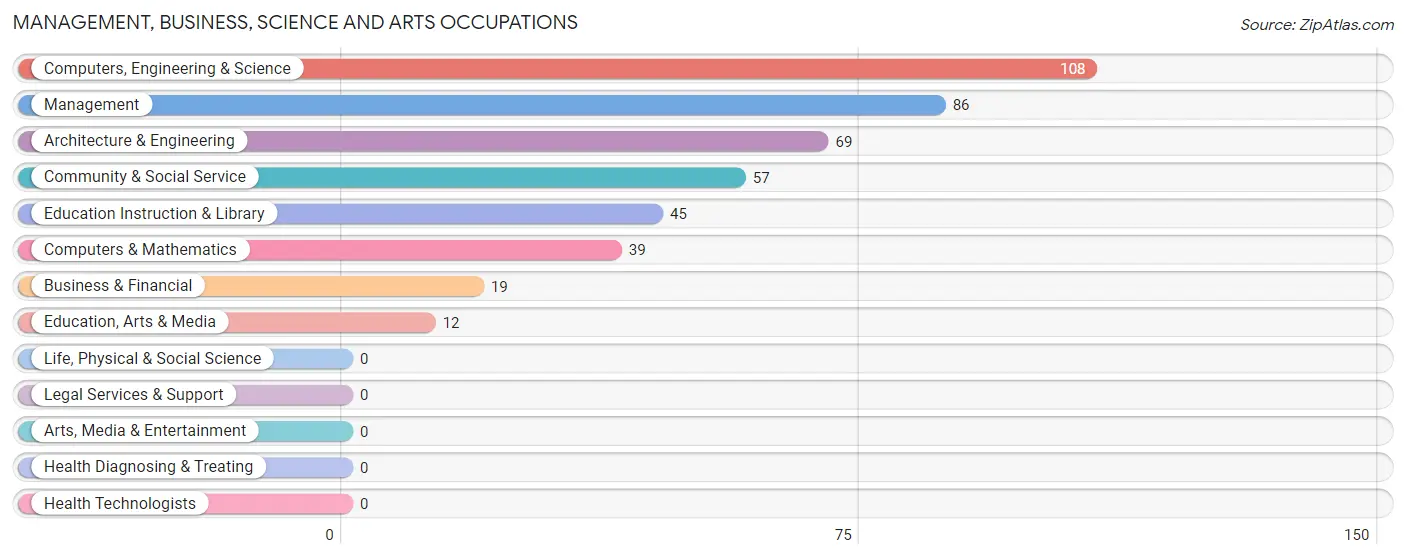
Management, Business, Science and Arts Occupations
The most common Management, Business, Science and Arts occupations in Wilton are Computers, Engineering & Science (108 | 14.0%), Management (86 | 11.2%), Architecture & Engineering (69 | 9.0%), Community & Social Service (57 | 7.4%), and Education Instruction & Library (45 | 5.9%).
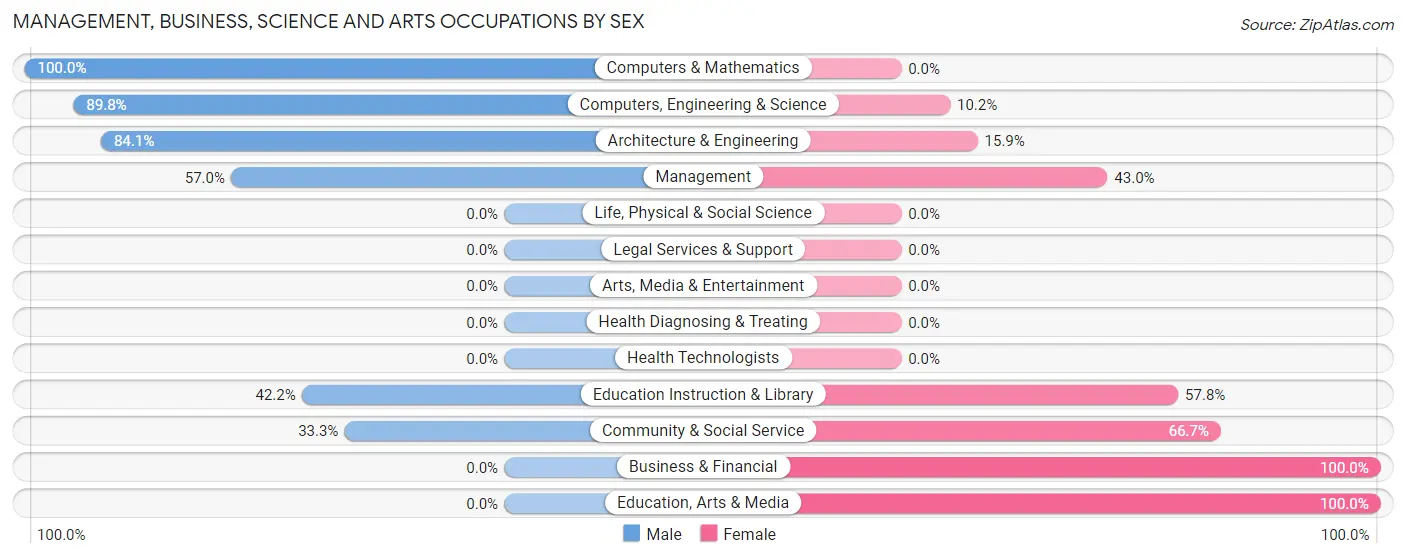
Management, Business, Science and Arts Occupations by Sex
Within the Management, Business, Science and Arts occupations in Wilton, the most male-oriented occupations are Computers & Mathematics (100.0%), Computers, Engineering & Science (89.8%), and Architecture & Engineering (84.1%), while the most female-oriented occupations are Business & Financial (100.0%), Education, Arts & Media (100.0%), and Community & Social Service (66.7%).
| Occupation | Male | Female |
| Management | 49 (57.0%) | 37 (43.0%) |
| Business & Financial | 0 (0.0%) | 19 (100.0%) |
| Computers, Engineering & Science | 97 (89.8%) | 11 (10.2%) |
| Computers & Mathematics | 39 (100.0%) | 0 (0.0%) |
| Architecture & Engineering | 58 (84.1%) | 11 (15.9%) |
| Life, Physical & Social Science | 0 (0.0%) | 0 (0.0%) |
| Community & Social Service | 19 (33.3%) | 38 (66.7%) |
| Education, Arts & Media | 0 (0.0%) | 12 (100.0%) |
| Legal Services & Support | 0 (0.0%) | 0 (0.0%) |
| Education Instruction & Library | 19 (42.2%) | 26 (57.8%) |
| Arts, Media & Entertainment | 0 (0.0%) | 0 (0.0%) |
| Health Diagnosing & Treating | 0 (0.0%) | 0 (0.0%) |
| Health Technologists | 0 (0.0%) | 0 (0.0%) |
| Total (Category) | 165 (61.1%) | 105 (38.9%) |
| Total (Overall) | 520 (67.6%) | 249 (32.4%) |
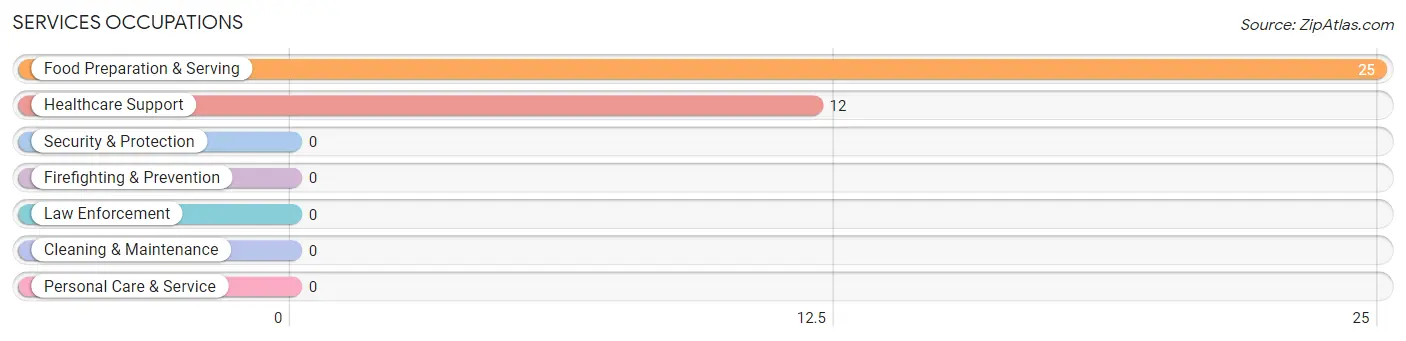
Services Occupations
The most common Services occupations in Wilton are Food Preparation & Serving (25 | 3.3%), and Healthcare Support (12 | 1.6%).
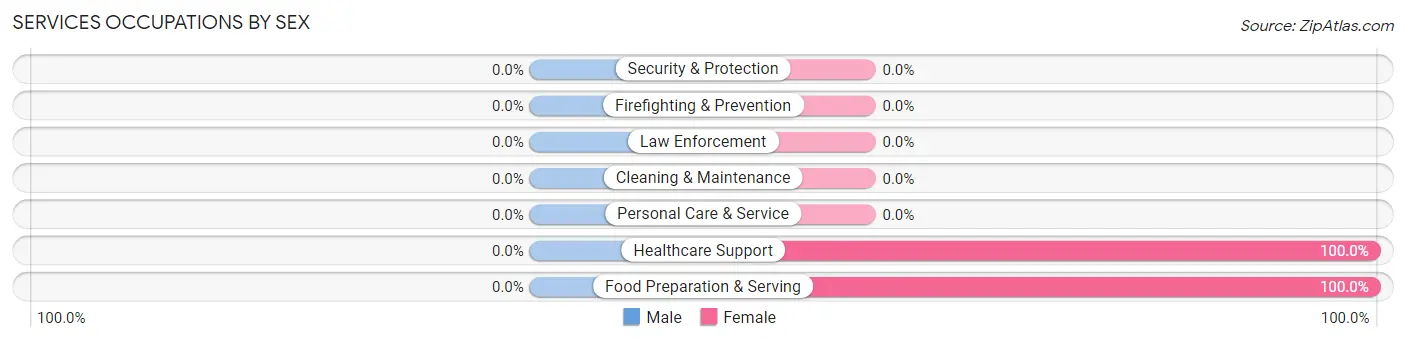
Services Occupations by Sex
| Occupation | Male | Female |
| Healthcare Support | 0 (0.0%) | 12 (100.0%) |
| Security & Protection | 0 (0.0%) | 0 (0.0%) |
| Firefighting & Prevention | 0 (0.0%) | 0 (0.0%) |
| Law Enforcement | 0 (0.0%) | 0 (0.0%) |
| Food Preparation & Serving | 0 (0.0%) | 25 (100.0%) |
| Cleaning & Maintenance | 0 (0.0%) | 0 (0.0%) |
| Personal Care & Service | 0 (0.0%) | 0 (0.0%) |
| Total (Category) | 0 (0.0%) | 37 (100.0%) |
| Total (Overall) | 520 (67.6%) | 249 (32.4%) |
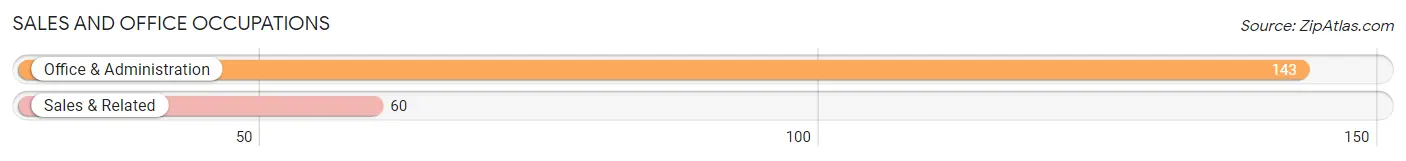
Sales and Office Occupations
The most common Sales and Office occupations in Wilton are Office & Administration (143 | 18.6%), and Sales & Related (60 | 7.8%).
Sales and Office Occupations by Sex
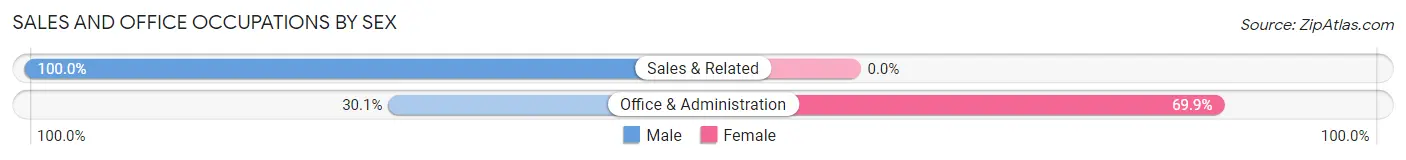
| Occupation | Male | Female |
| Sales & Related | 60 (100.0%) | 0 (0.0%) |
| Office & Administration | 43 (30.1%) | 100 (69.9%) |
| Total (Category) | 103 (50.7%) | 100 (49.3%) |
| Total (Overall) | 520 (67.6%) | 249 (32.4%) |
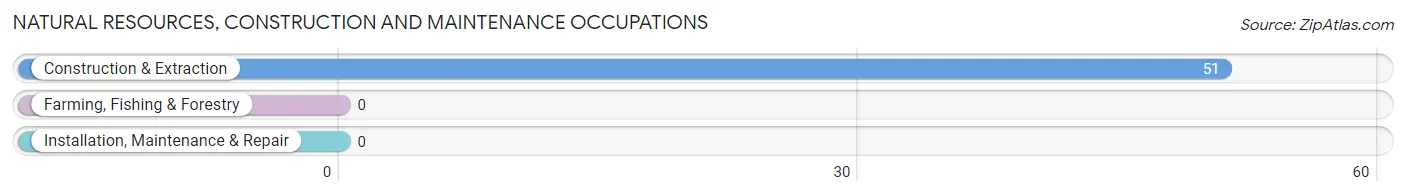
Natural Resources, Construction and Maintenance Occupations
The most common Natural Resources, Construction and Maintenance occupations in Wilton are , and Construction & Extraction (51 | 6.6%).
Natural Resources, Construction and Maintenance Occupations by Sex
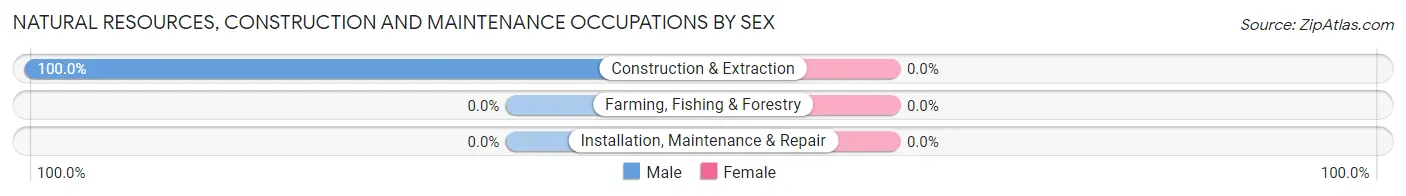
| Occupation | Male | Female |
| Farming, Fishing & Forestry | 0 (0.0%) | 0 (0.0%) |
| Construction & Extraction | 51 (100.0%) | 0 (0.0%) |
| Installation, Maintenance & Repair | 0 (0.0%) | 0 (0.0%) |
| Total (Category) | 51 (100.0%) | 0 (0.0%) |
| Total (Overall) | 520 (67.6%) | 249 (32.4%) |
Production, Transportation and Moving Occupations
The most common Production, Transportation and Moving occupations in Wilton are Material Moving (147 | 19.1%), Transportation (34 | 4.4%), and Production (27 | 3.5%).
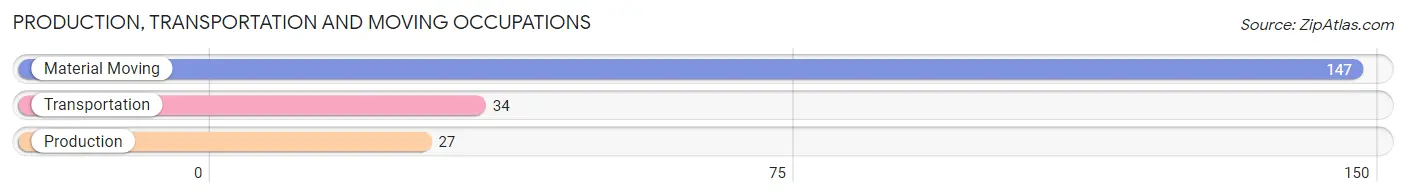
Production, Transportation and Moving Occupations by Sex
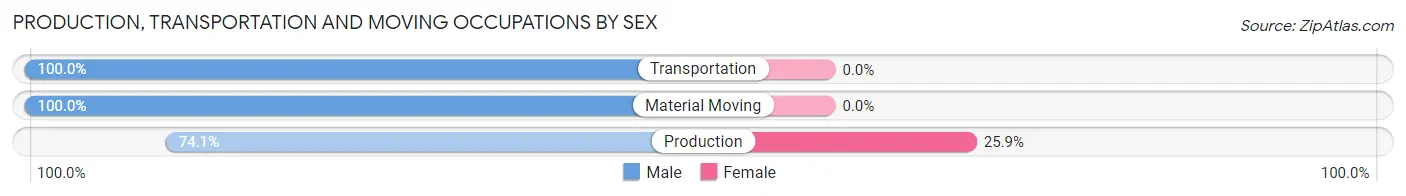
| Occupation | Male | Female |
| Production | 20 (74.1%) | 7 (25.9%) |
| Transportation | 34 (100.0%) | 0 (0.0%) |
| Material Moving | 147 (100.0%) | 0 (0.0%) |
| Total (Category) | 201 (96.6%) | 7 (3.4%) |
| Total (Overall) | 520 (67.6%) | 249 (32.4%) |
Employment Industries by Sex in Wilton
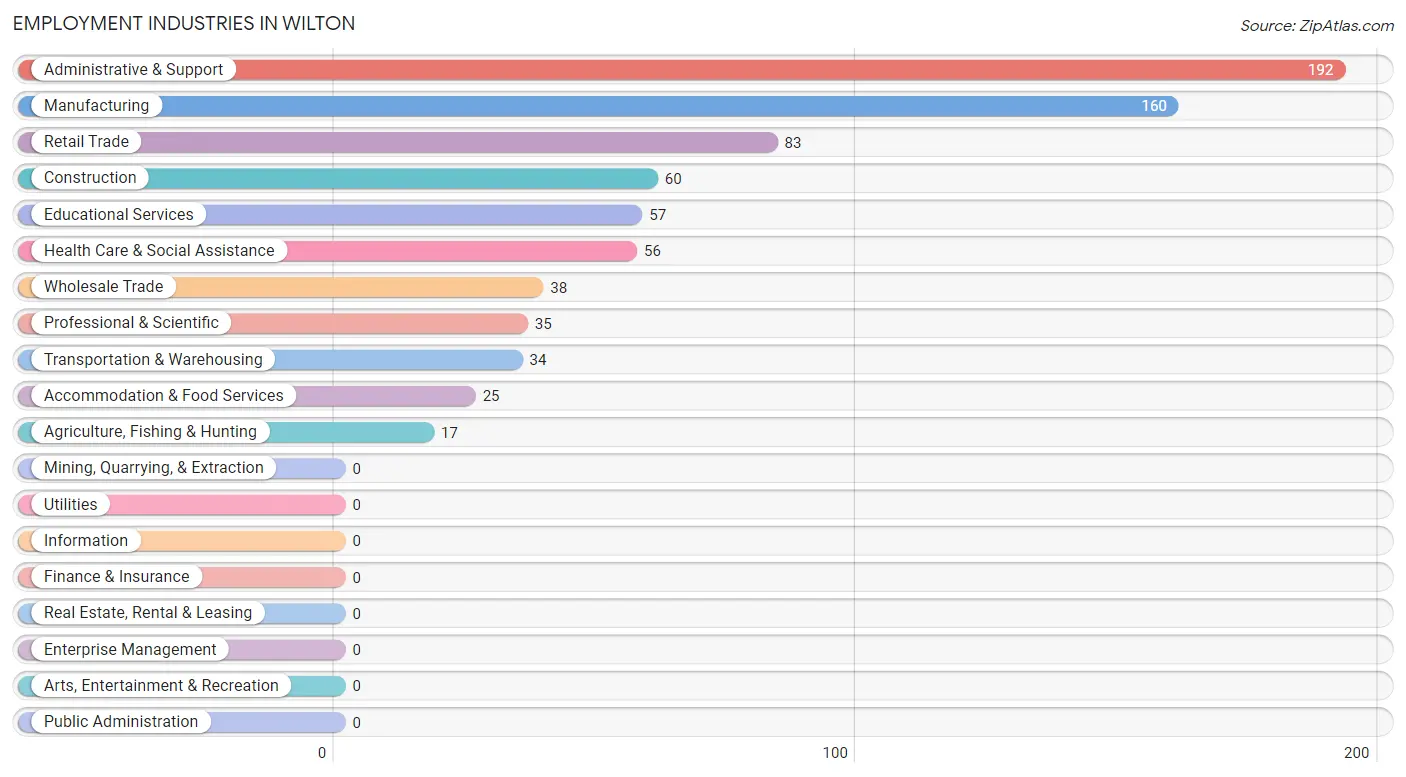
Employment Industries in Wilton
The major employment industries in Wilton include Administrative & Support (192 | 25.0%), Manufacturing (160 | 20.8%), Retail Trade (83 | 10.8%), Construction (60 | 7.8%), and Educational Services (57 | 7.4%).
Employment Industries by Sex in Wilton
The Wilton industries that see more men than women are Construction (100.0%), Wholesale Trade (100.0%), and Transportation & Warehousing (100.0%), whereas the industries that tend to have a higher number of women are Agriculture, Fishing & Hunting (100.0%), Health Care & Social Assistance (100.0%), and Accommodation & Food Services (100.0%).
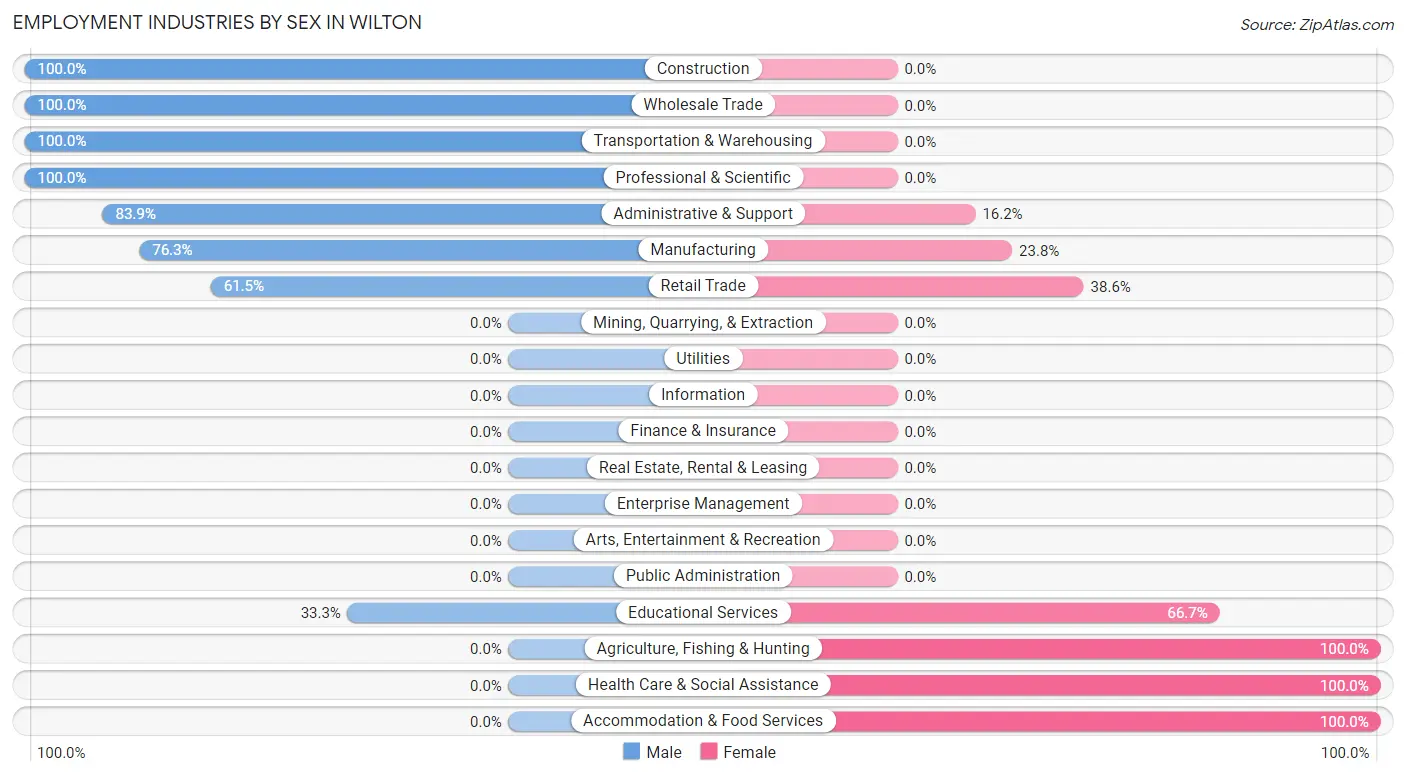
| Industry | Male | Female |
| Agriculture, Fishing & Hunting | 0 (0.0%) | 17 (100.0%) |
| Mining, Quarrying, & Extraction | 0 (0.0%) | 0 (0.0%) |
| Construction | 60 (100.0%) | 0 (0.0%) |
| Manufacturing | 122 (76.2%) | 38 (23.7%) |
| Wholesale Trade | 38 (100.0%) | 0 (0.0%) |
| Retail Trade | 51 (61.5%) | 32 (38.6%) |
| Transportation & Warehousing | 34 (100.0%) | 0 (0.0%) |
| Utilities | 0 (0.0%) | 0 (0.0%) |
| Information | 0 (0.0%) | 0 (0.0%) |
| Finance & Insurance | 0 (0.0%) | 0 (0.0%) |
| Real Estate, Rental & Leasing | 0 (0.0%) | 0 (0.0%) |
| Professional & Scientific | 35 (100.0%) | 0 (0.0%) |
| Enterprise Management | 0 (0.0%) | 0 (0.0%) |
| Administrative & Support | 161 (83.9%) | 31 (16.2%) |
| Educational Services | 19 (33.3%) | 38 (66.7%) |
| Health Care & Social Assistance | 0 (0.0%) | 56 (100.0%) |
| Arts, Entertainment & Recreation | 0 (0.0%) | 0 (0.0%) |
| Accommodation & Food Services | 0 (0.0%) | 25 (100.0%) |
| Public Administration | 0 (0.0%) | 0 (0.0%) |
| Total | 520 (67.6%) | 249 (32.4%) |
Education in Wilton
School Enrollment in Wilton
The most common levels of schooling among the 212 students in Wilton are high school (103 | 48.6%), elementary school (59 | 27.8%), and college / undergraduate (30 | 14.1%).
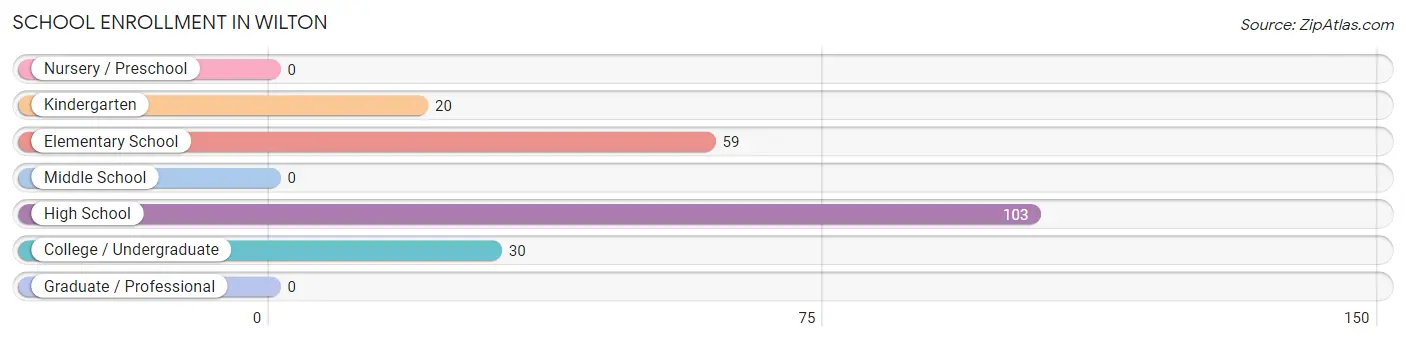
| School Level | # Students | % Students |
| Nursery / Preschool | 0 | 0.0% |
| Kindergarten | 20 | 9.4% |
| Elementary School | 59 | 27.8% |
| Middle School | 0 | 0.0% |
| High School | 103 | 48.6% |
| College / Undergraduate | 30 | 14.1% |
| Graduate / Professional | 0 | 0.0% |
| Total | 212 | 100.0% |
School Enrollment by Age by Funding Source in Wilton
Out of a total of 212 students who are enrolled in schools in Wilton, 30 (14.2%) attend a private institution, while the remaining 182 (85.8%) are enrolled in public schools. The age group of 25 to 34 year olds has the highest likelihood of being enrolled in private schools, with 7 (100.0% in the age bracket) enrolled. Conversely, the age group of 5 to 9 year old has the lowest likelihood of being enrolled in a private school, with 79 (100.0% in the age bracket) attending a public institution.
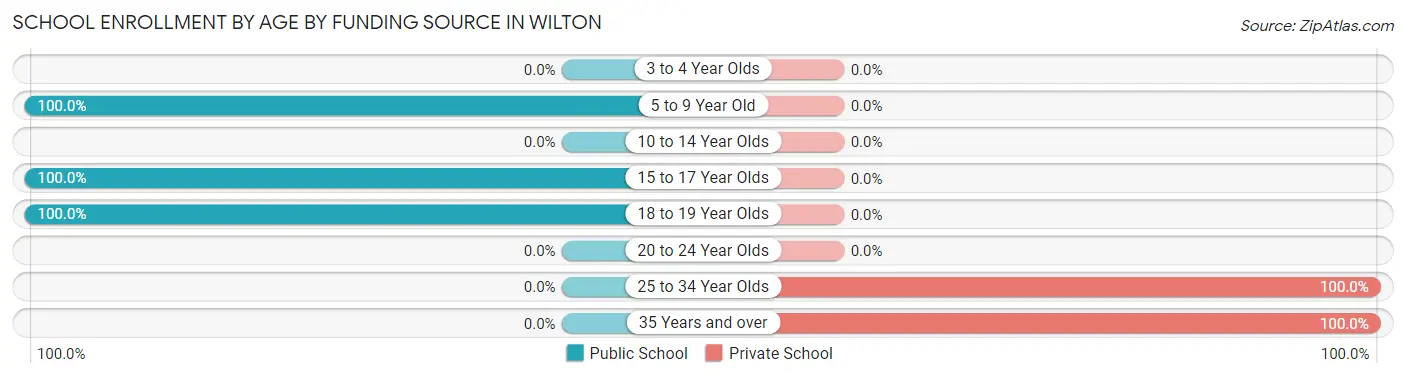
| Age Bracket | Public School | Private School |
| 3 to 4 Year Olds | 0 (0.0%) | 0 (0.0%) |
| 5 to 9 Year Old | 79 (100.0%) | 0 (0.0%) |
| 10 to 14 Year Olds | 0 (0.0%) | 0 (0.0%) |
| 15 to 17 Year Olds | 72 (100.0%) | 0 (0.0%) |
| 18 to 19 Year Olds | 31 (100.0%) | 0 (0.0%) |
| 20 to 24 Year Olds | 0 (0.0%) | 0 (0.0%) |
| 25 to 34 Year Olds | 0 (0.0%) | 7 (100.0%) |
| 35 Years and over | 0 (0.0%) | 23 (100.0%) |
| Total | 182 (85.8%) | 30 (14.2%) |
Educational Attainment by Field of Study in Wilton
Business (91 | 29.3%), communications (49 | 15.8%), engineering (45 | 14.5%), social sciences (41 | 13.2%), and bio, nature & agricultural (24 | 7.7%) are the most common fields of study among 310 individuals in Wilton who have obtained a bachelor's degree or higher.
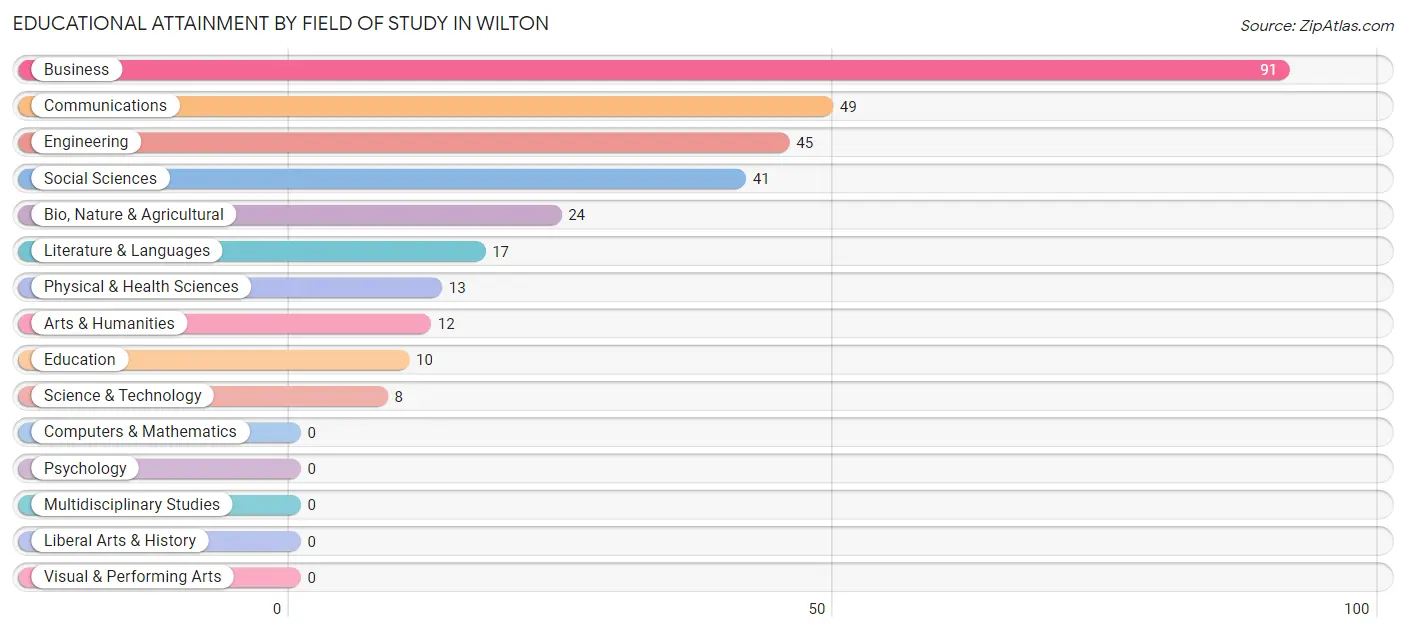
| Field of Study | # Graduates | % Graduates |
| Computers & Mathematics | 0 | 0.0% |
| Bio, Nature & Agricultural | 24 | 7.7% |
| Physical & Health Sciences | 13 | 4.2% |
| Psychology | 0 | 0.0% |
| Social Sciences | 41 | 13.2% |
| Engineering | 45 | 14.5% |
| Multidisciplinary Studies | 0 | 0.0% |
| Science & Technology | 8 | 2.6% |
| Business | 91 | 29.3% |
| Education | 10 | 3.2% |
| Literature & Languages | 17 | 5.5% |
| Liberal Arts & History | 0 | 0.0% |
| Visual & Performing Arts | 0 | 0.0% |
| Communications | 49 | 15.8% |
| Arts & Humanities | 12 | 3.9% |
| Total | 310 | 100.0% |
Transportation & Commute in Wilton
Vehicle Availability by Sex in Wilton
The most prevalent vehicle ownership categories in Wilton are males with 2 vehicles (239, accounting for 46.0%) and females with 2 vehicles (102, making up 96.0%).
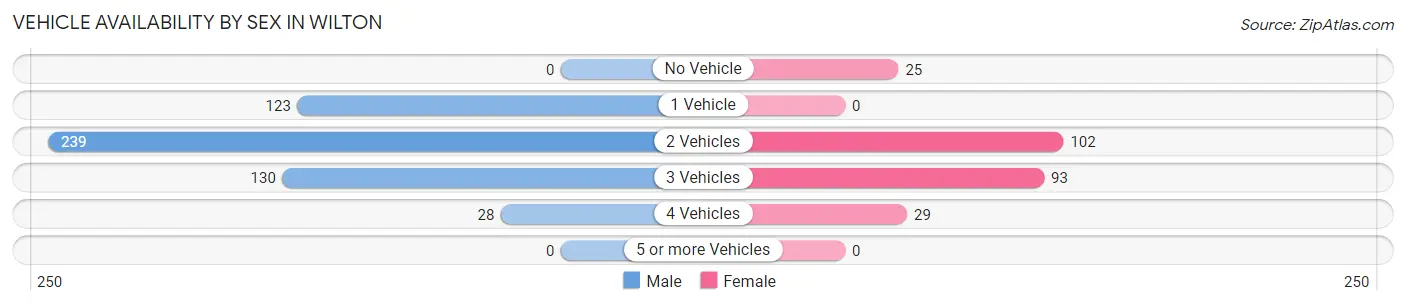
| Vehicles Available | Male | Female |
| No Vehicle | 0 (0.0%) | 25 (10.0%) |
| 1 Vehicle | 123 (23.6%) | 0 (0.0%) |
| 2 Vehicles | 239 (46.0%) | 102 (41.0%) |
| 3 Vehicles | 130 (25.0%) | 93 (37.3%) |
| 4 Vehicles | 28 (5.4%) | 29 (11.7%) |
| 5 or more Vehicles | 0 (0.0%) | 0 (0.0%) |
| Total | 520 (100.0%) | 249 (100.0%) |
Commute Time in Wilton
The most frequently occuring commute durations in Wilton are 20 to 24 minutes (216 commuters, 31.1%), 15 to 19 minutes (117 commuters, 16.9%), and 45 to 59 minutes (90 commuters, 13.0%).
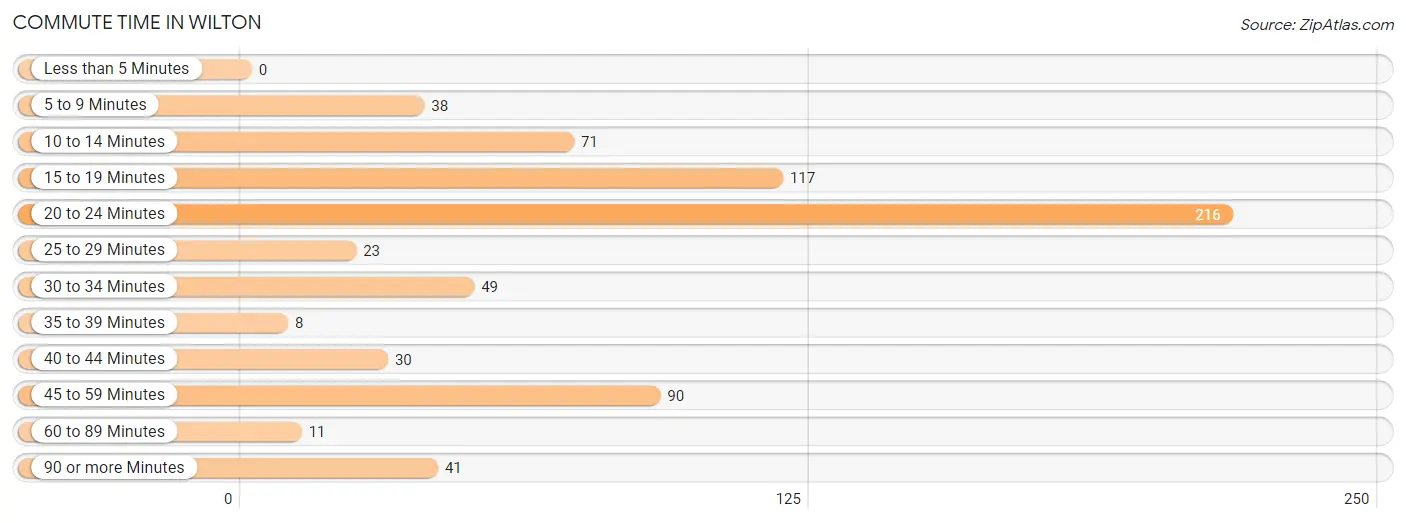
| Commute Time | # Commuters | % Commuters |
| Less than 5 Minutes | 0 | 0.0% |
| 5 to 9 Minutes | 38 | 5.5% |
| 10 to 14 Minutes | 71 | 10.2% |
| 15 to 19 Minutes | 117 | 16.9% |
| 20 to 24 Minutes | 216 | 31.1% |
| 25 to 29 Minutes | 23 | 3.3% |
| 30 to 34 Minutes | 49 | 7.1% |
| 35 to 39 Minutes | 8 | 1.1% |
| 40 to 44 Minutes | 30 | 4.3% |
| 45 to 59 Minutes | 90 | 13.0% |
| 60 to 89 Minutes | 11 | 1.6% |
| 90 or more Minutes | 41 | 5.9% |
Commute Time by Sex in Wilton
The most common commute times in Wilton are 20 to 24 minutes (162 commuters, 34.2%) for males and 15 to 19 minutes (57 commuters, 25.9%) for females.
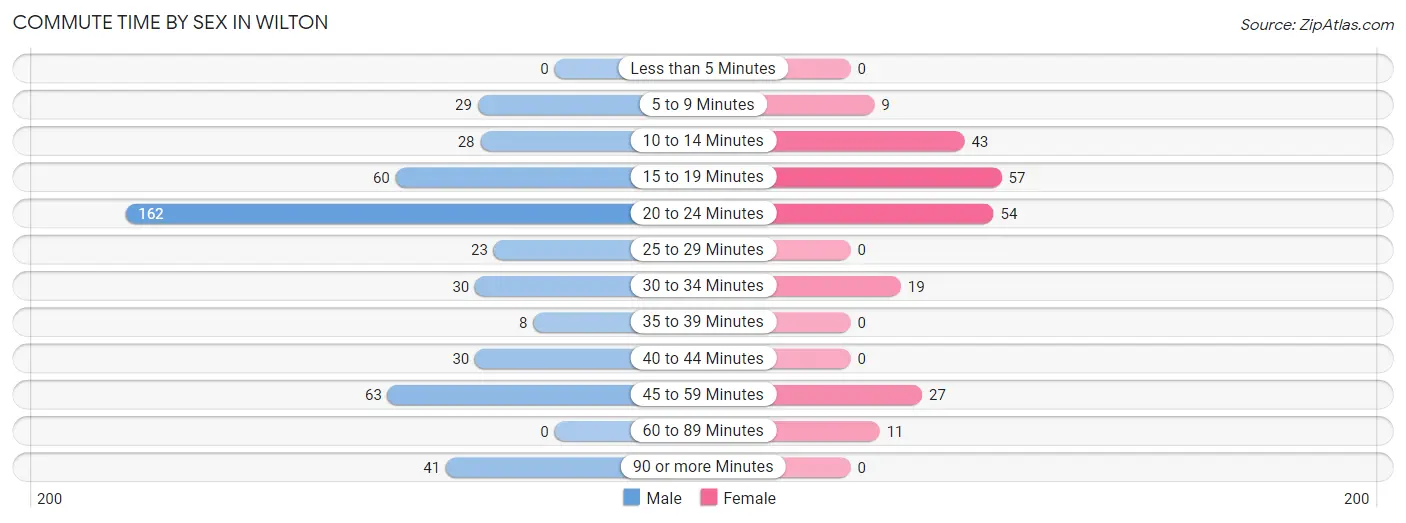
| Commute Time | Male | Female |
| Less than 5 Minutes | 0 (0.0%) | 0 (0.0%) |
| 5 to 9 Minutes | 29 (6.1%) | 9 (4.1%) |
| 10 to 14 Minutes | 28 (5.9%) | 43 (19.6%) |
| 15 to 19 Minutes | 60 (12.7%) | 57 (25.9%) |
| 20 to 24 Minutes | 162 (34.2%) | 54 (24.5%) |
| 25 to 29 Minutes | 23 (4.9%) | 0 (0.0%) |
| 30 to 34 Minutes | 30 (6.3%) | 19 (8.6%) |
| 35 to 39 Minutes | 8 (1.7%) | 0 (0.0%) |
| 40 to 44 Minutes | 30 (6.3%) | 0 (0.0%) |
| 45 to 59 Minutes | 63 (13.3%) | 27 (12.3%) |
| 60 to 89 Minutes | 0 (0.0%) | 11 (5.0%) |
| 90 or more Minutes | 41 (8.6%) | 0 (0.0%) |
Time of Departure to Work by Sex in Wilton
The most frequent times of departure to work in Wilton are 7:00 AM to 7:29 AM (172, 36.3%) for males and 7:30 AM to 7:59 AM (77, 35.0%) for females.
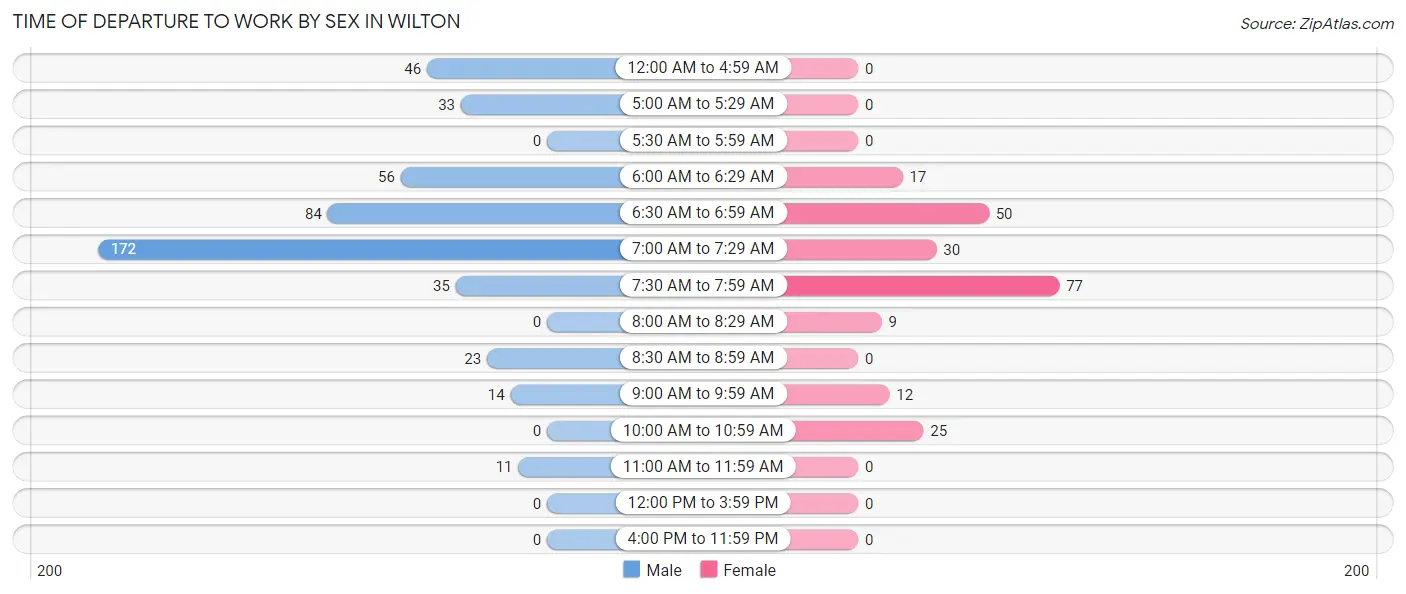
| Time of Departure | Male | Female |
| 12:00 AM to 4:59 AM | 46 (9.7%) | 0 (0.0%) |
| 5:00 AM to 5:29 AM | 33 (7.0%) | 0 (0.0%) |
| 5:30 AM to 5:59 AM | 0 (0.0%) | 0 (0.0%) |
| 6:00 AM to 6:29 AM | 56 (11.8%) | 17 (7.7%) |
| 6:30 AM to 6:59 AM | 84 (17.7%) | 50 (22.7%) |
| 7:00 AM to 7:29 AM | 172 (36.3%) | 30 (13.6%) |
| 7:30 AM to 7:59 AM | 35 (7.4%) | 77 (35.0%) |
| 8:00 AM to 8:29 AM | 0 (0.0%) | 9 (4.1%) |
| 8:30 AM to 8:59 AM | 23 (4.9%) | 0 (0.0%) |
| 9:00 AM to 9:59 AM | 14 (2.9%) | 12 (5.4%) |
| 10:00 AM to 10:59 AM | 0 (0.0%) | 25 (11.4%) |
| 11:00 AM to 11:59 AM | 11 (2.3%) | 0 (0.0%) |
| 12:00 PM to 3:59 PM | 0 (0.0%) | 0 (0.0%) |
| 4:00 PM to 11:59 PM | 0 (0.0%) | 0 (0.0%) |
| Total | 474 (100.0%) | 220 (100.0%) |
Housing Occupancy in Wilton
Occupancy by Ownership in Wilton
Of the total 676 dwellings in Wilton, owner-occupied units account for 493 (72.9%), while renter-occupied units make up 183 (27.1%).
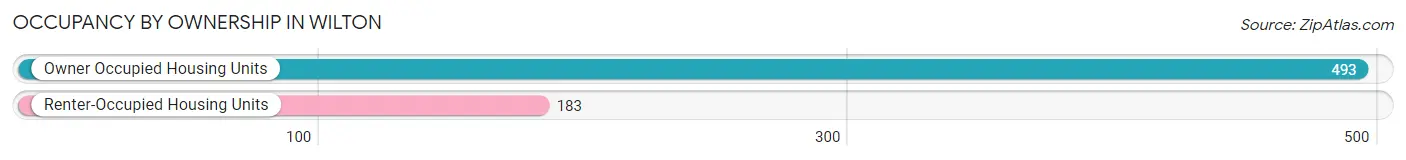
| Occupancy | # Housing Units | % Housing Units |
| Owner Occupied Housing Units | 493 | 72.9% |
| Renter-Occupied Housing Units | 183 | 27.1% |
| Total Occupied Housing Units | 676 | 100.0% |
Occupancy by Household Size in Wilton
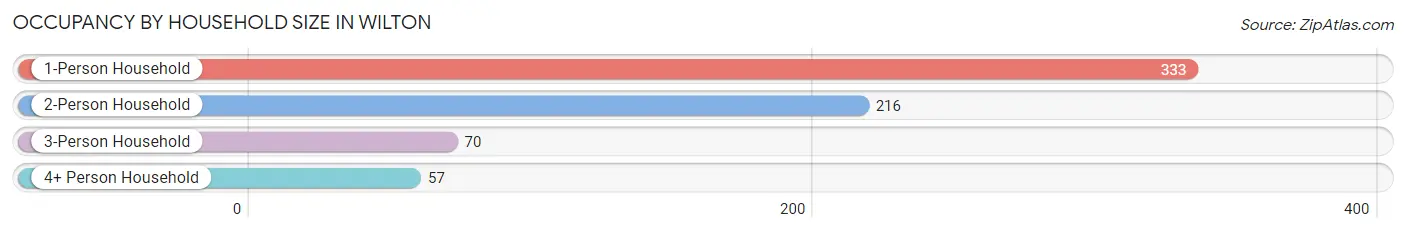
| Household Size | # Housing Units | % Housing Units |
| 1-Person Household | 333 | 49.3% |
| 2-Person Household | 216 | 32.0% |
| 3-Person Household | 70 | 10.4% |
| 4+ Person Household | 57 | 8.4% |
| Total Housing Units | 676 | 100.0% |
Occupancy by Ownership by Household Size in Wilton
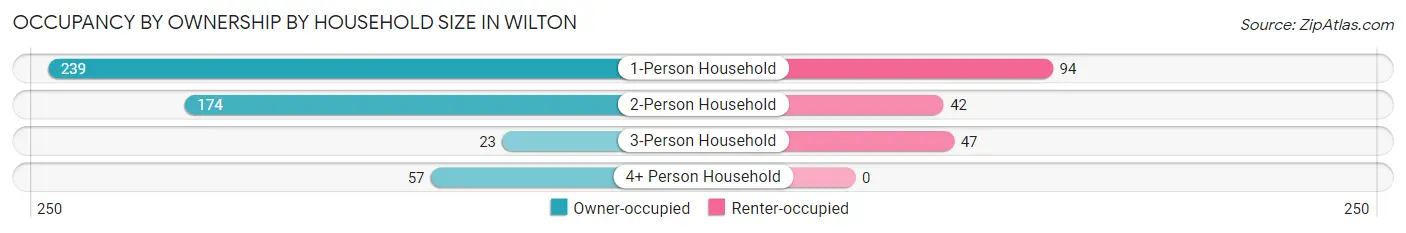
| Household Size | Owner-occupied | Renter-occupied |
| 1-Person Household | 239 (71.8%) | 94 (28.2%) |
| 2-Person Household | 174 (80.6%) | 42 (19.4%) |
| 3-Person Household | 23 (32.9%) | 47 (67.1%) |
| 4+ Person Household | 57 (100.0%) | 0 (0.0%) |
| Total Housing Units | 493 (72.9%) | 183 (27.1%) |
Occupancy by Educational Attainment in Wilton
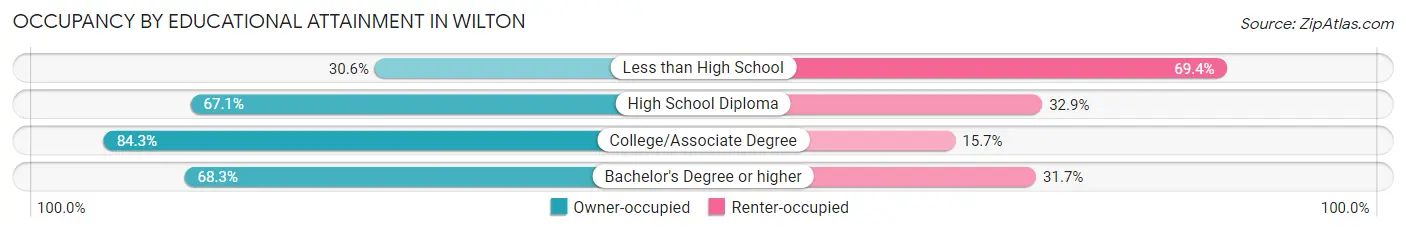
| Household Size | Owner-occupied | Renter-occupied |
| Less than High School | 11 (30.6%) | 25 (69.4%) |
| High School Diploma | 108 (67.1%) | 53 (32.9%) |
| College/Associate Degree | 247 (84.3%) | 46 (15.7%) |
| Bachelor's Degree or higher | 127 (68.3%) | 59 (31.7%) |
Occupancy by Age of Householder in Wilton
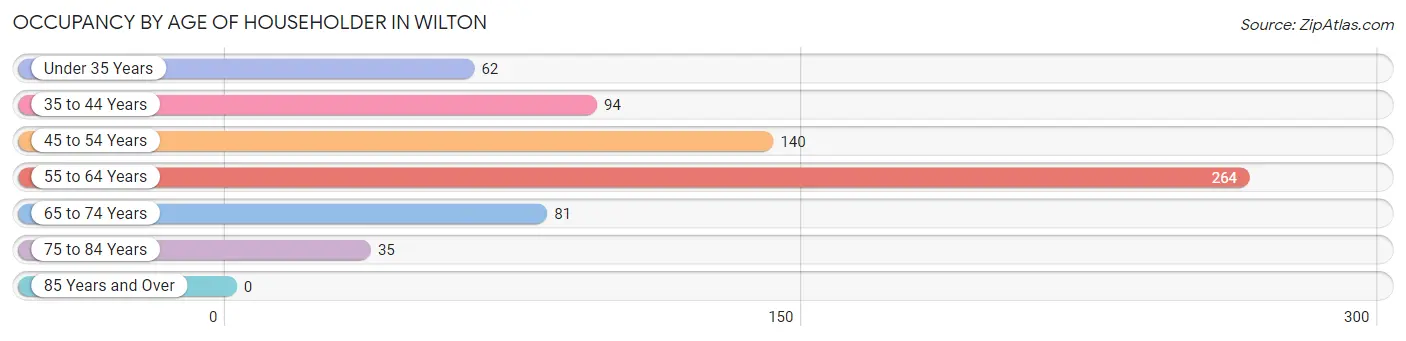
| Age Bracket | # Households | % Households |
| Under 35 Years | 62 | 9.2% |
| 35 to 44 Years | 94 | 13.9% |
| 45 to 54 Years | 140 | 20.7% |
| 55 to 64 Years | 264 | 39.1% |
| 65 to 74 Years | 81 | 12.0% |
| 75 to 84 Years | 35 | 5.2% |
| 85 Years and Over | 0 | 0.0% |
| Total | 676 | 100.0% |
Housing Finances in Wilton
Median Income by Occupancy in Wilton
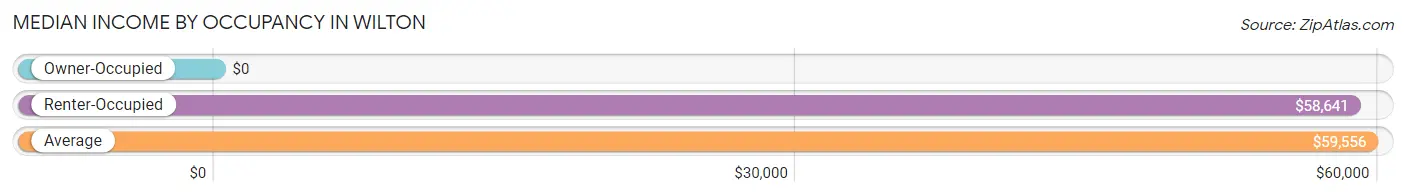
| Occupancy Type | # Households | Median Income |
| Owner-Occupied | 493 (72.9%) | $0 |
| Renter-Occupied | 183 (27.1%) | $58,641 |
| Average | 676 (100.0%) | $59,556 |
Occupancy by Householder Income Bracket in Wilton
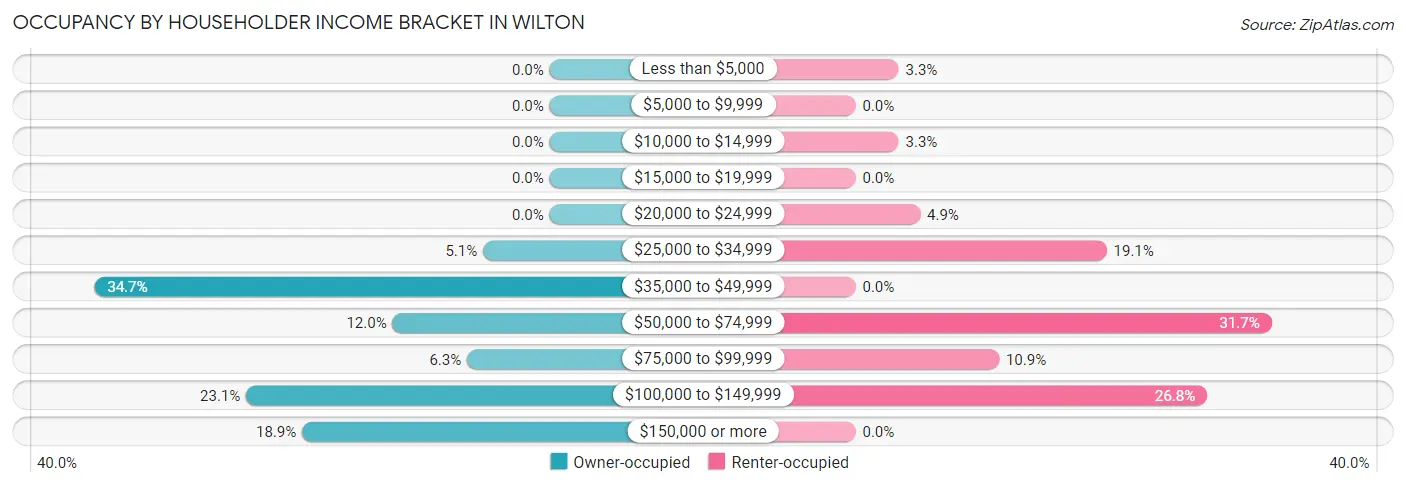
| Income Bracket | Owner-occupied | Renter-occupied |
| Less than $5,000 | 0 (0.0%) | 6 (3.3%) |
| $5,000 to $9,999 | 0 (0.0%) | 0 (0.0%) |
| $10,000 to $14,999 | 0 (0.0%) | 6 (3.3%) |
| $15,000 to $19,999 | 0 (0.0%) | 0 (0.0%) |
| $20,000 to $24,999 | 0 (0.0%) | 9 (4.9%) |
| $25,000 to $34,999 | 25 (5.1%) | 35 (19.1%) |
| $35,000 to $49,999 | 171 (34.7%) | 0 (0.0%) |
| $50,000 to $74,999 | 59 (12.0%) | 58 (31.7%) |
| $75,000 to $99,999 | 31 (6.3%) | 20 (10.9%) |
| $100,000 to $149,999 | 114 (23.1%) | 49 (26.8%) |
| $150,000 or more | 93 (18.9%) | 0 (0.0%) |
| Total | 493 (100.0%) | 183 (100.0%) |
Monthly Housing Cost Tiers in Wilton
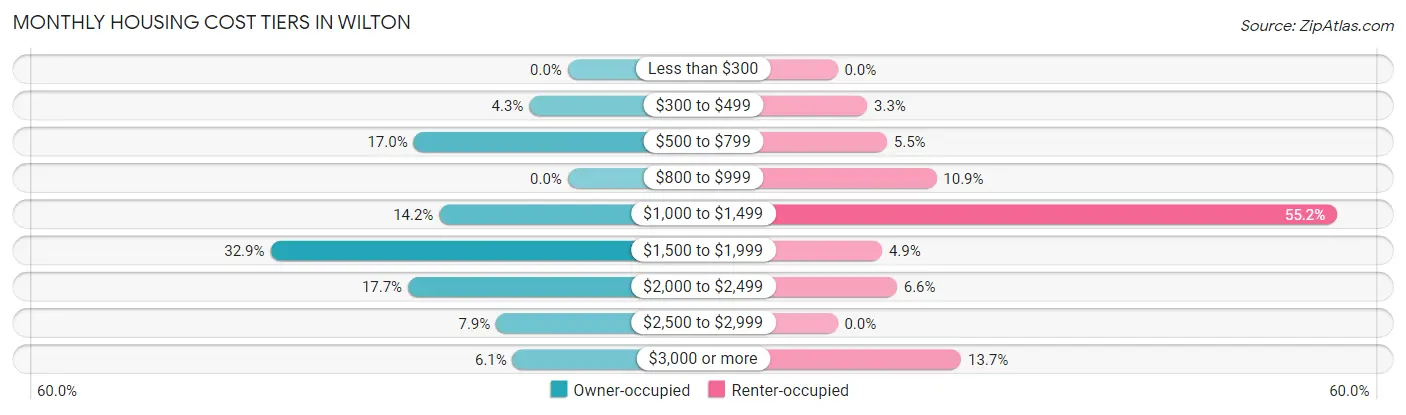
| Monthly Cost | Owner-occupied | Renter-occupied |
| Less than $300 | 0 (0.0%) | 0 (0.0%) |
| $300 to $499 | 21 (4.3%) | 6 (3.3%) |
| $500 to $799 | 84 (17.0%) | 10 (5.5%) |
| $800 to $999 | 0 (0.0%) | 20 (10.9%) |
| $1,000 to $1,499 | 70 (14.2%) | 101 (55.2%) |
| $1,500 to $1,999 | 162 (32.9%) | 9 (4.9%) |
| $2,000 to $2,499 | 87 (17.6%) | 12 (6.6%) |
| $2,500 to $2,999 | 39 (7.9%) | 0 (0.0%) |
| $3,000 or more | 30 (6.1%) | 25 (13.7%) |
| Total | 493 (100.0%) | 183 (100.0%) |
Physical Housing Characteristics in Wilton
Housing Structures in Wilton
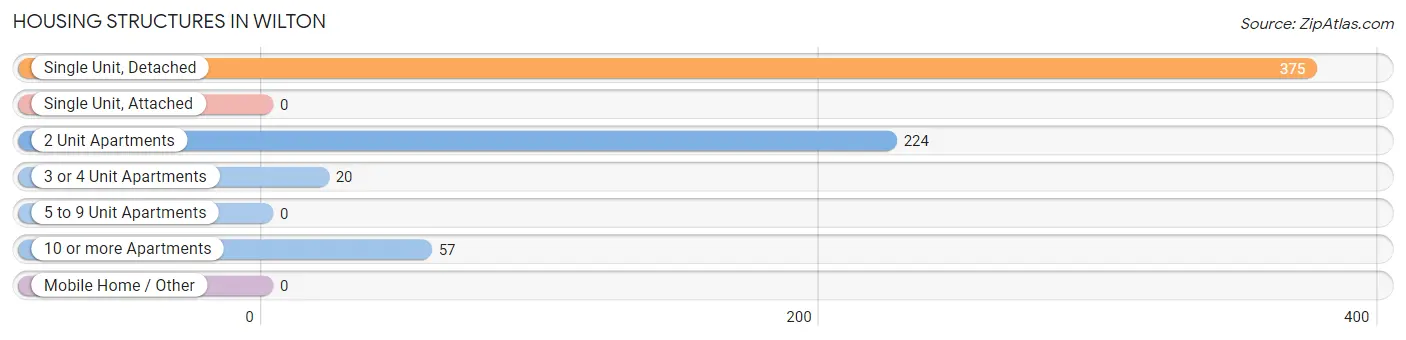
| Structure Type | # Housing Units | % Housing Units |
| Single Unit, Detached | 375 | 55.5% |
| Single Unit, Attached | 0 | 0.0% |
| 2 Unit Apartments | 224 | 33.1% |
| 3 or 4 Unit Apartments | 20 | 3.0% |
| 5 to 9 Unit Apartments | 0 | 0.0% |
| 10 or more Apartments | 57 | 8.4% |
| Mobile Home / Other | 0 | 0.0% |
| Total | 676 | 100.0% |
Housing Structures by Occupancy in Wilton
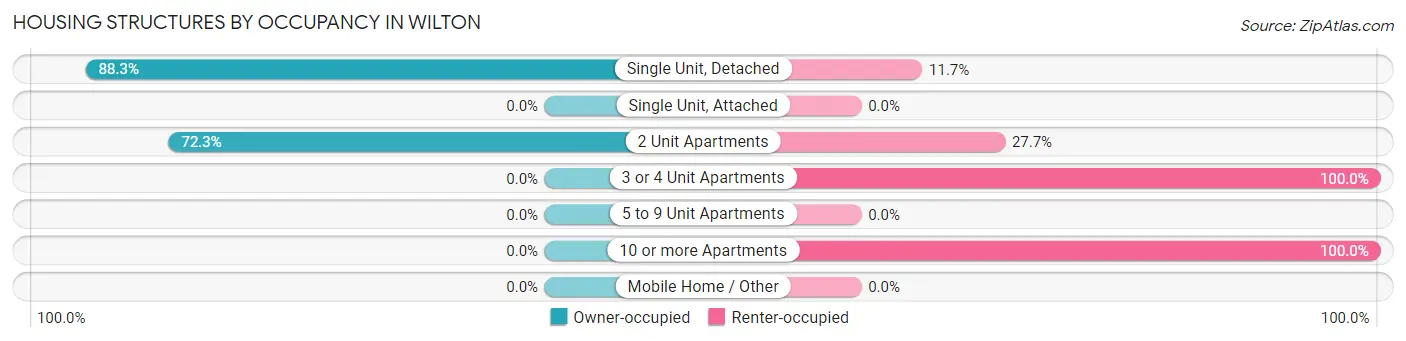
| Structure Type | Owner-occupied | Renter-occupied |
| Single Unit, Detached | 331 (88.3%) | 44 (11.7%) |
| Single Unit, Attached | 0 (0.0%) | 0 (0.0%) |
| 2 Unit Apartments | 162 (72.3%) | 62 (27.7%) |
| 3 or 4 Unit Apartments | 0 (0.0%) | 20 (100.0%) |
| 5 to 9 Unit Apartments | 0 (0.0%) | 0 (0.0%) |
| 10 or more Apartments | 0 (0.0%) | 57 (100.0%) |
| Mobile Home / Other | 0 (0.0%) | 0 (0.0%) |
| Total | 493 (72.9%) | 183 (27.1%) |
Housing Structures by Number of Rooms in Wilton
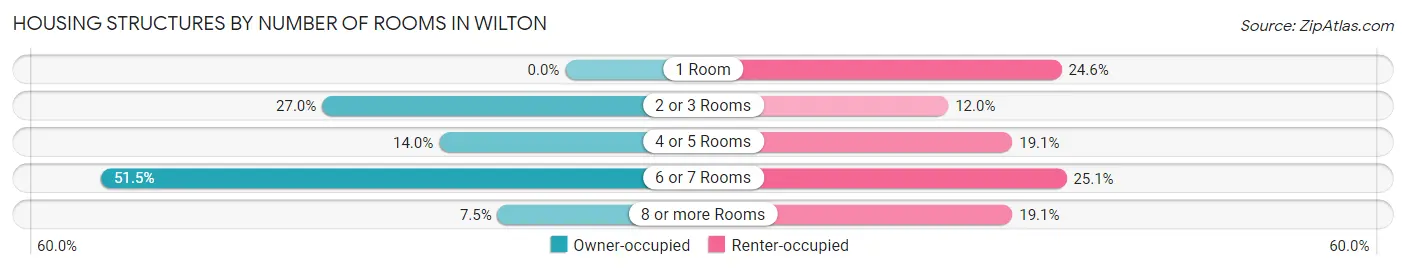
| Number of Rooms | Owner-occupied | Renter-occupied |
| 1 Room | 0 (0.0%) | 45 (24.6%) |
| 2 or 3 Rooms | 133 (27.0%) | 22 (12.0%) |
| 4 or 5 Rooms | 69 (14.0%) | 35 (19.1%) |
| 6 or 7 Rooms | 254 (51.5%) | 46 (25.1%) |
| 8 or more Rooms | 37 (7.5%) | 35 (19.1%) |
| Total | 493 (100.0%) | 183 (100.0%) |
Housing Structure by Heating Type in Wilton

| Heating Type | Owner-occupied | Renter-occupied |
| Utility Gas | 0 (0.0%) | 10 (5.5%) |
| Bottled, Tank, or LP Gas | 88 (17.8%) | 25 (13.7%) |
| Electricity | 37 (7.5%) | 36 (19.7%) |
| Fuel Oil or Kerosene | 357 (72.4%) | 50 (27.3%) |
| Coal or Coke | 0 (0.0%) | 0 (0.0%) |
| All other Fuels | 11 (2.2%) | 37 (20.2%) |
| No Fuel Used | 0 (0.0%) | 25 (13.7%) |
| Total | 493 (100.0%) | 183 (100.0%) |
Household Vehicle Usage in Wilton
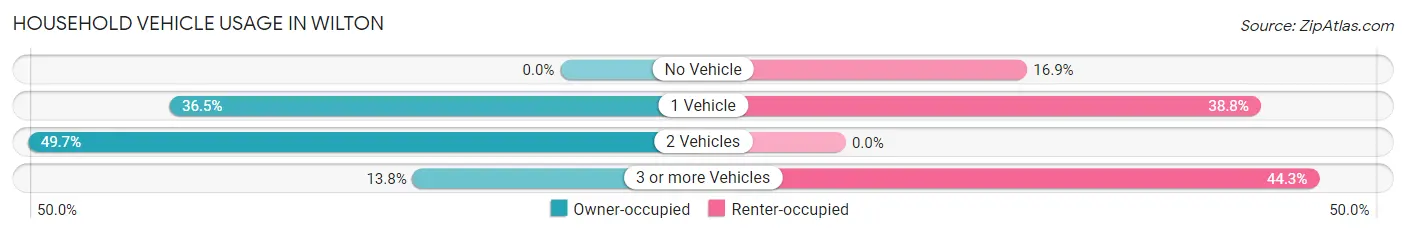
| Vehicles per Household | Owner-occupied | Renter-occupied |
| No Vehicle | 0 (0.0%) | 31 (16.9%) |
| 1 Vehicle | 180 (36.5%) | 71 (38.8%) |
| 2 Vehicles | 245 (49.7%) | 0 (0.0%) |
| 3 or more Vehicles | 68 (13.8%) | 81 (44.3%) |
| Total | 493 (100.0%) | 183 (100.0%) |
Real Estate & Mortgages in Wilton
Real Estate and Mortgage Overview in Wilton
| Characteristic | Without Mortgage | With Mortgage |
| Housing Units | 121 | 372 |
| Median Property Value | $176,500 | $283,900 |
| Median Household Income | - | - |
| Monthly Housing Costs | $590 | $30 |
| Real Estate Taxes | $3,402 | $0 |
Property Value by Mortgage Status in Wilton
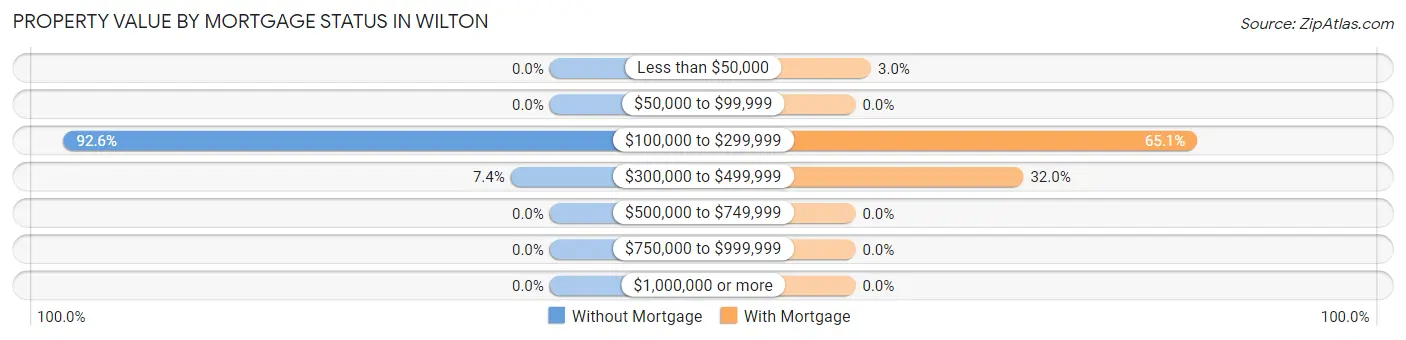
| Property Value | Without Mortgage | With Mortgage |
| Less than $50,000 | 0 (0.0%) | 11 (3.0%) |
| $50,000 to $99,999 | 0 (0.0%) | 0 (0.0%) |
| $100,000 to $299,999 | 112 (92.6%) | 242 (65.0%) |
| $300,000 to $499,999 | 9 (7.4%) | 119 (32.0%) |
| $500,000 to $749,999 | 0 (0.0%) | 0 (0.0%) |
| $750,000 to $999,999 | 0 (0.0%) | 0 (0.0%) |
| $1,000,000 or more | 0 (0.0%) | 0 (0.0%) |
| Total | 121 (100.0%) | 372 (100.0%) |
Household Income by Mortgage Status in Wilton
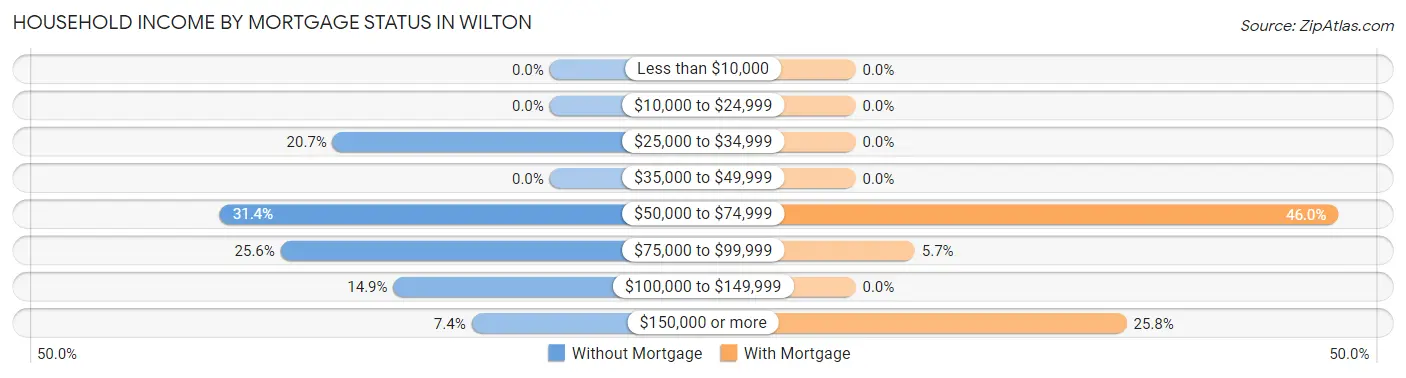
| Household Income | Without Mortgage | With Mortgage |
| Less than $10,000 | 0 (0.0%) | 0 (0.0%) |
| $10,000 to $24,999 | 0 (0.0%) | 0 (0.0%) |
| $25,000 to $34,999 | 25 (20.7%) | 0 (0.0%) |
| $35,000 to $49,999 | 0 (0.0%) | 0 (0.0%) |
| $50,000 to $74,999 | 38 (31.4%) | 171 (46.0%) |
| $75,000 to $99,999 | 31 (25.6%) | 21 (5.7%) |
| $100,000 to $149,999 | 18 (14.9%) | 0 (0.0%) |
| $150,000 or more | 9 (7.4%) | 96 (25.8%) |
| Total | 121 (100.0%) | 372 (100.0%) |
Property Value to Household Income Ratio in Wilton
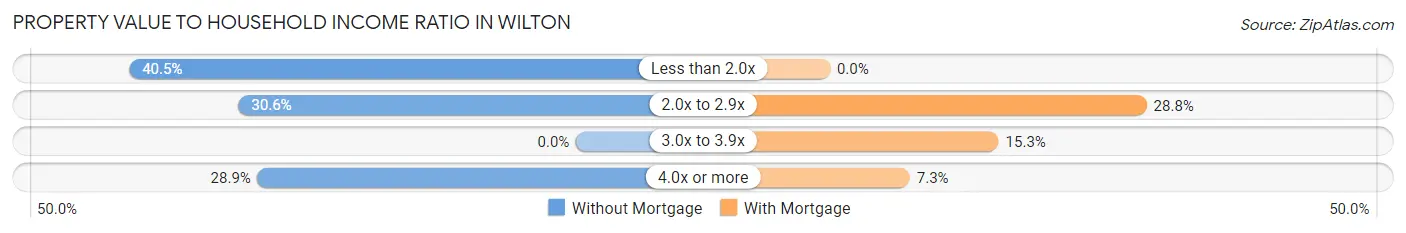
| Value-to-Income Ratio | Without Mortgage | With Mortgage |
| Less than 2.0x | 49 (40.5%) | 0 (0.0%) |
| 2.0x to 2.9x | 37 (30.6%) | 107 (28.8%) |
| 3.0x to 3.9x | 0 (0.0%) | 57 (15.3%) |
| 4.0x or more | 35 (28.9%) | 27 (7.3%) |
| Total | 121 (100.0%) | 372 (100.0%) |
Real Estate Taxes by Mortgage Status in Wilton
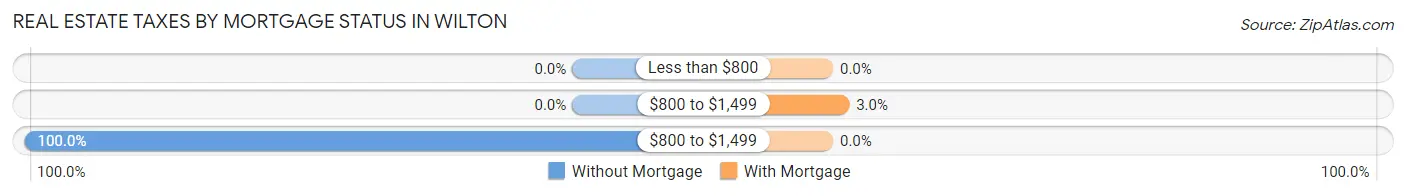
| Property Taxes | Without Mortgage | With Mortgage |
| Less than $800 | 0 (0.0%) | 0 (0.0%) |
| $800 to $1,499 | 0 (0.0%) | 11 (3.0%) |
| $800 to $1,499 | 121 (100.0%) | 0 (0.0%) |
| Total | 121 (100.0%) | 372 (100.0%) |
Health & Disability in Wilton
Health Insurance Coverage by Age in Wilton
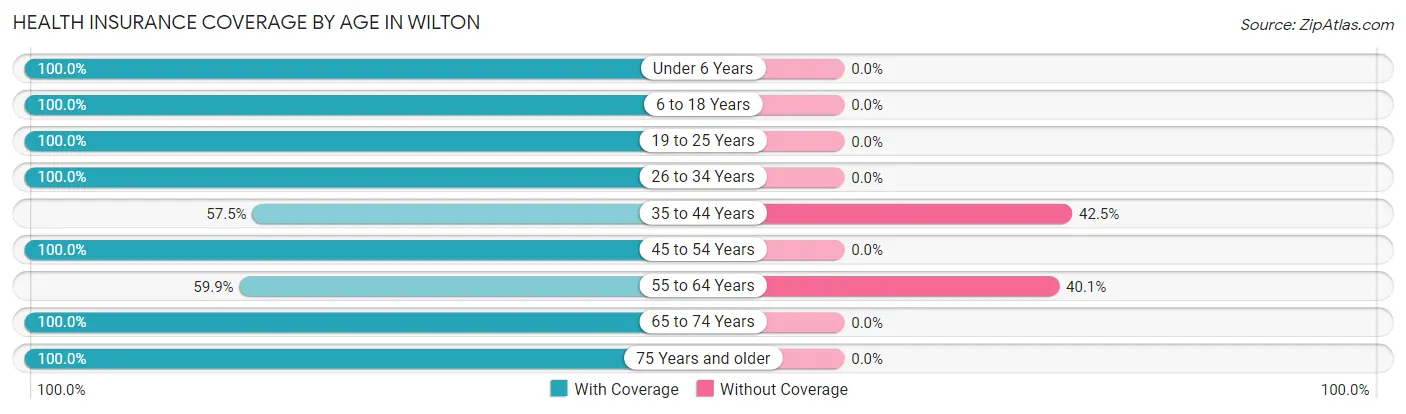
| Age Bracket | With Coverage | Without Coverage |
| Under 6 Years | 66 (100.0%) | 0 (0.0%) |
| 6 to 18 Years | 162 (100.0%) | 0 (0.0%) |
| 19 to 25 Years | 46 (100.0%) | 0 (0.0%) |
| 26 to 34 Years | 180 (100.0%) | 0 (0.0%) |
| 35 to 44 Years | 65 (57.5%) | 48 (42.5%) |
| 45 to 54 Years | 279 (100.0%) | 0 (0.0%) |
| 55 to 64 Years | 199 (59.9%) | 133 (40.1%) |
| 65 to 74 Years | 109 (100.0%) | 0 (0.0%) |
| 75 Years and older | 46 (100.0%) | 0 (0.0%) |
| Total | 1,152 (86.4%) | 181 (13.6%) |
Health Insurance Coverage by Citizenship Status in Wilton
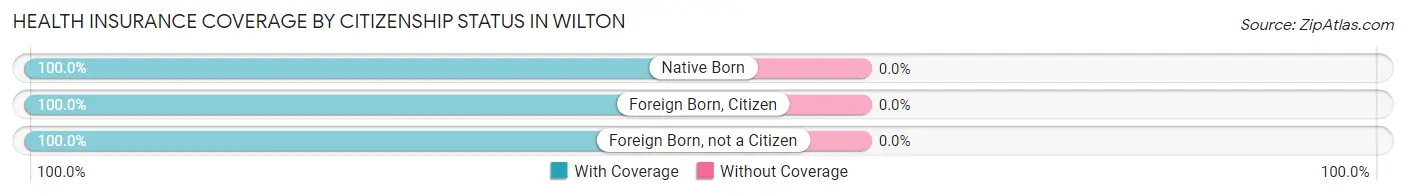
| Citizenship Status | With Coverage | Without Coverage |
| Native Born | 66 (100.0%) | 0 (0.0%) |
| Foreign Born, Citizen | 162 (100.0%) | 0 (0.0%) |
| Foreign Born, not a Citizen | 46 (100.0%) | 0 (0.0%) |
Health Insurance Coverage by Household Income in Wilton
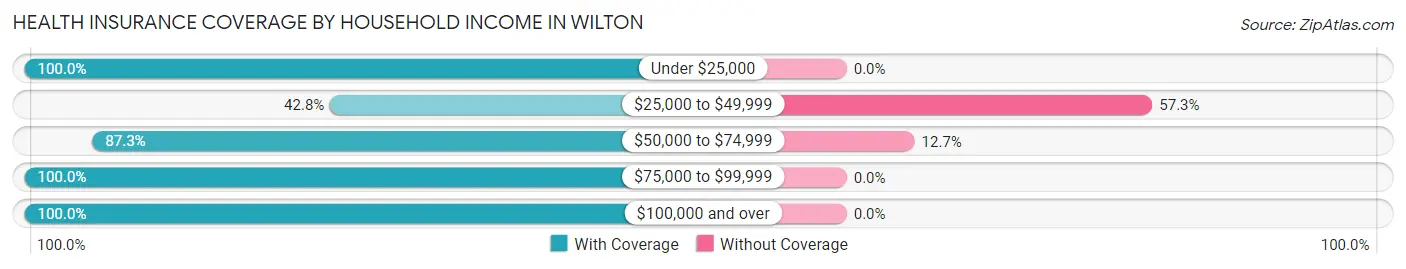
| Household Income | With Coverage | Without Coverage |
| Under $25,000 | 21 (100.0%) | 0 (0.0%) |
| $25,000 to $49,999 | 118 (42.7%) | 158 (57.3%) |
| $50,000 to $74,999 | 158 (87.3%) | 23 (12.7%) |
| $75,000 to $99,999 | 70 (100.0%) | 0 (0.0%) |
| $100,000 and over | 785 (100.0%) | 0 (0.0%) |
Public vs Private Health Insurance Coverage by Age in Wilton
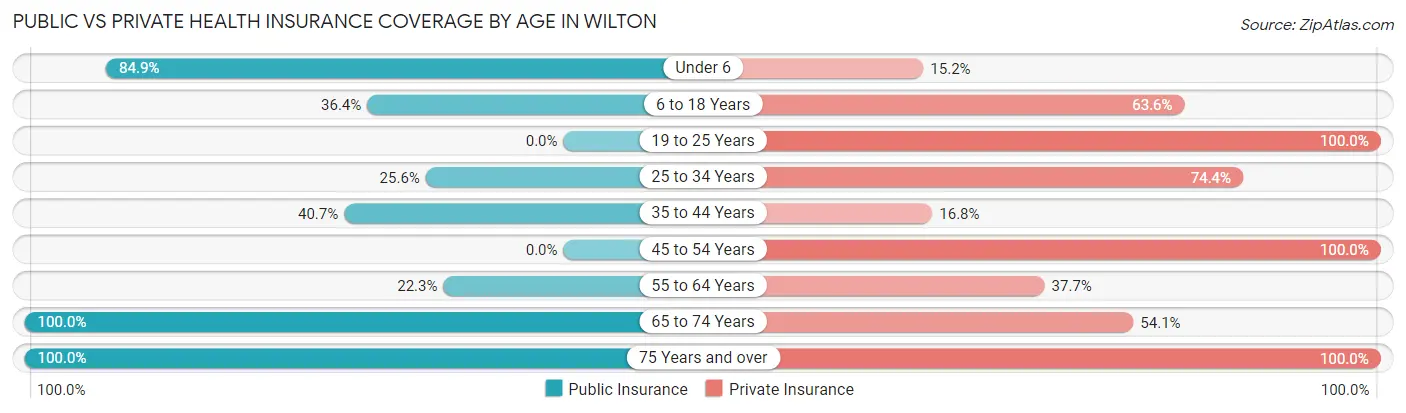
| Age Bracket | Public Insurance | Private Insurance |
| Under 6 | 56 (84.9%) | 10 (15.1%) |
| 6 to 18 Years | 59 (36.4%) | 103 (63.6%) |
| 19 to 25 Years | 0 (0.0%) | 46 (100.0%) |
| 25 to 34 Years | 46 (25.6%) | 134 (74.4%) |
| 35 to 44 Years | 46 (40.7%) | 19 (16.8%) |
| 45 to 54 Years | 0 (0.0%) | 279 (100.0%) |
| 55 to 64 Years | 74 (22.3%) | 125 (37.7%) |
| 65 to 74 Years | 109 (100.0%) | 59 (54.1%) |
| 75 Years and over | 46 (100.0%) | 46 (100.0%) |
| Total | 436 (32.7%) | 821 (61.6%) |
Disability Status by Sex by Age in Wilton
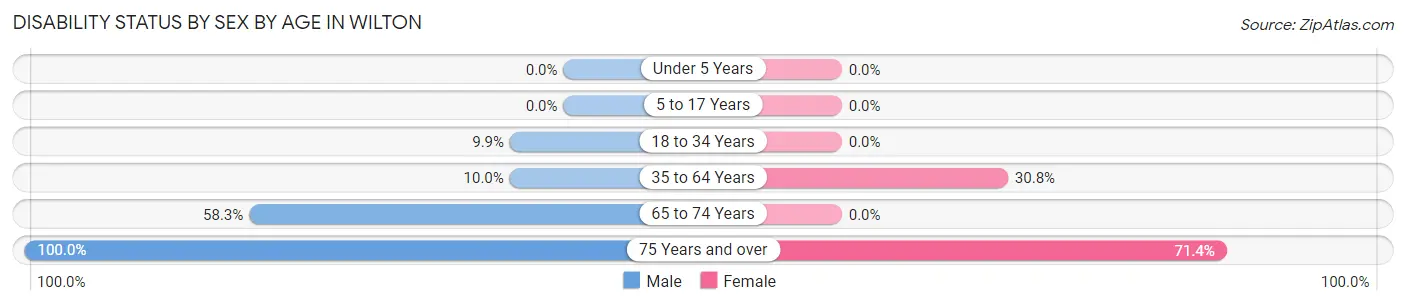
| Age Bracket | Male | Female |
| Under 5 Years | 0 (0.0%) | 0 (0.0%) |
| 5 to 17 Years | 0 (0.0%) | 0 (0.0%) |
| 18 to 34 Years | 14 (9.9%) | 0 (0.0%) |
| 35 to 64 Years | 47 (10.0%) | 78 (30.8%) |
| 65 to 74 Years | 42 (58.3%) | 0 (0.0%) |
| 75 Years and over | 11 (100.0%) | 25 (71.4%) |
Disability Class by Sex by Age in Wilton
Disability Class: Hearing Difficulty
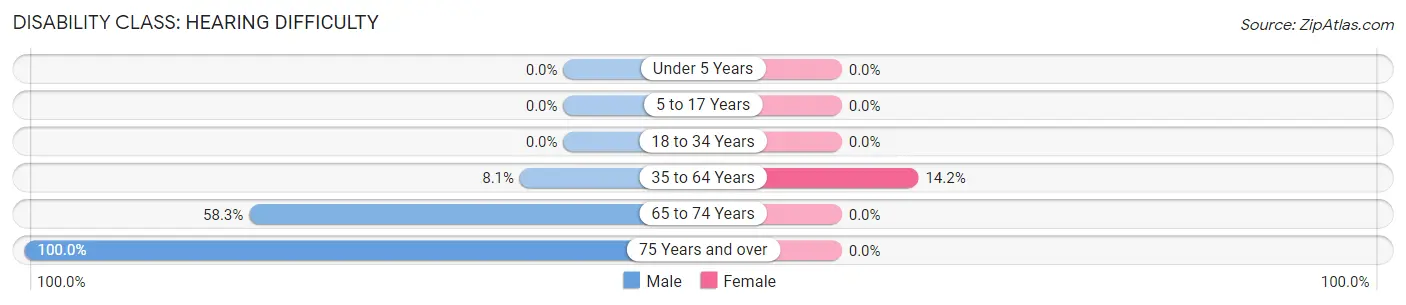
| Age Bracket | Male | Female |
| Under 5 Years | 0 (0.0%) | 0 (0.0%) |
| 5 to 17 Years | 0 (0.0%) | 0 (0.0%) |
| 18 to 34 Years | 0 (0.0%) | 0 (0.0%) |
| 35 to 64 Years | 38 (8.1%) | 36 (14.2%) |
| 65 to 74 Years | 42 (58.3%) | 0 (0.0%) |
| 75 Years and over | 11 (100.0%) | 0 (0.0%) |
Disability Class: Vision Difficulty
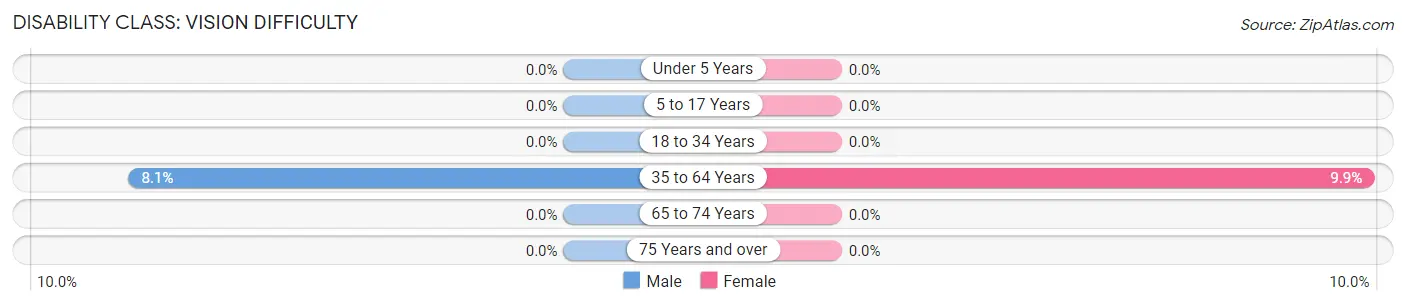
| Age Bracket | Male | Female |
| Under 5 Years | 0 (0.0%) | 0 (0.0%) |
| 5 to 17 Years | 0 (0.0%) | 0 (0.0%) |
| 18 to 34 Years | 0 (0.0%) | 0 (0.0%) |
| 35 to 64 Years | 38 (8.1%) | 25 (9.9%) |
| 65 to 74 Years | 0 (0.0%) | 0 (0.0%) |
| 75 Years and over | 0 (0.0%) | 0 (0.0%) |
Disability Class: Cognitive Difficulty
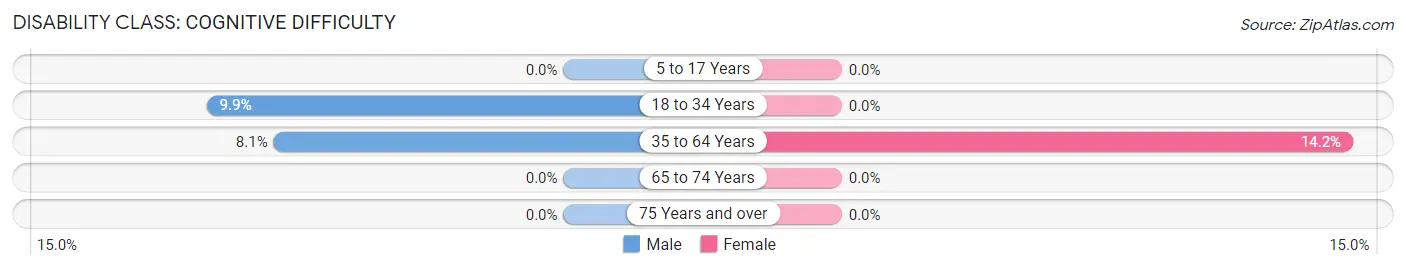
| Age Bracket | Male | Female |
| 5 to 17 Years | 0 (0.0%) | 0 (0.0%) |
| 18 to 34 Years | 14 (9.9%) | 0 (0.0%) |
| 35 to 64 Years | 38 (8.1%) | 36 (14.2%) |
| 65 to 74 Years | 0 (0.0%) | 0 (0.0%) |
| 75 Years and over | 0 (0.0%) | 0 (0.0%) |
Disability Class: Ambulatory Difficulty
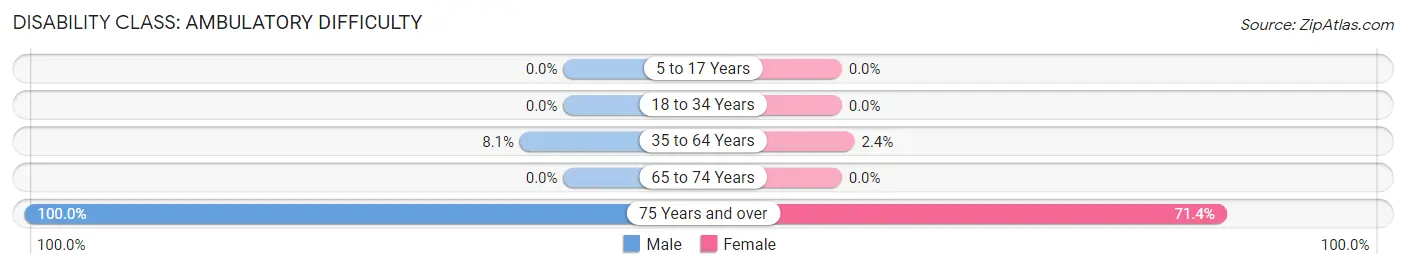
| Age Bracket | Male | Female |
| 5 to 17 Years | 0 (0.0%) | 0 (0.0%) |
| 18 to 34 Years | 0 (0.0%) | 0 (0.0%) |
| 35 to 64 Years | 38 (8.1%) | 6 (2.4%) |
| 65 to 74 Years | 0 (0.0%) | 0 (0.0%) |
| 75 Years and over | 11 (100.0%) | 25 (71.4%) |
Disability Class: Self-Care Difficulty
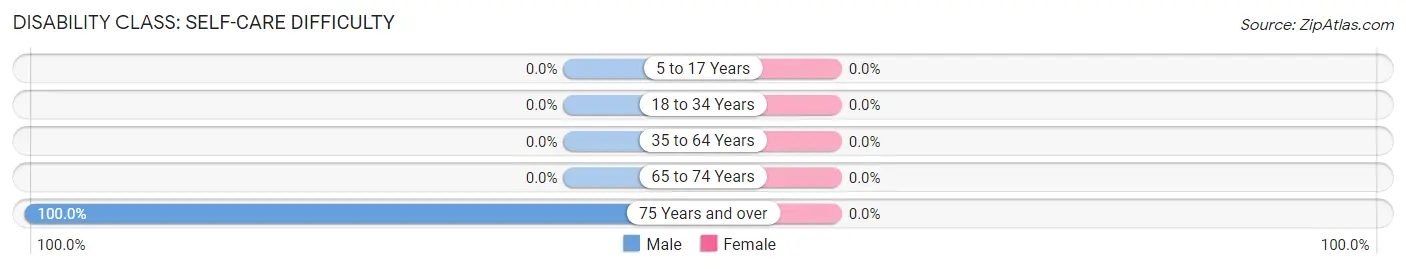
| Age Bracket | Male | Female |
| 5 to 17 Years | 0 (0.0%) | 0 (0.0%) |
| 18 to 34 Years | 0 (0.0%) | 0 (0.0%) |
| 35 to 64 Years | 0 (0.0%) | 0 (0.0%) |
| 65 to 74 Years | 0 (0.0%) | 0 (0.0%) |
| 75 Years and over | 11 (100.0%) | 0 (0.0%) |
Technology Access in Wilton
Computing Device Access in Wilton
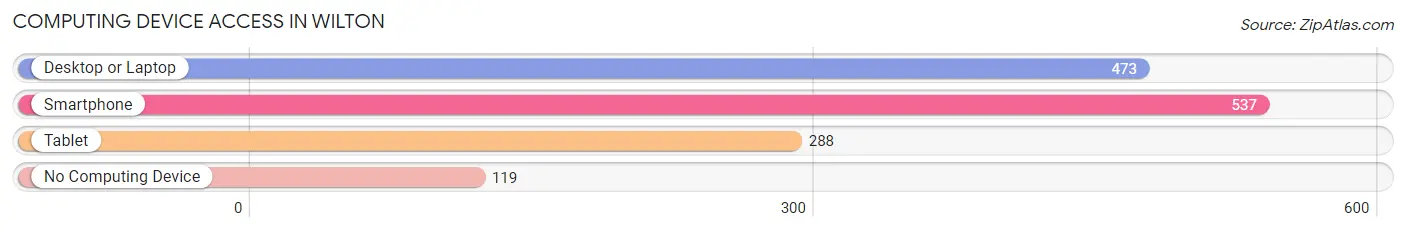
| Device Type | # Households | % Households |
| Desktop or Laptop | 473 | 70.0% |
| Smartphone | 537 | 79.4% |
| Tablet | 288 | 42.6% |
| No Computing Device | 119 | 17.6% |
| Total | 676 | 100.0% |
Internet Access in Wilton
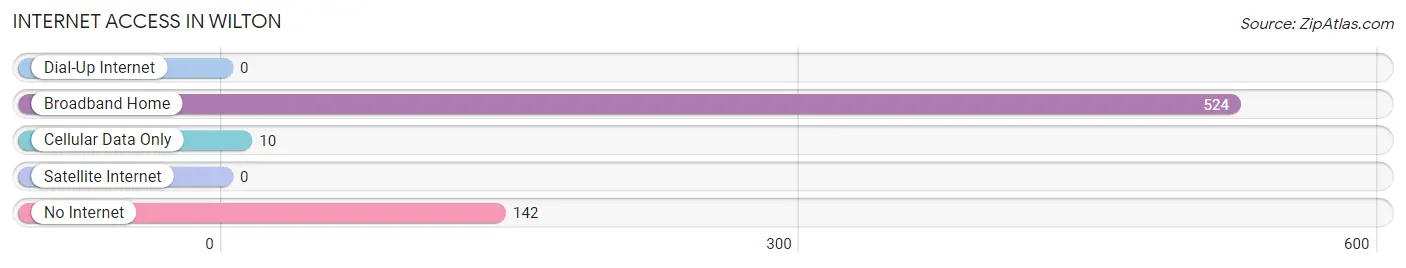
| Internet Type | # Households | % Households |
| Dial-Up Internet | 0 | 0.0% |
| Broadband Home | 524 | 77.5% |
| Cellular Data Only | 10 | 1.5% |
| Satellite Internet | 0 | 0.0% |
| No Internet | 142 | 21.0% |
| Total | 676 | 100.0% |
Wilton Summary
Wilton, New Hampshire is a small town located in Hillsborough County in the southwestern part of the state. It is situated on the Souhegan River, which is a tributary of the Merrimack River. The town was first settled in 1764 and was incorporated in 1794. As of the 2010 census, the population of Wilton was 3,677.
Geography
Wilton is located at 42°59'N 71°41'W (42.983, -71.683). It is bordered by Lyndeborough to the north, Mason to the east, Milford to the south, and Amherst to the west. Wilton is situated in the Souhegan Valley, which is part of the Merrimack Valley region. The town has a total area of 24.2 square miles, of which 24.1 square miles is land and 0.1 square miles is water. The highest point in Wilton is the summit of Pack Monadnock, which has an elevation of 2,290 feet above sea level.
Economy
Wilton has a diverse economy that is largely based on agriculture and manufacturing. The town is home to several small businesses, including a sawmill, a furniture factory, and a machine shop. The town also has a number of farms, which produce a variety of crops, including apples, corn, hay, and potatoes. In addition, Wilton is home to several large companies, including a paper mill, a plastics manufacturer, and a printing company.
Demographics
As of the 2010 census, there were 3,677 people, 1,521 households, and 1,039 families residing in Wilton. The population density was 152.7 people per square mile. The racial makeup of the town was 97.3% White, 0.7% African American, 0.2% Native American, 0.4% Asian, 0.1% Pacific Islander, 0.3% from other races, and 1.0% from two or more races. Hispanic or Latino of any race were 1.2% of the population.
The median age in Wilton was 43.2 years. 24.2% of residents were under the age of 18; 6.2% were between the ages of 18 and 24; 22.7% were from 25 to 44; 33.2% were from 45 to 64; and 13.7% were 65 years of age or older. The gender makeup of the town was 48.7% male and 51.3% female.
The median income for a household in Wilton was $63,958, and the median income for a family was $76,944. The per capita income for the town was $30,945. About 4.2% of families and 5.7% of the population were below the poverty line, including 6.3% of those under age 18 and 4.2% of those age 65 or over.
Conclusion
Wilton, New Hampshire is a small town located in Hillsborough County in the southwestern part of the state. It is situated on the Souhegan River and has a population of 3,677 as of the 2010 census. The town has a diverse economy that is largely based on agriculture and manufacturing. Wilton has a population that is 97.3% White, with a median age of 43.2 years and a median household income of $63,958.
Common Questions
What is Per Capita Income in Wilton?
Per Capita income in Wilton is $44,050.
What is the Median Family Income in Wilton?
Median Family Income in Wilton is $120,809.
What is the Median Household income in Wilton?
Median Household Income in Wilton is $59,556.
What is Income or Wage Gap in Wilton?
Income or Wage Gap in Wilton is 46.0%.
Women in Wilton earn 54.0 cents for every dollar earned by a man.
What is Inequality or Gini Index in Wilton?
Inequality or Gini Index in Wilton is 0.33.
What is the Total Population of Wilton?
Total Population of Wilton is 1,333.
What is the Total Male Population of Wilton?
Total Male Population of Wilton is 767.
What is the Total Female Population of Wilton?
Total Female Population of Wilton is 566.
What is the Ratio of Males per 100 Females in Wilton?
There are 135.51 Males per 100 Females in Wilton.
What is the Ratio of Females per 100 Males in Wilton?
There are 73.79 Females per 100 Males in Wilton.
What is the Median Population Age in Wilton?
Median Population Age in Wilton is 46.8 Years.
What is the Average Family Size in Wilton
Average Family Size in Wilton is 3.3 People.
What is the Average Household Size in Wilton
Average Household Size in Wilton is 2.0 People.
How Large is the Labor Force in Wilton?
There are 811 People in the Labor Forcein in Wilton.
What is the Percentage of People in the Labor Force in Wilton?
70.0% of People are in the Labor Force in Wilton.
What is the Unemployment Rate in Wilton?
Unemployment Rate in Wilton is 5.2%.