Seagrove, NC Map & Demographics
Seagrove Map
Seagrove Overview
$23,457
PER CAPITA INCOME
$41,404
AVG FAMILY INCOME
$65,000
AVG HOUSEHOLD INCOME
29.4%
WAGE / INCOME GAP [ % ]
70.6¢/ $1
WAGE / INCOME GAP [ $ ]
0.30
INEQUALITY / GINI INDEX
405
TOTAL POPULATION
239
MALE POPULATION
166
FEMALE POPULATION
143.98
MALES / 100 FEMALES
69.46
FEMALES / 100 MALES
36.5
MEDIAN AGE
2.6
AVG FAMILY SIZE
2.5
AVG HOUSEHOLD SIZE
200
LABOR FORCE [ PEOPLE ]
69.7%
PERCENT IN LABOR FORCE
5.5%
UNEMPLOYMENT RATE
Seagrove Zip Codes
Income in Seagrove
Income Overview in Seagrove
Per Capita Income in Seagrove is $23,457, while median incomes of families and households are $41,404 and $65,000 respectively.
| Characteristic | Number | Measure |
| Per Capita Income | 405 | $23,457 |
| Median Family Income | 124 | $41,404 |
| Mean Family Income | 124 | $55,622 |
| Median Household Income | 160 | $65,000 |
| Mean Household Income | 160 | $62,293 |
| Income Deficit | 124 | $0 |
| Wage / Income Gap (%) | 405 | 29.38% |
| Wage / Income Gap ($) | 405 | 70.62¢ per $1 |
| Gini / Inequality Index | 405 | 0.30 |
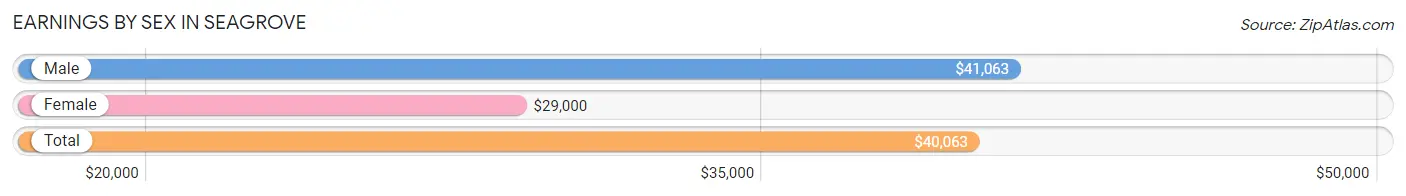
Earnings by Sex in Seagrove
Average Earnings in Seagrove are $40,063, $41,063 for men and $29,000 for women, a difference of 29.4%.
| Sex | Number | Average Earnings |
| Male | 103 (50.2%) | $41,063 |
| Female | 102 (49.8%) | $29,000 |
| Total | 205 (100.0%) | $40,063 |
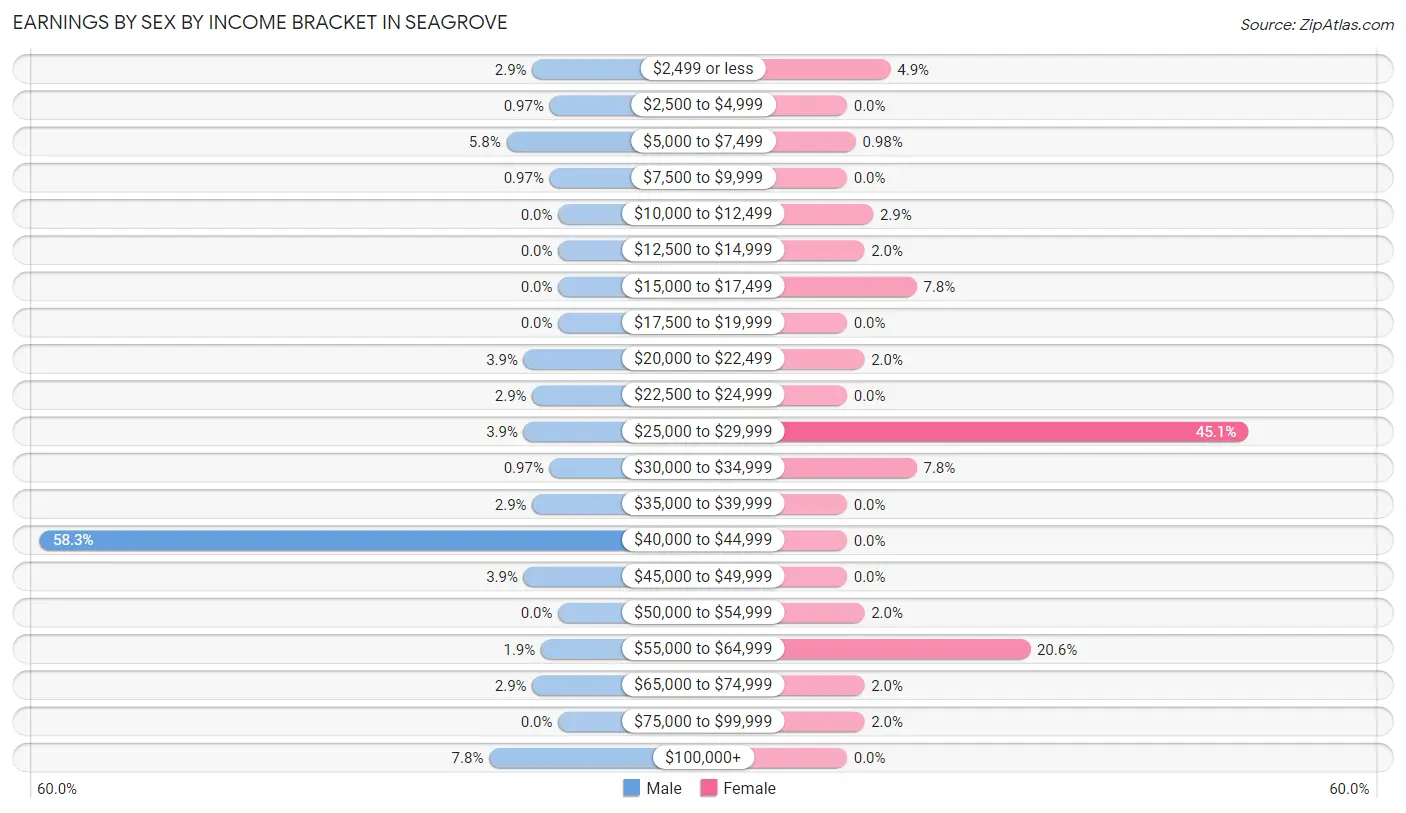
Earnings by Sex by Income Bracket in Seagrove
The most common earnings brackets in Seagrove are $40,000 to $44,999 for men (60 | 58.3%) and $25,000 to $29,999 for women (46 | 45.1%).
| Income | Male | Female |
| $2,499 or less | 3 (2.9%) | 5 (4.9%) |
| $2,500 to $4,999 | 1 (1.0%) | 0 (0.0%) |
| $5,000 to $7,499 | 6 (5.8%) | 1 (1.0%) |
| $7,500 to $9,999 | 1 (1.0%) | 0 (0.0%) |
| $10,000 to $12,499 | 0 (0.0%) | 3 (2.9%) |
| $12,500 to $14,999 | 0 (0.0%) | 2 (2.0%) |
| $15,000 to $17,499 | 0 (0.0%) | 8 (7.8%) |
| $17,500 to $19,999 | 0 (0.0%) | 0 (0.0%) |
| $20,000 to $22,499 | 4 (3.9%) | 2 (2.0%) |
| $22,500 to $24,999 | 3 (2.9%) | 0 (0.0%) |
| $25,000 to $29,999 | 4 (3.9%) | 46 (45.1%) |
| $30,000 to $34,999 | 1 (1.0%) | 8 (7.8%) |
| $35,000 to $39,999 | 3 (2.9%) | 0 (0.0%) |
| $40,000 to $44,999 | 60 (58.3%) | 0 (0.0%) |
| $45,000 to $49,999 | 4 (3.9%) | 0 (0.0%) |
| $50,000 to $54,999 | 0 (0.0%) | 2 (2.0%) |
| $55,000 to $64,999 | 2 (1.9%) | 21 (20.6%) |
| $65,000 to $74,999 | 3 (2.9%) | 2 (2.0%) |
| $75,000 to $99,999 | 0 (0.0%) | 2 (2.0%) |
| $100,000+ | 8 (7.8%) | 0 (0.0%) |
| Total | 103 (100.0%) | 102 (100.0%) |
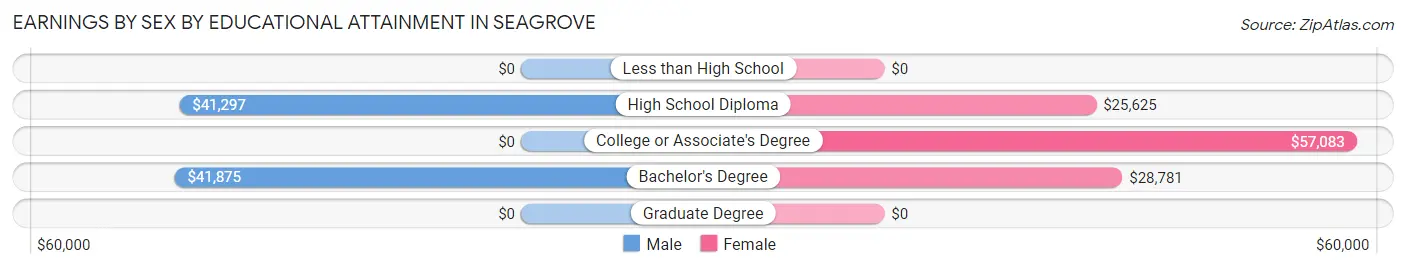
Earnings by Sex by Educational Attainment in Seagrove
Average earnings in Seagrove are $41,167 for men and $29,156 for women, a difference of 29.2%. Men with an educational attainment of bachelor's degree enjoy the highest average annual earnings of $41,875, while those with high school diploma education earn the least with $41,297. Women with an educational attainment of college or associate's degree earn the most with the average annual earnings of $57,083, while those with high school diploma education have the smallest earnings of $25,625.
| Educational Attainment | Male Income | Female Income |
| Less than High School | - | - |
| High School Diploma | $41,297 | $25,625 |
| College or Associate's Degree | - | - |
| Bachelor's Degree | $41,875 | $28,781 |
| Graduate Degree | - | - |
| Total | $41,167 | $29,156 |
Family Income in Seagrove
Family Income Brackets in Seagrove
According to the Seagrove family income data, there are 71 families falling into the $35,000 to $49,999 income range, which is the most common income bracket and makes up 57.3% of all families.
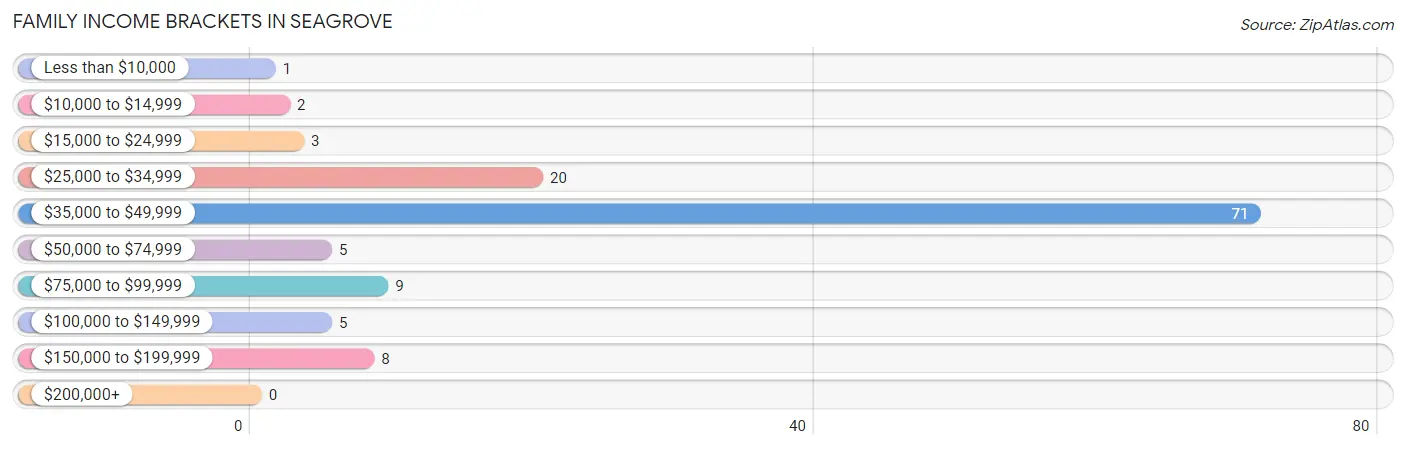
| Income Bracket | # Families | % Families |
| Less than $10,000 | 1 | 0.8% |
| $10,000 to $14,999 | 2 | 1.6% |
| $15,000 to $24,999 | 3 | 2.4% |
| $25,000 to $34,999 | 20 | 16.1% |
| $35,000 to $49,999 | 71 | 57.3% |
| $50,000 to $74,999 | 5 | 4.0% |
| $75,000 to $99,999 | 9 | 7.3% |
| $100,000 to $149,999 | 5 | 4.0% |
| $150,000 to $199,999 | 8 | 6.5% |
| $200,000+ | 0 | 0.0% |
Family Income by Famaliy Size in Seagrove
4-person families (5 | 4.0%) account for the highest median family income in Seagrove with $86,875 per family, while 2-person families (46 | 37.1%) have the highest median income of $23,125 per family member.
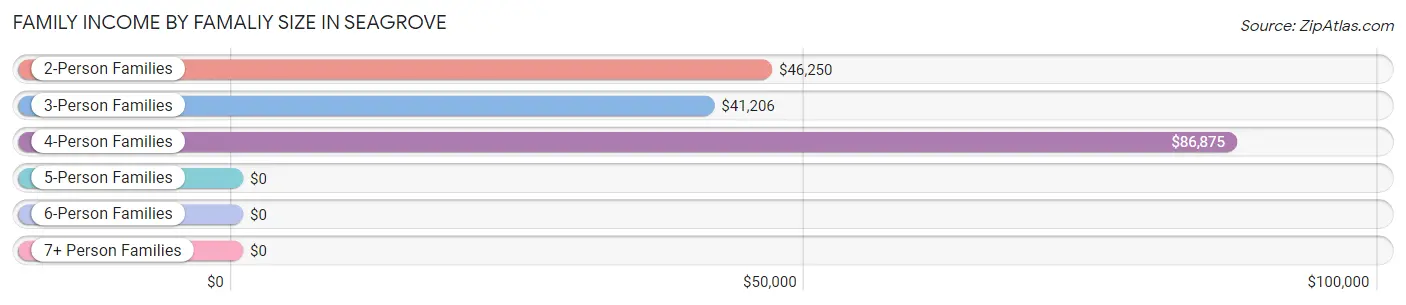
| Income Bracket | # Families | Median Income |
| 2-Person Families | 46 (37.1%) | $46,250 |
| 3-Person Families | 67 (54.0%) | $41,206 |
| 4-Person Families | 5 (4.0%) | $86,875 |
| 5-Person Families | 6 (4.8%) | $0 |
| 6-Person Families | 0 (0.0%) | $0 |
| 7+ Person Families | 0 (0.0%) | $0 |
| Total | 124 (100.0%) | $41,404 |
Family Income by Number of Earners in Seagrove
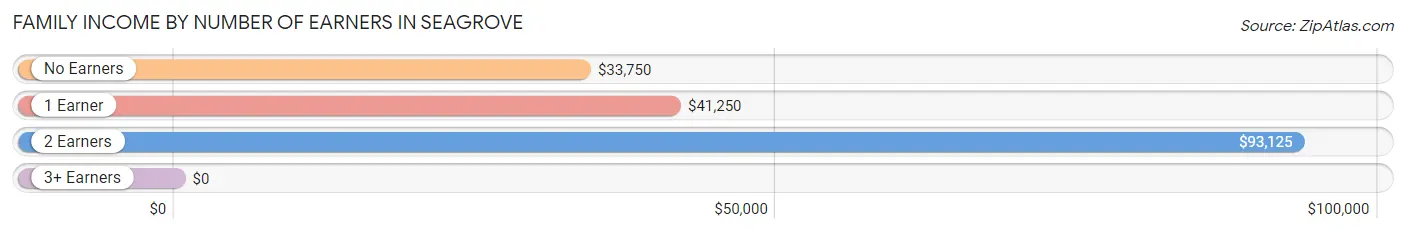
| Number of Earners | # Families | Median Income |
| No Earners | 22 (17.7%) | $33,750 |
| 1 Earner | 75 (60.5%) | $41,250 |
| 2 Earners | 23 (18.5%) | $93,125 |
| 3+ Earners | 4 (3.2%) | $0 |
| Total | 124 (100.0%) | $41,404 |
Household Income in Seagrove
Household Income Brackets in Seagrove
With 73 households falling in the category, the $50,000 to $74,999 income range is the most frequent in Seagrove, accounting for 45.6% of all households.
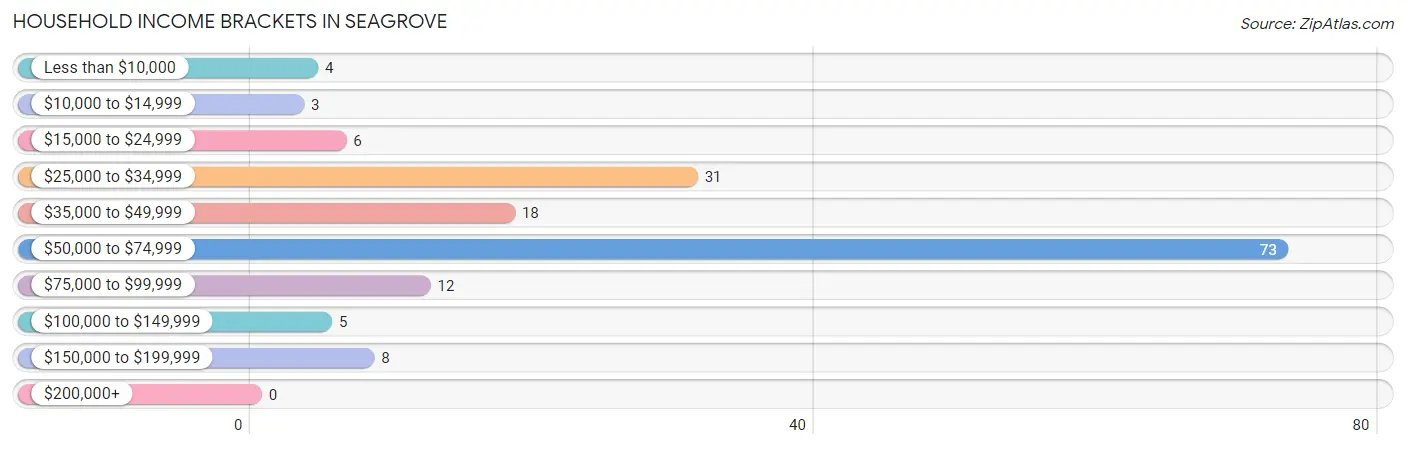
| Income Bracket | # Households | % Households |
| Less than $10,000 | 4 | 2.5% |
| $10,000 to $14,999 | 3 | 1.9% |
| $15,000 to $24,999 | 6 | 3.8% |
| $25,000 to $34,999 | 31 | 19.4% |
| $35,000 to $49,999 | 18 | 11.3% |
| $50,000 to $74,999 | 73 | 45.6% |
| $75,000 to $99,999 | 12 | 7.5% |
| $100,000 to $149,999 | 5 | 3.1% |
| $150,000 to $199,999 | 8 | 5.0% |
| $200,000+ | 0 | 0.0% |
Household Income by Householder Age in Seagrove
The median household income in Seagrove is $65,000, with the highest median household income of $71,297 found in the 25 to 44 years age bracket for the primary householder. A total of 73 households (45.6%) fall into this category. Meanwhile, the 15 to 24 years age bracket for the primary householder has the lowest median household income of $0, with 4 households (2.5%) in this group.
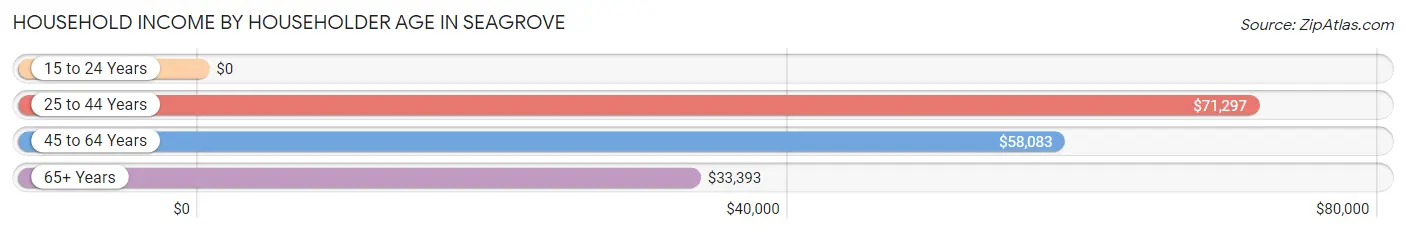
| Income Bracket | # Households | Median Income |
| 15 to 24 Years | 4 (2.5%) | $0 |
| 25 to 44 Years | 73 (45.6%) | $71,297 |
| 45 to 64 Years | 41 (25.6%) | $58,083 |
| 65+ Years | 42 (26.3%) | $33,393 |
| Total | 160 (100.0%) | $65,000 |
Poverty in Seagrove
Income Below Poverty by Sex and Age in Seagrove
With 5.0% poverty level for males and 6.6% for females among the residents of Seagrove, 16 and 17 year old males and 18 to 24 year old females are the most vulnerable to poverty, with 3 males (100.0%) and 3 females (33.3%) in their respective age groups living below the poverty level.
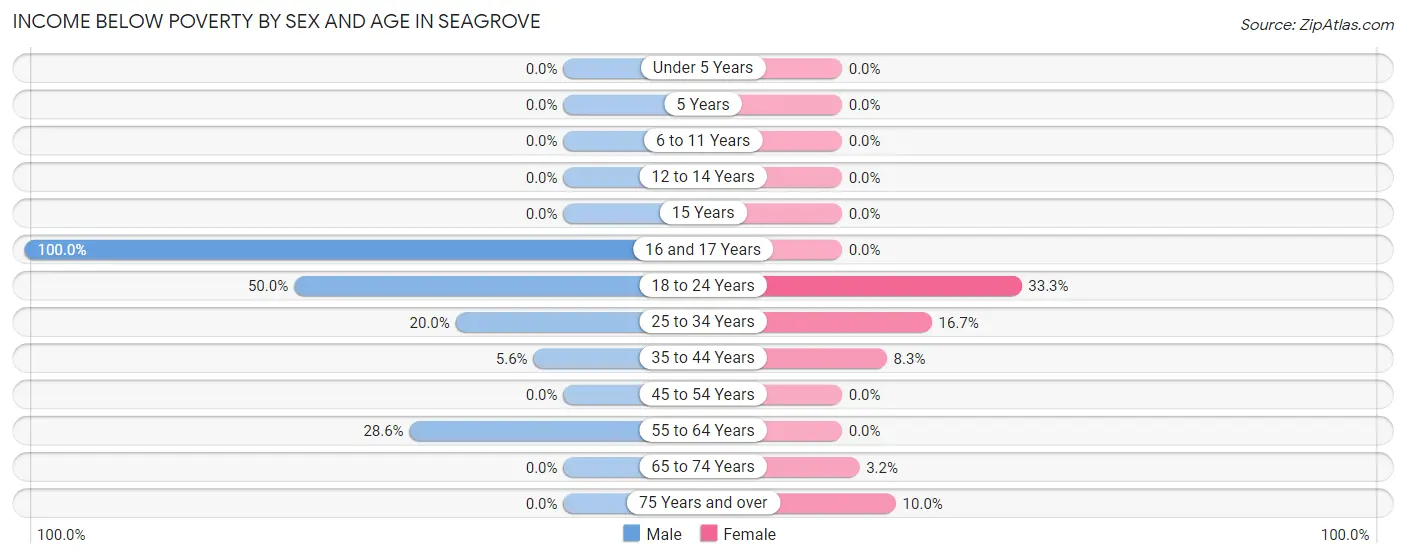
| Age Bracket | Male | Female |
| Under 5 Years | 0 (0.0%) | 0 (0.0%) |
| 5 Years | 0 (0.0%) | 0 (0.0%) |
| 6 to 11 Years | 0 (0.0%) | 0 (0.0%) |
| 12 to 14 Years | 0 (0.0%) | 0 (0.0%) |
| 15 Years | 0 (0.0%) | 0 (0.0%) |
| 16 and 17 Years | 3 (100.0%) | 0 (0.0%) |
| 18 to 24 Years | 1 (50.0%) | 3 (33.3%) |
| 25 to 34 Years | 2 (20.0%) | 2 (16.7%) |
| 35 to 44 Years | 4 (5.6%) | 4 (8.3%) |
| 45 to 54 Years | 0 (0.0%) | 0 (0.0%) |
| 55 to 64 Years | 2 (28.6%) | 0 (0.0%) |
| 65 to 74 Years | 0 (0.0%) | 1 (3.2%) |
| 75 Years and over | 0 (0.0%) | 1 (10.0%) |
| Total | 12 (5.0%) | 11 (6.6%) |
Income Above Poverty by Sex and Age in Seagrove
According to the poverty statistics in Seagrove, males aged under 5 years and females aged under 5 years are the age groups that are most secure financially, with 100.0% of males and 100.0% of females in these age groups living above the poverty line.
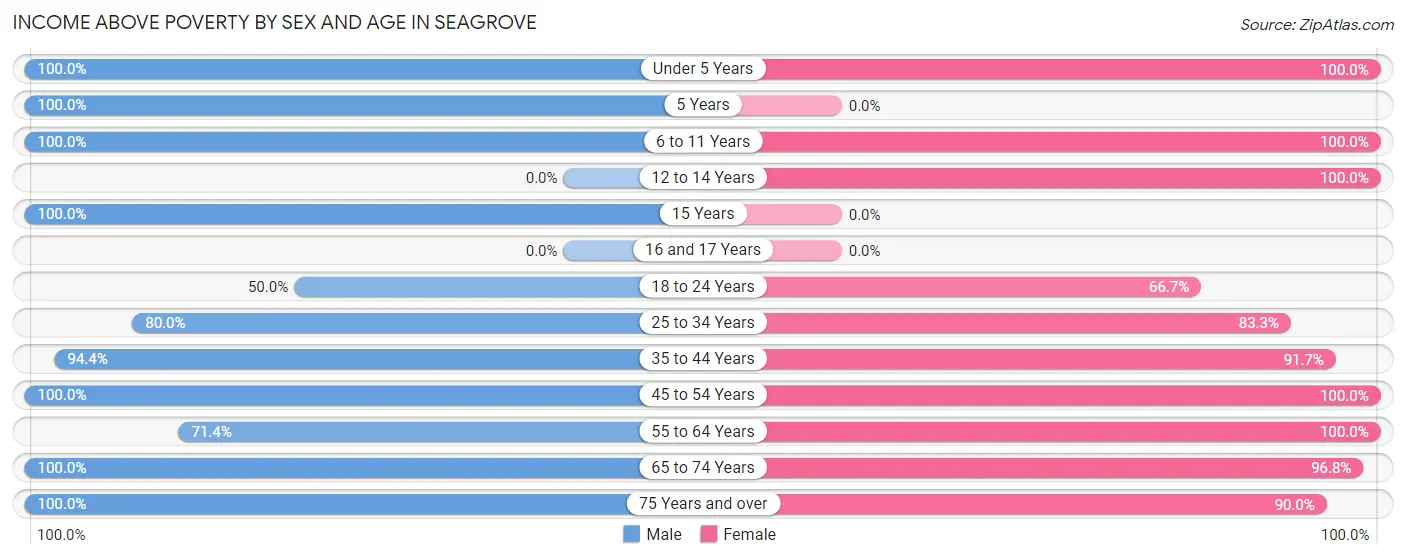
| Age Bracket | Male | Female |
| Under 5 Years | 16 (100.0%) | 8 (100.0%) |
| 5 Years | 2 (100.0%) | 0 (0.0%) |
| 6 to 11 Years | 83 (100.0%) | 4 (100.0%) |
| 12 to 14 Years | 0 (0.0%) | 2 (100.0%) |
| 15 Years | 2 (100.0%) | 0 (0.0%) |
| 16 and 17 Years | 0 (0.0%) | 0 (0.0%) |
| 18 to 24 Years | 1 (50.0%) | 6 (66.7%) |
| 25 to 34 Years | 8 (80.0%) | 10 (83.3%) |
| 35 to 44 Years | 68 (94.4%) | 44 (91.7%) |
| 45 to 54 Years | 12 (100.0%) | 21 (100.0%) |
| 55 to 64 Years | 5 (71.4%) | 21 (100.0%) |
| 65 to 74 Years | 23 (100.0%) | 30 (96.8%) |
| 75 Years and over | 6 (100.0%) | 9 (90.0%) |
| Total | 226 (95.0%) | 155 (93.4%) |
Income Below Poverty Among Married-Couple Families in Seagrove
The poverty statistics for married-couple families in Seagrove show that 3.1% or 2 of the total 64 families live below the poverty line. Families with no children have the highest poverty rate of 4.2%, comprising of 2 families. On the other hand, families with 1 or 2 children have the lowest poverty rate of 0.0%, which includes 0 families.
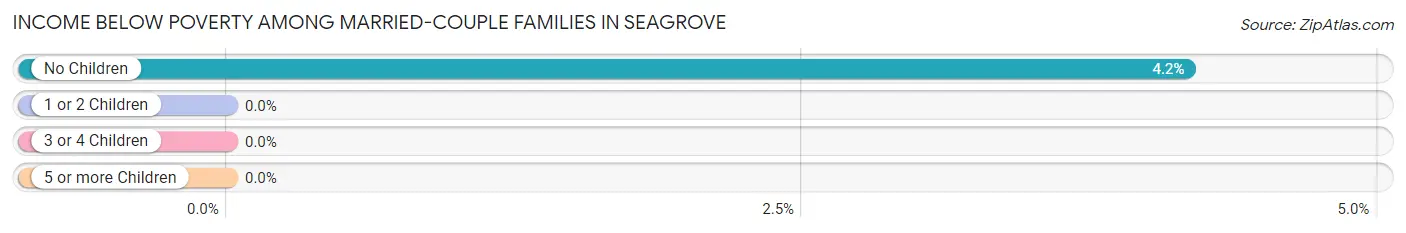
| Children | Above Poverty | Below Poverty |
| No Children | 46 (95.8%) | 2 (4.2%) |
| 1 or 2 Children | 10 (100.0%) | 0 (0.0%) |
| 3 or 4 Children | 6 (100.0%) | 0 (0.0%) |
| 5 or more Children | 0 (0.0%) | 0 (0.0%) |
| Total | 62 (96.9%) | 2 (3.1%) |
Income Below Poverty Among Single-Parent Households in Seagrove
According to the poverty data in Seagrove, 1.8% or 1 single-father households and 66.7% or 4 single-mother households are living below the poverty line. Among single-father households, those with no children have the highest poverty rate, with 1 households (100.0%) experiencing poverty. Likewise, among single-mother households, those with 1 or 2 children have the highest poverty rate, with 3 households (100.0%) falling below the poverty line.
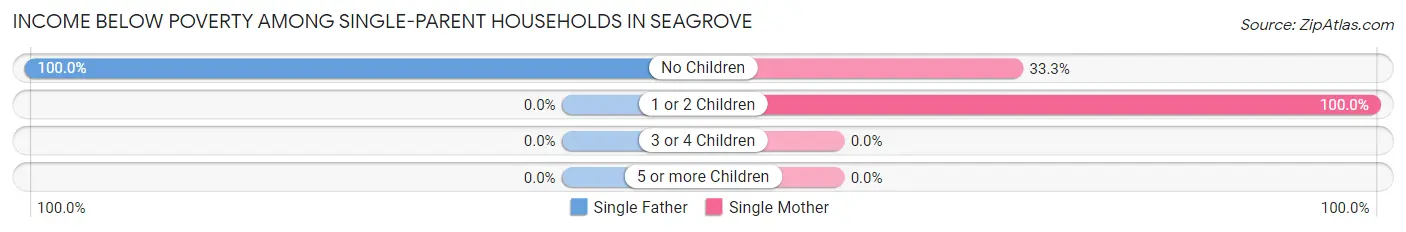
| Children | Single Father | Single Mother |
| No Children | 1 (100.0%) | 1 (33.3%) |
| 1 or 2 Children | 0 (0.0%) | 3 (100.0%) |
| 3 or 4 Children | 0 (0.0%) | 0 (0.0%) |
| 5 or more Children | 0 (0.0%) | 0 (0.0%) |
| Total | 1 (1.8%) | 4 (66.7%) |
Income Below Poverty Among Married-Couple vs Single-Parent Households in Seagrove
The poverty data for Seagrove shows that 2 of the married-couple family households (3.1%) and 5 of the single-parent households (8.3%) are living below the poverty level. Within the married-couple family households, those with no children have the highest poverty rate, with 2 households (4.2%) falling below the poverty line. Among the single-parent households, those with no children have the highest poverty rate, with 2 household (50.0%) living below poverty.
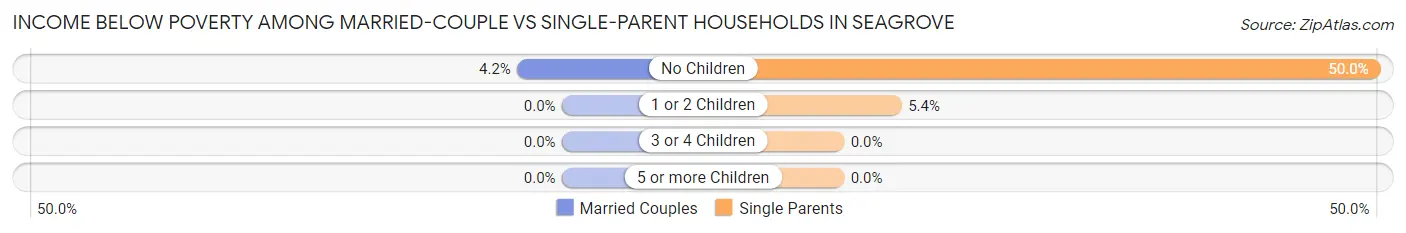
| Children | Married-Couple Families | Single-Parent Households |
| No Children | 2 (4.2%) | 2 (50.0%) |
| 1 or 2 Children | 0 (0.0%) | 3 (5.4%) |
| 3 or 4 Children | 0 (0.0%) | 0 (0.0%) |
| 5 or more Children | 0 (0.0%) | 0 (0.0%) |
| Total | 2 (3.1%) | 5 (8.3%) |
Race in Seagrove
The most populous races in Seagrove are White / Caucasian (383 | 94.6%), Two or more Races (21 | 5.2%), and Hispanic or Latino (17 | 4.2%).
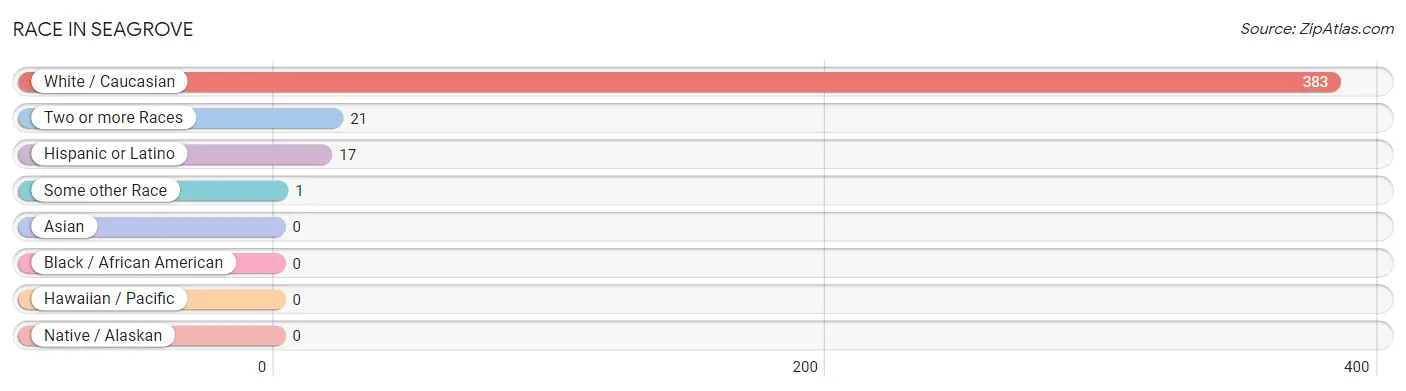
| Race | # Population | % Population |
| Asian | 0 | 0.0% |
| Black / African American | 0 | 0.0% |
| Hawaiian / Pacific | 0 | 0.0% |
| Hispanic or Latino | 17 | 4.2% |
| Native / Alaskan | 0 | 0.0% |
| White / Caucasian | 383 | 94.6% |
| Two or more Races | 21 | 5.2% |
| Some other Race | 1 | 0.3% |
| Total | 405 | 100.0% |
Ancestry in Seagrove
The most populous ancestries reported in Seagrove are German (182 | 44.9%), Irish (77 | 19.0%), English (42 | 10.4%), British (15 | 3.7%), and Cherokee (13 | 3.2%), together accounting for 81.2% of all Seagrove residents.
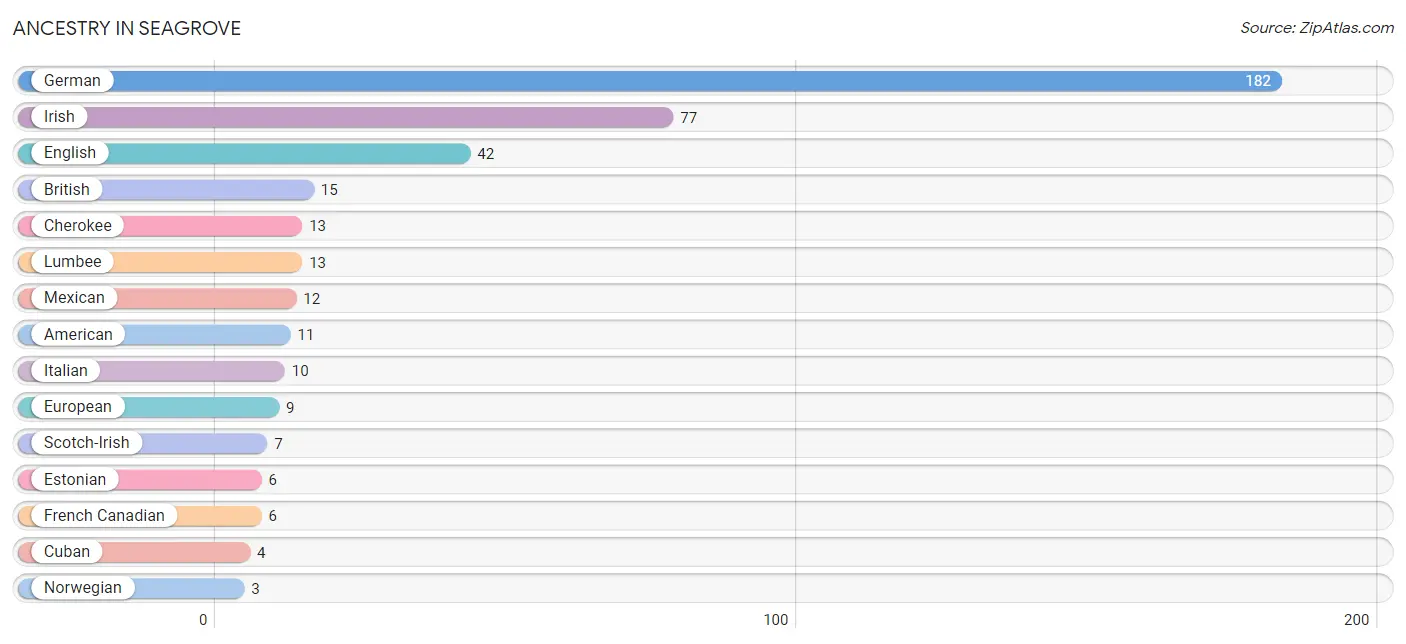
| Ancestry | # Population | % Population |
| American | 11 | 2.7% |
| British | 15 | 3.7% |
| Cherokee | 13 | 3.2% |
| Cuban | 4 | 1.0% |
| Danish | 2 | 0.5% |
| English | 42 | 10.4% |
| Estonian | 6 | 1.5% |
| European | 9 | 2.2% |
| French | 2 | 0.5% |
| French Canadian | 6 | 1.5% |
| German | 182 | 44.9% |
| Irish | 77 | 19.0% |
| Italian | 10 | 2.5% |
| Lumbee | 13 | 3.2% |
| Mexican | 12 | 3.0% |
| Northern European | 2 | 0.5% |
| Norwegian | 3 | 0.7% |
| Scotch-Irish | 7 | 1.7% |
| Scottish | 2 | 0.5% |
| Slovak | 2 | 0.5% |
| Spanish | 1 | 0.3% |
| Swedish | 1 | 0.3% |
| Swiss | 2 | 0.5% |
| Welsh | 2 | 0.5% | View All 24 Rows |
Immigrants in Seagrove
The most numerous immigrant groups reported in Seagrove came from Central America (5 | 1.2%), Latin America (5 | 1.2%), Mexico (5 | 1.2%), Eastern Europe (3 | 0.7%), and Europe (3 | 0.7%), together accounting for 5.2% of all Seagrove residents.
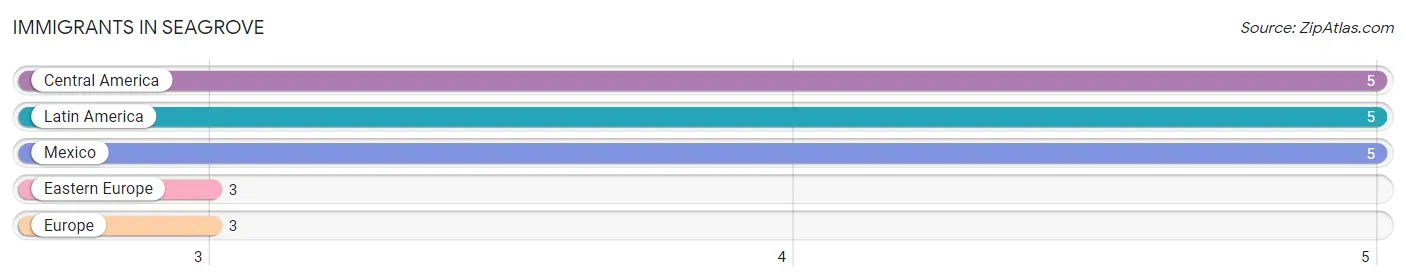
| Immigration Origin | # Population | % Population |
| Central America | 5 | 1.2% |
| Eastern Europe | 3 | 0.7% |
| Europe | 3 | 0.7% |
| Latin America | 5 | 1.2% |
| Mexico | 5 | 1.2% | View All 5 Rows |
Sex and Age in Seagrove
Sex and Age in Seagrove
The most populous age groups in Seagrove are 35 to 39 Years (62 | 25.9%) for men and 35 to 39 Years (44 | 26.5%) for women.
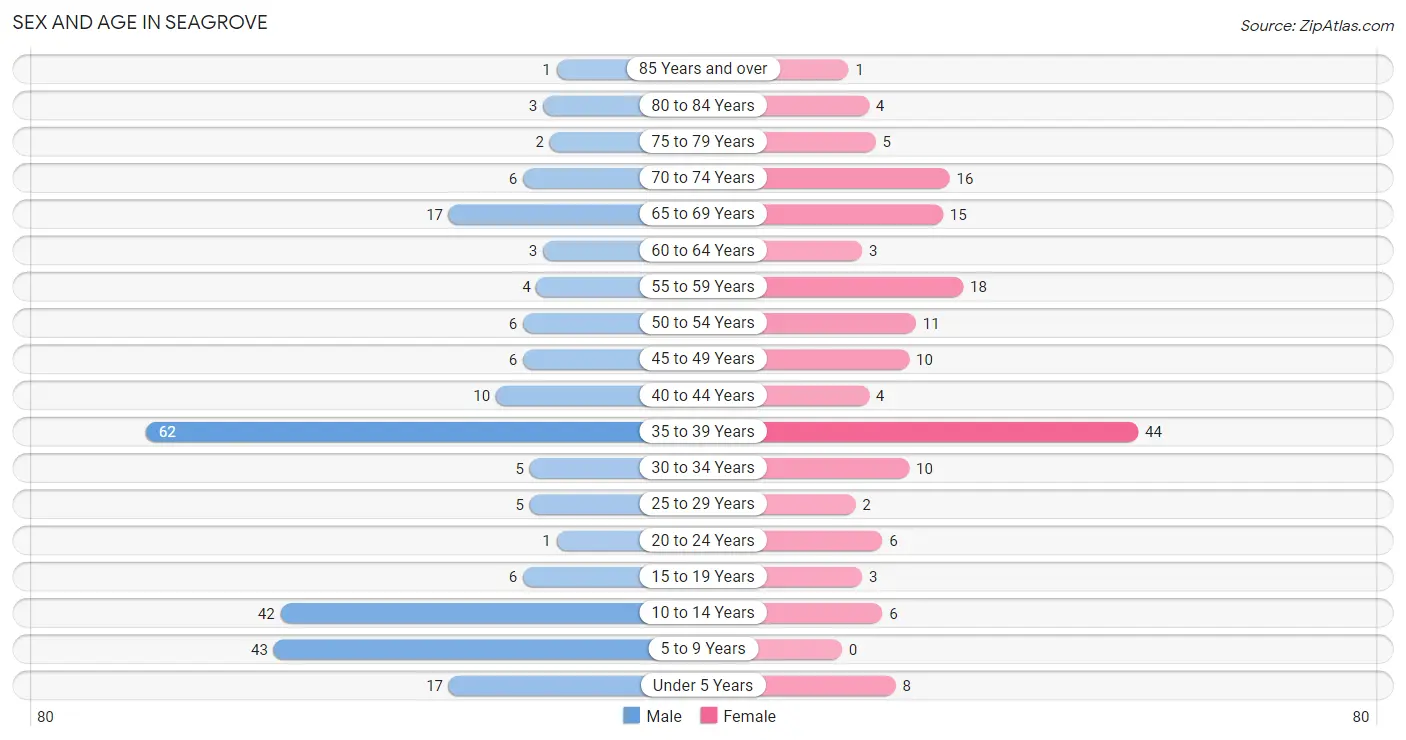
| Age Bracket | Male | Female |
| Under 5 Years | 17 (7.1%) | 8 (4.8%) |
| 5 to 9 Years | 43 (18.0%) | 0 (0.0%) |
| 10 to 14 Years | 42 (17.6%) | 6 (3.6%) |
| 15 to 19 Years | 6 (2.5%) | 3 (1.8%) |
| 20 to 24 Years | 1 (0.4%) | 6 (3.6%) |
| 25 to 29 Years | 5 (2.1%) | 2 (1.2%) |
| 30 to 34 Years | 5 (2.1%) | 10 (6.0%) |
| 35 to 39 Years | 62 (25.9%) | 44 (26.5%) |
| 40 to 44 Years | 10 (4.2%) | 4 (2.4%) |
| 45 to 49 Years | 6 (2.5%) | 10 (6.0%) |
| 50 to 54 Years | 6 (2.5%) | 11 (6.6%) |
| 55 to 59 Years | 4 (1.7%) | 18 (10.8%) |
| 60 to 64 Years | 3 (1.3%) | 3 (1.8%) |
| 65 to 69 Years | 17 (7.1%) | 15 (9.0%) |
| 70 to 74 Years | 6 (2.5%) | 16 (9.6%) |
| 75 to 79 Years | 2 (0.8%) | 5 (3.0%) |
| 80 to 84 Years | 3 (1.3%) | 4 (2.4%) |
| 85 Years and over | 1 (0.4%) | 1 (0.6%) |
| Total | 239 (100.0%) | 166 (100.0%) |
Families and Households in Seagrove
Median Family Size in Seagrove
The median family size in Seagrove is 2.63 persons per family, with married-couple families (64 | 51.6%) accounting for the largest median family size of 2.67 persons per family. On the other hand, single female/mother families (6 | 4.8%) represent the smallest median family size with 2.33 persons per family.
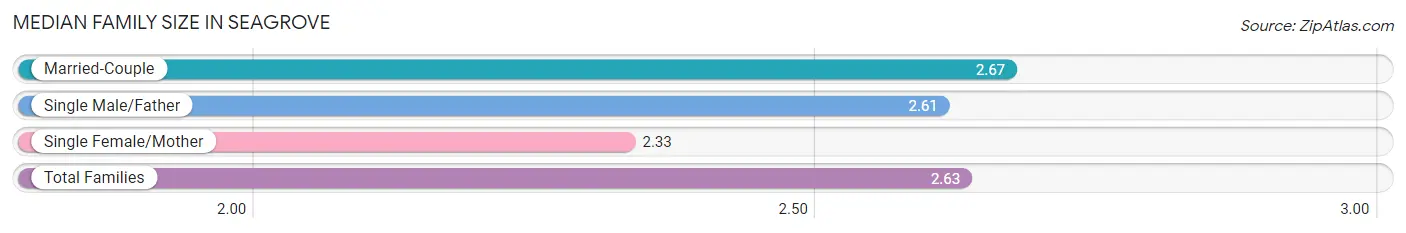
| Family Type | # Families | Family Size |
| Married-Couple | 64 (51.6%) | 2.67 |
| Single Male/Father | 54 (43.5%) | 2.61 |
| Single Female/Mother | 6 (4.8%) | 2.33 |
| Total Families | 124 (100.0%) | 2.63 |
Median Household Size in Seagrove
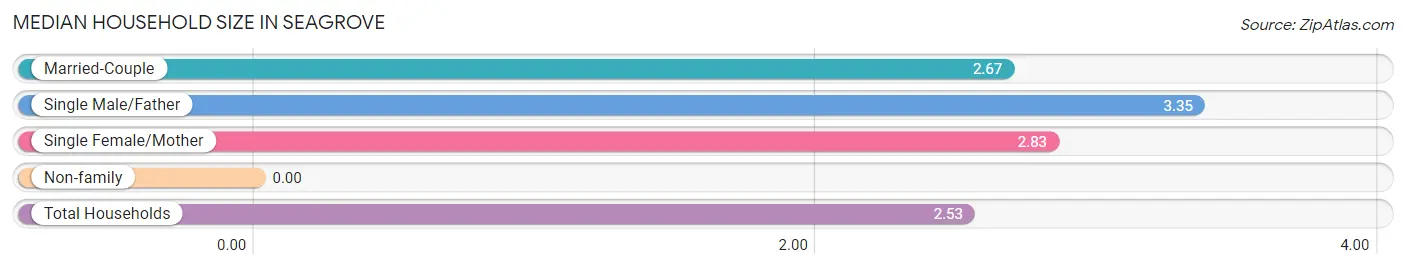
| Household Type | # Households | Household Size |
| Married-Couple | 64 (40.0%) | 2.67 |
| Single Male/Father | 54 (33.8%) | 3.35 |
| Single Female/Mother | 6 (3.7%) | 2.83 |
| Non-family | 36 (22.5%) | - |
| Total Households | 160 (100.0%) | 2.53 |
Household Size by Marriage Status in Seagrove
Out of a total of 160 households in Seagrove, 124 (77.5%) are family households, while 36 (22.5%) are nonfamily households. The most numerous type of family households are 4-person households, comprising 58, and the most common type of nonfamily households are 1-person households, comprising 36.
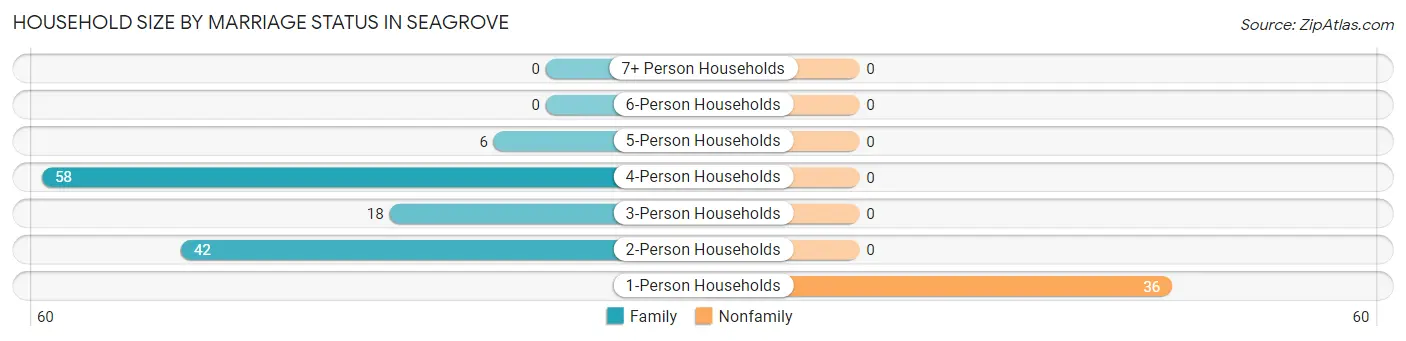
| Household Size | Family Households | Nonfamily Households |
| 1-Person Households | - | 36 (22.5%) |
| 2-Person Households | 42 (26.3%) | 0 (0.0%) |
| 3-Person Households | 18 (11.3%) | 0 (0.0%) |
| 4-Person Households | 58 (36.2%) | 0 (0.0%) |
| 5-Person Households | 6 (3.7%) | 0 (0.0%) |
| 6-Person Households | 0 (0.0%) | 0 (0.0%) |
| 7+ Person Households | 0 (0.0%) | 0 (0.0%) |
| Total | 124 (77.5%) | 36 (22.5%) |
Female Fertility in Seagrove
Fertility by Age in Seagrove
Average fertility rate in Seagrove is 51.0 births per 1,000 women. Women in the age bracket of 20 to 34 years have the highest fertility rate with 222.0 births per 1,000 women. Women in the age bracket of 20 to 34 years acount for 100.0% of all women with births.
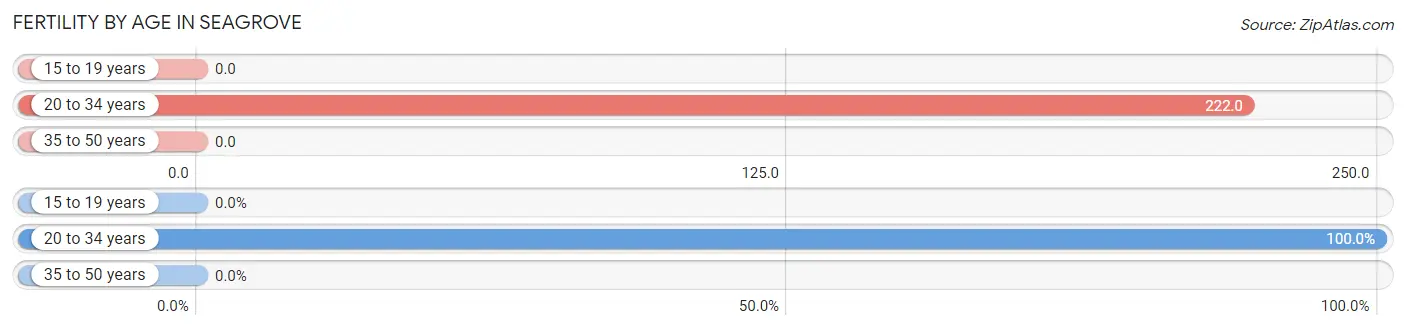
| Age Bracket | Women with Births | Births / 1,000 Women |
| 15 to 19 years | 0 (0.0%) | 0.0 |
| 20 to 34 years | 4 (100.0%) | 222.0 |
| 35 to 50 years | 0 (0.0%) | 0.0 |
| Total | 4 (100.0%) | 51.0 |
Fertility by Age by Marriage Status in Seagrove
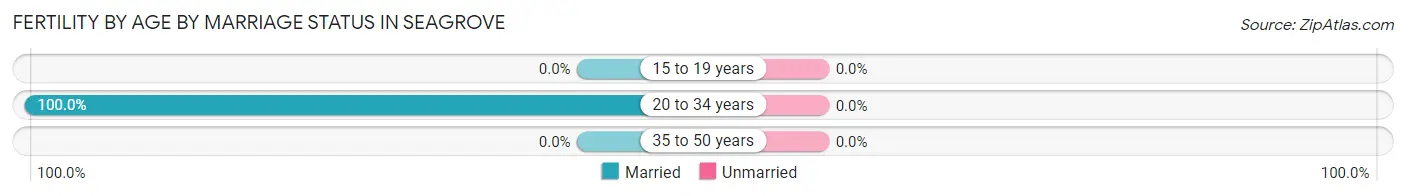
| Age Bracket | Married | Unmarried |
| 15 to 19 years | 0 (0.0%) | 0 (0.0%) |
| 20 to 34 years | 4 (100.0%) | 0 (0.0%) |
| 35 to 50 years | 0 (0.0%) | 0 (0.0%) |
| Total | 4 (100.0%) | 0 (0.0%) |
Fertility by Education in Seagrove
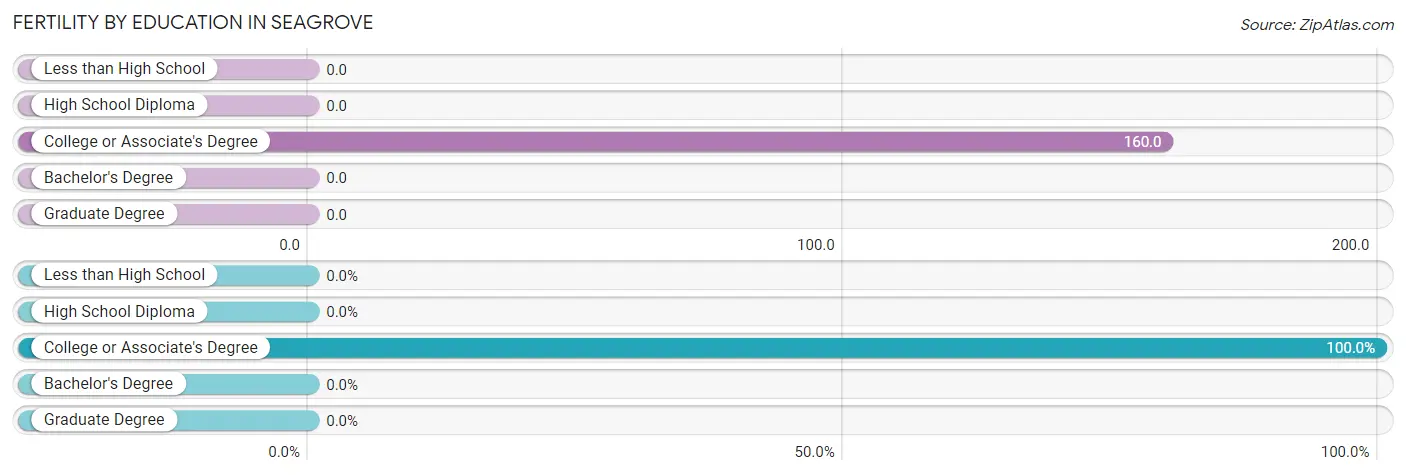
| Educational Attainment | Women with Births | Births / 1,000 Women |
| Less than High School | 0 (0.0%) | 0.0 |
| High School Diploma | 0 (0.0%) | 0.0 |
| College or Associate's Degree | 4 (100.0%) | 160.0 |
| Bachelor's Degree | 0 (0.0%) | 0.0 |
| Graduate Degree | 0 (0.0%) | 0.0 |
| Total | 4 (100.0%) | 51.0 |
Fertility by Education by Marriage Status in Seagrove
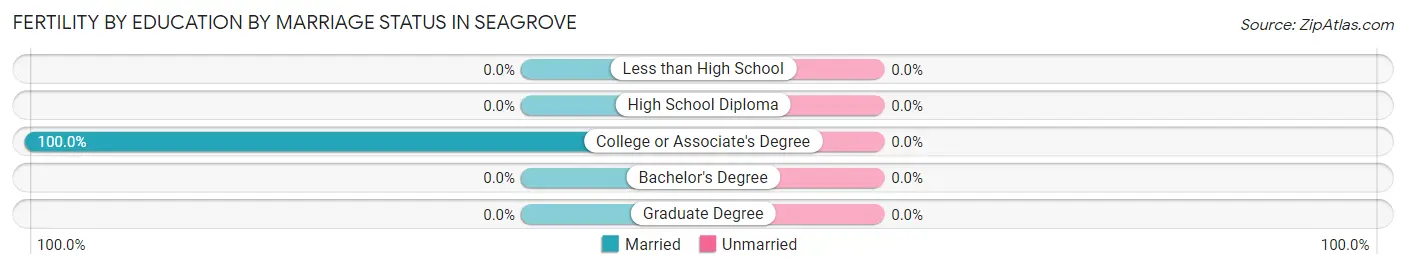
| Educational Attainment | Married | Unmarried |
| Less than High School | 0 (0.0%) | 0 (0.0%) |
| High School Diploma | 0 (0.0%) | 0 (0.0%) |
| College or Associate's Degree | 4 (100.0%) | 0 (0.0%) |
| Bachelor's Degree | 0 (0.0%) | 0 (0.0%) |
| Graduate Degree | 0 (0.0%) | 0 (0.0%) |
| Total | 4 (100.0%) | 0 (0.0%) |
Employment Characteristics in Seagrove
Employment by Class of Employer in Seagrove
Among the 188 employed individuals in Seagrove, private company employees (104 | 55.3%), state government employees (61 | 32.5%), and self-employed (not incorporated) (8 | 4.3%) make up the most common classes of employment.
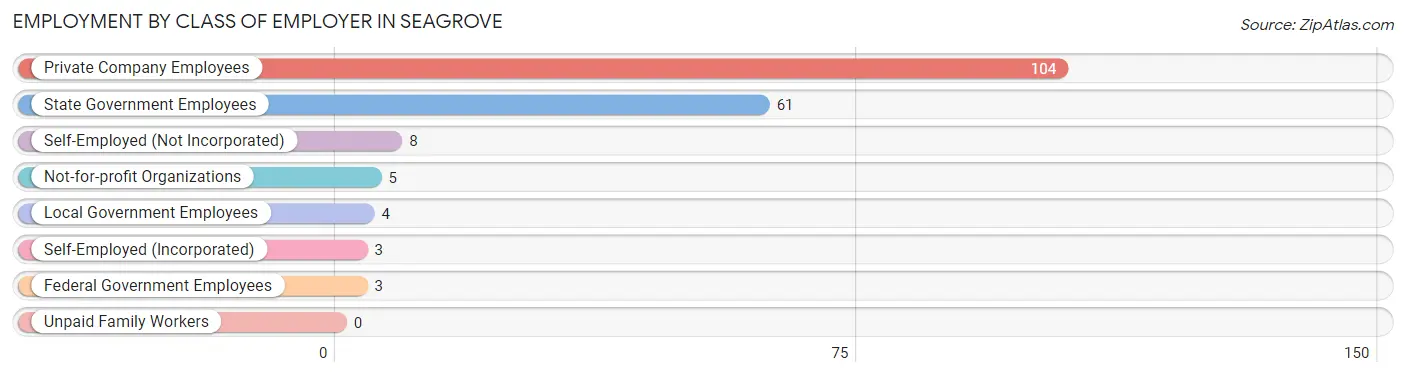
| Employer Class | # Employees | % Employees |
| Private Company Employees | 104 | 55.3% |
| Self-Employed (Incorporated) | 3 | 1.6% |
| Self-Employed (Not Incorporated) | 8 | 4.3% |
| Not-for-profit Organizations | 5 | 2.7% |
| Local Government Employees | 4 | 2.1% |
| State Government Employees | 61 | 32.5% |
| Federal Government Employees | 3 | 1.6% |
| Unpaid Family Workers | 0 | 0.0% |
| Total | 188 | 100.0% |
Employment Status by Age in Seagrove
According to the labor force statistics for Seagrove, out of the total population over 16 years of age (287), 69.7% or 200 individuals are in the labor force, with 5.5% or 11 of them unemployed. The age group with the highest labor force participation rate is 20 to 24 years, with 100.0% or 7 individuals in the labor force. Within the labor force, the 30 to 34 years age range has the highest percentage of unemployed individuals, with 57.1% or 4 of them being unemployed.
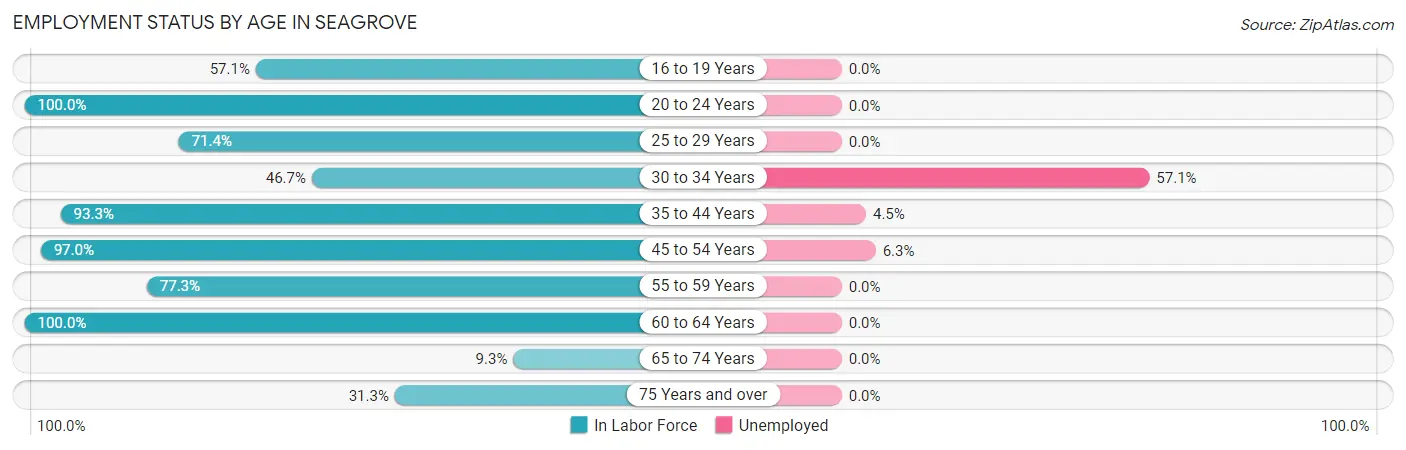
| Age Bracket | In Labor Force | Unemployed |
| 16 to 19 Years | 4 (57.1%) | 0 (0.0%) |
| 20 to 24 Years | 7 (100.0%) | 0 (0.0%) |
| 25 to 29 Years | 5 (71.4%) | 0 (0.0%) |
| 30 to 34 Years | 7 (46.7%) | 4 (57.1%) |
| 35 to 44 Years | 112 (93.3%) | 5 (4.5%) |
| 45 to 54 Years | 32 (97.0%) | 2 (6.3%) |
| 55 to 59 Years | 17 (77.3%) | 0 (0.0%) |
| 60 to 64 Years | 6 (100.0%) | 0 (0.0%) |
| 65 to 74 Years | 5 (9.3%) | 0 (0.0%) |
| 75 Years and over | 5 (31.3%) | 0 (0.0%) |
| Total | 200 (69.7%) | 11 (5.5%) |
Employment Status by Educational Attainment in Seagrove
According to labor force statistics for Seagrove, 88.2% of individuals (179) out of the total population between 25 and 64 years of age (203) are in the labor force, with 6.1% or 11 of them being unemployed. The group with the highest labor force participation rate are those with the educational attainment of less than high school, with 100.0% or 7 individuals in the labor force. Within the labor force, individuals with less than high school education have the highest percentage of unemployment, with 14.3% or 1 of them being unemployed.
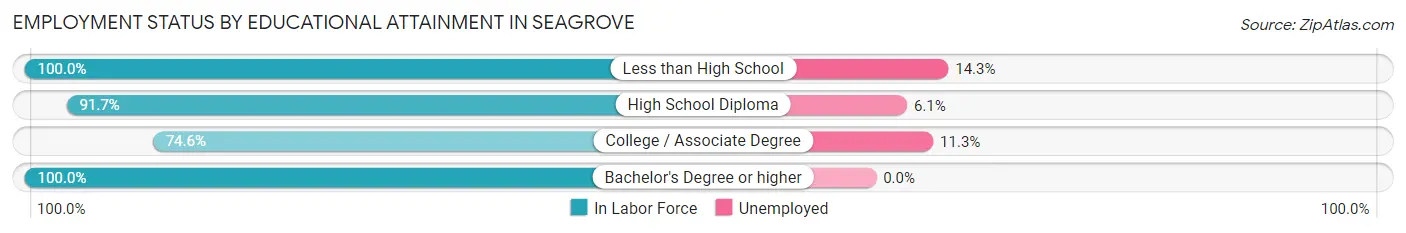
| Educational Attainment | In Labor Force | Unemployed |
| Less than High School | 7 (100.0%) | 1 (14.3%) |
| High School Diploma | 66 (91.7%) | 4 (6.1%) |
| College / Associate Degree | 53 (74.6%) | 8 (11.3%) |
| Bachelor's Degree or higher | 53 (100.0%) | 0 (0.0%) |
| Total | 179 (88.2%) | 12 (6.1%) |
Employment Occupations by Sex in Seagrove
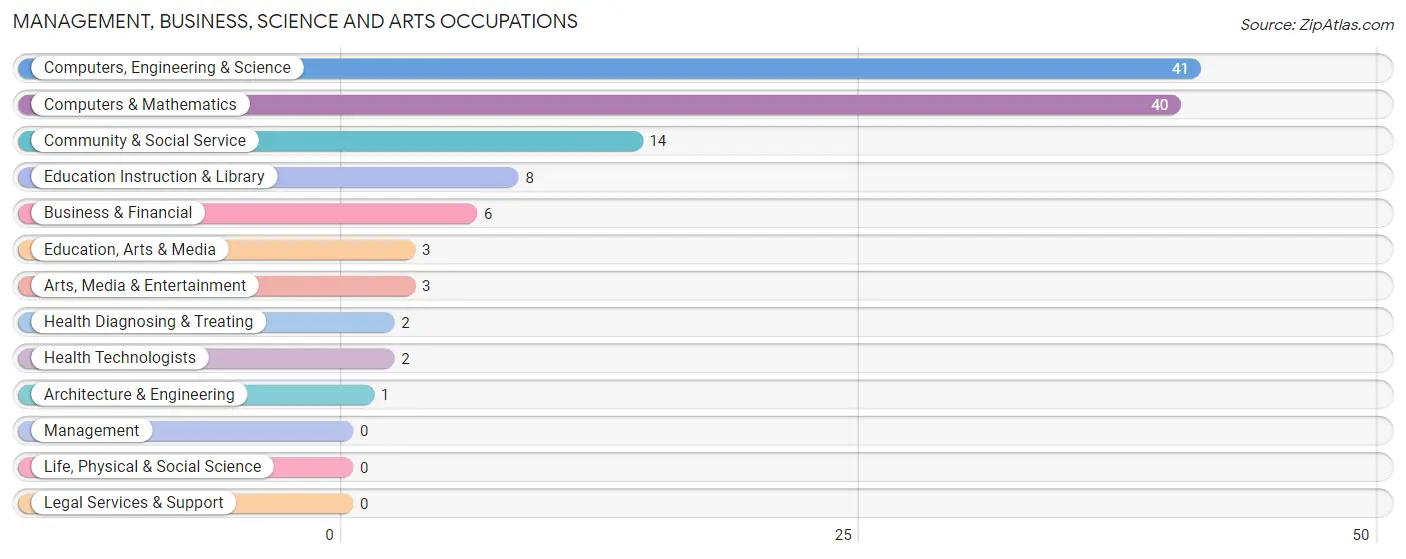
Management, Business, Science and Arts Occupations
The most common Management, Business, Science and Arts occupations in Seagrove are Computers, Engineering & Science (41 | 21.8%), Computers & Mathematics (40 | 21.3%), Community & Social Service (14 | 7.4%), Education Instruction & Library (8 | 4.3%), and Business & Financial (6 | 3.2%).
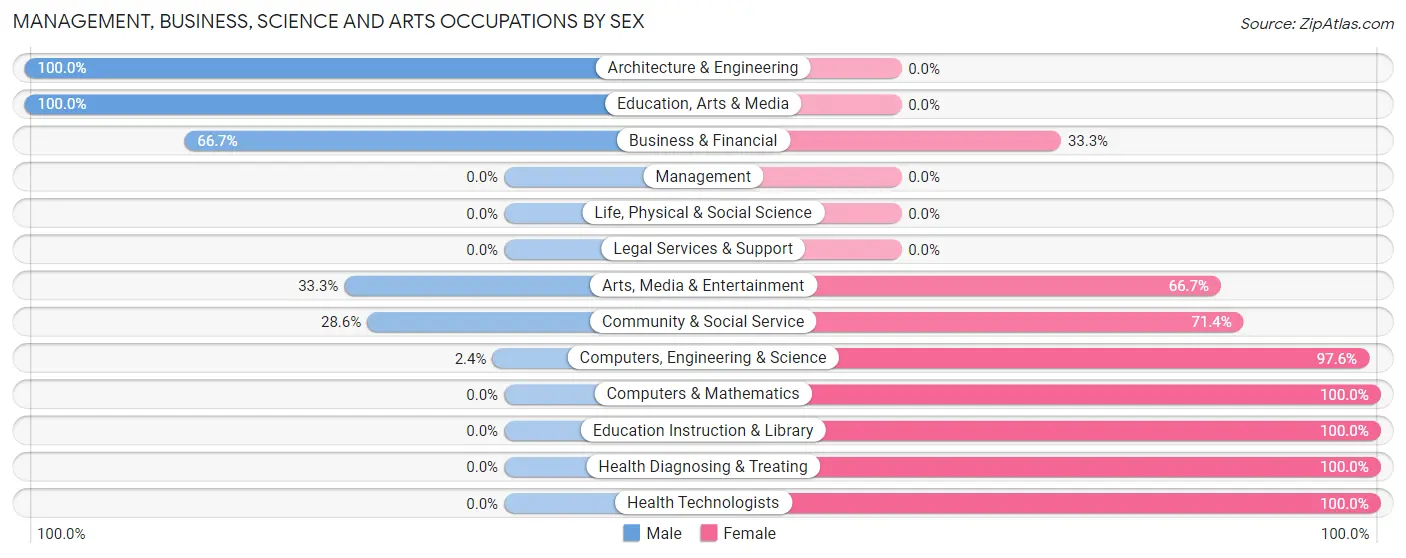
Management, Business, Science and Arts Occupations by Sex
Within the Management, Business, Science and Arts occupations in Seagrove, the most male-oriented occupations are Architecture & Engineering (100.0%), Education, Arts & Media (100.0%), and Business & Financial (66.7%), while the most female-oriented occupations are Computers & Mathematics (100.0%), Education Instruction & Library (100.0%), and Health Diagnosing & Treating (100.0%).
| Occupation | Male | Female |
| Management | 0 (0.0%) | 0 (0.0%) |
| Business & Financial | 4 (66.7%) | 2 (33.3%) |
| Computers, Engineering & Science | 1 (2.4%) | 40 (97.6%) |
| Computers & Mathematics | 0 (0.0%) | 40 (100.0%) |
| Architecture & Engineering | 1 (100.0%) | 0 (0.0%) |
| Life, Physical & Social Science | 0 (0.0%) | 0 (0.0%) |
| Community & Social Service | 4 (28.6%) | 10 (71.4%) |
| Education, Arts & Media | 3 (100.0%) | 0 (0.0%) |
| Legal Services & Support | 0 (0.0%) | 0 (0.0%) |
| Education Instruction & Library | 0 (0.0%) | 8 (100.0%) |
| Arts, Media & Entertainment | 1 (33.3%) | 2 (66.7%) |
| Health Diagnosing & Treating | 0 (0.0%) | 2 (100.0%) |
| Health Technologists | 0 (0.0%) | 2 (100.0%) |
| Total (Category) | 9 (14.3%) | 54 (85.7%) |
| Total (Overall) | 91 (48.4%) | 97 (51.6%) |
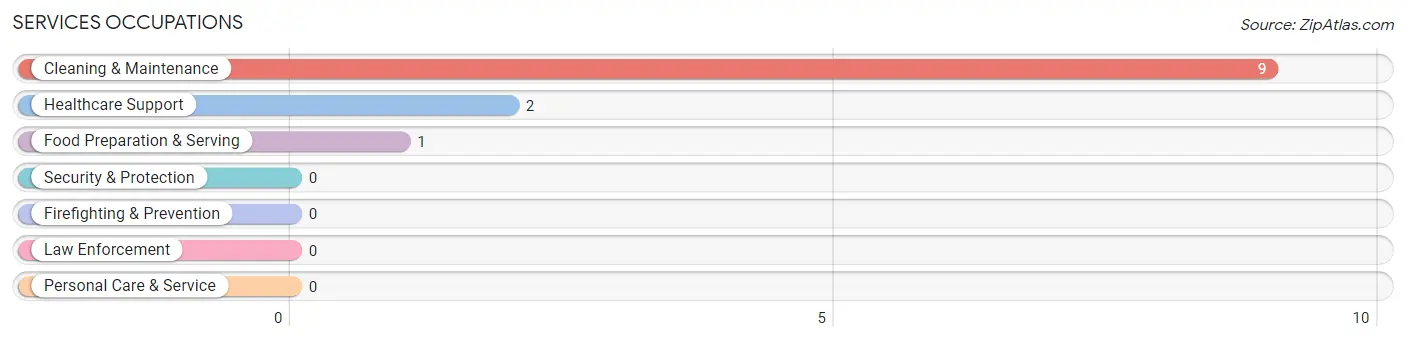
Services Occupations
The most common Services occupations in Seagrove are Cleaning & Maintenance (9 | 4.8%), Healthcare Support (2 | 1.1%), and Food Preparation & Serving (1 | 0.5%).
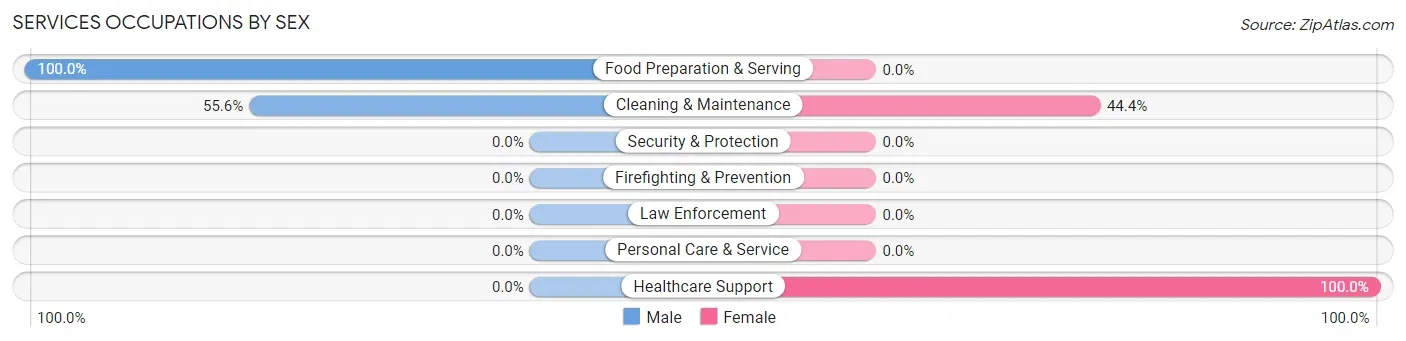
Services Occupations by Sex
Within the Services occupations in Seagrove, the most male-oriented occupations are Food Preparation & Serving (100.0%), and Cleaning & Maintenance (55.6%), while the most female-oriented occupations are Healthcare Support (100.0%), and Cleaning & Maintenance (44.4%).
| Occupation | Male | Female |
| Healthcare Support | 0 (0.0%) | 2 (100.0%) |
| Security & Protection | 0 (0.0%) | 0 (0.0%) |
| Firefighting & Prevention | 0 (0.0%) | 0 (0.0%) |
| Law Enforcement | 0 (0.0%) | 0 (0.0%) |
| Food Preparation & Serving | 1 (100.0%) | 0 (0.0%) |
| Cleaning & Maintenance | 5 (55.6%) | 4 (44.4%) |
| Personal Care & Service | 0 (0.0%) | 0 (0.0%) |
| Total (Category) | 6 (50.0%) | 6 (50.0%) |
| Total (Overall) | 91 (48.4%) | 97 (51.6%) |
Sales and Office Occupations
The most common Sales and Office occupations in Seagrove are Office & Administration (10 | 5.3%), and Sales & Related (3 | 1.6%).
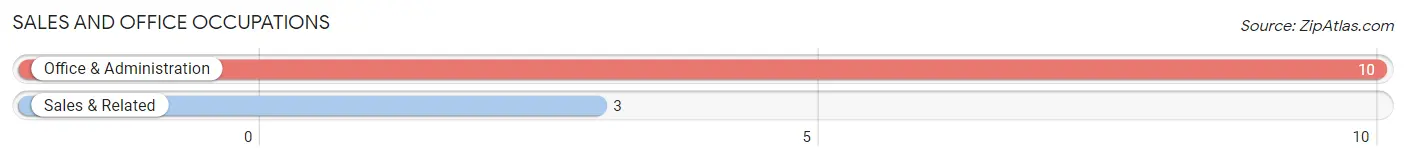
Sales and Office Occupations by Sex
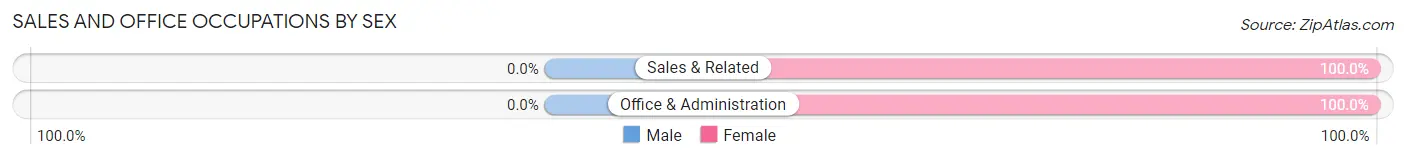
| Occupation | Male | Female |
| Sales & Related | 0 (0.0%) | 3 (100.0%) |
| Office & Administration | 0 (0.0%) | 10 (100.0%) |
| Total (Category) | 0 (0.0%) | 13 (100.0%) |
| Total (Overall) | 91 (48.4%) | 97 (51.6%) |
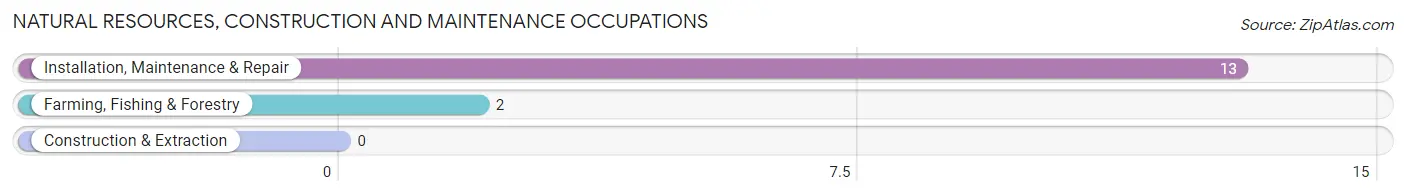
Natural Resources, Construction and Maintenance Occupations
The most common Natural Resources, Construction and Maintenance occupations in Seagrove are Installation, Maintenance & Repair (13 | 6.9%), and Farming, Fishing & Forestry (2 | 1.1%).
Natural Resources, Construction and Maintenance Occupations by Sex
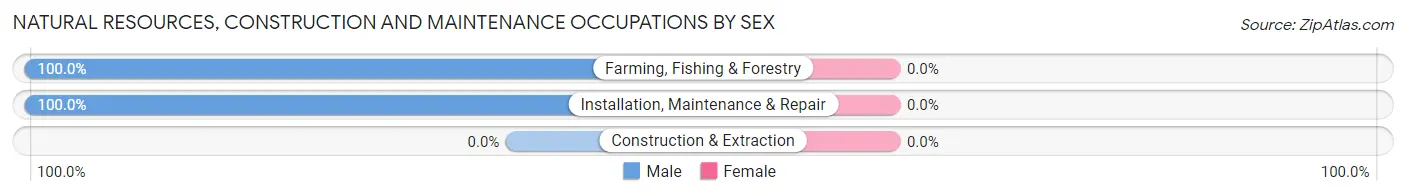
| Occupation | Male | Female |
| Farming, Fishing & Forestry | 2 (100.0%) | 0 (0.0%) |
| Construction & Extraction | 0 (0.0%) | 0 (0.0%) |
| Installation, Maintenance & Repair | 13 (100.0%) | 0 (0.0%) |
| Total (Category) | 15 (100.0%) | 0 (0.0%) |
| Total (Overall) | 91 (48.4%) | 97 (51.6%) |
Production, Transportation and Moving Occupations
The most common Production, Transportation and Moving occupations in Seagrove are Transportation (53 | 28.2%), and Production (32 | 17.0%).
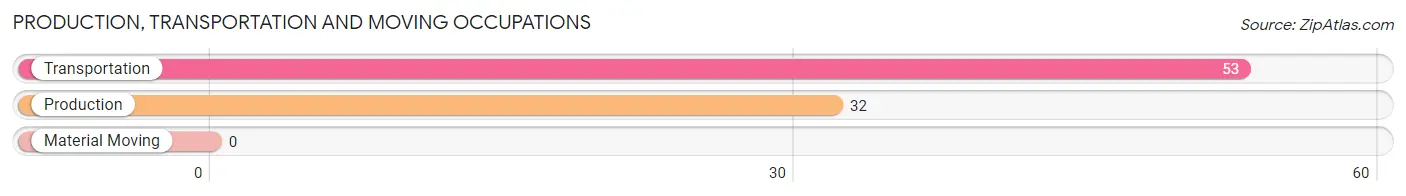
Production, Transportation and Moving Occupations by Sex
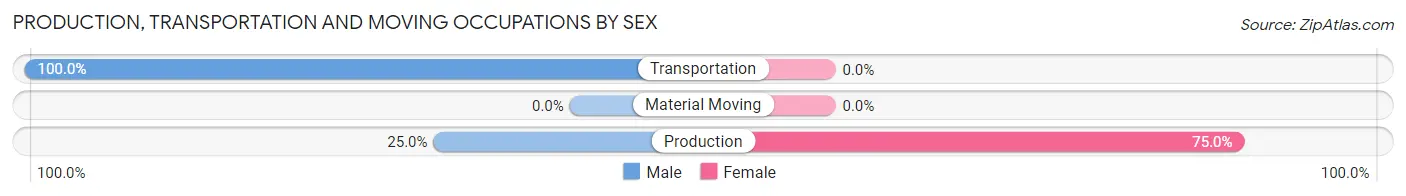
| Occupation | Male | Female |
| Production | 8 (25.0%) | 24 (75.0%) |
| Transportation | 53 (100.0%) | 0 (0.0%) |
| Material Moving | 0 (0.0%) | 0 (0.0%) |
| Total (Category) | 61 (71.8%) | 24 (28.2%) |
| Total (Overall) | 91 (48.4%) | 97 (51.6%) |
Employment Industries by Sex in Seagrove
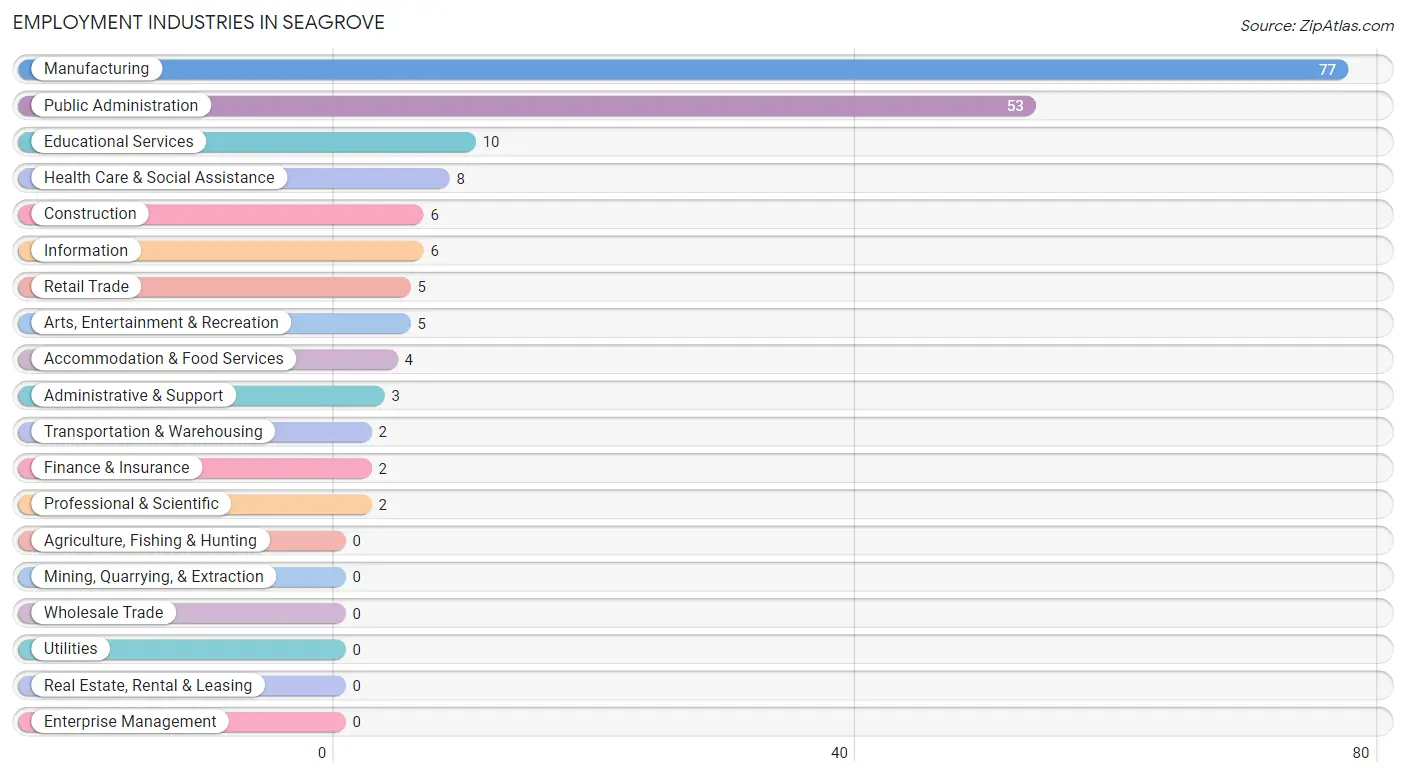
Employment Industries in Seagrove
The major employment industries in Seagrove include Manufacturing (77 | 41.0%), Public Administration (53 | 28.2%), Educational Services (10 | 5.3%), Health Care & Social Assistance (8 | 4.3%), and Construction (6 | 3.2%).
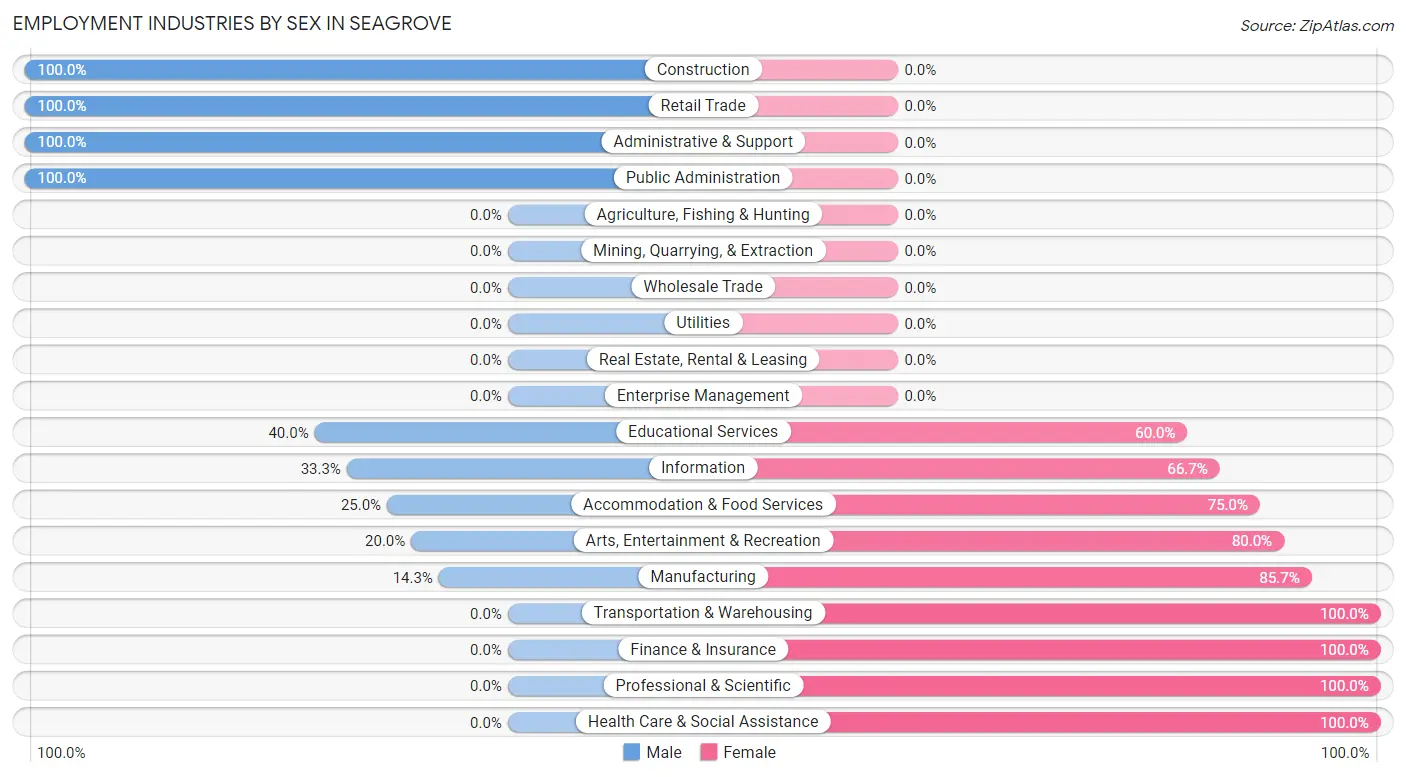
Employment Industries by Sex in Seagrove
The Seagrove industries that see more men than women are Construction (100.0%), Retail Trade (100.0%), and Administrative & Support (100.0%), whereas the industries that tend to have a higher number of women are Transportation & Warehousing (100.0%), Finance & Insurance (100.0%), and Professional & Scientific (100.0%).
| Industry | Male | Female |
| Agriculture, Fishing & Hunting | 0 (0.0%) | 0 (0.0%) |
| Mining, Quarrying, & Extraction | 0 (0.0%) | 0 (0.0%) |
| Construction | 6 (100.0%) | 0 (0.0%) |
| Manufacturing | 11 (14.3%) | 66 (85.7%) |
| Wholesale Trade | 0 (0.0%) | 0 (0.0%) |
| Retail Trade | 5 (100.0%) | 0 (0.0%) |
| Transportation & Warehousing | 0 (0.0%) | 2 (100.0%) |
| Utilities | 0 (0.0%) | 0 (0.0%) |
| Information | 2 (33.3%) | 4 (66.7%) |
| Finance & Insurance | 0 (0.0%) | 2 (100.0%) |
| Real Estate, Rental & Leasing | 0 (0.0%) | 0 (0.0%) |
| Professional & Scientific | 0 (0.0%) | 2 (100.0%) |
| Enterprise Management | 0 (0.0%) | 0 (0.0%) |
| Administrative & Support | 3 (100.0%) | 0 (0.0%) |
| Educational Services | 4 (40.0%) | 6 (60.0%) |
| Health Care & Social Assistance | 0 (0.0%) | 8 (100.0%) |
| Arts, Entertainment & Recreation | 1 (20.0%) | 4 (80.0%) |
| Accommodation & Food Services | 1 (25.0%) | 3 (75.0%) |
| Public Administration | 53 (100.0%) | 0 (0.0%) |
| Total | 91 (48.4%) | 97 (51.6%) |
Education in Seagrove
School Enrollment in Seagrove
The most common levels of schooling among the 100 students in Seagrove are middle school (48 | 48.0%), elementary school (41 | 41.0%), and high school (5 | 5.0%).
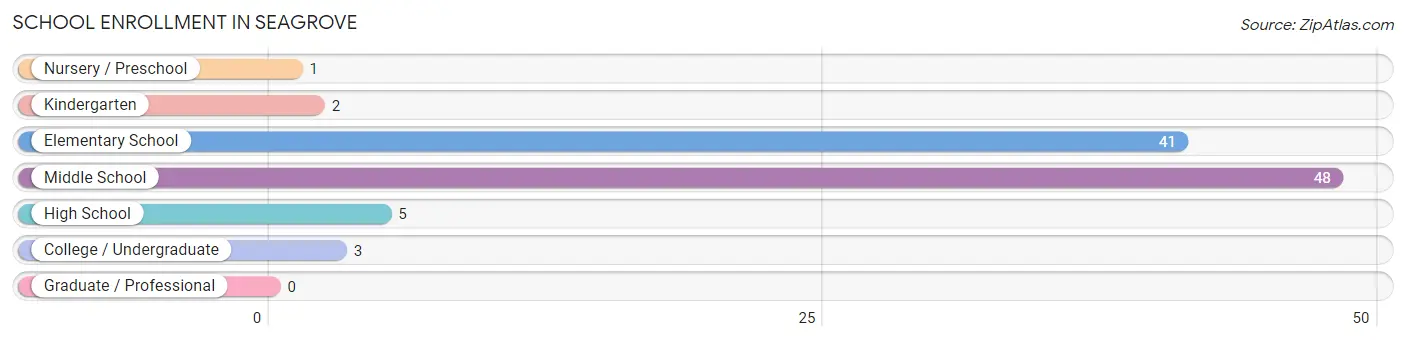
| School Level | # Students | % Students |
| Nursery / Preschool | 1 | 1.0% |
| Kindergarten | 2 | 2.0% |
| Elementary School | 41 | 41.0% |
| Middle School | 48 | 48.0% |
| High School | 5 | 5.0% |
| College / Undergraduate | 3 | 3.0% |
| Graduate / Professional | 0 | 0.0% |
| Total | 100 | 100.0% |
School Enrollment by Age by Funding Source in Seagrove
Out of a total of 100 students who are enrolled in schools in Seagrove, 4 (4.0%) attend a private institution, while the remaining 96 (96.0%) are enrolled in public schools. The age group of 3 to 4 year olds has the highest likelihood of being enrolled in private schools, with 1 (100.0% in the age bracket) enrolled. Conversely, the age group of 5 to 9 year old has the lowest likelihood of being enrolled in a private school, with 43 (100.0% in the age bracket) attending a public institution.
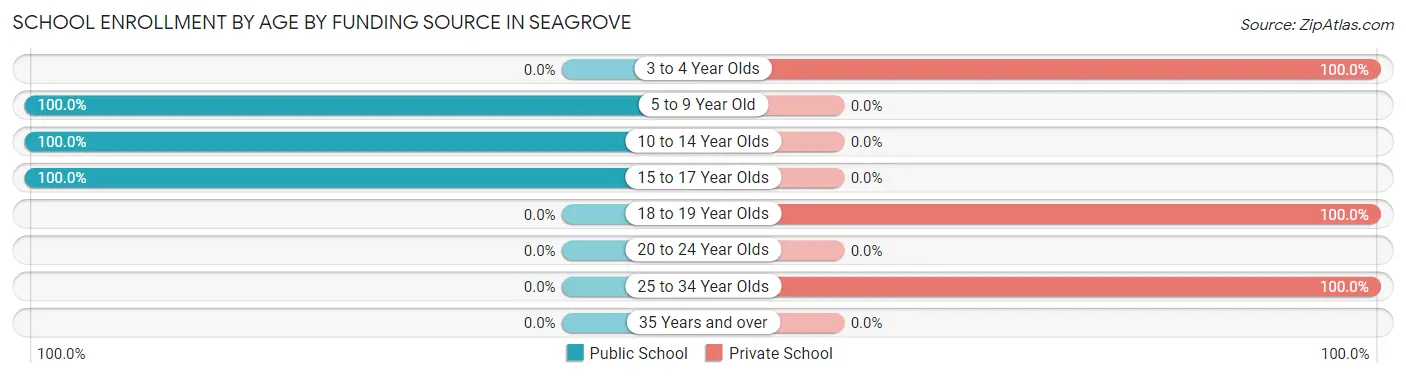
| Age Bracket | Public School | Private School |
| 3 to 4 Year Olds | 0 (0.0%) | 1 (100.0%) |
| 5 to 9 Year Old | 43 (100.0%) | 0 (0.0%) |
| 10 to 14 Year Olds | 48 (100.0%) | 0 (0.0%) |
| 15 to 17 Year Olds | 5 (100.0%) | 0 (0.0%) |
| 18 to 19 Year Olds | 0 (0.0%) | 1 (100.0%) |
| 20 to 24 Year Olds | 0 (0.0%) | 0 (0.0%) |
| 25 to 34 Year Olds | 0 (0.0%) | 2 (100.0%) |
| 35 Years and over | 0 (0.0%) | 0 (0.0%) |
| Total | 96 (96.0%) | 4 (4.0%) |
Educational Attainment by Field of Study in Seagrove
Education (54 | 73.0%), visual & performing arts (6 | 8.1%), science & technology (4 | 5.4%), psychology (2 | 2.7%), and social sciences (2 | 2.7%) are the most common fields of study among 74 individuals in Seagrove who have obtained a bachelor's degree or higher.
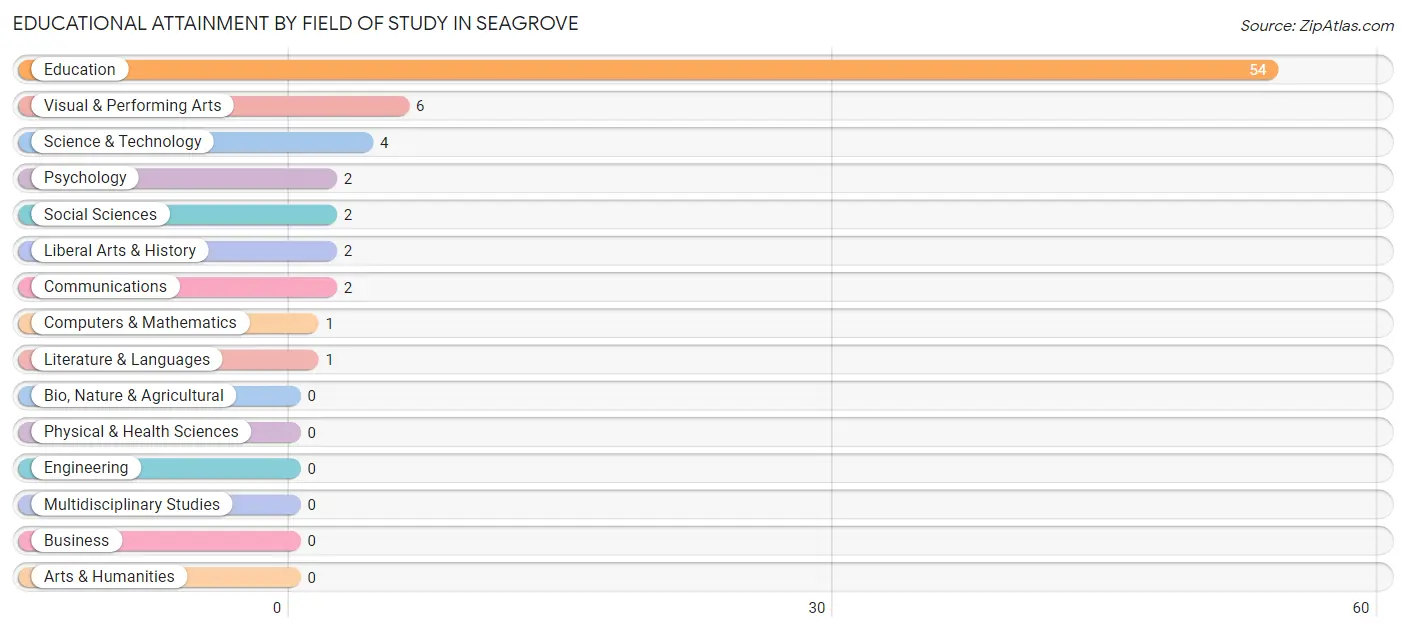
| Field of Study | # Graduates | % Graduates |
| Computers & Mathematics | 1 | 1.3% |
| Bio, Nature & Agricultural | 0 | 0.0% |
| Physical & Health Sciences | 0 | 0.0% |
| Psychology | 2 | 2.7% |
| Social Sciences | 2 | 2.7% |
| Engineering | 0 | 0.0% |
| Multidisciplinary Studies | 0 | 0.0% |
| Science & Technology | 4 | 5.4% |
| Business | 0 | 0.0% |
| Education | 54 | 73.0% |
| Literature & Languages | 1 | 1.3% |
| Liberal Arts & History | 2 | 2.7% |
| Visual & Performing Arts | 6 | 8.1% |
| Communications | 2 | 2.7% |
| Arts & Humanities | 0 | 0.0% |
| Total | 74 | 100.0% |
Transportation & Commute in Seagrove
Vehicle Availability by Sex in Seagrove
The most prevalent vehicle ownership categories in Seagrove are males with 3 vehicles (69, accounting for 75.0%) and females with 3 vehicles (55, making up 71.9%).
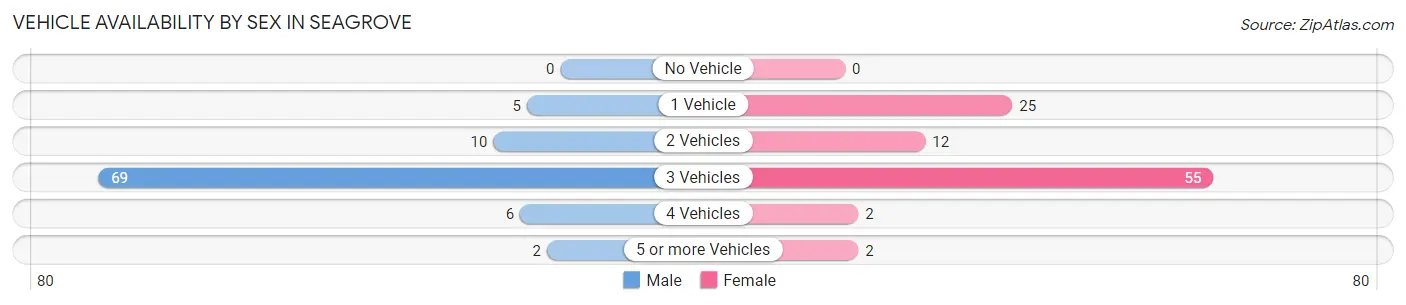
| Vehicles Available | Male | Female |
| No Vehicle | 0 (0.0%) | 0 (0.0%) |
| 1 Vehicle | 5 (5.4%) | 25 (26.0%) |
| 2 Vehicles | 10 (10.9%) | 12 (12.5%) |
| 3 Vehicles | 69 (75.0%) | 55 (57.3%) |
| 4 Vehicles | 6 (6.5%) | 2 (2.1%) |
| 5 or more Vehicles | 2 (2.2%) | 2 (2.1%) |
| Total | 92 (100.0%) | 96 (100.0%) |
Commute Time in Seagrove
The most frequently occuring commute durations in Seagrove are 10 to 14 minutes (97 commuters, 54.2%), 20 to 24 minutes (25 commuters, 14.0%), and 30 to 34 minutes (23 commuters, 12.9%).
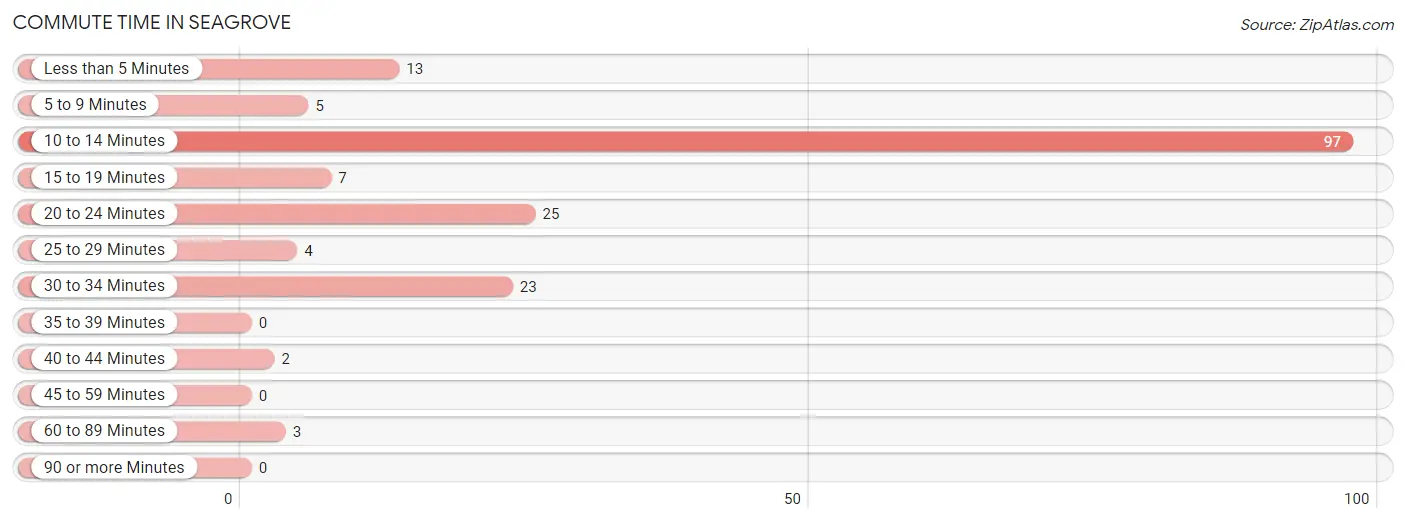
| Commute Time | # Commuters | % Commuters |
| Less than 5 Minutes | 13 | 7.3% |
| 5 to 9 Minutes | 5 | 2.8% |
| 10 to 14 Minutes | 97 | 54.2% |
| 15 to 19 Minutes | 7 | 3.9% |
| 20 to 24 Minutes | 25 | 14.0% |
| 25 to 29 Minutes | 4 | 2.2% |
| 30 to 34 Minutes | 23 | 12.9% |
| 35 to 39 Minutes | 0 | 0.0% |
| 40 to 44 Minutes | 2 | 1.1% |
| 45 to 59 Minutes | 0 | 0.0% |
| 60 to 89 Minutes | 3 | 1.7% |
| 90 or more Minutes | 0 | 0.0% |
Commute Time by Sex in Seagrove
The most common commute times in Seagrove are 10 to 14 minutes (55 commuters, 61.1%) for males and 10 to 14 minutes (42 commuters, 47.2%) for females.
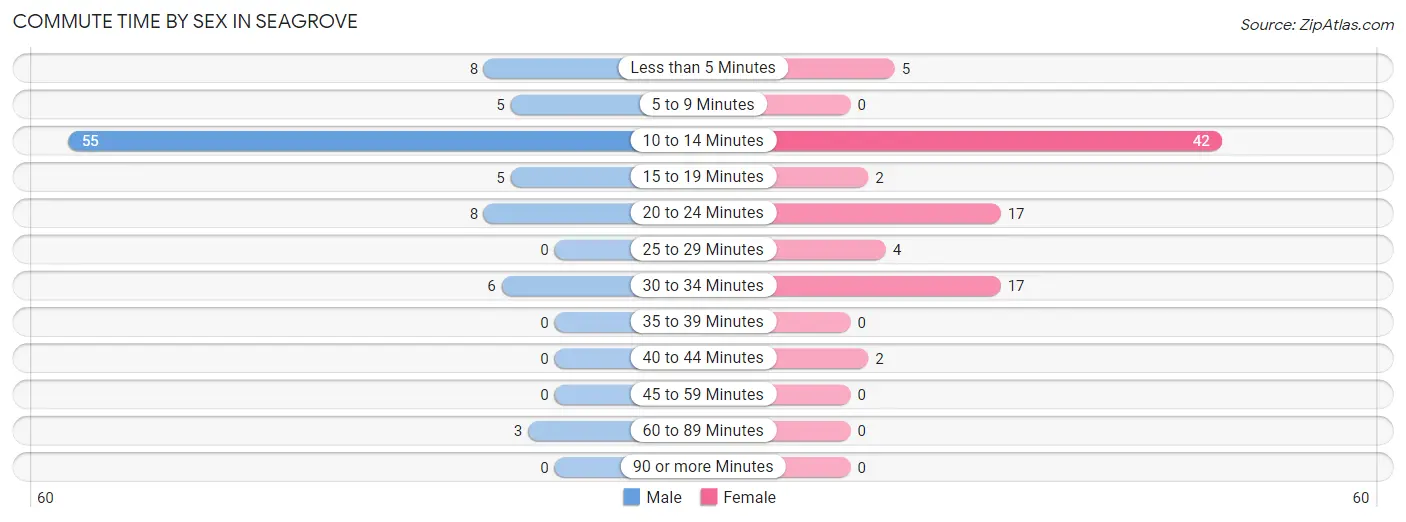
| Commute Time | Male | Female |
| Less than 5 Minutes | 8 (8.9%) | 5 (5.6%) |
| 5 to 9 Minutes | 5 (5.6%) | 0 (0.0%) |
| 10 to 14 Minutes | 55 (61.1%) | 42 (47.2%) |
| 15 to 19 Minutes | 5 (5.6%) | 2 (2.2%) |
| 20 to 24 Minutes | 8 (8.9%) | 17 (19.1%) |
| 25 to 29 Minutes | 0 (0.0%) | 4 (4.5%) |
| 30 to 34 Minutes | 6 (6.7%) | 17 (19.1%) |
| 35 to 39 Minutes | 0 (0.0%) | 0 (0.0%) |
| 40 to 44 Minutes | 0 (0.0%) | 2 (2.2%) |
| 45 to 59 Minutes | 0 (0.0%) | 0 (0.0%) |
| 60 to 89 Minutes | 3 (3.3%) | 0 (0.0%) |
| 90 or more Minutes | 0 (0.0%) | 0 (0.0%) |
Time of Departure to Work by Sex in Seagrove
The most frequent times of departure to work in Seagrove are 6:30 AM to 6:59 AM (53, 58.9%) for males and 6:30 AM to 6:59 AM (46, 51.7%) for females.
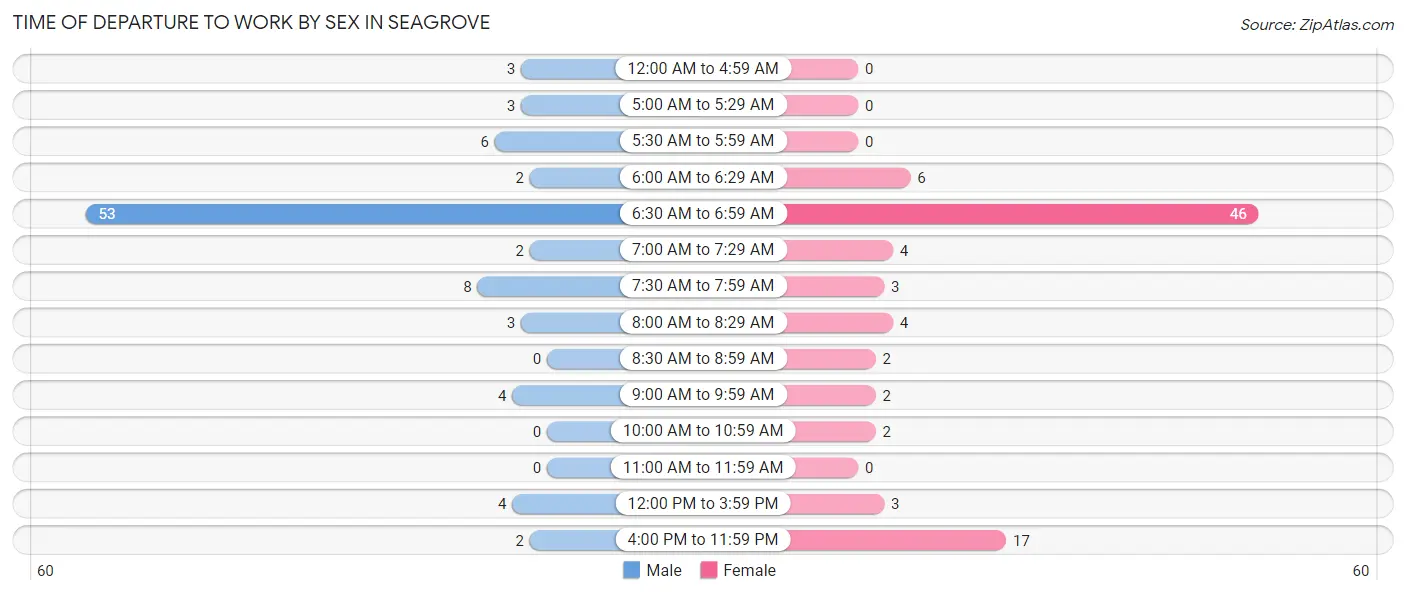
| Time of Departure | Male | Female |
| 12:00 AM to 4:59 AM | 3 (3.3%) | 0 (0.0%) |
| 5:00 AM to 5:29 AM | 3 (3.3%) | 0 (0.0%) |
| 5:30 AM to 5:59 AM | 6 (6.7%) | 0 (0.0%) |
| 6:00 AM to 6:29 AM | 2 (2.2%) | 6 (6.7%) |
| 6:30 AM to 6:59 AM | 53 (58.9%) | 46 (51.7%) |
| 7:00 AM to 7:29 AM | 2 (2.2%) | 4 (4.5%) |
| 7:30 AM to 7:59 AM | 8 (8.9%) | 3 (3.4%) |
| 8:00 AM to 8:29 AM | 3 (3.3%) | 4 (4.5%) |
| 8:30 AM to 8:59 AM | 0 (0.0%) | 2 (2.2%) |
| 9:00 AM to 9:59 AM | 4 (4.4%) | 2 (2.2%) |
| 10:00 AM to 10:59 AM | 0 (0.0%) | 2 (2.2%) |
| 11:00 AM to 11:59 AM | 0 (0.0%) | 0 (0.0%) |
| 12:00 PM to 3:59 PM | 4 (4.4%) | 3 (3.4%) |
| 4:00 PM to 11:59 PM | 2 (2.2%) | 17 (19.1%) |
| Total | 90 (100.0%) | 89 (100.0%) |
Housing Occupancy in Seagrove
Occupancy by Ownership in Seagrove
Of the total 160 dwellings in Seagrove, owner-occupied units account for 139 (86.9%), while renter-occupied units make up 21 (13.1%).
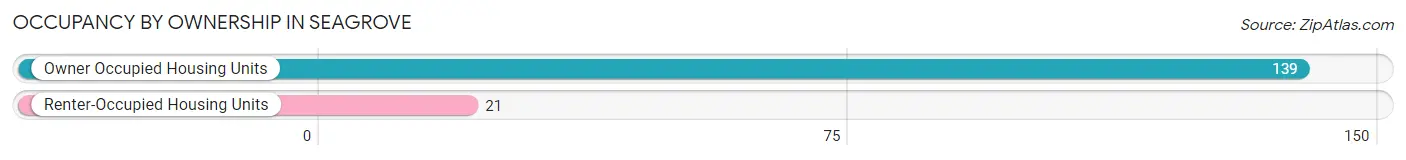
| Occupancy | # Housing Units | % Housing Units |
| Owner Occupied Housing Units | 139 | 86.9% |
| Renter-Occupied Housing Units | 21 | 13.1% |
| Total Occupied Housing Units | 160 | 100.0% |
Occupancy by Household Size in Seagrove
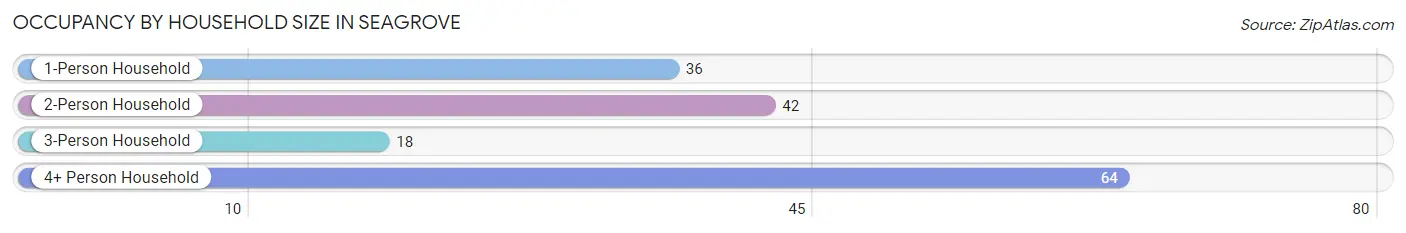
| Household Size | # Housing Units | % Housing Units |
| 1-Person Household | 36 | 22.5% |
| 2-Person Household | 42 | 26.3% |
| 3-Person Household | 18 | 11.3% |
| 4+ Person Household | 64 | 40.0% |
| Total Housing Units | 160 | 100.0% |
Occupancy by Ownership by Household Size in Seagrove
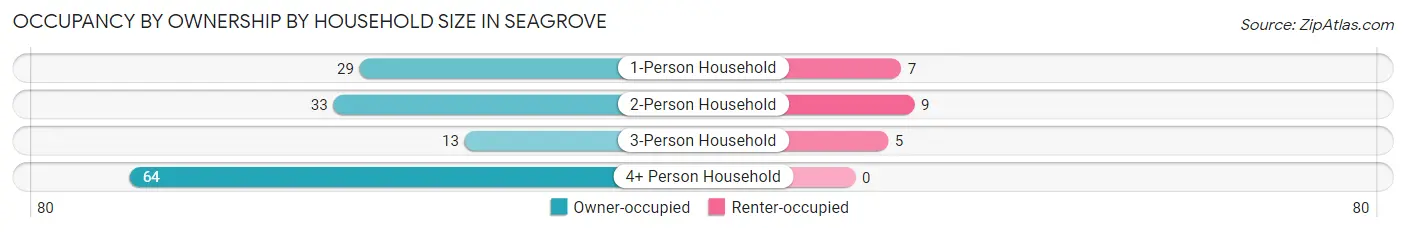
| Household Size | Owner-occupied | Renter-occupied |
| 1-Person Household | 29 (80.6%) | 7 (19.4%) |
| 2-Person Household | 33 (78.6%) | 9 (21.4%) |
| 3-Person Household | 13 (72.2%) | 5 (27.8%) |
| 4+ Person Household | 64 (100.0%) | 0 (0.0%) |
| Total Housing Units | 139 (86.9%) | 21 (13.1%) |
Occupancy by Educational Attainment in Seagrove
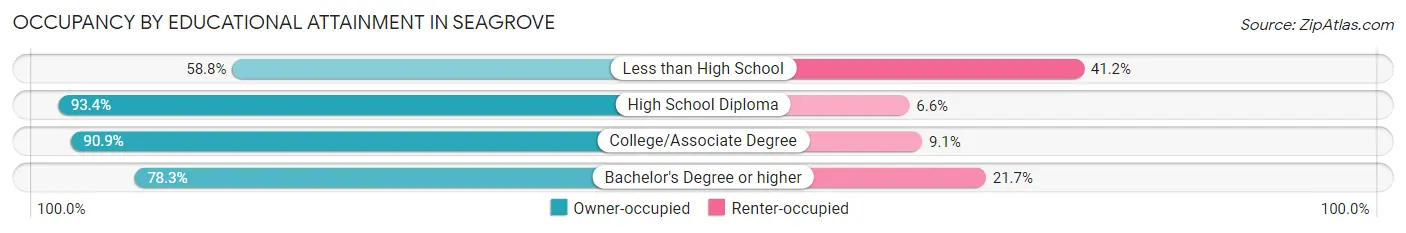
| Household Size | Owner-occupied | Renter-occupied |
| Less than High School | 10 (58.8%) | 7 (41.2%) |
| High School Diploma | 71 (93.4%) | 5 (6.6%) |
| College/Associate Degree | 40 (90.9%) | 4 (9.1%) |
| Bachelor's Degree or higher | 18 (78.3%) | 5 (21.7%) |
Occupancy by Age of Householder in Seagrove
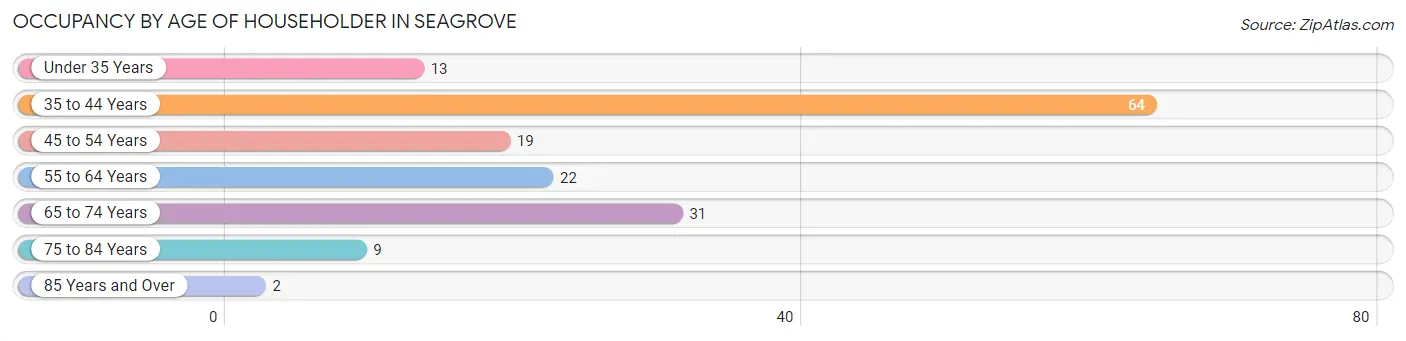
| Age Bracket | # Households | % Households |
| Under 35 Years | 13 | 8.1% |
| 35 to 44 Years | 64 | 40.0% |
| 45 to 54 Years | 19 | 11.9% |
| 55 to 64 Years | 22 | 13.8% |
| 65 to 74 Years | 31 | 19.4% |
| 75 to 84 Years | 9 | 5.6% |
| 85 Years and Over | 2 | 1.3% |
| Total | 160 | 100.0% |
Housing Finances in Seagrove
Median Income by Occupancy in Seagrove
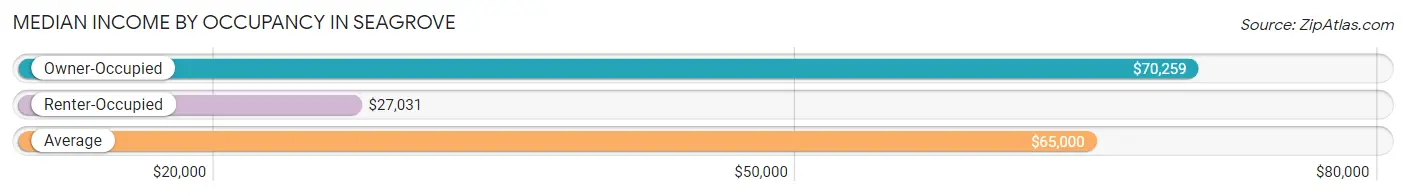
| Occupancy Type | # Households | Median Income |
| Owner-Occupied | 139 (86.9%) | $70,259 |
| Renter-Occupied | 21 (13.1%) | $27,031 |
| Average | 160 (100.0%) | $65,000 |
Occupancy by Householder Income Bracket in Seagrove
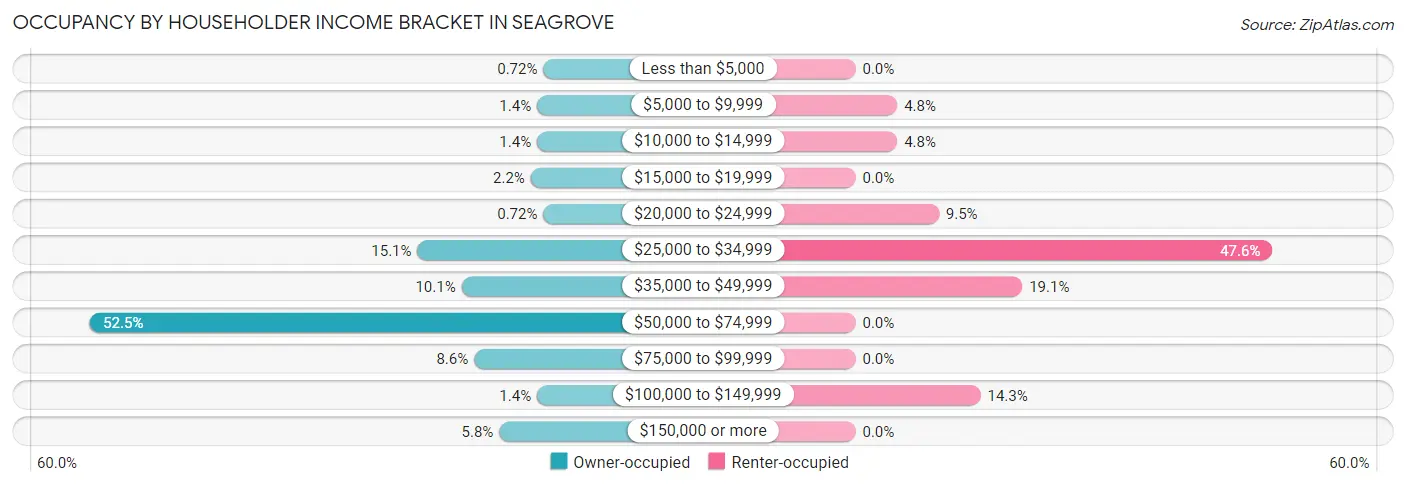
| Income Bracket | Owner-occupied | Renter-occupied |
| Less than $5,000 | 1 (0.7%) | 0 (0.0%) |
| $5,000 to $9,999 | 2 (1.4%) | 1 (4.8%) |
| $10,000 to $14,999 | 2 (1.4%) | 1 (4.8%) |
| $15,000 to $19,999 | 3 (2.2%) | 0 (0.0%) |
| $20,000 to $24,999 | 1 (0.7%) | 2 (9.5%) |
| $25,000 to $34,999 | 21 (15.1%) | 10 (47.6%) |
| $35,000 to $49,999 | 14 (10.1%) | 4 (19.1%) |
| $50,000 to $74,999 | 73 (52.5%) | 0 (0.0%) |
| $75,000 to $99,999 | 12 (8.6%) | 0 (0.0%) |
| $100,000 to $149,999 | 2 (1.4%) | 3 (14.3%) |
| $150,000 or more | 8 (5.8%) | 0 (0.0%) |
| Total | 139 (100.0%) | 21 (100.0%) |
Monthly Housing Cost Tiers in Seagrove
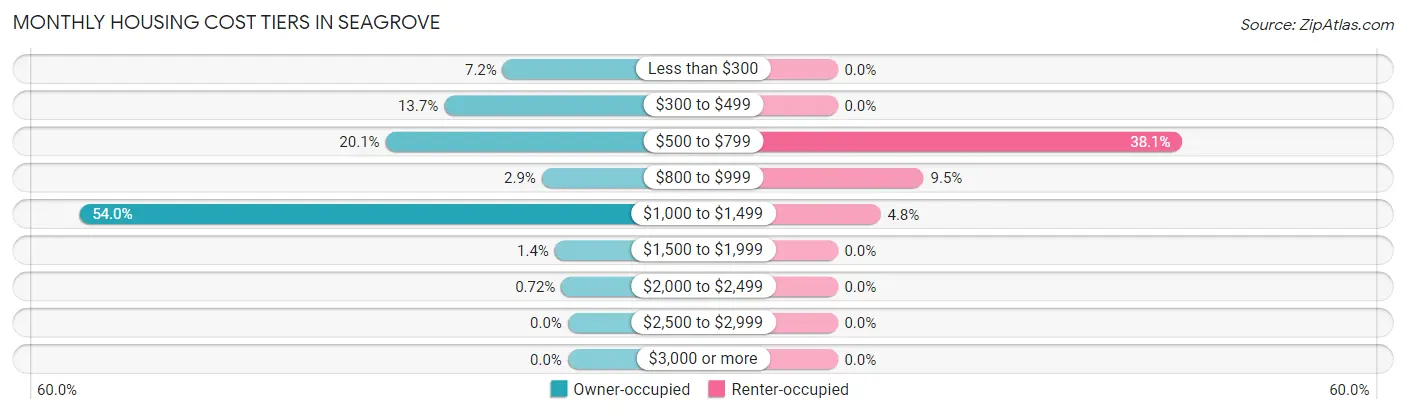
| Monthly Cost | Owner-occupied | Renter-occupied |
| Less than $300 | 10 (7.2%) | 0 (0.0%) |
| $300 to $499 | 19 (13.7%) | 0 (0.0%) |
| $500 to $799 | 28 (20.1%) | 8 (38.1%) |
| $800 to $999 | 4 (2.9%) | 2 (9.5%) |
| $1,000 to $1,499 | 75 (54.0%) | 1 (4.8%) |
| $1,500 to $1,999 | 2 (1.4%) | 0 (0.0%) |
| $2,000 to $2,499 | 1 (0.7%) | 0 (0.0%) |
| $2,500 to $2,999 | 0 (0.0%) | 0 (0.0%) |
| $3,000 or more | 0 (0.0%) | 0 (0.0%) |
| Total | 139 (100.0%) | 21 (100.0%) |
Physical Housing Characteristics in Seagrove
Housing Structures in Seagrove
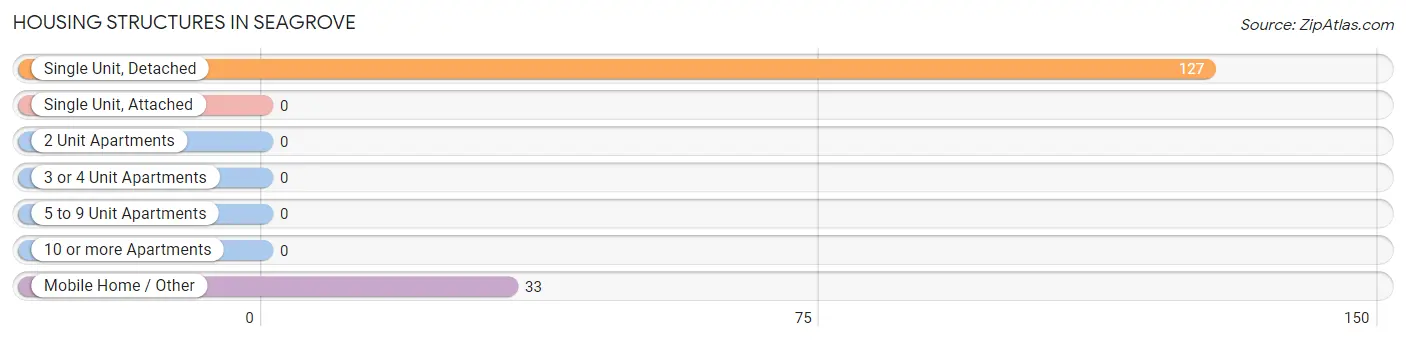
| Structure Type | # Housing Units | % Housing Units |
| Single Unit, Detached | 127 | 79.4% |
| Single Unit, Attached | 0 | 0.0% |
| 2 Unit Apartments | 0 | 0.0% |
| 3 or 4 Unit Apartments | 0 | 0.0% |
| 5 to 9 Unit Apartments | 0 | 0.0% |
| 10 or more Apartments | 0 | 0.0% |
| Mobile Home / Other | 33 | 20.6% |
| Total | 160 | 100.0% |
Housing Structures by Occupancy in Seagrove
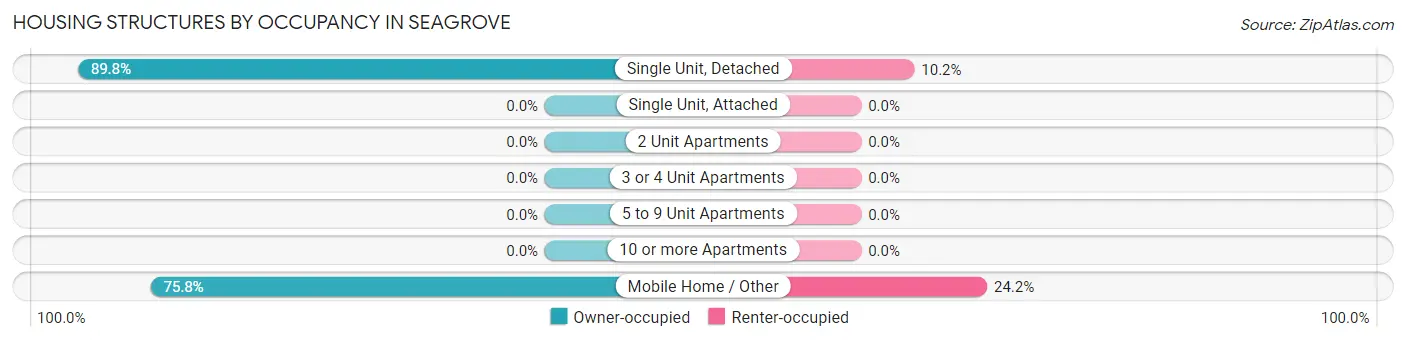
| Structure Type | Owner-occupied | Renter-occupied |
| Single Unit, Detached | 114 (89.8%) | 13 (10.2%) |
| Single Unit, Attached | 0 (0.0%) | 0 (0.0%) |
| 2 Unit Apartments | 0 (0.0%) | 0 (0.0%) |
| 3 or 4 Unit Apartments | 0 (0.0%) | 0 (0.0%) |
| 5 to 9 Unit Apartments | 0 (0.0%) | 0 (0.0%) |
| 10 or more Apartments | 0 (0.0%) | 0 (0.0%) |
| Mobile Home / Other | 25 (75.8%) | 8 (24.2%) |
| Total | 139 (86.9%) | 21 (13.1%) |
Housing Structures by Number of Rooms in Seagrove
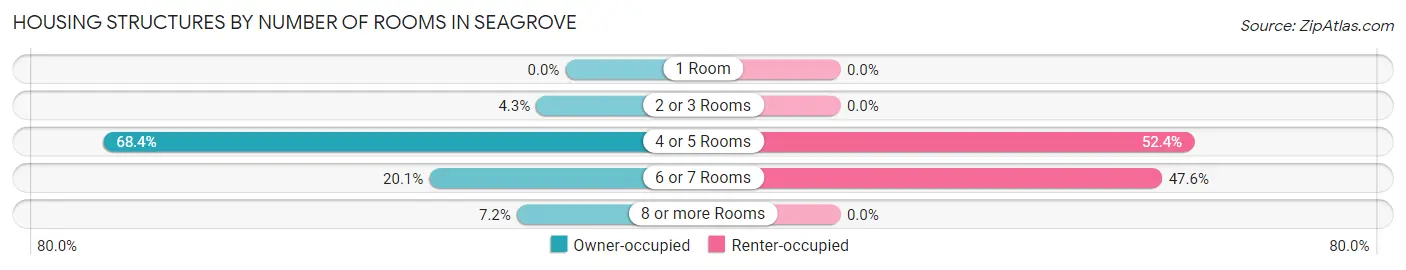
| Number of Rooms | Owner-occupied | Renter-occupied |
| 1 Room | 0 (0.0%) | 0 (0.0%) |
| 2 or 3 Rooms | 6 (4.3%) | 0 (0.0%) |
| 4 or 5 Rooms | 95 (68.3%) | 11 (52.4%) |
| 6 or 7 Rooms | 28 (20.1%) | 10 (47.6%) |
| 8 or more Rooms | 10 (7.2%) | 0 (0.0%) |
| Total | 139 (100.0%) | 21 (100.0%) |
Housing Structure by Heating Type in Seagrove
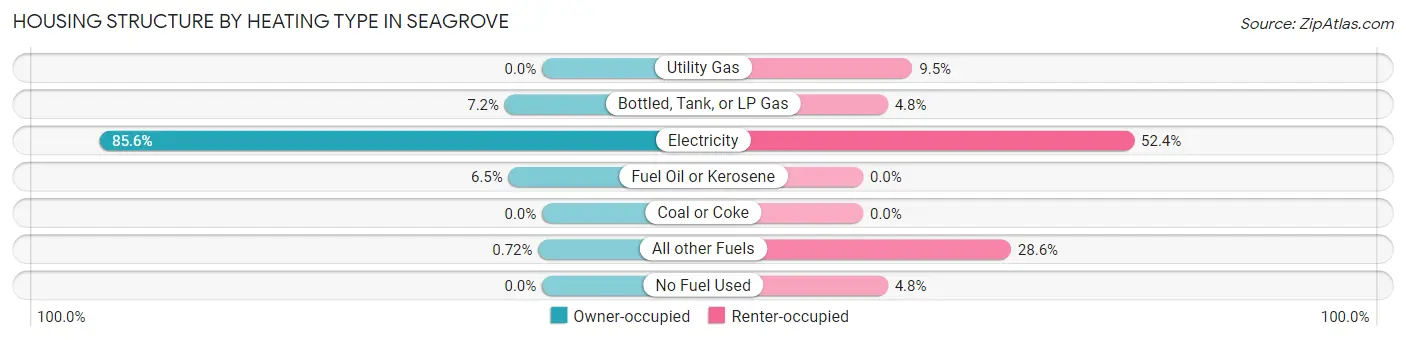
| Heating Type | Owner-occupied | Renter-occupied |
| Utility Gas | 0 (0.0%) | 2 (9.5%) |
| Bottled, Tank, or LP Gas | 10 (7.2%) | 1 (4.8%) |
| Electricity | 119 (85.6%) | 11 (52.4%) |
| Fuel Oil or Kerosene | 9 (6.5%) | 0 (0.0%) |
| Coal or Coke | 0 (0.0%) | 0 (0.0%) |
| All other Fuels | 1 (0.7%) | 6 (28.6%) |
| No Fuel Used | 0 (0.0%) | 1 (4.8%) |
| Total | 139 (100.0%) | 21 (100.0%) |
Household Vehicle Usage in Seagrove
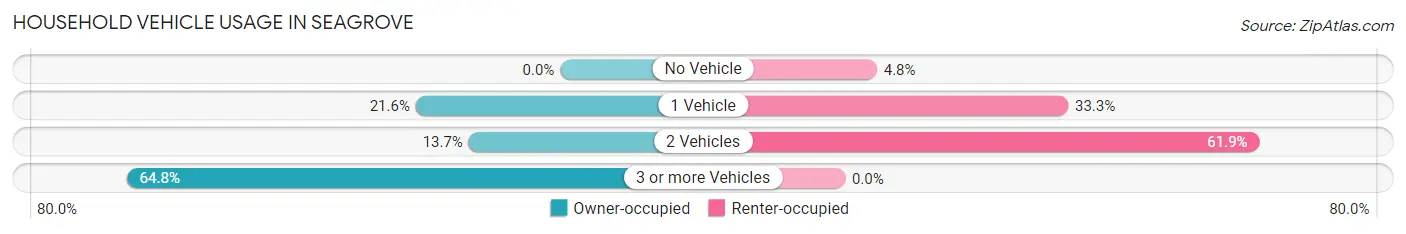
| Vehicles per Household | Owner-occupied | Renter-occupied |
| No Vehicle | 0 (0.0%) | 1 (4.8%) |
| 1 Vehicle | 30 (21.6%) | 7 (33.3%) |
| 2 Vehicles | 19 (13.7%) | 13 (61.9%) |
| 3 or more Vehicles | 90 (64.7%) | 0 (0.0%) |
| Total | 139 (100.0%) | 21 (100.0%) |
Real Estate & Mortgages in Seagrove
Real Estate and Mortgage Overview in Seagrove
| Characteristic | Without Mortgage | With Mortgage |
| Housing Units | 38 | 101 |
| Median Property Value | $155,600 | $135,000 |
| Median Household Income | $34,107 | $8 |
| Monthly Housing Costs | $360 | $0 |
| Real Estate Taxes | $1,167 | $0 |
Property Value by Mortgage Status in Seagrove
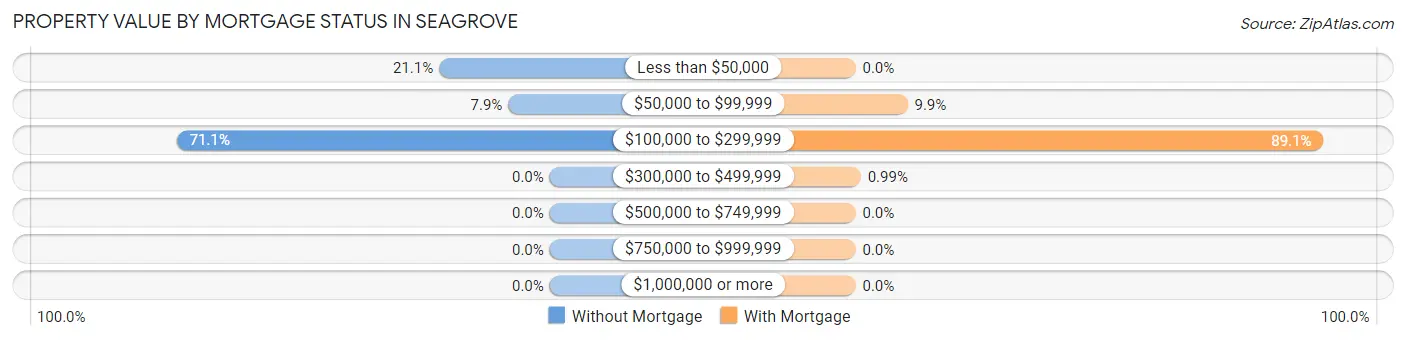
| Property Value | Without Mortgage | With Mortgage |
| Less than $50,000 | 8 (21.0%) | 0 (0.0%) |
| $50,000 to $99,999 | 3 (7.9%) | 10 (9.9%) |
| $100,000 to $299,999 | 27 (71.1%) | 90 (89.1%) |
| $300,000 to $499,999 | 0 (0.0%) | 1 (1.0%) |
| $500,000 to $749,999 | 0 (0.0%) | 0 (0.0%) |
| $750,000 to $999,999 | 0 (0.0%) | 0 (0.0%) |
| $1,000,000 or more | 0 (0.0%) | 0 (0.0%) |
| Total | 38 (100.0%) | 101 (100.0%) |
Household Income by Mortgage Status in Seagrove
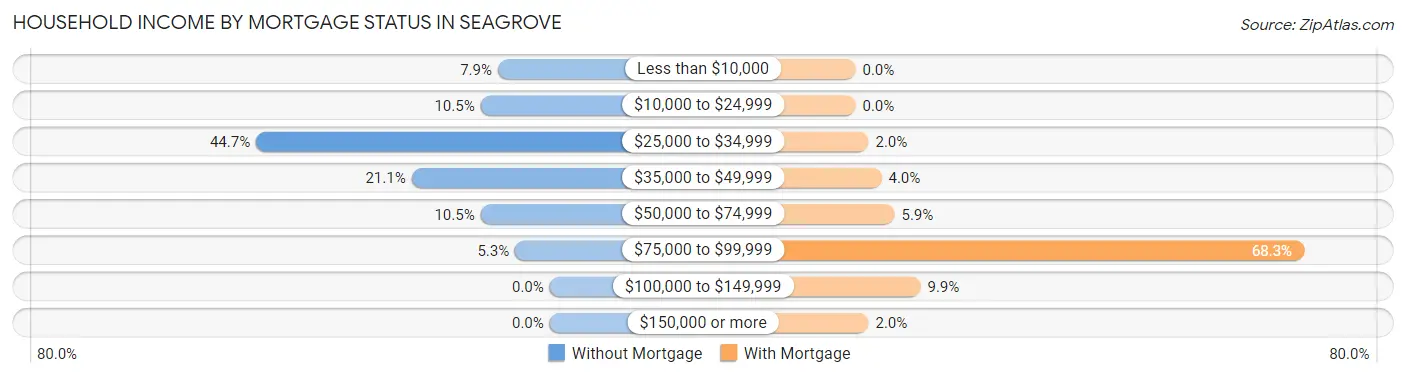
| Household Income | Without Mortgage | With Mortgage |
| Less than $10,000 | 3 (7.9%) | 0 (0.0%) |
| $10,000 to $24,999 | 4 (10.5%) | 0 (0.0%) |
| $25,000 to $34,999 | 17 (44.7%) | 2 (2.0%) |
| $35,000 to $49,999 | 8 (21.0%) | 4 (4.0%) |
| $50,000 to $74,999 | 4 (10.5%) | 6 (5.9%) |
| $75,000 to $99,999 | 2 (5.3%) | 69 (68.3%) |
| $100,000 to $149,999 | 0 (0.0%) | 10 (9.9%) |
| $150,000 or more | 0 (0.0%) | 2 (2.0%) |
| Total | 38 (100.0%) | 101 (100.0%) |
Property Value to Household Income Ratio in Seagrove
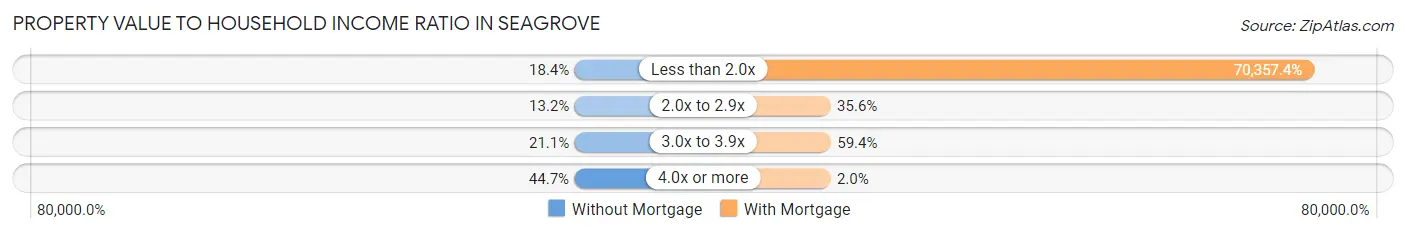
| Value-to-Income Ratio | Without Mortgage | With Mortgage |
| Less than 2.0x | 7 (18.4%) | 71,061 (70,357.4%) |
| 2.0x to 2.9x | 5 (13.2%) | 36 (35.6%) |
| 3.0x to 3.9x | 8 (21.0%) | 60 (59.4%) |
| 4.0x or more | 17 (44.7%) | 2 (2.0%) |
| Total | 38 (100.0%) | 101 (100.0%) |
Real Estate Taxes by Mortgage Status in Seagrove
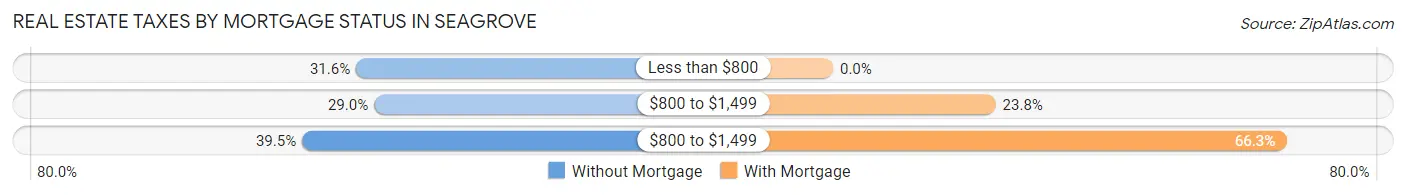
| Property Taxes | Without Mortgage | With Mortgage |
| Less than $800 | 12 (31.6%) | 0 (0.0%) |
| $800 to $1,499 | 11 (28.9%) | 24 (23.8%) |
| $800 to $1,499 | 15 (39.5%) | 67 (66.3%) |
| Total | 38 (100.0%) | 101 (100.0%) |
Health & Disability in Seagrove
Health Insurance Coverage by Age in Seagrove
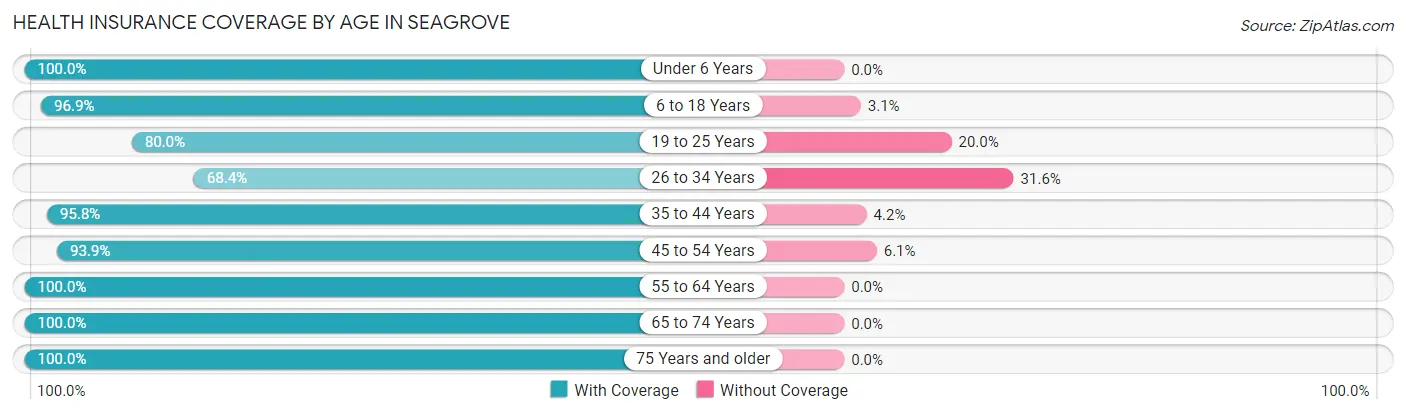
| Age Bracket | With Coverage | Without Coverage |
| Under 6 Years | 27 (100.0%) | 0 (0.0%) |
| 6 to 18 Years | 94 (96.9%) | 3 (3.1%) |
| 19 to 25 Years | 8 (80.0%) | 2 (20.0%) |
| 26 to 34 Years | 13 (68.4%) | 6 (31.6%) |
| 35 to 44 Years | 115 (95.8%) | 5 (4.2%) |
| 45 to 54 Years | 31 (93.9%) | 2 (6.1%) |
| 55 to 64 Years | 28 (100.0%) | 0 (0.0%) |
| 65 to 74 Years | 54 (100.0%) | 0 (0.0%) |
| 75 Years and older | 16 (100.0%) | 0 (0.0%) |
| Total | 386 (95.5%) | 18 (4.5%) |
Health Insurance Coverage by Citizenship Status in Seagrove
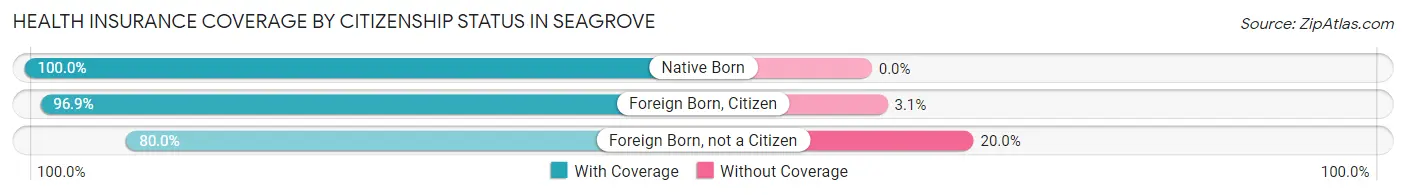
| Citizenship Status | With Coverage | Without Coverage |
| Native Born | 27 (100.0%) | 0 (0.0%) |
| Foreign Born, Citizen | 94 (96.9%) | 3 (3.1%) |
| Foreign Born, not a Citizen | 8 (80.0%) | 2 (20.0%) |
Health Insurance Coverage by Household Income in Seagrove

| Household Income | With Coverage | Without Coverage |
| Under $25,000 | 11 (57.9%) | 8 (42.1%) |
| $25,000 to $49,999 | 117 (95.9%) | 5 (4.1%) |
| $50,000 to $74,999 | 201 (100.0%) | 0 (0.0%) |
| $75,000 to $99,999 | 27 (84.4%) | 5 (15.6%) |
| $100,000 and over | 30 (100.0%) | 0 (0.0%) |
Public vs Private Health Insurance Coverage by Age in Seagrove
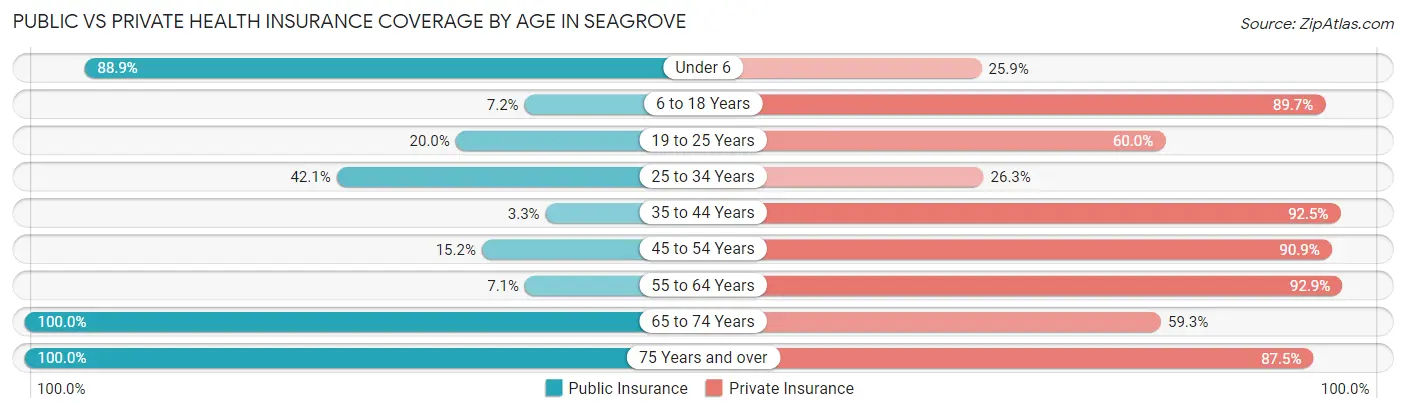
| Age Bracket | Public Insurance | Private Insurance |
| Under 6 | 24 (88.9%) | 7 (25.9%) |
| 6 to 18 Years | 7 (7.2%) | 87 (89.7%) |
| 19 to 25 Years | 2 (20.0%) | 6 (60.0%) |
| 25 to 34 Years | 8 (42.1%) | 5 (26.3%) |
| 35 to 44 Years | 4 (3.3%) | 111 (92.5%) |
| 45 to 54 Years | 5 (15.1%) | 30 (90.9%) |
| 55 to 64 Years | 2 (7.1%) | 26 (92.9%) |
| 65 to 74 Years | 54 (100.0%) | 32 (59.3%) |
| 75 Years and over | 16 (100.0%) | 14 (87.5%) |
| Total | 122 (30.2%) | 318 (78.7%) |
Disability Status by Sex by Age in Seagrove
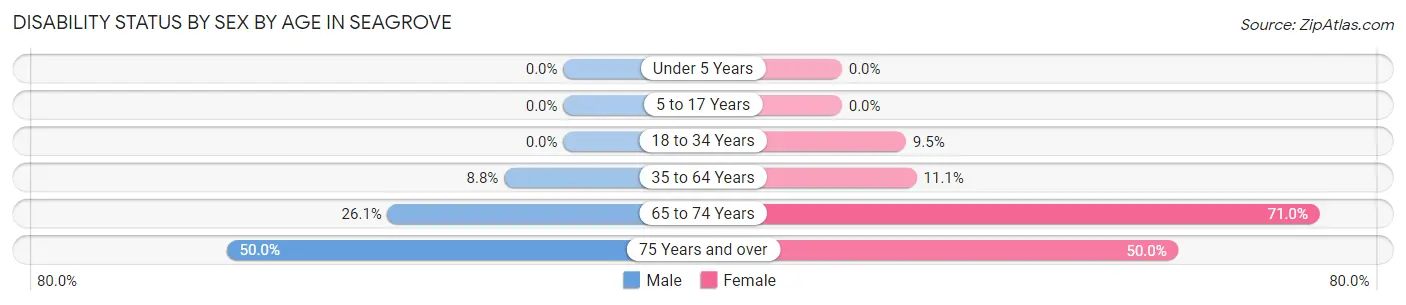
| Age Bracket | Male | Female |
| Under 5 Years | 0 (0.0%) | 0 (0.0%) |
| 5 to 17 Years | 0 (0.0%) | 0 (0.0%) |
| 18 to 34 Years | 0 (0.0%) | 2 (9.5%) |
| 35 to 64 Years | 8 (8.8%) | 10 (11.1%) |
| 65 to 74 Years | 6 (26.1%) | 22 (71.0%) |
| 75 Years and over | 3 (50.0%) | 5 (50.0%) |
Disability Class by Sex by Age in Seagrove
Disability Class: Hearing Difficulty
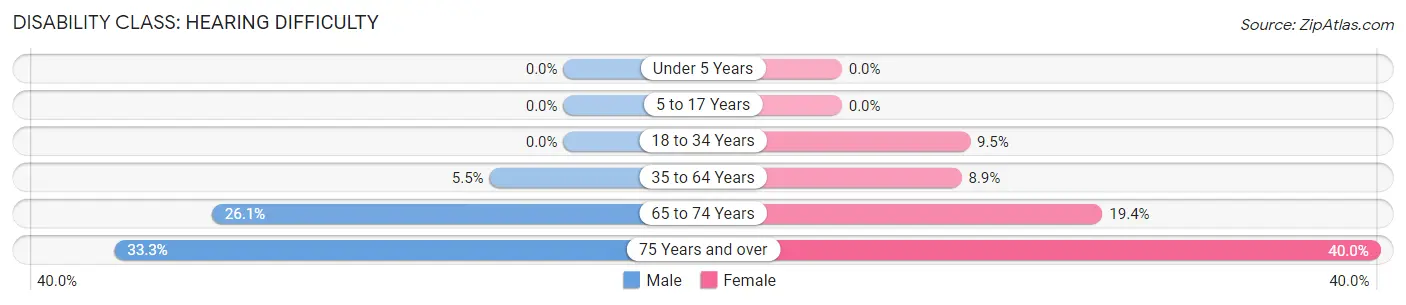
| Age Bracket | Male | Female |
| Under 5 Years | 0 (0.0%) | 0 (0.0%) |
| 5 to 17 Years | 0 (0.0%) | 0 (0.0%) |
| 18 to 34 Years | 0 (0.0%) | 2 (9.5%) |
| 35 to 64 Years | 5 (5.5%) | 8 (8.9%) |
| 65 to 74 Years | 6 (26.1%) | 6 (19.4%) |
| 75 Years and over | 2 (33.3%) | 4 (40.0%) |
Disability Class: Vision Difficulty
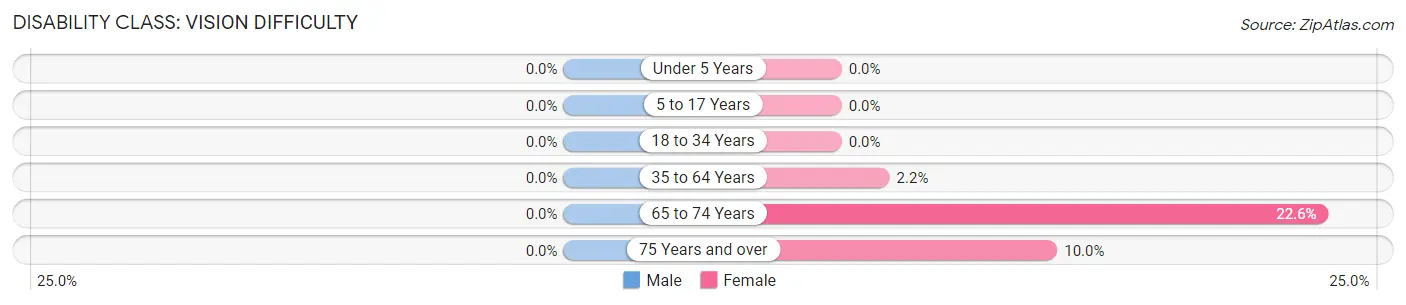
| Age Bracket | Male | Female |
| Under 5 Years | 0 (0.0%) | 0 (0.0%) |
| 5 to 17 Years | 0 (0.0%) | 0 (0.0%) |
| 18 to 34 Years | 0 (0.0%) | 0 (0.0%) |
| 35 to 64 Years | 0 (0.0%) | 2 (2.2%) |
| 65 to 74 Years | 0 (0.0%) | 7 (22.6%) |
| 75 Years and over | 0 (0.0%) | 1 (10.0%) |
Disability Class: Cognitive Difficulty
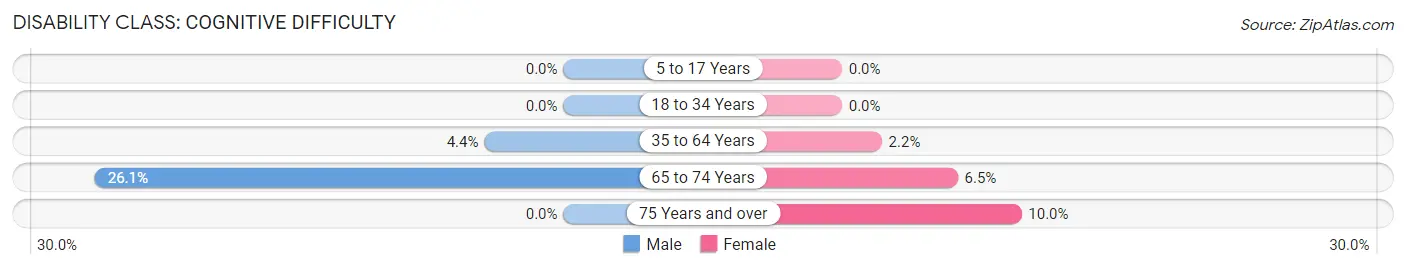
| Age Bracket | Male | Female |
| 5 to 17 Years | 0 (0.0%) | 0 (0.0%) |
| 18 to 34 Years | 0 (0.0%) | 0 (0.0%) |
| 35 to 64 Years | 4 (4.4%) | 2 (2.2%) |
| 65 to 74 Years | 6 (26.1%) | 2 (6.5%) |
| 75 Years and over | 0 (0.0%) | 1 (10.0%) |
Disability Class: Ambulatory Difficulty
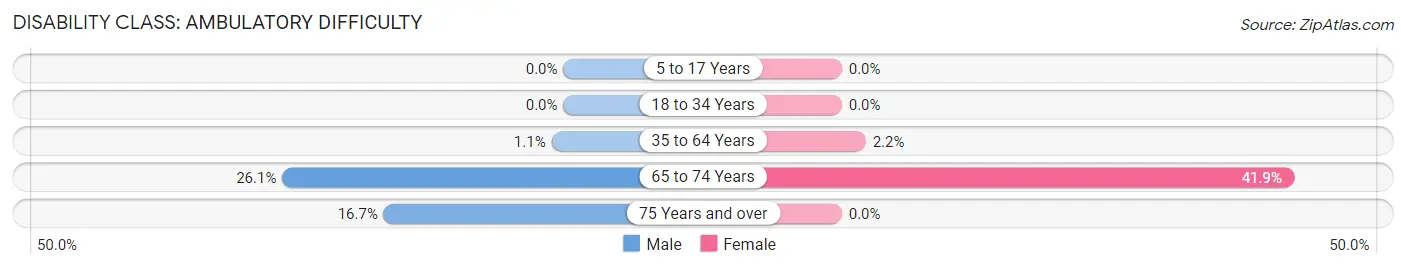
| Age Bracket | Male | Female |
| 5 to 17 Years | 0 (0.0%) | 0 (0.0%) |
| 18 to 34 Years | 0 (0.0%) | 0 (0.0%) |
| 35 to 64 Years | 1 (1.1%) | 2 (2.2%) |
| 65 to 74 Years | 6 (26.1%) | 13 (41.9%) |
| 75 Years and over | 1 (16.7%) | 0 (0.0%) |
Disability Class: Self-Care Difficulty
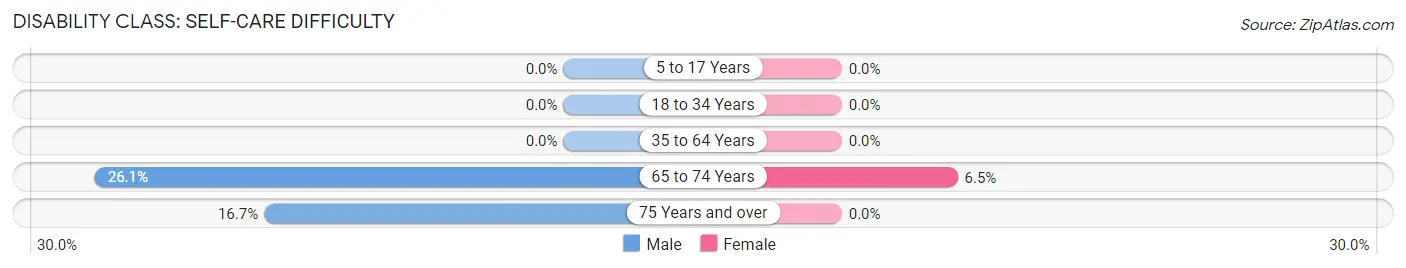
| Age Bracket | Male | Female |
| 5 to 17 Years | 0 (0.0%) | 0 (0.0%) |
| 18 to 34 Years | 0 (0.0%) | 0 (0.0%) |
| 35 to 64 Years | 0 (0.0%) | 0 (0.0%) |
| 65 to 74 Years | 6 (26.1%) | 2 (6.5%) |
| 75 Years and over | 1 (16.7%) | 0 (0.0%) |
Technology Access in Seagrove
Computing Device Access in Seagrove
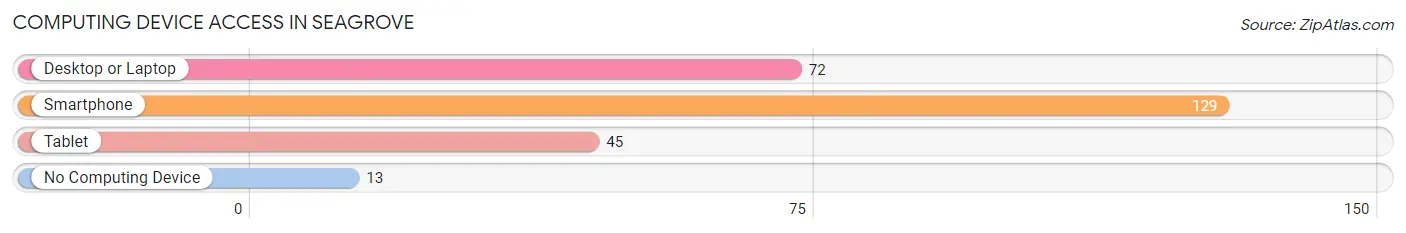
| Device Type | # Households | % Households |
| Desktop or Laptop | 72 | 45.0% |
| Smartphone | 129 | 80.6% |
| Tablet | 45 | 28.1% |
| No Computing Device | 13 | 8.1% |
| Total | 160 | 100.0% |
Internet Access in Seagrove
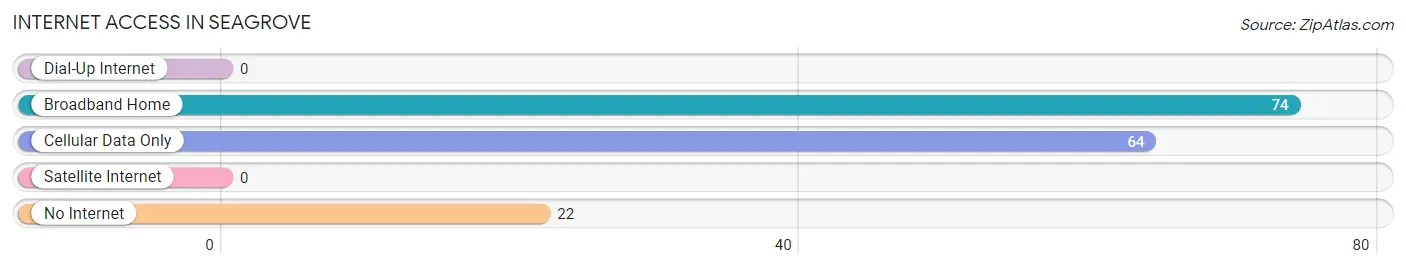
| Internet Type | # Households | % Households |
| Dial-Up Internet | 0 | 0.0% |
| Broadband Home | 74 | 46.3% |
| Cellular Data Only | 64 | 40.0% |
| Satellite Internet | 0 | 0.0% |
| No Internet | 22 | 13.8% |
| Total | 160 | 100.0% |
Seagrove Summary
Seagrove, North Carolina is a small town located in Randolph County, in the central part of the state. It is situated in the Uwharrie Mountains, and is part of the Piedmont Triad region. The town was founded in 1790 and is named after the Seagrove family, who were among the first settlers in the area.
History
The area that is now Seagrove was first settled by the Seagrove family in 1790. The family had moved from Virginia and established a homestead in the area. The town was officially incorporated in 1887, and the first post office was established in 1891.
The town was originally a farming community, and the main crops grown were cotton, corn, and tobacco. In the early 1900s, the town began to develop a furniture industry, which is still a major part of the local economy today.
Geography
Seagrove is located in the Uwharrie Mountains, which are part of the Appalachian Mountains. The town is situated in the Piedmont Triad region of North Carolina, and is about 30 miles south of Greensboro. The town is located at an elevation of 830 feet above sea level.
The town is located in a rural area, and is surrounded by forests and rolling hills. The nearest major city is Greensboro, which is about 30 miles away.
Economy
The economy of Seagrove is largely based on the furniture industry. The town is home to several furniture factories, which produce a variety of furniture items, including bedroom sets, dining room sets, and office furniture. The furniture industry is the largest employer in the town, and provides jobs for many of the local residents.
In addition to the furniture industry, Seagrove is also home to several small businesses, including restaurants, shops, and other services. The town is also home to a few tourist attractions, including the Seagrove Pottery Museum and the Seagrove Country Store.
Demographics
As of the 2010 census, the population of Seagrove was 1,845. The racial makeup of the town was 94.3% White, 2.3% African American, 0.3% Native American, 0.3% Asian, and 2.7% from other races. The median household income was $37,917, and the median age was 41.
Seagrove is a small, rural town with a close-knit community. The town is home to several churches, and there are several community events held throughout the year. The town is also home to a few tourist attractions, including the Seagrove Pottery Museum and the Seagrove Country Store.
Common Questions
What is Per Capita Income in Seagrove?
Per Capita income in Seagrove is $23,457.
What is the Median Family Income in Seagrove?
Median Family Income in Seagrove is $41,404.
What is the Median Household income in Seagrove?
Median Household Income in Seagrove is $65,000.
What is Income or Wage Gap in Seagrove?
Income or Wage Gap in Seagrove is 29.4%.
Women in Seagrove earn 70.6 cents for every dollar earned by a man.
What is Inequality or Gini Index in Seagrove?
Inequality or Gini Index in Seagrove is 0.30.
What is the Total Population of Seagrove?
Total Population of Seagrove is 405.
What is the Total Male Population of Seagrove?
Total Male Population of Seagrove is 239.
What is the Total Female Population of Seagrove?
Total Female Population of Seagrove is 166.
What is the Ratio of Males per 100 Females in Seagrove?
There are 143.98 Males per 100 Females in Seagrove.
What is the Ratio of Females per 100 Males in Seagrove?
There are 69.46 Females per 100 Males in Seagrove.
What is the Median Population Age in Seagrove?
Median Population Age in Seagrove is 36.5 Years.
What is the Average Family Size in Seagrove
Average Family Size in Seagrove is 2.6 People.
What is the Average Household Size in Seagrove
Average Household Size in Seagrove is 2.5 People.
How Large is the Labor Force in Seagrove?
There are 200 People in the Labor Forcein in Seagrove.
What is the Percentage of People in the Labor Force in Seagrove?
69.7% of People are in the Labor Force in Seagrove.
What is the Unemployment Rate in Seagrove?
Unemployment Rate in Seagrove is 5.5%.