Cocoa Beach, FL Map & Demographics
Cocoa Beach Map
Cocoa Beach Overview
$62,117
PER CAPITA INCOME
$116,343
AVG FAMILY INCOME
$80,880
AVG HOUSEHOLD INCOME
27.3%
WAGE / INCOME GAP [ % ]
72.7¢/ $1
WAGE / INCOME GAP [ $ ]
0.48
INEQUALITY / GINI INDEX
11,334
TOTAL POPULATION
5,849
MALE POPULATION
5,485
FEMALE POPULATION
106.64
MALES / 100 FEMALES
93.78
FEMALES / 100 MALES
58.6
MEDIAN AGE
2.5
AVG FAMILY SIZE
1.9
AVG HOUSEHOLD SIZE
5,247
LABOR FORCE [ PEOPLE ]
49.8%
PERCENT IN LABOR FORCE
7.4%
UNEMPLOYMENT RATE
Cocoa Beach Zip Codes
Cocoa Beach Area Codes
Income in Cocoa Beach
Income Overview in Cocoa Beach
Per Capita Income in Cocoa Beach is $62,117, while median incomes of families and households are $116,343 and $80,880 respectively.
| Characteristic | Number | Measure |
| Per Capita Income | 11,334 | $62,117 |
| Median Family Income | 3,092 | $116,343 |
| Mean Family Income | 3,092 | $143,504 |
| Median Household Income | 6,115 | $80,880 |
| Mean Household Income | 6,115 | $112,541 |
| Income Deficit | 3,092 | $0 |
| Wage / Income Gap (%) | 11,334 | 27.35% |
| Wage / Income Gap ($) | 11,334 | 72.65¢ per $1 |
| Gini / Inequality Index | 11,334 | 0.48 |
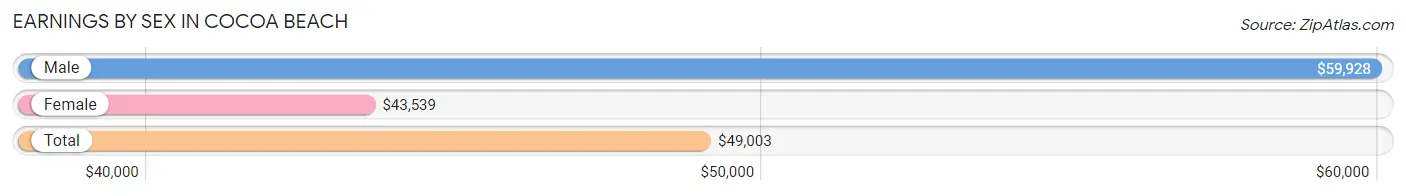
Earnings by Sex in Cocoa Beach
Average Earnings in Cocoa Beach are $49,003, $59,928 for men and $43,539 for women, a difference of 27.4%.
| Sex | Number | Average Earnings |
| Male | 2,919 (53.2%) | $59,928 |
| Female | 2,567 (46.8%) | $43,539 |
| Total | 5,486 (100.0%) | $49,003 |
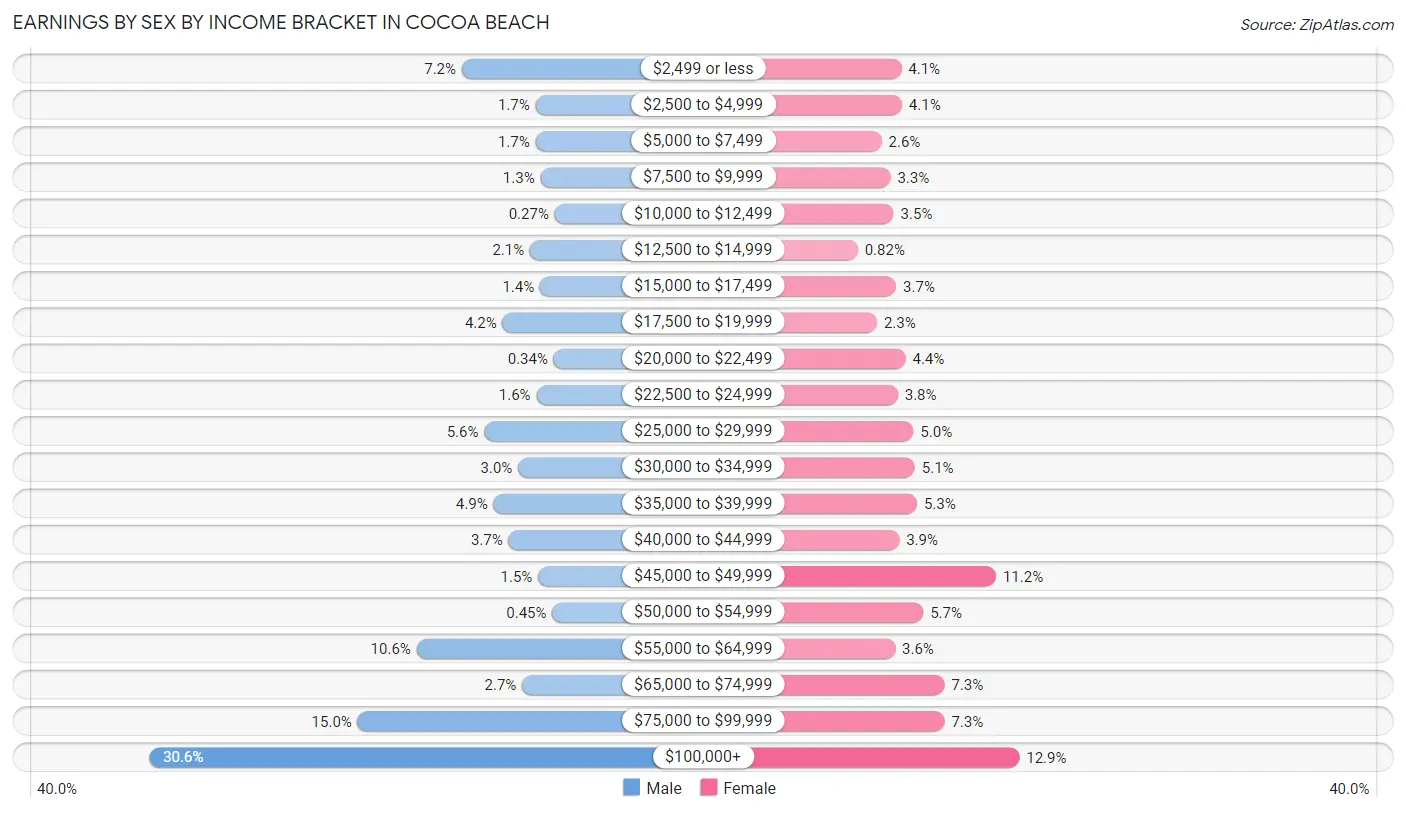
Earnings by Sex by Income Bracket in Cocoa Beach
The most common earnings brackets in Cocoa Beach are $100,000+ for men (893 | 30.6%) and $100,000+ for women (332 | 12.9%).
| Income | Male | Female |
| $2,499 or less | 211 (7.2%) | 105 (4.1%) |
| $2,500 to $4,999 | 50 (1.7%) | 106 (4.1%) |
| $5,000 to $7,499 | 50 (1.7%) | 67 (2.6%) |
| $7,500 to $9,999 | 39 (1.3%) | 84 (3.3%) |
| $10,000 to $12,499 | 8 (0.3%) | 90 (3.5%) |
| $12,500 to $14,999 | 62 (2.1%) | 21 (0.8%) |
| $15,000 to $17,499 | 40 (1.4%) | 95 (3.7%) |
| $17,500 to $19,999 | 122 (4.2%) | 58 (2.3%) |
| $20,000 to $22,499 | 10 (0.3%) | 113 (4.4%) |
| $22,500 to $24,999 | 48 (1.6%) | 98 (3.8%) |
| $25,000 to $29,999 | 162 (5.6%) | 128 (5.0%) |
| $30,000 to $34,999 | 88 (3.0%) | 131 (5.1%) |
| $35,000 to $39,999 | 142 (4.9%) | 135 (5.3%) |
| $40,000 to $44,999 | 109 (3.7%) | 101 (3.9%) |
| $45,000 to $49,999 | 44 (1.5%) | 287 (11.2%) |
| $50,000 to $54,999 | 13 (0.4%) | 147 (5.7%) |
| $55,000 to $64,999 | 310 (10.6%) | 93 (3.6%) |
| $65,000 to $74,999 | 79 (2.7%) | 188 (7.3%) |
| $75,000 to $99,999 | 439 (15.0%) | 188 (7.3%) |
| $100,000+ | 893 (30.6%) | 332 (12.9%) |
| Total | 2,919 (100.0%) | 2,567 (100.0%) |
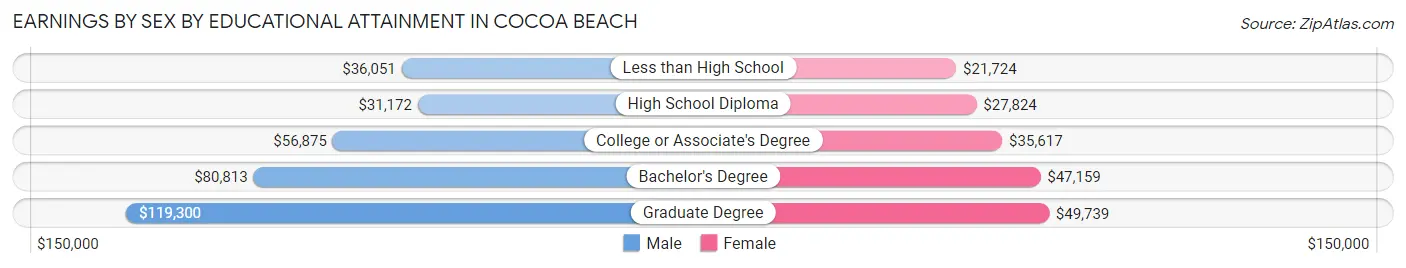
Earnings by Sex by Educational Attainment in Cocoa Beach
Average earnings in Cocoa Beach are $64,932 for men and $44,834 for women, a difference of 30.9%. Men with an educational attainment of graduate degree enjoy the highest average annual earnings of $119,300, while those with high school diploma education earn the least with $31,172. Women with an educational attainment of graduate degree earn the most with the average annual earnings of $49,739, while those with less than high school education have the smallest earnings of $21,724.
| Educational Attainment | Male Income | Female Income |
| Less than High School | $36,051 | $21,724 |
| High School Diploma | $31,172 | $27,824 |
| College or Associate's Degree | $56,875 | $35,617 |
| Bachelor's Degree | $80,813 | $47,159 |
| Graduate Degree | $119,300 | $49,739 |
| Total | $64,932 | $44,834 |
Family Income in Cocoa Beach
Family Income Brackets in Cocoa Beach
According to the Cocoa Beach family income data, there are 894 families falling into the $100,000 to $149,999 income range, which is the most common income bracket and makes up 28.9% of all families. Conversely, the $10,000 to $14,999 income bracket is the least frequent group with only 25 families (0.8%) belonging to this category.

| Income Bracket | # Families | % Families |
| Less than $10,000 | 71 | 2.3% |
| $10,000 to $14,999 | 25 | 0.8% |
| $15,000 to $24,999 | 31 | 1.0% |
| $25,000 to $34,999 | 167 | 5.4% |
| $35,000 to $49,999 | 312 | 10.1% |
| $50,000 to $74,999 | 318 | 10.3% |
| $75,000 to $99,999 | 318 | 10.3% |
| $100,000 to $149,999 | 894 | 28.9% |
| $150,000 to $199,999 | 396 | 12.8% |
| $200,000+ | 557 | 18.0% |
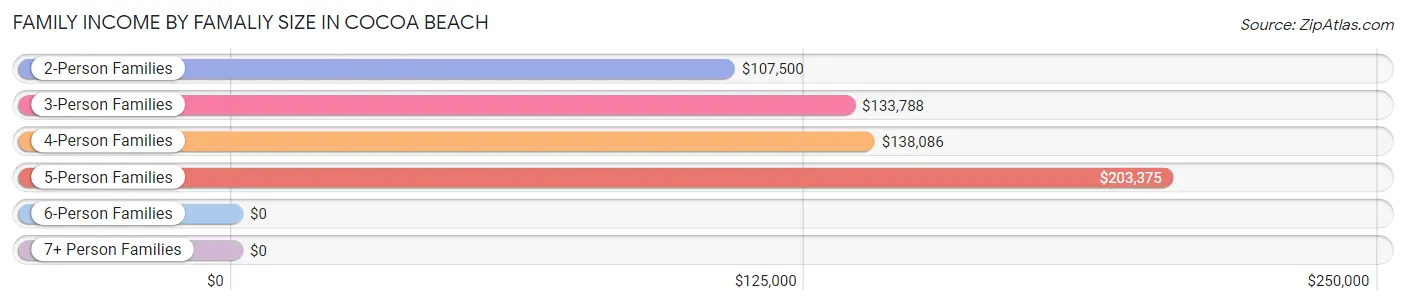
Family Income by Famaliy Size in Cocoa Beach
5-person families (61 | 2.0%) account for the highest median family income in Cocoa Beach with $203,375 per family, while 2-person families (2,326 | 75.2%) have the highest median income of $53,750 per family member.
| Income Bracket | # Families | Median Income |
| 2-Person Families | 2,326 (75.2%) | $107,500 |
| 3-Person Families | 494 (16.0%) | $133,788 |
| 4-Person Families | 211 (6.8%) | $138,086 |
| 5-Person Families | 61 (2.0%) | $203,375 |
| 6-Person Families | 0 (0.0%) | $0 |
| 7+ Person Families | 0 (0.0%) | $0 |
| Total | 3,092 (100.0%) | $116,343 |
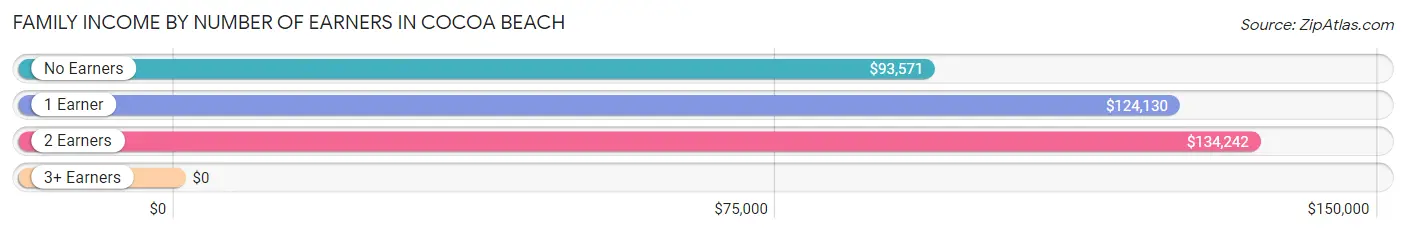
Family Income by Number of Earners in Cocoa Beach
| Number of Earners | # Families | Median Income |
| No Earners | 1,068 (34.5%) | $93,571 |
| 1 Earner | 914 (29.6%) | $124,130 |
| 2 Earners | 1,026 (33.2%) | $134,242 |
| 3+ Earners | 84 (2.7%) | $0 |
| Total | 3,092 (100.0%) | $116,343 |
Household Income in Cocoa Beach
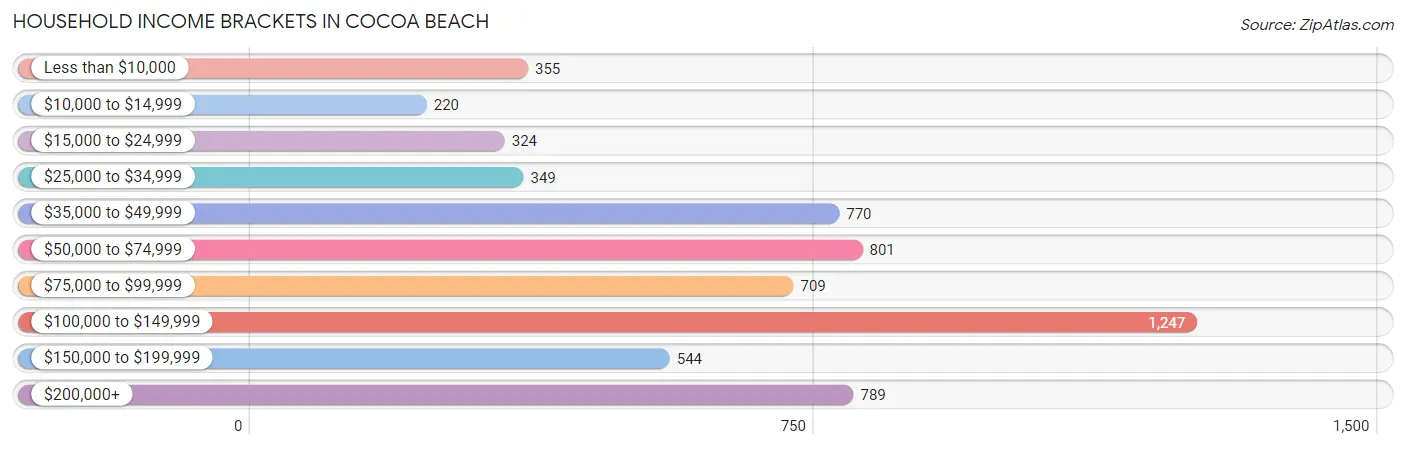
Household Income Brackets in Cocoa Beach
With 1,247 households falling in the category, the $100,000 to $149,999 income range is the most frequent in Cocoa Beach, accounting for 20.4% of all households. In contrast, only 220 households (3.6%) fall into the $10,000 to $14,999 income bracket, making it the least populous group.
| Income Bracket | # Households | % Households |
| Less than $10,000 | 355 | 5.8% |
| $10,000 to $14,999 | 220 | 3.6% |
| $15,000 to $24,999 | 324 | 5.3% |
| $25,000 to $34,999 | 349 | 5.7% |
| $35,000 to $49,999 | 770 | 12.6% |
| $50,000 to $74,999 | 801 | 13.1% |
| $75,000 to $99,999 | 709 | 11.6% |
| $100,000 to $149,999 | 1,247 | 20.4% |
| $150,000 to $199,999 | 544 | 8.9% |
| $200,000+ | 789 | 12.9% |
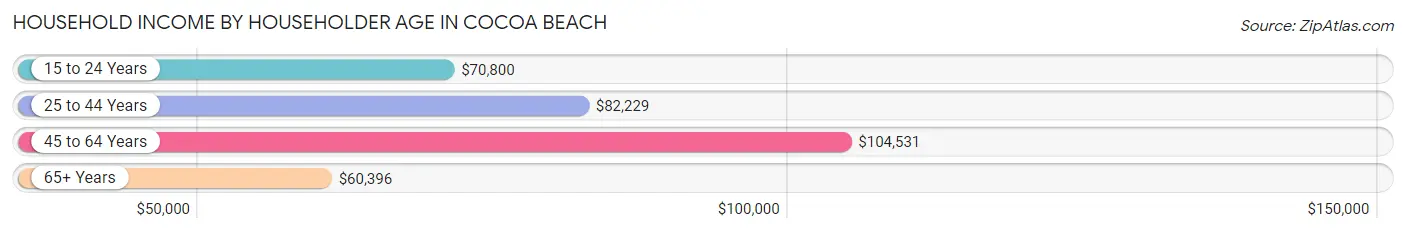
Household Income by Householder Age in Cocoa Beach
The median household income in Cocoa Beach is $80,880, with the highest median household income of $104,531 found in the 45 to 64 years age bracket for the primary householder. A total of 2,533 households (41.4%) fall into this category. Meanwhile, the 65+ years age bracket for the primary householder has the lowest median household income of $60,396, with 2,771 households (45.3%) in this group.
| Income Bracket | # Households | Median Income |
| 15 to 24 Years | 48 (0.8%) | $70,800 |
| 25 to 44 Years | 763 (12.5%) | $82,229 |
| 45 to 64 Years | 2,533 (41.4%) | $104,531 |
| 65+ Years | 2,771 (45.3%) | $60,396 |
| Total | 6,115 (100.0%) | $80,880 |
Poverty in Cocoa Beach
Income Below Poverty by Sex and Age in Cocoa Beach
With 8.2% poverty level for males and 7.5% for females among the residents of Cocoa Beach, 55 to 64 year old males and 15 year old females are the most vulnerable to poverty, with 314 males (20.1%) and 16 females (28.6%) in their respective age groups living below the poverty level.
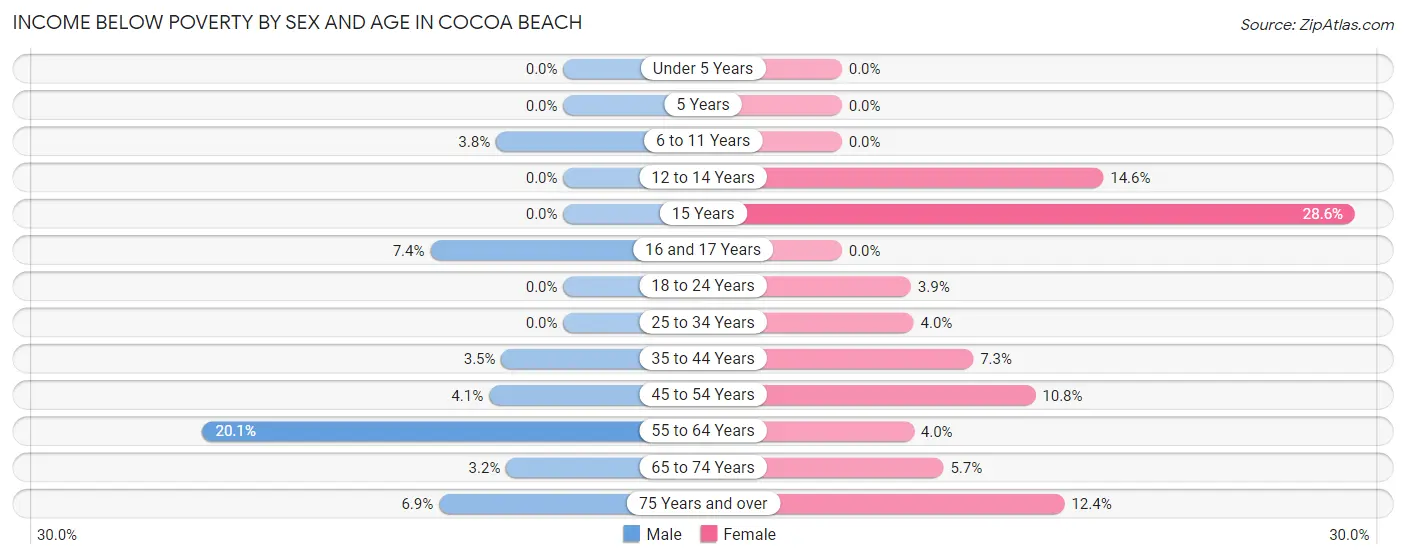
| Age Bracket | Male | Female |
| Under 5 Years | 0 (0.0%) | 0 (0.0%) |
| 5 Years | 0 (0.0%) | 0 (0.0%) |
| 6 to 11 Years | 9 (3.7%) | 0 (0.0%) |
| 12 to 14 Years | 0 (0.0%) | 15 (14.6%) |
| 15 Years | 0 (0.0%) | 16 (28.6%) |
| 16 and 17 Years | 14 (7.4%) | 0 (0.0%) |
| 18 to 24 Years | 0 (0.0%) | 10 (3.8%) |
| 25 to 34 Years | 0 (0.0%) | 8 (4.0%) |
| 35 to 44 Years | 11 (3.5%) | 36 (7.3%) |
| 45 to 54 Years | 28 (4.1%) | 102 (10.8%) |
| 55 to 64 Years | 314 (20.1%) | 47 (4.0%) |
| 65 to 74 Years | 37 (3.2%) | 52 (5.7%) |
| 75 Years and over | 65 (6.9%) | 126 (12.4%) |
| Total | 478 (8.2%) | 412 (7.5%) |
Income Above Poverty by Sex and Age in Cocoa Beach
According to the poverty statistics in Cocoa Beach, males aged under 5 years and females aged under 5 years are the age groups that are most secure financially, with 100.0% of males and 100.0% of females in these age groups living above the poverty line.
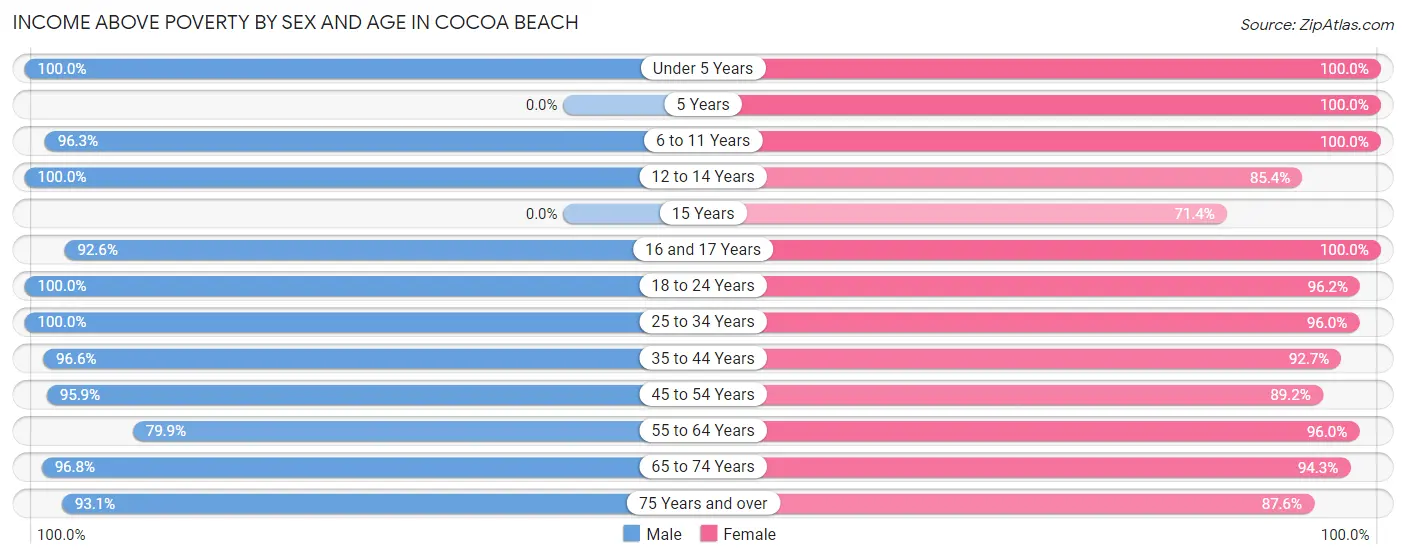
| Age Bracket | Male | Female |
| Under 5 Years | 58 (100.0%) | 68 (100.0%) |
| 5 Years | 0 (0.0%) | 49 (100.0%) |
| 6 to 11 Years | 231 (96.3%) | 113 (100.0%) |
| 12 to 14 Years | 111 (100.0%) | 88 (85.4%) |
| 15 Years | 0 (0.0%) | 40 (71.4%) |
| 16 and 17 Years | 175 (92.6%) | 91 (100.0%) |
| 18 to 24 Years | 150 (100.0%) | 250 (96.2%) |
| 25 to 34 Years | 441 (100.0%) | 192 (96.0%) |
| 35 to 44 Years | 308 (96.6%) | 456 (92.7%) |
| 45 to 54 Years | 649 (95.9%) | 844 (89.2%) |
| 55 to 64 Years | 1,249 (79.9%) | 1,125 (96.0%) |
| 65 to 74 Years | 1,125 (96.8%) | 867 (94.3%) |
| 75 Years and over | 874 (93.1%) | 890 (87.6%) |
| Total | 5,371 (91.8%) | 5,073 (92.5%) |
Income Below Poverty Among Married-Couple Families in Cocoa Beach
The poverty statistics for married-couple families in Cocoa Beach show that 3.3% or 87 of the total 2,649 families live below the poverty line. Families with 1 or 2 children have the highest poverty rate of 4.1%, comprising of 16 families. On the other hand, families with 3 or 4 children have the lowest poverty rate of 0.0%, which includes 0 families.
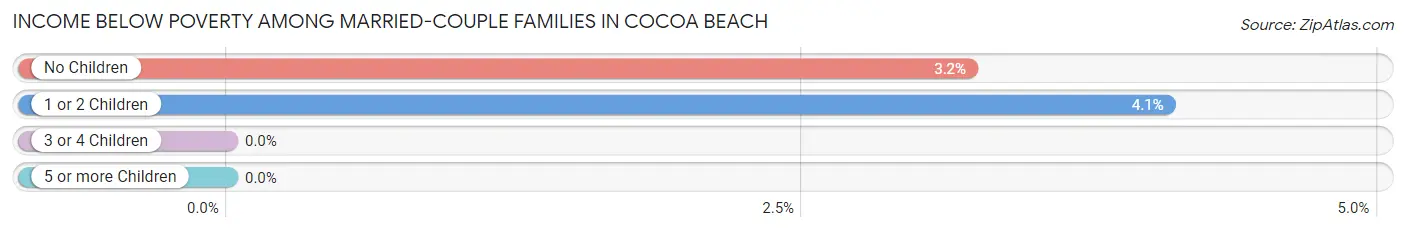
| Children | Above Poverty | Below Poverty |
| No Children | 2,136 (96.8%) | 71 (3.2%) |
| 1 or 2 Children | 376 (95.9%) | 16 (4.1%) |
| 3 or 4 Children | 50 (100.0%) | 0 (0.0%) |
| 5 or more Children | 0 (0.0%) | 0 (0.0%) |
| Total | 2,562 (96.7%) | 87 (3.3%) |
Income Below Poverty Among Single-Parent Households in Cocoa Beach
According to the poverty data in Cocoa Beach, 22.9% or 30 single-father households and 3.2% or 10 single-mother households are living below the poverty line. Among single-father households, those with no children have the highest poverty rate, with 23 households (23.5%) experiencing poverty. Likewise, among single-mother households, those with 1 or 2 children have the highest poverty rate, with 10 households (5.0%) falling below the poverty line.
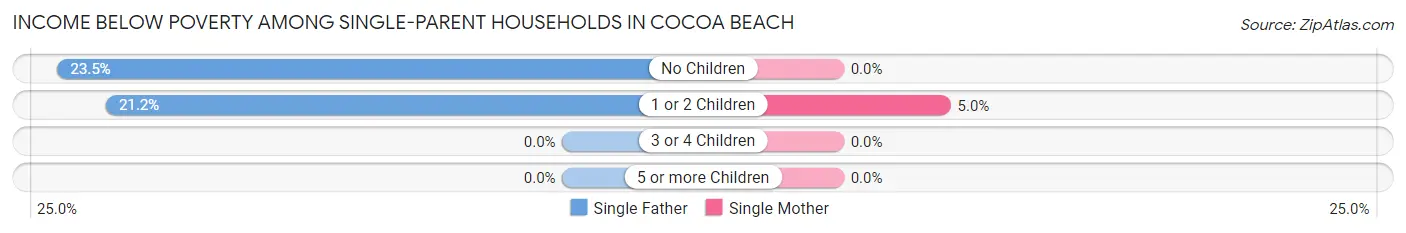
| Children | Single Father | Single Mother |
| No Children | 23 (23.5%) | 0 (0.0%) |
| 1 or 2 Children | 7 (21.2%) | 10 (5.0%) |
| 3 or 4 Children | 0 (0.0%) | 0 (0.0%) |
| 5 or more Children | 0 (0.0%) | 0 (0.0%) |
| Total | 30 (22.9%) | 10 (3.2%) |
Income Below Poverty Among Married-Couple vs Single-Parent Households in Cocoa Beach
The poverty data for Cocoa Beach shows that 87 of the married-couple family households (3.3%) and 40 of the single-parent households (9.0%) are living below the poverty level. Within the married-couple family households, those with 1 or 2 children have the highest poverty rate, with 16 households (4.1%) falling below the poverty line. Among the single-parent households, those with no children have the highest poverty rate, with 23 household (11.0%) living below poverty.
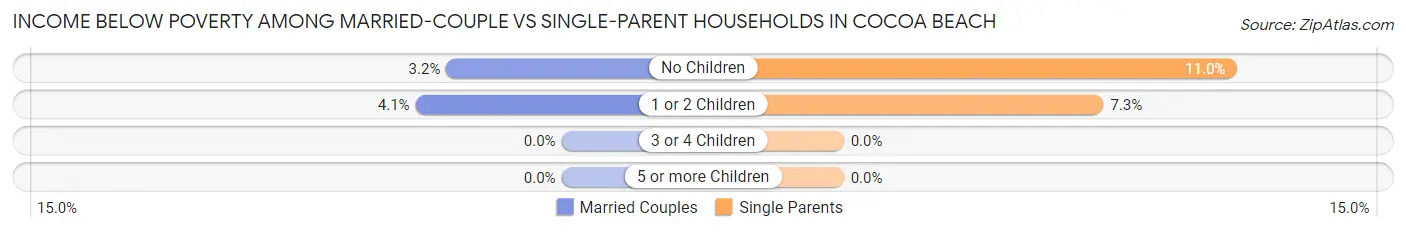
| Children | Married-Couple Families | Single-Parent Households |
| No Children | 71 (3.2%) | 23 (11.0%) |
| 1 or 2 Children | 16 (4.1%) | 17 (7.3%) |
| 3 or 4 Children | 0 (0.0%) | 0 (0.0%) |
| 5 or more Children | 0 (0.0%) | 0 (0.0%) |
| Total | 87 (3.3%) | 40 (9.0%) |
Race in Cocoa Beach
The most populous races in Cocoa Beach are White / Caucasian (10,379 | 91.6%), Hispanic or Latino (801 | 7.1%), and Two or more Races (646 | 5.7%).
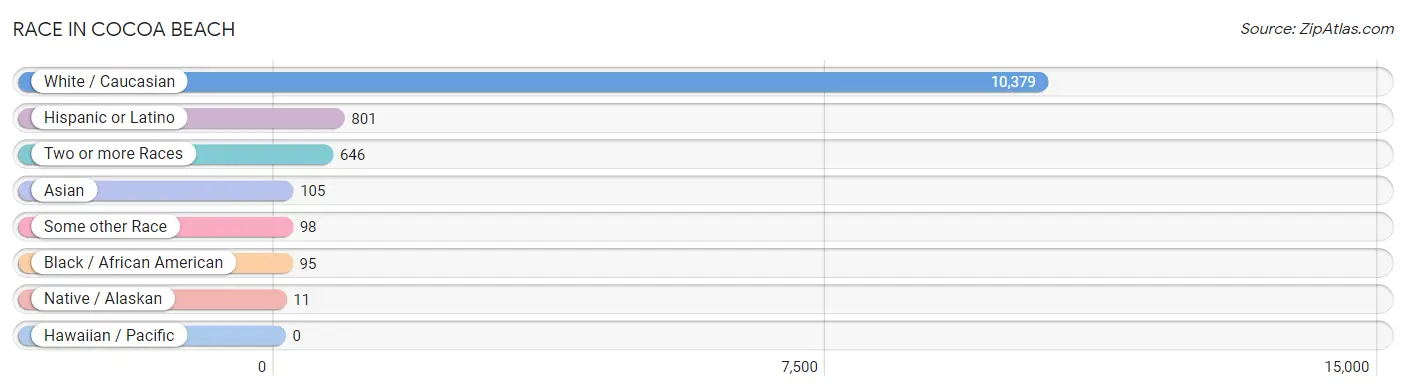
| Race | # Population | % Population |
| Asian | 105 | 0.9% |
| Black / African American | 95 | 0.8% |
| Hawaiian / Pacific | 0 | 0.0% |
| Hispanic or Latino | 801 | 7.1% |
| Native / Alaskan | 11 | 0.1% |
| White / Caucasian | 10,379 | 91.6% |
| Two or more Races | 646 | 5.7% |
| Some other Race | 98 | 0.9% |
| Total | 11,334 | 100.0% |
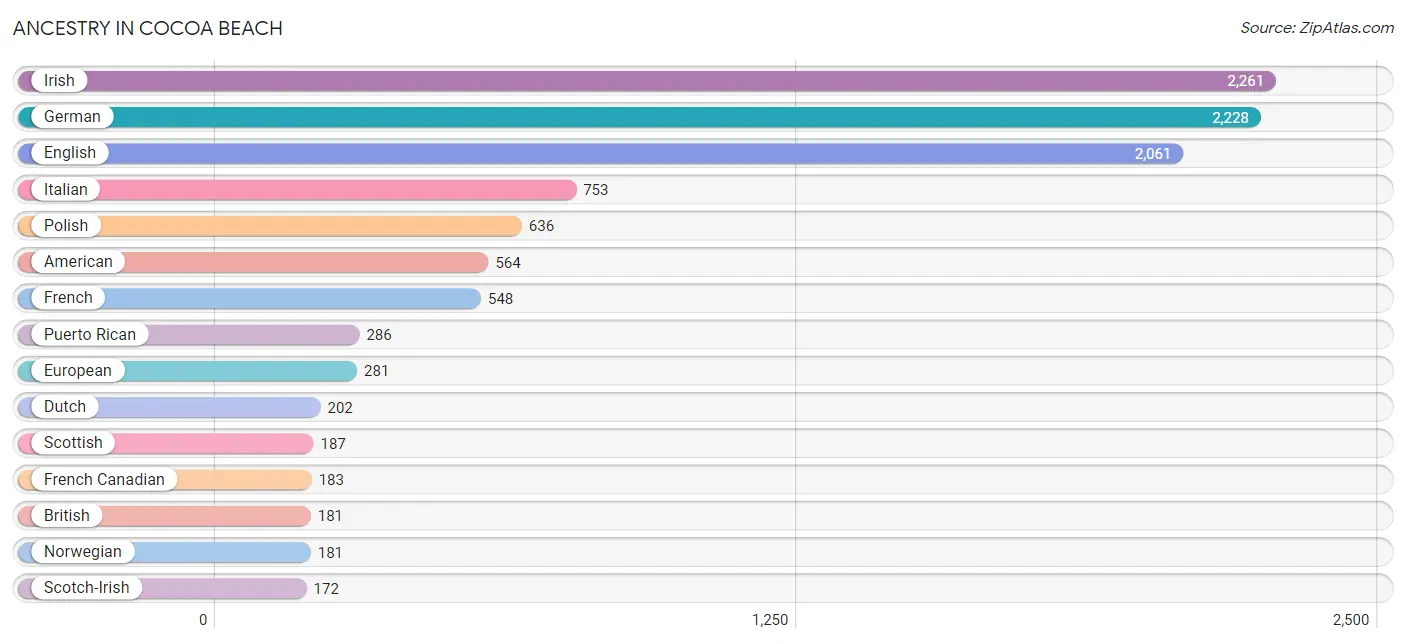
Ancestry in Cocoa Beach
The most populous ancestries reported in Cocoa Beach are Irish (2,261 | 20.0%), German (2,228 | 19.7%), English (2,061 | 18.2%), Italian (753 | 6.6%), and Polish (636 | 5.6%), together accounting for 70.0% of all Cocoa Beach residents.
| Ancestry | # Population | % Population |
| American | 564 | 5.0% |
| Arab | 57 | 0.5% |
| Armenian | 29 | 0.3% |
| Austrian | 32 | 0.3% |
| Belgian | 7 | 0.1% |
| Bhutanese | 21 | 0.2% |
| Brazilian | 26 | 0.2% |
| British | 181 | 1.6% |
| Burmese | 7 | 0.1% |
| Canadian | 87 | 0.8% |
| Central American | 19 | 0.2% |
| Central American Indian | 8 | 0.1% |
| Chinese | 138 | 1.2% |
| Colombian | 73 | 0.6% |
| Costa Rican | 11 | 0.1% |
| Croatian | 11 | 0.1% |
| Cuban | 132 | 1.2% |
| Czech | 26 | 0.2% |
| Danish | 52 | 0.5% |
| Dominican | 142 | 1.3% |
| Dutch | 202 | 1.8% |
| Eastern European | 95 | 0.8% |
| Egyptian | 10 | 0.1% |
| English | 2,061 | 18.2% |
| European | 281 | 2.5% |
| Finnish | 74 | 0.6% |
| French | 548 | 4.8% |
| French Canadian | 183 | 1.6% |
| German | 2,228 | 19.7% |
| Greek | 57 | 0.5% |
| Haitian | 40 | 0.4% |
| Hungarian | 105 | 0.9% |
| Indian (Asian) | 12 | 0.1% |
| Iranian | 61 | 0.5% |
| Irish | 2,261 | 20.0% |
| Italian | 753 | 6.6% |
| Korean | 73 | 0.6% |
| Lebanese | 31 | 0.3% |
| Lithuanian | 26 | 0.2% |
| Mexican | 120 | 1.1% |
| Moroccan | 9 | 0.1% |
| Northern European | 69 | 0.6% |
| Norwegian | 181 | 1.6% |
| Polish | 636 | 5.6% |
| Portuguese | 15 | 0.1% |
| Puerto Rican | 286 | 2.5% |
| Romanian | 11 | 0.1% |
| Russian | 97 | 0.9% |
| Salvadoran | 8 | 0.1% |
| Scandinavian | 64 | 0.6% |
| Scotch-Irish | 172 | 1.5% |
| Scottish | 187 | 1.7% |
| Slavic | 6 | 0.1% |
| Slovak | 82 | 0.7% |
| South American | 73 | 0.6% |
| Spaniard | 11 | 0.1% |
| Sri Lankan | 5 | 0.0% |
| Subsaharan African | 24 | 0.2% |
| Swedish | 86 | 0.8% |
| Swiss | 15 | 0.1% |
| Thai | 22 | 0.2% |
| Turkish | 9 | 0.1% |
| Ukrainian | 25 | 0.2% |
| Welsh | 124 | 1.1% |
| Yugoslavian | 7 | 0.1% | View All 65 Rows |
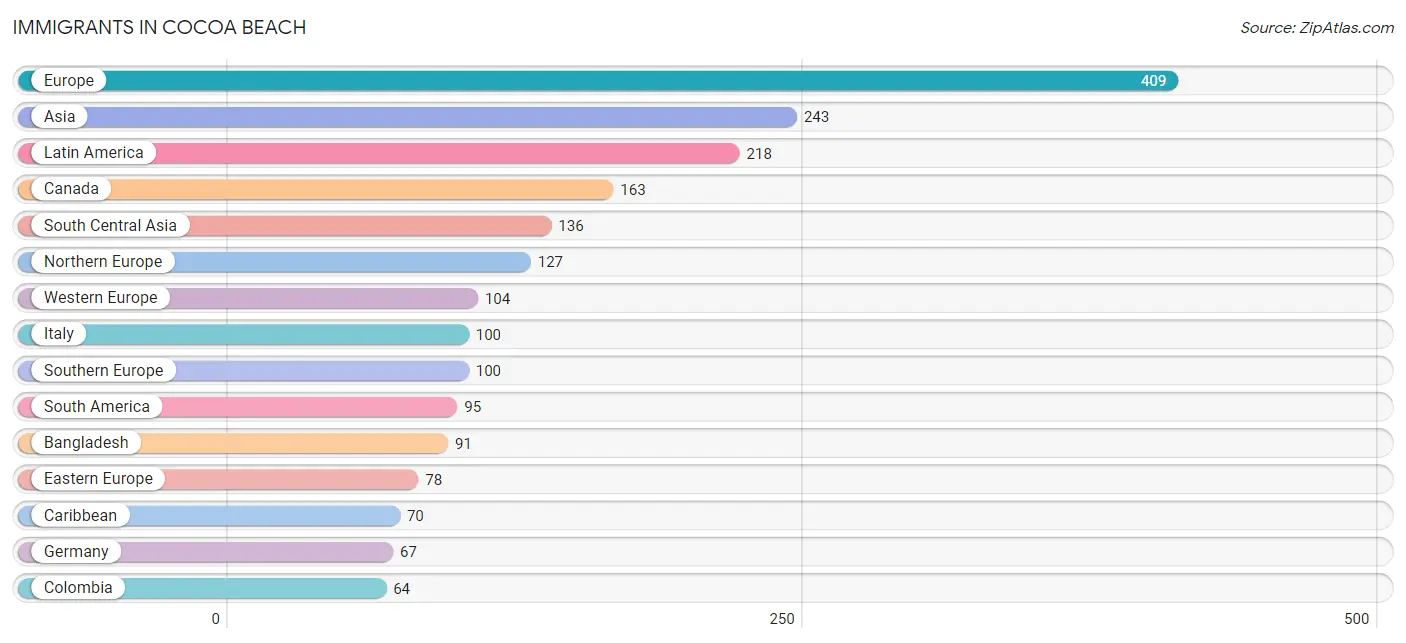
Immigrants in Cocoa Beach
The most numerous immigrant groups reported in Cocoa Beach came from Europe (409 | 3.6%), Asia (243 | 2.1%), Latin America (218 | 1.9%), Canada (163 | 1.4%), and South Central Asia (136 | 1.2%), together accounting for 10.3% of all Cocoa Beach residents.
| Immigration Origin | # Population | % Population |
| Africa | 34 | 0.3% |
| Asia | 243 | 2.1% |
| Australia | 9 | 0.1% |
| Bangladesh | 91 | 0.8% |
| Brazil | 13 | 0.1% |
| Canada | 163 | 1.4% |
| Caribbean | 70 | 0.6% |
| Central America | 53 | 0.5% |
| China | 12 | 0.1% |
| Colombia | 64 | 0.6% |
| Croatia | 5 | 0.0% |
| Dominican Republic | 30 | 0.3% |
| Eastern Asia | 18 | 0.2% |
| Eastern Europe | 78 | 0.7% |
| Egypt | 10 | 0.1% |
| El Salvador | 8 | 0.1% |
| England | 37 | 0.3% |
| Europe | 409 | 3.6% |
| France | 37 | 0.3% |
| Germany | 67 | 0.6% |
| Haiti | 40 | 0.4% |
| Hong Kong | 9 | 0.1% |
| Hungary | 38 | 0.3% |
| India | 14 | 0.1% |
| Iran | 31 | 0.3% |
| Ireland | 16 | 0.1% |
| Italy | 100 | 0.9% |
| Japan | 6 | 0.1% |
| Latin America | 218 | 1.9% |
| Mexico | 40 | 0.4% |
| Morocco | 9 | 0.1% |
| Northern Africa | 19 | 0.2% |
| Northern Europe | 127 | 1.1% |
| Oceania | 9 | 0.1% |
| Panama | 5 | 0.0% |
| Philippines | 55 | 0.5% |
| Poland | 25 | 0.2% |
| South Africa | 15 | 0.1% |
| South America | 95 | 0.8% |
| South Central Asia | 136 | 1.2% |
| South Eastern Asia | 60 | 0.5% |
| Southern Europe | 100 | 0.9% |
| Turkey | 29 | 0.3% |
| Ukraine | 10 | 0.1% |
| Venezuela | 18 | 0.2% |
| Vietnam | 5 | 0.0% |
| Western Asia | 29 | 0.3% |
| Western Europe | 104 | 0.9% | View All 48 Rows |
Sex and Age in Cocoa Beach
Sex and Age in Cocoa Beach
The most populous age groups in Cocoa Beach are 55 to 59 Years (933 | 16.0%) for men and 50 to 54 Years (615 | 11.2%) for women.
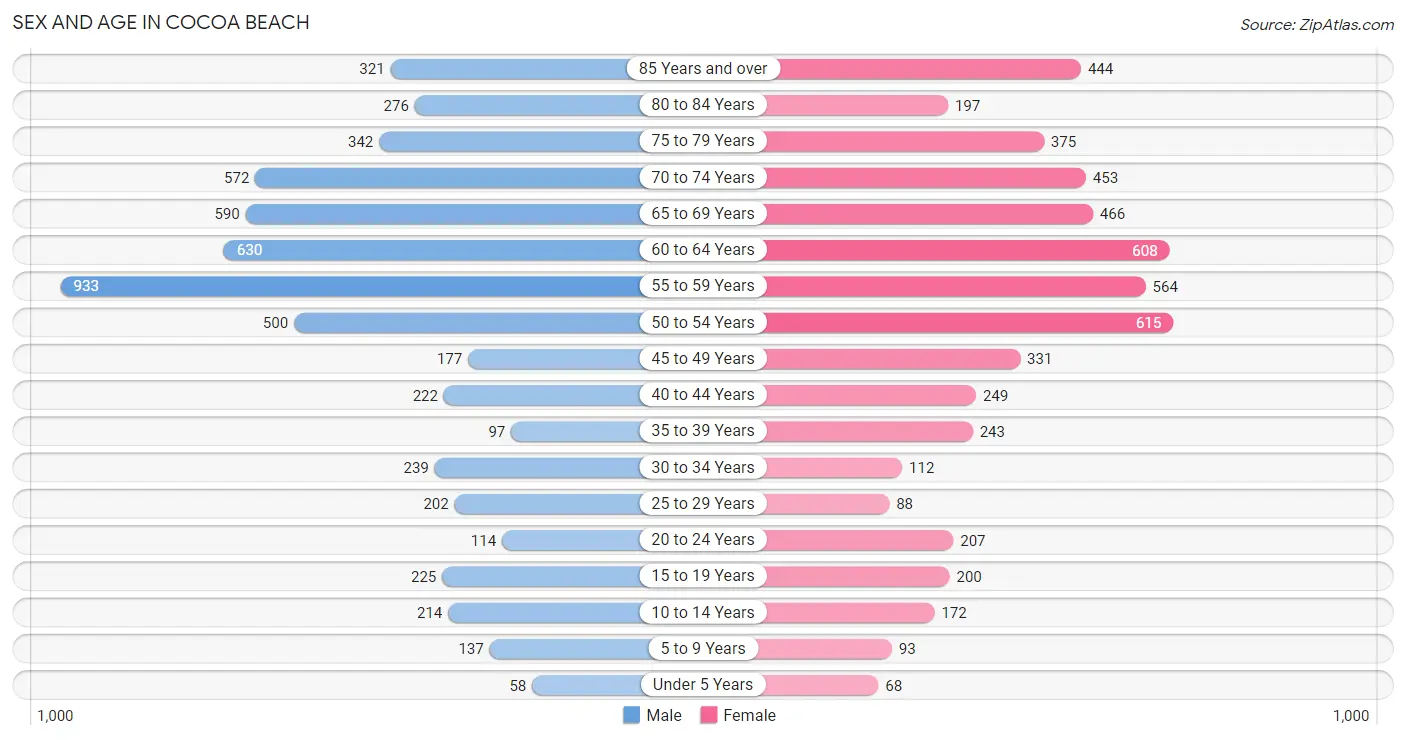
| Age Bracket | Male | Female |
| Under 5 Years | 58 (1.0%) | 68 (1.2%) |
| 5 to 9 Years | 137 (2.3%) | 93 (1.7%) |
| 10 to 14 Years | 214 (3.7%) | 172 (3.1%) |
| 15 to 19 Years | 225 (3.8%) | 200 (3.6%) |
| 20 to 24 Years | 114 (1.9%) | 207 (3.8%) |
| 25 to 29 Years | 202 (3.5%) | 88 (1.6%) |
| 30 to 34 Years | 239 (4.1%) | 112 (2.0%) |
| 35 to 39 Years | 97 (1.7%) | 243 (4.4%) |
| 40 to 44 Years | 222 (3.8%) | 249 (4.5%) |
| 45 to 49 Years | 177 (3.0%) | 331 (6.0%) |
| 50 to 54 Years | 500 (8.6%) | 615 (11.2%) |
| 55 to 59 Years | 933 (16.0%) | 564 (10.3%) |
| 60 to 64 Years | 630 (10.8%) | 608 (11.1%) |
| 65 to 69 Years | 590 (10.1%) | 466 (8.5%) |
| 70 to 74 Years | 572 (9.8%) | 453 (8.3%) |
| 75 to 79 Years | 342 (5.9%) | 375 (6.8%) |
| 80 to 84 Years | 276 (4.7%) | 197 (3.6%) |
| 85 Years and over | 321 (5.5%) | 444 (8.1%) |
| Total | 5,849 (100.0%) | 5,485 (100.0%) |
Families and Households in Cocoa Beach
Median Family Size in Cocoa Beach
The median family size in Cocoa Beach is 2.45 persons per family, with single female/mother families (312 | 10.1%) accounting for the largest median family size of 2.89 persons per family. On the other hand, married-couple families (2,649 | 85.7%) represent the smallest median family size with 2.40 persons per family.
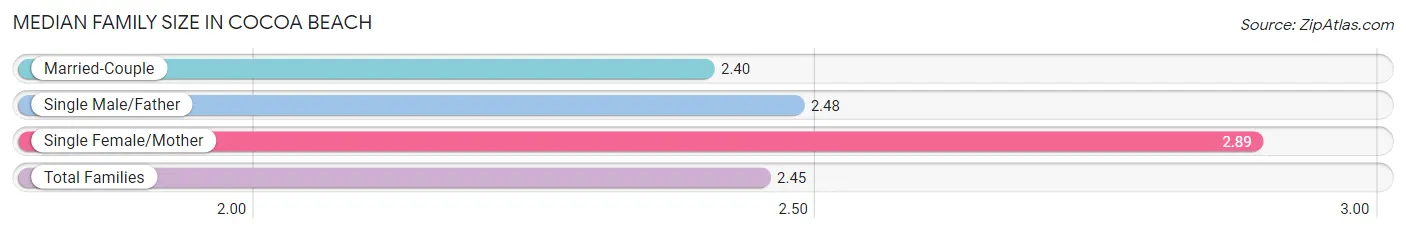
| Family Type | # Families | Family Size |
| Married-Couple | 2,649 (85.7%) | 2.40 |
| Single Male/Father | 131 (4.2%) | 2.48 |
| Single Female/Mother | 312 (10.1%) | 2.89 |
| Total Families | 3,092 (100.0%) | 2.45 |
Median Household Size in Cocoa Beach
The median household size in Cocoa Beach is 1.85 persons per household, with single female/mother households (312 | 5.1%) accounting for the largest median household size of 3.2 persons per household. non-family households (3,023 | 49.4%) represent the smallest median household size with 1.19 persons per household.
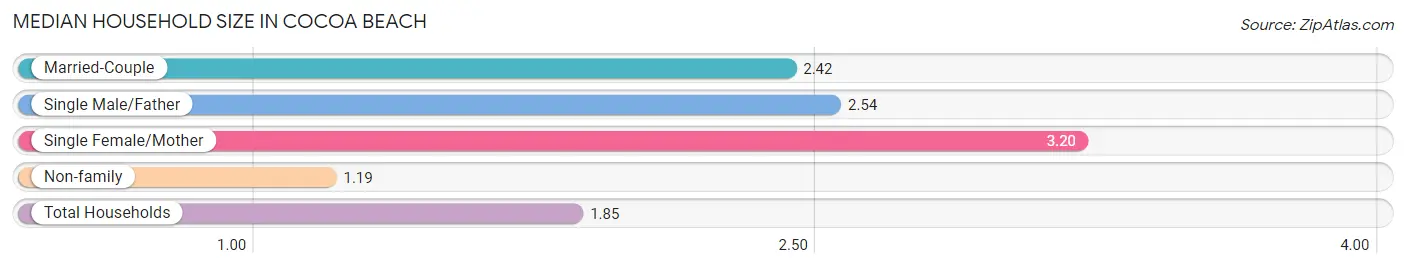
| Household Type | # Households | Household Size |
| Married-Couple | 2,649 (43.3%) | 2.42 |
| Single Male/Father | 131 (2.1%) | 2.54 |
| Single Female/Mother | 312 (5.1%) | 3.20 |
| Non-family | 3,023 (49.4%) | 1.19 |
| Total Households | 6,115 (100.0%) | 1.85 |
Household Size by Marriage Status in Cocoa Beach
Out of a total of 6,115 households in Cocoa Beach, 3,092 (50.6%) are family households, while 3,023 (49.4%) are nonfamily households. The most numerous type of family households are 2-person households, comprising 2,267, and the most common type of nonfamily households are 1-person households, comprising 2,566.
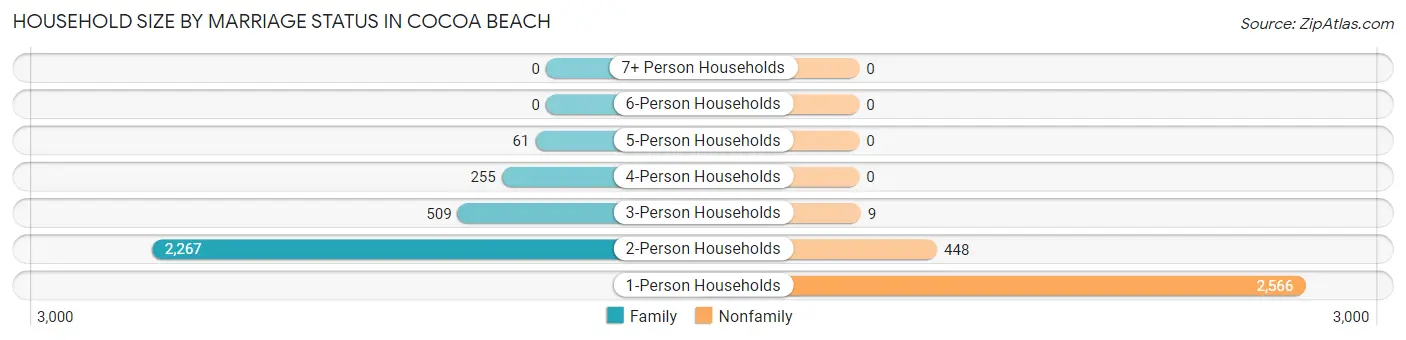
| Household Size | Family Households | Nonfamily Households |
| 1-Person Households | - | 2,566 (42.0%) |
| 2-Person Households | 2,267 (37.1%) | 448 (7.3%) |
| 3-Person Households | 509 (8.3%) | 9 (0.2%) |
| 4-Person Households | 255 (4.2%) | 0 (0.0%) |
| 5-Person Households | 61 (1.0%) | 0 (0.0%) |
| 6-Person Households | 0 (0.0%) | 0 (0.0%) |
| 7+ Person Households | 0 (0.0%) | 0 (0.0%) |
| Total | 3,092 (50.6%) | 3,023 (49.4%) |
Female Fertility in Cocoa Beach
Fertility by Age in Cocoa Beach
Average fertility rate in Cocoa Beach is 19.0 births per 1,000 women. Women in the age bracket of 20 to 34 years have the highest fertility rate with 59.0 births per 1,000 women. Women in the age bracket of 20 to 34 years acount for 77.4% of all women with births.
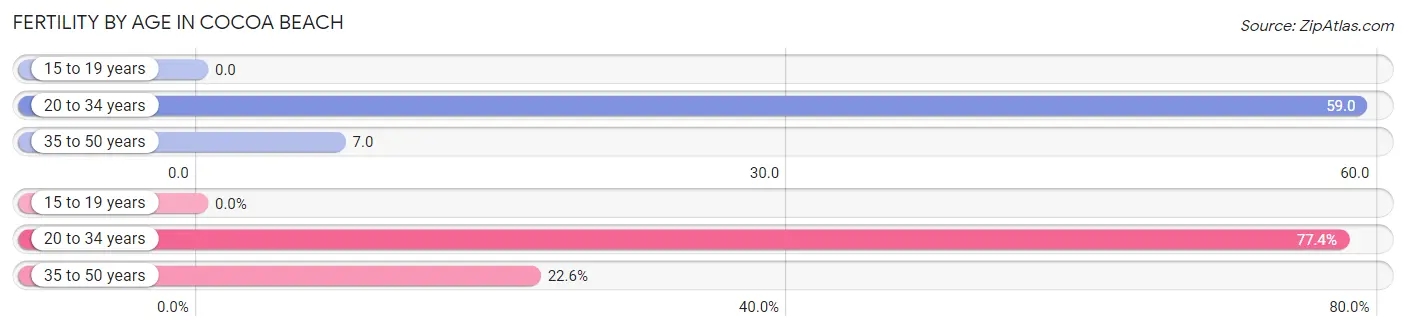
| Age Bracket | Women with Births | Births / 1,000 Women |
| 15 to 19 years | 0 (0.0%) | 0.0 |
| 20 to 34 years | 24 (77.4%) | 59.0 |
| 35 to 50 years | 7 (22.6%) | 7.0 |
| Total | 31 (100.0%) | 19.0 |
Fertility by Age by Marriage Status in Cocoa Beach
41.9% of women with births (31) in Cocoa Beach are married. The highest percentage of unmarried women with births falls into 35 to 50 years age bracket with 100.0% of them unmarried at the time of birth, while the lowest percentage of unmarried women with births belong to 20 to 34 years age bracket with 45.8% of them unmarried.
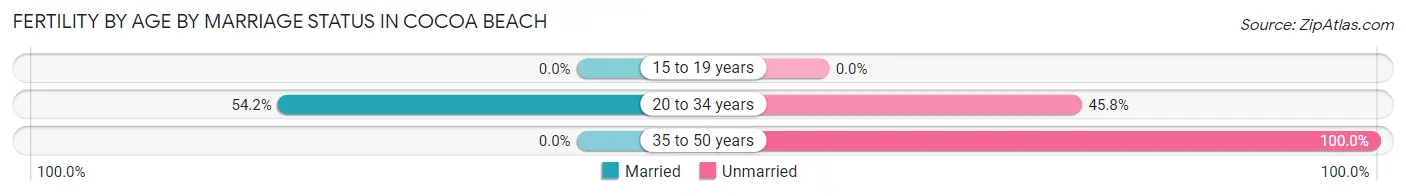
| Age Bracket | Married | Unmarried |
| 15 to 19 years | 0 (0.0%) | 0 (0.0%) |
| 20 to 34 years | 13 (54.2%) | 11 (45.8%) |
| 35 to 50 years | 0 (0.0%) | 7 (100.0%) |
| Total | 13 (41.9%) | 18 (58.1%) |
Fertility by Education in Cocoa Beach
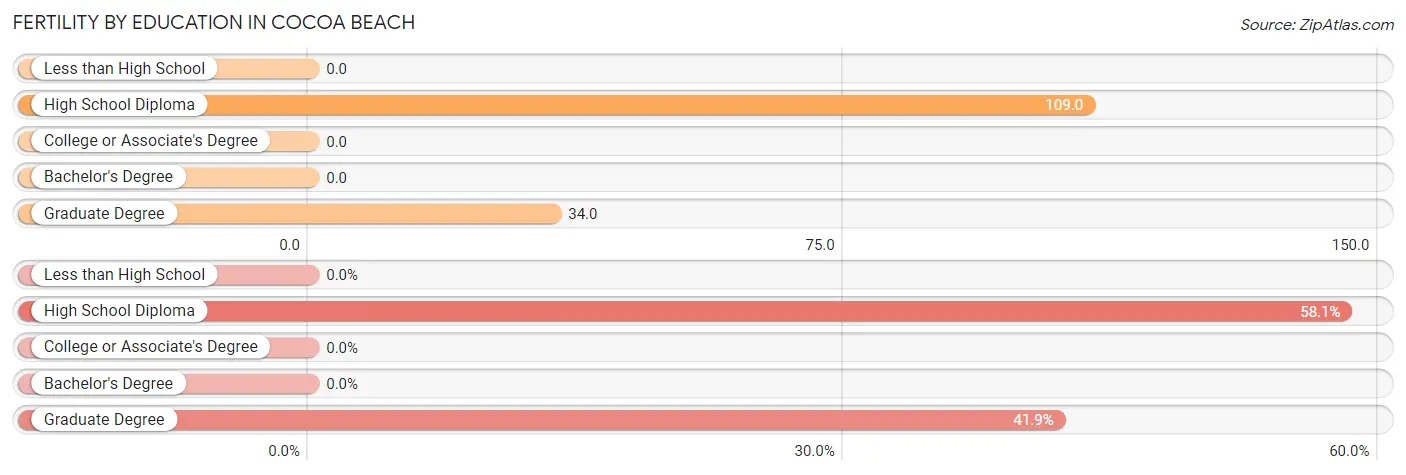
| Educational Attainment | Women with Births | Births / 1,000 Women |
| Less than High School | 0 (0.0%) | 0.0 |
| High School Diploma | 18 (58.1%) | 109.0 |
| College or Associate's Degree | 0 (0.0%) | 0.0 |
| Bachelor's Degree | 0 (0.0%) | 0.0 |
| Graduate Degree | 13 (41.9%) | 34.0 |
| Total | 31 (100.0%) | 19.0 |
Fertility by Education by Marriage Status in Cocoa Beach
58.1% of women with births in Cocoa Beach are unmarried. Women with the educational attainment of graduate degree are most likely to be married with 100.0% of them married at childbirth, while women with the educational attainment of high school diploma are least likely to be married with 100.0% of them unmarried at childbirth.
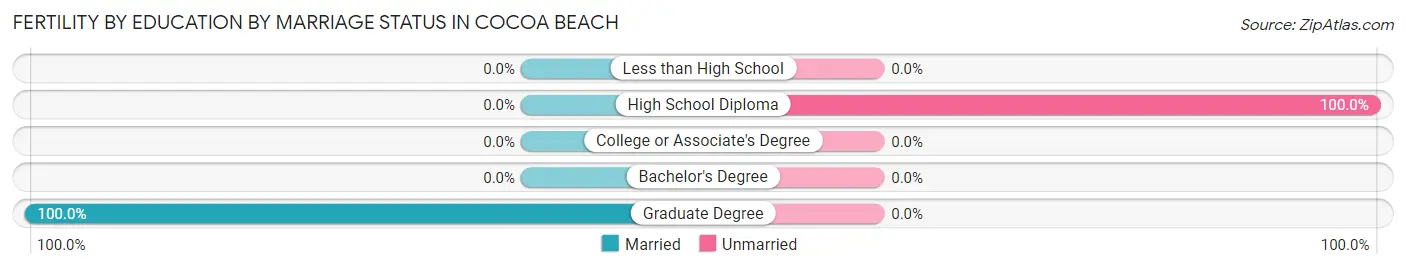
| Educational Attainment | Married | Unmarried |
| Less than High School | 0 (0.0%) | 0 (0.0%) |
| High School Diploma | 0 (0.0%) | 18 (100.0%) |
| College or Associate's Degree | 0 (0.0%) | 0 (0.0%) |
| Bachelor's Degree | 0 (0.0%) | 0 (0.0%) |
| Graduate Degree | 13 (100.0%) | 0 (0.0%) |
| Total | 13 (41.9%) | 18 (58.1%) |
Employment Characteristics in Cocoa Beach
Employment by Class of Employer in Cocoa Beach
Among the 4,781 employed individuals in Cocoa Beach, private company employees (2,887 | 60.4%), self-employed (incorporated) (397 | 8.3%), and federal government employees (380 | 8.0%) make up the most common classes of employment.
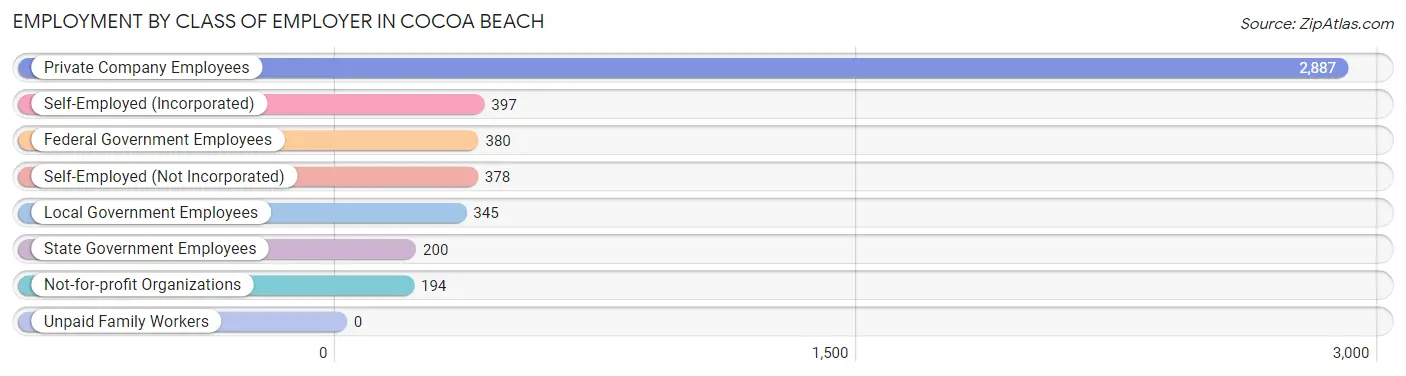
| Employer Class | # Employees | % Employees |
| Private Company Employees | 2,887 | 60.4% |
| Self-Employed (Incorporated) | 397 | 8.3% |
| Self-Employed (Not Incorporated) | 378 | 7.9% |
| Not-for-profit Organizations | 194 | 4.1% |
| Local Government Employees | 345 | 7.2% |
| State Government Employees | 200 | 4.2% |
| Federal Government Employees | 380 | 8.0% |
| Unpaid Family Workers | 0 | 0.0% |
| Total | 4,781 | 100.0% |
Employment Status by Age in Cocoa Beach
According to the labor force statistics for Cocoa Beach, out of the total population over 16 years of age (10,536), 49.8% or 5,247 individuals are in the labor force, with 7.4% or 388 of them unemployed. The age group with the highest labor force participation rate is 25 to 29 years, with 96.2% or 279 individuals in the labor force. Within the labor force, the 20 to 24 years age range has the highest percentage of unemployed individuals, with 23.0% or 62 of them being unemployed.
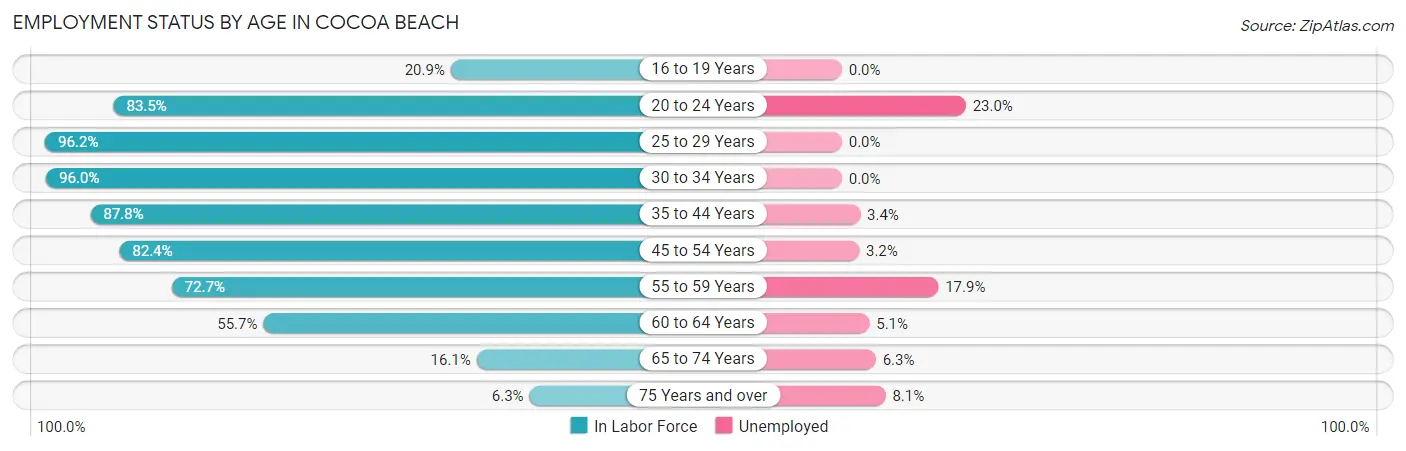
| Age Bracket | In Labor Force | Unemployed |
| 16 to 19 Years | 77 (20.9%) | 0 (0.0%) |
| 20 to 24 Years | 268 (83.5%) | 62 (23.0%) |
| 25 to 29 Years | 279 (96.2%) | 0 (0.0%) |
| 30 to 34 Years | 337 (96.0%) | 0 (0.0%) |
| 35 to 44 Years | 712 (87.8%) | 24 (3.4%) |
| 45 to 54 Years | 1,337 (82.4%) | 43 (3.2%) |
| 55 to 59 Years | 1,088 (72.7%) | 195 (17.9%) |
| 60 to 64 Years | 690 (55.7%) | 35 (5.1%) |
| 65 to 74 Years | 335 (16.1%) | 21 (6.3%) |
| 75 Years and over | 123 (6.3%) | 10 (8.1%) |
| Total | 5,247 (49.8%) | 388 (7.4%) |
Employment Status by Educational Attainment in Cocoa Beach
According to labor force statistics for Cocoa Beach, 76.5% of individuals (4,445) out of the total population between 25 and 64 years of age (5,810) are in the labor force, with 6.7% or 298 of them being unemployed. The group with the highest labor force participation rate are those with the educational attainment of college / associate degree, with 81.9% or 1,371 individuals in the labor force. Within the labor force, individuals with bachelor's degree or higher education have the highest percentage of unemployment, with 9.2% or 226 of them being unemployed.
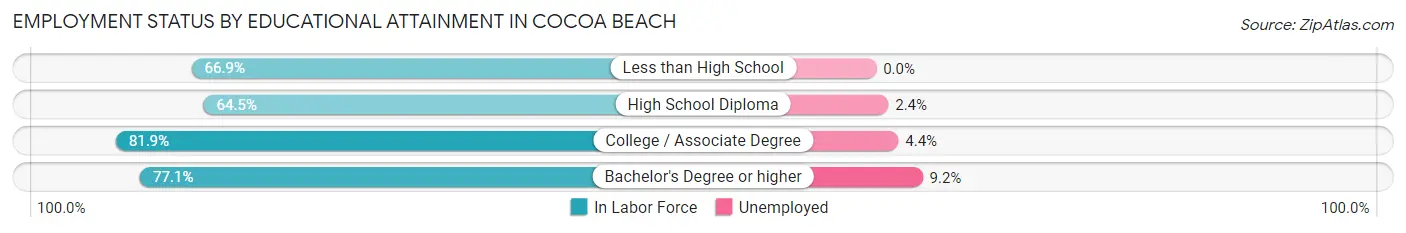
| Educational Attainment | In Labor Force | Unemployed |
| Less than High School | 119 (66.9%) | 0 (0.0%) |
| High School Diploma | 501 (64.5%) | 19 (2.4%) |
| College / Associate Degree | 1,371 (81.9%) | 74 (4.4%) |
| Bachelor's Degree or higher | 2,453 (77.1%) | 293 (9.2%) |
| Total | 4,445 (76.5%) | 389 (6.7%) |
Employment Occupations by Sex in Cocoa Beach
Management, Business, Science and Arts Occupations
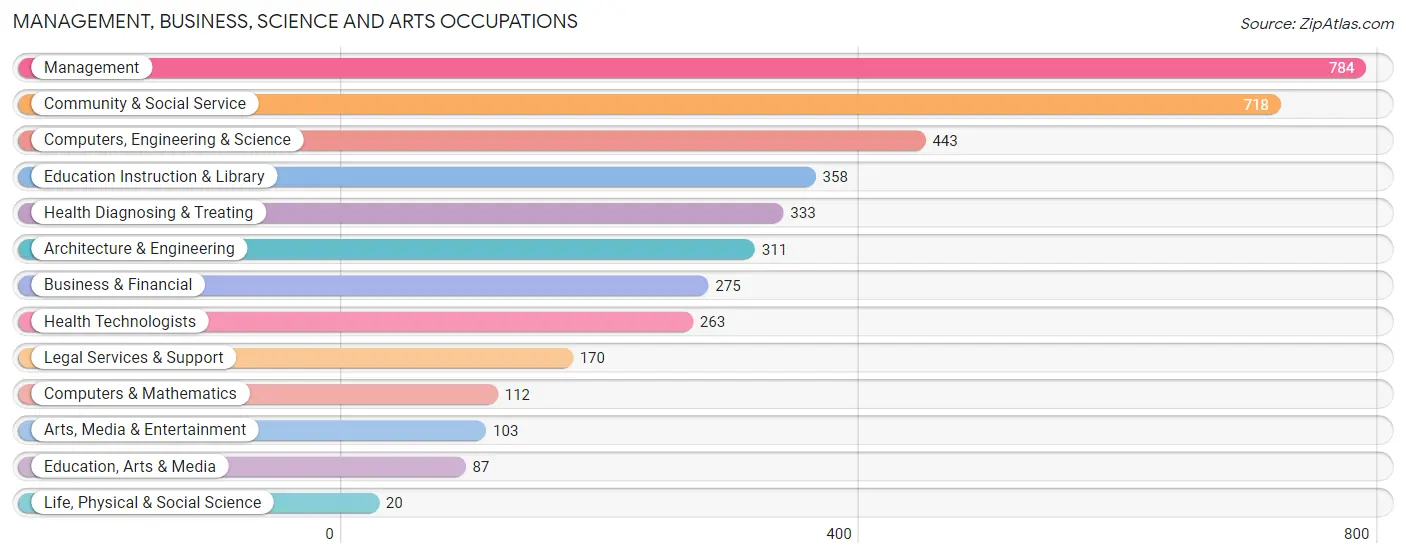
The most common Management, Business, Science and Arts occupations in Cocoa Beach are Management (784 | 16.3%), Community & Social Service (718 | 14.9%), Computers, Engineering & Science (443 | 9.2%), Education Instruction & Library (358 | 7.4%), and Health Diagnosing & Treating (333 | 6.9%).
Management, Business, Science and Arts Occupations by Sex
Within the Management, Business, Science and Arts occupations in Cocoa Beach, the most male-oriented occupations are Architecture & Engineering (87.1%), Computers, Engineering & Science (84.7%), and Computers & Mathematics (81.2%), while the most female-oriented occupations are Health Diagnosing & Treating (76.9%), Health Technologists (75.3%), and Education, Arts & Media (71.3%).
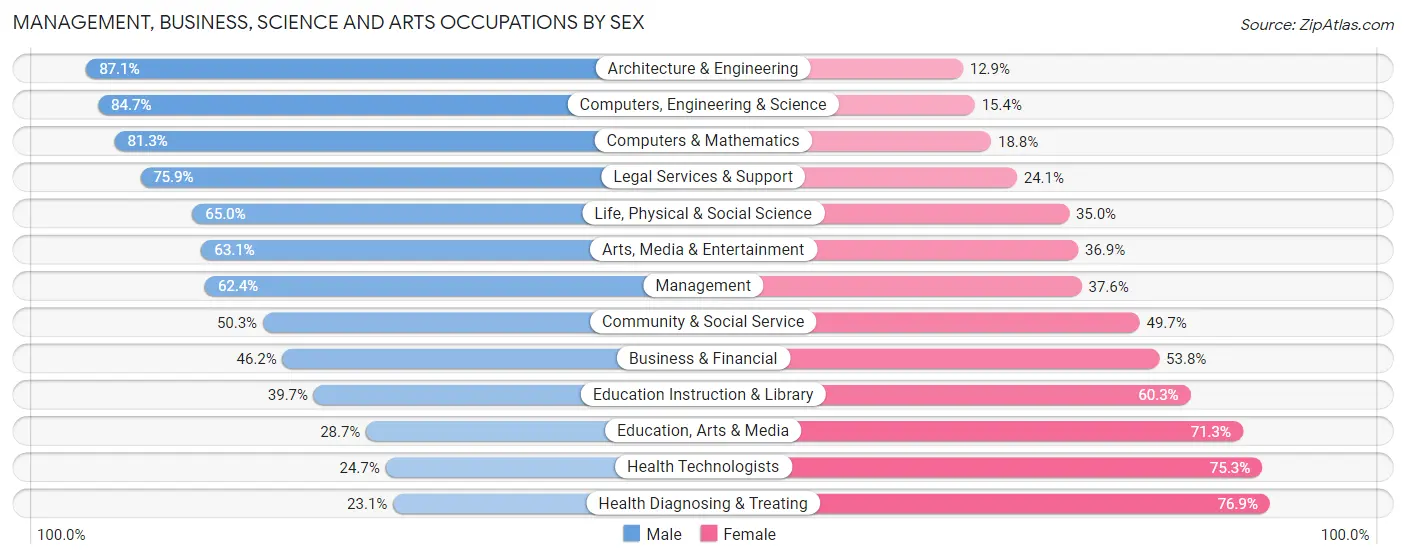
| Occupation | Male | Female |
| Management | 489 (62.4%) | 295 (37.6%) |
| Business & Financial | 127 (46.2%) | 148 (53.8%) |
| Computers, Engineering & Science | 375 (84.7%) | 68 (15.3%) |
| Computers & Mathematics | 91 (81.2%) | 21 (18.8%) |
| Architecture & Engineering | 271 (87.1%) | 40 (12.9%) |
| Life, Physical & Social Science | 13 (65.0%) | 7 (35.0%) |
| Community & Social Service | 361 (50.3%) | 357 (49.7%) |
| Education, Arts & Media | 25 (28.7%) | 62 (71.3%) |
| Legal Services & Support | 129 (75.9%) | 41 (24.1%) |
| Education Instruction & Library | 142 (39.7%) | 216 (60.3%) |
| Arts, Media & Entertainment | 65 (63.1%) | 38 (36.9%) |
| Health Diagnosing & Treating | 77 (23.1%) | 256 (76.9%) |
| Health Technologists | 65 (24.7%) | 198 (75.3%) |
| Total (Category) | 1,429 (56.0%) | 1,124 (44.0%) |
| Total (Overall) | 2,582 (53.6%) | 2,239 (46.4%) |
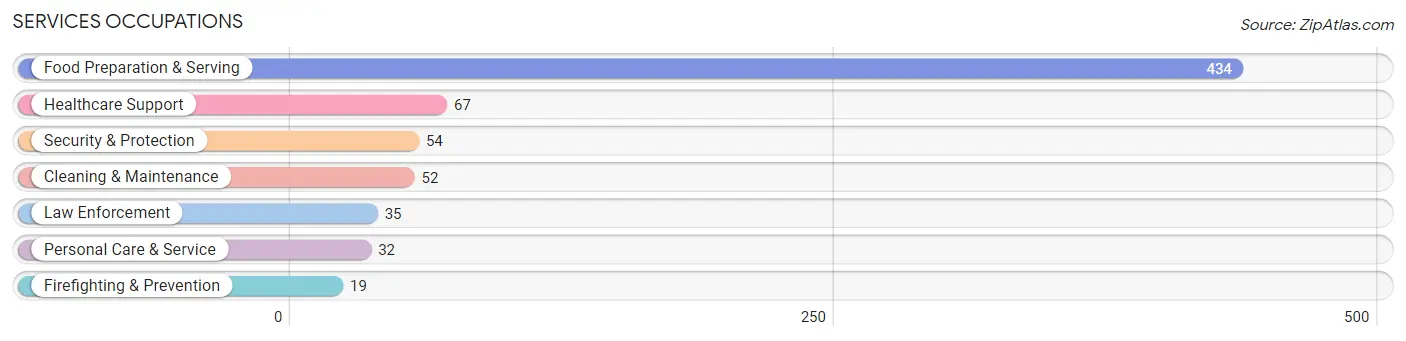
Services Occupations
The most common Services occupations in Cocoa Beach are Food Preparation & Serving (434 | 9.0%), Healthcare Support (67 | 1.4%), Security & Protection (54 | 1.1%), Cleaning & Maintenance (52 | 1.1%), and Law Enforcement (35 | 0.7%).
Services Occupations by Sex
Within the Services occupations in Cocoa Beach, the most male-oriented occupations are Firefighting & Prevention (100.0%), Cleaning & Maintenance (100.0%), and Security & Protection (50.0%), while the most female-oriented occupations are Law Enforcement (77.1%), Healthcare Support (74.6%), and Food Preparation & Serving (72.4%).
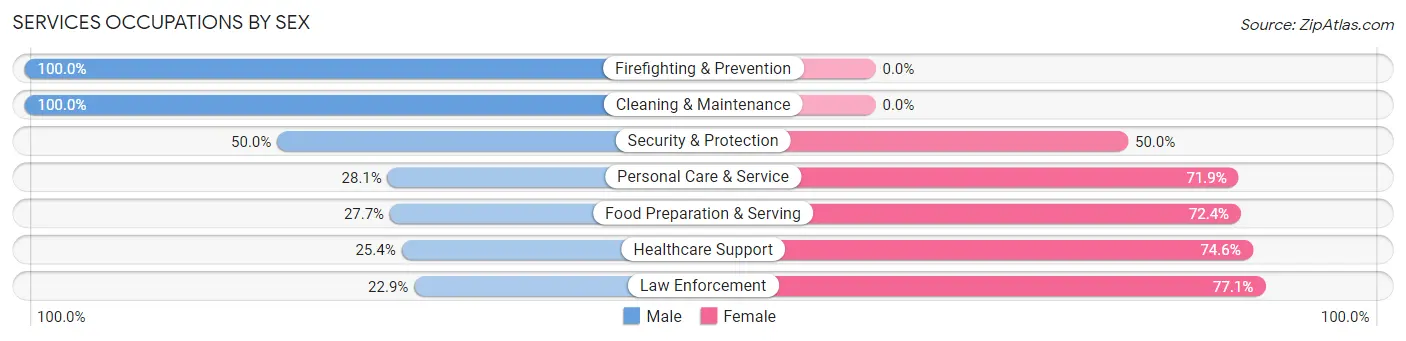
| Occupation | Male | Female |
| Healthcare Support | 17 (25.4%) | 50 (74.6%) |
| Security & Protection | 27 (50.0%) | 27 (50.0%) |
| Firefighting & Prevention | 19 (100.0%) | 0 (0.0%) |
| Law Enforcement | 8 (22.9%) | 27 (77.1%) |
| Food Preparation & Serving | 120 (27.7%) | 314 (72.4%) |
| Cleaning & Maintenance | 52 (100.0%) | 0 (0.0%) |
| Personal Care & Service | 9 (28.1%) | 23 (71.9%) |
| Total (Category) | 225 (35.2%) | 414 (64.8%) |
| Total (Overall) | 2,582 (53.6%) | 2,239 (46.4%) |
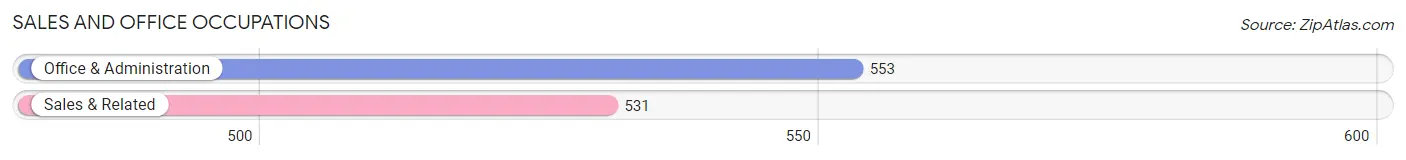
Sales and Office Occupations
The most common Sales and Office occupations in Cocoa Beach are Office & Administration (553 | 11.5%), and Sales & Related (531 | 11.0%).
Sales and Office Occupations by Sex
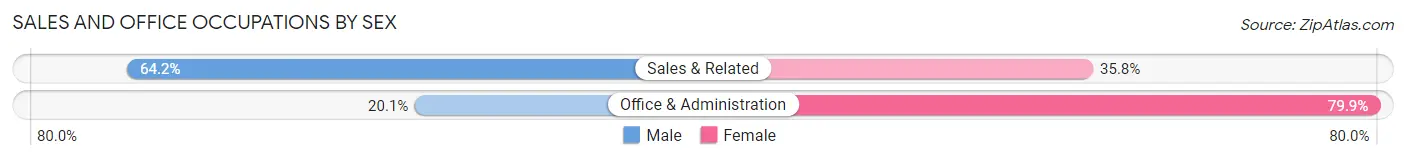
| Occupation | Male | Female |
| Sales & Related | 341 (64.2%) | 190 (35.8%) |
| Office & Administration | 111 (20.1%) | 442 (79.9%) |
| Total (Category) | 452 (41.7%) | 632 (58.3%) |
| Total (Overall) | 2,582 (53.6%) | 2,239 (46.4%) |
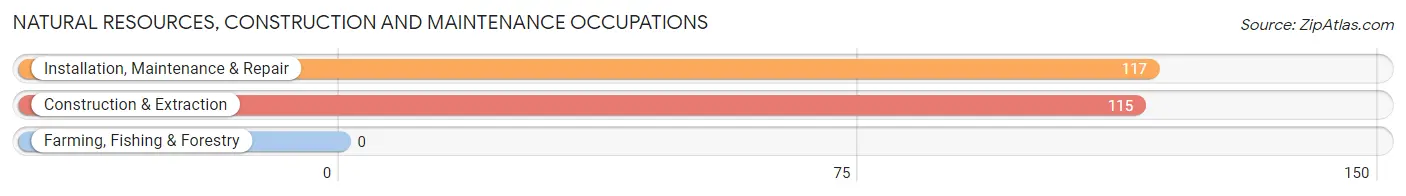
Natural Resources, Construction and Maintenance Occupations
The most common Natural Resources, Construction and Maintenance occupations in Cocoa Beach are Installation, Maintenance & Repair (117 | 2.4%), and Construction & Extraction (115 | 2.4%).
Natural Resources, Construction and Maintenance Occupations by Sex
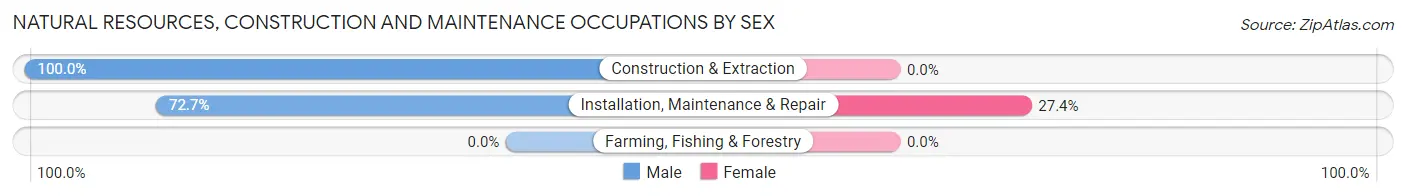
| Occupation | Male | Female |
| Farming, Fishing & Forestry | 0 (0.0%) | 0 (0.0%) |
| Construction & Extraction | 115 (100.0%) | 0 (0.0%) |
| Installation, Maintenance & Repair | 85 (72.7%) | 32 (27.4%) |
| Total (Category) | 200 (86.2%) | 32 (13.8%) |
| Total (Overall) | 2,582 (53.6%) | 2,239 (46.4%) |
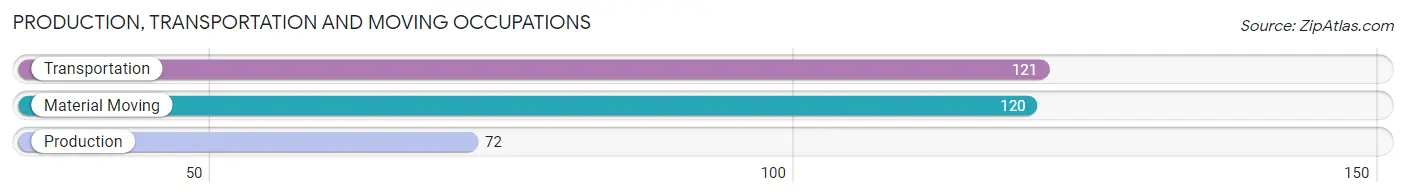
Production, Transportation and Moving Occupations
The most common Production, Transportation and Moving occupations in Cocoa Beach are Transportation (121 | 2.5%), Material Moving (120 | 2.5%), and Production (72 | 1.5%).
Production, Transportation and Moving Occupations by Sex
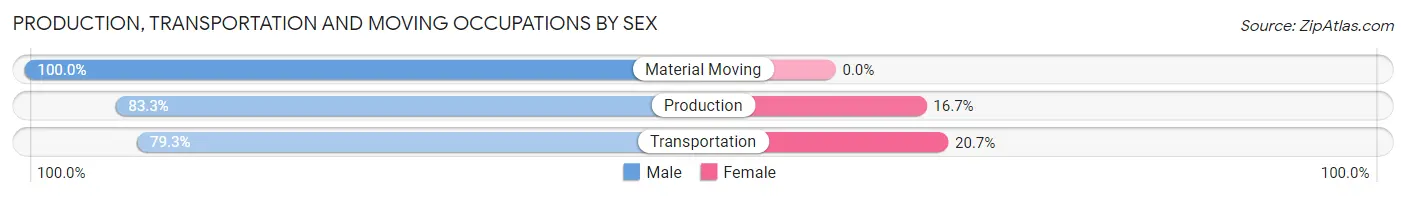
| Occupation | Male | Female |
| Production | 60 (83.3%) | 12 (16.7%) |
| Transportation | 96 (79.3%) | 25 (20.7%) |
| Material Moving | 120 (100.0%) | 0 (0.0%) |
| Total (Category) | 276 (88.2%) | 37 (11.8%) |
| Total (Overall) | 2,582 (53.6%) | 2,239 (46.4%) |
Employment Industries by Sex in Cocoa Beach
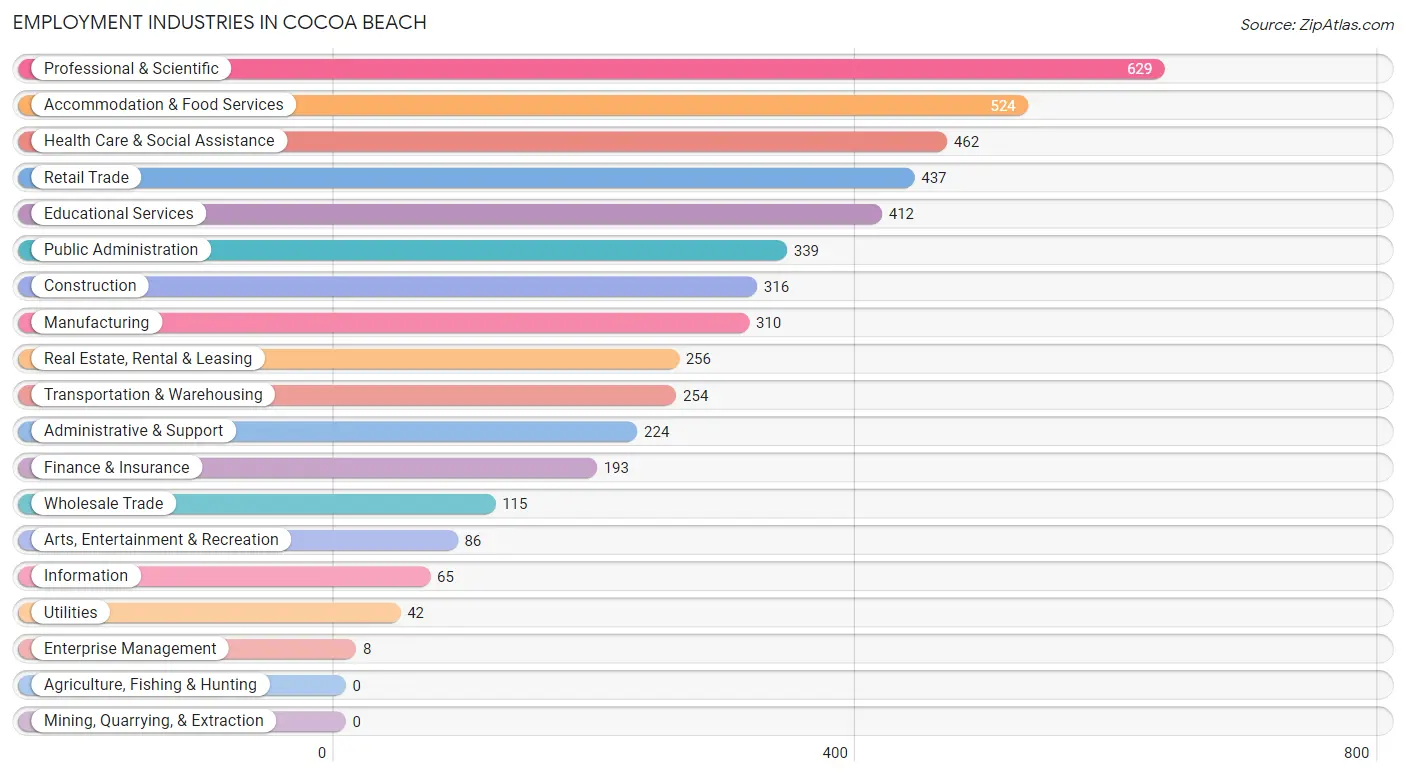
Employment Industries in Cocoa Beach
The major employment industries in Cocoa Beach include Professional & Scientific (629 | 13.1%), Accommodation & Food Services (524 | 10.9%), Health Care & Social Assistance (462 | 9.6%), Retail Trade (437 | 9.1%), and Educational Services (412 | 8.6%).
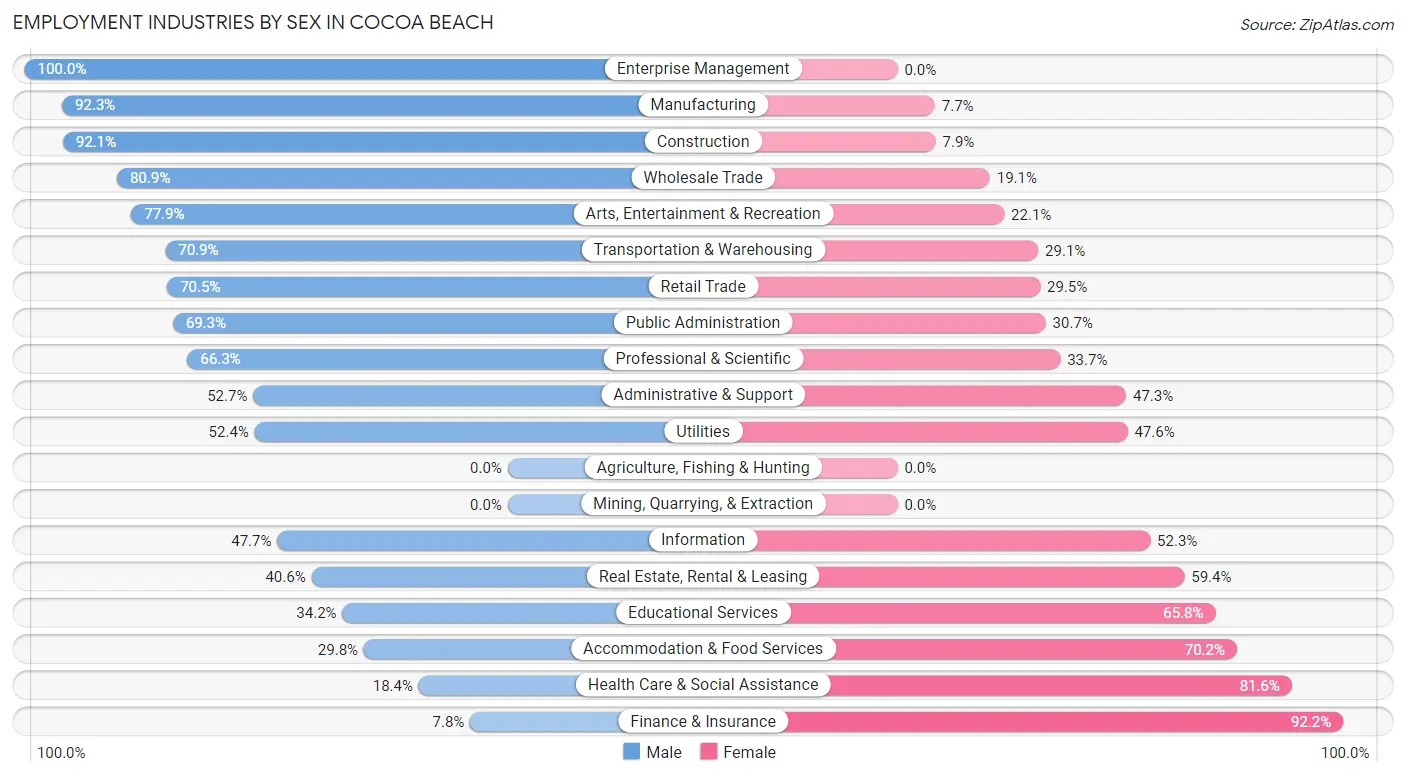
Employment Industries by Sex in Cocoa Beach
The Cocoa Beach industries that see more men than women are Enterprise Management (100.0%), Manufacturing (92.3%), and Construction (92.1%), whereas the industries that tend to have a higher number of women are Finance & Insurance (92.2%), Health Care & Social Assistance (81.6%), and Accommodation & Food Services (70.2%).
| Industry | Male | Female |
| Agriculture, Fishing & Hunting | 0 (0.0%) | 0 (0.0%) |
| Mining, Quarrying, & Extraction | 0 (0.0%) | 0 (0.0%) |
| Construction | 291 (92.1%) | 25 (7.9%) |
| Manufacturing | 286 (92.3%) | 24 (7.7%) |
| Wholesale Trade | 93 (80.9%) | 22 (19.1%) |
| Retail Trade | 308 (70.5%) | 129 (29.5%) |
| Transportation & Warehousing | 180 (70.9%) | 74 (29.1%) |
| Utilities | 22 (52.4%) | 20 (47.6%) |
| Information | 31 (47.7%) | 34 (52.3%) |
| Finance & Insurance | 15 (7.8%) | 178 (92.2%) |
| Real Estate, Rental & Leasing | 104 (40.6%) | 152 (59.4%) |
| Professional & Scientific | 417 (66.3%) | 212 (33.7%) |
| Enterprise Management | 8 (100.0%) | 0 (0.0%) |
| Administrative & Support | 118 (52.7%) | 106 (47.3%) |
| Educational Services | 141 (34.2%) | 271 (65.8%) |
| Health Care & Social Assistance | 85 (18.4%) | 377 (81.6%) |
| Arts, Entertainment & Recreation | 67 (77.9%) | 19 (22.1%) |
| Accommodation & Food Services | 156 (29.8%) | 368 (70.2%) |
| Public Administration | 235 (69.3%) | 104 (30.7%) |
| Total | 2,582 (53.6%) | 2,239 (46.4%) |
Education in Cocoa Beach
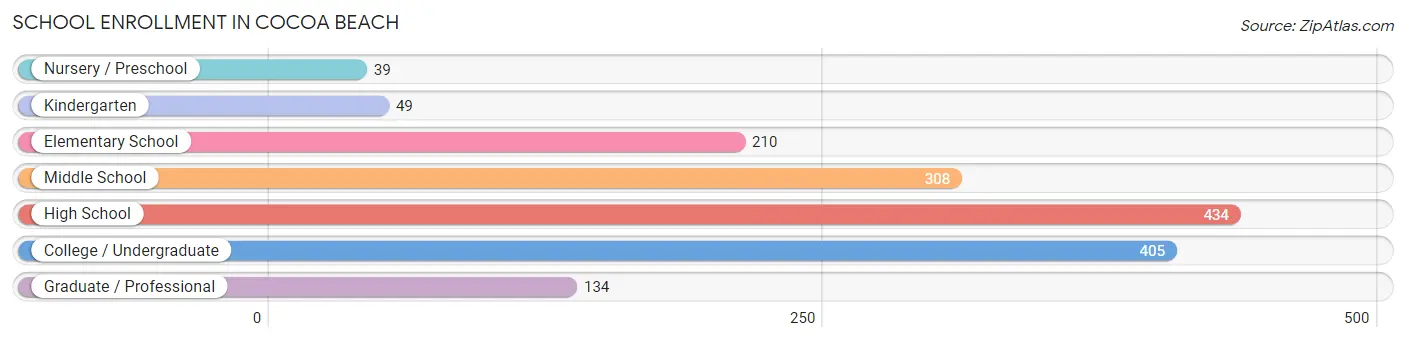
School Enrollment in Cocoa Beach
The most common levels of schooling among the 1,579 students in Cocoa Beach are high school (434 | 27.5%), college / undergraduate (405 | 25.7%), and middle school (308 | 19.5%).
| School Level | # Students | % Students |
| Nursery / Preschool | 39 | 2.5% |
| Kindergarten | 49 | 3.1% |
| Elementary School | 210 | 13.3% |
| Middle School | 308 | 19.5% |
| High School | 434 | 27.5% |
| College / Undergraduate | 405 | 25.7% |
| Graduate / Professional | 134 | 8.5% |
| Total | 1,579 | 100.0% |
School Enrollment by Age by Funding Source in Cocoa Beach
Out of a total of 1,579 students who are enrolled in schools in Cocoa Beach, 325 (20.6%) attend a private institution, while the remaining 1,254 (79.4%) are enrolled in public schools. The age group of 3 to 4 year olds has the highest likelihood of being enrolled in private schools, with 24 (61.5% in the age bracket) enrolled. Conversely, the age group of 5 to 9 year old has the lowest likelihood of being enrolled in a private school, with 230 (100.0% in the age bracket) attending a public institution.
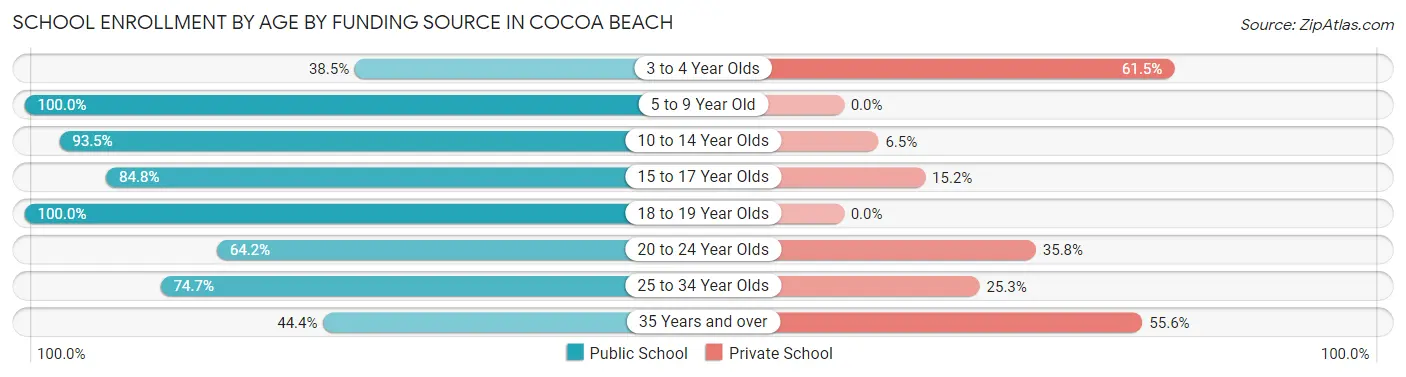
| Age Bracket | Public School | Private School |
| 3 to 4 Year Olds | 15 (38.5%) | 24 (61.5%) |
| 5 to 9 Year Old | 230 (100.0%) | 0 (0.0%) |
| 10 to 14 Year Olds | 361 (93.5%) | 25 (6.5%) |
| 15 to 17 Year Olds | 285 (84.8%) | 51 (15.2%) |
| 18 to 19 Year Olds | 76 (100.0%) | 0 (0.0%) |
| 20 to 24 Year Olds | 113 (64.2%) | 63 (35.8%) |
| 25 to 34 Year Olds | 59 (74.7%) | 20 (25.3%) |
| 35 Years and over | 114 (44.4%) | 143 (55.6%) |
| Total | 1,254 (79.4%) | 325 (20.6%) |
Educational Attainment by Field of Study in Cocoa Beach
Business (1,029 | 19.2%), engineering (935 | 17.5%), education (698 | 13.0%), science & technology (409 | 7.6%), and social sciences (383 | 7.1%) are the most common fields of study among 5,354 individuals in Cocoa Beach who have obtained a bachelor's degree or higher.
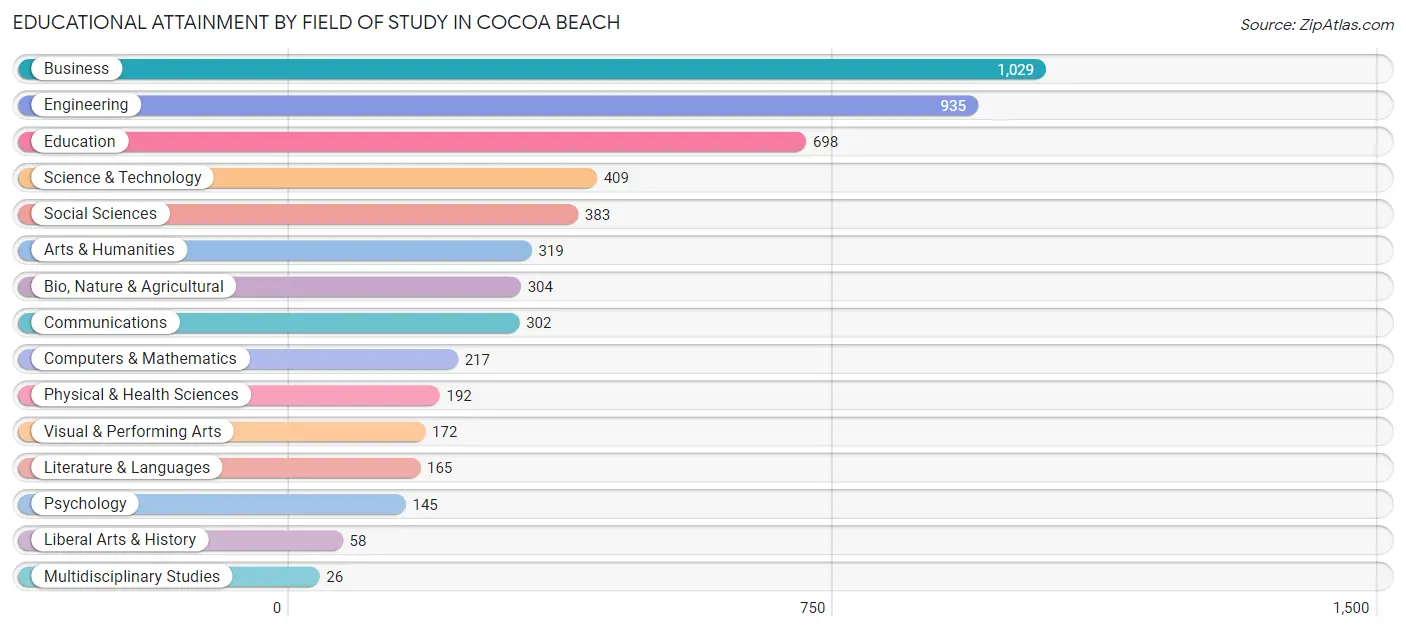
| Field of Study | # Graduates | % Graduates |
| Computers & Mathematics | 217 | 4.1% |
| Bio, Nature & Agricultural | 304 | 5.7% |
| Physical & Health Sciences | 192 | 3.6% |
| Psychology | 145 | 2.7% |
| Social Sciences | 383 | 7.1% |
| Engineering | 935 | 17.5% |
| Multidisciplinary Studies | 26 | 0.5% |
| Science & Technology | 409 | 7.6% |
| Business | 1,029 | 19.2% |
| Education | 698 | 13.0% |
| Literature & Languages | 165 | 3.1% |
| Liberal Arts & History | 58 | 1.1% |
| Visual & Performing Arts | 172 | 3.2% |
| Communications | 302 | 5.6% |
| Arts & Humanities | 319 | 6.0% |
| Total | 5,354 | 100.0% |
Transportation & Commute in Cocoa Beach
Vehicle Availability by Sex in Cocoa Beach
The most prevalent vehicle ownership categories in Cocoa Beach are males with 2 vehicles (1,103, accounting for 42.7%) and females with 2 vehicles (942, making up 50.2%).
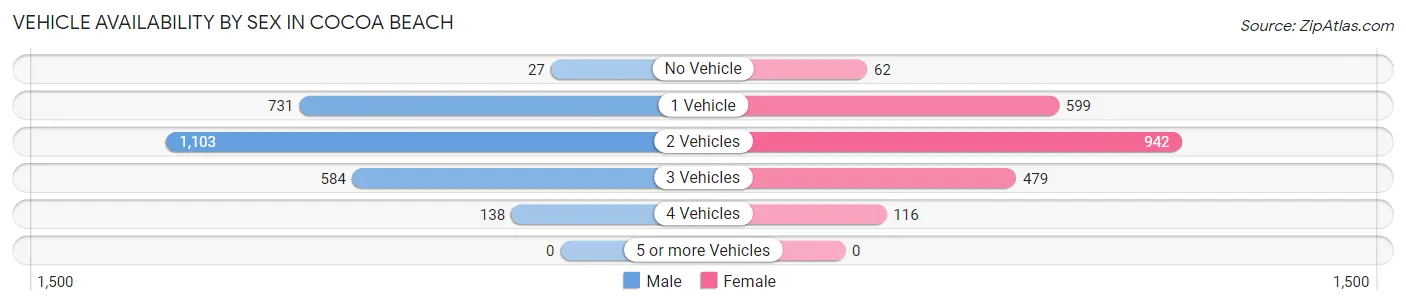
| Vehicles Available | Male | Female |
| No Vehicle | 27 (1.1%) | 62 (2.8%) |
| 1 Vehicle | 731 (28.3%) | 599 (27.3%) |
| 2 Vehicles | 1,103 (42.7%) | 942 (42.9%) |
| 3 Vehicles | 584 (22.6%) | 479 (21.8%) |
| 4 Vehicles | 138 (5.3%) | 116 (5.3%) |
| 5 or more Vehicles | 0 (0.0%) | 0 (0.0%) |
| Total | 2,583 (100.0%) | 2,198 (100.0%) |
Commute Time in Cocoa Beach
The most frequently occuring commute durations in Cocoa Beach are 20 to 24 minutes (625 commuters, 16.5%), 15 to 19 minutes (562 commuters, 14.8%), and 5 to 9 minutes (511 commuters, 13.5%).
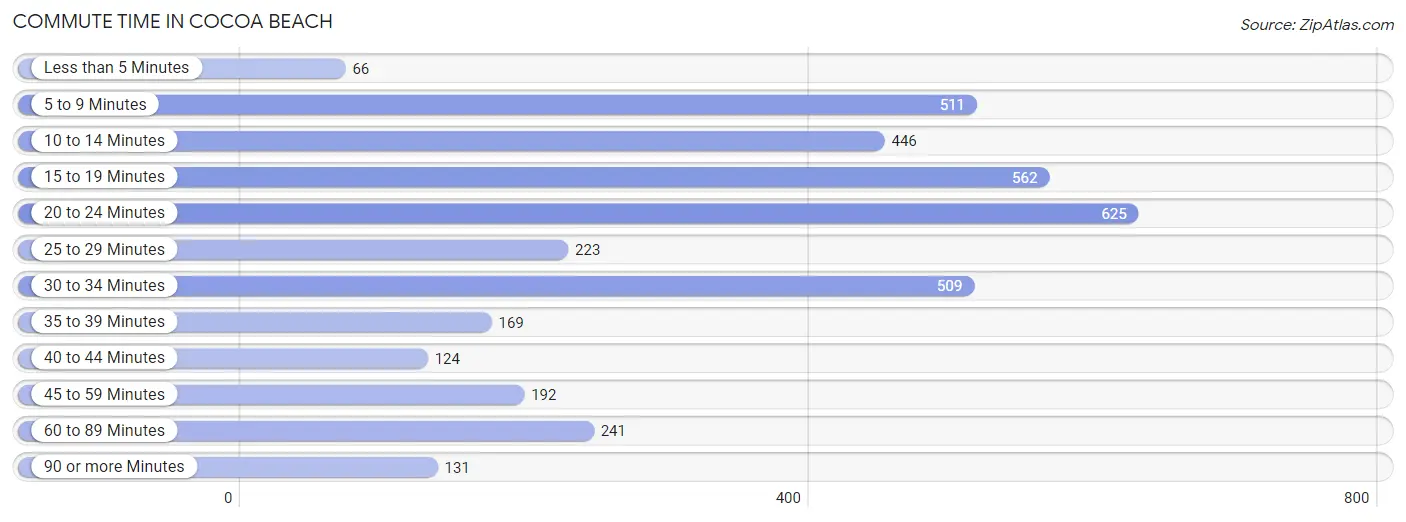
| Commute Time | # Commuters | % Commuters |
| Less than 5 Minutes | 66 | 1.7% |
| 5 to 9 Minutes | 511 | 13.5% |
| 10 to 14 Minutes | 446 | 11.7% |
| 15 to 19 Minutes | 562 | 14.8% |
| 20 to 24 Minutes | 625 | 16.5% |
| 25 to 29 Minutes | 223 | 5.9% |
| 30 to 34 Minutes | 509 | 13.4% |
| 35 to 39 Minutes | 169 | 4.4% |
| 40 to 44 Minutes | 124 | 3.3% |
| 45 to 59 Minutes | 192 | 5.1% |
| 60 to 89 Minutes | 241 | 6.3% |
| 90 or more Minutes | 131 | 3.5% |
Commute Time by Sex in Cocoa Beach
The most common commute times in Cocoa Beach are 30 to 34 minutes (387 commuters, 19.2%) for males and 15 to 19 minutes (373 commuters, 21.0%) for females.
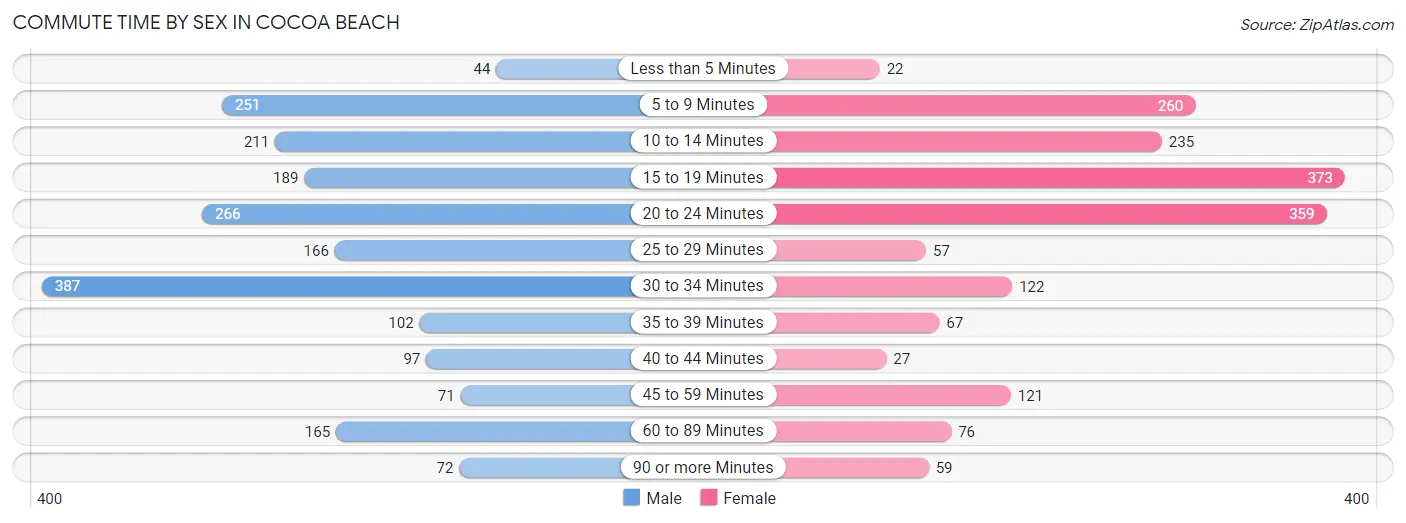
| Commute Time | Male | Female |
| Less than 5 Minutes | 44 (2.2%) | 22 (1.2%) |
| 5 to 9 Minutes | 251 (12.4%) | 260 (14.6%) |
| 10 to 14 Minutes | 211 (10.4%) | 235 (13.2%) |
| 15 to 19 Minutes | 189 (9.3%) | 373 (21.0%) |
| 20 to 24 Minutes | 266 (13.2%) | 359 (20.2%) |
| 25 to 29 Minutes | 166 (8.2%) | 57 (3.2%) |
| 30 to 34 Minutes | 387 (19.2%) | 122 (6.9%) |
| 35 to 39 Minutes | 102 (5.1%) | 67 (3.8%) |
| 40 to 44 Minutes | 97 (4.8%) | 27 (1.5%) |
| 45 to 59 Minutes | 71 (3.5%) | 121 (6.8%) |
| 60 to 89 Minutes | 165 (8.2%) | 76 (4.3%) |
| 90 or more Minutes | 72 (3.6%) | 59 (3.3%) |
Time of Departure to Work by Sex in Cocoa Beach
The most frequent times of departure to work in Cocoa Beach are 7:00 AM to 7:29 AM (407, 20.1%) for males and 7:00 AM to 7:29 AM (428, 24.1%) for females.
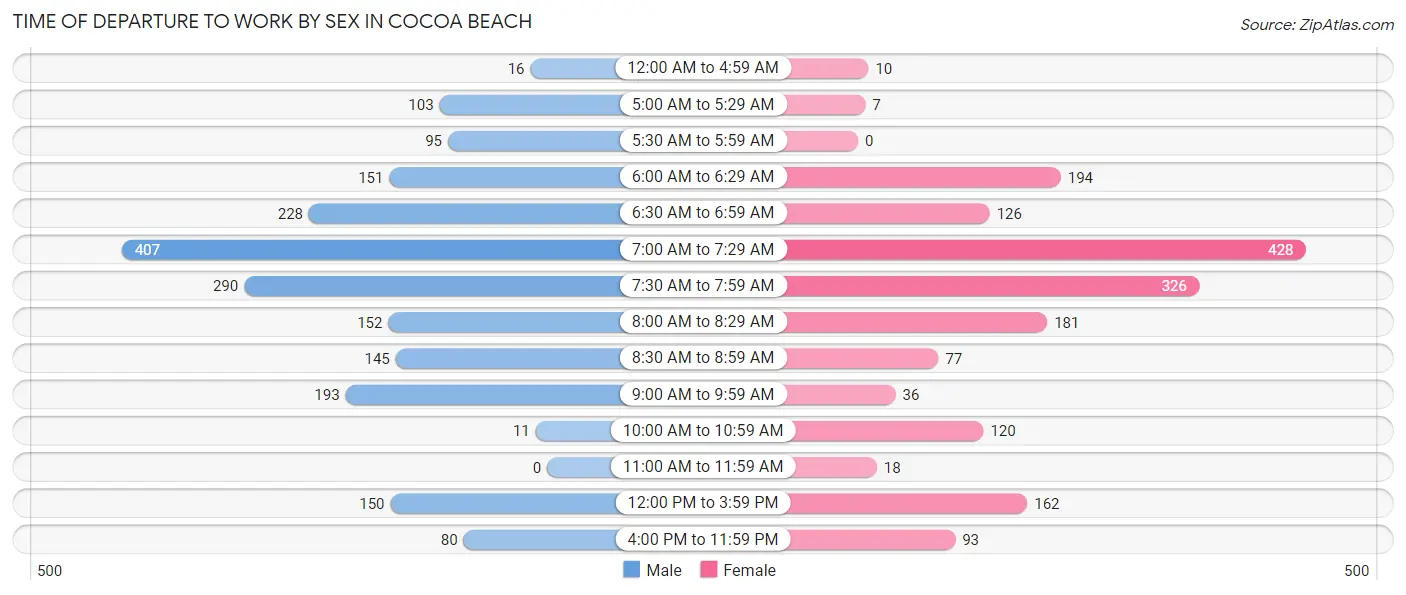
| Time of Departure | Male | Female |
| 12:00 AM to 4:59 AM | 16 (0.8%) | 10 (0.6%) |
| 5:00 AM to 5:29 AM | 103 (5.1%) | 7 (0.4%) |
| 5:30 AM to 5:59 AM | 95 (4.7%) | 0 (0.0%) |
| 6:00 AM to 6:29 AM | 151 (7.5%) | 194 (10.9%) |
| 6:30 AM to 6:59 AM | 228 (11.3%) | 126 (7.1%) |
| 7:00 AM to 7:29 AM | 407 (20.1%) | 428 (24.1%) |
| 7:30 AM to 7:59 AM | 290 (14.3%) | 326 (18.3%) |
| 8:00 AM to 8:29 AM | 152 (7.5%) | 181 (10.2%) |
| 8:30 AM to 8:59 AM | 145 (7.2%) | 77 (4.3%) |
| 9:00 AM to 9:59 AM | 193 (9.6%) | 36 (2.0%) |
| 10:00 AM to 10:59 AM | 11 (0.5%) | 120 (6.8%) |
| 11:00 AM to 11:59 AM | 0 (0.0%) | 18 (1.0%) |
| 12:00 PM to 3:59 PM | 150 (7.4%) | 162 (9.1%) |
| 4:00 PM to 11:59 PM | 80 (4.0%) | 93 (5.2%) |
| Total | 2,021 (100.0%) | 1,778 (100.0%) |
Housing Occupancy in Cocoa Beach
Occupancy by Ownership in Cocoa Beach
Of the total 6,115 dwellings in Cocoa Beach, owner-occupied units account for 4,657 (76.2%), while renter-occupied units make up 1,458 (23.8%).
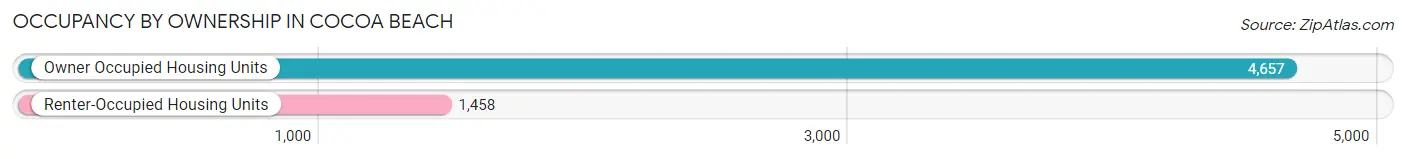
| Occupancy | # Housing Units | % Housing Units |
| Owner Occupied Housing Units | 4,657 | 76.2% |
| Renter-Occupied Housing Units | 1,458 | 23.8% |
| Total Occupied Housing Units | 6,115 | 100.0% |
Occupancy by Household Size in Cocoa Beach
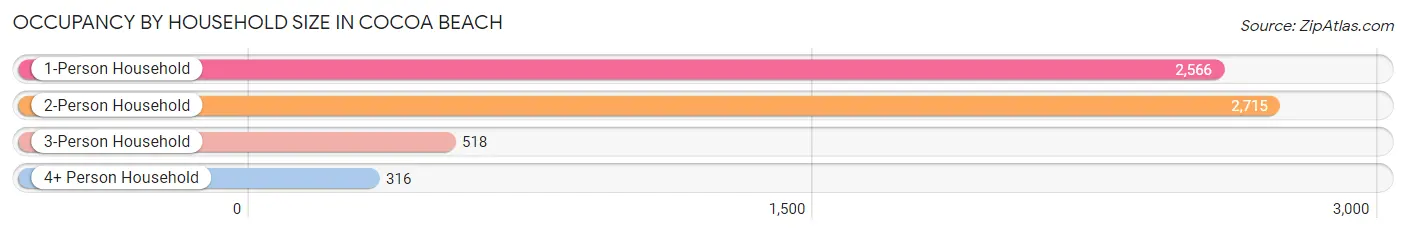
| Household Size | # Housing Units | % Housing Units |
| 1-Person Household | 2,566 | 42.0% |
| 2-Person Household | 2,715 | 44.4% |
| 3-Person Household | 518 | 8.5% |
| 4+ Person Household | 316 | 5.2% |
| Total Housing Units | 6,115 | 100.0% |
Occupancy by Ownership by Household Size in Cocoa Beach
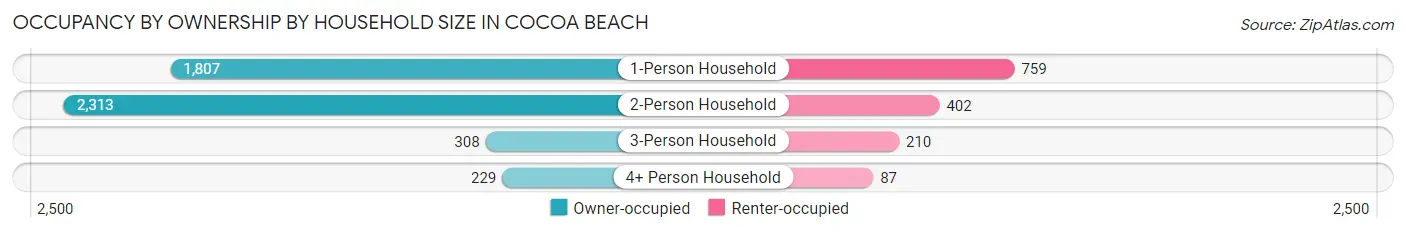
| Household Size | Owner-occupied | Renter-occupied |
| 1-Person Household | 1,807 (70.4%) | 759 (29.6%) |
| 2-Person Household | 2,313 (85.2%) | 402 (14.8%) |
| 3-Person Household | 308 (59.5%) | 210 (40.5%) |
| 4+ Person Household | 229 (72.5%) | 87 (27.5%) |
| Total Housing Units | 4,657 (76.2%) | 1,458 (23.8%) |
Occupancy by Educational Attainment in Cocoa Beach
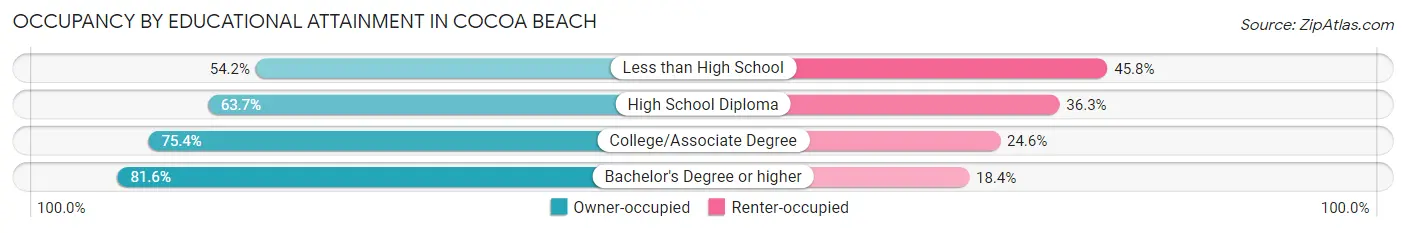
| Household Size | Owner-occupied | Renter-occupied |
| Less than High School | 78 (54.2%) | 66 (45.8%) |
| High School Diploma | 594 (63.7%) | 339 (36.3%) |
| College/Associate Degree | 1,536 (75.4%) | 500 (24.6%) |
| Bachelor's Degree or higher | 2,449 (81.6%) | 553 (18.4%) |
Occupancy by Age of Householder in Cocoa Beach
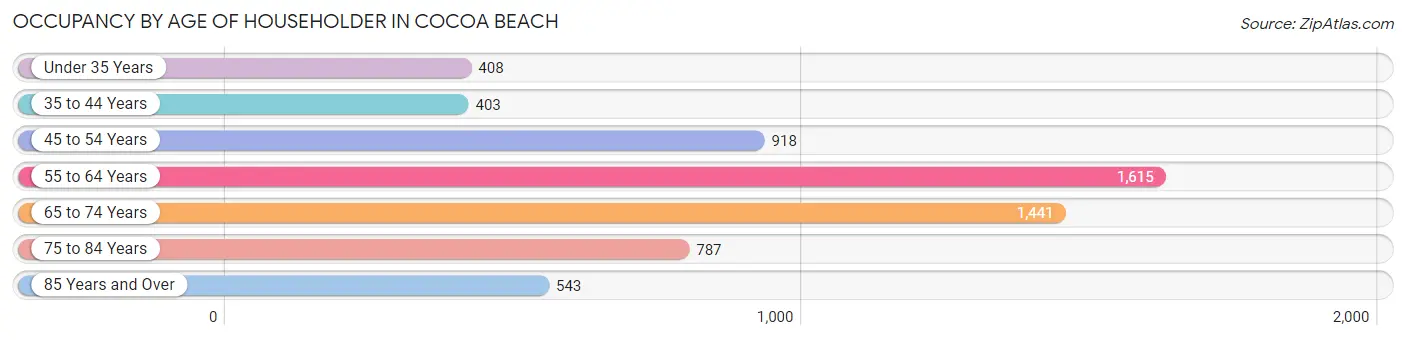
| Age Bracket | # Households | % Households |
| Under 35 Years | 408 | 6.7% |
| 35 to 44 Years | 403 | 6.6% |
| 45 to 54 Years | 918 | 15.0% |
| 55 to 64 Years | 1,615 | 26.4% |
| 65 to 74 Years | 1,441 | 23.6% |
| 75 to 84 Years | 787 | 12.9% |
| 85 Years and Over | 543 | 8.9% |
| Total | 6,115 | 100.0% |
Housing Finances in Cocoa Beach
Median Income by Occupancy in Cocoa Beach
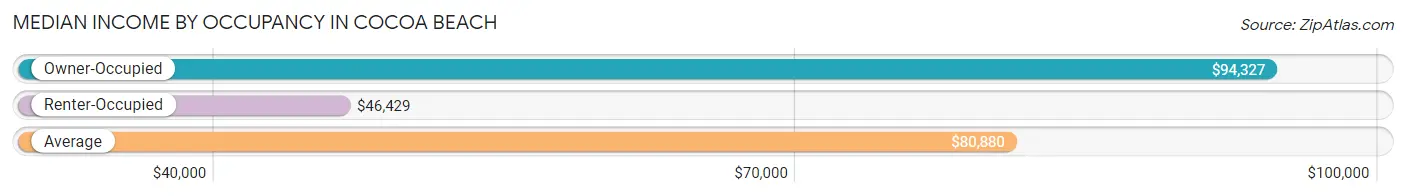
| Occupancy Type | # Households | Median Income |
| Owner-Occupied | 4,657 (76.2%) | $94,327 |
| Renter-Occupied | 1,458 (23.8%) | $46,429 |
| Average | 6,115 (100.0%) | $80,880 |
Occupancy by Householder Income Bracket in Cocoa Beach
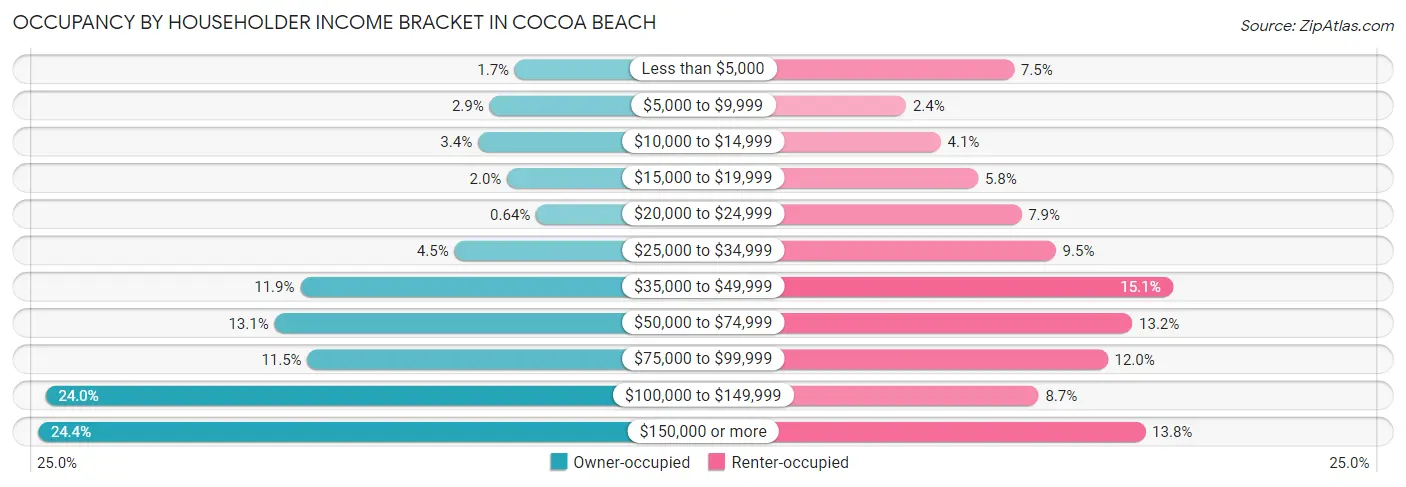
| Income Bracket | Owner-occupied | Renter-occupied |
| Less than $5,000 | 77 (1.7%) | 110 (7.5%) |
| $5,000 to $9,999 | 133 (2.9%) | 35 (2.4%) |
| $10,000 to $14,999 | 159 (3.4%) | 59 (4.1%) |
| $15,000 to $19,999 | 94 (2.0%) | 85 (5.8%) |
| $20,000 to $24,999 | 30 (0.6%) | 115 (7.9%) |
| $25,000 to $34,999 | 211 (4.5%) | 139 (9.5%) |
| $35,000 to $49,999 | 553 (11.9%) | 220 (15.1%) |
| $50,000 to $74,999 | 610 (13.1%) | 192 (13.2%) |
| $75,000 to $99,999 | 537 (11.5%) | 175 (12.0%) |
| $100,000 to $149,999 | 1,118 (24.0%) | 127 (8.7%) |
| $150,000 or more | 1,135 (24.4%) | 201 (13.8%) |
| Total | 4,657 (100.0%) | 1,458 (100.0%) |
Monthly Housing Cost Tiers in Cocoa Beach
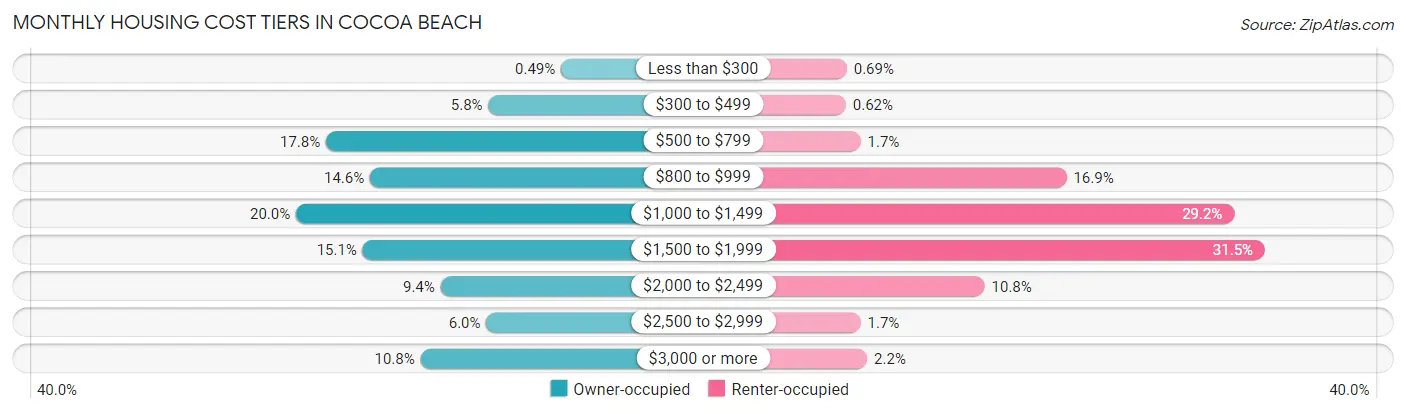
| Monthly Cost | Owner-occupied | Renter-occupied |
| Less than $300 | 23 (0.5%) | 10 (0.7%) |
| $300 to $499 | 272 (5.8%) | 9 (0.6%) |
| $500 to $799 | 829 (17.8%) | 25 (1.7%) |
| $800 to $999 | 678 (14.6%) | 246 (16.9%) |
| $1,000 to $1,499 | 932 (20.0%) | 426 (29.2%) |
| $1,500 to $1,999 | 703 (15.1%) | 459 (31.5%) |
| $2,000 to $2,499 | 436 (9.4%) | 158 (10.8%) |
| $2,500 to $2,999 | 279 (6.0%) | 25 (1.7%) |
| $3,000 or more | 505 (10.8%) | 32 (2.2%) |
| Total | 4,657 (100.0%) | 1,458 (100.0%) |
Physical Housing Characteristics in Cocoa Beach
Housing Structures in Cocoa Beach
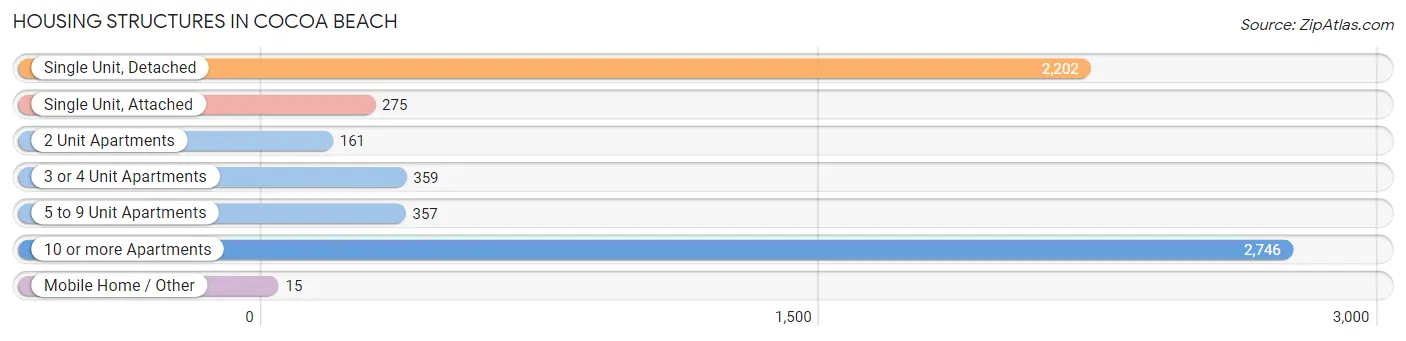
| Structure Type | # Housing Units | % Housing Units |
| Single Unit, Detached | 2,202 | 36.0% |
| Single Unit, Attached | 275 | 4.5% |
| 2 Unit Apartments | 161 | 2.6% |
| 3 or 4 Unit Apartments | 359 | 5.9% |
| 5 to 9 Unit Apartments | 357 | 5.8% |
| 10 or more Apartments | 2,746 | 44.9% |
| Mobile Home / Other | 15 | 0.3% |
| Total | 6,115 | 100.0% |
Housing Structures by Occupancy in Cocoa Beach
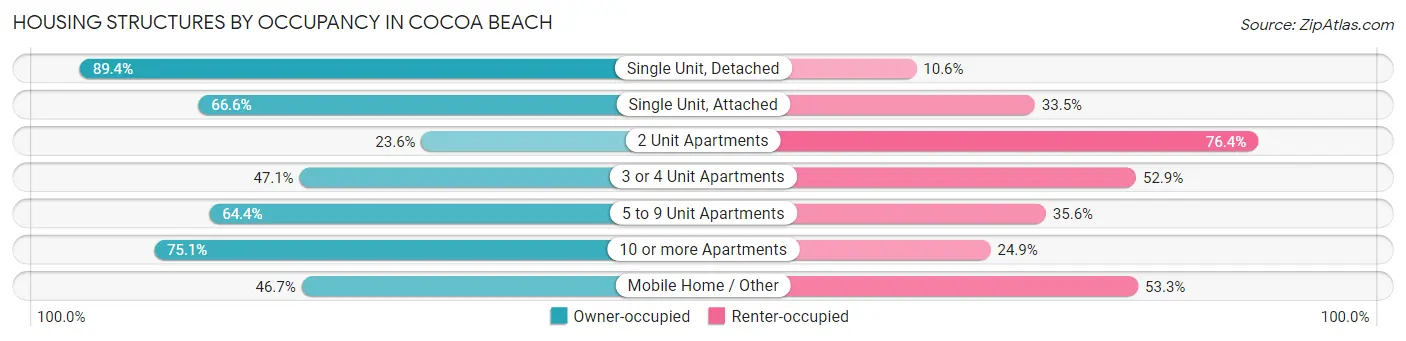
| Structure Type | Owner-occupied | Renter-occupied |
| Single Unit, Detached | 1,968 (89.4%) | 234 (10.6%) |
| Single Unit, Attached | 183 (66.5%) | 92 (33.5%) |
| 2 Unit Apartments | 38 (23.6%) | 123 (76.4%) |
| 3 or 4 Unit Apartments | 169 (47.1%) | 190 (52.9%) |
| 5 to 9 Unit Apartments | 230 (64.4%) | 127 (35.6%) |
| 10 or more Apartments | 2,062 (75.1%) | 684 (24.9%) |
| Mobile Home / Other | 7 (46.7%) | 8 (53.3%) |
| Total | 4,657 (76.2%) | 1,458 (23.8%) |
Housing Structures by Number of Rooms in Cocoa Beach
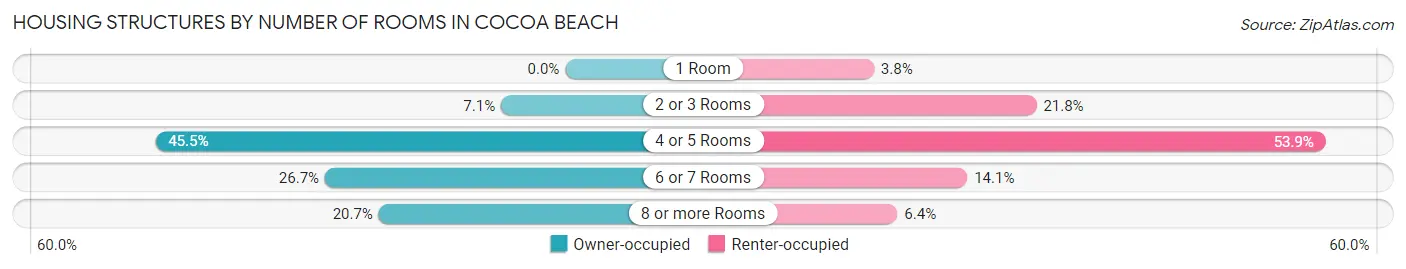
| Number of Rooms | Owner-occupied | Renter-occupied |
| 1 Room | 0 (0.0%) | 55 (3.8%) |
| 2 or 3 Rooms | 332 (7.1%) | 318 (21.8%) |
| 4 or 5 Rooms | 2,119 (45.5%) | 786 (53.9%) |
| 6 or 7 Rooms | 1,242 (26.7%) | 206 (14.1%) |
| 8 or more Rooms | 964 (20.7%) | 93 (6.4%) |
| Total | 4,657 (100.0%) | 1,458 (100.0%) |
Housing Structure by Heating Type in Cocoa Beach
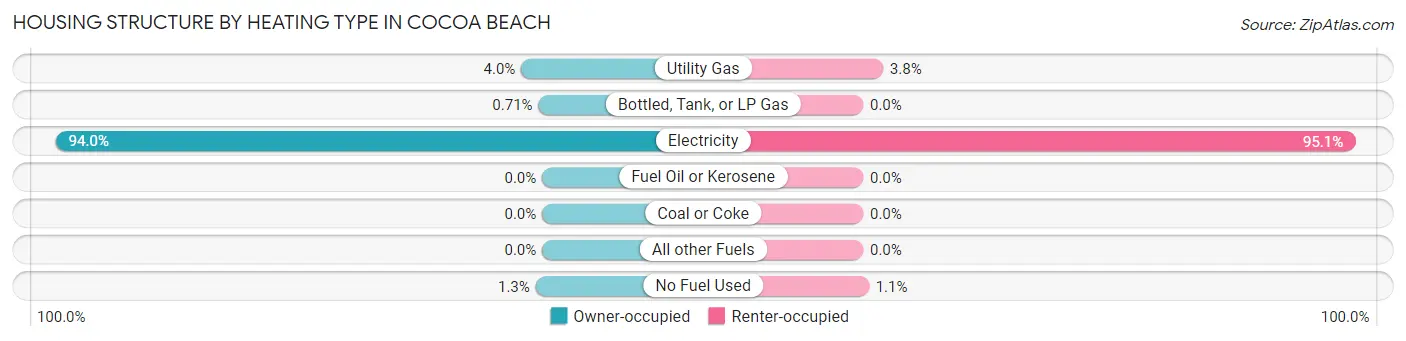
| Heating Type | Owner-occupied | Renter-occupied |
| Utility Gas | 188 (4.0%) | 56 (3.8%) |
| Bottled, Tank, or LP Gas | 33 (0.7%) | 0 (0.0%) |
| Electricity | 4,378 (94.0%) | 1,386 (95.1%) |
| Fuel Oil or Kerosene | 0 (0.0%) | 0 (0.0%) |
| Coal or Coke | 0 (0.0%) | 0 (0.0%) |
| All other Fuels | 0 (0.0%) | 0 (0.0%) |
| No Fuel Used | 58 (1.3%) | 16 (1.1%) |
| Total | 4,657 (100.0%) | 1,458 (100.0%) |
Household Vehicle Usage in Cocoa Beach
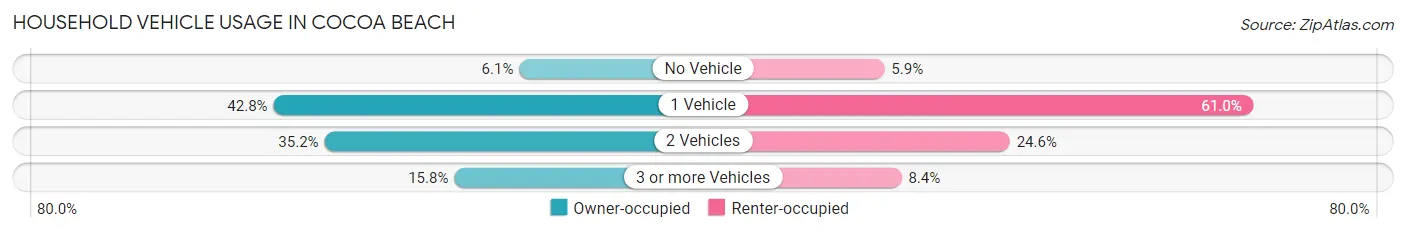
| Vehicles per Household | Owner-occupied | Renter-occupied |
| No Vehicle | 285 (6.1%) | 86 (5.9%) |
| 1 Vehicle | 1,995 (42.8%) | 890 (61.0%) |
| 2 Vehicles | 1,640 (35.2%) | 359 (24.6%) |
| 3 or more Vehicles | 737 (15.8%) | 123 (8.4%) |
| Total | 4,657 (100.0%) | 1,458 (100.0%) |
Real Estate & Mortgages in Cocoa Beach
Real Estate and Mortgage Overview in Cocoa Beach
| Characteristic | Without Mortgage | With Mortgage |
| Housing Units | 2,463 | 2,194 |
| Median Property Value | $404,600 | $427,500 |
| Median Household Income | $78,512 | $665 |
| Monthly Housing Costs | $857 | $505 |
| Real Estate Taxes | $2,743 | $0 |
Property Value by Mortgage Status in Cocoa Beach
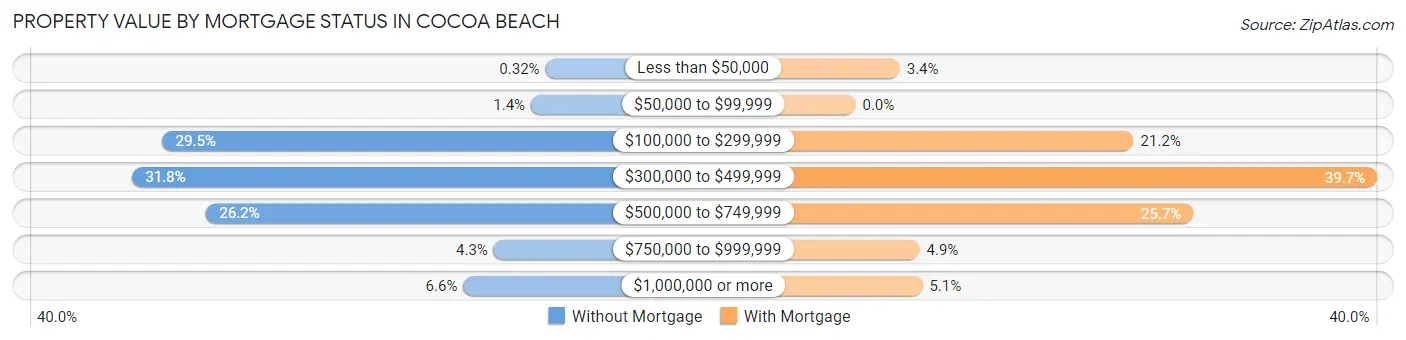
| Property Value | Without Mortgage | With Mortgage |
| Less than $50,000 | 8 (0.3%) | 74 (3.4%) |
| $50,000 to $99,999 | 35 (1.4%) | 0 (0.0%) |
| $100,000 to $299,999 | 726 (29.5%) | 465 (21.2%) |
| $300,000 to $499,999 | 783 (31.8%) | 872 (39.7%) |
| $500,000 to $749,999 | 644 (26.2%) | 564 (25.7%) |
| $750,000 to $999,999 | 105 (4.3%) | 107 (4.9%) |
| $1,000,000 or more | 162 (6.6%) | 112 (5.1%) |
| Total | 2,463 (100.0%) | 2,194 (100.0%) |
Household Income by Mortgage Status in Cocoa Beach
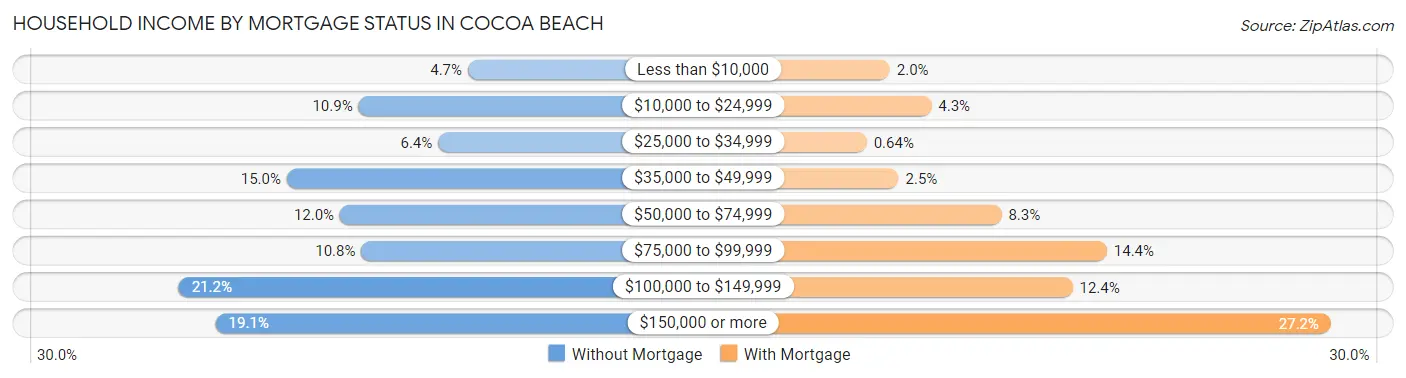
| Household Income | Without Mortgage | With Mortgage |
| Less than $10,000 | 115 (4.7%) | 43 (2.0%) |
| $10,000 to $24,999 | 269 (10.9%) | 95 (4.3%) |
| $25,000 to $34,999 | 157 (6.4%) | 14 (0.6%) |
| $35,000 to $49,999 | 370 (15.0%) | 54 (2.5%) |
| $50,000 to $74,999 | 295 (12.0%) | 183 (8.3%) |
| $75,000 to $99,999 | 265 (10.8%) | 315 (14.4%) |
| $100,000 to $149,999 | 522 (21.2%) | 272 (12.4%) |
| $150,000 or more | 470 (19.1%) | 596 (27.2%) |
| Total | 2,463 (100.0%) | 2,194 (100.0%) |
Property Value to Household Income Ratio in Cocoa Beach
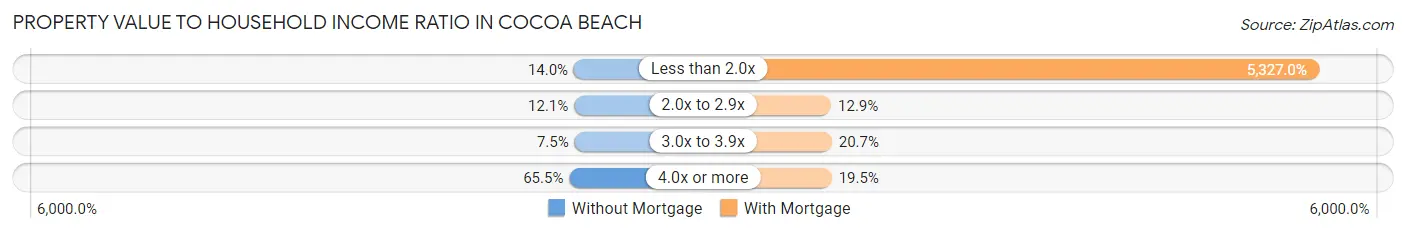
| Value-to-Income Ratio | Without Mortgage | With Mortgage |
| Less than 2.0x | 344 (14.0%) | 116,875 (5,327.0%) |
| 2.0x to 2.9x | 298 (12.1%) | 284 (12.9%) |
| 3.0x to 3.9x | 185 (7.5%) | 453 (20.6%) |
| 4.0x or more | 1,613 (65.5%) | 428 (19.5%) |
| Total | 2,463 (100.0%) | 2,194 (100.0%) |
Real Estate Taxes by Mortgage Status in Cocoa Beach
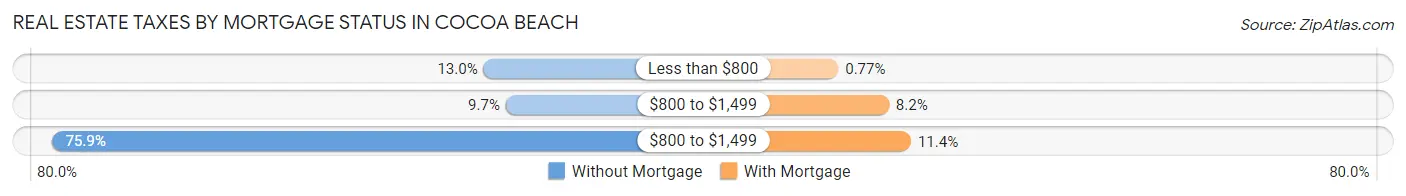
| Property Taxes | Without Mortgage | With Mortgage |
| Less than $800 | 319 (13.0%) | 17 (0.8%) |
| $800 to $1,499 | 239 (9.7%) | 179 (8.2%) |
| $800 to $1,499 | 1,870 (75.9%) | 250 (11.4%) |
| Total | 2,463 (100.0%) | 2,194 (100.0%) |
Health & Disability in Cocoa Beach
Health Insurance Coverage by Age in Cocoa Beach
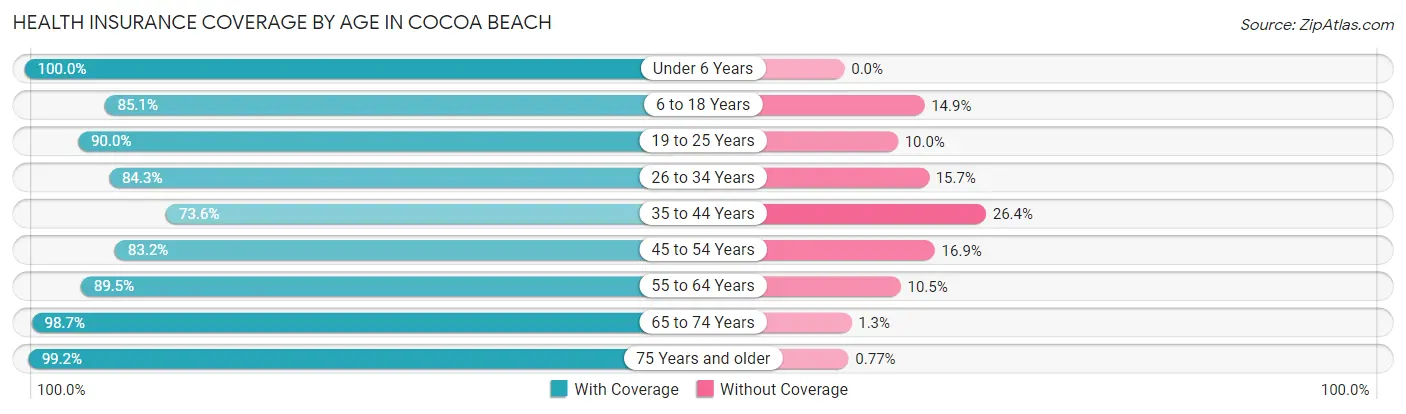
| Age Bracket | With Coverage | Without Coverage |
| Under 6 Years | 175 (100.0%) | 0 (0.0%) |
| 6 to 18 Years | 799 (85.1%) | 140 (14.9%) |
| 19 to 25 Years | 416 (90.0%) | 46 (10.0%) |
| 26 to 34 Years | 439 (84.3%) | 82 (15.7%) |
| 35 to 44 Years | 597 (73.6%) | 214 (26.4%) |
| 45 to 54 Years | 1,342 (83.2%) | 272 (16.9%) |
| 55 to 64 Years | 2,448 (89.5%) | 287 (10.5%) |
| 65 to 74 Years | 2,054 (98.7%) | 27 (1.3%) |
| 75 Years and older | 1,940 (99.2%) | 15 (0.8%) |
| Total | 10,210 (90.4%) | 1,083 (9.6%) |
Health Insurance Coverage by Citizenship Status in Cocoa Beach
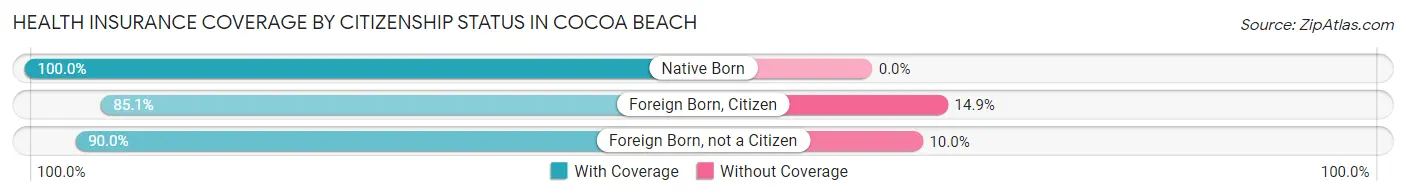
| Citizenship Status | With Coverage | Without Coverage |
| Native Born | 175 (100.0%) | 0 (0.0%) |
| Foreign Born, Citizen | 799 (85.1%) | 140 (14.9%) |
| Foreign Born, not a Citizen | 416 (90.0%) | 46 (10.0%) |
Health Insurance Coverage by Household Income in Cocoa Beach
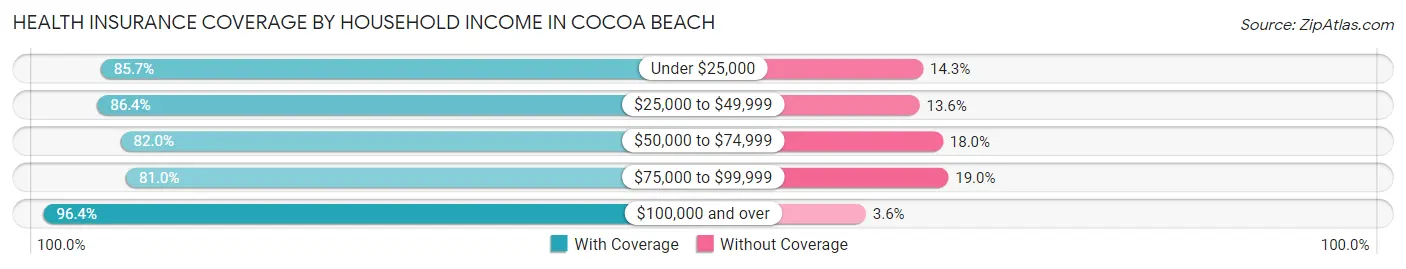
| Household Income | With Coverage | Without Coverage |
| Under $25,000 | 923 (85.7%) | 154 (14.3%) |
| $25,000 to $49,999 | 1,532 (86.4%) | 242 (13.6%) |
| $50,000 to $74,999 | 1,057 (82.0%) | 232 (18.0%) |
| $75,000 to $99,999 | 1,048 (81.0%) | 246 (19.0%) |
| $100,000 and over | 5,650 (96.4%) | 209 (3.6%) |
Public vs Private Health Insurance Coverage by Age in Cocoa Beach
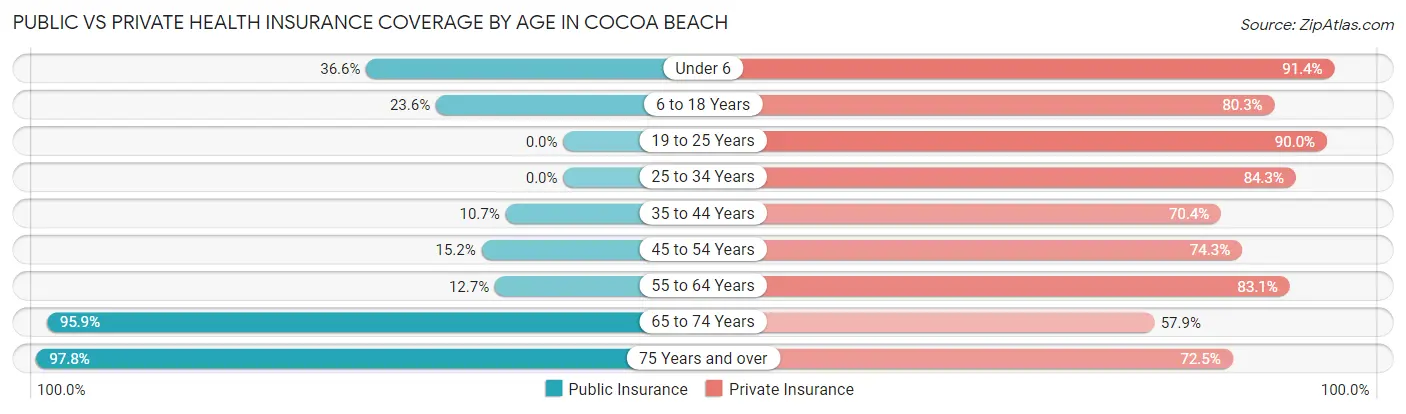
| Age Bracket | Public Insurance | Private Insurance |
| Under 6 | 64 (36.6%) | 160 (91.4%) |
| 6 to 18 Years | 222 (23.6%) | 754 (80.3%) |
| 19 to 25 Years | 0 (0.0%) | 416 (90.0%) |
| 25 to 34 Years | 0 (0.0%) | 439 (84.3%) |
| 35 to 44 Years | 87 (10.7%) | 571 (70.4%) |
| 45 to 54 Years | 245 (15.2%) | 1,199 (74.3%) |
| 55 to 64 Years | 347 (12.7%) | 2,273 (83.1%) |
| 65 to 74 Years | 1,995 (95.9%) | 1,205 (57.9%) |
| 75 Years and over | 1,912 (97.8%) | 1,418 (72.5%) |
| Total | 4,872 (43.1%) | 8,435 (74.7%) |
Disability Status by Sex by Age in Cocoa Beach
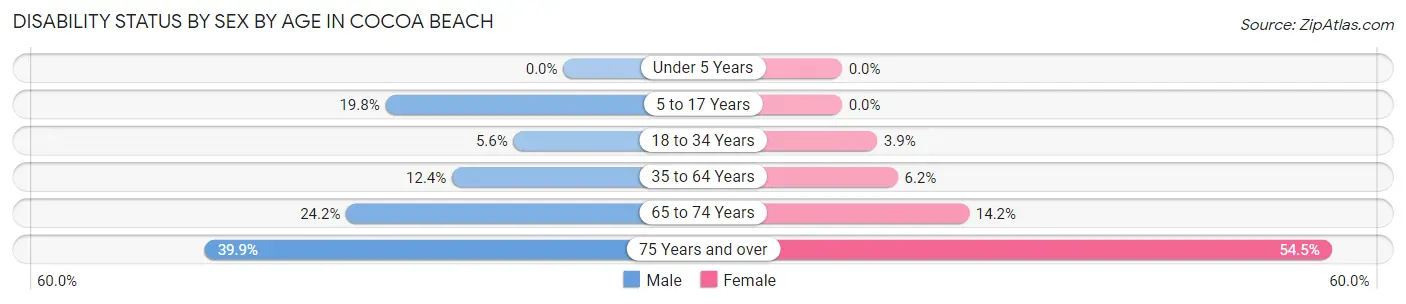
| Age Bracket | Male | Female |
| Under 5 Years | 0 (0.0%) | 0 (0.0%) |
| 5 to 17 Years | 107 (19.8%) | 0 (0.0%) |
| 18 to 34 Years | 31 (5.6%) | 18 (3.9%) |
| 35 to 64 Years | 316 (12.4%) | 162 (6.2%) |
| 65 to 74 Years | 281 (24.2%) | 130 (14.1%) |
| 75 Years and over | 375 (39.9%) | 554 (54.5%) |
Disability Class by Sex by Age in Cocoa Beach
Disability Class: Hearing Difficulty
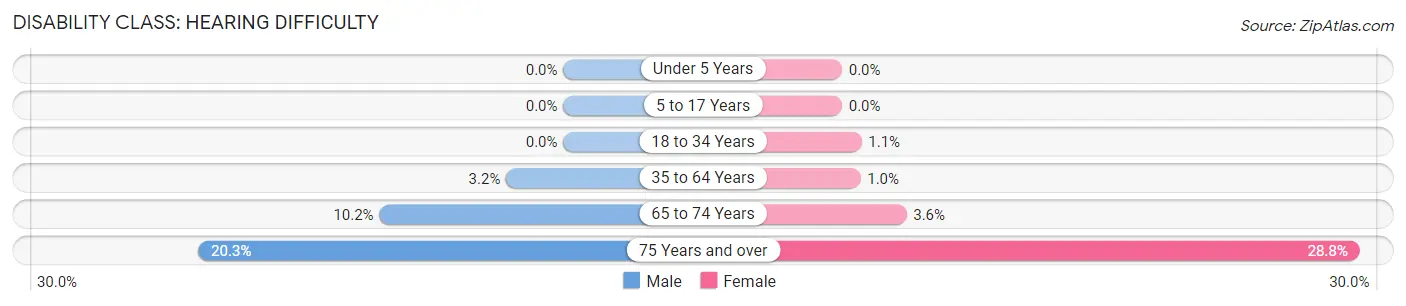
| Age Bracket | Male | Female |
| Under 5 Years | 0 (0.0%) | 0 (0.0%) |
| 5 to 17 Years | 0 (0.0%) | 0 (0.0%) |
| 18 to 34 Years | 0 (0.0%) | 5 (1.1%) |
| 35 to 64 Years | 81 (3.2%) | 27 (1.0%) |
| 65 to 74 Years | 119 (10.2%) | 33 (3.6%) |
| 75 Years and over | 191 (20.3%) | 293 (28.8%) |
Disability Class: Vision Difficulty
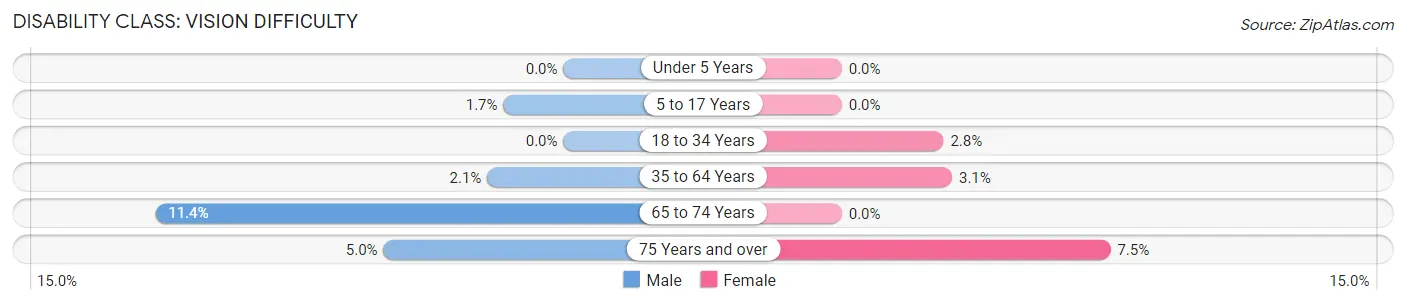
| Age Bracket | Male | Female |
| Under 5 Years | 0 (0.0%) | 0 (0.0%) |
| 5 to 17 Years | 9 (1.7%) | 0 (0.0%) |
| 18 to 34 Years | 0 (0.0%) | 13 (2.8%) |
| 35 to 64 Years | 54 (2.1%) | 80 (3.1%) |
| 65 to 74 Years | 132 (11.4%) | 0 (0.0%) |
| 75 Years and over | 47 (5.0%) | 76 (7.5%) |
Disability Class: Cognitive Difficulty
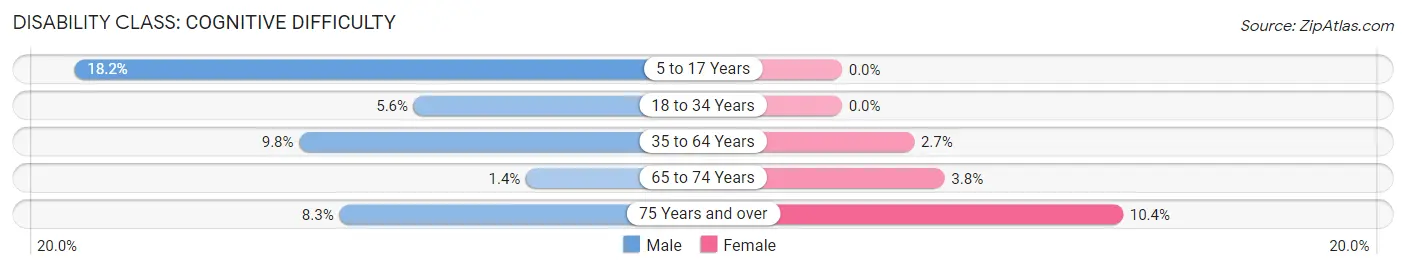
| Age Bracket | Male | Female |
| 5 to 17 Years | 98 (18.1%) | 0 (0.0%) |
| 18 to 34 Years | 31 (5.6%) | 0 (0.0%) |
| 35 to 64 Years | 250 (9.8%) | 70 (2.7%) |
| 65 to 74 Years | 16 (1.4%) | 35 (3.8%) |
| 75 Years and over | 78 (8.3%) | 106 (10.4%) |
Disability Class: Ambulatory Difficulty
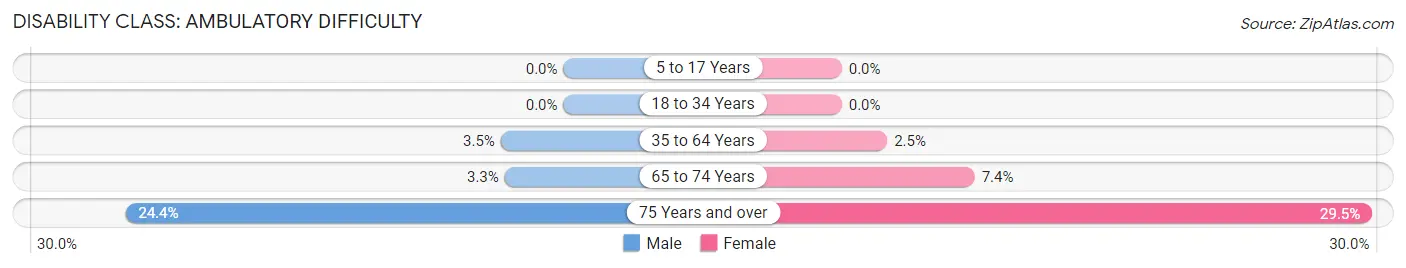
| Age Bracket | Male | Female |
| 5 to 17 Years | 0 (0.0%) | 0 (0.0%) |
| 18 to 34 Years | 0 (0.0%) | 0 (0.0%) |
| 35 to 64 Years | 89 (3.5%) | 66 (2.5%) |
| 65 to 74 Years | 38 (3.3%) | 68 (7.4%) |
| 75 Years and over | 229 (24.4%) | 300 (29.5%) |
Disability Class: Self-Care Difficulty
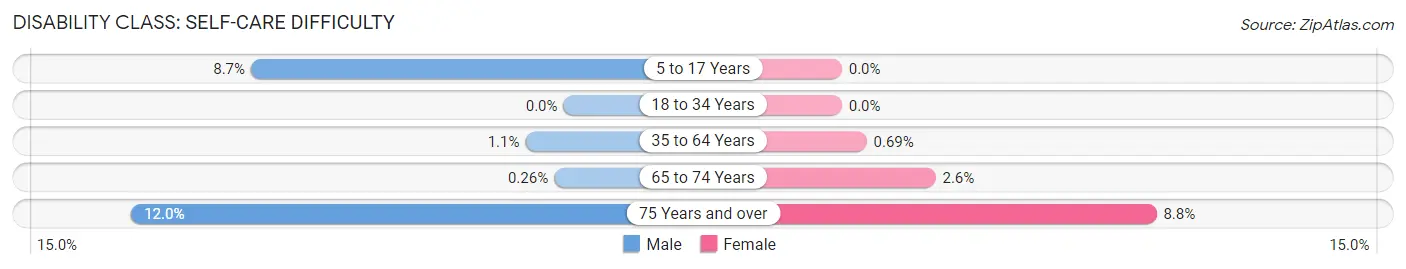
| Age Bracket | Male | Female |
| 5 to 17 Years | 47 (8.7%) | 0 (0.0%) |
| 18 to 34 Years | 0 (0.0%) | 0 (0.0%) |
| 35 to 64 Years | 27 (1.1%) | 18 (0.7%) |
| 65 to 74 Years | 3 (0.3%) | 24 (2.6%) |
| 75 Years and over | 113 (12.0%) | 89 (8.8%) |
Technology Access in Cocoa Beach
Computing Device Access in Cocoa Beach
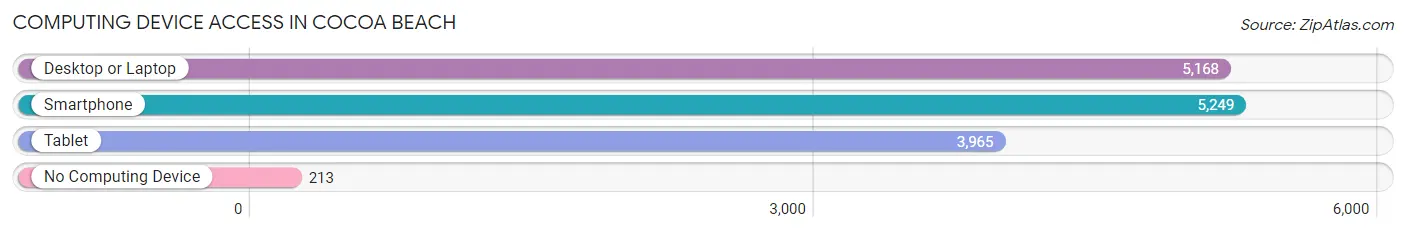
| Device Type | # Households | % Households |
| Desktop or Laptop | 5,168 | 84.5% |
| Smartphone | 5,249 | 85.8% |
| Tablet | 3,965 | 64.8% |
| No Computing Device | 213 | 3.5% |
| Total | 6,115 | 100.0% |
Internet Access in Cocoa Beach
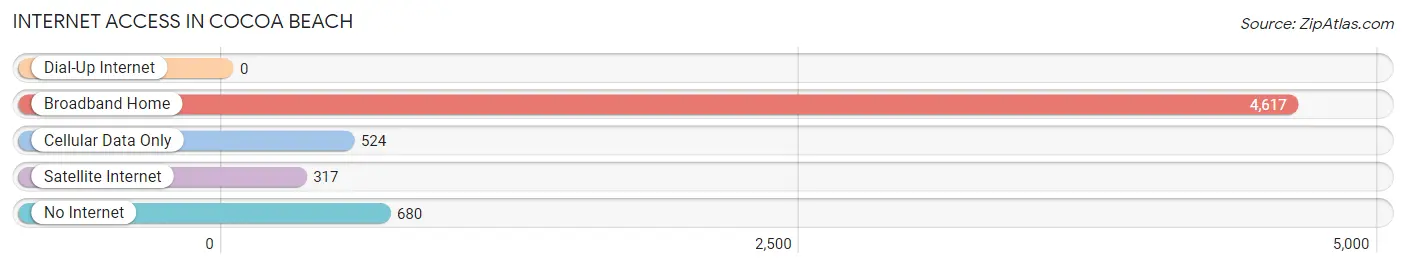
| Internet Type | # Households | % Households |
| Dial-Up Internet | 0 | 0.0% |
| Broadband Home | 4,617 | 75.5% |
| Cellular Data Only | 524 | 8.6% |
| Satellite Internet | 317 | 5.2% |
| No Internet | 680 | 11.1% |
| Total | 6,115 | 100.0% |
Cocoa Beach Summary
Cocoa Beach, Florida is a small city located on the Atlantic Coast of Florida, just south of the Kennedy Space Center. It is a popular tourist destination, known for its beautiful beaches, surfing, and fishing. The city has a population of 11,231 as of the 2020 census, and is part of the larger Brevard County.
History
Cocoa Beach was first settled in the late 1800s by a group of settlers from the Bahamas. The settlers named the area after the cocoa trees that grew in the area. The area was originally used for farming and fishing, and the settlers built a small fishing village. In the early 1900s, the area began to attract tourists, and the first hotel was built in 1912.
In the 1920s, the area began to develop as a tourist destination, and the first beachfront hotel was built in 1925. The area continued to grow in popularity, and in the 1950s, the area was featured in the television show "I Love Lucy." The show helped to make Cocoa Beach a popular tourist destination.
In the 1960s, the area began to attract surfers, and the city became known as the "Surfing Capital of the East Coast." The city also became a popular destination for space launches, as the Kennedy Space Center is located nearby.
Geography
Cocoa Beach is located on the Atlantic Coast of Florida, just south of the Kennedy Space Center. The city is located on a barrier island, and is bordered by the Banana River to the west and the Atlantic Ocean to the east. The city has a total area of 4.2 square miles, and is located at an elevation of 10 feet above sea level.
The city has a humid subtropical climate, with hot, humid summers and mild winters. The average temperature in the summer is around 90 degrees Fahrenheit, and the average temperature in the winter is around 70 degrees Fahrenheit.
Economy
Cocoa Beach's economy is largely based on tourism. The city is a popular destination for beachgoers, surfers, and space enthusiasts. The city is also home to several large hotels and resorts, as well as a variety of restaurants and shops.
The city is also home to several aerospace companies, including Lockheed Martin and Northrop Grumman. The city is also home to the Kennedy Space Center Visitor Complex, which attracts millions of visitors each year.
Demographics
As of the 2020 census, Cocoa Beach had a population of 11,231. The population is predominantly white (86.3%), with a small Hispanic population (7.2%). The median household income is $50,945, and the median home value is $323,400.
The city is home to a variety of religious denominations, including Catholic (25.3%), Baptist (17.2%), and Methodist (14.2%). The city is also home to a variety of educational institutions, including Brevard Community College and the University of Central Florida.
Conclusion
Cocoa Beach, Florida is a small city located on the Atlantic Coast of Florida, just south of the Kennedy Space Center. It is a popular tourist destination, known for its beautiful beaches, surfing, and fishing. The city has a population of 11,231 as of the 2020 census, and is part of the larger Brevard County. The city's economy is largely based on tourism, and the city is home to several aerospace companies, as well as the Kennedy Space Center Visitor Complex. The population is predominantly white, with a small Hispanic population. The median household income is $50,945, and the median home value is $323,400.
Common Questions
What is Per Capita Income in Cocoa Beach?
Per Capita income in Cocoa Beach is $62,117.
What is the Median Family Income in Cocoa Beach?
Median Family Income in Cocoa Beach is $116,343.
What is the Median Household income in Cocoa Beach?
Median Household Income in Cocoa Beach is $80,880.
What is Income or Wage Gap in Cocoa Beach?
Income or Wage Gap in Cocoa Beach is 27.3%.
Women in Cocoa Beach earn 72.7 cents for every dollar earned by a man.
What is Inequality or Gini Index in Cocoa Beach?
Inequality or Gini Index in Cocoa Beach is 0.48.
What is the Total Population of Cocoa Beach?
Total Population of Cocoa Beach is 11,334.
What is the Total Male Population of Cocoa Beach?
Total Male Population of Cocoa Beach is 5,849.
What is the Total Female Population of Cocoa Beach?
Total Female Population of Cocoa Beach is 5,485.
What is the Ratio of Males per 100 Females in Cocoa Beach?
There are 106.64 Males per 100 Females in Cocoa Beach.
What is the Ratio of Females per 100 Males in Cocoa Beach?
There are 93.78 Females per 100 Males in Cocoa Beach.
What is the Median Population Age in Cocoa Beach?
Median Population Age in Cocoa Beach is 58.6 Years.
What is the Average Family Size in Cocoa Beach
Average Family Size in Cocoa Beach is 2.5 People.
What is the Average Household Size in Cocoa Beach
Average Household Size in Cocoa Beach is 1.9 People.
How Large is the Labor Force in Cocoa Beach?
There are 5,247 People in the Labor Forcein in Cocoa Beach.
What is the Percentage of People in the Labor Force in Cocoa Beach?
49.8% of People are in the Labor Force in Cocoa Beach.
What is the Unemployment Rate in Cocoa Beach?
Unemployment Rate in Cocoa Beach is 7.4%.