Paauilo, HI Map & Demographics
Paauilo Map
Paauilo Overview
$28,450
PER CAPITA INCOME
$73,750
AVG FAMILY INCOME
$66,250
AVG HOUSEHOLD INCOME
7.7%
WAGE / INCOME GAP [ % ]
92.3¢/ $1
WAGE / INCOME GAP [ $ ]
0.40
INEQUALITY / GINI INDEX
548
TOTAL POPULATION
282
MALE POPULATION
266
FEMALE POPULATION
106.02
MALES / 100 FEMALES
94.33
FEMALES / 100 MALES
51.2
MEDIAN AGE
3.3
AVG FAMILY SIZE
2.6
AVG HOUSEHOLD SIZE
286
LABOR FORCE [ PEOPLE ]
61.5%
PERCENT IN LABOR FORCE
14.0%
UNEMPLOYMENT RATE
Paauilo Zip Codes
Paauilo Area Codes
Income in Paauilo
Income Overview in Paauilo
Per Capita Income in Paauilo is $28,450, while median incomes of families and households are $73,750 and $66,250 respectively.
| Characteristic | Number | Measure |
| Per Capita Income | 548 | $28,450 |
| Median Family Income | 125 | $73,750 |
| Mean Family Income | 125 | $84,695 |
| Median Household Income | 210 | $66,250 |
| Mean Household Income | 210 | $71,062 |
| Income Deficit | 125 | $0 |
| Wage / Income Gap (%) | 548 | 7.66% |
| Wage / Income Gap ($) | 548 | 92.34¢ per $1 |
| Gini / Inequality Index | 548 | 0.40 |
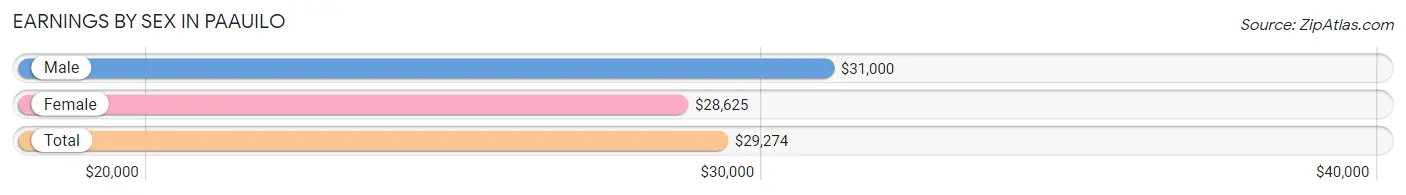
Earnings by Sex in Paauilo
Average Earnings in Paauilo are $29,274, $31,000 for men and $28,625 for women, a difference of 7.7%.
| Sex | Number | Average Earnings |
| Male | 146 (52.9%) | $31,000 |
| Female | 130 (47.1%) | $28,625 |
| Total | 276 (100.0%) | $29,274 |
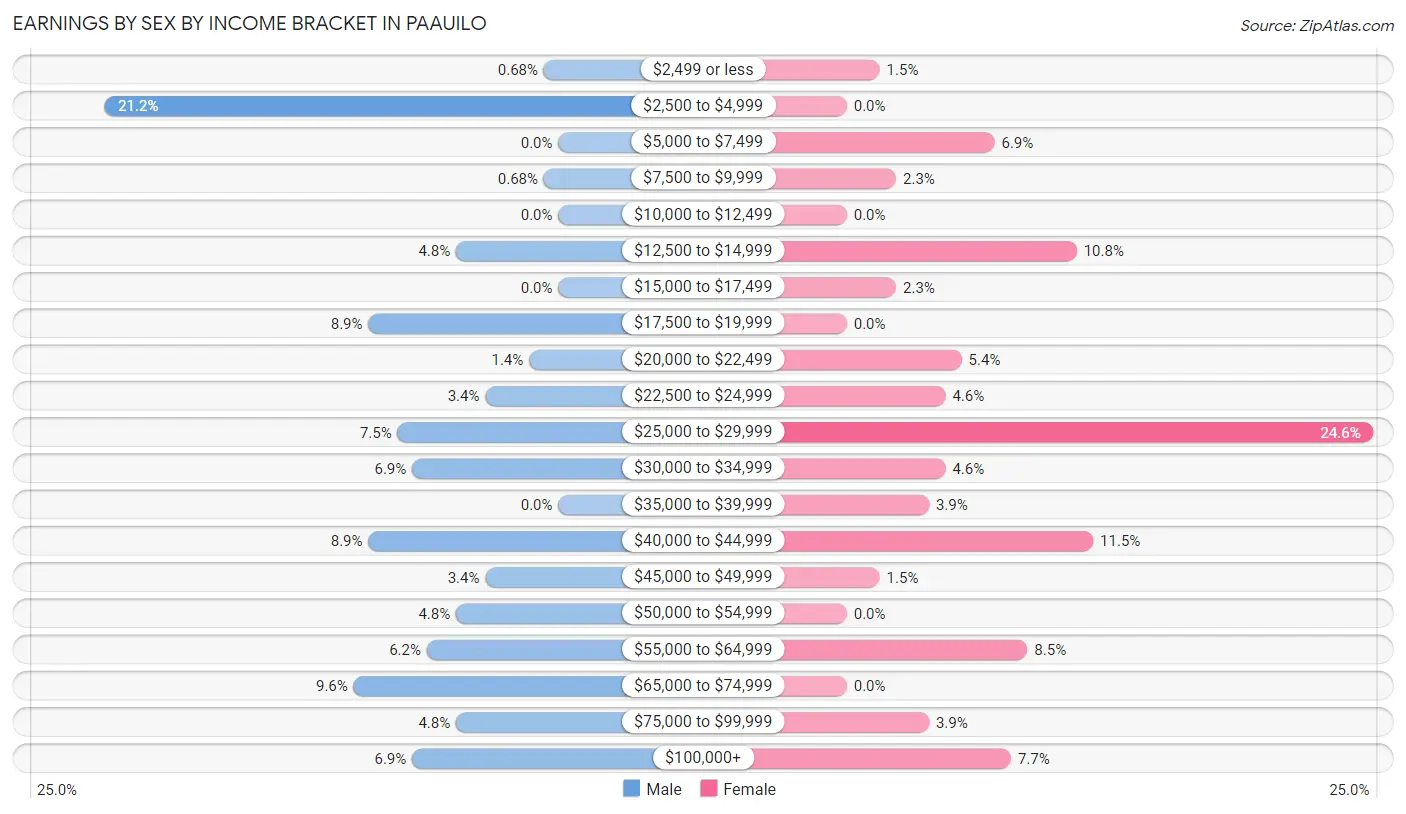
Earnings by Sex by Income Bracket in Paauilo
The most common earnings brackets in Paauilo are $2,500 to $4,999 for men (31 | 21.2%) and $25,000 to $29,999 for women (32 | 24.6%).
| Income | Male | Female |
| $2,499 or less | 1 (0.7%) | 2 (1.5%) |
| $2,500 to $4,999 | 31 (21.2%) | 0 (0.0%) |
| $5,000 to $7,499 | 0 (0.0%) | 9 (6.9%) |
| $7,500 to $9,999 | 1 (0.7%) | 3 (2.3%) |
| $10,000 to $12,499 | 0 (0.0%) | 0 (0.0%) |
| $12,500 to $14,999 | 7 (4.8%) | 14 (10.8%) |
| $15,000 to $17,499 | 0 (0.0%) | 3 (2.3%) |
| $17,500 to $19,999 | 13 (8.9%) | 0 (0.0%) |
| $20,000 to $22,499 | 2 (1.4%) | 7 (5.4%) |
| $22,500 to $24,999 | 5 (3.4%) | 6 (4.6%) |
| $25,000 to $29,999 | 11 (7.5%) | 32 (24.6%) |
| $30,000 to $34,999 | 10 (6.9%) | 6 (4.6%) |
| $35,000 to $39,999 | 0 (0.0%) | 5 (3.8%) |
| $40,000 to $44,999 | 13 (8.9%) | 15 (11.5%) |
| $45,000 to $49,999 | 5 (3.4%) | 2 (1.5%) |
| $50,000 to $54,999 | 7 (4.8%) | 0 (0.0%) |
| $55,000 to $64,999 | 9 (6.2%) | 11 (8.5%) |
| $65,000 to $74,999 | 14 (9.6%) | 0 (0.0%) |
| $75,000 to $99,999 | 7 (4.8%) | 5 (3.8%) |
| $100,000+ | 10 (6.9%) | 10 (7.7%) |
| Total | 146 (100.0%) | 130 (100.0%) |
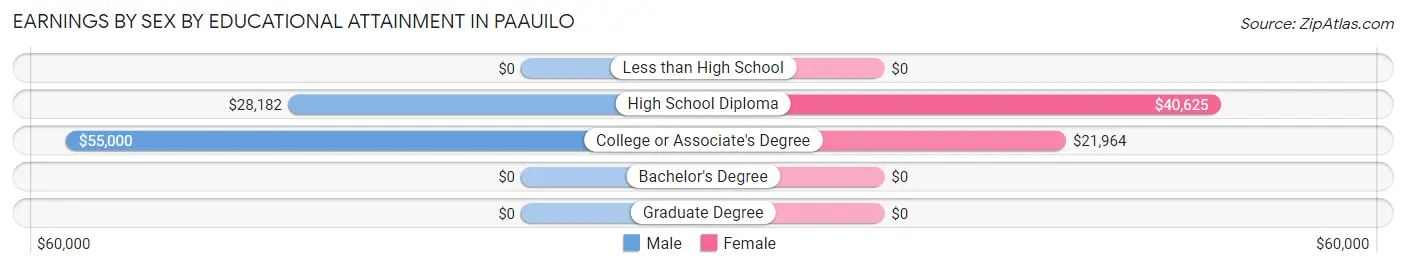
Earnings by Sex by Educational Attainment in Paauilo
Average earnings in Paauilo are $37,500 for men and $29,500 for women, a difference of 21.3%. Men with an educational attainment of college or associate's degree enjoy the highest average annual earnings of $55,000, while those with high school diploma education earn the least with $28,182. Women with an educational attainment of high school diploma earn the most with the average annual earnings of $40,625, while those with college or associate's degree education have the smallest earnings of $21,964.
| Educational Attainment | Male Income | Female Income |
| Less than High School | - | - |
| High School Diploma | $28,182 | $40,625 |
| College or Associate's Degree | $55,000 | $21,964 |
| Bachelor's Degree | - | - |
| Graduate Degree | - | - |
| Total | $37,500 | $29,500 |
Family Income in Paauilo
Family Income Brackets in Paauilo
According to the Paauilo family income data, there are 44 families falling into the $50,000 to $74,999 income range, which is the most common income bracket and makes up 35.2% of all families.
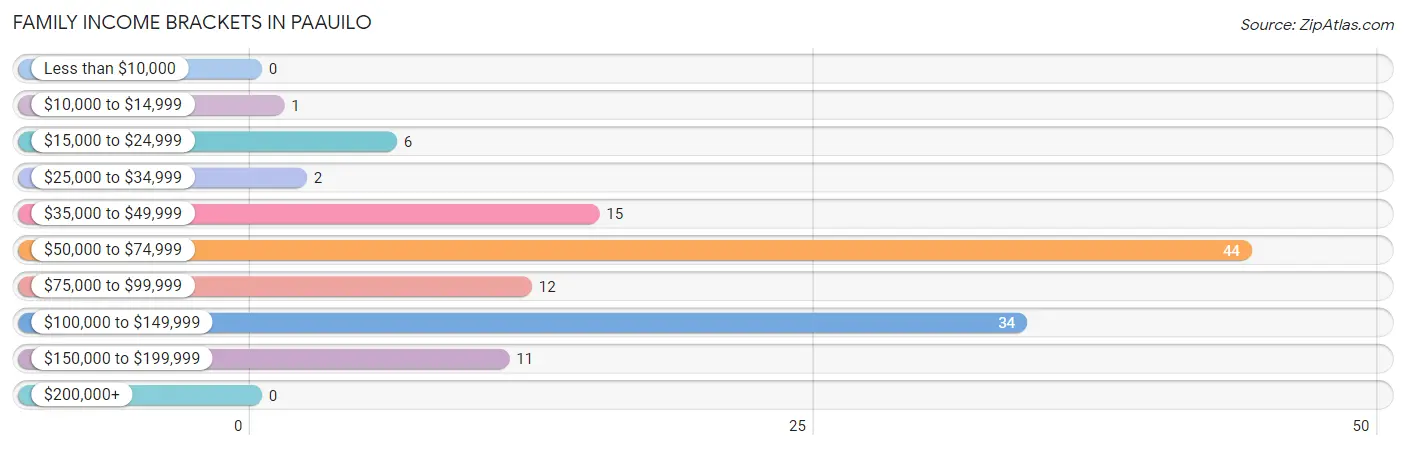
| Income Bracket | # Families | % Families |
| Less than $10,000 | 0 | 0.0% |
| $10,000 to $14,999 | 1 | 0.8% |
| $15,000 to $24,999 | 6 | 4.8% |
| $25,000 to $34,999 | 2 | 1.6% |
| $35,000 to $49,999 | 15 | 12.0% |
| $50,000 to $74,999 | 44 | 35.2% |
| $75,000 to $99,999 | 12 | 9.6% |
| $100,000 to $149,999 | 34 | 27.2% |
| $150,000 to $199,999 | 11 | 8.8% |
| $200,000+ | 0 | 0.0% |
Family Income by Famaliy Size in Paauilo
2-person families (44 | 35.2%) account for the highest median family income in Paauilo with $101,250 per family, while 2-person families (44 | 35.2%) have the highest median income of $50,625 per family member.
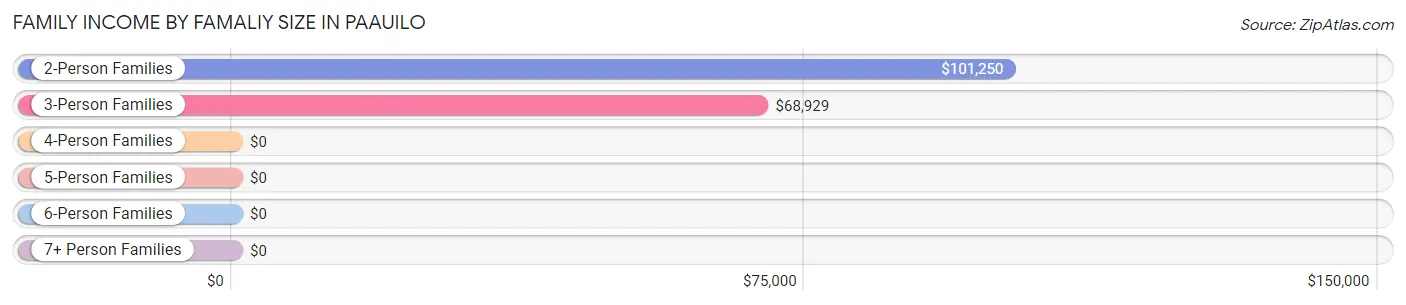
| Income Bracket | # Families | Median Income |
| 2-Person Families | 44 (35.2%) | $101,250 |
| 3-Person Families | 54 (43.2%) | $68,929 |
| 4-Person Families | 19 (15.2%) | $0 |
| 5-Person Families | 2 (1.6%) | $0 |
| 6-Person Families | 0 (0.0%) | $0 |
| 7+ Person Families | 6 (4.8%) | $0 |
| Total | 125 (100.0%) | $73,750 |
Family Income by Number of Earners in Paauilo
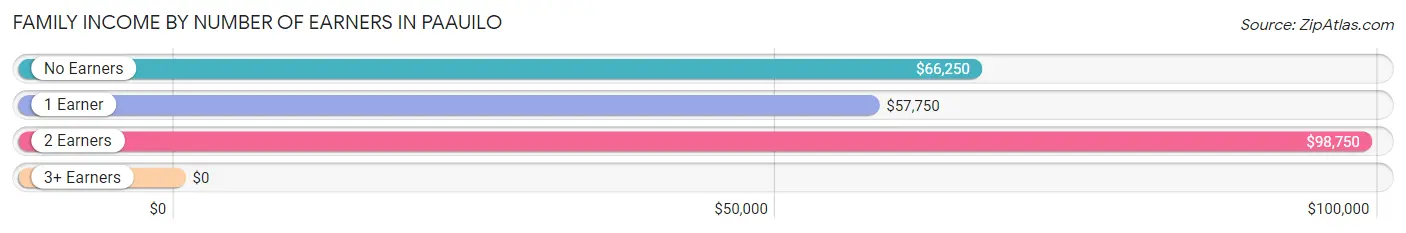
| Number of Earners | # Families | Median Income |
| No Earners | 22 (17.6%) | $66,250 |
| 1 Earner | 27 (21.6%) | $57,750 |
| 2 Earners | 63 (50.4%) | $98,750 |
| 3+ Earners | 13 (10.4%) | $0 |
| Total | 125 (100.0%) | $73,750 |
Household Income in Paauilo
Household Income Brackets in Paauilo
With 45 households falling in the category, the $50,000 to $74,999 income range is the most frequent in Paauilo, accounting for 21.4% of all households. In contrast, only 6 households (2.9%) fall into the $200,000+ income bracket, making it the least populous group.
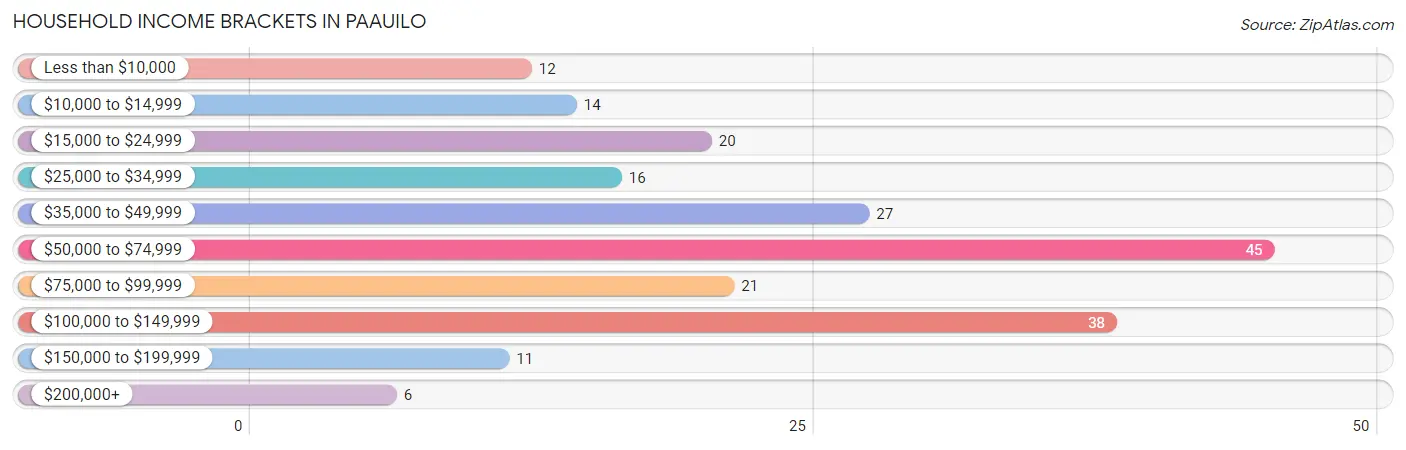
| Income Bracket | # Households | % Households |
| Less than $10,000 | 12 | 5.7% |
| $10,000 to $14,999 | 14 | 6.7% |
| $15,000 to $24,999 | 20 | 9.5% |
| $25,000 to $34,999 | 16 | 7.6% |
| $35,000 to $49,999 | 27 | 12.9% |
| $50,000 to $74,999 | 45 | 21.4% |
| $75,000 to $99,999 | 21 | 10.0% |
| $100,000 to $149,999 | 38 | 18.1% |
| $150,000 to $199,999 | 11 | 5.2% |
| $200,000+ | 6 | 2.9% |
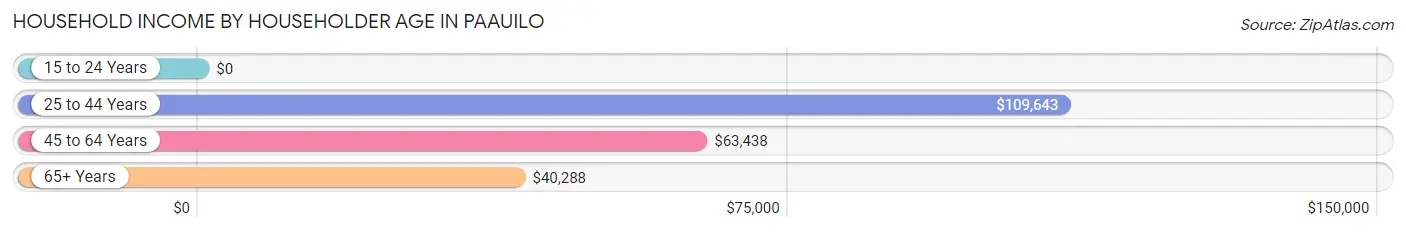
Household Income by Householder Age in Paauilo
The median household income in Paauilo is $66,250, with the highest median household income of $109,643 found in the 25 to 44 years age bracket for the primary householder. A total of 42 households (20.0%) fall into this category.
| Income Bracket | # Households | Median Income |
| 15 to 24 Years | 0 (0.0%) | $0 |
| 25 to 44 Years | 42 (20.0%) | $109,643 |
| 45 to 64 Years | 75 (35.7%) | $63,438 |
| 65+ Years | 93 (44.3%) | $40,288 |
| Total | 210 (100.0%) | $66,250 |
Poverty in Paauilo
Income Below Poverty by Sex and Age in Paauilo
With 11.7% poverty level for males and 6.0% for females among the residents of Paauilo, 45 to 54 year old males and 5 year old females are the most vulnerable to poverty, with 11 males (32.4%) and 1 females (100.0%) in their respective age groups living below the poverty level.
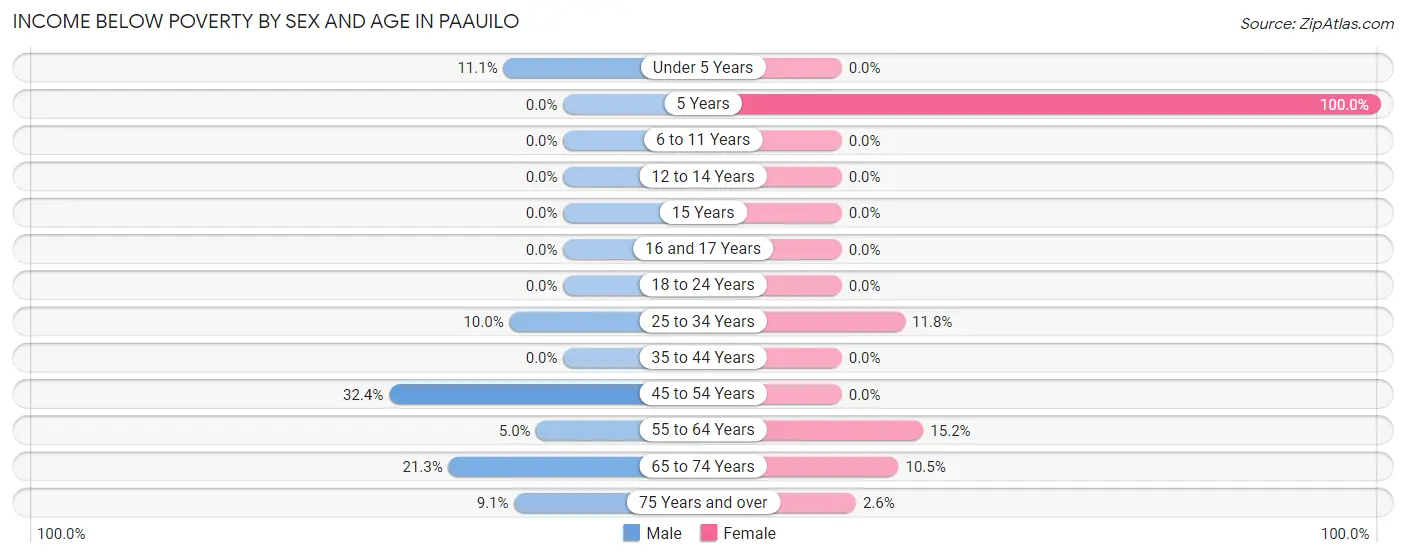
| Age Bracket | Male | Female |
| Under 5 Years | 3 (11.1%) | 0 (0.0%) |
| 5 Years | 0 (0.0%) | 1 (100.0%) |
| 6 to 11 Years | 0 (0.0%) | 0 (0.0%) |
| 12 to 14 Years | 0 (0.0%) | 0 (0.0%) |
| 15 Years | 0 (0.0%) | 0 (0.0%) |
| 16 and 17 Years | 0 (0.0%) | 0 (0.0%) |
| 18 to 24 Years | 0 (0.0%) | 0 (0.0%) |
| 25 to 34 Years | 3 (10.0%) | 2 (11.8%) |
| 35 to 44 Years | 0 (0.0%) | 0 (0.0%) |
| 45 to 54 Years | 11 (32.4%) | 0 (0.0%) |
| 55 to 64 Years | 2 (5.0%) | 10 (15.1%) |
| 65 to 74 Years | 13 (21.3%) | 2 (10.5%) |
| 75 Years and over | 1 (9.1%) | 1 (2.6%) |
| Total | 33 (11.7%) | 16 (6.0%) |
Income Above Poverty by Sex and Age in Paauilo
According to the poverty statistics in Paauilo, males aged 6 to 11 years and females aged under 5 years are the age groups that are most secure financially, with 100.0% of males and 100.0% of females in these age groups living above the poverty line.
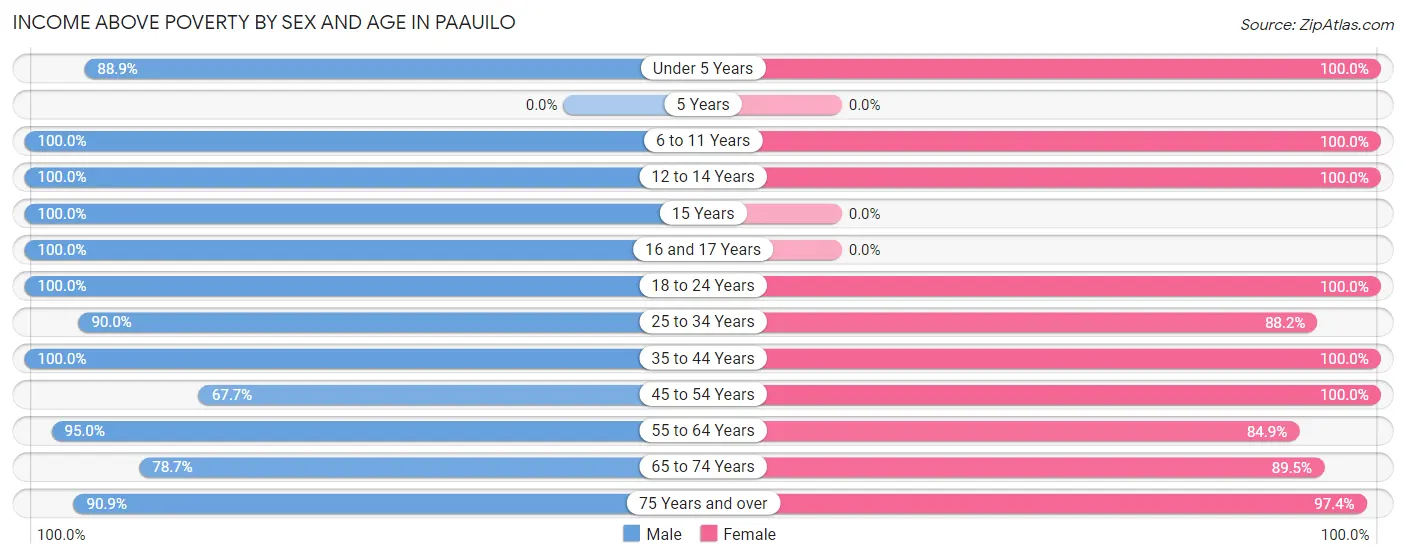
| Age Bracket | Male | Female |
| Under 5 Years | 24 (88.9%) | 10 (100.0%) |
| 5 Years | 0 (0.0%) | 0 (0.0%) |
| 6 to 11 Years | 16 (100.0%) | 18 (100.0%) |
| 12 to 14 Years | 2 (100.0%) | 8 (100.0%) |
| 15 Years | 1 (100.0%) | 0 (0.0%) |
| 16 and 17 Years | 11 (100.0%) | 0 (0.0%) |
| 18 to 24 Years | 16 (100.0%) | 14 (100.0%) |
| 25 to 34 Years | 27 (90.0%) | 15 (88.2%) |
| 35 to 44 Years | 33 (100.0%) | 32 (100.0%) |
| 45 to 54 Years | 23 (67.6%) | 43 (100.0%) |
| 55 to 64 Years | 38 (95.0%) | 56 (84.9%) |
| 65 to 74 Years | 48 (78.7%) | 17 (89.5%) |
| 75 Years and over | 10 (90.9%) | 37 (97.4%) |
| Total | 249 (88.3%) | 250 (94.0%) |
Income Below Poverty Among Married-Couple Families in Paauilo
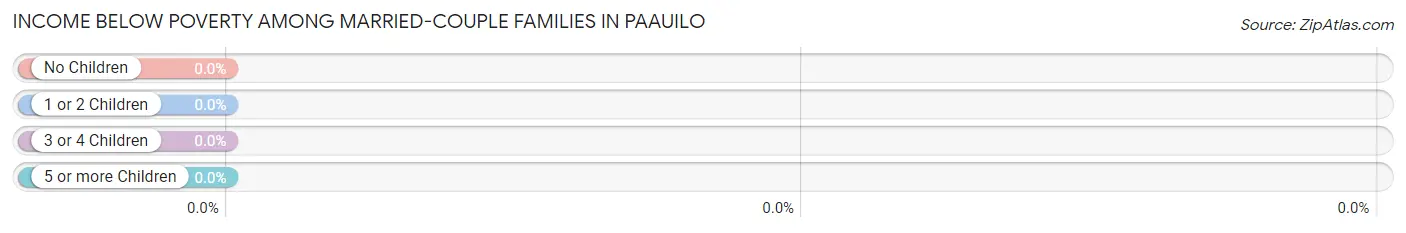
| Children | Above Poverty | Below Poverty |
| No Children | 44 (100.0%) | 0 (0.0%) |
| 1 or 2 Children | 34 (100.0%) | 0 (0.0%) |
| 3 or 4 Children | 1 (100.0%) | 0 (0.0%) |
| 5 or more Children | 0 (0.0%) | 0 (0.0%) |
| Total | 79 (100.0%) | 0 (0.0%) |
Income Below Poverty Among Single-Parent Households in Paauilo
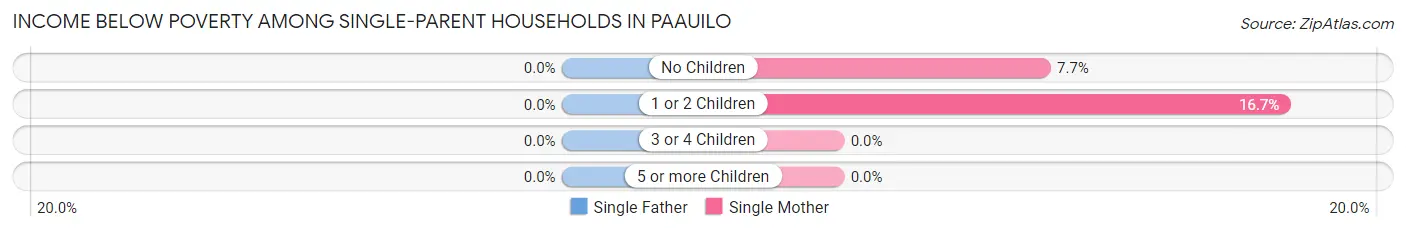
| Children | Single Father | Single Mother |
| No Children | 0 (0.0%) | 1 (7.7%) |
| 1 or 2 Children | 0 (0.0%) | 2 (16.7%) |
| 3 or 4 Children | 0 (0.0%) | 0 (0.0%) |
| 5 or more Children | 0 (0.0%) | 0 (0.0%) |
| Total | 0 (0.0%) | 3 (11.5%) |
Income Below Poverty Among Married-Couple vs Single-Parent Households in Paauilo
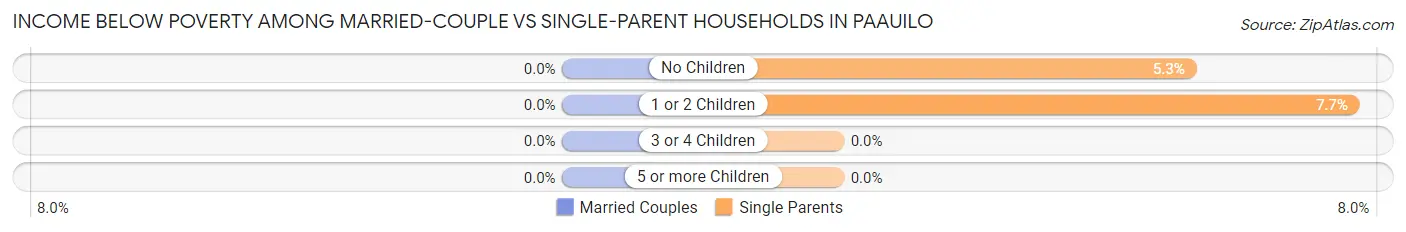
| Children | Married-Couple Families | Single-Parent Households |
| No Children | 0 (0.0%) | 1 (5.3%) |
| 1 or 2 Children | 0 (0.0%) | 2 (7.7%) |
| 3 or 4 Children | 0 (0.0%) | 0 (0.0%) |
| 5 or more Children | 0 (0.0%) | 0 (0.0%) |
| Total | 0 (0.0%) | 3 (6.5%) |
Race in Paauilo
The most populous races in Paauilo are Two or more Races (241 | 44.0%), Asian (162 | 29.6%), and White / Caucasian (124 | 22.6%).
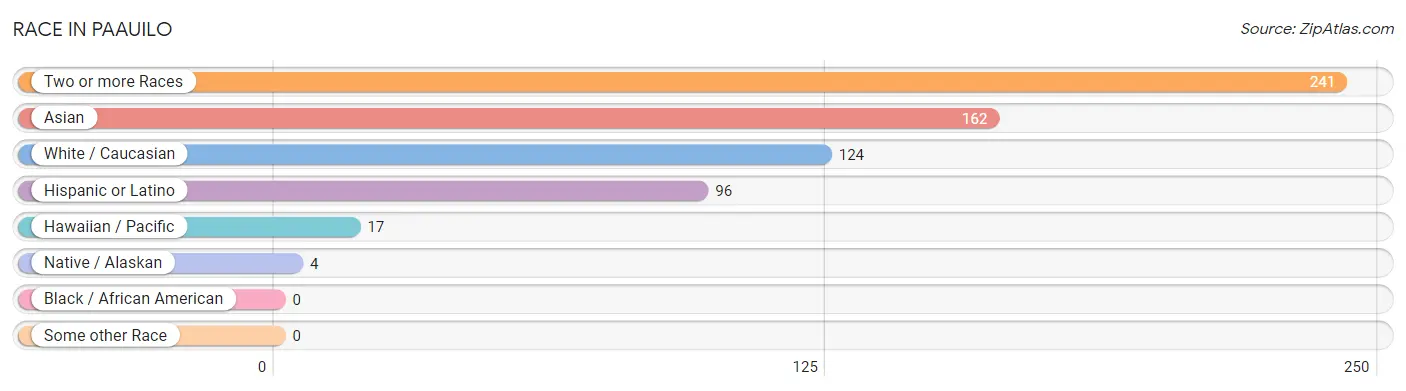
| Race | # Population | % Population |
| Asian | 162 | 29.6% |
| Black / African American | 0 | 0.0% |
| Hawaiian / Pacific | 17 | 3.1% |
| Hispanic or Latino | 96 | 17.5% |
| Native / Alaskan | 4 | 0.7% |
| White / Caucasian | 124 | 22.6% |
| Two or more Races | 241 | 44.0% |
| Some other Race | 0 | 0.0% |
| Total | 548 | 100.0% |
Ancestry in Paauilo
The most populous ancestries reported in Paauilo are Korean (219 | 40.0%), Native Hawaiian (189 | 34.5%), Portuguese (86 | 15.7%), Puerto Rican (71 | 13.0%), and Bhutanese (66 | 12.0%), together accounting for 115.1% of all Paauilo residents.
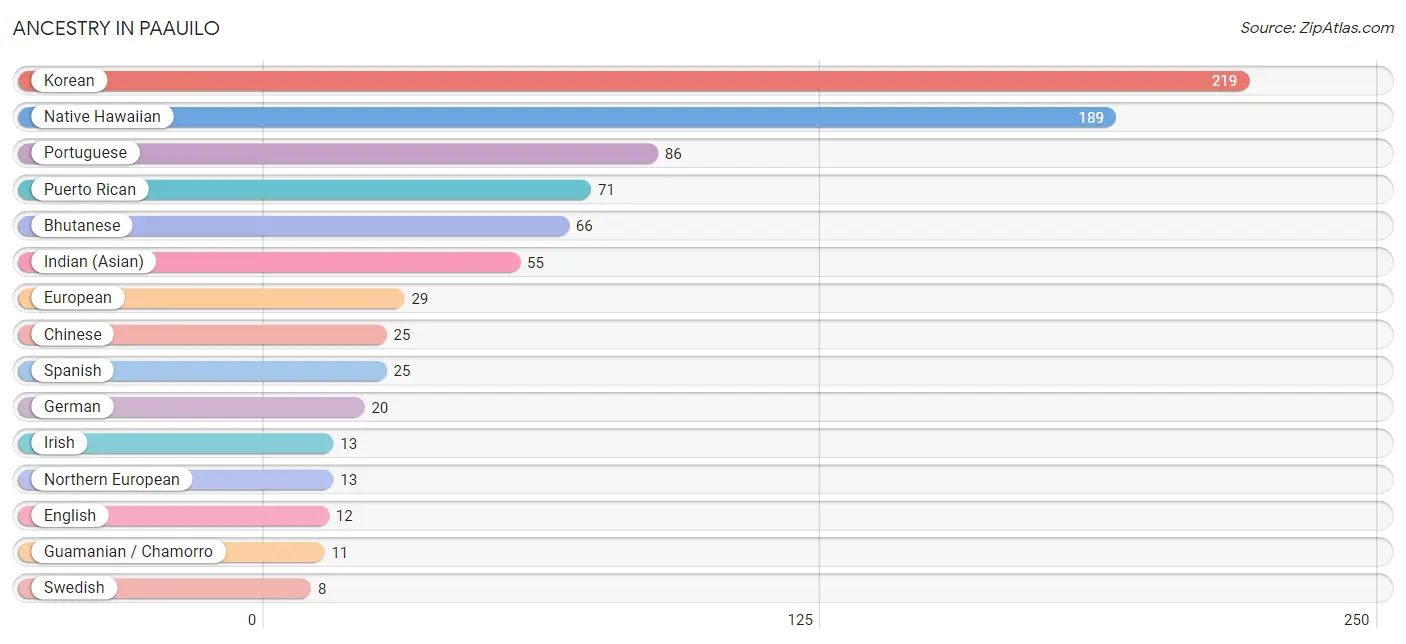
| Ancestry | # Population | % Population |
| American | 1 | 0.2% |
| Bhutanese | 66 | 12.0% |
| Burmese | 6 | 1.1% |
| Canadian | 5 | 0.9% |
| Chinese | 25 | 4.6% |
| Czech | 7 | 1.3% |
| English | 12 | 2.2% |
| European | 29 | 5.3% |
| German | 20 | 3.6% |
| Guamanian / Chamorro | 11 | 2.0% |
| Indian (Asian) | 55 | 10.0% |
| Irish | 13 | 2.4% |
| Korean | 219 | 40.0% |
| Native Hawaiian | 189 | 34.5% |
| Northern European | 13 | 2.4% |
| Portuguese | 86 | 15.7% |
| Puerto Rican | 71 | 13.0% |
| Spanish | 25 | 4.6% |
| Swedish | 8 | 1.5% |
| Yup'ik | 4 | 0.7% | View All 20 Rows |
Immigrants in Paauilo
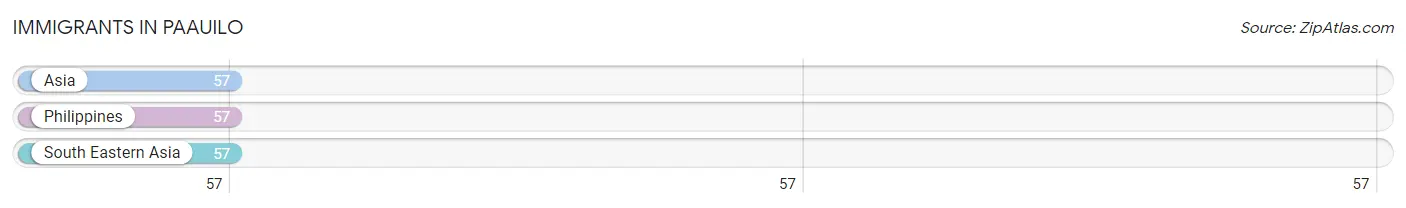
The most numerous immigrant groups reported in Paauilo came from Asia (57 | 10.4%), Philippines (57 | 10.4%), and South Eastern Asia (57 | 10.4%), together accounting for 31.2% of all Paauilo residents.
| Immigration Origin | # Population | % Population |
| Asia | 57 | 10.4% |
| Philippines | 57 | 10.4% |
| South Eastern Asia | 57 | 10.4% | View All 3 Rows |
Sex and Age in Paauilo
Sex and Age in Paauilo
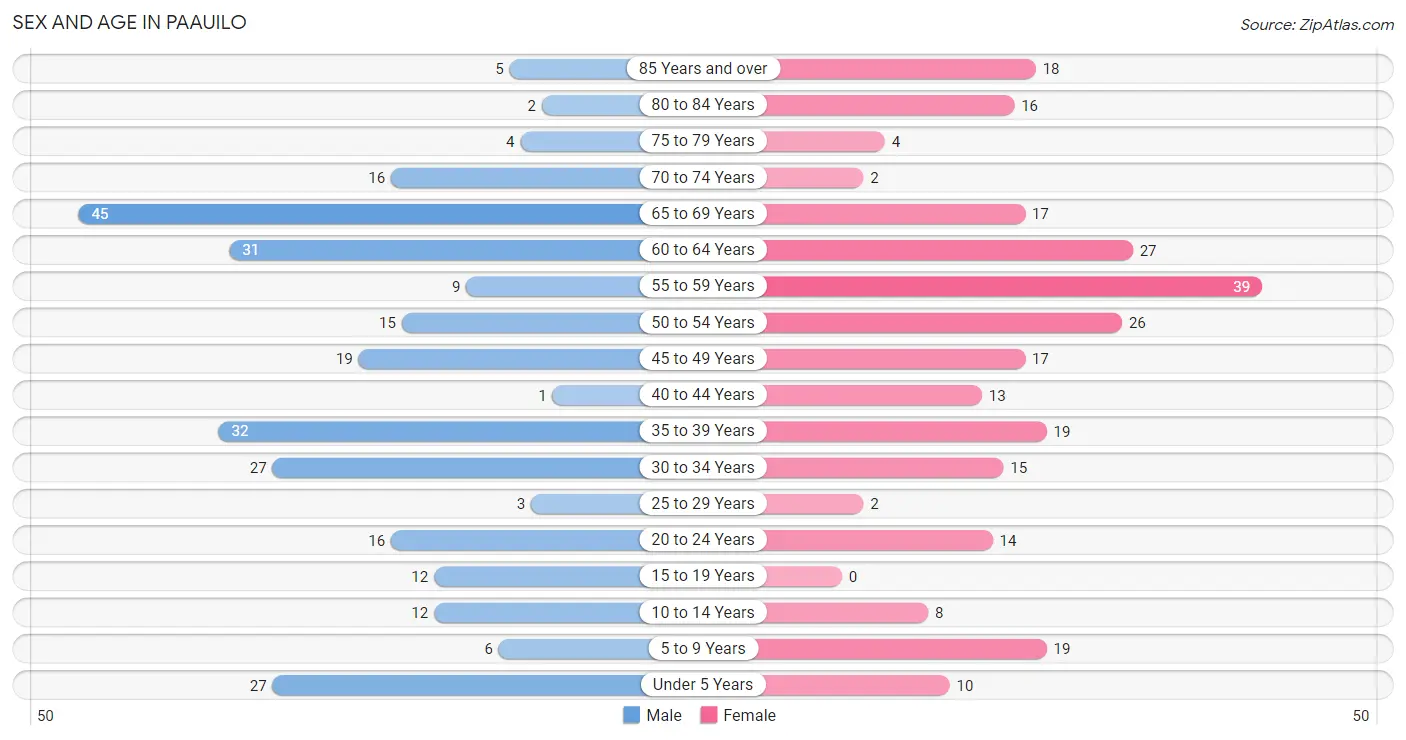
The most populous age groups in Paauilo are 65 to 69 Years (45 | 16.0%) for men and 55 to 59 Years (39 | 14.7%) for women.
| Age Bracket | Male | Female |
| Under 5 Years | 27 (9.6%) | 10 (3.8%) |
| 5 to 9 Years | 6 (2.1%) | 19 (7.1%) |
| 10 to 14 Years | 12 (4.3%) | 8 (3.0%) |
| 15 to 19 Years | 12 (4.3%) | 0 (0.0%) |
| 20 to 24 Years | 16 (5.7%) | 14 (5.3%) |
| 25 to 29 Years | 3 (1.1%) | 2 (0.7%) |
| 30 to 34 Years | 27 (9.6%) | 15 (5.6%) |
| 35 to 39 Years | 32 (11.4%) | 19 (7.1%) |
| 40 to 44 Years | 1 (0.4%) | 13 (4.9%) |
| 45 to 49 Years | 19 (6.7%) | 17 (6.4%) |
| 50 to 54 Years | 15 (5.3%) | 26 (9.8%) |
| 55 to 59 Years | 9 (3.2%) | 39 (14.7%) |
| 60 to 64 Years | 31 (11.0%) | 27 (10.2%) |
| 65 to 69 Years | 45 (16.0%) | 17 (6.4%) |
| 70 to 74 Years | 16 (5.7%) | 2 (0.7%) |
| 75 to 79 Years | 4 (1.4%) | 4 (1.5%) |
| 80 to 84 Years | 2 (0.7%) | 16 (6.0%) |
| 85 Years and over | 5 (1.8%) | 18 (6.8%) |
| Total | 282 (100.0%) | 266 (100.0%) |
Families and Households in Paauilo
Median Family Size in Paauilo
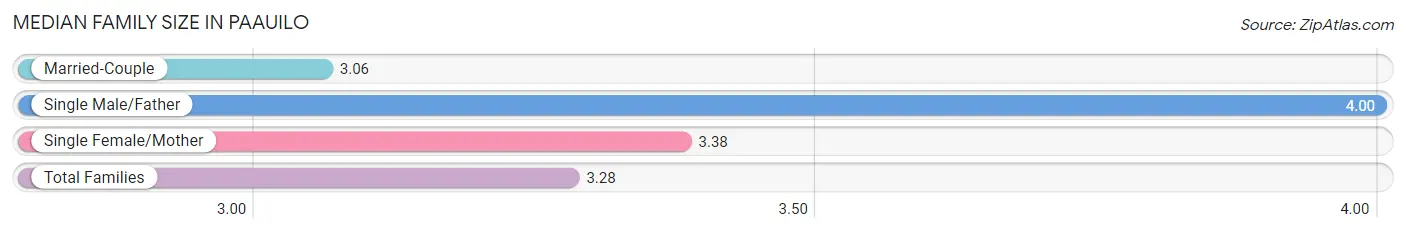
The median family size in Paauilo is 3.28 persons per family, with single male/father families (20 | 16.0%) accounting for the largest median family size of 4 persons per family. On the other hand, married-couple families (79 | 63.2%) represent the smallest median family size with 3.06 persons per family.
| Family Type | # Families | Family Size |
| Married-Couple | 79 (63.2%) | 3.06 |
| Single Male/Father | 20 (16.0%) | 4.00 |
| Single Female/Mother | 26 (20.8%) | 3.38 |
| Total Families | 125 (100.0%) | 3.28 |
Median Household Size in Paauilo
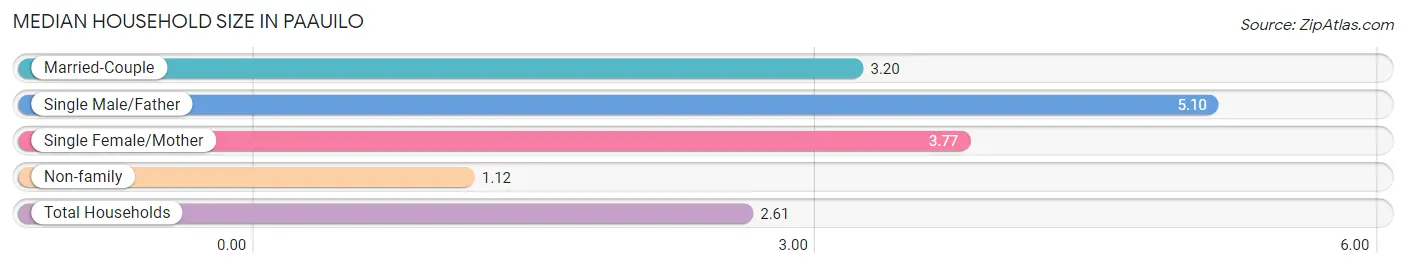
The median household size in Paauilo is 2.61 persons per household, with single male/father households (20 | 9.5%) accounting for the largest median household size of 5.1 persons per household. non-family households (85 | 40.5%) represent the smallest median household size with 1.12 persons per household.
| Household Type | # Households | Household Size |
| Married-Couple | 79 (37.6%) | 3.20 |
| Single Male/Father | 20 (9.5%) | 5.10 |
| Single Female/Mother | 26 (12.4%) | 3.77 |
| Non-family | 85 (40.5%) | 1.12 |
| Total Households | 210 (100.0%) | 2.61 |
Household Size by Marriage Status in Paauilo
Out of a total of 210 households in Paauilo, 125 (59.5%) are family households, while 85 (40.5%) are nonfamily households. The most numerous type of family households are 3-person households, comprising 53, and the most common type of nonfamily households are 1-person households, comprising 81.
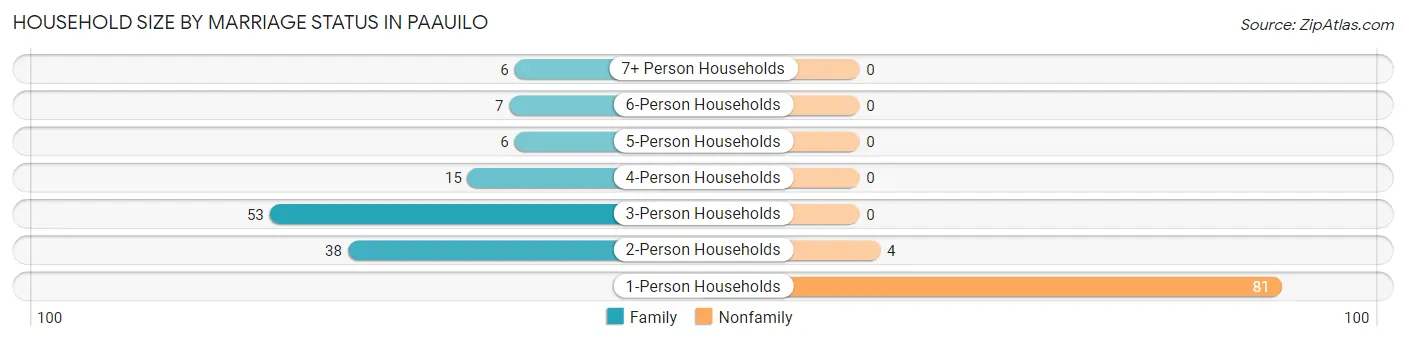
| Household Size | Family Households | Nonfamily Households |
| 1-Person Households | - | 81 (38.6%) |
| 2-Person Households | 38 (18.1%) | 4 (1.9%) |
| 3-Person Households | 53 (25.2%) | 0 (0.0%) |
| 4-Person Households | 15 (7.1%) | 0 (0.0%) |
| 5-Person Households | 6 (2.9%) | 0 (0.0%) |
| 6-Person Households | 7 (3.3%) | 0 (0.0%) |
| 7+ Person Households | 6 (2.9%) | 0 (0.0%) |
| Total | 125 (59.5%) | 85 (40.5%) |
Female Fertility in Paauilo
Fertility by Age in Paauilo
Average fertility rate in Paauilo is 213.0 births per 1,000 women. Women in the age bracket of 20 to 34 years have the highest fertility rate with 323.0 births per 1,000 women. Women in the age bracket of 20 to 34 years acount for 58.8% of all women with births.
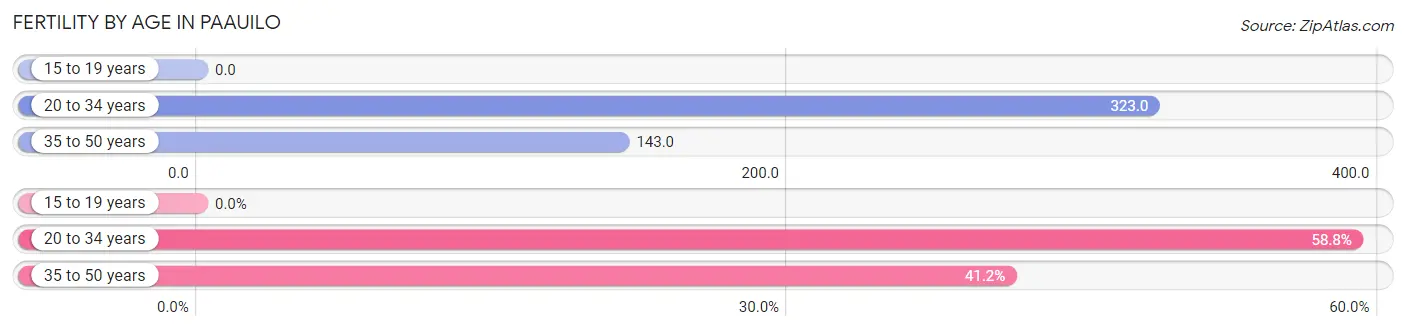
| Age Bracket | Women with Births | Births / 1,000 Women |
| 15 to 19 years | 0 (0.0%) | 0.0 |
| 20 to 34 years | 10 (58.8%) | 323.0 |
| 35 to 50 years | 7 (41.2%) | 143.0 |
| Total | 17 (100.0%) | 213.0 |
Fertility by Age by Marriage Status in Paauilo
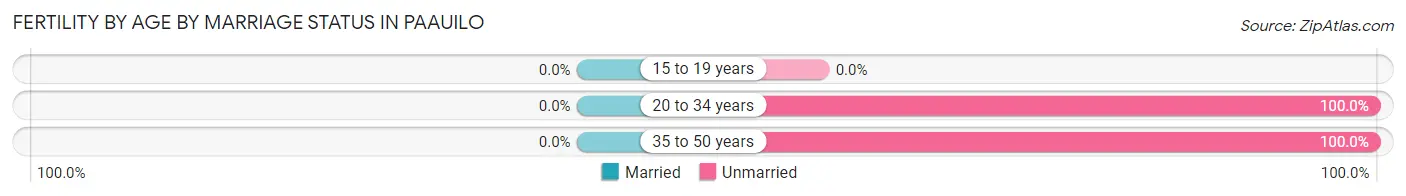
| Age Bracket | Married | Unmarried |
| 15 to 19 years | 0 (0.0%) | 0 (0.0%) |
| 20 to 34 years | 0 (0.0%) | 10 (100.0%) |
| 35 to 50 years | 0 (0.0%) | 7 (100.0%) |
| Total | 0 (0.0%) | 17 (100.0%) |
Fertility by Education in Paauilo
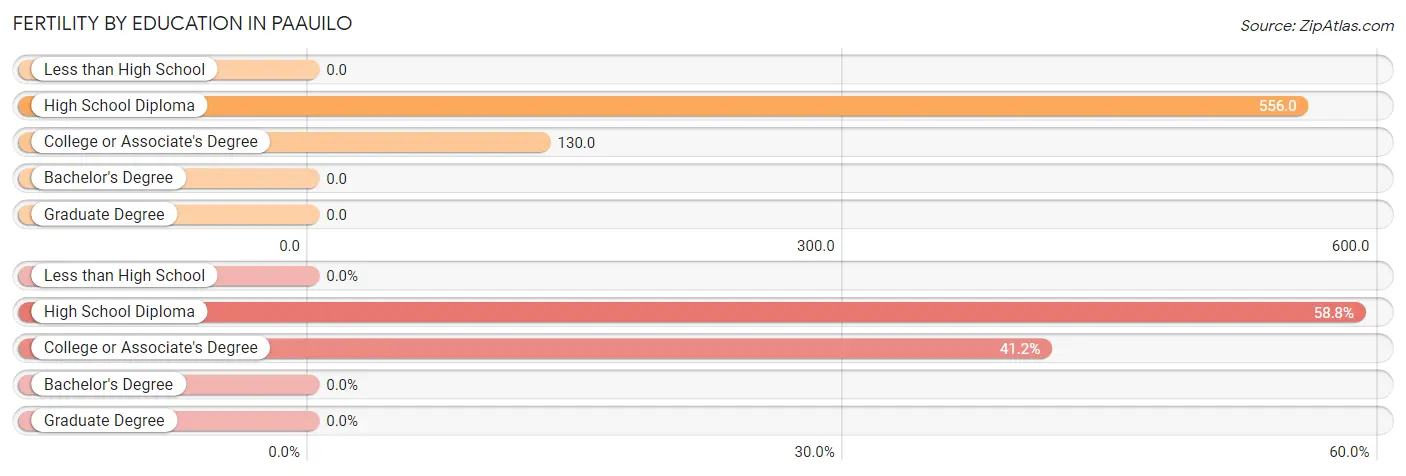
| Educational Attainment | Women with Births | Births / 1,000 Women |
| Less than High School | 0 (0.0%) | 0.0 |
| High School Diploma | 10 (58.8%) | 556.0 |
| College or Associate's Degree | 7 (41.2%) | 130.0 |
| Bachelor's Degree | 0 (0.0%) | 0.0 |
| Graduate Degree | 0 (0.0%) | 0.0 |
| Total | 17 (100.0%) | 213.0 |
Fertility by Education by Marriage Status in Paauilo
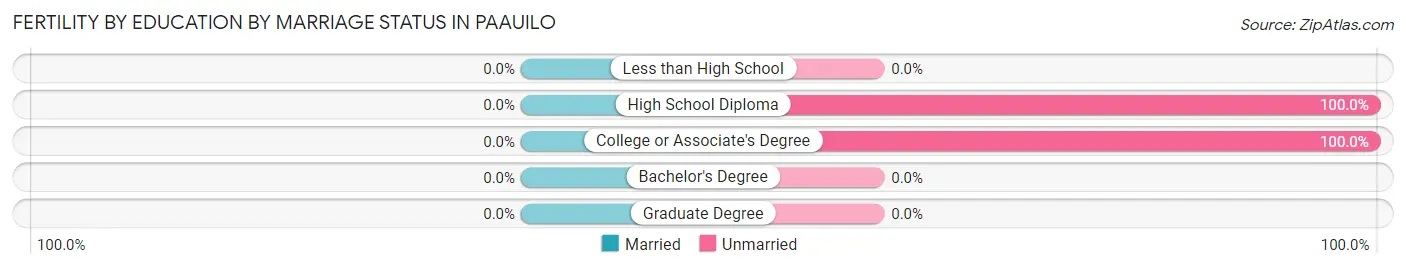
| Educational Attainment | Married | Unmarried |
| Less than High School | 0 (0.0%) | 0 (0.0%) |
| High School Diploma | 0 (0.0%) | 10 (100.0%) |
| College or Associate's Degree | 0 (0.0%) | 7 (100.0%) |
| Bachelor's Degree | 0 (0.0%) | 0 (0.0%) |
| Graduate Degree | 0 (0.0%) | 0 (0.0%) |
| Total | 0 (0.0%) | 17 (100.0%) |
Employment Characteristics in Paauilo
Employment by Class of Employer in Paauilo
Among the 219 employed individuals in Paauilo, private company employees (159 | 72.6%), not-for-profit organizations (26 | 11.9%), and self-employed (not incorporated) (15 | 6.9%) make up the most common classes of employment.
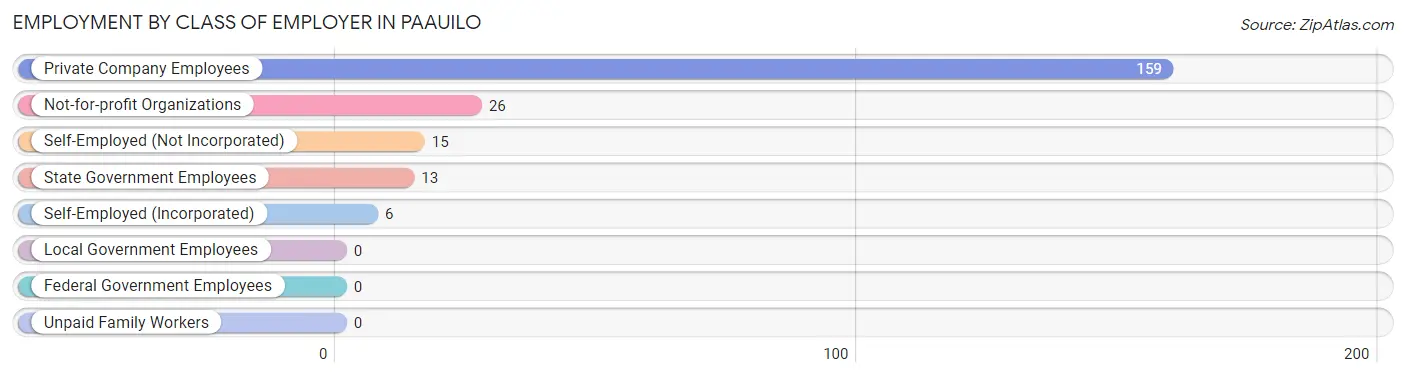
| Employer Class | # Employees | % Employees |
| Private Company Employees | 159 | 72.6% |
| Self-Employed (Incorporated) | 6 | 2.7% |
| Self-Employed (Not Incorporated) | 15 | 6.9% |
| Not-for-profit Organizations | 26 | 11.9% |
| Local Government Employees | 0 | 0.0% |
| State Government Employees | 13 | 5.9% |
| Federal Government Employees | 0 | 0.0% |
| Unpaid Family Workers | 0 | 0.0% |
| Total | 219 | 100.0% |
Employment Status by Age in Paauilo
According to the labor force statistics for Paauilo, out of the total population over 16 years of age (465), 61.5% or 286 individuals are in the labor force, with 14.0% or 40 of them unemployed. The age group with the highest labor force participation rate is 30 to 34 years, with 100.0% or 42 individuals in the labor force. Within the labor force, the 30 to 34 years age range has the highest percentage of unemployed individuals, with 31.0% or 13 of them being unemployed.
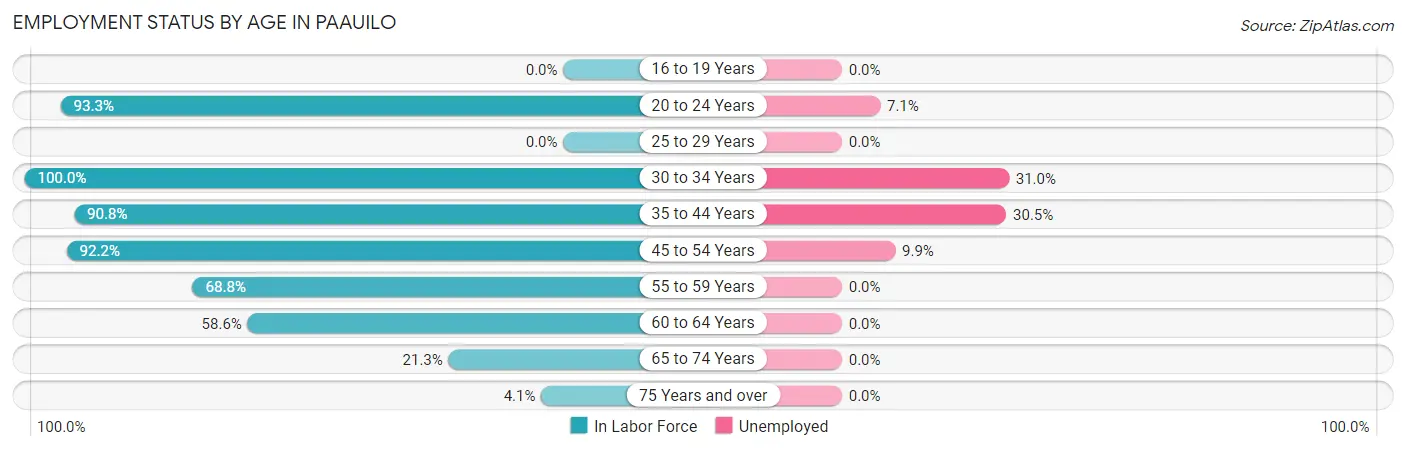
| Age Bracket | In Labor Force | Unemployed |
| 16 to 19 Years | 0 (0.0%) | 0 (0.0%) |
| 20 to 24 Years | 28 (93.3%) | 2 (7.1%) |
| 25 to 29 Years | 0 (0.0%) | 0 (0.0%) |
| 30 to 34 Years | 42 (100.0%) | 13 (31.0%) |
| 35 to 44 Years | 59 (90.8%) | 18 (30.5%) |
| 45 to 54 Years | 71 (92.2%) | 7 (9.9%) |
| 55 to 59 Years | 33 (68.8%) | 0 (0.0%) |
| 60 to 64 Years | 34 (58.6%) | 0 (0.0%) |
| 65 to 74 Years | 17 (21.3%) | 0 (0.0%) |
| 75 Years and over | 2 (4.1%) | 0 (0.0%) |
| Total | 286 (61.5%) | 40 (14.0%) |
Employment Status by Educational Attainment in Paauilo
According to labor force statistics for Paauilo, 81.0% of individuals (239) out of the total population between 25 and 64 years of age (295) are in the labor force, with 15.9% or 38 of them being unemployed. The group with the highest labor force participation rate are those with the educational attainment of less than high school, with 100.0% or 5 individuals in the labor force. Within the labor force, individuals with high school diploma education have the highest percentage of unemployment, with 21.0% or 25 of them being unemployed.
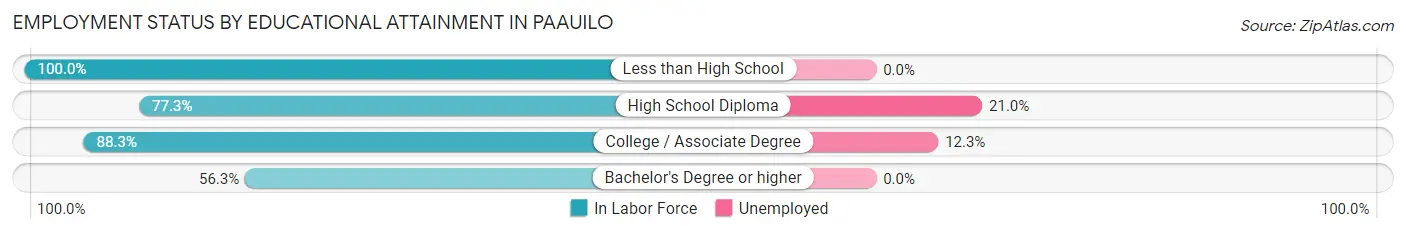
| Educational Attainment | In Labor Force | Unemployed |
| Less than High School | 5 (100.0%) | 0 (0.0%) |
| High School Diploma | 119 (77.3%) | 32 (21.0%) |
| College / Associate Degree | 106 (88.3%) | 15 (12.3%) |
| Bachelor's Degree or higher | 9 (56.3%) | 0 (0.0%) |
| Total | 239 (81.0%) | 47 (15.9%) |
Employment Occupations by Sex in Paauilo
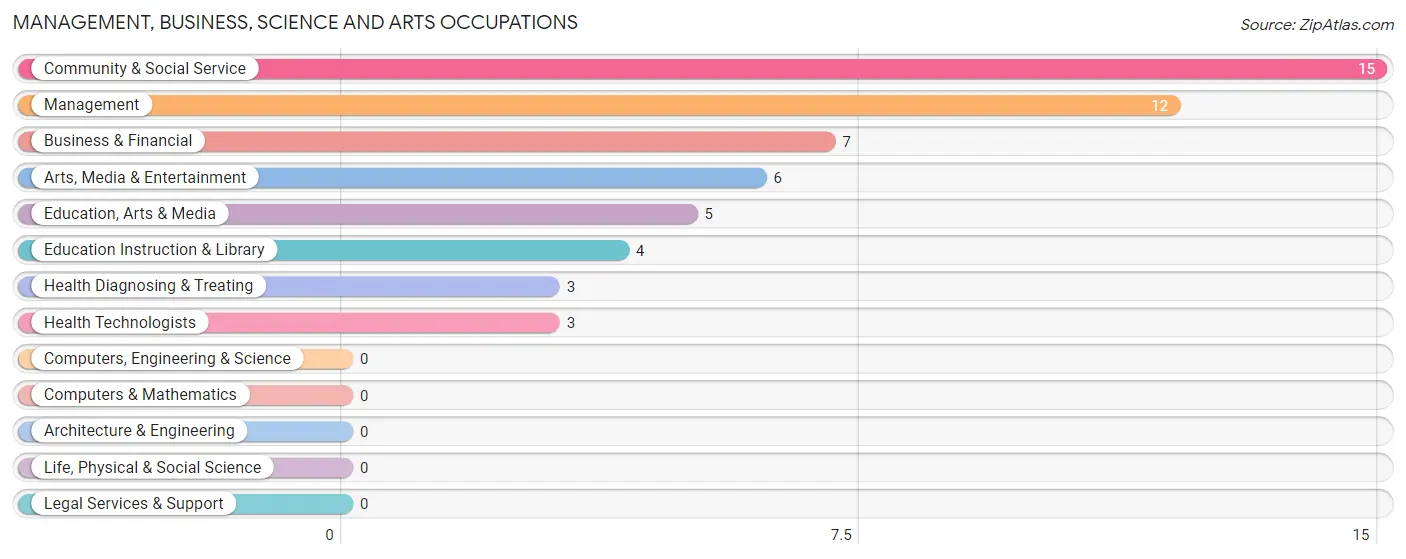
Management, Business, Science and Arts Occupations
The most common Management, Business, Science and Arts occupations in Paauilo are Community & Social Service (15 | 6.1%), Management (12 | 4.9%), Business & Financial (7 | 2.9%), Arts, Media & Entertainment (6 | 2.4%), and Education, Arts & Media (5 | 2.0%).
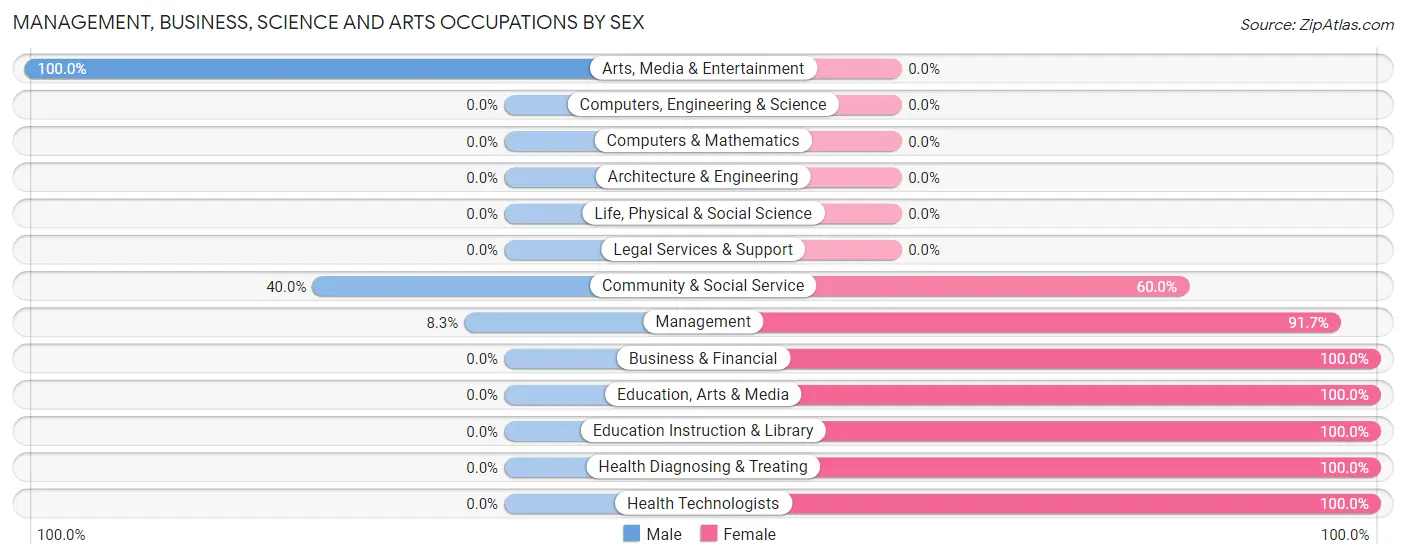
Management, Business, Science and Arts Occupations by Sex
Within the Management, Business, Science and Arts occupations in Paauilo, the most male-oriented occupations are Arts, Media & Entertainment (100.0%), Community & Social Service (40.0%), and Management (8.3%), while the most female-oriented occupations are Business & Financial (100.0%), Education, Arts & Media (100.0%), and Education Instruction & Library (100.0%).
| Occupation | Male | Female |
| Management | 1 (8.3%) | 11 (91.7%) |
| Business & Financial | 0 (0.0%) | 7 (100.0%) |
| Computers, Engineering & Science | 0 (0.0%) | 0 (0.0%) |
| Computers & Mathematics | 0 (0.0%) | 0 (0.0%) |
| Architecture & Engineering | 0 (0.0%) | 0 (0.0%) |
| Life, Physical & Social Science | 0 (0.0%) | 0 (0.0%) |
| Community & Social Service | 6 (40.0%) | 9 (60.0%) |
| Education, Arts & Media | 0 (0.0%) | 5 (100.0%) |
| Legal Services & Support | 0 (0.0%) | 0 (0.0%) |
| Education Instruction & Library | 0 (0.0%) | 4 (100.0%) |
| Arts, Media & Entertainment | 6 (100.0%) | 0 (0.0%) |
| Health Diagnosing & Treating | 0 (0.0%) | 3 (100.0%) |
| Health Technologists | 0 (0.0%) | 3 (100.0%) |
| Total (Category) | 7 (18.9%) | 30 (81.1%) |
| Total (Overall) | 130 (52.8%) | 116 (47.1%) |
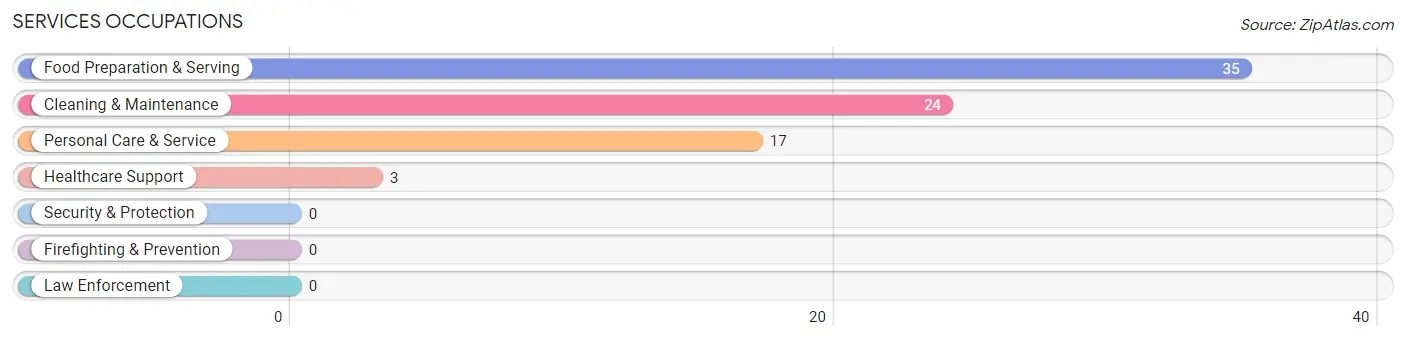
Services Occupations
The most common Services occupations in Paauilo are Food Preparation & Serving (35 | 14.2%), Cleaning & Maintenance (24 | 9.8%), Personal Care & Service (17 | 6.9%), and Healthcare Support (3 | 1.2%).
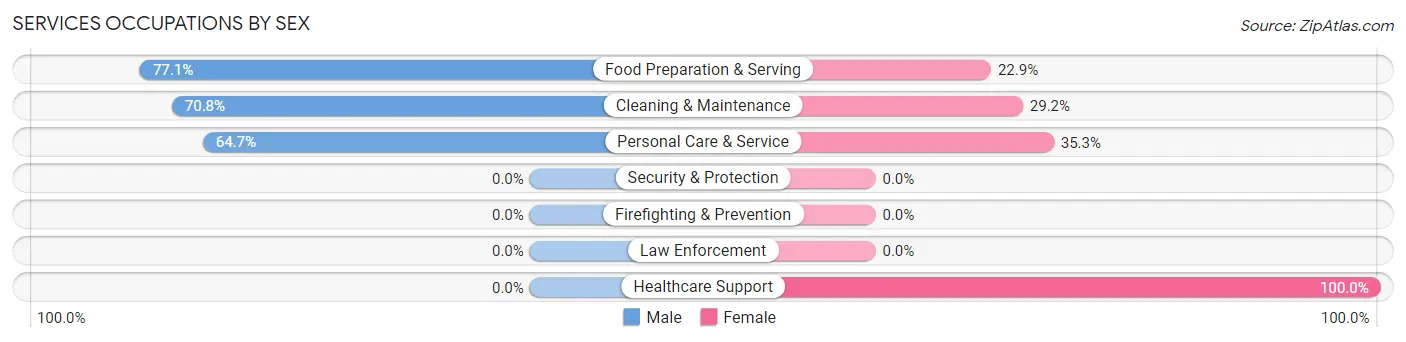
Services Occupations by Sex
Within the Services occupations in Paauilo, the most male-oriented occupations are Food Preparation & Serving (77.1%), Cleaning & Maintenance (70.8%), and Personal Care & Service (64.7%), while the most female-oriented occupations are Healthcare Support (100.0%), Personal Care & Service (35.3%), and Cleaning & Maintenance (29.2%).
| Occupation | Male | Female |
| Healthcare Support | 0 (0.0%) | 3 (100.0%) |
| Security & Protection | 0 (0.0%) | 0 (0.0%) |
| Firefighting & Prevention | 0 (0.0%) | 0 (0.0%) |
| Law Enforcement | 0 (0.0%) | 0 (0.0%) |
| Food Preparation & Serving | 27 (77.1%) | 8 (22.9%) |
| Cleaning & Maintenance | 17 (70.8%) | 7 (29.2%) |
| Personal Care & Service | 11 (64.7%) | 6 (35.3%) |
| Total (Category) | 55 (69.6%) | 24 (30.4%) |
| Total (Overall) | 130 (52.8%) | 116 (47.1%) |
Sales and Office Occupations
The most common Sales and Office occupations in Paauilo are Office & Administration (39 | 15.9%), and Sales & Related (11 | 4.5%).

Sales and Office Occupations by Sex
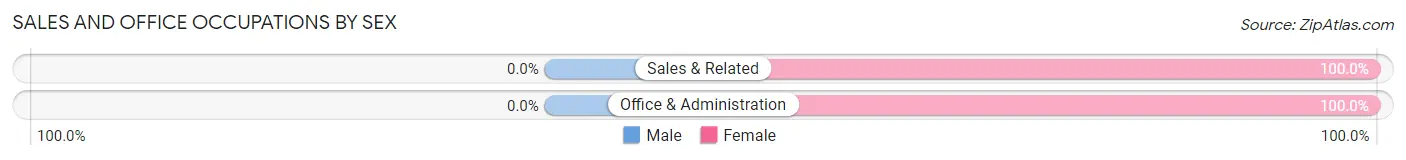
| Occupation | Male | Female |
| Sales & Related | 0 (0.0%) | 11 (100.0%) |
| Office & Administration | 0 (0.0%) | 39 (100.0%) |
| Total (Category) | 0 (0.0%) | 50 (100.0%) |
| Total (Overall) | 130 (52.8%) | 116 (47.1%) |
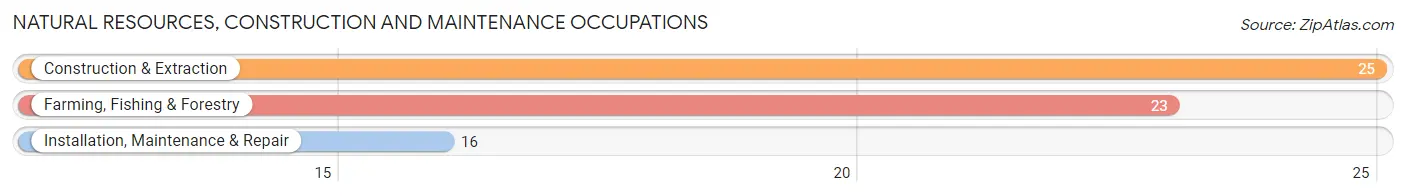
Natural Resources, Construction and Maintenance Occupations
The most common Natural Resources, Construction and Maintenance occupations in Paauilo are Construction & Extraction (25 | 10.2%), Farming, Fishing & Forestry (23 | 9.3%), and Installation, Maintenance & Repair (16 | 6.5%).
Natural Resources, Construction and Maintenance Occupations by Sex
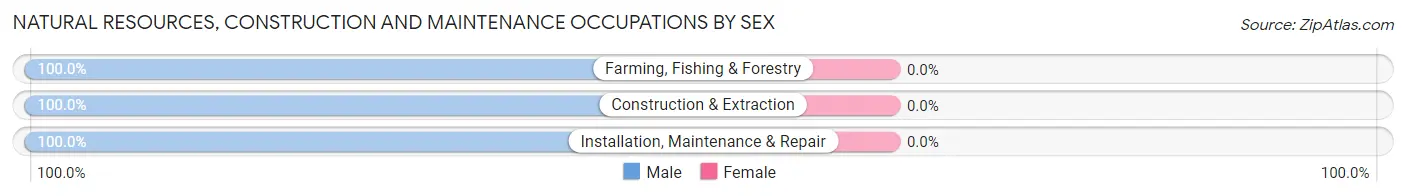
| Occupation | Male | Female |
| Farming, Fishing & Forestry | 23 (100.0%) | 0 (0.0%) |
| Construction & Extraction | 25 (100.0%) | 0 (0.0%) |
| Installation, Maintenance & Repair | 16 (100.0%) | 0 (0.0%) |
| Total (Category) | 64 (100.0%) | 0 (0.0%) |
| Total (Overall) | 130 (52.8%) | 116 (47.1%) |
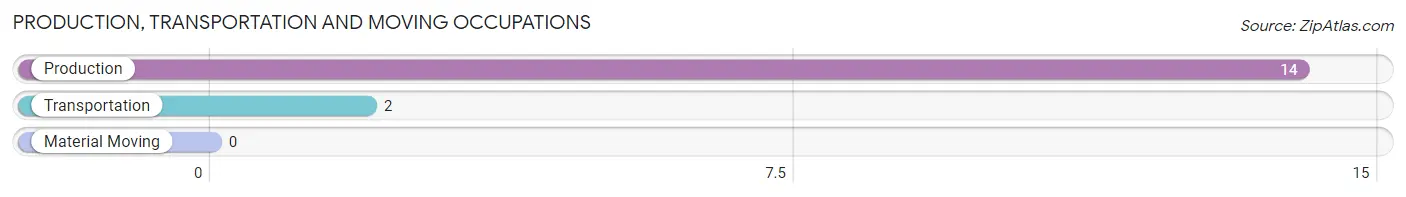
Production, Transportation and Moving Occupations
The most common Production, Transportation and Moving occupations in Paauilo are Production (14 | 5.7%), and Transportation (2 | 0.8%).
Production, Transportation and Moving Occupations by Sex
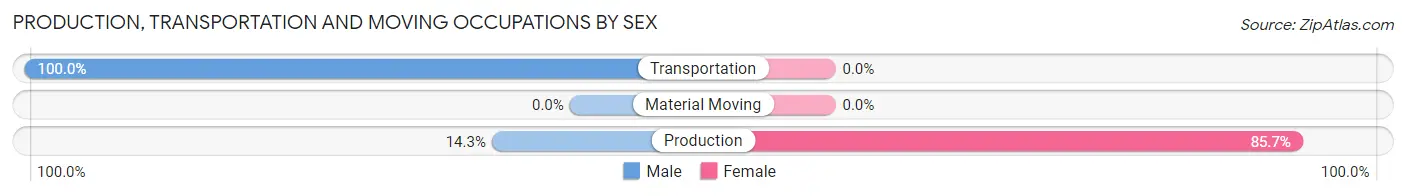
| Occupation | Male | Female |
| Production | 2 (14.3%) | 12 (85.7%) |
| Transportation | 2 (100.0%) | 0 (0.0%) |
| Material Moving | 0 (0.0%) | 0 (0.0%) |
| Total (Category) | 4 (25.0%) | 12 (75.0%) |
| Total (Overall) | 130 (52.8%) | 116 (47.1%) |
Employment Industries by Sex in Paauilo
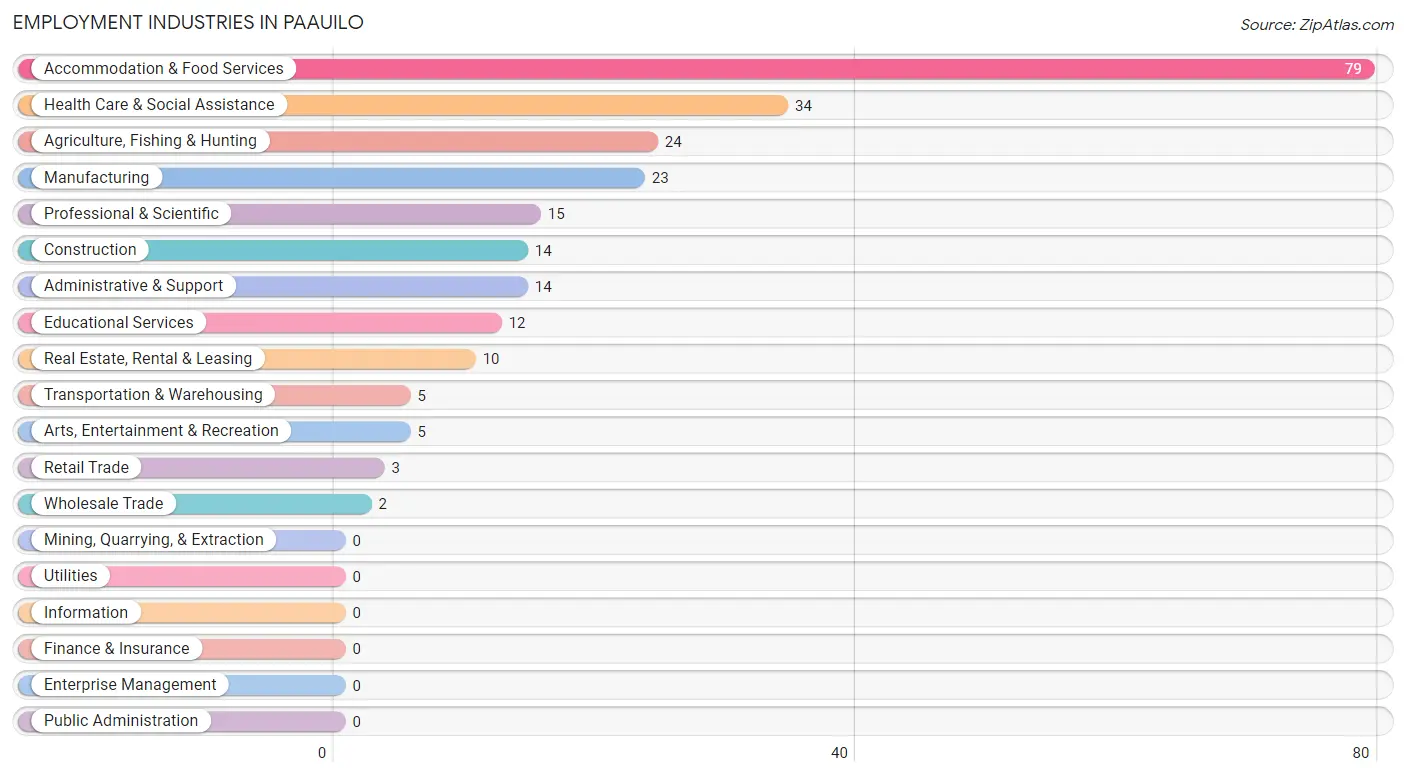
Employment Industries in Paauilo
The major employment industries in Paauilo include Accommodation & Food Services (79 | 32.1%), Health Care & Social Assistance (34 | 13.8%), Agriculture, Fishing & Hunting (24 | 9.8%), Manufacturing (23 | 9.3%), and Professional & Scientific (15 | 6.1%).
Employment Industries by Sex in Paauilo
The Paauilo industries that see more men than women are Agriculture, Fishing & Hunting (100.0%), Construction (100.0%), and Wholesale Trade (100.0%), whereas the industries that tend to have a higher number of women are Professional & Scientific (100.0%), Educational Services (100.0%), and Health Care & Social Assistance (79.4%).
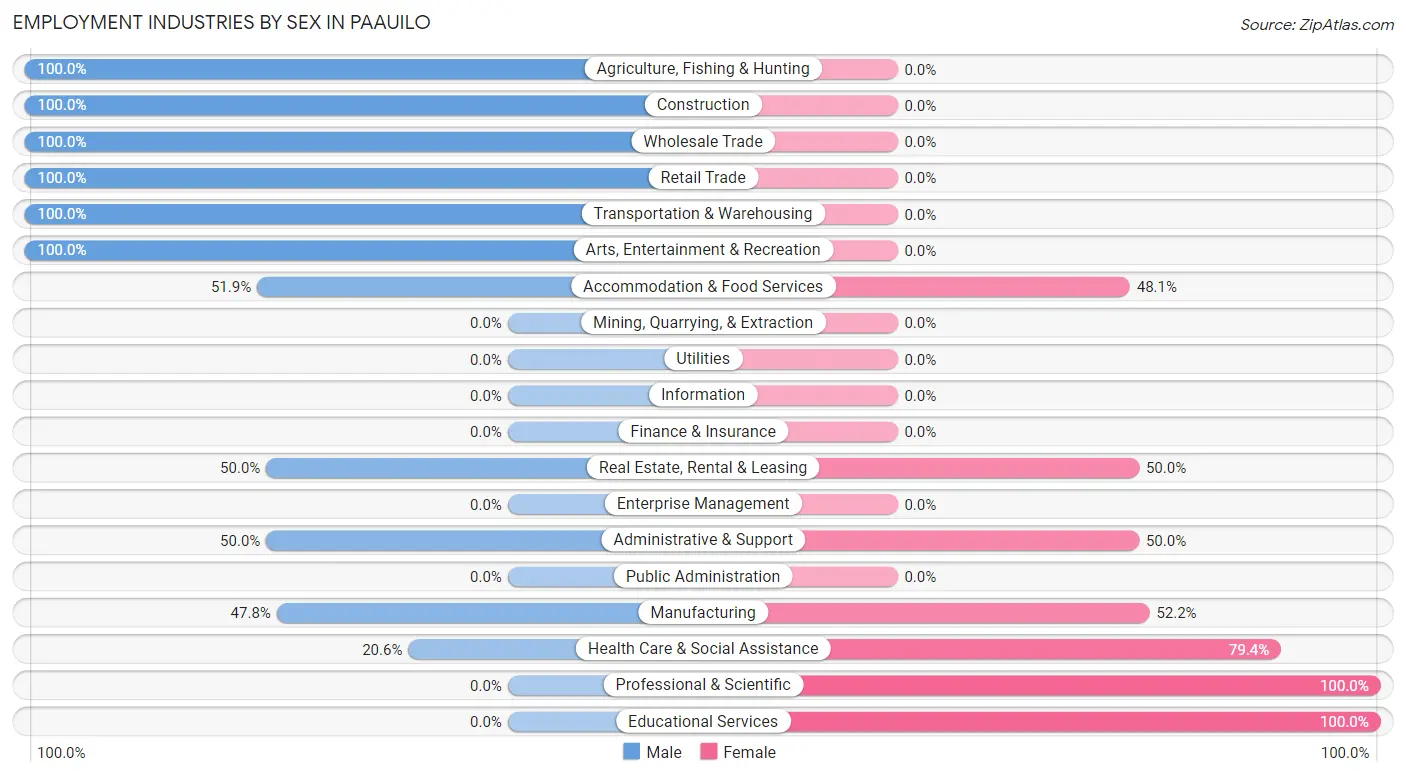
| Industry | Male | Female |
| Agriculture, Fishing & Hunting | 24 (100.0%) | 0 (0.0%) |
| Mining, Quarrying, & Extraction | 0 (0.0%) | 0 (0.0%) |
| Construction | 14 (100.0%) | 0 (0.0%) |
| Manufacturing | 11 (47.8%) | 12 (52.2%) |
| Wholesale Trade | 2 (100.0%) | 0 (0.0%) |
| Retail Trade | 3 (100.0%) | 0 (0.0%) |
| Transportation & Warehousing | 5 (100.0%) | 0 (0.0%) |
| Utilities | 0 (0.0%) | 0 (0.0%) |
| Information | 0 (0.0%) | 0 (0.0%) |
| Finance & Insurance | 0 (0.0%) | 0 (0.0%) |
| Real Estate, Rental & Leasing | 5 (50.0%) | 5 (50.0%) |
| Professional & Scientific | 0 (0.0%) | 15 (100.0%) |
| Enterprise Management | 0 (0.0%) | 0 (0.0%) |
| Administrative & Support | 7 (50.0%) | 7 (50.0%) |
| Educational Services | 0 (0.0%) | 12 (100.0%) |
| Health Care & Social Assistance | 7 (20.6%) | 27 (79.4%) |
| Arts, Entertainment & Recreation | 5 (100.0%) | 0 (0.0%) |
| Accommodation & Food Services | 41 (51.9%) | 38 (48.1%) |
| Public Administration | 0 (0.0%) | 0 (0.0%) |
| Total | 130 (52.8%) | 116 (47.1%) |
Education in Paauilo
School Enrollment in Paauilo
The most common levels of schooling among the 71 students in Paauilo are middle school (18 | 25.4%), kindergarten (15 | 21.1%), and college / undergraduate (15 | 21.1%).
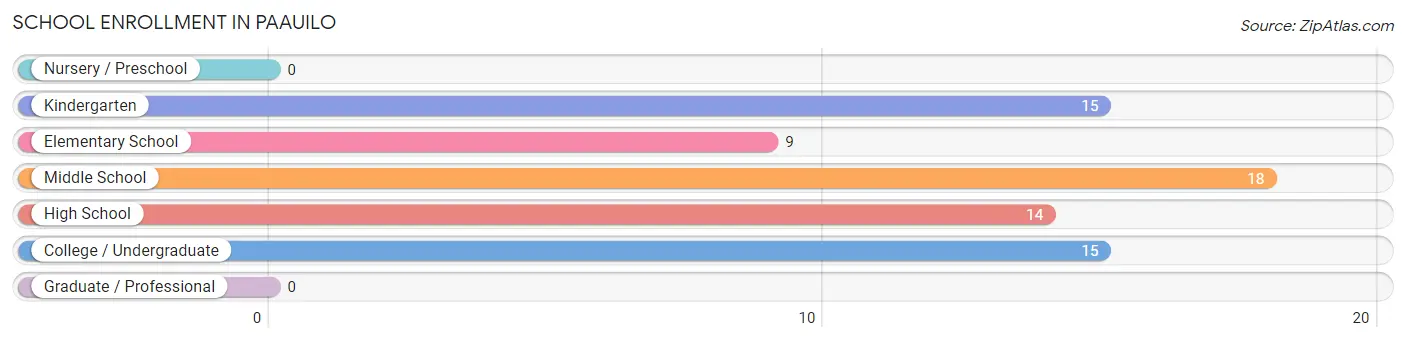
| School Level | # Students | % Students |
| Nursery / Preschool | 0 | 0.0% |
| Kindergarten | 15 | 21.1% |
| Elementary School | 9 | 12.7% |
| Middle School | 18 | 25.4% |
| High School | 14 | 19.7% |
| College / Undergraduate | 15 | 21.1% |
| Graduate / Professional | 0 | 0.0% |
| Total | 71 | 100.0% |
School Enrollment by Age by Funding Source in Paauilo
Out of a total of 71 students who are enrolled in schools in Paauilo, 14 (19.7%) attend a private institution, while the remaining 57 (80.3%) are enrolled in public schools. The age group of 5 to 9 year old has the highest likelihood of being enrolled in private schools, with 11 (45.8% in the age bracket) enrolled. Conversely, the age group of 15 to 17 year olds has the lowest likelihood of being enrolled in a private school, with 12 (100.0% in the age bracket) attending a public institution.
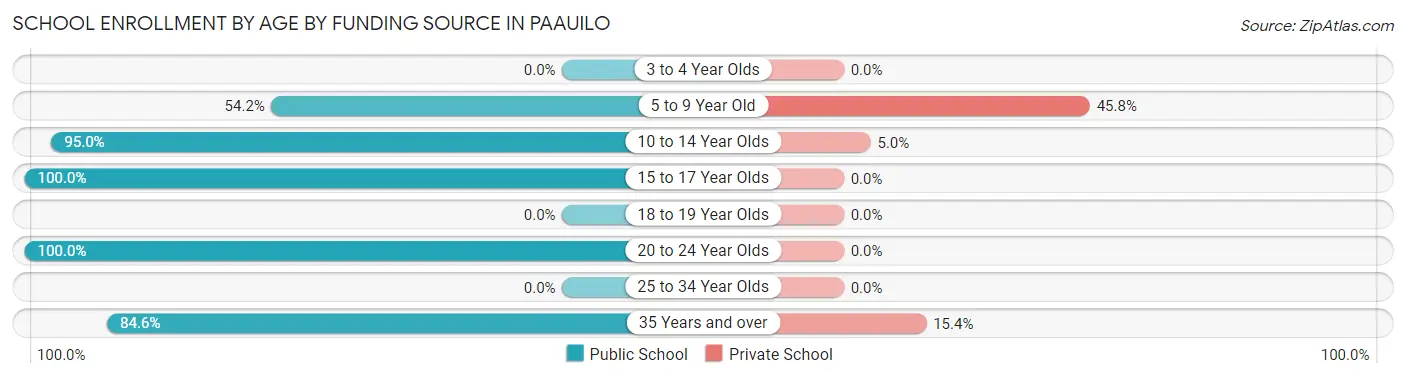
| Age Bracket | Public School | Private School |
| 3 to 4 Year Olds | 0 (0.0%) | 0 (0.0%) |
| 5 to 9 Year Old | 13 (54.2%) | 11 (45.8%) |
| 10 to 14 Year Olds | 19 (95.0%) | 1 (5.0%) |
| 15 to 17 Year Olds | 12 (100.0%) | 0 (0.0%) |
| 18 to 19 Year Olds | 0 (0.0%) | 0 (0.0%) |
| 20 to 24 Year Olds | 2 (100.0%) | 0 (0.0%) |
| 25 to 34 Year Olds | 0 (0.0%) | 0 (0.0%) |
| 35 Years and over | 11 (84.6%) | 2 (15.4%) |
| Total | 57 (80.3%) | 14 (19.7%) |
Educational Attainment by Field of Study in Paauilo
Arts & humanities (7 | 43.8%), education (6 | 37.5%), and science & technology (3 | 18.8%) are the most common fields of study among 16 individuals in Paauilo who have obtained a bachelor's degree or higher.
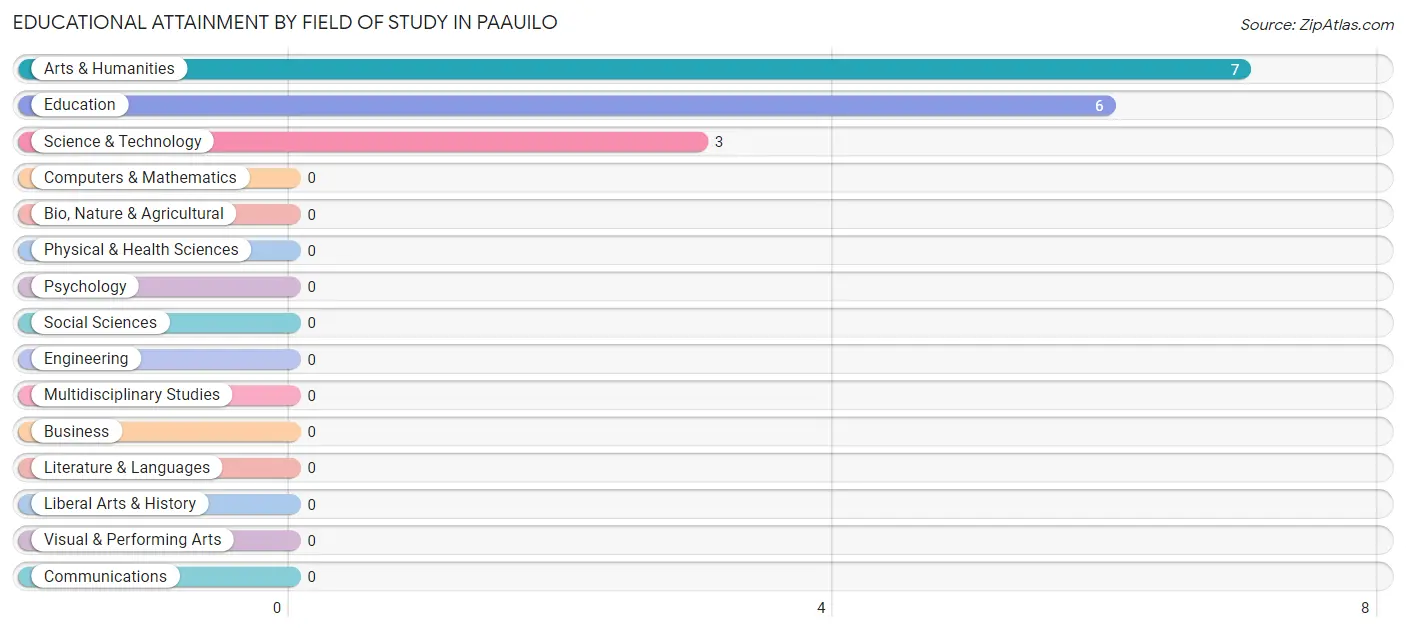
| Field of Study | # Graduates | % Graduates |
| Computers & Mathematics | 0 | 0.0% |
| Bio, Nature & Agricultural | 0 | 0.0% |
| Physical & Health Sciences | 0 | 0.0% |
| Psychology | 0 | 0.0% |
| Social Sciences | 0 | 0.0% |
| Engineering | 0 | 0.0% |
| Multidisciplinary Studies | 0 | 0.0% |
| Science & Technology | 3 | 18.8% |
| Business | 0 | 0.0% |
| Education | 6 | 37.5% |
| Literature & Languages | 0 | 0.0% |
| Liberal Arts & History | 0 | 0.0% |
| Visual & Performing Arts | 0 | 0.0% |
| Communications | 0 | 0.0% |
| Arts & Humanities | 7 | 43.8% |
| Total | 16 | 100.0% |
Transportation & Commute in Paauilo
Vehicle Availability by Sex in Paauilo
The most prevalent vehicle ownership categories in Paauilo are males with 3 vehicles (42, accounting for 37.5%) and females with 3 vehicles (19, making up 39.3%).
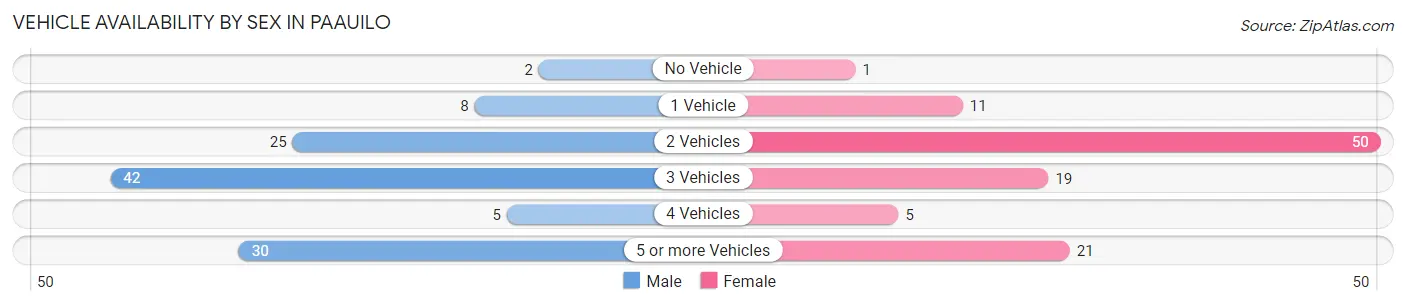
| Vehicles Available | Male | Female |
| No Vehicle | 2 (1.8%) | 1 (0.9%) |
| 1 Vehicle | 8 (7.1%) | 11 (10.3%) |
| 2 Vehicles | 25 (22.3%) | 50 (46.7%) |
| 3 Vehicles | 42 (37.5%) | 19 (17.8%) |
| 4 Vehicles | 5 (4.5%) | 5 (4.7%) |
| 5 or more Vehicles | 30 (26.8%) | 21 (19.6%) |
| Total | 112 (100.0%) | 107 (100.0%) |
Commute Time in Paauilo
The most frequently occuring commute durations in Paauilo are 60 to 89 minutes (51 commuters, 24.4%), 45 to 59 minutes (37 commuters, 17.7%), and 30 to 34 minutes (33 commuters, 15.8%).
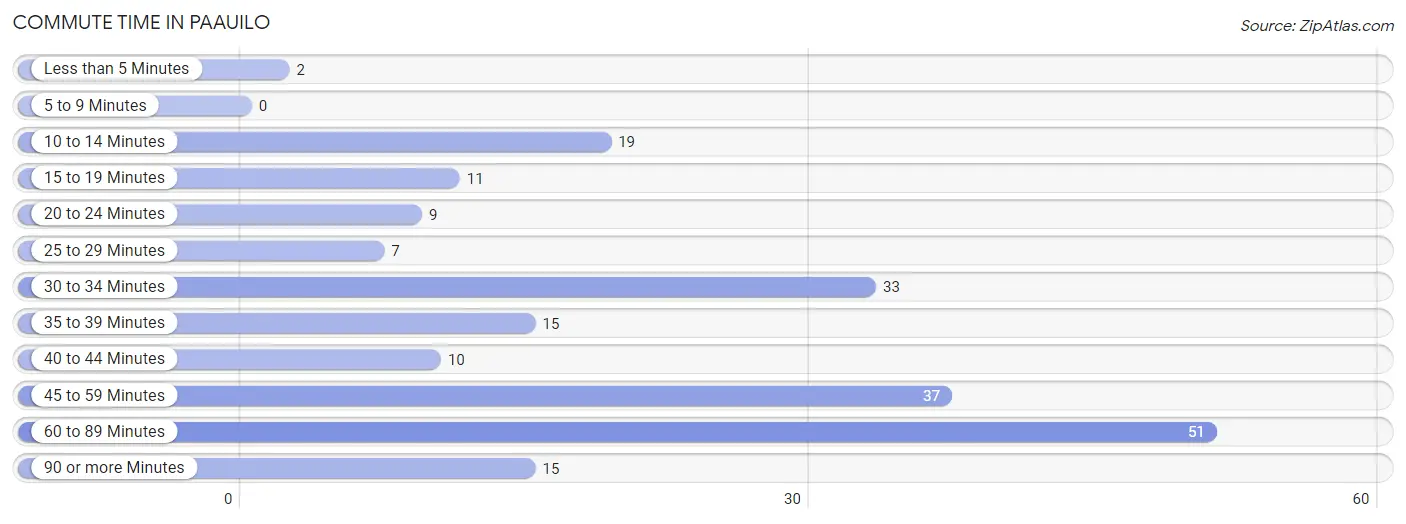
| Commute Time | # Commuters | % Commuters |
| Less than 5 Minutes | 2 | 1.0% |
| 5 to 9 Minutes | 0 | 0.0% |
| 10 to 14 Minutes | 19 | 9.1% |
| 15 to 19 Minutes | 11 | 5.3% |
| 20 to 24 Minutes | 9 | 4.3% |
| 25 to 29 Minutes | 7 | 3.4% |
| 30 to 34 Minutes | 33 | 15.8% |
| 35 to 39 Minutes | 15 | 7.2% |
| 40 to 44 Minutes | 10 | 4.8% |
| 45 to 59 Minutes | 37 | 17.7% |
| 60 to 89 Minutes | 51 | 24.4% |
| 90 or more Minutes | 15 | 7.2% |
Commute Time by Sex in Paauilo
The most common commute times in Paauilo are 60 to 89 minutes (19 commuters, 17.3%) for males and 60 to 89 minutes (32 commuters, 32.3%) for females.
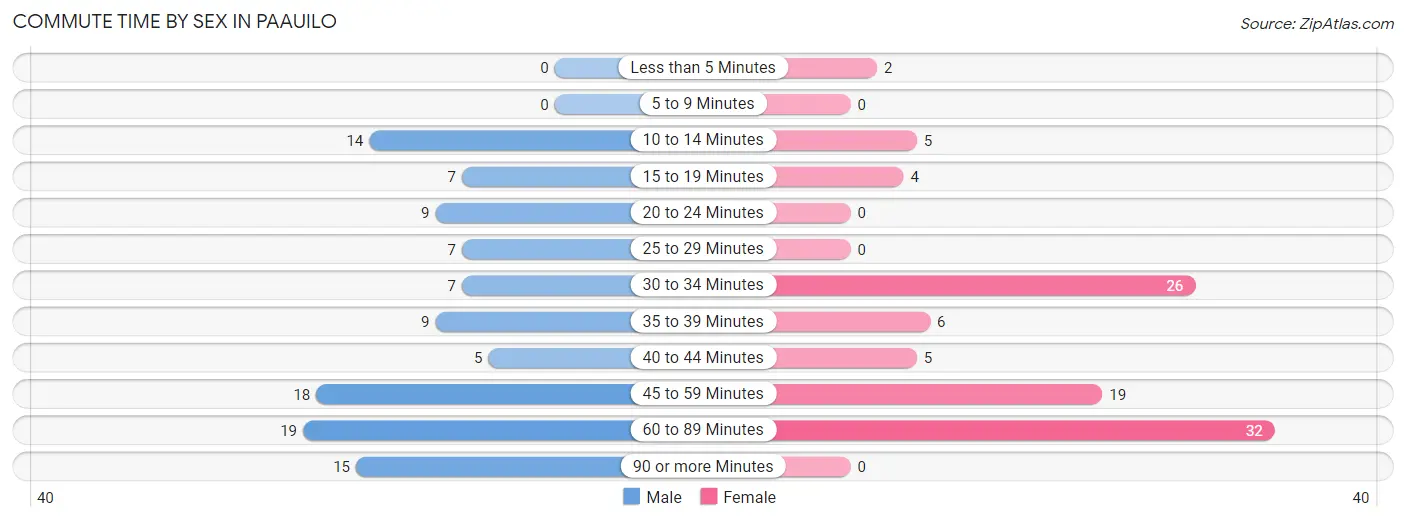
| Commute Time | Male | Female |
| Less than 5 Minutes | 0 (0.0%) | 2 (2.0%) |
| 5 to 9 Minutes | 0 (0.0%) | 0 (0.0%) |
| 10 to 14 Minutes | 14 (12.7%) | 5 (5.1%) |
| 15 to 19 Minutes | 7 (6.4%) | 4 (4.0%) |
| 20 to 24 Minutes | 9 (8.2%) | 0 (0.0%) |
| 25 to 29 Minutes | 7 (6.4%) | 0 (0.0%) |
| 30 to 34 Minutes | 7 (6.4%) | 26 (26.3%) |
| 35 to 39 Minutes | 9 (8.2%) | 6 (6.1%) |
| 40 to 44 Minutes | 5 (4.5%) | 5 (5.1%) |
| 45 to 59 Minutes | 18 (16.4%) | 19 (19.2%) |
| 60 to 89 Minutes | 19 (17.3%) | 32 (32.3%) |
| 90 or more Minutes | 15 (13.6%) | 0 (0.0%) |
Time of Departure to Work by Sex in Paauilo
The most frequent times of departure to work in Paauilo are 7:00 AM to 7:29 AM (28, 25.5%) for males and 6:00 AM to 6:29 AM (28, 28.3%) for females.
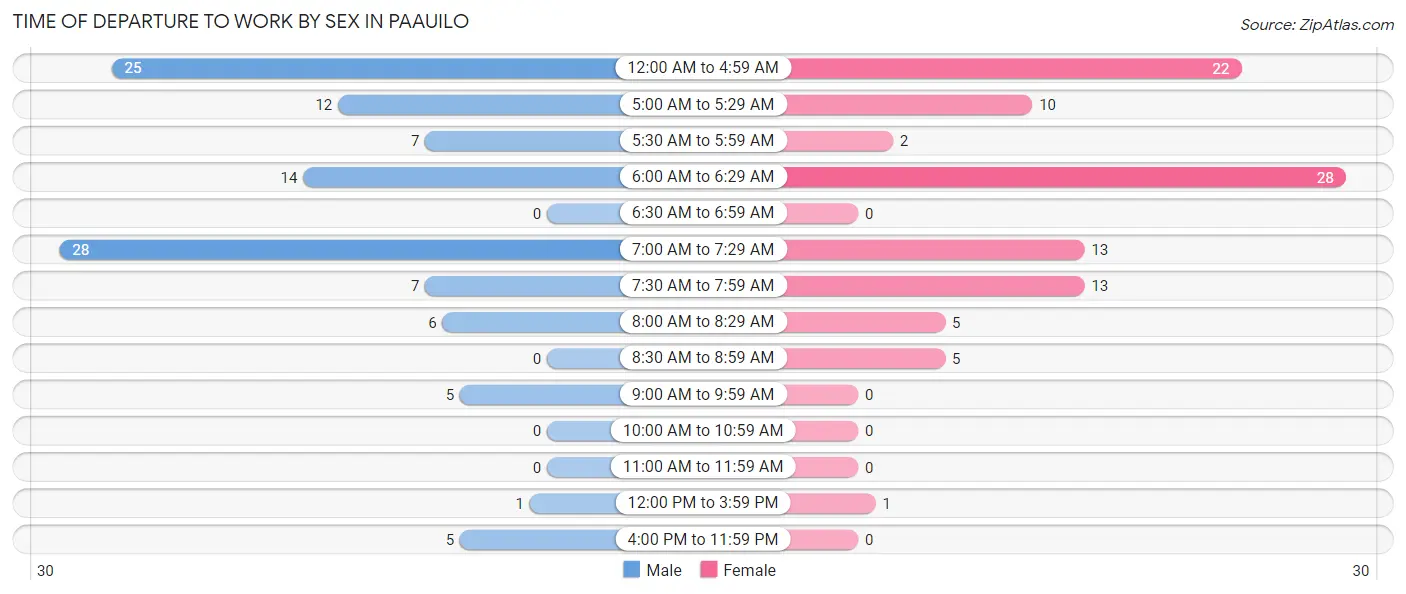
| Time of Departure | Male | Female |
| 12:00 AM to 4:59 AM | 25 (22.7%) | 22 (22.2%) |
| 5:00 AM to 5:29 AM | 12 (10.9%) | 10 (10.1%) |
| 5:30 AM to 5:59 AM | 7 (6.4%) | 2 (2.0%) |
| 6:00 AM to 6:29 AM | 14 (12.7%) | 28 (28.3%) |
| 6:30 AM to 6:59 AM | 0 (0.0%) | 0 (0.0%) |
| 7:00 AM to 7:29 AM | 28 (25.5%) | 13 (13.1%) |
| 7:30 AM to 7:59 AM | 7 (6.4%) | 13 (13.1%) |
| 8:00 AM to 8:29 AM | 6 (5.4%) | 5 (5.1%) |
| 8:30 AM to 8:59 AM | 0 (0.0%) | 5 (5.1%) |
| 9:00 AM to 9:59 AM | 5 (4.5%) | 0 (0.0%) |
| 10:00 AM to 10:59 AM | 0 (0.0%) | 0 (0.0%) |
| 11:00 AM to 11:59 AM | 0 (0.0%) | 0 (0.0%) |
| 12:00 PM to 3:59 PM | 1 (0.9%) | 1 (1.0%) |
| 4:00 PM to 11:59 PM | 5 (4.5%) | 0 (0.0%) |
| Total | 110 (100.0%) | 99 (100.0%) |
Housing Occupancy in Paauilo
Occupancy by Ownership in Paauilo
Of the total 210 dwellings in Paauilo, owner-occupied units account for 166 (79.0%), while renter-occupied units make up 44 (20.9%).
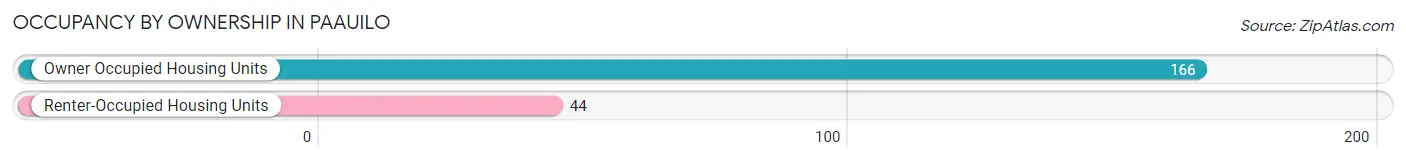
| Occupancy | # Housing Units | % Housing Units |
| Owner Occupied Housing Units | 166 | 79.0% |
| Renter-Occupied Housing Units | 44 | 20.9% |
| Total Occupied Housing Units | 210 | 100.0% |
Occupancy by Household Size in Paauilo
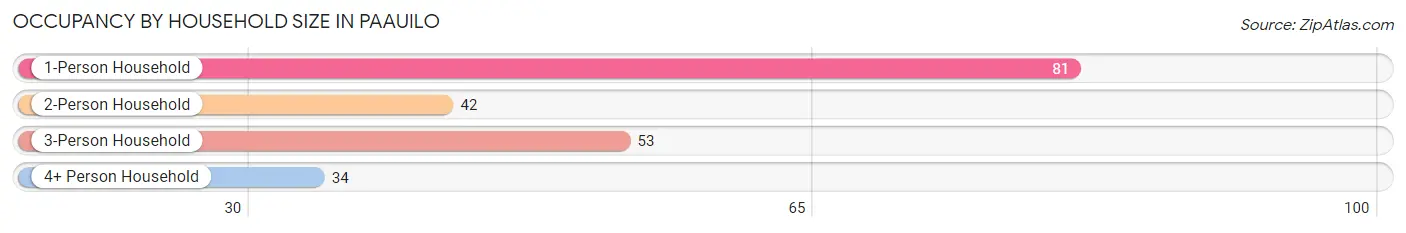
| Household Size | # Housing Units | % Housing Units |
| 1-Person Household | 81 | 38.6% |
| 2-Person Household | 42 | 20.0% |
| 3-Person Household | 53 | 25.2% |
| 4+ Person Household | 34 | 16.2% |
| Total Housing Units | 210 | 100.0% |
Occupancy by Ownership by Household Size in Paauilo
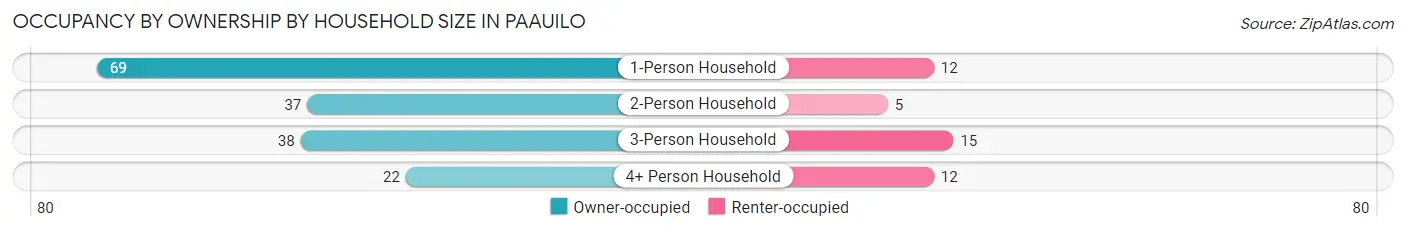
| Household Size | Owner-occupied | Renter-occupied |
| 1-Person Household | 69 (85.2%) | 12 (14.8%) |
| 2-Person Household | 37 (88.1%) | 5 (11.9%) |
| 3-Person Household | 38 (71.7%) | 15 (28.3%) |
| 4+ Person Household | 22 (64.7%) | 12 (35.3%) |
| Total Housing Units | 166 (79.0%) | 44 (20.9%) |
Occupancy by Educational Attainment in Paauilo
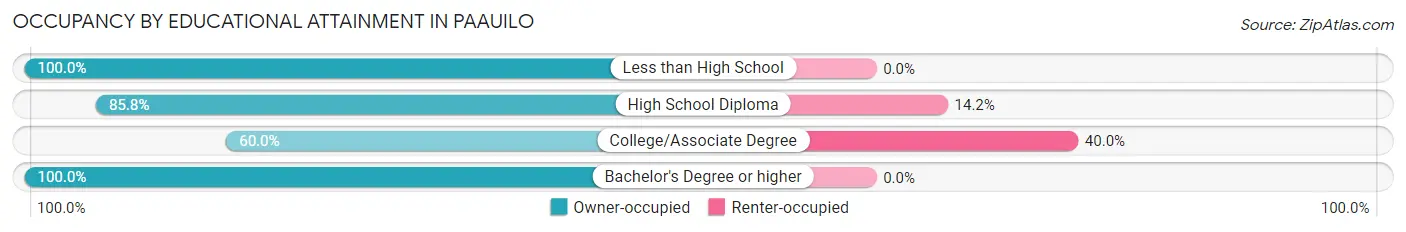
| Household Size | Owner-occupied | Renter-occupied |
| Less than High School | 20 (100.0%) | 0 (0.0%) |
| High School Diploma | 97 (85.8%) | 16 (14.2%) |
| College/Associate Degree | 42 (60.0%) | 28 (40.0%) |
| Bachelor's Degree or higher | 7 (100.0%) | 0 (0.0%) |
Occupancy by Age of Householder in Paauilo
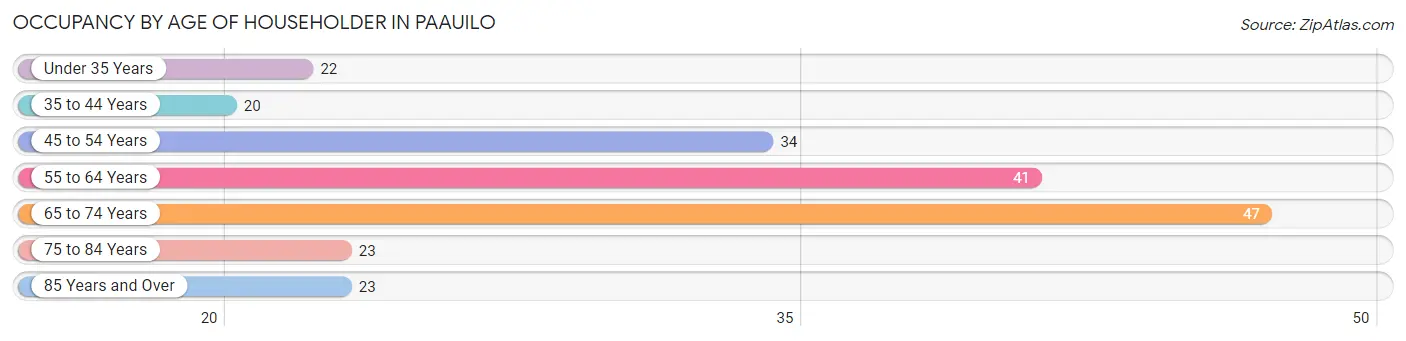
| Age Bracket | # Households | % Households |
| Under 35 Years | 22 | 10.5% |
| 35 to 44 Years | 20 | 9.5% |
| 45 to 54 Years | 34 | 16.2% |
| 55 to 64 Years | 41 | 19.5% |
| 65 to 74 Years | 47 | 22.4% |
| 75 to 84 Years | 23 | 11.0% |
| 85 Years and Over | 23 | 11.0% |
| Total | 210 | 100.0% |
Housing Finances in Paauilo
Median Income by Occupancy in Paauilo
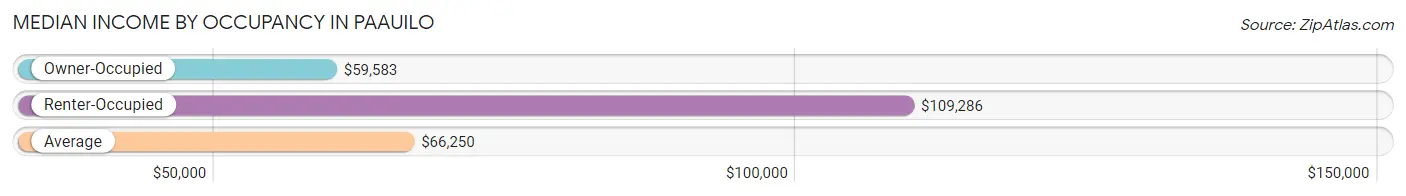
| Occupancy Type | # Households | Median Income |
| Owner-Occupied | 166 (79.0%) | $59,583 |
| Renter-Occupied | 44 (20.9%) | $109,286 |
| Average | 210 (100.0%) | $66,250 |
Occupancy by Householder Income Bracket in Paauilo
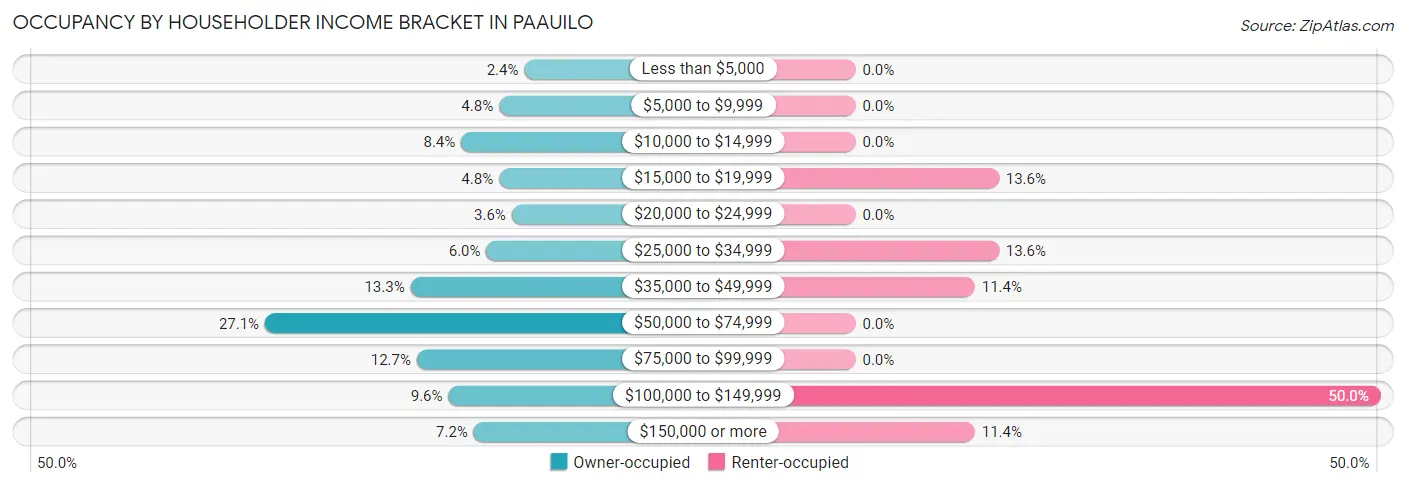
| Income Bracket | Owner-occupied | Renter-occupied |
| Less than $5,000 | 4 (2.4%) | 0 (0.0%) |
| $5,000 to $9,999 | 8 (4.8%) | 0 (0.0%) |
| $10,000 to $14,999 | 14 (8.4%) | 0 (0.0%) |
| $15,000 to $19,999 | 8 (4.8%) | 6 (13.6%) |
| $20,000 to $24,999 | 6 (3.6%) | 0 (0.0%) |
| $25,000 to $34,999 | 10 (6.0%) | 6 (13.6%) |
| $35,000 to $49,999 | 22 (13.3%) | 5 (11.4%) |
| $50,000 to $74,999 | 45 (27.1%) | 0 (0.0%) |
| $75,000 to $99,999 | 21 (12.7%) | 0 (0.0%) |
| $100,000 to $149,999 | 16 (9.6%) | 22 (50.0%) |
| $150,000 or more | 12 (7.2%) | 5 (11.4%) |
| Total | 166 (100.0%) | 44 (100.0%) |
Monthly Housing Cost Tiers in Paauilo
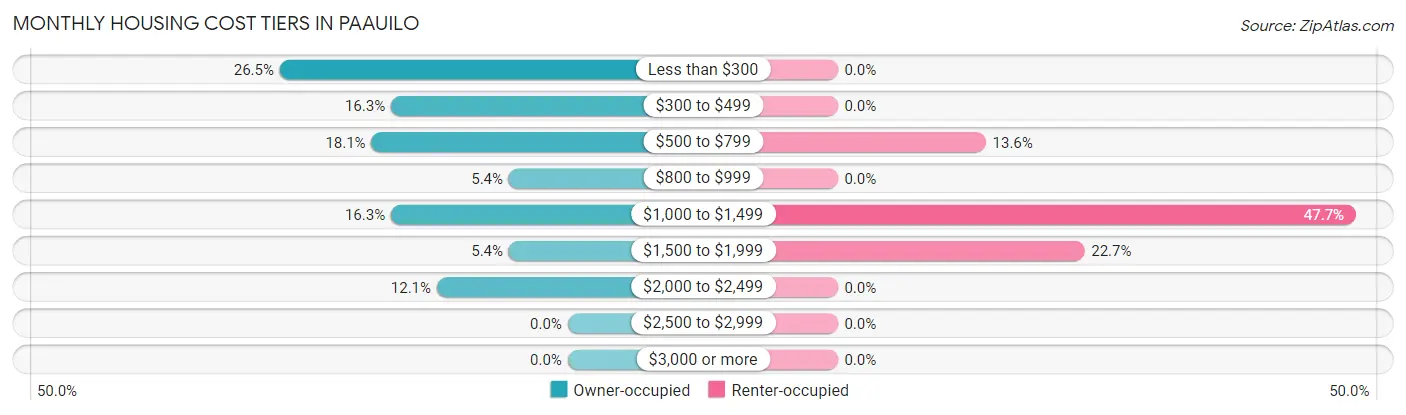
| Monthly Cost | Owner-occupied | Renter-occupied |
| Less than $300 | 44 (26.5%) | 0 (0.0%) |
| $300 to $499 | 27 (16.3%) | 0 (0.0%) |
| $500 to $799 | 30 (18.1%) | 6 (13.6%) |
| $800 to $999 | 9 (5.4%) | 0 (0.0%) |
| $1,000 to $1,499 | 27 (16.3%) | 21 (47.7%) |
| $1,500 to $1,999 | 9 (5.4%) | 10 (22.7%) |
| $2,000 to $2,499 | 20 (12.0%) | 0 (0.0%) |
| $2,500 to $2,999 | 0 (0.0%) | 0 (0.0%) |
| $3,000 or more | 0 (0.0%) | 0 (0.0%) |
| Total | 166 (100.0%) | 44 (100.0%) |
Physical Housing Characteristics in Paauilo
Housing Structures in Paauilo
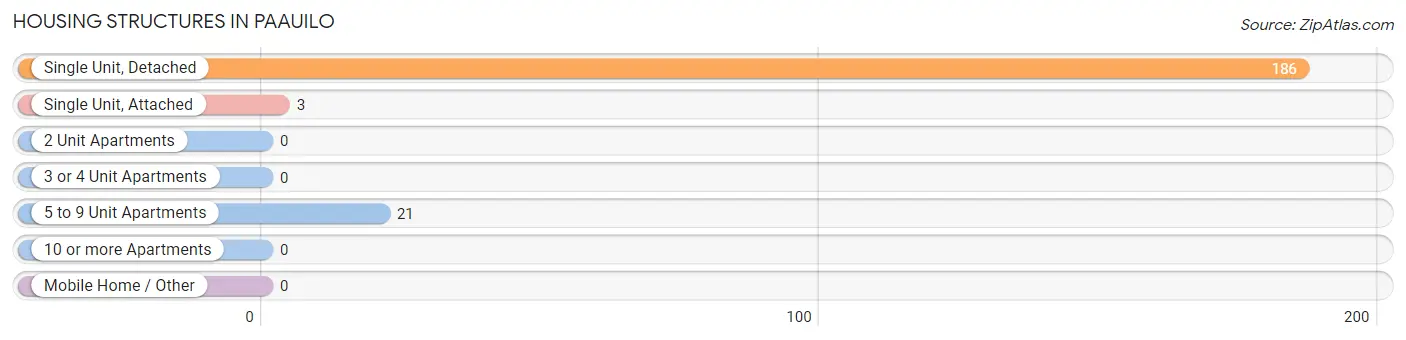
| Structure Type | # Housing Units | % Housing Units |
| Single Unit, Detached | 186 | 88.6% |
| Single Unit, Attached | 3 | 1.4% |
| 2 Unit Apartments | 0 | 0.0% |
| 3 or 4 Unit Apartments | 0 | 0.0% |
| 5 to 9 Unit Apartments | 21 | 10.0% |
| 10 or more Apartments | 0 | 0.0% |
| Mobile Home / Other | 0 | 0.0% |
| Total | 210 | 100.0% |
Housing Structures by Occupancy in Paauilo
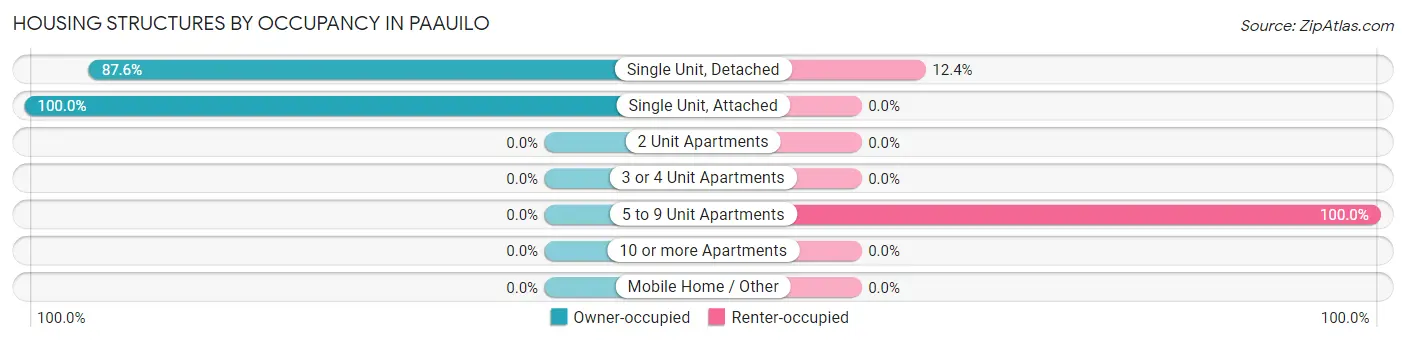
| Structure Type | Owner-occupied | Renter-occupied |
| Single Unit, Detached | 163 (87.6%) | 23 (12.4%) |
| Single Unit, Attached | 3 (100.0%) | 0 (0.0%) |
| 2 Unit Apartments | 0 (0.0%) | 0 (0.0%) |
| 3 or 4 Unit Apartments | 0 (0.0%) | 0 (0.0%) |
| 5 to 9 Unit Apartments | 0 (0.0%) | 21 (100.0%) |
| 10 or more Apartments | 0 (0.0%) | 0 (0.0%) |
| Mobile Home / Other | 0 (0.0%) | 0 (0.0%) |
| Total | 166 (79.0%) | 44 (20.9%) |
Housing Structures by Number of Rooms in Paauilo
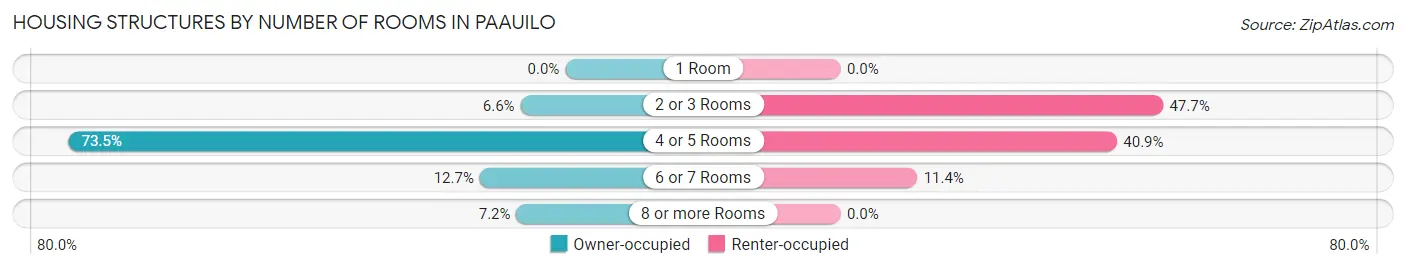
| Number of Rooms | Owner-occupied | Renter-occupied |
| 1 Room | 0 (0.0%) | 0 (0.0%) |
| 2 or 3 Rooms | 11 (6.6%) | 21 (47.7%) |
| 4 or 5 Rooms | 122 (73.5%) | 18 (40.9%) |
| 6 or 7 Rooms | 21 (12.7%) | 5 (11.4%) |
| 8 or more Rooms | 12 (7.2%) | 0 (0.0%) |
| Total | 166 (100.0%) | 44 (100.0%) |
Housing Structure by Heating Type in Paauilo
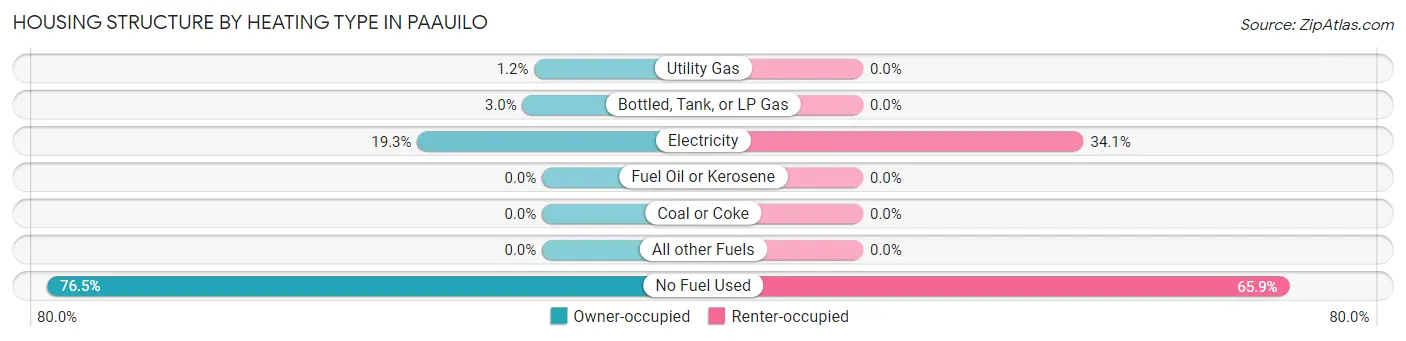
| Heating Type | Owner-occupied | Renter-occupied |
| Utility Gas | 2 (1.2%) | 0 (0.0%) |
| Bottled, Tank, or LP Gas | 5 (3.0%) | 0 (0.0%) |
| Electricity | 32 (19.3%) | 15 (34.1%) |
| Fuel Oil or Kerosene | 0 (0.0%) | 0 (0.0%) |
| Coal or Coke | 0 (0.0%) | 0 (0.0%) |
| All other Fuels | 0 (0.0%) | 0 (0.0%) |
| No Fuel Used | 127 (76.5%) | 29 (65.9%) |
| Total | 166 (100.0%) | 44 (100.0%) |
Household Vehicle Usage in Paauilo
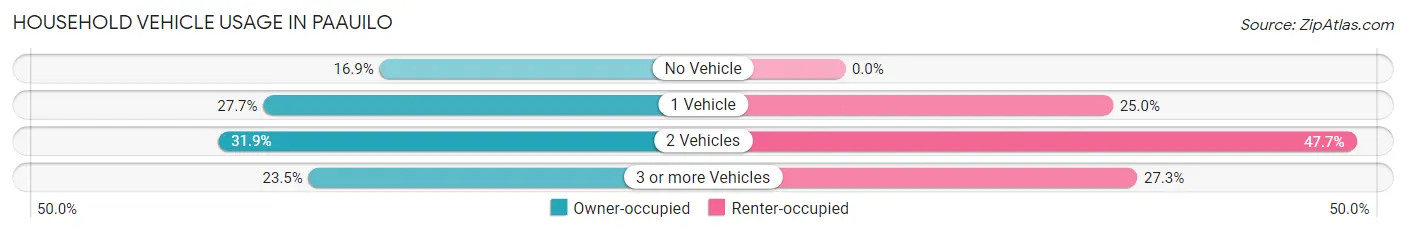
| Vehicles per Household | Owner-occupied | Renter-occupied |
| No Vehicle | 28 (16.9%) | 0 (0.0%) |
| 1 Vehicle | 46 (27.7%) | 11 (25.0%) |
| 2 Vehicles | 53 (31.9%) | 21 (47.7%) |
| 3 or more Vehicles | 39 (23.5%) | 12 (27.3%) |
| Total | 166 (100.0%) | 44 (100.0%) |
Real Estate & Mortgages in Paauilo
Real Estate and Mortgage Overview in Paauilo
| Characteristic | Without Mortgage | With Mortgage |
| Housing Units | 95 | 71 |
| Median Property Value | $341,000 | $359,500 |
| Median Household Income | $41,583 | $6 |
| Monthly Housing Costs | $354 | $0 |
| Real Estate Taxes | $392 | $2 |
Property Value by Mortgage Status in Paauilo
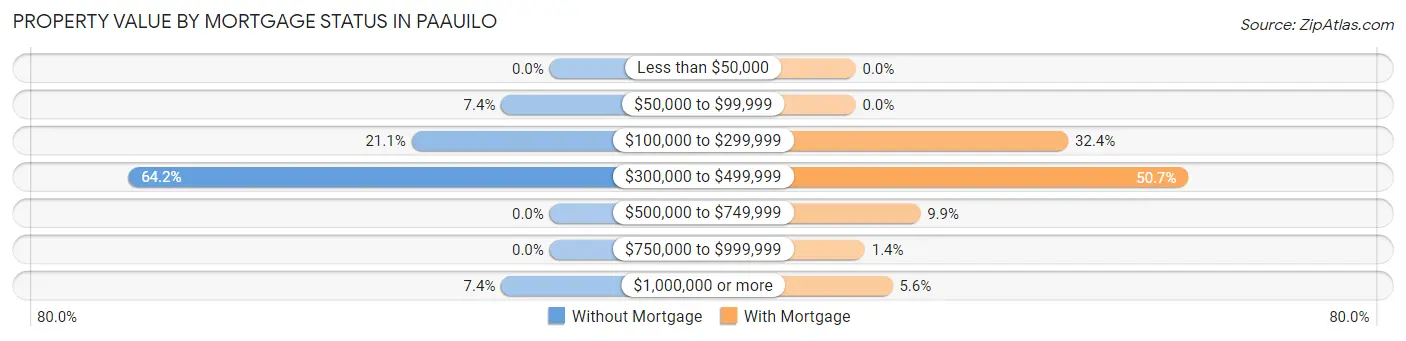
| Property Value | Without Mortgage | With Mortgage |
| Less than $50,000 | 0 (0.0%) | 0 (0.0%) |
| $50,000 to $99,999 | 7 (7.4%) | 0 (0.0%) |
| $100,000 to $299,999 | 20 (21.0%) | 23 (32.4%) |
| $300,000 to $499,999 | 61 (64.2%) | 36 (50.7%) |
| $500,000 to $749,999 | 0 (0.0%) | 7 (9.9%) |
| $750,000 to $999,999 | 0 (0.0%) | 1 (1.4%) |
| $1,000,000 or more | 7 (7.4%) | 4 (5.6%) |
| Total | 95 (100.0%) | 71 (100.0%) |
Household Income by Mortgage Status in Paauilo
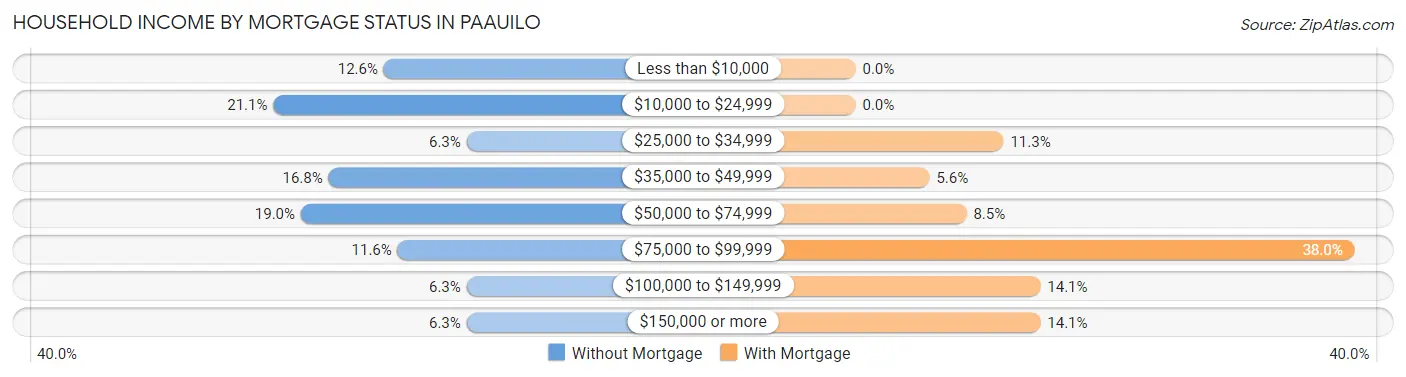
| Household Income | Without Mortgage | With Mortgage |
| Less than $10,000 | 12 (12.6%) | 0 (0.0%) |
| $10,000 to $24,999 | 20 (21.0%) | 0 (0.0%) |
| $25,000 to $34,999 | 6 (6.3%) | 8 (11.3%) |
| $35,000 to $49,999 | 16 (16.8%) | 4 (5.6%) |
| $50,000 to $74,999 | 18 (19.0%) | 6 (8.5%) |
| $75,000 to $99,999 | 11 (11.6%) | 27 (38.0%) |
| $100,000 to $149,999 | 6 (6.3%) | 10 (14.1%) |
| $150,000 or more | 6 (6.3%) | 10 (14.1%) |
| Total | 95 (100.0%) | 71 (100.0%) |
Property Value to Household Income Ratio in Paauilo
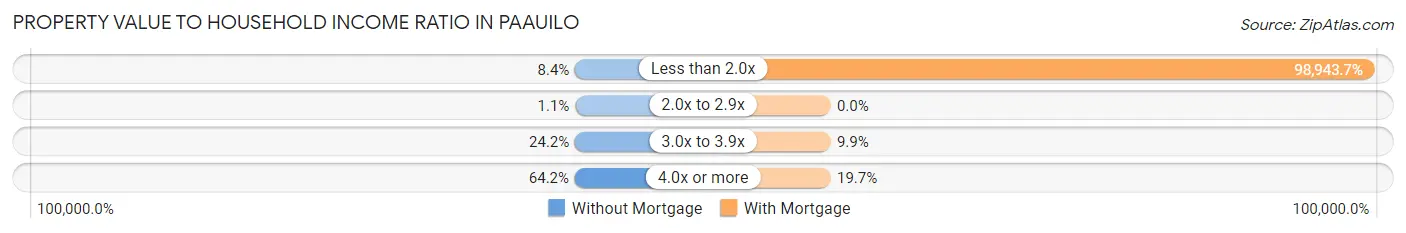
| Value-to-Income Ratio | Without Mortgage | With Mortgage |
| Less than 2.0x | 8 (8.4%) | 70,250 (98,943.7%) |
| 2.0x to 2.9x | 1 (1.1%) | 0 (0.0%) |
| 3.0x to 3.9x | 23 (24.2%) | 7 (9.9%) |
| 4.0x or more | 61 (64.2%) | 14 (19.7%) |
| Total | 95 (100.0%) | 71 (100.0%) |
Real Estate Taxes by Mortgage Status in Paauilo
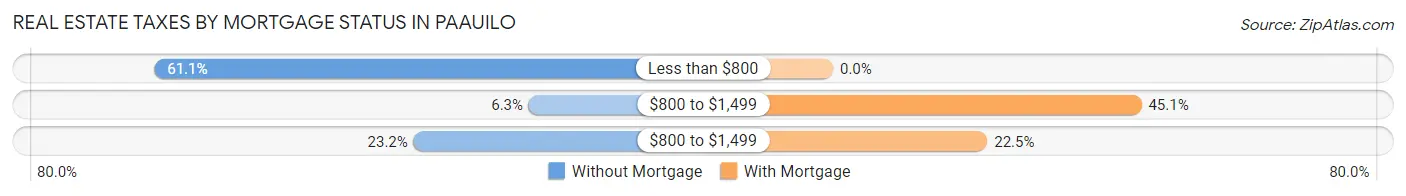
| Property Taxes | Without Mortgage | With Mortgage |
| Less than $800 | 58 (61.1%) | 0 (0.0%) |
| $800 to $1,499 | 6 (6.3%) | 32 (45.1%) |
| $800 to $1,499 | 22 (23.2%) | 16 (22.5%) |
| Total | 95 (100.0%) | 71 (100.0%) |
Health & Disability in Paauilo
Health Insurance Coverage by Age in Paauilo
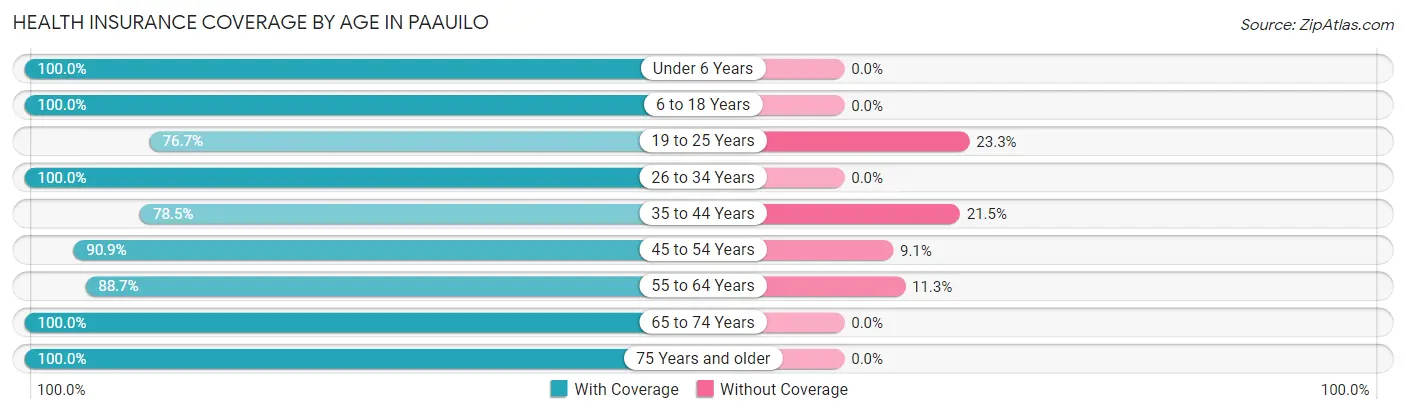
| Age Bracket | With Coverage | Without Coverage |
| Under 6 Years | 38 (100.0%) | 0 (0.0%) |
| 6 to 18 Years | 56 (100.0%) | 0 (0.0%) |
| 19 to 25 Years | 23 (76.7%) | 7 (23.3%) |
| 26 to 34 Years | 47 (100.0%) | 0 (0.0%) |
| 35 to 44 Years | 51 (78.5%) | 14 (21.5%) |
| 45 to 54 Years | 70 (90.9%) | 7 (9.1%) |
| 55 to 64 Years | 94 (88.7%) | 12 (11.3%) |
| 65 to 74 Years | 80 (100.0%) | 0 (0.0%) |
| 75 Years and older | 49 (100.0%) | 0 (0.0%) |
| Total | 508 (92.7%) | 40 (7.3%) |
Health Insurance Coverage by Citizenship Status in Paauilo
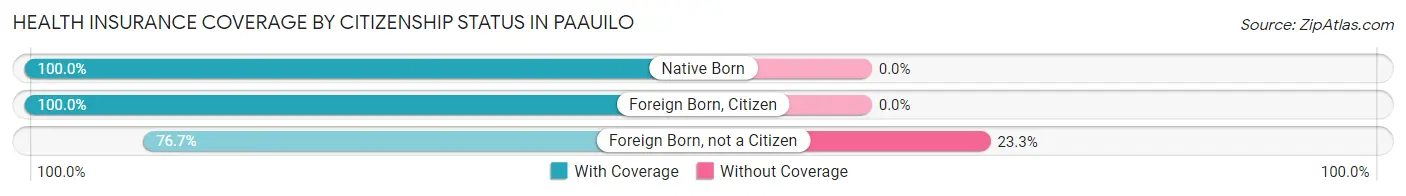
| Citizenship Status | With Coverage | Without Coverage |
| Native Born | 38 (100.0%) | 0 (0.0%) |
| Foreign Born, Citizen | 56 (100.0%) | 0 (0.0%) |
| Foreign Born, not a Citizen | 23 (76.7%) | 7 (23.3%) |
Health Insurance Coverage by Household Income in Paauilo
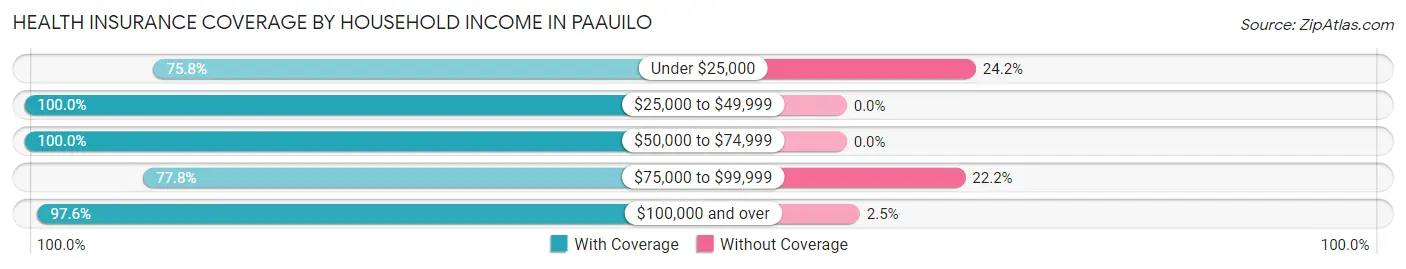
| Household Income | With Coverage | Without Coverage |
| Under $25,000 | 47 (75.8%) | 15 (24.2%) |
| $25,000 to $49,999 | 60 (100.0%) | 0 (0.0%) |
| $50,000 to $74,999 | 132 (100.0%) | 0 (0.0%) |
| $75,000 to $99,999 | 70 (77.8%) | 20 (22.2%) |
| $100,000 and over | 199 (97.6%) | 5 (2.5%) |
Public vs Private Health Insurance Coverage by Age in Paauilo
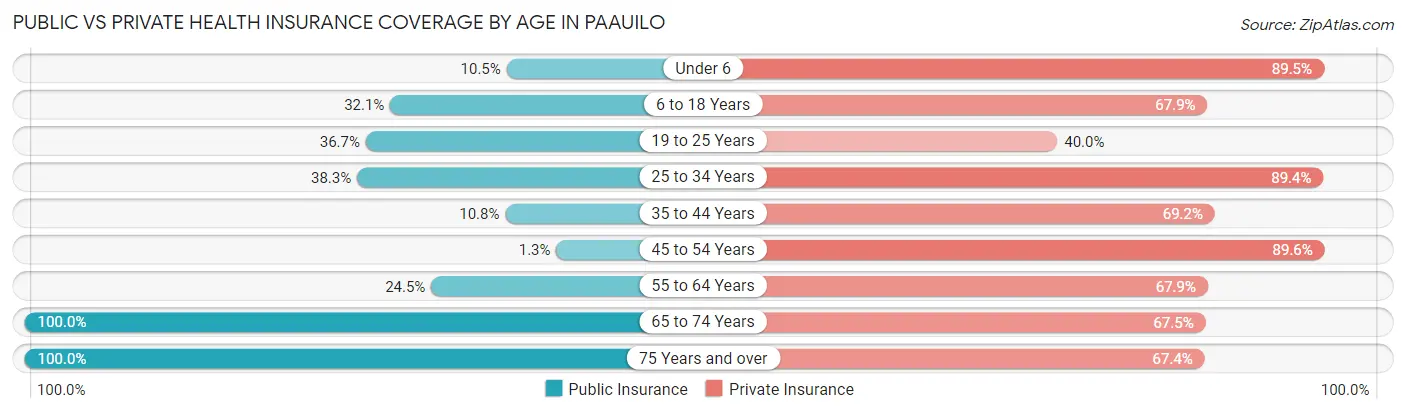
| Age Bracket | Public Insurance | Private Insurance |
| Under 6 | 4 (10.5%) | 34 (89.5%) |
| 6 to 18 Years | 18 (32.1%) | 38 (67.9%) |
| 19 to 25 Years | 11 (36.7%) | 12 (40.0%) |
| 25 to 34 Years | 18 (38.3%) | 42 (89.4%) |
| 35 to 44 Years | 7 (10.8%) | 45 (69.2%) |
| 45 to 54 Years | 1 (1.3%) | 69 (89.6%) |
| 55 to 64 Years | 26 (24.5%) | 72 (67.9%) |
| 65 to 74 Years | 80 (100.0%) | 54 (67.5%) |
| 75 Years and over | 49 (100.0%) | 33 (67.3%) |
| Total | 214 (39.1%) | 399 (72.8%) |
Disability Status by Sex by Age in Paauilo
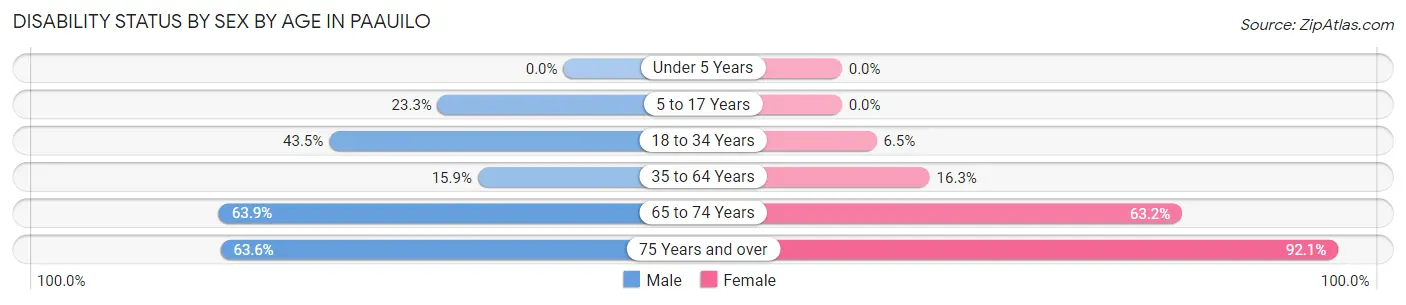
| Age Bracket | Male | Female |
| Under 5 Years | 0 (0.0%) | 0 (0.0%) |
| 5 to 17 Years | 7 (23.3%) | 0 (0.0%) |
| 18 to 34 Years | 20 (43.5%) | 2 (6.5%) |
| 35 to 64 Years | 17 (15.9%) | 23 (16.3%) |
| 65 to 74 Years | 39 (63.9%) | 12 (63.2%) |
| 75 Years and over | 7 (63.6%) | 35 (92.1%) |
Disability Class by Sex by Age in Paauilo
Disability Class: Hearing Difficulty
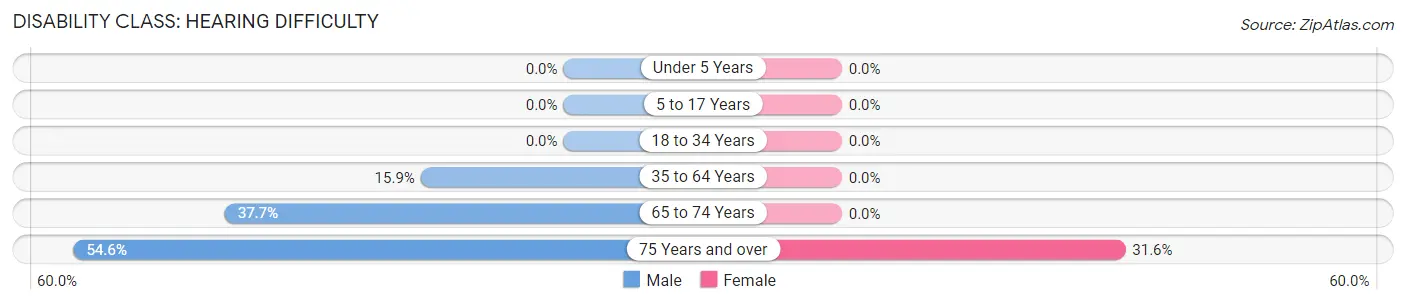
| Age Bracket | Male | Female |
| Under 5 Years | 0 (0.0%) | 0 (0.0%) |
| 5 to 17 Years | 0 (0.0%) | 0 (0.0%) |
| 18 to 34 Years | 0 (0.0%) | 0 (0.0%) |
| 35 to 64 Years | 17 (15.9%) | 0 (0.0%) |
| 65 to 74 Years | 23 (37.7%) | 0 (0.0%) |
| 75 Years and over | 6 (54.5%) | 12 (31.6%) |
Disability Class: Vision Difficulty
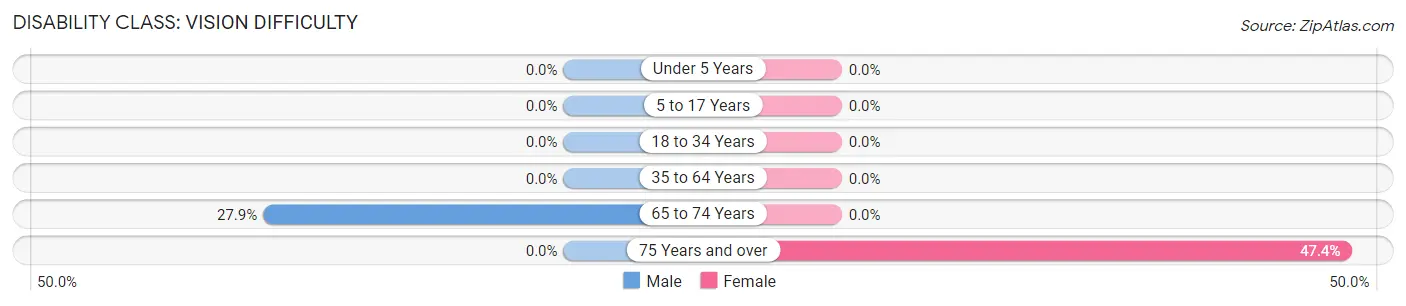
| Age Bracket | Male | Female |
| Under 5 Years | 0 (0.0%) | 0 (0.0%) |
| 5 to 17 Years | 0 (0.0%) | 0 (0.0%) |
| 18 to 34 Years | 0 (0.0%) | 0 (0.0%) |
| 35 to 64 Years | 0 (0.0%) | 0 (0.0%) |
| 65 to 74 Years | 17 (27.9%) | 0 (0.0%) |
| 75 Years and over | 0 (0.0%) | 18 (47.4%) |
Disability Class: Cognitive Difficulty
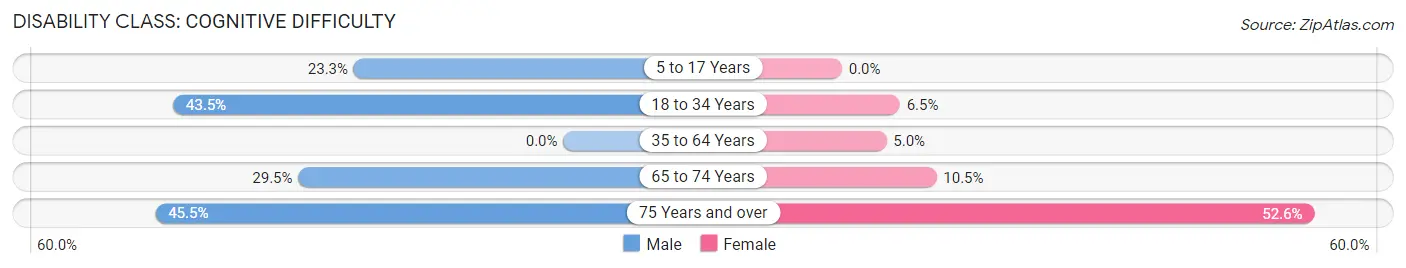
| Age Bracket | Male | Female |
| 5 to 17 Years | 7 (23.3%) | 0 (0.0%) |
| 18 to 34 Years | 20 (43.5%) | 2 (6.5%) |
| 35 to 64 Years | 0 (0.0%) | 7 (5.0%) |
| 65 to 74 Years | 18 (29.5%) | 2 (10.5%) |
| 75 Years and over | 5 (45.5%) | 20 (52.6%) |
Disability Class: Ambulatory Difficulty
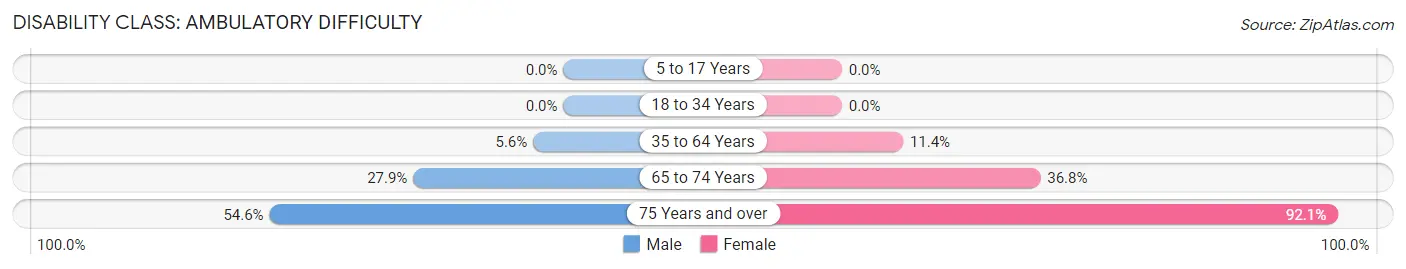
| Age Bracket | Male | Female |
| 5 to 17 Years | 0 (0.0%) | 0 (0.0%) |
| 18 to 34 Years | 0 (0.0%) | 0 (0.0%) |
| 35 to 64 Years | 6 (5.6%) | 16 (11.4%) |
| 65 to 74 Years | 17 (27.9%) | 7 (36.8%) |
| 75 Years and over | 6 (54.5%) | 35 (92.1%) |
Disability Class: Self-Care Difficulty
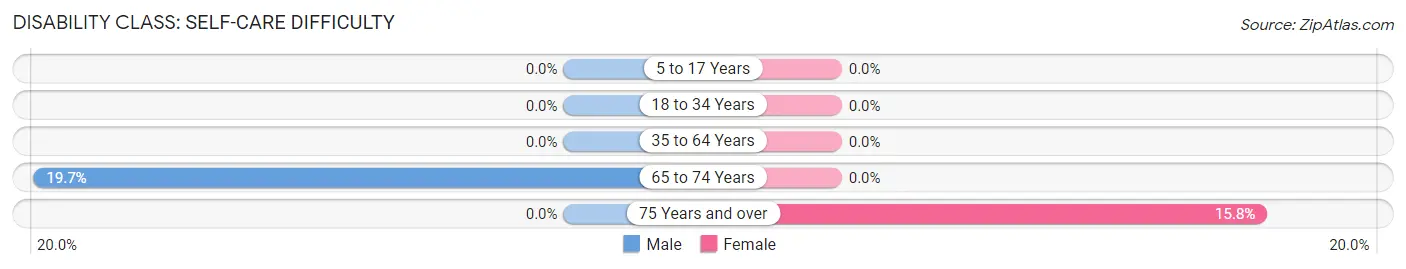
| Age Bracket | Male | Female |
| 5 to 17 Years | 0 (0.0%) | 0 (0.0%) |
| 18 to 34 Years | 0 (0.0%) | 0 (0.0%) |
| 35 to 64 Years | 0 (0.0%) | 0 (0.0%) |
| 65 to 74 Years | 12 (19.7%) | 0 (0.0%) |
| 75 Years and over | 0 (0.0%) | 6 (15.8%) |
Technology Access in Paauilo
Computing Device Access in Paauilo
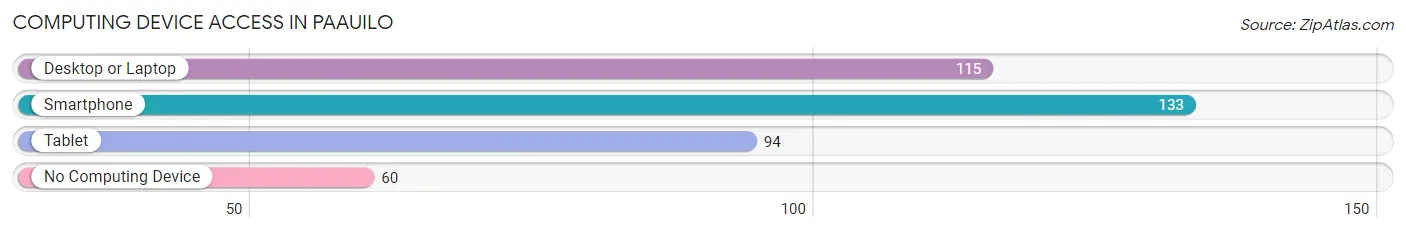
| Device Type | # Households | % Households |
| Desktop or Laptop | 115 | 54.8% |
| Smartphone | 133 | 63.3% |
| Tablet | 94 | 44.8% |
| No Computing Device | 60 | 28.6% |
| Total | 210 | 100.0% |
Internet Access in Paauilo
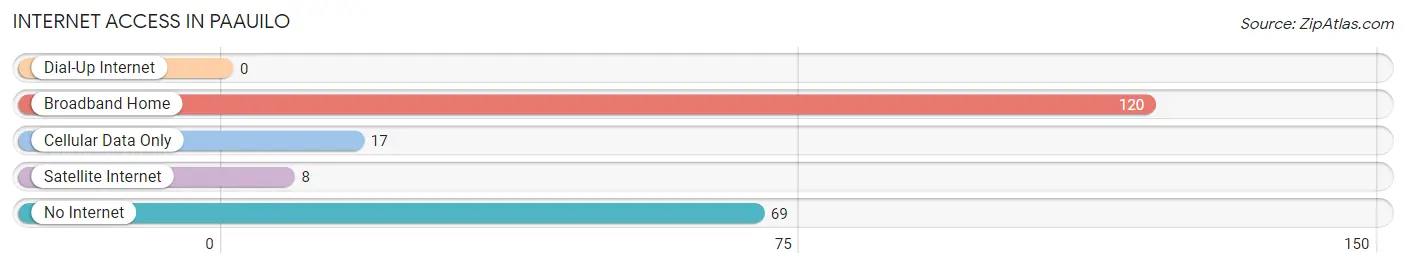
| Internet Type | # Households | % Households |
| Dial-Up Internet | 0 | 0.0% |
| Broadband Home | 120 | 57.1% |
| Cellular Data Only | 17 | 8.1% |
| Satellite Internet | 8 | 3.8% |
| No Internet | 69 | 32.9% |
| Total | 210 | 100.0% |
Paauilo Summary
Paauilo is a small unincorporated community located in the Hamakua District of Hawaii County, Hawaii. It is located on the northern slopes of Mauna Kea, about 20 miles northeast of Hilo. The population of Paauilo was 1,039 at the 2010 census.
History
The area of Paauilo was first settled by the ancient Hawaiians, who used the area for farming and fishing. The first European settlers arrived in the area in the late 1800s, and the town was officially established in 1883. The town was named after a local chief, Paauilo, who was known for his generosity and hospitality.
In the early 1900s, the town was a thriving agricultural center, with sugarcane, coffee, and macadamia nuts being the main crops. The Paauilo Sugar Mill was built in 1906 and operated until the late 1940s. The town also had a thriving ranching industry, with cattle and horses being raised in the area.
In the 1950s, the town began to decline as the sugar industry moved away from the area. The Paauilo Sugar Mill closed in the late 1940s, and the town's population began to decline. In the 1970s, the town was revitalized with the opening of the Paauilo Store, which provided the town with much needed jobs and services.
Geography
Paauilo is located on the northern slopes of Mauna Kea, about 20 miles northeast of Hilo. The town is situated at an elevation of 1,400 feet, and is surrounded by lush tropical rainforest. The climate is warm and humid, with temperatures ranging from the mid-70s to the mid-80s.
Economy
The economy of Paauilo is largely based on agriculture and ranching. The town is home to several farms and ranches, which produce a variety of crops, including coffee, macadamia nuts, and sugarcane. The town also has a thriving tourism industry, with visitors coming to the area to enjoy the natural beauty and outdoor activities.
Demographics
As of the 2010 census, the population of Paauilo was 1,039. The racial makeup of the town was 57.3% White, 0.3% African American, 0.2% Native American, 0.2% Asian, 0.1% Pacific Islander, and 41.9% from other races. The median household income was $37,917, and the median family income was $45,917.
Conclusion
Paauilo is a small unincorporated community located in the Hamakua District of Hawaii County, Hawaii. It is located on the northern slopes of Mauna Kea, about 20 miles northeast of Hilo. The population of Paauilo was 1,039 at the 2010 census. The economy of Paauilo is largely based on agriculture and ranching, with coffee, macadamia nuts, and sugarcane being the main crops. The town also has a thriving tourism industry, with visitors coming to the area to enjoy the natural beauty and outdoor activities.
Common Questions
What is Per Capita Income in Paauilo?
Per Capita income in Paauilo is $28,450.
What is the Median Family Income in Paauilo?
Median Family Income in Paauilo is $73,750.
What is the Median Household income in Paauilo?
Median Household Income in Paauilo is $66,250.
What is Income or Wage Gap in Paauilo?
Income or Wage Gap in Paauilo is 7.7%.
Women in Paauilo earn 92.3 cents for every dollar earned by a man.
What is Inequality or Gini Index in Paauilo?
Inequality or Gini Index in Paauilo is 0.40.
What is the Total Population of Paauilo?
Total Population of Paauilo is 548.
What is the Total Male Population of Paauilo?
Total Male Population of Paauilo is 282.
What is the Total Female Population of Paauilo?
Total Female Population of Paauilo is 266.
What is the Ratio of Males per 100 Females in Paauilo?
There are 106.02 Males per 100 Females in Paauilo.
What is the Ratio of Females per 100 Males in Paauilo?
There are 94.33 Females per 100 Males in Paauilo.
What is the Median Population Age in Paauilo?
Median Population Age in Paauilo is 51.2 Years.
What is the Average Family Size in Paauilo
Average Family Size in Paauilo is 3.3 People.
What is the Average Household Size in Paauilo
Average Household Size in Paauilo is 2.6 People.
How Large is the Labor Force in Paauilo?
There are 286 People in the Labor Forcein in Paauilo.
What is the Percentage of People in the Labor Force in Paauilo?
61.5% of People are in the Labor Force in Paauilo.
What is the Unemployment Rate in Paauilo?
Unemployment Rate in Paauilo is 14.0%.